Embed Size (px)
Citation preview
2D Steady State Temperature DistributionMatrix Structural Analysis
Giuliano BasileVinh Nguyen
Christine Rohr
University of Massachusetts Dartmouth
July 21, 2010
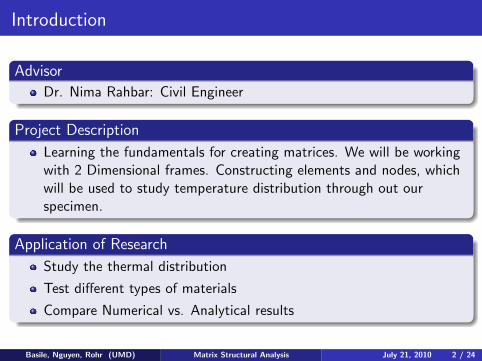
Introduction
Advisor
Dr. Nima Rahbar: Civil Engineer
Project Description
Learning the fundamentals for creating matrices. We will be workingwith 2 Dimensional frames. Constructing elements and nodes, whichwill be used to study temperature distribution through out ourspecimen.
Application of Research
Study the thermal distribution
Test different types of materials
Compare Numerical vs. Analytical results
Basile, Nguyen, Rohr (UMD) Matrix Structural Analysis July 21, 2010 2 / 24
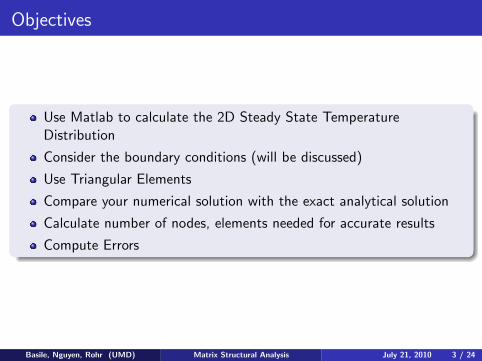
Objectives
Use Matlab to calculate the 2D Steady State TemperatureDistribution
Consider the boundary conditions (will be discussed)
Use Triangular Elements
Compare your numerical solution with the exact analytical solution
Calculate number of nodes, elements needed for accurate results
Compute Errors
Basile, Nguyen, Rohr (UMD) Matrix Structural Analysis July 21, 2010 3 / 24
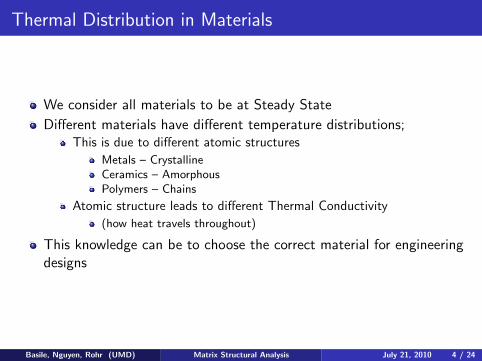
Thermal Distribution in Materials
We consider all materials to be at Steady State
Different materials have different temperature distributions;This is due to different atomic structures
Metals – CrystallineCeramics – AmorphousPolymers – Chains
Atomic structure leads to different Thermal Conductivity
(how heat travels throughout)
This knowledge can be to choose the correct material for engineeringdesigns
Basile, Nguyen, Rohr (UMD) Matrix Structural Analysis July 21, 2010 4 / 24
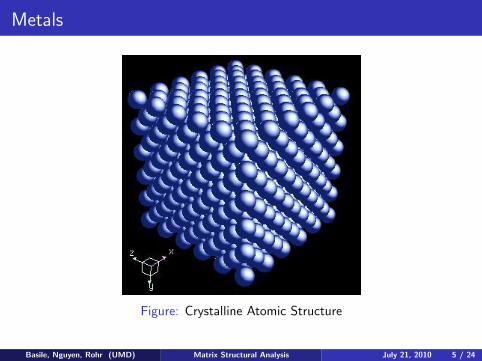
Metals
Figure: Crystalline Atomic Structure
Basile, Nguyen, Rohr (UMD) Matrix Structural Analysis July 21, 2010 5 / 24
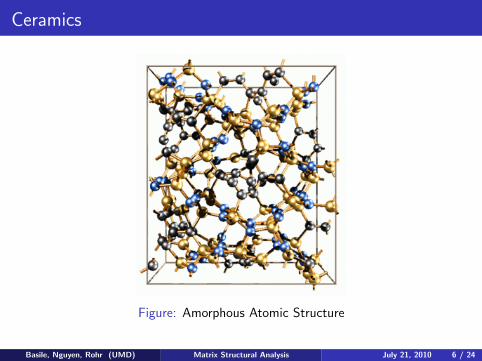
Ceramics
Figure: Amorphous Atomic Structure
Basile, Nguyen, Rohr (UMD) Matrix Structural Analysis July 21, 2010 6 / 24
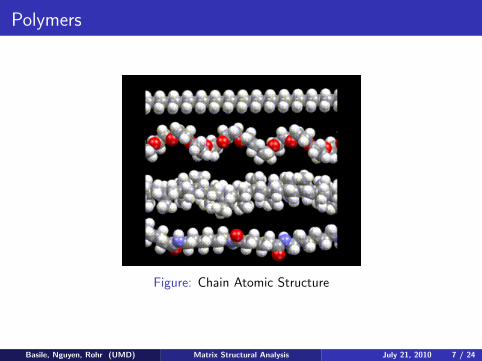
Polymers
Figure: Chain Atomic Structure
Basile, Nguyen, Rohr (UMD) Matrix Structural Analysis July 21, 2010 7 / 24
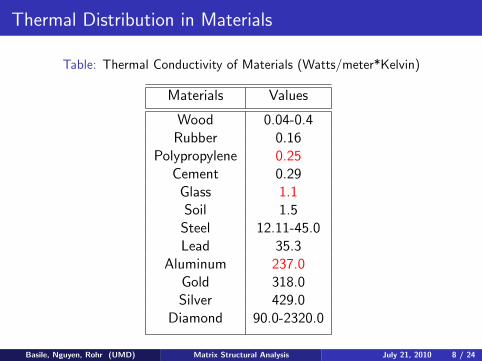
Thermal Distribution in Materials
Table: Thermal Conductivity of Materials (Watts/meter*Kelvin)
Materials Values
Wood 0.04-0.4Rubber 0.16
Polypropylene 0.25Cement 0.29
Glass 1.1Soil 1.5
Steel 12.11-45.0Lead 35.3
Aluminum 237.0Gold 318.0Silver 429.0
Diamond 90.0-2320.0
Basile, Nguyen, Rohr (UMD) Matrix Structural Analysis July 21, 2010 8 / 24
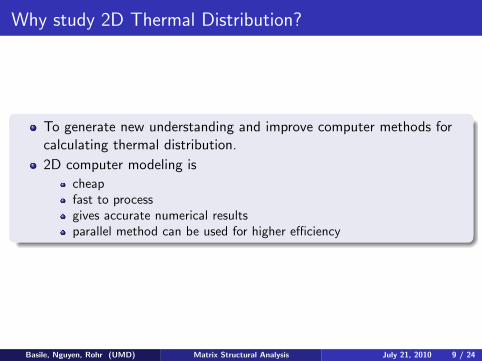
Why study 2D Thermal Distribution?
To generate new understanding and improve computer methods forcalculating thermal distribution.
2D computer modeling is
cheapfast to processgives accurate numerical resultsparallel method can be used for higher efficiency
Basile, Nguyen, Rohr (UMD) Matrix Structural Analysis July 21, 2010 9 / 24
Short Description
!
!
!
!
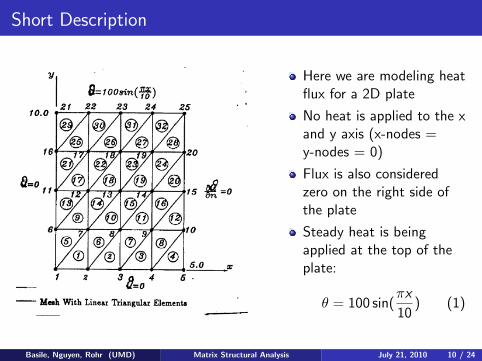
Here we are modeling heatflux for a 2D plate
No heat is applied to the xand y axis (x-nodes =y-nodes = 0)
Flux is also consideredzero on the right side ofthe plate
Steady heat is beingapplied at the top of theplate:
θ = 100 sin(πx
10) (1)
Basile, Nguyen, Rohr (UMD) Matrix Structural Analysis July 21, 2010 10 / 24
What’s Included
Elements
We start with 32 triangular elements
Numbering left to right; bottom to top
Each element has 3 local and global nodes
Number of Elements and Global Nodes will change
Nodes
Local nodes are used to indicate Global nodes
Nodes are used to define elements
Independent Element Number ien (3,5) = 17
3 is the Local node number
5 is the Element number
17 is the Global node number
Basile, Nguyen, Rohr (UMD) Matrix Structural Analysis July 21, 2010 11 / 24
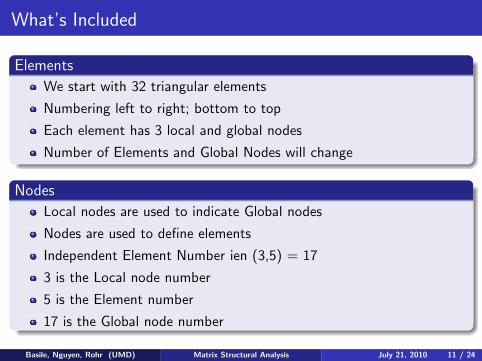
25 Nodes (32 Elements) — Plate vs. MatLab Solution
0 1 2 3 4 50
1
2
3
4
5
6
7
8
9
10Temperature Distribution
Horizontal Side
Vert
ical S
ide
45
50
55
60
65
70
75
80
85
90
Student Version of MATLAB
Basile, Nguyen, Rohr (UMD) Matrix Structural Analysis July 21, 2010 12 / 24
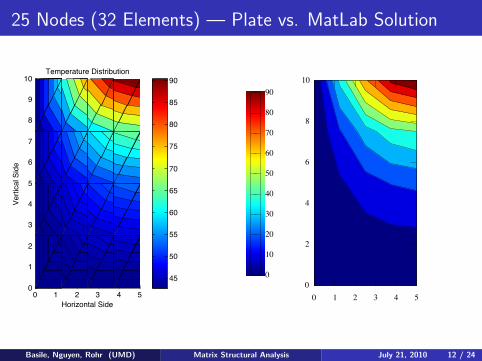
81 Nodes (128 Elements) — Plate vs. MatLab Solution
0 1 2 3 4 50
1
2
3
4
5
6
7
8
9
10Temperature Distribution
Horizontal side
Ve
rtic
al sid
e
70
75
80
85
90
Student Version of MATLAB
Basile, Nguyen, Rohr (UMD) Matrix Structural Analysis July 21, 2010 13 / 24
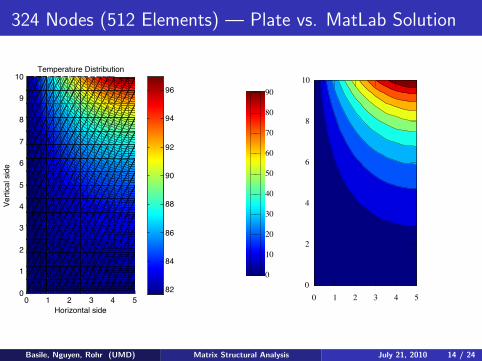
324 Nodes (512 Elements) — Plate vs. MatLab Solution
0 1 2 3 4 50
1
2
3
4
5
6
7
8
9
10Temperature Distribution
Horizontal side
Vert
ical sid
e
82
84
86
88
90
92
94
96
Student Version of MATLAB
Basile, Nguyen, Rohr (UMD) Matrix Structural Analysis July 21, 2010 14 / 24
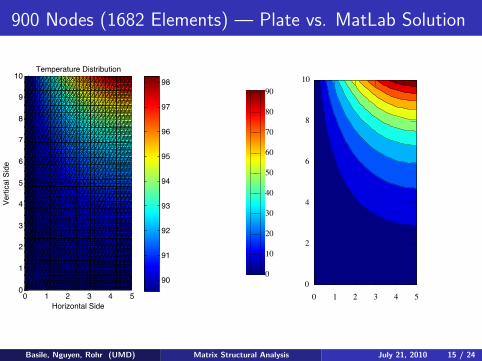
900 Nodes (1682 Elements) — Plate vs. MatLab Solution
0 1 2 3 4 50
1
2
3
4
5
6
7
8
9
10Temperature Distribution
Horizontal Side
Ve
rtic
al S
ide
90
91
92
93
94
95
96
97
98
Student Version of MATLAB
Basile, Nguyen, Rohr (UMD) Matrix Structural Analysis July 21, 2010 15 / 24
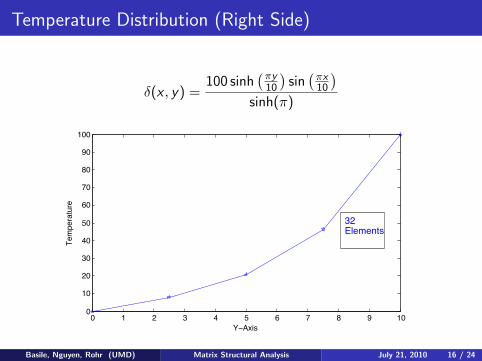
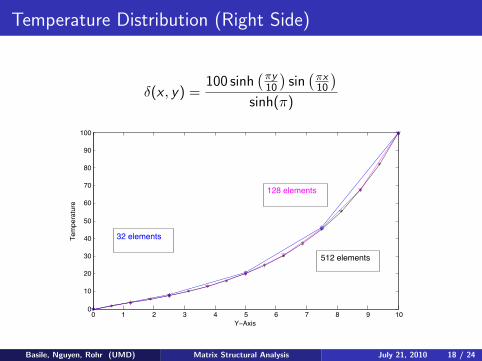
Temperature Distribution (Right Side)
δ(x , y) =100 sinh
(πy10
)sin
(πx10
)sinh(π)
0 1 2 3 4 5 6 7 8 9 100
10
20
30
40
50
60
70
80
90
100
Y!Axis
Temperature
32Elements
Student Version of MATLAB
Basile, Nguyen, Rohr (UMD) Matrix Structural Analysis July 21, 2010 16 / 24
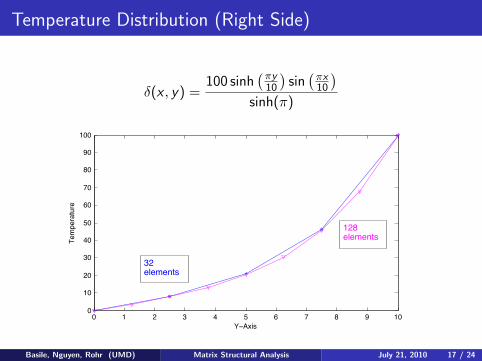
Temperature Distribution (Right Side)
δ(x , y) =100 sinh
(πy10
)sin
(πx10
)sinh(π)
0 1 2 3 4 5 6 7 8 9 100
10
20
30
40
50
60
70
80
90
100
Y!Axis
Temperature
32elements
128elements
Student Version of MATLAB
Basile, Nguyen, Rohr (UMD) Matrix Structural Analysis July 21, 2010 17 / 24
Temperature Distribution (Right Side)
δ(x , y) =100 sinh
(πy10
)sin
(πx10
)sinh(π)
0 1 2 3 4 5 6 7 8 9 100
10
20
30
40
50
60
70
80
90
100
Y!Axis
Tem
pera
ture
32 elements
128 elements
512 elements
Student Version of MATLAB
Basile, Nguyen, Rohr (UMD) Matrix Structural Analysis July 21, 2010 18 / 24
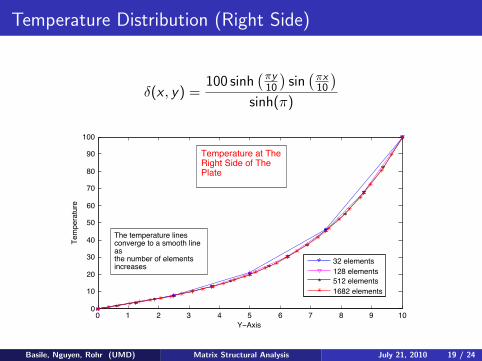
Temperature Distribution (Right Side)
δ(x , y) =100 sinh
(πy10
)sin
(πx10
)sinh(π)
0 1 2 3 4 5 6 7 8 9 100
10
20
30
40
50
60
70
80
90
100
Y!Axis
Tem
pera
ture
32 elements
128 elements
512 elements
1682 elements
Temperature at TheRight Side of ThePlate
The temperature linesconverge to a smooth lineasthe number of elementsincreases
Student Version of MATLAB
Basile, Nguyen, Rohr (UMD) Matrix Structural Analysis July 21, 2010 19 / 24
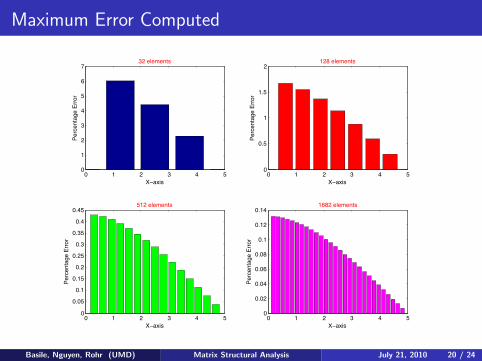
Maximum Error Computed
0 1 2 3 4 50
1
2
3
4
5
6
732 elements
X!axis
Pe
rce
nta
ge
Err
or
0 1 2 3 4 50
0.5
1
1.5
2128 elements
X!axis
Pe
rce
nta
ge
Err
or
0 1 2 3 4 50
0.05
0.1
0.15
0.2
0.25
0.3
0.35
0.4
0.45512 elements
X!axis
Pe
rce
nta
ge
Err
or
0 1 2 3 4 50
0.02
0.04
0.06
0.08
0.1
0.12
0.141682 elements
X!axis
Pe
rce
nta
ge
Err
or
Student Version of MATLAB
Basile, Nguyen, Rohr (UMD) Matrix Structural Analysis July 21, 2010 20 / 24
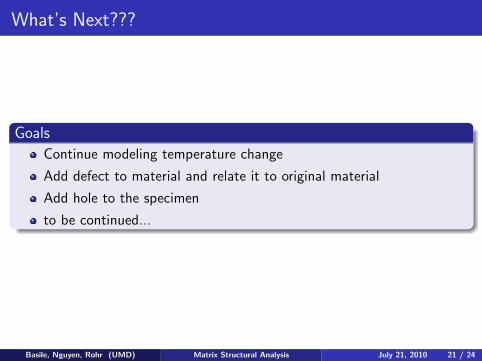
What’s Next???
Goals
Continue modeling temperature change
Add defect to material and relate it to original material
Add hole to the specimen
to be continued...
Basile, Nguyen, Rohr (UMD) Matrix Structural Analysis July 21, 2010 21 / 24
References
[Civil Engineer] Dr. Nima RahbarFundamental Matrix AlgebraUniversity of Massachusetts Dartmouth, Summer 2010.
[Thermal Conductivity of some common Materials]Thermal Conductivity of Materialswww. engineeringtoolbox. com , July 2010
Cu Atomic StructureCrystalline Atomic Structurehttp: // www. webelements. com , July 2010
Ceramic Atomic StructureAmorphous Atomic Structurehttp: // www. bccms. uni-bremen. de , July 2010
Polymer Atomic StructureChain Atomic Structurehttp: // www. themolecularuniverse. com , July 2010
Thank You for Listening
We would like to take this time to thank some very special peopleduring this whole learning process.
Dr. Gottlieb
Dr. Davis
Dr. Kim
Dr. Rahbar
Dr. Hausknecht
CSUMS Staff
Daniel Higgs
Zachary Grant
Charels Poole
Sidafa Conde
CSUMS Students
Questions?
???????????????????????????????????????????????????????????????????
Basile, Nguyen, Rohr (UMD) Matrix Structural Analysis July 21, 2010 24 / 24


![[Franklin Y. Cheng] Matrix Analysis of Structural (BookFi.org)](https://img.dokumen.tips/doc/110x75/545d2b08b1af9f225d8b4580/franklin-y-cheng-matrix-analysis-of-structural-bookfiorg.jpg)