Embed Size (px)
Citation preview
ECE 583 - HTE Ağustos 2013 Sayfa 1
Mathematical (Special) FunctionsHTE - 19.08.2013
1. Step Function
The representation of the unit step function is
0 for 0
(1.1)1 for 0
xU x
x
As seen from (1.1), U x has a value of zero prior to 0x , then at this instance of 0x , it jumps
to unity and continues forever towards x . Thus, the graphical view of (1.1) will be as shown inFig. 1.1.
Fig. 1.1 Graph of U x given in (1.1).
U x can be generated in Matlab by the following commands
x = -50:50;Ux = [zeros(1,50) ones(1,51)];plot(x,Ux)
axis([-55 55 -0.1 1.2])
Exercise 1.1 : Test that the Matlab code given above in red typing gives the unit step function.
Different forms of the step function can be envisaged, some of them are stated below
0
1
U ( x )
x
- x x x = 0

ECE 583 - HTE Ağustos 2013 Sayfa 2
00
0
1 for1 for 0 ,
0 for 0 0 for
for 0 1 for 0 ,
0 for 0 0
x xxU x U x x
x x x
A x xAU x U x
x
(1.2) for 0x
The step functions of (1.2) are depicted in Fig. 1.2 one by one.
Fig. 1.2 Step functions of (1.2).
It is possible to define other functions from the combination of step functions. One such function isthe sign function, abbreviated as
1 for 0
sgn 0 for 0 (1.3)1 for 0
xx U x U x x
x
The sgn x is plotted in Fig. 1.3.
Note that, sgn x is named as sign x in Matlab.
Exercise 1.2 : Type in the following commands in Matlab command window, comment on the plot,you obtain.
x = -50:50;sgnx = sign(x);plot(x,sgnx)
axis([-55 55 -1.2 1.2])
0
1
0
A
0
0
1
1- U ( x )
AU ( x )
x0
U ( - x ) U ( x - x0 )
x x
x
x

ECE 583 - HTE Ağustos 2013 Sayfa 3
Fig. 1.3 The plot of sgn x given in (1.3).
It is also possible to generate other known functions using step functions. Such examples arerectangular and triangular functions illustrated in Fig. 1.4.
Fig. 1.4 Rectangular and triangular functions.
Exercise 1.3 : Write the mathematical expressions of rectangular and triangular functions given inFig. 1.4. You can do this with or without using step functions. In each case, write the Matlab code toobtain the plots of Fig. 1.4.
Unit step function is an important tool in the representation of energy and power signals. It isgenerally preferred (to smoothly shaped waveforms) since it is time independent within certainduration.
2. Delta (Impulse) Function
The delta function can be retrieved from the unit step function as follows
- 1
0
1
sgn ( x )
xx - x
0
Rectangular function
A A
0
Triangular function
rect ( x ) tri ( x )
x0
x0
- x0
x x

ECE 583 - HTE Ağustos 2013 Sayfa 4
(2.1)dx U xdx
The delta function, x has an existence only at 0x , hence it will have the following properties
0 , when 0
0 (2.2)
x x
x x
x f x dx f
It is also possible to define a delta function shifted from 0x , thus
0 0
0 0 0
0 0
0 , when
0 , when , 0
(2.3)
x x x x
x x x x x
x x f x dt f x
The delta functions defined in (2.2) and (2.3) are displayed in Fig. 2.1.
Fig. 2.1 The display of various delta functions.
It is possible to have multiple delta functions spread over the horizontal axis. This way we can have
1
2 (2.4)
n
nn
f x x n
f x c x n
The pictorial representation of 1f x and 2f x stated in (2.4) can be found in Fig. 2.2.

ECE 583 - HTE Ağustos 2013 Sayfa 5
Fig. 2.2 Two samples of multiple delta functions.
Note that single delta function can be approximated in Matlab as
deltax = [zeros(1,50) ones(1,1) zeros(1,50)];plot(-50:50,deltax)
axis([-55 55 -0.1 1.2])
3. Sinc and Gaussian Functions
Sinc function is defined as
sin
sinc (3.1)x
xx
It is also possible to envisage a shifted version of this sinc function as
sin /sinc / (3.2)
/x a b
x a bx a b
In the case of (3.1), the zero crossings occur at 1, 2, 3x , whereas for (3.2), the zeros
are at , 1, 2, 3x a nb n . The plots of (3.1) and (3.2) are shown in Fig. 3.1 together with theassociated zero crossings.
It is worth noting that sinc function frequently occurs in Fourier transforms. For instance the Fouriertransform of a ractangular time function is a sinc function.
0
0
4
4
3
3
2
2
1- 1
- 1
- 2- 4 - 3
- 3- 4 - 2 1
c2
1
f1 ( x )
x
f2 ( x )
x

ECE 583 - HTE Ağustos 2013 Sayfa 6
Fig. 3.1 Plots of the sinc functions in (3.1) and (3.2).
Gaussian function (or Gaussian exponential) is expressed as
2 2Gauss exp / (3.3)x x a
If a shifted Gaussian function or Gaussian function of different broadness is required, then wemodify the definition of (3.3) as follows
2 20Gauss exp / (3.4)x x x a
In (3.4), 0x indicates a shift along axis x , while 2a is known as the variance and measures the
broadness of the functions. Various Gaussian functions are displayed in Fig. 3.2.
Fig. 3.2 Plots of the Gaussian functions for various shifts and variances.
Gaussian function is quite instrumental particularly in noise analysis.
0- 2
- 1- 3
- 4
1
2
3
4
1
1
a
a+b
a-ba+2b
a-2b a+3b
a-3b a+4b
a-4b a+5b
a-5ba+6b
a-6b
a-7b
a-8b
sinc ( x )
x
x
sinc[ ( x - a) / b ]

ECE 583 - HTE Ağustos 2013 Sayfa 7
4. Gamma Functions
The gamma function x is defined as
1
0
exp (4.1)xx t t dt
Note that, an integral routine named “quade” which is available on the course webpage.
Example 4.1 : Using quade, type the following commands in Matlab
>> x = 0.26;
>> F = @(t) exp(-t).*t.^(x - 1);
>> quade(F,0,inf)
ans = 3.4784
>> gamma(0.26)
ans = 3.4785
As seen the result delivered by “quade” and the result obtained by the use of Matlab internalfunction “gamma” agree to the fourth digit.
In the limit of xbeing an integer, the gamma function turns into the factorial as shown below
(integer) , ! 1 (4.2)x n n n
Example 4.2 : By using the following commands, a partial plot of gamma function can be obtained,
>> x = -4.1:0.11:4;
>> fx = gamma(x);
>> plot(x,fx)
>> axis([-5 5 -6 6])
Exercise 4.1 : Perform the steps in Example 4.2 and comment on the behaviour of gamma functionagainst its argument x .
Another type of gamma function is the incomplete gamma function defined as
1
0
, exp , 0 (4.3)x
aa x t t dt a
There is also complementary incomplete gamma function given by

ECE 583 - HTE Ağustos 2013 Sayfa 8
1, exp , 0 (4.4)a
x
a x t t dt a
Finally we define the beta function as
11 1
0
1
0
2 1 2 1
0
, 1 , , 0
, , , 01
, 2 cos sin , , 0 (4.5)
y x
x
x y
x y
x yB x y t t dt x y
x y
x y uB x y du x yx y u
x yB x y d x y
x y
The integral expressions on the second and third lines of (4.5) are just alternatives to the one on thefirst line.
For the different gamma functions listed in (4.3) to (4.5), it is important to note that there are thefollowing differences in the Matlab notation.
1Matlab
0
1Matlab
11 1
Matlab0
,1, exp , gaM = gammainc x,a,'lower'
,1, exp , gaMc = gammainc x,a,'upper'
, 1 , , BM = beta x,y
xa
a
x
y x
a xa x t t dt
a a
a xa x t t dt
a a
x yB x y t t dt B x y
x y
(4.6)
To the right of (4.6), the way of calling the corresponding gamma function in Matlab is indicated aswell. From there, we see that for incomplete and the complimentary incomplete gamma functions,the arguments are placed inside the calling brackets in the order opposite to the one shown in themathematical expression.
On the course webpage, there is the Matlab m file named, “Gammaint_ECE583”. This file can be usedto compute and compare the results of various gamma function via different method. The results ofa sample run of this m file for 1.2, 2.01, 1.5x y a is listed below
Results for gamma function -------
res1 = 0.9182
res2 = 0.9182
res3 = 0.9182
res4 = 1
Results for incomplete gamma function -------
res1 = 0.4488

ECE 583 - HTE Ağustos 2013 Sayfa 9
res2 = 0.4488
Results for complimentary incomplete gamma function -------
res1 = 0.4375
res2 = 0.4375
res3 = 0.4375
Results for beta function -------
res1 = 0.3766
res2 = 0.3766
res3 = 0.3766
Alternative results for beta function -------
res1 = 0.3766
res2 = 0.3766
Exercise 4.2 : By running “Gammaint_ECE583”, confirm the results above for1.2, 2.01, 1.5x y a .
We can utilize Gammaint_ECE583, the gamma functions of Matlab together with the symbolic facilityto solve the following examples.
Example 4.3 : Evaluate the following integral
0
1 exp , 0 (4.7)I pt tdt pp p
Solution : Make the substitution, x pt to get
3/ 2
0
3/ 21 exp (4.8)I x xdtp p p p
If needed we can also evaluate 3/ 2 in (4.8) by writing gamma(1.5) in Matlab.
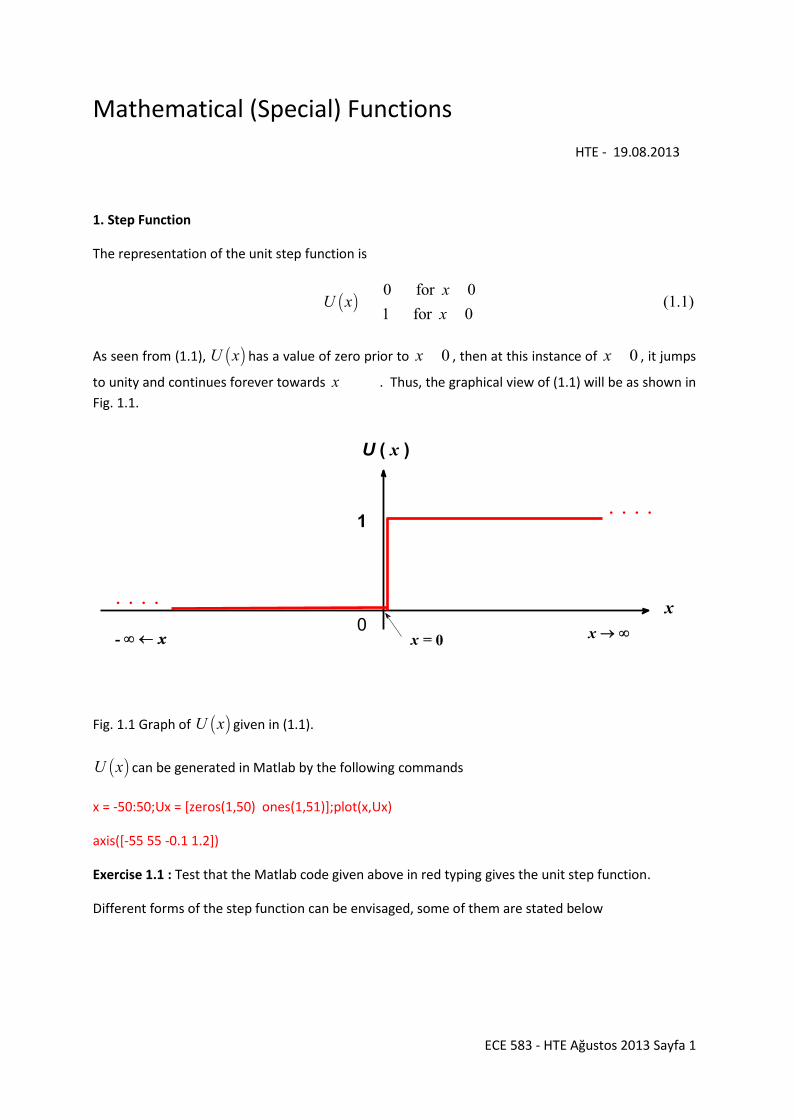
Example 4.4 : Prove the following identity
1 (4.9)x x x
Solution : We perform the followings in Matlab command window to get
>> syms x
ECE 583 - HTE Ağustos 2013 Sayfa 10
>> simplify(gamma(1 + x) - x*gamma(x))
ans = 0
Example 4.5 : Prove the following identity
LHSRHS
1, 1, (4.10)a ad x a x x a xdx
Solution : We perform the followings in Matlab command window and get
>> syms x a
>> diff(x^(-a)*gammainc(x,a,'lower'))
Undefined function 'gammainc' for input arguments of type 'sym'.
The warning on the last line means that the incomplete gamma function is not handled by thesymbolic tool box of Matlab, hence we have to resort to a different method, which is listed below
>> x = 0.12:0.01:5; %%% Defining a range for x
>> a = 0.13; %%% Setting a to a single numeric value
>> RHS = -x.^(-a-1).*gammainc(x,a + 1,'upper')*gamma(a + 1); %%% Computing the RHS of (4.10)
>> LHS = x.^(-a).*gammainc(x,a,’upper’)*gamma(a); %%% Computing the LHS of (4.10)
>> dLHS = diff(LHS) / 0.01; dLHS = [dLHS dLHS(end)]; %%% Computing the LHS of (4.10) and matchingdimensions
>> plot(x,RHS, '-k', 'LineWidth',3);hold on>> plot(x, dLHS, '--r', 'LineWidth',3); hold off
>>set(gca,'FontSize',15);set(gcf,'Color',[1 1 1])
As a result of above operations, we get the following graph

ECE 583 - HTE Ağustos 2013 Sayfa 11
Fig. 4.1 Graph for Example 4.5.
As seen from Fig. 4.1, the curves for the left hand side (LHS) and right hand side (RHS) of (4.10)overlap, which means the identity is proven numerically.
Example 4.6 : Prove the following identity
1, , exp (4.11)aa x a a x x x
Solution : We know from Example 4.5 that incomplete gamma function is not handled by Matlabsymbolically, therefore we have to resort to numerical methods.
By setting 0.79, 2.16x a and running Gammaint_ECE583, we get
2.16
1, 2.16 1,0.79
, 2.16,0.79 0.1649
, exp 2.16 0.164
0.083
9 0.79 exp -0.79 (4.1
4
0. 4 2)083a
a x
a x
a a x x x
Exercise 4.2 : Prove the following identities
a) 0.5 (4.13)
b)
2
2 !0.5 , 0, 1, 2 (4.14)
2 !n
nn n
n
c)
0.5 0.5 , noninteger (4.15)cos
x x xx
d)
1 , noninteger (4.16)sin
x x xx
e) , , (4.17)a x a x a
f) 1, , exp (4.18)aa x a a x x x
0 0.5 1 1.5 2 2.5 3 3.5 4 4.5 5-10
-8
-6
-4
-2
0
RHS, LHS of (4.10)
x

ECE 583 - HTE Ağustos 2013 Sayfa 12
g) 1, 1, (4.19)a ad x a x x a xdx
h)
1
1,
!Take 5, 10, 20 terms in the summation to see the progress in convergence (4.20)
n na
n
xa x x
n a n
Gamma functions come up particularly in writing the expansions of other functions.
5. Error Functions
Error function is defined as
20
2erf exp (5.1)x
x t dt
For some applications, it is useful to introduce the complimentary error function, which is given by
22erfc exp (5.2)x
x t dt
The two functions have the following properties
a) erf erf (5.3)x x
Proven in Matlab by typing
>> syms x
>> simplify(erf(-x) + erf(x))
ans = 0
b) erf 0 0 , erf 1 (5.4)
c) erfc 1 erf (5.5)x x
d) 2exp
erfc (5.6)x
xx
x
e) 22exp
erfc (5.7)xd x
dx
f) 22exp
erf (5.8)xd x
dx
Exercise 5.1 : Prove b to f in (5.4) to (5.8) by using symbolic facility of Matlab or otherwise.
Plotting erf x and erfc x against x , we get the curves in Fig. 5.1.

ECE 583 - HTE Ağustos 2013 Sayfa 13
Fig. 5.1 Plots of erf x and erfc x against x .
Exercise 5.2 : As seen from Fig. 5.1, there is an intersection point along the positive side of the xaxis where, erf erfcx x , find this value of x and the value of erf x at this intersection.
Example 5.1 : Error function finds wide application in probability calculations. Based on (3.4), wedefine the probability density function of Gaussian distribution as
2 21 exp / 2 (5.9)2
f u u m
Another function, called cumulative distribution function denoted by F x , which measure the
probabilities from up to a certain value x , is related to (5.9) as follows
2 2
2 22 2
1 exp / 221 1 exp / 2 exp / 2 (5.10)2 2
x
x
F x u m du
u m du u m du
By making a change of variable / 2t u m , (5.10) turns into
0.5erfc / 20.5erfc 1
2 2
/ 2
1 1exp exp
1 0.5erfc 0.5 1 erf (5.11)2 2
u m
u m
F x t dt t dt
x m x m
Exercise 5.3 : Plot the cumulative distribution function, F x , given in (5.11) and comment on this
plot.
x
1
2
- 1
0 2- 2
erf ( x )erfc ( x )
erf ( x ) = erfc ( x )

ECE 583 - HTE Ağustos 2013 Sayfa 14
6. Orthogonal Polynomials
Orthogonal polynomials satisfy the following orthogonality integral
0 , (6.1)b
m na
r x x x dx m n
where m x and n x are the polynomials of the same type with the respective different
degrees of andm n , r x is the weighting function.
6. 1 Legendre Polynomials
These polynomials, ny P x constitute the solutions of the following differential equation
2
22
1 2 1 0 , 1 1 (6.2)d dx y x y n n y xdx dx
nP x has the following (finite) series expansion
2/ 2
0
1 2 2 ! , 0, 1, 2 (6.3)
2 ! ! 2 !
k n kn
n nk
n k xP x n
k n k n k
where the notation / 2n means the integral (integer) part of n and will be given by
/ 2 for even/ 2 (6.4)
1 /2 for oddn n
nn n
The operation of (6.4) is acheived in Matlab, by the function “fix(n)”. ! found in (6.3) is the factorialnotation as used in (4.2).
In Matlab, Legendre polynomials can be invoked by legendre(n,x) or mfun('P',n,x). This way byemploying legendre(n,x)we can construct the graphs shown in Fig. 6.1 by the following Matlab codes.
clear;clc;clf reset;close alllinwid = [2 2 3.0 3.0 2 2 2 2 2] ; sitil = ['--k ';'-r ';':y ';'-.b ';'-ok ';'--ok';':ok ';'--k ';':k '];%%%% Computation of Legendre Polynomialsx = -1:0.02:1;narr = [0 1 2 3 4];
for in = 1:length(narr)n = narr(in);
resL = legendre(n,x,'sch');resL = resL(1,:);plot(x,resL ,sitil(in,:),'LineWidth',linwid(in));hold on;end;hold off
set(gcf,'Color',[1 1 1]);set(gca,'FontSize',16)xlabel(' \fontname{Times}x','FontSize',16,'FontWeight','bold');ylabel('Legendre polynomials ','FontSize',16,'FontWeight','bold');

ECE 583 - HTE Ağustos 2013 Sayfa 15
axis([-1.1 1.1 -1.1 1.1])
Fig. 6.1 Plots of Legendre polynomials for 0, 1, 2, 3, 4n .
From (6.3), it is possible to write for the Legendre polynomials of Fig. 6.1, as listed below
2 30 1 2 3
4 24
1 11 , , 3 1 , 5 32 2
1 35 30 3 (6.5)8
P x P x x P x x P x x x
P x x x
Exercise 6.1 : Prove that the Legendre polynomial expressions written in (6.5) are correct, using the
expansion in (6.3). Further by evaluating any nP x (other than 0P x and 1P x ) of (6.5) at three
different x values, confirm the numeric values displayed in Fig. 6.1.
Example 6.1 : Prove that
1 (6.6)n
n nP x P x
Solution : Since Matlab cannot handle nP x symbolically (analytically), we perform the following
sample calculation
>> n = 3;x = -1:0.1:1;
>> L1 = legendre(n,-x,'sch');L2 = (-1)^3*legendre(n,x,'sch');
>> L1(1,:) - L2(1,:)
ans =
Columns 1 through 20
-1 -0.8 -0.6 -0.4 -0.2 0 0.2 0.4 0.6 0.8 1
-1
-0.8
-0.6
-0.4
-0.2
0
0.2
0.4
0.6
0.8
1
x
Lege
ndre
pol
ynom
ials
P0 ( x ) P
1 ( x )
P2 ( x )
P3 ( x )
P4 ( x )

ECE 583 - HTE Ağustos 2013 Sayfa 16
0 0 0 0 0 0 0 0 0 0 0 0 0 0 0 0 0 0 0 0 0
Or alternatively, we can achieve the same result by utilizing mfun('P',n,x), thus
>> n = 3;x = -1:0.2:1;mfun('P',n,-x) - (-1)^n*mfun('P',n,x)
ans = 0 0 0 0 0 0 0 0 0 0 0
Note that similar to code used for generation of Fig. 6.1, we have had to take the first line of theLegendre polynomials delivered by Matlab, since Matlab generates associated Legendre polynomialsup to degree n , whereas we need the zeroth degree.
Example 6.2 : Prove that
1
1
0 , (6.7)n mP x P x dx m n
Solution : Comparing (6.7) with (6.1) we understand that (6.7) is the orthogonality condition for
Legendre polynomials with 1, 1, 1a b r x . Again nP x is not handled analytically in
Matlab, hence we benefit from the Matlab file, OrthogonalP_ECE583.m avaliable on coursewebpage. This m file contains results for other orthogonal polynomials. By running this file, the firstresult printed on Matlab command window is
resL = -2.775557561562891e-017
which is effectively zero at the level of machine accuracy. As seen from line 8 ofOrthogonalP_ECE583.m, the above result is for 1, 7n m .
Example 6.3 : Prove that
211 0 (6.8)n n n
dx P x nP x nxP xdx
Solution : Since we cannot handle nP x analytically in Matlab, it is best to prove (6.8) using the
expansion given in (6.3). Thus inserting (6.3) into (6.8), we get
1 2
2 1 2 1/ 2 / 2
0 0
3
2 1 2 1/ 2
10
1 2 2 ! 1 2 2 !2 2
2 ! ! 2 ! 2 ! ! 2 !
1 2 2 2 ! 1 2 2 !2 ! 1 ! 2 1 ! 2 !
T T
k kn k n kn n
n nk k
T
k kn k n kn
n nk
n k x n k xn k n k
k n k n k k n k n k
n k x n k xn n
k n k n k k
4
/ 2
00 (6.9)
! 2 !
T
n
k n k n k
In order to see that the coefficients of all terms will go to zero, we select the term, 2 1n kx which
means that we have to replace the k s in 2 and 4T T of (6.9) by 1k s. Doing so we obtain the
coefficient of 2 1n kx as follows

ECE 583 - HTE Ağustos 2013 Sayfa 17
1
1
1
1 2 2 ! 1 2 2 2 !2 2 2
2 ! ! 2 ! 2 1 ! 1 ! 2 2 !
1 2 2 2 ! 1 2 2 2 !0 (6.10)
2 ! 1 ! 2 1 ! 2 1 ! 1 ! 2 2 !
k k
n n
k k
n n
n k n kn k n k
k n k n k k n k n k
n k n kn n
k n k n k k n k n k
Now based on (4.9), we write the following identities
2 2 ! 2 2 2 2 1 2 2 2 !
2 ! 2 2 1 2 2 !
! 1 !
1 ! 1 ! (6.11)
n k n k n k n k
n k n k n k n k
n k n k n k
k k k
Using (6.11) in (6.10) and cancelling all common terms such as
1 , 2 , ! , 1 ! , 2 2 !k n k n k n k , we are left with
2 2 2 2 1 2 2 22 0 (6.12)2 2 1 1 2 1
n k n k k nn kn k n k n k k n k
It is easy to show that the left hand side of (6.12) will evaluate to zero. For full details of thederivation, you can consult the hand written derivation which is in file named, ECE 583_PI_2013,available on course webpage.
Exercise 6.2 : Prove the relations by using legendre(n,x,’sch’) or mfun('P',n,x) in Matlab, orOrthogonalP_ECE583.m or otherwise.
a) 1 1 , 1 1 (6.13)n
n nP P
b)
2 2 2 12
1 2 !0 , 0 0 (6.14)
2 !
n
n nn
nP P
n
c) 1 11 2 1 0 (6.15)n n nn P x n xP x nP x
d) 1
2
1
2 (6.16)2 1nP x dxn
6. 2 Hermite Polynomials
These polynomials, ny H x constitute the solutions of the following differential equation
2
22 2 0 , (6.17)d dy x y ny x
dx dx
nH x has the following (finite) series expansion

ECE 583 - HTE Ağustos 2013 Sayfa 18
2/ 2
0
1 ! 2 , 0, 1, 2 (6.18)
! 2 !
k n kn
nk
n xH x n
k n k
where the notation / 2n is as defined in (6.4).
By running OrthogonalP_ECE583.m inn Matlab, it is possible to construct the graphs shown in Fig. 6.2for the Hermite polynomials, 0, 1, 2, 3, 4n .
Fig. 6.2 Plots of Hermite polynomials for 0, 1, 2, 3, 4n .
From (6.18), it is possible to write for the Hermite polynomials of Fig. 6.2, as listed below
2 30 1 2 3
4 24
1 , 2 , 4 2 , 8 12
16 48 12 (6.19)
H x H x x H x x H x x x
H x x x
As an intrinsic function of Matlab, Hermite polymonials can be invoked in Matlab by writingmfun(‘H’,n,x).
Exercise 6.3 : Prove that the Hermite polynomial expressions written in (6.19) are correct, using the
expansion in (6.18). Further by evaluating nH x via the Matlab functional call of mfun(‘H’,n,x) at
three different andn x values, confirm the numeric values displayed in Fig. 6.2.
Example 6.4 : Prove that
1 (6.20)n
n nH x H x
Solution : We prove (6.20) by using mfun(‘H’,n,x) as follows
>> x = -5:5;n = 2;
-1 -0.5 0 0.5 1
-10
-5
0
5
10
x
Her
mite
pol
ynom
ials
H0 ( x )
H1 ( x )
H2 ( x )
H3 ( x )
H4 ( x )

ECE 583 - HTE Ağustos 2013 Sayfa 19
>> mfun('H',n,-x) - (-1)^n*mfun('H',n,x)
ans = 0 0 0 0 0 0 0 0 0 0 0
>> n = 3;
>> mfun('H',n,-x) - (-1)^n*mfun('H',n,x)
ans = 0 0 0 0 0 0 0 0 0 0
Example 6.5 : Prove that
2 21 exp exp (6.21)n
n
n n
dH x x xdx
Solution : By setting 4n , we express the right hand side of (6.21) symbolically in Matlab asshown below
>> syms x
>> n = 4;
>> simplify((-1)^n*exp(x^2)*diff(exp(-x^2),n))
ans = 16*x^4 - 48*x^2 + 12
The last line of the Matlab result above is the same as 4H x in (6.19).
Example 6.6 : Prove that
2 2 1
1 2 !0 , 0 0 (6.22)
!
n
n n
nH H
n
Solution : By alternatively setting 4, 5n and using mfun(‘H’,n,x) of Matlab, we get
>> x = 0;n = 4;mfun('H',n,x)
ans = 12
>> factorial(n)/factorial(n/2)
ans = 12
>> x = 0;n = 5;mfun('H',n,x)
ans = 0
Example 6.7 : Prove that
2exp 0 , (6.23)n mx H x H x dx m n
ECE 583 - HTE Ağustos 2013 Sayfa 20
Solution : Comparing (6.23) with (6.1) we understand that (6.23) is the orthogonality condition for
Hermite polynomials with 2, , expa b r x x . nH x is not handled analytically
in Matlab, hence we benefit from the Matlab file, OrthogonalP_ECE583.m. This m file containsresults for other orthogonal polynomials. By running this file, the second result printed on Matlabcommand window is
resL = -1.0295e-013
which is effectively zero at the level of machine accuracy. As seen from line 8 ofOrthogonalP_ECE583.m, the above result is for 1, 7n m .
Exercise 6.4 : Prove the relations by using mfun(‘H’,n,x) in Matlab, or OrthogonalP_ECE583.m orotherwise.
a) 1 12 2 0 (6.24)n n nH x xH x nH x
b) 12 (6.25)n n
d H x nH xdx
c) 22exp 2 ! (6.26)n
nx H x dx n
6. 3 Laguerre Polynomials
These polynomials, ny L x constitute the solutions of the following differential equation
2
21 0 , 0 (6.27)d dx y x y ny x
dx dx
Note that there is the more generalized associated Laguerre polynomials denoted by mnL x , where
m indicates the order. The notation nL x corresponds to 0nL x .
nL x has the following (finite) series expansion
2
0
1! , 0, 1, 2 (6.28)
! !
k kn
nk
xL x n n
k n k
By running OrthogonalP_ECE583.m inn Matlab, it is possible to construct the graphs shown in Fig. 6.3for the Laguerre polynomials, 0, 1, 2, 3, 4n .

ECE 583 - HTE Ağustos 2013 Sayfa 21
Fig. 6.3 Plots of Laguerre polynomials for 0, 1, 2, 3, 4n .
From (6.28), it is possible to write for the Laguerre polynomials of Fig. 6.3, as listed below
20 1 2
3 2 4 3 23 4
11 , 1 , 4 22
1 19 18 6 , 16 72 96 24 (6.29)6 24
L x L x x L x x x
L x x x x L x x x x x
As an intrinsic function of Matlab, Laguarre polymonials can be invoked in Matlab by writingmfun(‘L’,n,x).
Exercise 6.5 : Prove that the Laguarre polynomial expressions written in (6.29) are correct, using the
expansion in (6.28). Further by evaluating nL x via the Matlab functional call of mfun(‘L’,n,x) at
three different andn x values, confirm the numeric values displayed in Fig. 6.3.
Example 6.8 : Prove that
1 11 2 1 0 (6.30)n n nn L x x n L x nL x
Solution : Here, we prove (6.30) using the mfun(‘L’,n,x) from Matlab
>> n = 13; x = 0:5;
>> (n + 1)*mfun('L',n+1,x) + (x - 1 -2*n).*mfun('L',n,x) + n*mfun('L',n-1,x)
ans = 1.0e-013 *( 0 0 -0.0178 0 0 -0.2487)
which corresponds to zeros at machine accuracy level.
Example 6.9 : Prove that
0 0.2 0.4 0.6 0.8 1 1.2 1.4 1.6 1.8 2-1.5
-1
-0.5
0
0.5
1
1.5
x
Lagu
erre
Pol
ynom
ials
L0 ( x )
L1 ( x )
L2 ( x )
L3 ( x )
L4 ( x )

ECE 583 - HTE Ağustos 2013 Sayfa 22
0
exp 0 , (6.31)n mx L x L x dx m n
Solution : Comparing (6.31) with (6.1) we understand that (6.31) is the orthogonality condition for
Laguerre polynomials with 0, , expa b r x x . nL x is not handled analytically in
Matlab, hence we benefit from the Matlab file, OrthogonalP_ECE583.m. This m file contains resultsfor other orthogonal polynomials. By running this file, the third result printed on Matlab commandwindow is
resLa = 1.1480e-012
which is effectively zero at the level of machine accuracy. As seen from line 8 ofOrthogonalP_ECE583.m, the above result is for 1, 7n m .
Exercise 6.5 : Prove the relations by using mfun(‘L’,n,x) in Matlab, or OrthogonalP_ECE583.m orotherwise.
a)
exp
exp (6.32)!
nn
n n
x dL x x xn dx
Benefit from Example 6.5
b) 2
121 0 (in error) (6.33)n n n
d dx L x x L x nL xdx dx
c) 2
0
exp 1 (6.34)nx L x dx
6. 4 Chebyshev Polynomials
These polynomials, 1 2 andn ny T x y U x constitute the solutions of the following respective
differential equations
22 2
1 1 12
22
2 2 22
1 0 , 1 1
1 3 2 0 , 1 1 (6.35)
d dx y x y n y xdx dxd dx y x y n n y xdx dx
andn nT x U x have the following (finite) series expansion
2/ 2
0
2/ 2
0
1 1 ! 2 , 0, 1, 2
2 ! 2 !
1 ! 2 , 0, 1, 2 (6.36)
! 2 !
k n kn
nk
k n kn
nk
n k xnT x nk n k
n k xU x n
k n k
where the notation / 2n means the integral (integer) part of n as defined in (6.4).

ECE 583 - HTE Ağustos 2013 Sayfa 23
By running OrthogonalP_ECE583.m inn Matlab, it is possible to construct the graphs shown in Fig. 6.4and 6.5 for the Chebyshev polynomials, 0, 1, 2, 3, 4n .
Fig. 6.4 Plots of Chebyshev polynomials, nT x for 0, 1, 2, 3, 4n .
Fig. 6.5 Plots of Chebyshev polynomials, nU x for 0, 1, 2, 3, 4n .
From (6.36), it is possible to write for the Chebyshev polynomials of Figs. 6.4 and 6.5 as listed below
2 30 1 2 3
4 24
2 30 1 2 3
4 24
1 , , 2 1 , 4 3
8 8 1
1 , 2 , 4 1 , 8 4
16 12 1
T x T x x T x x T x x x
T x x x
U x U x x U x x U x x x
U x x x
(6.37)
-1 -0.8 -0.6 -0.4 -0.2 0 0.2 0.4 0.6 0.8 1
-1
-0.8
-0.6
-0.4
-0.2
0
0.2
0.4
0.6
0.8
1
x
Che
bysh
evT
poly
nom
ials
T0 ( x )
T1 ( x )
T2 ( x )
T3 ( x ) T
4 ( x )
-1 -0.8 -0.6 -0.4 -0.2 0 0.2 0.4 0.6 0.8 1-4
-3
-2
-1
0
1
2
3
4
x
Che
bysh
evU
poly
nom
ials U
0 ( x )
U1 ( x )
U2 ( x )
U3 ( x )
U4 ( x )

ECE 583 - HTE Ağustos 2013 Sayfa 24
As an intrinsic function of Matlab, Chebyshev polymonials can be invoked in Matlab by writingmfun(‘T’,n,x) and mfun(‘U’,n,x).
Exercise 6.6 : Prove that the Chebyshev polynomial expressions written in (6.37) are correct, using
the expansions given in (6.36). Further by evaluating andn nT x U x via the Matlab functional call
of mfun(‘T’,n,x) and mfun(‘U’,n,x) at three different andn x values, confirm the numeric valuesdisplayed in Figs. 6.4 and 6.5.
Example 6.10 : Prove that
11 , 1 1 , (6.38)n
n n n n n nT x T x T T x U x xU x
Solution : Here, we prove the validity of the relations in (6.38) using the mfun(‘T’,n,x) andmfun(‘T’,n,x) from Matlab
>> n = 3;x = -1:0.2:1;mfun('T',n,-x) - (-1)^n*mfun('T',n,x)
ans = 0 0 0 0 0 0 0 0 0 0 0
>> n = 4;x = 1;mfun('T',n,x) - 1
ans = 0
n = 3;x = -1:0.2:1;mfun('T',n,x) - mfun('U',n,x) + x.*mfun('U',n-1,x)
ans = 1.0e-016 *( 0 0 0 -0.2776 0.5551 0 -0.5551 0.2776 0 0 0)
Example 6.11 : Prove the following orthogonality expressions for andn nT x U x
10.52
1
10.52
1
1 0 ,
1 0 , (6.39)
n m
n m
x T x T x dx m n
x U x U x dx m n
Solution : Comparing (6.39) with (6.1) we understand that in the orthogonality condition for
Chebyshev polynomials 0.521, 1, 1a b r x x . To prove (6.39), we benefit from the
Matlab file, OrthogonalP_ECE583.m. This m file contains results for other orthogonal polynomials. Byrunning this file, the fourth and fifth results printed on Matlab command window are
resT = 2.7756e-017
resU = -2.7756e-017
which is effectively zero at the level of machine accuracy. As seen from lines 46 and 57 ofOrthogonalP_ECE583.m, the above results are for 2, 5n m .
Exercise 6.7 : Prove the following relations by using mfun(‘L’,n,x) in Matlab, orOrthogonalP_ECE583.m or otherwise.

ECE 583 - HTE Ağustos 2013 Sayfa 25
a) 1 12 0 (6.40)n n nT x xT x T x
b) 1 1 (6.41)nU n
c) 21 11 0 (6.42)n n nx U x xT x T x
d) 1
0.52
1
1 0 , (6.39)n mx U x U x dx m n
7. Bessel Functions
Bessel functions of 1 2, , ,y J x Y x H x H x each and independently constitutes the
solution of the following differential equation
2
2 2 22
0 (7.1)d dx y x y x ydx dx
They are named as
1
2
: Bessel function of first kind
: Bessel function of second kind
: Bessel function of third kind
: Bessel function of third kind (7.2)
J x
Y x
H x J x jY x
H x J x jY x
For an alternative version of (7.1), modified Bessel functions of ,y I x K x satisfy the
differential equation
2
2 2 22
0 (7.3)d dx y x y x ydx dx
For complex argument, i.e., x z , and the order being integer, i.e., n following relation holds
between J x and I x
(7.4)n nI z jJ jz
In this course, we limit ourselves to integer orders and real arguments.
Figs. 7.1 and 7.2 display Bessel functions , and ,n n n nJ x Y x I x K x for 0, 1, 2, 3, 4n . As
seen from Fig. 7.1, Bessel functions nJ x start at unity when 0n , but they start at zero for
0n . As x , they oscillate and decay towards zero. On the other hand, Bessel functions
nY x rise from minus infinity. As x , similar to nJ x s, nY x s also oscillate and decay
towards zero. As observed from Fig 7.2, Bessel functions Bessel functions nI x start at unity when
0n , but they start at zero for 0n . As x , they rise towards infinity. On the other hand,
Bessel functions nK x come down from plus infinity. As x , nK x s decay towards zero.

ECE 583 - HTE Ağustos 2013 Sayfa 26
Fig. 7.1 Plots of Bessel functions andn nJ x Y x for 0, 1, 2, 3, 4n .
Fig. 7.2 Plots of Bessel functions andn nI x K x for 0, 1, 2, 3, 4n .
Infinite series expansions for andn nJ x I x are given below
22
0
22
0
0.250.5
! !
0.250.5 (7.5)
! !
kn
nk
kn
nk
xJ x x
k n k
xI x x
k n k
Fortunately Matlab offers quite comprehensive calculations and symbolic handling of all types ofBessel function. We benefit from this facility both in the examples and exercises below. In Matlab,
the Bessel functions, , , ,n n n nJ x Y x I x K x are respectively invoked by besselj(n, x),
0 5 10 15
-1
-0.8
-0.6
-0.4
-0.2
0
0.2
0.4
0.6
0.8
1
x
Bess
el fu
nctio
nsJ n (
x) ,
Y n (x
)J0 ( x )
J1 ( x )J2 ( x ) J3 ( x )
J4 ( x )
Y0 ( x )Y1 ( x )
Y2 ( x )Y3 ( x )
Y4 ( x )
0 0.5 1 1.5 2 2.5 3 3.5 40
0.2
0.4
0.6
0.8
1
1.2
1.4
1.6
1.8
2
x
Bess
el fu
nctio
nsI n (
x) ,
K n (x
)
I0 ( x )
I1 ( x )
I2 ( x )
I3 ( x )
I4 ( x )
K0 ( x )
K1 ( x )
K2 ( x )K3 ( x )
K4 ( x )
ECE 583 - HTE Ağustos 2013 Sayfa 27
bessely(n, x), besseli(n, x), besselk(n, x). These functions serve numerically and symbolically. Hence it
is easy to prove that Bessel functions ,J x Y x will satisfy the differential equations of (7.1),
while ,n nI x K x will satisfy the differential equations of (7.3) by the following simple Matlab
operations
>> syms x n
>> simplify(x^2*diff(besselj(n,x),x,2) + x*diff(besselj(n,x),x,1) + (x^2 - n^2)*besselj(n,x))
ans = 0
>> simplify(x^2*diff(bessely(n,x),x,2) + x*diff(bessely(n,x),x,1) + (x^2 - n^2)*bessely(n,x))
ans = 0
>> simplify(x^2*diff(besseli(n,x),x,2) + x*diff(besseli(n,x),x,1) - (x^2 + n^2)*besseli(n,x))
ans = 0
>> simplify(x^2*diff(besselk(n,x),x,2) + x*diff(besselk(n,x),x,1) - (x^2 + n^2)*besselk(n,x))
ans = 0
Example 7.1 : Prove the following identities for , , ,n n n nJ x Y x I x K x
1 1
1 1
1 1
1 1
2+
+ , +
2
+ , + (7.6)
n n n
n n n n n n
n n n
n n n n n n
nJ x J x J xx
d n d nJ x J x J x Y x Y x Y xdx x dx x
nI x I x I xx
d n d nI x I x I x K x K x K xdx x dx x
Solution : By typing in Matlab
>> syms n x
>> simplify(besselj(n-1,x) + besselj(n+1,x))
ans = (2*n*besselj(n, x))/x
>> diff(besselj(n,x))
ans = (n*besselj(n, x))/x - besselj(n + 1, x)
>> diff(bessely(n,x))
ans = (n*bessely(n, x))/x - bessely(n + 1, x)

ECE 583 - HTE Ağustos 2013 Sayfa 28
>> simplify(besseli(n-1,x) - besseli(n+1,x))
ans = (2*n*besseli(n, x))/x
>> diff(besseli(n,x))
ans = besseli(n + 1, x) + (n*besseli(n, x))/x
>> diff(besselk(n,x))
ans = (n*besselk(n, x))/x - besselk(n + 1, x)
Example 7.2 : Prove that the following integrals yield nJ x and nI x
0
0
1 cos sin
1 exp cos cos (7.7)
n
n
J x x n d
I x x n d
Solution : (7.7) can be solved by the running the Matlab m file, named BesselJIIntegral.m , reprintedbelow
function BesselJIIntegralclear;clc;global n xn = 4;x = 3.02;format longresJint = quade(@funJ,0,pi)/piresJMatlab = besselj(n, x)resIint = quade(@funI,0,pi)/piresIMatlab = besseli(n, x)
function y = funJ(tet)global n xy = cos(x*sin(tet) - n*tet);function y = funI(tet)global n xy = exp(x*cos(tet)).*cos(n*tet);
By running this m (function) file, we get the following results
resJint = 0.134706120101117
resJMatlab = 0.134706120101117
resIint = 0.336361890104750
resIMatlab = 0.336361890104750
As seen from the above numeric results, those values of Bessel functions evaluated from the integralexpressions of (7.7) agree perfectly with those calculated by the intrinsic Matlab functions ofbesselj(n, x), and besseli(n, x).

ECE 583 - HTE Ağustos 2013 Sayfa 29
Example 7.3 : Prove that the following identity
2
2 20 2 2
0
1exp exp (7.8)2 4
bx a x J bx dxa a
Solution : (7.7) can be solved in Matlab by the following commands
>> syms x
>> a = 1.2;b = 2.05;
>> eval(int(x*exp(-a^2*x^2)*besselj(0,b*x),x,0,inf))
ans = 0.1674
>> 1/(2*a^2)*exp(-b^2/(4*a^2))
ans = 0.1674
Example 7.4 : Find the number of terms that should be included in the following summation to get areasonable approximation to zero
max
max
0
(7.9)
k
n n n kk
k k
n n n kk k
I x y I x I y
D I x y I x I y
Solution : (7.9) can be tested by the following Matlab m file named, SUMIxy.m, also reprinted below
clc ;clf reset;close all;n = 5;x = 1.26;y = 4.01;kmax = 10;sumarr = [];Ixy = besseli(n,x + y);for in = 1:kmax
sumIxy = 0;for k = -in:in
sumIxy = sumIxy + besseli(k,x)*besseli(n-k,y);endsumarr = [sumarr sumIxy];endsumarr = sumarr - sumIxy;plot(3:2:21,sumarr,'-r','LineWidth',3)set(gcf,'Color',[1 1 1]);set(gca,'FontSize',16)xlabel('Number of terms','FontSize',18,'FontWeight','bold');ylabel('Difference -\itD','FontSize',20,'FontWeight','bold','FontName','Times');axis([3 21 -1.2 0.1])
Running this m file, we get the graph displayed in Fig. 7.3.

ECE 583 - HTE Ağustos 2013 Sayfa 30
Fig. 7.3 The approach of the expression in (7.9) to zero by the inclusion of more number of terms
Exercise 7.1 : Prove the relations by summation, numeric evaluation or using the symbolic facility ofMatlab .
a) 1exp , 0 (7.10)2
nn
nn
x t J x t tt
b) 1 (7.11)n nn n
d x I x x I xdx
c) 1 : Integration constant (7.12)n nn nx J x dx x J x C C
Bessel function are quite important in propagation, particularly in cylindrical coordinates, where xbecomes the radial coordinate. In some instances, we need fractional order Bessel functions, sameimportant ones are described below.
The solutions to the following differential equation are Airy functions
2
20 (7.13)d y xy
dx
The two types of Airy functions are written in terms of fractional order Besssel functions as
3 / 2 3 / 2 3 / 21/ 3 1/ 3 1/ 3
1 2 2 2Ai , Bi (7.14)3 3 3 3 3x xx K x x I x I x
For negative argument, the Airy functions are defined as
3/ 2 3 / 21/ 3 1/ 3
3 / 2 3 / 21/ 3 1/ 3
2 2Ai3 3 3
2 2Bi (7.15)3 3 3
xx J x J x
xx J x J x
4 6 8 10 12 14 16 18 20
-1
-0.8
-0.6
-0.4
-0.2
0X: 9Y: -0.01103
Number of terms ( - kmax to kmax
)
Diff
eren
ce -
DX: 11Y: -0.0009605
X: 13Y: -5.552e-005
X: 15Y: -2.238e-006
X: 17Y: -6.579e-008
X: 19Y: -1.442e-009

ECE 583 - HTE Ağustos 2013 Sayfa 31
Exercise 7.2 : In Matlab, airy(0,x) returns the Airy function, Ai x , while airy(2,x) returns the Airy
function, Bi x . Obtain numeric values of Ai x and Bi x at 1.5:0.1:1.5x using this
facility and compare those numeric values against the results obtained from the right hand sides of(7.14) and (7.15) by using Bessel functions.
8. Hypergeometric Functions
There are quite a family of hypergeometric functions, while we examine 2 1 , , ,F a b c x , also
denoted as , , ,F a b c x 1 1 , ,F a b x also denoted as , ,M a b x and , ,U a b x .
, ,M a b x and , ,U a b x are also known as confluent hypergeometric functions.
The differential equations satisfied by these functions are
2
2
2
2
, , , , 1 1 0
, , or , , , 0 (8.1)
d dy F a b c x x x y c a b x y abydx dx
d dy M a b x U a b x x y b x y aydx dx
The series expansions of , , ,F a b c x and , ,M a b x and expression of , ,U a b x in terms of
, ,M a b x are given below
0
0
1
, , , , 1 , 1 2 1!
, ,!
1 , , 1, ,
1
kk k
kk
k
kk
kk
b
a b x a kF a b c x x a a a a a k
c k a
a xM a b x
b k
b M a b x M aU a b x z
a b
, 2 ,
1 (8.2)b b x
ba
k is known as the Pochhammer symbol.
, ,M a b x is invoked in Matlab by hypergeom(a,b,x) both numerically and symbolically, for
, , ,F a b c x and , ,U a b x , we can respectively use HG2F1call_ECE583.m and CHU1F1_ECE583.m.
Note that HG2F1call_ECE583.m can compute the values of , , ,F a b c x for 1x . In Matlab, some
results are given in terms of Whittaker’s function, that is related to , ,M a b x as follows
/ 2/ 2 ,( 1) / 2 exp / 2 , , (8.3)bb a bW x x x M a b x
Whittaker’s function, / 2 ,( 1) / 2b a bW x is invoked in Matlab by whittakerM(0.5*b-a, (b-1)/2, x).
Example 8.1 : Prove that the following identity

ECE 583 - HTE Ağustos 2013 Sayfa 32
, , , , , 1, 2, 3, (8.4)n
nn
n
ad M a b x M a n b n x ndx b
Solution : (8.4) can be solved by analytic means. For this purpose, we the summation for , ,M a b xfrom (8.2) and differentiate it once to get
1
0, , (8.5)
!
kk
kk
a xd M a b x kdx b k
Since the summation index runs up to infinity, we let in (8.5) 1k k or replace k by 1k , hence(8.5) becomes
1 1
0 01 1
, , 1 (8.6)1 ! !
k kk k
k kk k
a x a xd M a b x kdx b k b k
Considering that
1
1
1
1
1 2 1 1
1 2 1 1 (8.7)
k
k
a
k k
b
k k
a a a a a k a k a a
b b b b b k b k b b
Then (8.5) transforms into
1
1
, , 1, 1, 1, 1, (8.8)ad aM a b x M a b x M a b x
dx b b
Continuing in this manner, we reach the general case given in (8.4).
Example 8.2 : By using HG2F1call_ECE583.m, plot , , ,F a b c x for the following numeric settings
a) 0.8, 0.57, 0.18, 0.1:0.1:0.8 (8.9)a b c x
b) 0.48, 1.2, 0.3, 0.1:0.1:0.8 (8.10)a b c x c) 0.55, 1.5, 0.6, 0.1:0.1:0.8 (8.11)a b c x d) 0.39, 0.6, 0.43, 0.1:0.1:0.8 (8.12)a b c x
Solution : Inserting the numeric settings of (8.9) to (8.12) in HG2F1call_ECE583.m, we obtain the plotgiven in Fig. 8.1.

ECE 583 - HTE Ağustos 2013 Sayfa 33
Fig. 8.1 Plots of , , ,F a b c x for the numeric settings of (8.9) to (8.12).
Exercise 8.1 : Prove the followings by using hypergeom(a,b,x)
a)
22
1 !, , 1 (8.13)2 2 !
n
n
nM n x H xn
b) 21 3, , erf (8.14)2 2 2
M x xx
c) 0 1
1 , 2, exp / 2 / 2 / 2 (8.15)2
M x x I x I x
d) , , exp (8.16)M a a x x
1) MATLAB m files.2) My own Lecture Notes.3) Larry C. Andrews and Ronald L. Phillips, “Mathematical Techniques for Engineers and Scientists”,
SPIE Press, Bellingham, 2002.4) M. Abramowitz and I. Stegun, “Handbook of Mathematical Functions”, Dover Publications, New
York, 1970.5) I. S. Gradshteyn and I. M. Ryzhik, “Tables of Integrals, Series and Products”, Academic Press, New
York, 2000.
0.1 0.2 0.3 0.4 0.5 0.6 0.7 0.80
5
10
15
x
F ( a
, b, c
, x )
a = 0.8 , b = 0.57 , c = 0.18
a = 0.48 , b = 01.2 , c = 0.3
a = 0.55 , b = 1.5 , c = 0.6
a = 0.39 , b = 0.6 , c = 0.43


![Abramowitz & Stegun - Handbook of Mathematical Functions [1970]](https://img.dokumen.tips/doc/110x75/54507e19b1af9fd07b8b4dee/abramowitz-stegun-handbook-of-mathematical-functions-1970.jpg)