Embed Size (px)
Citation preview

No.1, January 2016
The potential of meso-level climate risk
insurance as a risk management tool for
agricultural intermediaries
Authors: Jan Kerer, Clémence Tatin-Jaleran, Lilian Steinhäuser, Simona Helmsmüller, Lukas Kornherr, Evelyn Debrah, Mohamed Ben Galha, Januario Ntungwa and Andriatsitohaina Rakotoarimanana
KfW Development Bank
Materials on
Development Financing

FEASIBILITY STUDY
Presented by on behalf of
Feasibility Study
I
ACKNOWLEDGMENT:
This feasibility study was carried out by AFC Consultants International on behalf of KfW De-velopment Bank. AFC expresses its deepest gratitude to colleagues from the participating microfinance institutions and producer groups in Madagascar, Uganda, Ghana and Morocco.
PREPARED BY: Jan Kerer, Clémence Tatin-Jaleran, Lilian Steinhäuser, Simona Helmsmüller, Lukas Korn-herr, Evelyn Debrah, Mohamed Ben Galha, Januario Ntungwa and Andriatsitohaina Rako-toarimanana AFC Consultants International GmbH (AFC) Dottendorfer Str. 82, 53129 Bonn, Germany Telephone: +49-228-98579-0 Email: [email protected] Web: www.afci.de
ON BEHALF OF: Kreditanstalt für Wiederaufbau (KfW) Sector Policy Unit – Financial Sector Development Palmengartenstraße 5-9, 60325 Frankfurt/M., GERMANY Telephone: +49-69-7431-2395 Email: [email protected]
Bonn, January 2016
Feasibility Study
II
Table of Contents
EXECUTIVE SUMMARY ............................................................................................................1
1 INTRODUCTION..............................................................................................................3
1.1 Objective of the study 3
1.2 Methodology 3
1.3 Data limitations 5
2 CASE STUDY OF THE MFI IN MADAGASCAR............................................................6
2.1 Country background 6 2.1.1 Agricultural sector 6 2.1.2 Agricultural finance and insurance 7
2.2 Institutional profile of the MFI 7 2.2.1 Brief description 7 2.2.2 Detailed description of agricultural sector exposure 9
2.3 Agricultural risk analysis 10 2.3.1 Major risks for the value chain of rice 10 2.3.2 Impact of risk factors on production 10
2.4 Impact of risks on the MFI 12 2.4.1 Preliminary qualitative considerations 12 2.4.2 Risk variables and key performance indicators (KPI) 13 2.4.3 Correlation analysis between risk factors and KPI 14
2.5 Risk management of the MFI 17 2.5.1 Description of applied risk management strategy 17 2.5.2 SWOT Analysis of Agricultural Risk Management 18
2.6 Recommendations for improved risk management and potential of meso-level insurance 18
3 CASE STUDY OF THE MICROFINANCE BANK IN UGANDA...................................20
3.1 Country background 20 3.1.1 Agricultural sector 20 3.1.2 Agricultural finance and insurance 21
3.2 Institutional profile of the microfinance bank 22 3.2.1 Brief description 22 3.2.2 Detailed description of agricultural sector exposure 23
3.3 Agricultural risk analysis 25 3.3.1 Major risks for the value chains of maize and coffee 25 3.3.2 Impact of risk factors on production 27
3.4 Impact of risks on the microfinance bank 28 3.4.1 Preliminary qualitative considerations 28 3.4.2 Risk variables and key performance indicators (KPI) 29 3.4.3 Correlation analysis between risk factors and KPI 29
3.5 Risk management of the microfinance bank 34 3.5.1 Description of applied risk management strategy 34 3.5.2 SWOT analysis of agricultural risk management 36
3.6 Recommendations for improved risk management and potential of meso-level insurance 36
Feasibility Study
III
4 CASE STUDY OF THE PRODUCER COOPERATIVE IN MOROCCO.......................38
4.1 Country background 38 4.1.1 Agricultural sector 38 4.1.2 Agricultural finance and insurance 39
4.2 Institutional profile of the cooperative 40 4.2.1 Brief description 40 4.2.2 Detailed description of agricultural sector exposure 40
4.3 Agricultural risk analysis 41 4.3.1 Major risks for the value chain of wheat 41 4.3.2 Impact of risk factors on production 41
4.4 Impact of risks on the cooperative 42 4.4.1 Preliminary qualitative considerations 42 4.4.2 Risk variables and key performance indicators (KPI) 43 4.4.3 Correlation analysis between risk factors and KPI 43
4.5 Risk management of the cooperative 45 4.5.1 Description of applied risk management strategy 45 4.5.2 SWOT analysis of agricultural risk management 46
4.6 Recommendations for improved risk management and potential of meso-level insurance 47
5 CASE STUDY OF THE MANGO PRODUCER GROUP IN GHANA ...........................49
5.1 Country background 49 5.1.1 Agricultural sector 49 5.1.2 Agricultural finance and insurance 49
5.2 Institutional profile of the producer group 50 5.2.1 Brief description 50 5.2.2 Detailed description of agricultural sector exposure 51
5.3 Agricultural risk analysis 51 5.3.1 Major risks for the mango value chain 51 5.3.2 Impact of risk factors on production 52
5.4 Impact of risks on the producer group 52 5.4.1 Preliminary qualitative considerations 52 5.4.2 Risk variables and key performance indicators (KPI) 53 5.4.3 Correlation analysis between risk factors and KPI 53
5.5 Risk management of the producer group 55 5.5.1 Description of applied risk management strategy 55 5.5.2 SWOT analysis of agricultural risk management 55
5.6 Recommendations for improved risk management and potential of meso-level insurance 56
BIBLIOGRAPHY.......................................................................................................................57

Feasibility Study
IV
Tables
Table 1: Overview of KPIs ......................................................................................................... 4
Table 2: Monthly rainfall averages for location of selected branches of the MFI (2010-2015) 6
Table 3: Yield and income loss for farmers due to external risk factors in Madagascar ........ 11
Table 4: Correlations between monthly rainfall and rice production in Madagascar .............. 11
Table 5: Correlation between rainfall at ten-day intervals and national rice production ......... 12
Table 6: Characteristics of agricultural loan portfolio of the MFI............................................. 14
Table 7: Correlation of risk factors and the agricultural portfolio of the MFI ........................... 15
Table 8: Correlation between risk factors and portfolio quality at branch level ...................... 15
Table 9: Correlation of weather parameters and the write-off ratio of the MFI ....................... 16
Table 10: Major crop groups produced in Uganda .................................................................. 20
Table 11: Geographical distribution of agricultural loan portfolio ............................................ 24
Table 12: Economic losses due to droughts in Uganda 2005-2013 (in million euros) ........... 27
Table 13: Non-performing loan ratio at selected branches of the microfinance bank (2010-2014) ........................................................................................................................................ 29
Table 14: Correlation analysis between rainfall and NPL ratio in six branches (2010-2014). 31
Table 15: Calculated loss of income for the microfinance bank in 2006 and 2012 (in UGX) . 33
Table 16: Utilisation of aBi guarantee scheme by the microfinance bank in EUR (2010-2013) .................................................................................................................................................. 35
Table 17: Correlation analysis between rainfall and wheat yields in the province of Meknès-Elhajeb (2001-2014)................................................................................................................. 42
Table 18: KPI data for the cooperative (2006-2014) ............................................................... 43
Table 19: Correlation analysis between rainfall and wheat yield of cooperative members (2006-2014) .............................................................................................................................. 43
Table 20: Correlation analysis between rainfall and internal credit portfolio of the cooperative (2011-2014) .............................................................................................................................. 45
Table 21: Farm gate prices for mangoes in the focus province (2007-2014) ......................... 51
Table 22: KPI data of the farmers’ association (2010-2014)................................................... 53
Table 23: Correlation analysis between mango yield of the association (2010-2014) and days with excessive rainfall (>30mm) between mid-August and beginning of October .................. 54
Table 24: Correlation analysis between members’ mango sales to the export company (2010-2014) and days with excessive rainfall (>30mm) between mid-August and beginning of October ..................................................................................................................................... 54
Feasibility Study
V
Figures
Figure 1: Map of Africa with the four institutions participating in the study ............................... 4
Figure 2: National rice production and average yield in Madagascar (2001-2014) .................. 6
Figure 3: Composition of the MFI’s loan portfolio ...................................................................... 7
Figure 4: Growth of the MFI’s agricultural lending (2010-2014)................................................ 8
Figure 5: Branches of the MFI with agricultural loans and regional distribution of crop production in Madagascar.......................................................................................................... 9
Figure 6: Risk factors for rice production in Central/Eastern Madagascar ............................. 10
Figure 7: MFI risk analysis for agricultural lending .................................................................. 13
Figure 8: Loan appraisal and risk analysis process of the MFI ............................................... 17
Figure 9: Long term climate trend for Uganda (since 1900) ................................................... 20
Figure 10: Distribution of sectors in the bank’s loan portfolio ................................................. 22
Figure 11: Composition of agricultural loans in Mbale and Hoima branch ............................. 25
Figure 12: Risk factors for maize production in Western Uganda........................................... 26
Figure 13: Market prices for maize in Uganda for 2014 (mean price in UGX/kg) ................... 26
Figure 14: Risk factors for coffee production in Eastern Uganda ........................................... 27
Figure 15: Sources of agricultural losses in Uganda............................................................... 28
Figure 16: Agricultural portfolio development of the microfinance bank (in UGX, 1999-2014) .................................................................................................................................................. 30
Figure 17: Correlation between annual rainfall and (inflation-adjusted) agricultural portfolio growth ....................................................................................................................................... 30
Figure 18: RoA and PAR 90 (1999-2013) ............................................................................... 31
Figure 19: Rainfall in March and NPL ratio at Hoima branch (2010-2014)............................. 32
Figure 20: Rainfall in April and NPL ratio at Mbale branch (2010-2014) ................................ 33
Figure 21: Loan appraisal and risk analysis process of the microfinance bank ..................... 35
Figure 22: Main crops of Moroccan agriculture in terms of production quantity ..................... 38
Figure 23: Relation between GDP, Agricultural GDP, and rainfall in Morocco (1981-2007).. 38
Figure 24: Equity and RoA of the cooperative (2006-2014).................................................... 40
Figure 25: Main crops produced by cooperative members in terms of sales volume ............ 40
Figure 26: Major risks for wheat production in Northern Morocco .......................................... 41
Figure 27: Wheat yields (in t/ha, left-hand scale) and rainfall (in mm, right-hand scale) in the province of Meknès-Elhajeb..................................................................................................... 42
Figure 28: Wheat yield (in t/ha, left axis) and cumulative rainfall (in mm, right axis).............. 44
Figure 29: Relationship between wheat yield (right axis), production (left axis) and sales (left axis) of the cooperative’s members ......................................................................................... 44
Figure 30: Internal loans of the cooperative (portfolio size on left axis, number of credits on right axis) and cumulative rainfall (in mm, left axis)................................................................. 45
Figure 31: Main crops of Ghanaian agriculture in terms of production quantity ..................... 49
Figure 32: Risk factors for mango production in Eastern Ghana ............................................ 52
Figure 33: Mango yields and sales growth of the association and days with excessive rainfall in Somanya (2010-2014) ......................................................................................................... 54
Feasibility Study
VI
Abbreviations
ADB Agricultural Development Bank
AFC AFC Consultants International GmbH
ALAS Agricultural Loan Analysis Spreadsheet
ALGS Agribusiness Loan Guarantee Scheme
APHLIS African Postharvest Loss Information System
ARC2 Africa Rainfall Climatology version 2
ATM Automated Teller Machine
BCM Banque Centrale de Madagascar
BOU Bank of Uganda
CCE Crop Cutting Experiments
CPI Consumer Price Index
EUR Euro
FAO Food and Agriculture Organization of the United Nations
FAOSTAT FAO Statistics Division
GAIP Ghana Agricultural Insurance Pool
GAP Good Agricultural Practices
GDP Gross Domestic Product
GHS Ghanaian Cedi
ICARDA International Center for Agricultural Research in the Dry Areas
IFAD International Fund for Agricultural Development
IFC International Finance Corporation
INRA Institut national de la recherche agronomique au Maroc
IRA Insurance Regulatory Authority
KfW Kreditanstalt für Wiederaufbau (German Development Bank)
KPI Key performance indicator
MAD Moroccan Dirham
MAMDA Mutuelle Agricole Marocaine d’Assurance
MD Managing Director
MFI Microfinance Institution
MGA Malagasy Ariary

Feasibility Study
VII
MLND Maize Lethal Necrosis Disease
MSME Micro, small and medium enterprises
NGO Non-governmental organisation
NPL Non-performing loans
ODCO Office du Développement de la Coopération
OdR Rice Observatory of Madagascar
ONCA Office National du Conseil Agricole du Maroc
PAR Portfolio at Risk
PMV Plan Maroc Vert
POS Point of Sale
RATIN Regional Agricultural Trade and Intelligence Network
ROA Return on Assets
ROAA Return on Average Assets
ROEE Return on Average Equity
ROE Return on Equity
SACCO Savings and Credit Cooperatives
SD Standard Deviation
SME Small and medium enterprises
SWOT Strengths, Weaknesses, Opportunities and Threats
UCA Uganda Cooperative Alliance
UCDA Uganda Coffee Development Authority
UGX Ugandan Shilling
USD U.S. Dollar
WFP World Food Programme
WII Weather Index Insurance
Feasibility Study “Insurance f or agricultural intermediaries”
1
EXECUTIVE SUMMARY
A major reason for the reluctance of banks to extend credit to farmers is the broad range of risks that affect agricultural production and that reduce farmers' ability to repay loans. Against this backdrop, agricultural insurance presents one promising option to lower the financial impact from risks that the farmers face and hence to increase their creditworthiness. However, classical indemnity-based insurance products face the typical adverse selection and moral hazard prob-lems, which are especially difficult to mitigate in countries with high transaction costs and weak judicial systems. In order to tackle this problem, index-based insurance products have been developed, linking payouts to an index such as rainfall, temperature or area yields rather than actual losses. Despite the broad attention that this approach has attracted, the success of pilot projects, measured in terms of uptake by farmers, has fallen behind expectations in many coun-tries.
In view of the difficulties to insure individual farmers in low-income economies, the objective of this feasibility study is to assess the potential of developing agri-insurance schemes for inter-mediaries in the agricultural value chain. The geographical focus of the study is Africa: two mi-crofinance institutions (MFIs) in Madagascar and Uganda as well as two producer groups in Morocco and Ghana took part in the assessment. Their key performance indicators (KPI) over the past 5-15 years, namely loan portfolio growth, Portfolio at Risk (PAR), write-off ratio, agricul-tural yield and sales volume, were analysed for correlations with risk factors such as rainfall and price volatility. This quantitative assessment was complemented by qualitative information to derive conclusions on possible improvements of their risk management and the potential for meso-level insurance.
The two MFIs in Madagascar and Uganda both show a clear dedication to the agricultural sec-tor which represents 18% and 16% of their lending portfolio respectively. Whereas the Mala-gasy MFI only started agri-lending a few years ago in one specific region that is dominated by rice cultivation, the Ugandan MFI already has a well-diversified agri-lending portfolio in terms of climate zones and crops. The assessment for both countries focuses on the risk of excessive or insufficient rainfall and, in the case of Madagascar, also the volatility of rice prices.
The results of the correlation analysis show that, over the past five years, neither of the two MFIs has experienced a deterioration of the agricultural loan portfolio quality due to rainfall pat-terns at an aggregated MFI level. However, at the branch level, significant correlations exist between insufficient rainfall and delayed repayments of agricultural loans, especially in branch-es that mainly finance rice or maize producers. Price shocks also indicate significant correla-tions with branch-level portfolio quality. At the same time, the analysis shows that deviations in portfolio quality can also be the result of other risks, such as mismanagement of a branch, that sometimes coincide with adverse weather conditions. Overall, the Malagasy MFI has incurred a total opportunity cost of an estimated EUR 62,760 per year for provisioning doubtful agricultural loans. This equals 2.26% of its total agricultural portfolio.
Even if portfolio diversification seems to allow MFIs to cushion variations in branch-level portfo-lio at risk, the growth rate of the agricultural portfolio can nevertheless suffer at an aggregated level. The case of Uganda suggests that years with severe nation-wide weather shocks, such as droughts, may have severe effects on agricultural portfolio growth and even lead to reduced portfolio size in the subsequent year. Due to lost business, the estimated loss of interest income for the Ugandan MFI for the years 2006 and 2012, which were preceded by drought years, is EUR 416,276 and EUR 2,303,495 respectively. This equals to 12.8% and 10.7% of the bank’s gross profit in these years.
In order to protect themselves against agricultural risks, the two MFIs have already embedded the analysis and management of risks in their agricultural loan appraisal process. For larger loans, the Malagasy MFI might consider in future to also take into account the clients’ vulnera-bility to price volatility in this process. Furthermore, it would be advisable to strive towards en-hanced geographic and crop diversification, as demonstrated by the Ugandan MFI. Financial institutions with a lower degree of diversification, which are smaller than the MFIs assessed in this study, might be even more interested in pooling their risks with others. An insurance prod-
Feasibility Study “Insurance f or agricultural intermediaries”
2
uct that ought to protect the MFIs against larger-scale risks, such as droughts, should be crop-specific and take into account the agro-climatic specifics of each branch. The option of an area yield index insurance seems less useful, at least in the case of the Malagasy MFI, where annual production at district levels did not show any correlation with portfolio quality. Especially in the case of Uganda, the complementarity of insurance with existing credit guarantee schemes would need to be assessed. Due to the lack of long-term datasets from the Malagasy MFIs, it was not feasible to assess the potential for a pure catastrophe insurance, e.g. for cyclones.
The two producer groups in Morocco and Ghana are significantly weaker institutions than the MFIs and do not have the opportunity for geographic diversification. The producer association in Ghana concentrates exclusively on the production of mangoes and only supports its members in production techniques and price negotiations. The members of the Moroccan cooperative focus on the production of wheat, potato and onion, but do no longer need the cooperative in order to apply for a bank loan or to sell their harvest. Based on the most prominent agricultural risks of the particular crop, the study analysed the risk of droughts for the Moroccan cooperative and the risk of excessive rainfall for the Ghanaian association.
The wheat yields recorded by the Moroccan cooperative show a strong correlation with cumula-tive rainfall during the planting and tillering phase which is evidence for the risk of drought. Due to insufficient data quality and quantity, the observations on sales volume and internal lending operations of the cooperative did not provide any meaningful results. In the case of the Ghana-ian farmer association, the analysis shows that excessive rainfall in the flowering stage of man-goes can reduce yields by up to 90%. The combined yield losses of all members in 2010 and 2014 are estimated at EUR 817,220 and EUR 959,675 respectively. This loss equals to 90% and 75% of the association’s expected yields in these years.
Yet, in the case of both producer groups, the weather risks are borne by each farmer individual-ly, rather than by the group as a whole. Therefore, the case for meso-level insurance for these two groups is fairly weak unless the association is mandated by its members to purchase insur-ance cover on behalf of the group. Otherwise, the producer groups may also act as distribution channel for existing insurance schemes in their country, namely Mutuelle Agricole Marocaine d’Assurance (MAMDA) and Ghana Agricultural Insurance Pool (GAIP). In the latter case, an expansion of this scheme to also include mangoes could be feasible and could draw on other mango insurance schemes as those established in India.
In addition to these recommendations, the study highlights the necessity, at the institutional lev-el, of longer and more reliable data records concerning the agricultural portfolio of financial insti-tutions and the production and sales figures of agricultural associations and companies. Long-term historical weather records are available from service providers using satellite-generated data, but sometimes show inconsistencies with on-the-ground observations from automated weather stations.
Feasibility Study “Insurance f or agricultural intermediaries”
3
1 INTRODUCTION
1.1 Objective of the study
Overall objective of KfW. KfW on behalf of the German government considers developing
agri-insurance schemes for intermediaries in the agricultural value chain, with the ultimate aim to increase the flow of lending in rural areas by complementing existing risk management strat-egies of intermediaries and thus reducing agricultural credit risks.
Objective of feasibility study. The aim of this feasibility study is to assess the potential of such
meso-level agri-insurance schemes and to derive conclusions on whether and how different types of intermediaries would be suited to apply and benefit from them. Looking at the most important players in agricultural value chains, the feasibility study comprises case studies for two different types of intermediaries: microfinance institutions (MFIs) with an agricultural loan portfolio and agricultural producer organisations/cooperatives.
Outcomes. This feasibility study provides qualitative and quantitative assessments of the fol-
lowing aspects for each intermediary that participated in this study:
(1) An agricultural risk analysis for specific crops relevant for the specific intermediary
(2) An analysis of the impact of these risks on the intermediary
(3) An assessment of the current risk management strategies pursued by the intermediary
(4) Recommendations for improved risk management strategies, including the option of me-so-level insurance
1.2 Methodology
Geographical focus. The study focuses on Africa, reflecting the currently very low agricultural
insurance penetration rate that leaves significant room for improvement, as well as the German government’s intention to increase its engagement with agricultural finance in Africa. In order to provide results that can be generalised, at a minimum for the African continent, the study focus-es on one country each in North, West, East and Southern Africa, namely Morocco, Ghana, Uganda and Madagascar. The main selection criteria were the following:
Market size: Morocco, Ghana, Uganda and Madagascar are ranked 5th, 9th, 11th and 15th respectively, in terms of agricultural GDP in Africa. The size of their agricultural sec-tors renders these countries potentially more attractive for insurance and re-insurance companies targeting agricultural insurance.
Institutional strength of agricultural intermediaries: in each country, there is at least one agricultural intermediary with the institutional capacity to compile historical data on its business performance and the willingness to consider options for an improved risk man-agement strategy.
Experience with agricultural insurance: even though overall insurance penetration is low in all four countries, first attempts at introducing agricultural insurance have been made in Morocco, Ghana and Uganda. This indicates that insurance companies are, in princi-ple, considering the agricultural sector as a target.
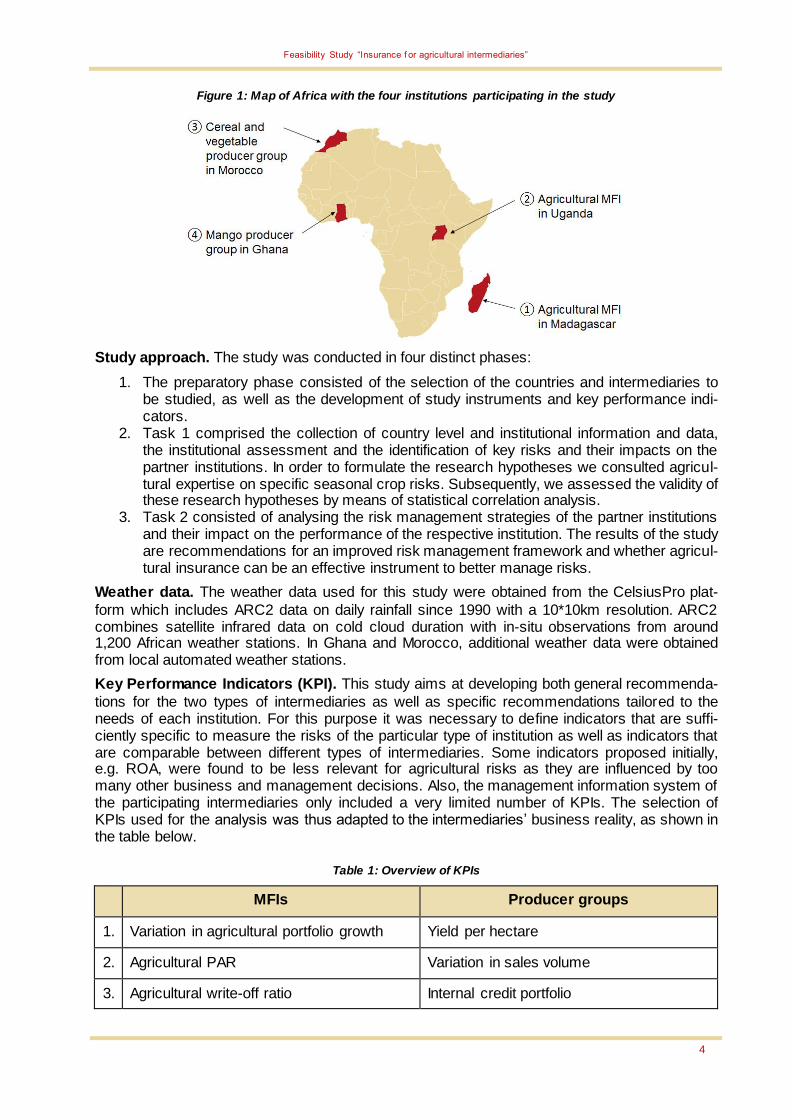
Institutional focus. The analysis is based on case studies of selected agricultural intermediar-
ies. As illustrated in Figure 1 below, two MFIs in Madagascar and Uganda as well as two pro-ducer groups in Morocco and Ghana participated in the study.
Feasibility Study “Insurance f or agricultural intermediaries”
4
Figure 1: Map of Africa with the four institutions participating in the study
Study approach. The study was conducted in four distinct phases:
1. The preparatory phase consisted of the selection of the countries and intermediaries to be studied, as well as the development of study instruments and key performance indi-cators.
2. Task 1 comprised the collection of country level and institutional information and data, the institutional assessment and the identification of key risks and their impacts on the partner institutions. In order to formulate the research hypotheses we consulted agricul-tural expertise on specific seasonal crop risks. Subsequently, we assessed the validity of these research hypotheses by means of statistical correlation analysis.
3. Task 2 consisted of analysing the risk management strategies of the partner institutions and their impact on the performance of the respective institution. The results of the study are recommendations for an improved risk management framework and whether agricul-tural insurance can be an effective instrument to better manage risks.
Weather data. The weather data used for this study were obtained from the CelsiusPro plat-
form which includes ARC2 data on daily rainfall since 1990 with a 10*10km resolution. ARC2 combines satellite infrared data on cold cloud duration with in-situ observations from around 1,200 African weather stations. In Ghana and Morocco, additional weather data were obtained from local automated weather stations.
Key Performance Indicators (KPI). This study aims at developing both general recommenda-
tions for the two types of intermediaries as well as specific recommendations tailored to the needs of each institution. For this purpose it was necessary to define indicators that are suffi-ciently specific to measure the risks of the particular type of institution as well as indicators that are comparable between different types of intermediaries. Some indicators proposed initially, e.g. ROA, were found to be less relevant for agricultural risks as they are influenced by too many other business and management decisions. Also, the management information system of the participating intermediaries only included a very limited number of KPIs. The selection of KPIs used for the analysis was thus adapted to the intermediaries’ business reality, as shown in the table below.
Table 1: Overview of KPIs
MFIs Producer groups
1. Variation in agricultural portfolio growth Yield per hectare
2. Agricultural PAR Variation in sales volume
3. Agricultural write-off ratio Internal credit portfolio

Feasibility Study “Insurance f or agricultural intermediaries”
5
1.3 Data limitations
Data on KPIs of microfinance institutions. The KPI data available for the MFI in Madagascar
are limited to a five-year dataset on their agricultural loans from which we retrieved information on portfolio at risk (PAR) and write-off ratios for 2011-2015. It was not possible to observe varia-tions in portfolio growth for this MFI as this would have required data for at least ten years. In the case of the MFI in Uganda, the data obtained included portfolio growth for the past 15 years and agricultural PAR for six selected branches for the past five years. As there were no data available on the agricultural portfolio size at branch level it was not possible to calculate an av-erage agricultural PAR for this institution. The information on crop-specific portfolio composition for two branches of the Uganda MFI was used to link the PAR of these branches to agricultural risks of the most common crop financed by that branch. Yet, it was not possible to define a crop-specific PAR in Uganda. In general, a major shortcoming of the KPI focus for MFIs is that they do not reveal whether borrowers repay their loans even if their income is reduced by low harvest. Without this information, the link between weather indicators and loan portfolio quality is therefore indirect.
Data on KPIs of producer groups. At the level of producer organisations, the connection be-
tween risks and agricultural output is more straightforward. The Moroccan cooperative has doc-umented members’ yield levels and sales volume for the past nine years as well as a list of out-standing loan balances for the past four years. However, data records show some inconsisten-cies as average yield levels in some years were significantly different from production quantity divided by cultivated area. In the case of the Ghanaian farmers association, the information on yield even had to be reconstructed as there were no historical records. This was only possible for the past five years by means of interviews on the performance of the producer group as a whole and of selected members. Also, due to lack of data on sales volumes we analysed as a proxy the quantities purchased from the association’s farmers by one but not the only trade company that maintains business relations with them. Finally, the KPI on internal credit portfolio does not apply to the Ghanaian producer group as they do not disburse any loans to their members.
Feasibility Study “Insurance f or agricultural intermediaries”
6
2 CASE STUDY OF THE MFI IN MADAGASCAR
2.1 Country background
2.1.1 Agricultural sector
Importance, structure and products. The agricultural sector contributes 29% to Madagascar’s
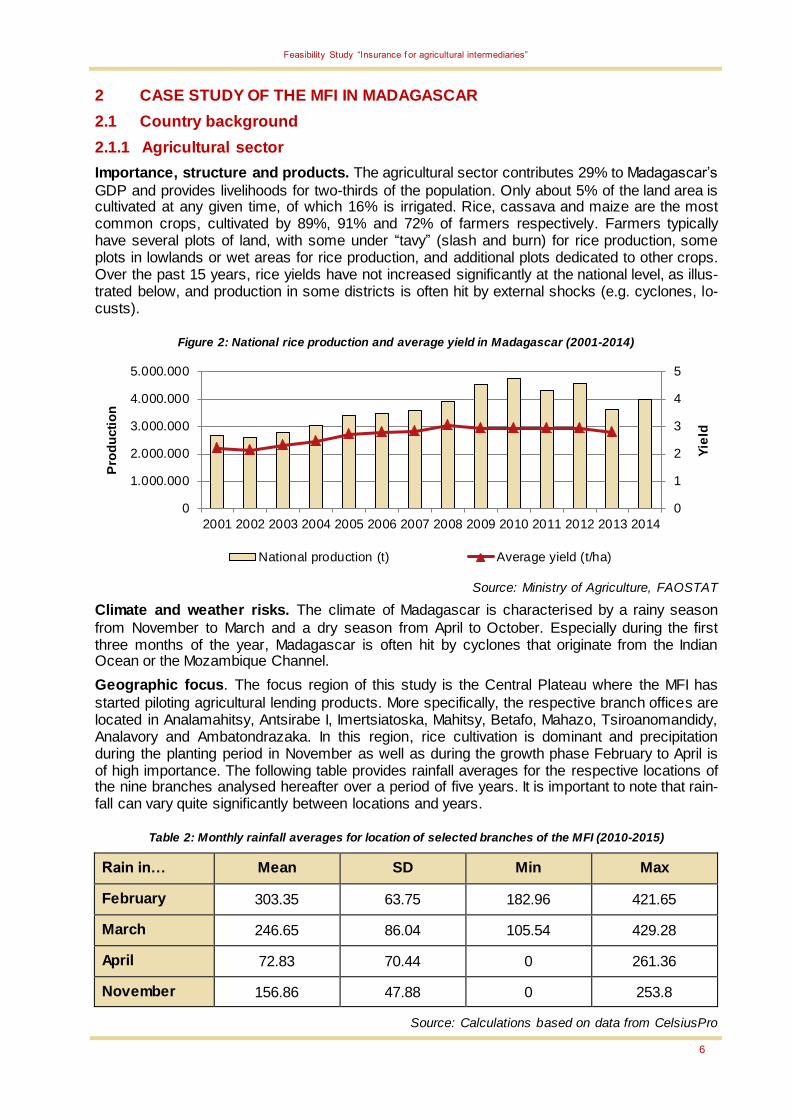
GDP and provides livelihoods for two-thirds of the population. Only about 5% of the land area is cultivated at any given time, of which 16% is irrigated. Rice, cassava and maize are the most common crops, cultivated by 89%, 91% and 72% of farmers respectively. Farmers typically have several plots of land, with some under “tavy” (slash and burn) for rice production, some plots in lowlands or wet areas for rice production, and additional plots dedicated to other crops. Over the past 15 years, rice yields have not increased significantly at the national level, as illus-trated below, and production in some districts is often hit by external shocks (e.g. cyclones, lo-custs).
Figure 2: National rice production and average yield in Madagascar (2001-2014)
Source: Ministry of Agriculture, FAOSTAT
Climate and weather risks. The climate of Madagascar is characterised by a rainy season
from November to March and a dry season from April to October. Especially during the first three months of the year, Madagascar is often hit by cyclones that originate from the Indian Ocean or the Mozambique Channel.
Geographic focus. The focus region of this study is the Central Plateau where the MFI has
started piloting agricultural lending products. More specifically, the respective branch offices are located in Analamahitsy, Antsirabe I, Imertsiatoska, Mahitsy, Betafo, Mahazo, Tsiroanomandidy, Analavory and Ambatondrazaka. In this region, rice cultivation is dominant and precipitation during the planting period in November as well as during the growth phase February to April is of high importance. The following table provides rainfall averages for the respective locations of the nine branches analysed hereafter over a period of five years. It is important to note that rain-fall can vary quite significantly between locations and years.
Table 2: Monthly rainfall averages for location of selected branches of the MFI (2010-2015)
Rain in… Mean SD Min Max
February 303.35 63.75 182.96 421.65
March 246.65 86.04 105.54 429.28
April 72.83 70.44 0 261.36
November 156.86 47.88 0 253.8
Source: Calculations based on data from CelsiusPro
0
1
2
3
4
5
0
1.000.000
2.000.000
3.000.000
4.000.000
5.000.000
2001 2002 2003 2004 2005 2006 2007 2008 2009 2010 2011 2012 2013 2014
Yie
ld
Pro
du
cti
on
National production (t) Average yield (t/ha)
Feasibility Study “Insurance f or agricultural intermediaries”
7
2.1.2 Agricultural finance and insurance
Access to finance. The financial system in Madagascar is shallow and has so far fallen short
of catalysing funds for growth: the domestic credit to GDP ratio is low, and the economy re-mains largely cash-based. Access to credit is expensive and limited, especially for small and medium enterprises. The financial sector comprises twelve banks, five financial establishments and 30 microfinance institutions (MFI). One key issue is the low cover of financial institutions in rural areas: on average, there are 1.74 bank branches and 8.71 MFI branches per 100,000 people. As a consequence, a mere 2.8% of the rural population have an account with a financial institution.
Agricultural insurance. Agricultural insurance is not available in Madagascar; instead, farmers
rely on informal support systems, borrowing money or food from family or friends. However, insurance against catastrophic events, such as cyclones, is available, and to some extent, the public sector is prepared for disaster events. There is a government reserve fund of approxi-mately USD 20 million for funding relief and reconstruction; however, demand often exceeds supply. Private sector insurance uptake is substantial, with a 4.3% insurance premium/income ratio for disaster coverage.
Selection of intermediary. The selected institution is the first MFI with a banking license in
Madagascar. Originally based in urban and peri-urban areas, over the past five years, this MFI has significantly increased its agricultural lending activities, which now represent 18% of its overall loan portfolio (as of June 2015). The following chapters will provide an in-depth analysis for this institution.
2.2 Institutional profile of the MFI
2.2.1 Brief description
Organisational structure. The MFI was established in October 2006 as a greenfield institution
by the holding company of the MFI and three investors. Later, the International Finance Corpo-ration (IFC) and KfW joined the ranks of shareholders. As of 2013, the network of the MFI in-cludes 23 branches, including two "micro branches" which are located in smaller market towns and have a considerably larger agricultural portfolio share than the other branches.
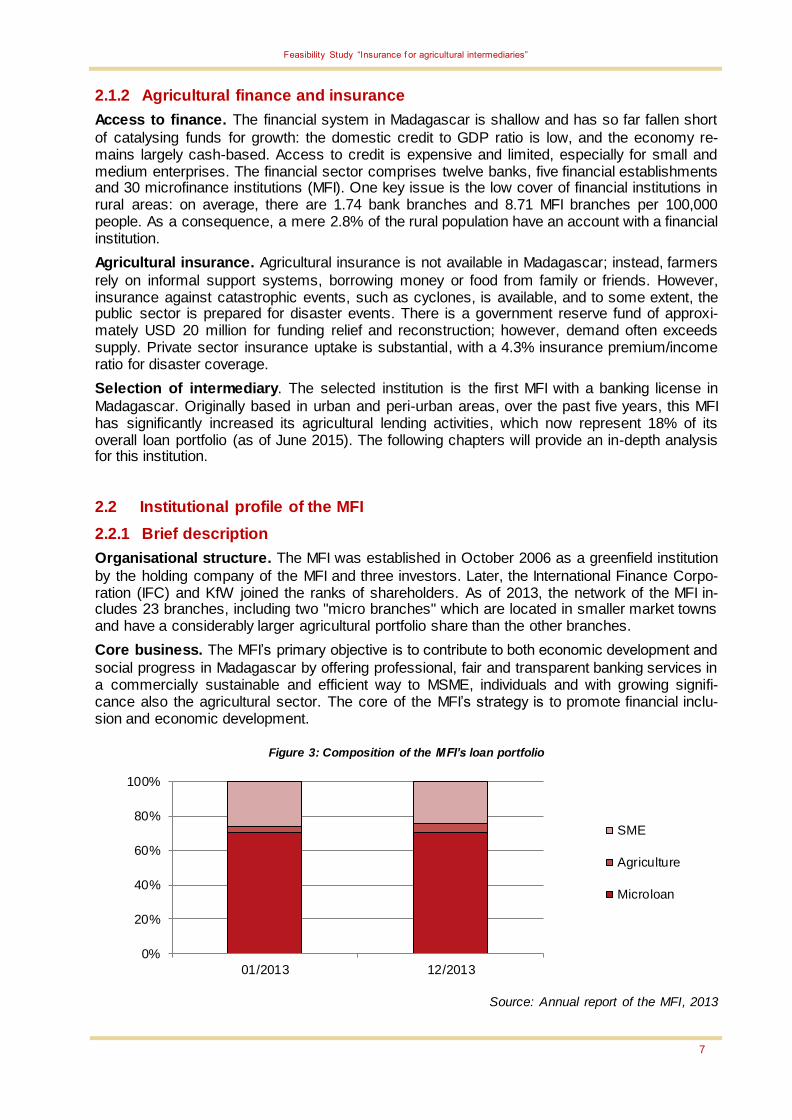
Core business. The MFI’s primary objective is to contribute to both economic development and
social progress in Madagascar by offering professional, fair and transparent banking services in a commercially sustainable and efficient way to MSME, individuals and with growing signifi-cance also the agricultural sector. The core of the MFI’s strategy is to promote financial inclu-sion and economic development.
Figure 3: Composition of the MFI’s loan portfolio
Source: Annual report of the MFI, 2013
0%
20%
40%
60%
80%
100%
01/2013 12/2013
SME
Agriculture
Microloan
Feasibility Study “Insurance f or agricultural intermediaries”
8
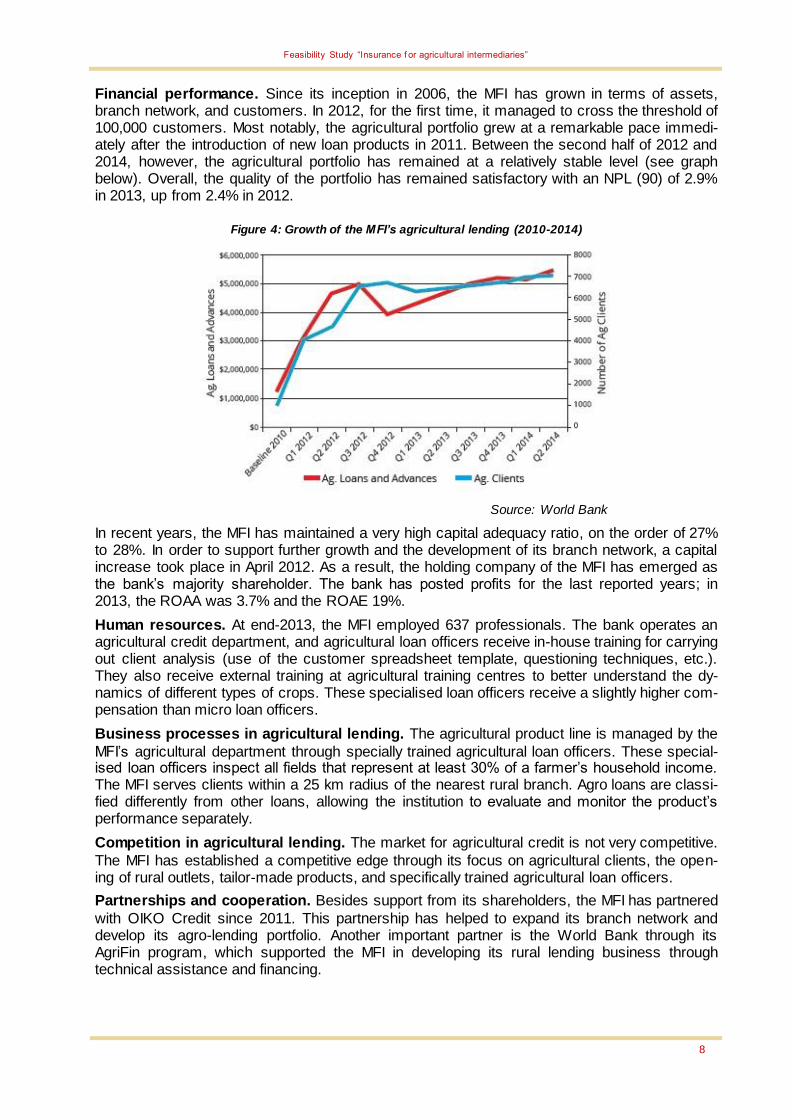
Financial performance. Since its inception in 2006, the MFI has grown in terms of assets, branch network, and customers. In 2012, for the first time, it managed to cross the threshold of 100,000 customers. Most notably, the agricultural portfolio grew at a remarkable pace immedi-ately after the introduction of new loan products in 2011. Between the second half of 2012 and 2014, however, the agricultural portfolio has remained at a relatively stable level (see graph below). Overall, the quality of the portfolio has remained satisfactory with an NPL (90) of 2.9% in 2013, up from 2.4% in 2012.
Figure 4: Growth of the MFI’s agricultural lending (2010-2014)
Source: World Bank
In recent years, the MFI has maintained a very high capital adequacy ratio, on the order of 27% to 28%. In order to support further growth and the development of its branch network, a capital increase took place in April 2012. As a result, the holding company of the MFI has emerged as the bank’s majority shareholder. The bank has posted profits for the last reported years; in 2013, the ROAA was 3.7% and the ROAE 19%.
Human resources. At end-2013, the MFI employed 637 professionals. The bank operates an agricultural credit department, and agricultural loan officers receive in-house training for carrying out client analysis (use of the customer spreadsheet template, questioning techniques, etc.). They also receive external training at agricultural training centres to better understand the dy-namics of different types of crops. These specialised loan officers receive a slightly higher com-pensation than micro loan officers.
Business processes in agricultural lending. The agricultural product line is managed by the
MFI’s agricultural department through specially trained agricultural loan officers. These special-ised loan officers inspect all fields that represent at least 30% of a farmer’s household income. The MFI serves clients within a 25 km radius of the nearest rural branch. Agro loans are classi-fied differently from other loans, allowing the institution to evaluate and monitor the product’s performance separately.
Competition in agricultural lending. The market for agricultural credit is not very competitive.
The MFI has established a competitive edge through its focus on agricultural clients, the open-ing of rural outlets, tailor-made products, and specifically trained agricultural loan officers.
Partnerships and cooperation. Besides support from its shareholders, the MFI has partnered
with OIKO Credit since 2011. This partnership has helped to expand its branch network and develop its agro-lending portfolio. Another important partner is the World Bank through its AgriFin program, which supported the MFI in developing its rural lending business through technical assistance and financing.

Feasibility Study “Insurance f or agricultural intermediaries”
9
2.2.2 Detailed description of agricultural sector exposure
Geographic scope. As illustrated by the map below, there are nine branches of the MFI that
currently offer agricultural loans. All are located in the Central Plateau, where rice is the main crop. The agricultural portfolio is thus still relatively concentrated in terms of agro-climatic zones.
Figure 5: Branches of the MFI with agricultural loans and regional distribution of crop production in Mada-
gascar
Source: FAO and the MFI
Product features. More than half of the MFI’s agricultural clients, i.e. 4,316 out of 8,444, are
already served under the cash flow-based agro loan product that the MFI launched in 2011. The minimum loan amount is MGA 100,000 (approximately EUR 30), and the maximum amount is MGA 15,000,000 (approximately EUR 4,500). The MFI requires that at least half of a farmer’s household income be derived from farming activity. The agro loan features monthly repayment, though the monthly payment varies in line with the client’s cash flow. The loan agreement may include principal grace periods, but interest must always be paid. Clients are required to make the monthly payments at the branch office, ensuring frequent client contact, which the MFI finds to be a helpful form of loan supervision.
In addition to the agro loan, the MFI has developed three new specialised loan products for farmers, namely warehouse loans, poultry loans, and equipment loans. Warehouse loans are short term working capital loans extended to rice producers and collectors after harvest. The product is provided via warehouses owned and managed by the MFI. It allows farmers to store their commodity at the warehouse and receive a loan against the market value of the stored commodity. As is common with warehouse receipt systems elsewhere, the fixed cost associated with maintaining warehouses is a challenge for this product. The poultry lending product is de-signed as an integrated value chain loan, provided in partnership with a chicken feed input sup-plier. However, results of this particular loan segment are mixed as quality control of inputs re-mains a challenge. Equipment loans are made in partnership with a local equipment supplier to finance farm equipment. So far, the product has not yet met demand and the MFI is trying to partner up with additional suppliers.
Pricing. The MFI charges a monthly interest rate between 3.35% and 3.75% for agro loans
(with lower rates applied to larger loans), which is similar to the micro loan product of the MFI.

Feasibility Study “Insurance f or agricultural intermediaries”
10
For loan amounts below MGA 500,000, the MFI charges 4% per month to cover the relatively high administrative costs. After timely repayment of a loan, a client can immediately apply for a repeat loan. A system of graduated incentives (including reduced interest rate charges) rewards a client’s good performance, supports client retention, and helps to ensure that the bank’s prod-ucts remain attractive.
2.3 Agricultural risk analysis
2.3.1 Major risks for the value chain of rice
Precipitation. Rice is affected negatively both by excessive and insufficient rain. Immediately after planting, the plants require sufficient moisture. Droughts during this phase can lead to a substantial reduction of yields. After being transplanted, growth of the plants is influenced signif-icantly by moisture content: too much rain leaves plants vulnerable to pests and diseases, while droughts limit the growth. A particularly critical growth stage is flowering, when insufficient rain-fall leads to reduced flowering while excessive rainfall may lead to flower abortion. The majority of farmers operate without irrigation systems.
Price volatility. Besides adverse weather, rice farmers are also affected by problems of market access and price volatility. Many farmers sell some of their crop immediately after the harvest to cover the costs of inputs and basic household needs. Later in the year, when their rice reserves run out, the same farmers typically buy back rice in the market, often at higher prices. Reflecting a typical pattern, rice prices are the lowest immediately after the harvest and the highest during the lean season when farmers have to buy back rice to feed their families.
The following graph provides an overview of the major risk factors for rice, based on a qualita-tive evaluation of local agricultural expertise. As the minor season is mostly used for subsist-ence farming, our analysis focuses on the major crop season starting in November.
Figure 6: Risk factors for rice production in Central/Eastern Madagascar
Source: Illustration based on expert interviews
2.3.2 Impact of risk factors on production
General impact of weather risks. An analysis of some 600 farmers across Madagascar
showed that the three most frequent risks were pest damage, drought and cyclones, affecting 15%, 13% and 10% of farmers respectively during the five-year period of the study. The farmers affected by pest damage and diseases were hit the hardest as 56% of them lost half of their household income due to yield losses. Yet, the severe effects of cyclones and droughts are not less alarming as they left around 30% of affected households with less than half of their normal income.

Feasibility Study “Insurance f or agricultural intermediaries”
11
Table 3: Yield and income loss for farmers due to external risk factors in Madagascar
Risk factor
Farmers affected (in per-cent)
Crop yields lost due to risks1 (in percent)
Reduction in household income due to risk (in per-
cent)
<25 25-50 50-75 >75 <25 25-50 50-75
>75
Diseases 8.72 56 29 15 — 10 32 41 15
Pest damage 15.03
Storage loss 6.68 88 10 2 — — — — —
Cyclones 9.73 30 29 30 26 39 30 21 10
Flooding 8.40 40 35 20 5 40 34 17 8
Drought 12.98 23 42 27 9 35 35 22 8
Source: Harvey et al. (2014)
Coping strategies. Farmers use a variety of coping strategies to deal with these adverse im-
pacts: one of the most common strategies for households is to consume less food or to switch their diet from rice to cassava and other tubers. Some farmers also rely on wild foods from communal forests to supplement their diets. But some farmers also find means of generating extra income so that they can purchase food in the market, often selling small livestock (e.g. chicken) or working as agricultural wage labourers on other farms. Last but not least, farmers turn to relatives or friends for support. The table above shows how severe loss of yield affects their income. Despite their coping strategies, some affected farmers were most likely not able to repay their loans on time.
Correlation between weather factors and rice production. In order to obtain a quantitative
assessment of the impact of weather factors on rice production, we analysed the correlation
between rainfall and production shocks.2 Production shocks are computed as deviations from a linear trend over the period 2000-2013. Overall, we found only weak to moderate correlation between rainfall and rice production in Madagascar. Aggregated analysis using cumulative monthly rainfall indicates positive correlations between rainfall in November and rice yields. This confirms the assumptions of the risk graph above. The statistical results for the remaining months from December to May are less conclusive as these patterns vary substantially across districts, possibly weakening the overall correlation. The following table shows the results of the correlation analysis at the national level and by way of example for two districts.
Table 4: Correlations between monthly rainfall and rice production in Madagascar
Month
11 12 1 2 3 4 5
National production 0.2653* -0.0393 0.1022 -0.0621 0.1014 0.0592 -0.1423
District: Avaradrano -0.1504 -0.0411 -0.1593 0.1171 -0.1727 0.0692 -0.0104
District: Arivonimamo 0.2957 0.0623 0.3336 -0.4572 0.6709* 0.0347 -0.3655
* Significant at 90%-level
1 Impacts of pests and diseases on crop yields and income levels are assessed jointly, because of diff iculties in attributing impacts to one or the other.
2 Production data w ere provided by the statistical department of the Ministry of Agriculture of Madagascar for the period 2001-2014, broken dow n by regions and districts.
Feasibility Study “Insurance f or agricultural intermediaries”
12
Source: Calculations based on data from Ministry of Agriculture and CelsiusPro
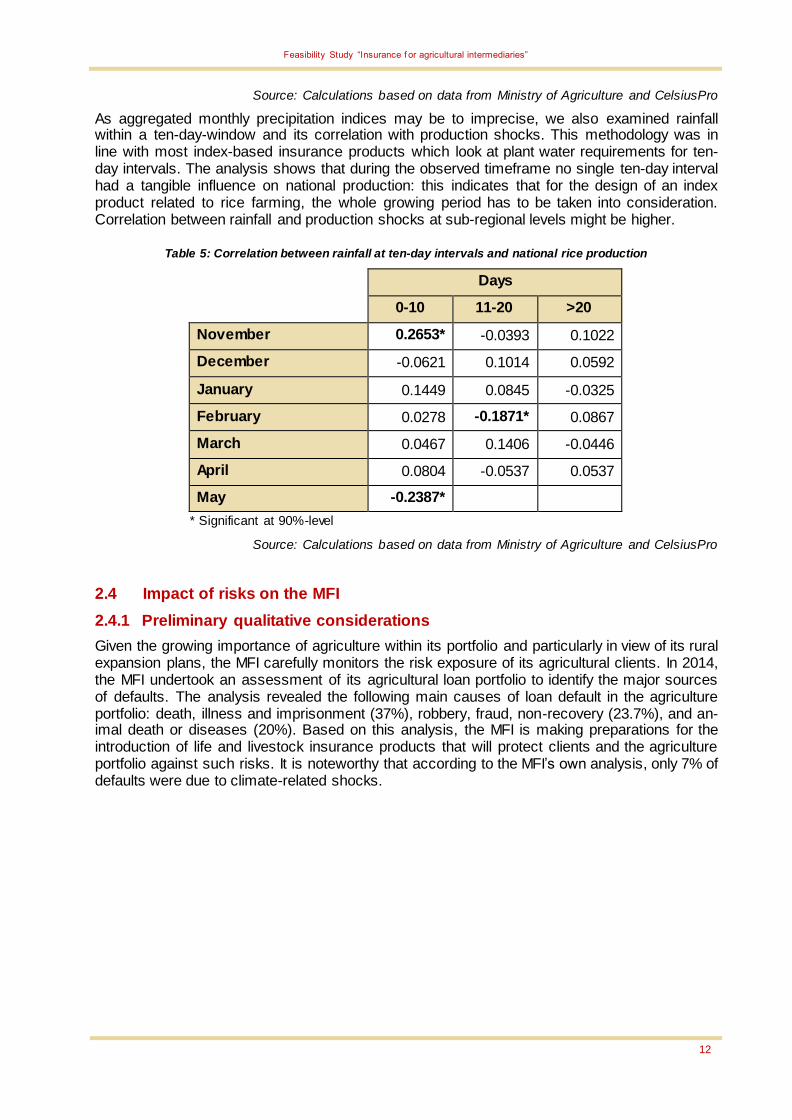
As aggregated monthly precipitation indices may be to imprecise, we also examined rainfall within a ten-day-window and its correlation with production shocks. This methodology was in line with most index-based insurance products which look at plant water requirements for ten-day intervals. The analysis shows that during the observed timeframe no single ten-day interval had a tangible influence on national production: this indicates that for the design of an index product related to rice farming, the whole growing period has to be taken into consideration. Correlation between rainfall and production shocks at sub-regional levels might be higher.
Table 5: Correlation between rainfall at ten-day intervals and national rice production
Days
0-10 11-20 >20
November 0.2653* -0.0393 0.1022
December -0.0621 0.1014 0.0592
January 0.1449 0.0845 -0.0325
February 0.0278 -0.1871* 0.0867
March 0.0467 0.1406 -0.0446
April 0.0804 -0.0537 0.0537
May -0.2387*
* Significant at 90%-level
Source: Calculations based on data from Ministry of Agriculture and CelsiusPro
2.4 Impact of risks on the MFI
2.4.1 Preliminary qualitative considerations
Given the growing importance of agriculture within its portfolio and particularly in view of its rural expansion plans, the MFI carefully monitors the risk exposure of its agricultural clients. In 2014, the MFI undertook an assessment of its agricultural loan portfolio to identify the major sources of defaults. The analysis revealed the following main causes of loan default in the agriculture portfolio: death, illness and imprisonment (37%), robbery, fraud, non-recovery (23.7%), and an-imal death or diseases (20%). Based on this analysis, the MFI is making preparations for the introduction of life and livestock insurance products that will protect clients and the agriculture portfolio against such risks. It is noteworthy that according to the MFI’s own analysis, only 7% of defaults were due to climate-related shocks.

Feasibility Study “Insurance f or agricultural intermediaries”
13
Figure 7: MFI risk analysis for agricultural lending
Source: World Bank (2014)
With the introduction of life and livestock insurance, the MFI would be able to reduce its risk exposure quite significantly. Other risk factors, such as fraud, dishonesty, and over-indebtedness are problems that have to be managed through loan appraisal and management procedures. The residual risk is weather/climate.
2.4.2 Risk variables and key performance indicators (KPI)
Selection of risk variables. For our analysis, we focused on those risk parameters that are
most important for rice, namely precipitation, price and area yield. As the bank serves only cli-ents that can be reached by its officers on motorbikes, the analysis was based on the rainfall observed within a 25 km radius from the location of each branch office. Monthly data on the retail price of paddy were obtained from the Rice Observatory of Madagascar (OdR) for the pe-
riod 2005-2014.3 The data collected by the Ministry of Agriculture included data from 103 dis-tricts on production (measured in tons) between 2001 and 2014 as well as on cultivated areas
(measured in hectares), with the latter ranging only from 2001 to 2011.4
Loan portfolio data. For the KPI analysis, we worked with a dataset of 11,304 agricultural
loans, disbursed by nine different branches of the MFI since 2011. In order to narrow down the analysis to farmers that use the loan to grow rice, we focused on loans with a maturity of less than twelvemonths and excluded loans that were disbursed between April and June as these were unlikely to have been used for rice cultivation due to the start of the planting season in November. This procedure reduced the total number of observed loans to 6,807. However, re-sults from the analysis presented hereafter remained largely unchanged regardless of the use of the larger or smaller dataset within this five-year period.
The average loan size was MGA 1.26 million (app. EUR 370) which implies that most farmers cultivate rather small plots. In the sample, quite a high share of clients (38%) were repeat cus-tomers which indicates a strong customer relation between farmers and the MFI. The portfolio
overdue one day5 is comparatively high but drops significantly thereafter; this is an indication that farmers have difficulties with liquidity or transport rather than a general repayment problem.
3 For the purpose of this study, w e deflated and de-seasonalised price data, concentrating on June and July data representing prices just after harvest. Prices are deflated by the national CPI and then real prices are regressed on dummy variables for all months. Thus, the regression error represents deviations from normal harvest prices.
4 As variable for the analysis, w e calculated production shocks as deviation from a linear trend. We decided against considering
cultivated hectares as our experience shows that this variable is usually highly unreliable and the data are not believed to shed further light on the issue at hand.
5 In this analysis, Portfolio at Risk (PAR) refers to a 0/1-indicator variable for all loans that w ere extended during one cropping season/year and that takes the value 1 for loans that w ere overdue at least once during the repayment period. This indicator dif-fers from the PAR ratio commonly applied at a specif ic point in time and that comprises all loans that w ere outstanding at that specif ic point in time. The Portfolio at Risk ratio used in this analysis is a better indicator to assess the portfolio quality of the short term loans used for agricultural purposes.
Death, sickness, imprisonment
37%
Robbery, fraud and non recovery
24%
Animal death or diseases
20%
Climate 7%
Mistakes on the analysis, dishonesty, unwillingness, over
indebtedness 7%
Credit diversion 5%

Feasibility Study “Insurance f or agricultural intermediaries”
14
The following table provides an overview on the main characteristics of the agricultural portfolio in recent years.
Table 6: Characteristics of agricultural loan portfolio of the MFI
Variable Unit Mean SD Min Max
Dependent variable
PAR-1 1/0 0.52
PAR-15 1/0 0.07
PAR-30 1/0 0.04
PAR-90 1/0 0.02
Loan characteristics
Disbursed amount MGA 1,269,000 1,448,000 100,000 20,000,000
Repeat loans 1/0 0.38
Socio-demographic characteristics
Age years 43.5 11 20 84
Gender (female) 1/0 28
Family members number 4.83 1.96 0 16
Source: Calculations based on MFI data
KPIs for portfolio analysis. As this analysis focuses on agricultural lending, it is important to
choose KPIs which can be disaggregated into the agricultural and non-agricultural portfolio. With the data obtained from the MFI this was possible for two KPIs, namely PAR and write-off ratio.
2.4.3 Correlation analysis between risk factors and KPI
PAR analysis at bank level. At the aggregate level, only weak correlations between the PAR
of the overall agricultural portfolio and monthly cumulative rainfall can be identified.6 Also, na-tional rice prices after harvest7 and annual production amounts do not show any correlations with the agricultural PAR of the bank as a whole. The following table provides an overview of the results:
6 The follow ing table show s correlations betw een all individual agricultural loans of the MFI w ith the national w eather average. But
as w eather patterns can differ significantly even within a few kilometers, using the national average limits the signif icance of the results.
7 Prices are deflated and de-seasonalised. June and July paddy prices represent prices just after harvest. Prices are deflated by the national CPI and then real prices are regressed on dummy variables for all months. The f ixed dummy approach w as applied due to the short time series available. Thus, the regression errors represent deviations from normal harvest prices. The variable therefore show s w hether prices in June or July of a particular year w ere high or low compared to average prices for those months during all observed years.
Feasibility Study “Insurance f or agricultural intermediaries”
15
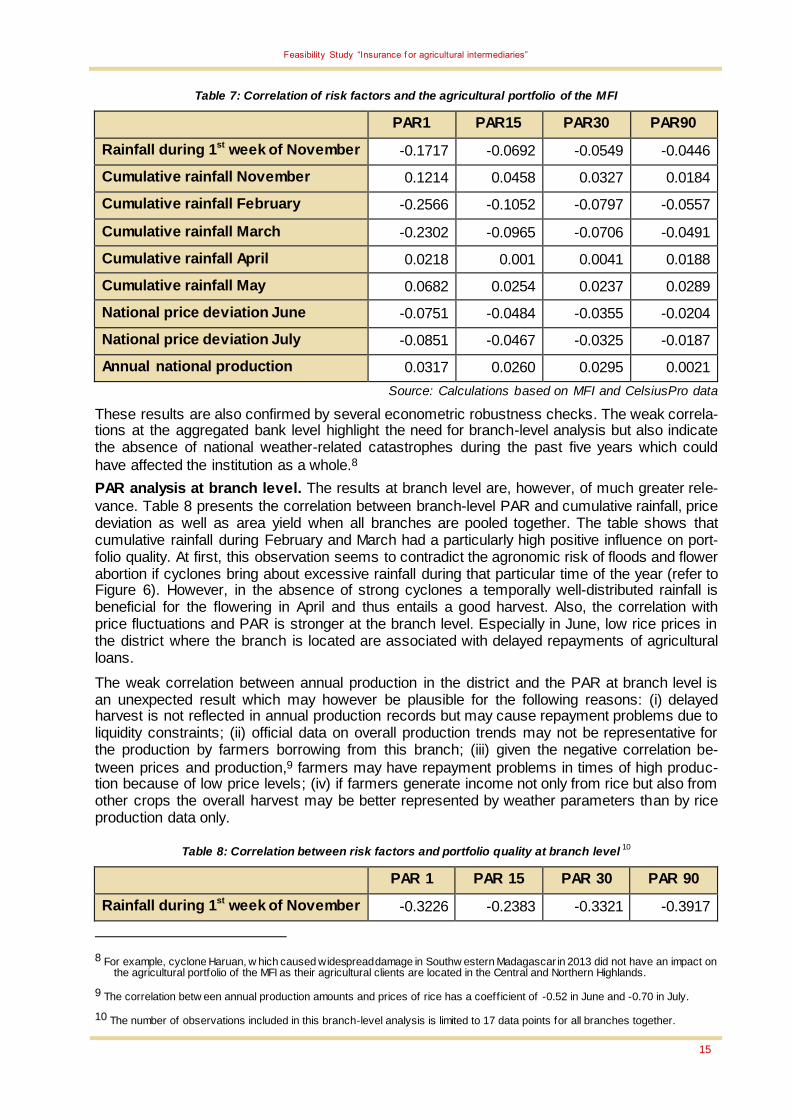
Table 7: Correlation of risk factors and the agricultural portfolio of the MFI
PAR1 PAR15 PAR30 PAR90
Rainfall during 1st week of November -0.1717 -0.0692 -0.0549 -0.0446
Cumulative rainfall November 0.1214 0.0458 0.0327 0.0184
Cumulative rainfall February -0.2566 -0.1052 -0.0797 -0.0557
Cumulative rainfall March -0.2302 -0.0965 -0.0706 -0.0491
Cumulative rainfall April 0.0218 0.001 0.0041 0.0188
Cumulative rainfall May 0.0682 0.0254 0.0237 0.0289
National price deviation June -0.0751 -0.0484 -0.0355 -0.0204
National price deviation July -0.0851 -0.0467 -0.0325 -0.0187
Annual national production 0.0317 0.0260 0.0295 0.0021
Source: Calculations based on MFI and CelsiusPro data
These results are also confirmed by several econometric robustness checks. The weak correla-tions at the aggregated bank level highlight the need for branch-level analysis but also indicate the absence of national weather-related catastrophes during the past five years which could
have affected the institution as a whole.8
PAR analysis at branch level. The results at branch level are, however, of much greater rele-
vance. Table 8 presents the correlation between branch-level PAR and cumulative rainfall, price deviation as well as area yield when all branches are pooled together. The table shows that cumulative rainfall during February and March had a particularly high positive influence on port-folio quality. At first, this observation seems to contradict the agronomic risk of floods and flower abortion if cyclones bring about excessive rainfall during that particular time of the year (refer to Figure 6). However, in the absence of strong cyclones a temporally well-distributed rainfall is beneficial for the flowering in April and thus entails a good harvest. Also, the correlation with price fluctuations and PAR is stronger at the branch level. Especially in June, low rice prices in the district where the branch is located are associated with delayed repayments of agricultural loans.
The weak correlation between annual production in the district and the PAR at branch level is an unexpected result which may however be plausible for the following reasons: (i) delayed harvest is not reflected in annual production records but may cause repayment problems due to liquidity constraints; (ii) official data on overall production trends may not be representative for the production by farmers borrowing from this branch; (iii) given the negative correlation be-
tween prices and production,9 farmers may have repayment problems in times of high produc-tion because of low price levels; (iv) if farmers generate income not only from rice but also from other crops the overall harvest may be better represented by weather parameters than by rice production data only.
Table 8: Correlation between risk factors and portfolio quality at branch level 10
PAR 1 PAR 15 PAR 30 PAR 90
Rainfall during 1st week of November -0.3226 -0.2383 -0.3321 -0.3917
8 For example, cyclone Haruan, w hich caused widespread damage in Southw estern Madagascar in 2013 did not have an impact on the agricultural portfolio of the MFI as their agricultural clients are located in the Central and Northern Highlands.
9 The correlation betw een annual production amounts and prices of rice has a coeff icient of -0.52 in June and -0.70 in July.
10 The number of observations included in this branch-level analysis is limited to 17 data points for all branches together.
Feasibility Study “Insurance f or agricultural intermediaries”
16
Cumulative rainfall February -0.6860* -0.5874* -0.6502* -0.7033*
Cumulative rainfall March -0.4287* -0.4753* -0.4664* -0.4480*
Cumulative rainfall April 0.2337 0.0242 -0.0668 0.0682
District price deviation June -0.3079 -0.5850* -0.4705 -0.4461
District price deviation July -0.1890 -0.4203 -0.3386 -0.2440
Annual area production -0.3898 -0.0685 -0.0897 0.1389
* Significant at 90%-level
Source: Calculations based on MFI and CelsiusPro data
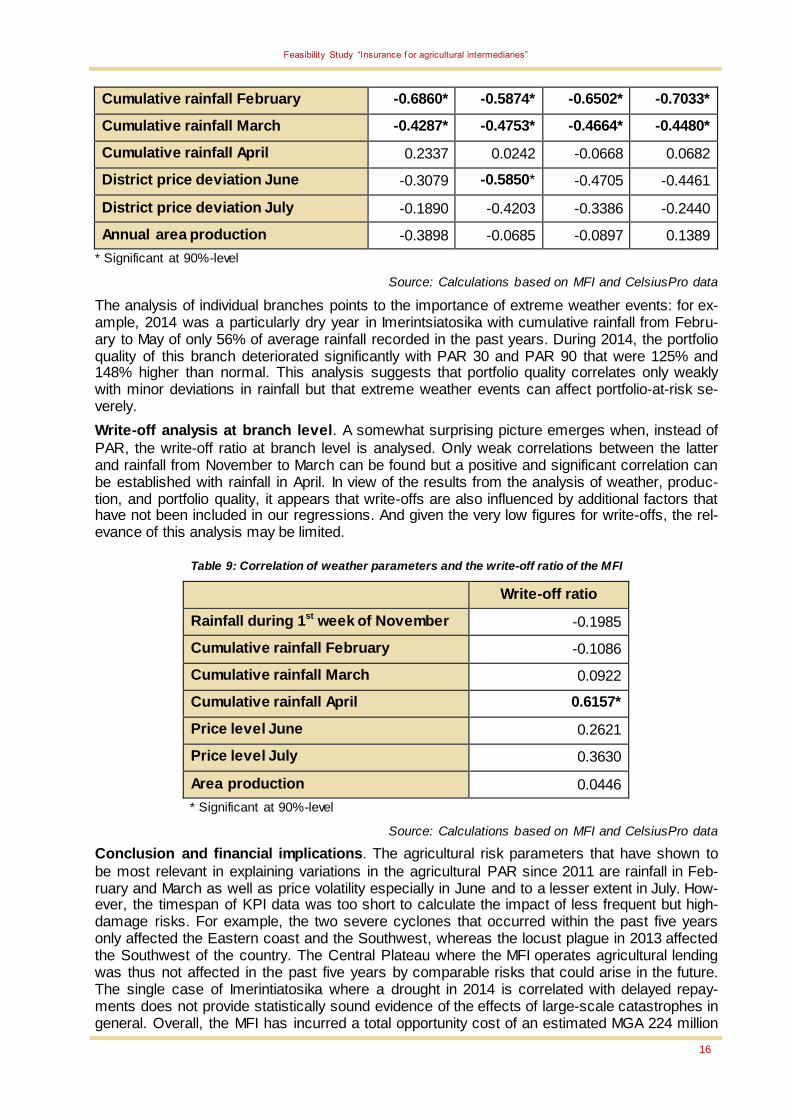
The analysis of individual branches points to the importance of extreme weather events: for ex-ample, 2014 was a particularly dry year in Imerintsiatosika with cumulative rainfall from Febru-ary to May of only 56% of average rainfall recorded in the past years. During 2014, the portfolio quality of this branch deteriorated significantly with PAR 30 and PAR 90 that were 125% and 148% higher than normal. This analysis suggests that portfolio quality correlates only weakly with minor deviations in rainfall but that extreme weather events can affect portfolio-at-risk se-verely.
Write-off analysis at branch level. A somewhat surprising picture emerges when, instead of
PAR, the write-off ratio at branch level is analysed. Only weak correlations between the latter and rainfall from November to March can be found but a positive and significant correlation can be established with rainfall in April. In view of the results from the analysis of weather, produc-tion, and portfolio quality, it appears that write-offs are also influenced by additional factors that have not been included in our regressions. And given the very low figures for write-offs, the rel-evance of this analysis may be limited.
Table 9: Correlation of weather parameters and the write-off ratio of the MFI
Write-off ratio
Rainfall during 1st week of November -0.1985
Cumulative rainfall February -0.1086
Cumulative rainfall March 0.0922
Cumulative rainfall April 0.6157*
Price level June 0.2621
Price level July 0.3630
Area production 0.0446
* Significant at 90%-level
Source: Calculations based on MFI and CelsiusPro data
Conclusion and financial implications. The agricultural risk parameters that have shown to
be most relevant in explaining variations in the agricultural PAR since 2011 are rainfall in Feb-ruary and March as well as price volatility especially in June and to a lesser extent in July. How-ever, the timespan of KPI data was too short to calculate the impact of less frequent but high-damage risks. For example, the two severe cyclones that occurred within the past five years only affected the Eastern coast and the Southwest, whereas the locust plague in 2013 affected the Southwest of the country. The Central Plateau where the MFI operates agricultural lending was thus not affected in the past five years by comparable risks that could arise in the future. The single case of Imerintiatosika where a drought in 2014 is correlated with delayed repay-ments does not provide statistically sound evidence of the effects of large-scale catastrophes in general. Overall, the MFI has incurred a total opportunity cost of an estimated MGA 224 million
Feasibility Study “Insurance f or agricultural intermediaries”
17
(app. EUR 67,200) per year for provisioning doubtful loans.11 This represents 2.26% of the total agricultural portfolio.12
2.5 Risk management of the MFI
2.5.1 Description of applied risk management strategy
Loan appraisal procedure. Risk assessment is an integral element of loan application and
monitoring. The loan officers use standardised tools to assess clients' cash flows and their risk exposure. The main tools are (i) the crop calendar and (ii) the cash flow analysis spreadsheet.
The crop calendar helps to analyse the production characteristics of farmers. It is a plan that is drawn up jointly between an agricultural loan officer and the client, representing a projection of the timing, investment cost and potential revenue of the client’s household and farm activities.
The crop calendar helps the loan officer to understand whether the farmer is aware of the main risk factors in agriculture, for example, if he/she has an understanding of how price volatility affects cash flows. Furthermore, the loan officer can identify whether the farmer can achieve risk diversification through its planned activities (e.g. by planting more than one crop).
The data established in the crop calendar are transferred to a customized spreadsheet that was developed by the MFI. The client’s repayment capacity is calculated based on projections of future crop yields and additional income from other activities, e.g., dairy cows, chicken breeding, or a small food store. These revenues are compared to projected household expenses and po-tential repayment of other loans. The repayment capacity is determined by netting all revenues and expenses.
In addition to this, the loan officer also uses external information to assess whether expectations and projections are realistic: regional farm price information is available through NGOs and farmer associations. Another important cross-check is the evaluation of rice stocks available at the time of the loan officer’s first visit to the client’s home. In order to estimate the harvest ca-pacity of the farmer’s fields, the stock available at the household is compared to daily consump-tion, taking into account the time passed since the latest harvest.
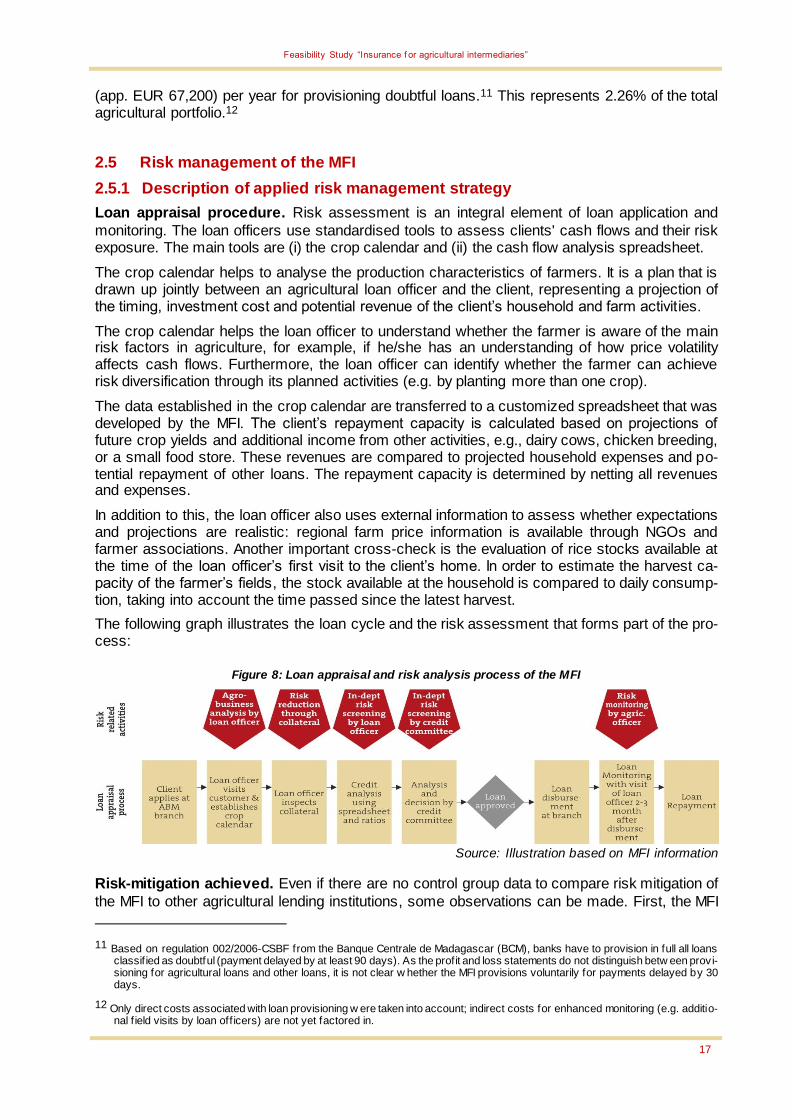
The following graph illustrates the loan cycle and the risk assessment that forms part of the pro-cess:
Figure 8: Loan appraisal and risk analysis process of the MFI
Source: Illustration based on MFI information
Risk-mitigation achieved. Even if there are no control group data to compare risk mitigation of
the MFI to other agricultural lending institutions, some observations can be made. First, the MFI
11 Based on regulation 002/2006-CSBF from the Banque Centrale de Madagascar (BCM), banks have to provision in full all loans classif ied as doubtful (payment delayed by at least 90 days). As the profit and loss statements do not distinguish betw een provi-sioning for agricultural loans and other loans, it is not clear w hether the MFI provisions voluntarily for payments delayed by 30 days.
12 Only direct costs associated with loan provisioning w ere taken into account; indirect costs for enhanced monitoring (e.g. additio-nal f ield visits by loan off icers) are not yet factored in.

Feasibility Study “Insurance f or agricultural intermediaries”
18
collects the relevant data on price volatility from clients and reference institutions. Nevertheless portfolio quality is still affected by price shocks as shown by our correlation analysis. Second, the description of the loan appraisal process conducted by the MFI does not indicate whether the lender also takes into account clients’ vulnerability to adverse rainfall patterns , resulting from lack of irrigation and drainage. As droughts currently have an impact on the portfolio quality, this risk has not yet been mitigated.
2.5.2 SWOT Analysis of Agricultural Risk Management
Strengths
Loan appraisal process that factors in vulnerability to some agricultural risks, such as price volatility
Loan officers visit farmers in their fields to assess production and risk exposure
Systematic analysis of risk factors in agri-culture has been carried out
Weaknesses
Portfolio quality is affected by droughts and price declines
Some branches, in particular micro branches, have a very high exposure to agriculture without significant diversifica-tion opportunities
Difficulty to place highly-skilled, well-paid agricultural loan officers in small branch-es/outlets
Opportunities
Defining an eligibility threshold for price volatility for larger loans
Development of branch level portfolio insurance
Risk diversification through rural expan-sion strategy and larger agricultural port-folio
Threats
Other types of catastrophes such as cy-clones and locusts may affect overall portfolio performance and threaten the portfolio of rural branches
2.6 Recommendations for improved risk management and potential of meso-
level insurance
Need for improved risk management. Based on our analysis we conclude that the MFI’s port-
folio quality is vulnerable to adverse rainfall patterns and price volatility, thus requiring improved risk management strategies with respect to these challenges. Preliminary recommendations for improvement strategies are listed below but are of an indicative nature only, as further analysis of their suitability would be necessary:
The risk of price shocks could be mitigated by an internal lending policy for larger agricultur-al loans that defines, as an eligibility criterion for larger loans, a minimum price threshold (x) needed for profitability. For example, clients would need to prove that they could still gener-ate income to cover their costs even if the market price of their agricultural product de-creased to x. In line with the MFI’s strategy to promote financial inclusion, this criterion should not apply to smaller loans. The MFI could also take into account farmers’ access to storage facilities which would reduce their vulnerability to short-term seasonal price varia-tions but not to longer-term inter-annual variations.
By contrast, conservative risk appraisal policies are less advisable for precipitation risks since only a few farmers would benefit from an irrigation and drainage system and thus be eligible for credit. Especially in view of the institution’s current lack of geographic diversifica-tion of the agricultural portfolio, risk transfer could be an option reflected in more detail be-low.
The option of area yield index-insurance would likely be less useful for the MFI as annual production at district levels did not indicate any correlation with the portfolio quality of the MFI.
Unfortunately, we cannot assess the usefulness of catastrophe insurance, e.g. for cyclones or pests, in quantitative terms because of the short time line of data series and the geo-graphic concentration of agri-lending operations in the Central Highlands.

Feasibility Study “Insurance f or agricultural intermediaries”
19
Crop-specific hazard insurance. Given the overwhelming importance of rice in the Malagasy culture, the most promising option for the MFI is a crop-specific hazard cover for rice farmers tailored to the weather parameters of each branch. Based on the weather correlations revealed in our analysis there is potential to develop portfolio insurance against droughts and excessive rainfall for all rice farmers borrowing from the MFI. In such a model, the MFI would buy blanket insurance for all rice farmers before the planting season in November/December; each new loan customer stating rice cultivation as his/her main source of income would be added auto-matically to the insurance cover during the subscription period, i.e. before planting. The general insurance policy would only specify the main features of the product; the details on (i) the plant-ing and growing periods, (ii) water requirements of the plants, and (iii) trigger points would be tailored to each branch. Our branch-level analysis examined only monthly water requirements; however, for the final product water/rainfall requirements for shorter timeframes would need to be considered (i.e. 10-day intervals).
Since data points remain insufficient (45 data points for portfolio quality only), it is not yet feasi-ble to develop a product along the proposed lines. For each branch, a maximum of five data points exists. In order to design an insurance cover tailored to each branch, further agronomic analysis would be required.
Feasibility Study “Insurance f or agricultural intermediaries”
20
3 CASE STUDY OF THE MICROFINANCE BANK IN UGANDA
3.1 Country background
3.1.1 Agricultural sector
Importance, structure and products. While the importance of agriculture in terms of its share
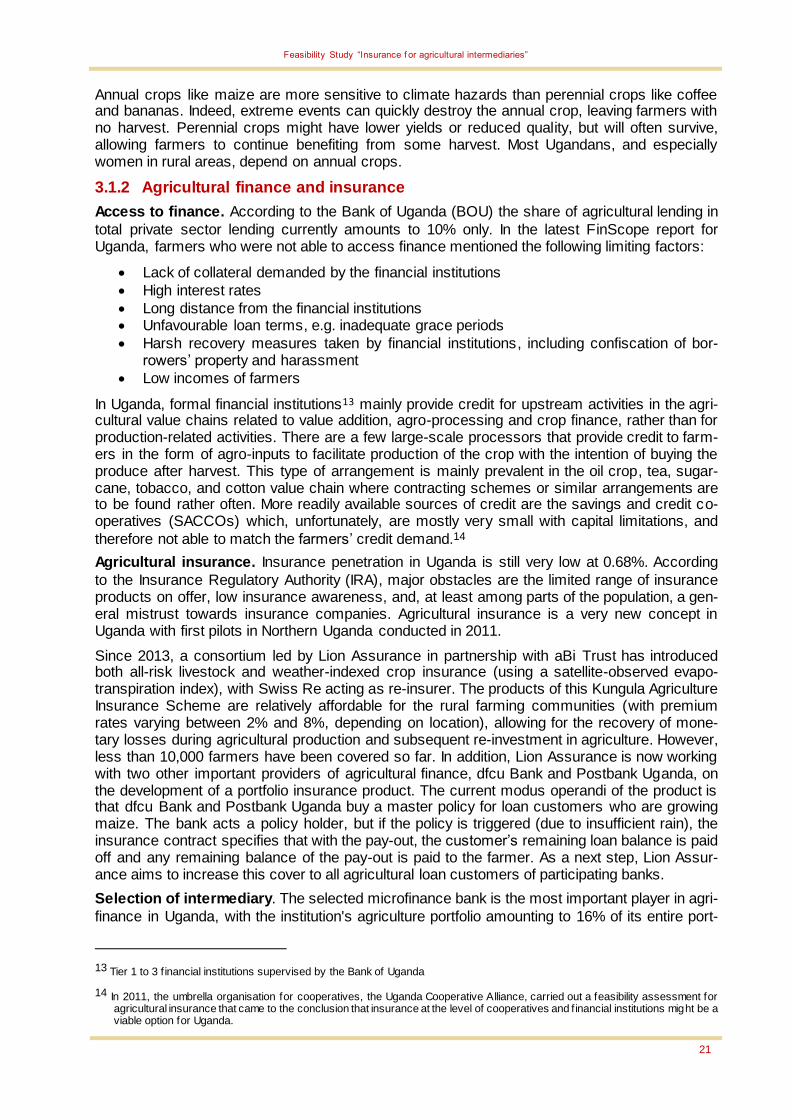
of GDP has been declining in Uganda for several years, giving way to industry and services, the agricultural sector still employs 72% of the country’s labour force. Even though large scale pro-ducers are gradually emerging, agriculture in Uganda is dominated by smallholder farmers who constitute 96% of the farmers who produce both cash and food crops on less than 2.5 acres of land. The most important commodity is coffee, followed by tea, tobacco, and cotton. The major crop groups and crops are the following:
Table 10: Major crop groups produced in Uganda
Category Crops Share of area planted
Cereals Maize, millet, sorghum and rice 30.6%
Root crops Cassava, sweet potatoes and Irish potatoes 23.4%
Plantains Matoke 16.9%
Oil crops Groundnuts, soybeans and sim sim 15.9%
Pulses Beans, cow peas, field peas and pigeon peas 13.2%
Source: Uganda Bureau of Statistics
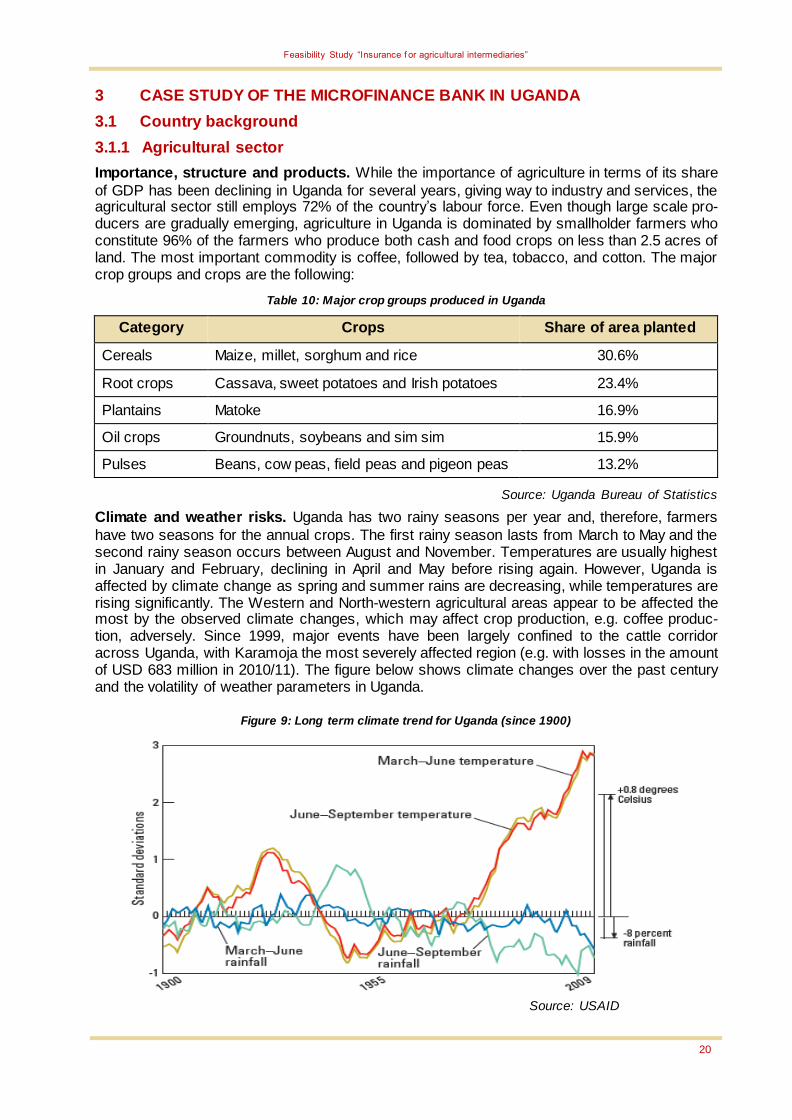
Climate and weather risks. Uganda has two rainy seasons per year and, therefore, farmers
have two seasons for the annual crops. The first rainy season lasts from March to May and the second rainy season occurs between August and November. Temperatures are usually highest in January and February, declining in April and May before rising again. However, Uganda is affected by climate change as spring and summer rains are decreasing, while temperatures are rising significantly. The Western and North-western agricultural areas appear to be affected the most by the observed climate changes, which may affect crop production, e.g. coffee produc-tion, adversely. Since 1999, major events have been largely confined to the cattle corridor across Uganda, with Karamoja the most severely affected region (e.g. with losses in the amount of USD 683 million in 2010/11). The figure below shows climate changes over the past century and the volatility of weather parameters in Uganda.
Figure 9: Long term climate trend for Uganda (since 1900)
Source: USAID
Feasibility Study “Insurance f or agricultural intermediaries”
21
Annual crops like maize are more sensitive to climate hazards than perennial crops like coffee and bananas. Indeed, extreme events can quickly destroy the annual crop, leaving farmers with no harvest. Perennial crops might have lower yields or reduced quality, but will often survive, allowing farmers to continue benefiting from some harvest. Most Ugandans, and especially women in rural areas, depend on annual crops.
3.1.2 Agricultural finance and insurance
Access to finance. According to the Bank of Uganda (BOU) the share of agricultural lending in
total private sector lending currently amounts to 10% only. In the latest FinScope report for Uganda, farmers who were not able to access finance mentioned the following limiting factors:
Lack of collateral demanded by the financial institutions
High interest rates
Long distance from the financial institutions Unfavourable loan terms, e.g. inadequate grace periods
Harsh recovery measures taken by financial institutions, including confiscation of bor-rowers’ property and harassment
Low incomes of farmers
In Uganda, formal financial institutions13 mainly provide credit for upstream activities in the agri-cultural value chains related to value addition, agro-processing and crop finance, rather than for production-related activities. There are a few large-scale processors that provide credit to farm-ers in the form of agro-inputs to facilitate production of the crop with the intention of buying the produce after harvest. This type of arrangement is mainly prevalent in the oil crop, tea, sugar-cane, tobacco, and cotton value chain where contracting schemes or similar arrangements are to be found rather often. More readily available sources of credit are the savings and credit co-operatives (SACCOs) which, unfortunately, are mostly very small with capital limitations, and
therefore not able to match the farmers’ credit demand.14
Agricultural insurance. Insurance penetration in Uganda is still very low at 0.68%. According
to the Insurance Regulatory Authority (IRA), major obstacles are the limited range of insurance products on offer, low insurance awareness, and, at least among parts of the population, a gen-eral mistrust towards insurance companies. Agricultural insurance is a very new concept in Uganda with first pilots in Northern Uganda conducted in 2011.
Since 2013, a consortium led by Lion Assurance in partnership with aBi Trust has introduced both all-risk livestock and weather-indexed crop insurance (using a satellite-observed evapo-transpiration index), with Swiss Re acting as re-insurer. The products of this Kungula Agriculture Insurance Scheme are relatively affordable for the rural farming communities (with premium rates varying between 2% and 8%, depending on location), allowing for the recovery of mone-tary losses during agricultural production and subsequent re-investment in agriculture. However, less than 10,000 farmers have been covered so far. In addition, Lion Assurance is now working with two other important providers of agricultural finance, dfcu Bank and Postbank Uganda, on the development of a portfolio insurance product. The current modus operandi of the product is that dfcu Bank and Postbank Uganda buy a master policy for loan customers who are growing maize. The bank acts a policy holder, but if the policy is triggered (due to insufficient rain), the insurance contract specifies that with the pay-out, the customer’s remaining loan balance is paid off and any remaining balance of the pay-out is paid to the farmer. As a next step, Lion Assur-ance aims to increase this cover to all agricultural loan customers of participating banks.
Selection of intermediary. The selected microfinance bank is the most important player in agri-
finance in Uganda, with the institution's agriculture portfolio amounting to 16% of its entire port-
13 Tier 1 to 3 f inancial institutions supervised by the Bank of Uganda
14 In 2011, the umbrella organisation for cooperatives, the Uganda Cooperative Alliance, carried out a feasibility assessment for agricultural insurance that came to the conclusion that insurance at the level of cooperatives and f inancial institutions might be a viable option for Uganda.

Feasibility Study “Insurance f or agricultural intermediaries”
22
folio. While the bank is the second largest in terms of branch network in Uganda as well as in terms of customer base, it currently holds approximately 40% of bank accounts in Uganda. Lion Assurance is also interested in providing cover for the BANK in the future and first discussions have taken place. The following chapters will provide an in-depth analysis for this institution.
3.2 Institutional profile of the microfinance bank
3.2.1 Brief description
Organisational structure. Founded and majority-owned by Christian faith-based organisations,
the BANK started its operations in 1985. Nowadays, the bank has over 1,900 staff, of whom 130 work in agricultural lending. The bank has a large branch network of 62 branches and 154 ATM outlets, giving the institution a distinct competitive edge over other financial institutions in the country.
Core business. Since incorporation, the bank has remained focused on serving economically
disadvantaged people, especially in rural areas, and on contributing to economic development in Uganda. Though licensed as a fully-fledged commercial bank, the institution has remained the dominant provider of microfinance services in Uganda. Nevertheless, the bank has a well-diversified business strategy, covering small and medium enterprises (SME) and large corpora-tions to complement its microfinance and agricultural lending portfolio. As a commercial bank, it provides most banking services available at any other bank in Uganda, such as: deposit ac-counts, money transfer services (local and international), e-banking (mobile banking, ATMs, POS), collection of cheques, international business, and credit and bank guarantees. The bank’s loan products comprise agricultural loans, home improvement, micro-business, commer-cial and corporate loans, salary loans, mortgages, leases, overdrafts, trade finance and special loan schemes. The following table shows the portfolio distribution for major sectors.
Figure 10: Distribution of sectors in the bank’s loan portfolio
Source: Annual Reports of the bank
Financial performance. The bank has performed well in recent years. Since 2010, the institu-
tion has managed to increase its portfolio by more than 20% p.a. on average, in line with its current growth strategy of 18% in credit operations and 22% in savings. During the same period of time, the number of borrowers has increased only by around 10% p.a. on average, indicating that the average loan size has increased.
The bank has posted positive financial results in recent years, even during 2013 when many other financial institutions in Uganda struggled. The average ROE and ROA are above average for the financial sector in Uganda, particularly for financial institutions dealing with small loans.
The bank is well-protected against future losses that may accrue from loans. Given the fairly constant PAR-ratio and the write-off ratio, the risk cover of 86% in 2014 is justified. The average
0%
20%
40%
60%
80%
100%
2012 2013
Other services
Building and construction
Transport and utilities
Trade and commerce
Manufacturing
Agriculture
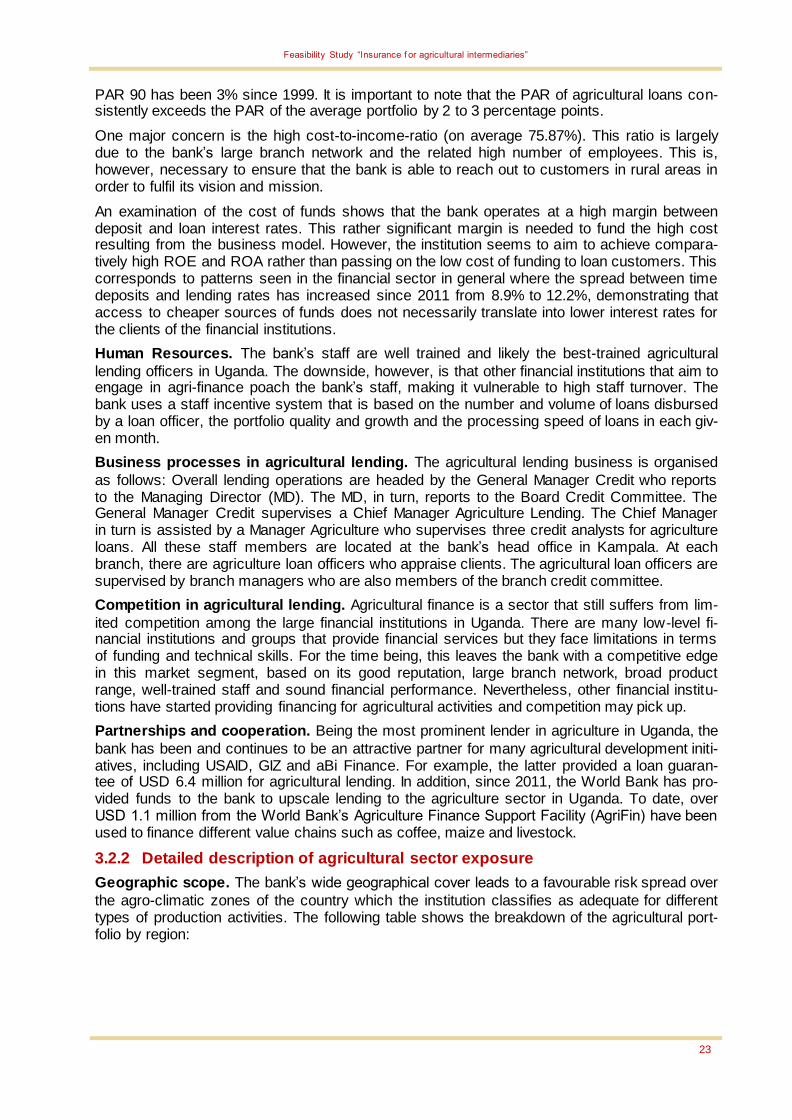
Feasibility Study “Insurance f or agricultural intermediaries”
23
PAR 90 has been 3% since 1999. It is important to note that the PAR of agricultural loans con-sistently exceeds the PAR of the average portfolio by 2 to 3 percentage points.
One major concern is the high cost-to-income-ratio (on average 75.87%). This ratio is largely due to the bank’s large branch network and the related high number of employees. This is, however, necessary to ensure that the bank is able to reach out to customers in rural areas in order to fulfil its vision and mission.
An examination of the cost of funds shows that the bank operates at a high margin between deposit and loan interest rates. This rather significant margin is needed to fund the high cost resulting from the business model. However, the institution seems to aim to achieve compara-tively high ROE and ROA rather than passing on the low cost of funding to loan customers. This corresponds to patterns seen in the financial sector in general where the spread between time deposits and lending rates has increased since 2011 from 8.9% to 12.2%, demonstrating that access to cheaper sources of funds does not necessarily translate into lower interest rates for the clients of the financial institutions.
Human Resources. The bank’s staff are well trained and likely the best-trained agricultural
lending officers in Uganda. The downside, however, is that other financial institutions that aim to engage in agri-finance poach the bank’s staff, making it vulnerable to high staff turnover. The bank uses a staff incentive system that is based on the number and volume of loans disbursed by a loan officer, the portfolio quality and growth and the processing speed of loans in each giv-en month.
Business processes in agricultural lending. The agricultural lending business is organised
as follows: Overall lending operations are headed by the General Manager Credit who reports to the Managing Director (MD). The MD, in turn, reports to the Board Credit Committee. The General Manager Credit supervises a Chief Manager Agriculture Lending. The Chief Manager in turn is assisted by a Manager Agriculture who supervises three credit analysts for agriculture loans. All these staff members are located at the bank’s head office in Kampala. At each branch, there are agriculture loan officers who appraise clients. The agricultural loan officers are supervised by branch managers who are also members of the branch credit committee.
Competition in agricultural lending. Agricultural finance is a sector that still suffers from lim-
ited competition among the large financial institutions in Uganda. There are many low-level fi-nancial institutions and groups that provide financial services but they face limitations in terms of funding and technical skills. For the time being, this leaves the bank with a competitive edge in this market segment, based on its good reputation, large branch network, broad product range, well-trained staff and sound financial performance. Nevertheless, other financial institu-tions have started providing financing for agricultural activities and competition may pick up.
Partnerships and cooperation. Being the most prominent lender in agriculture in Uganda, the
bank has been and continues to be an attractive partner for many agricultural development initi-atives, including USAID, GIZ and aBi Finance. For example, the latter provided a loan guaran-tee of USD 6.4 million for agricultural lending. In addition, since 2011, the World Bank has pro-vided funds to the bank to upscale lending to the agriculture sector in Uganda. To date, over USD 1.1 million from the World Bank’s Agriculture Finance Support Facility (AgriFin) have been used to finance different value chains such as coffee, maize and livestock.
3.2.2 Detailed description of agricultural sector exposure
Geographic scope. The bank’s wide geographical cover leads to a favourable risk spread over
the agro-climatic zones of the country which the institution classifies as adequate for different types of production activities. The following table shows the breakdown of the agricultural port-folio by region:
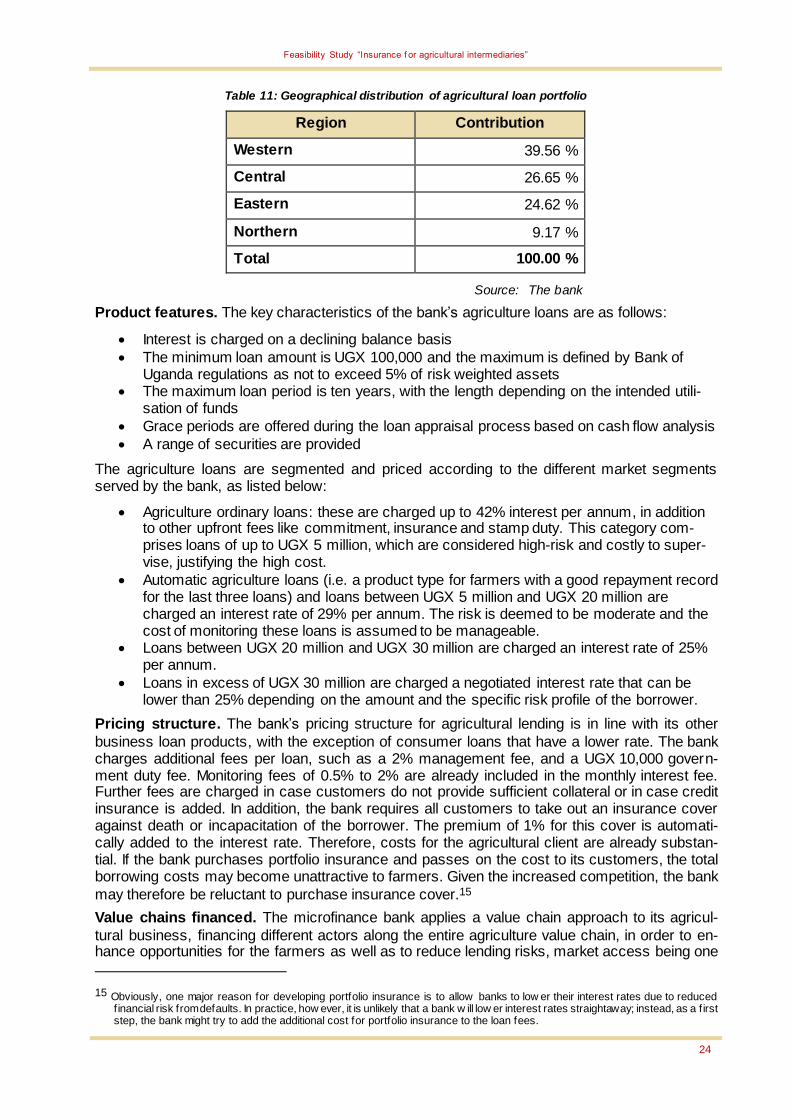
Feasibility Study “Insurance f or agricultural intermediaries”
24
Table 11: Geographical distribution of agricultural loan portfolio
Region Contribution
Western 39.56 %
Central 26.65 %
Eastern 24.62 %
Northern 9.17 %
Total 100.00 %
Source: The bank
Product features. The key characteristics of the bank’s agriculture loans are as follows:
Interest is charged on a declining balance basis
The minimum loan amount is UGX 100,000 and the maximum is defined by Bank of Uganda regulations as not to exceed 5% of risk weighted assets
The maximum loan period is ten years, with the length depending on the intended utili-sation of funds
Grace periods are offered during the loan appraisal process based on cash flow analysis
A range of securities are provided
The agriculture loans are segmented and priced according to the different market segments served by the bank, as listed below:
Agriculture ordinary loans: these are charged up to 42% interest per annum, in addition to other upfront fees like commitment, insurance and stamp duty. This category com-prises loans of up to UGX 5 million, which are considered high-risk and costly to super-vise, justifying the high cost.
Automatic agriculture loans (i.e. a product type for farmers with a good repayment record for the last three loans) and loans between UGX 5 million and UGX 20 million are charged an interest rate of 29% per annum. The risk is deemed to be moderate and the cost of monitoring these loans is assumed to be manageable.
Loans between UGX 20 million and UGX 30 million are charged an interest rate of 25% per annum.
Loans in excess of UGX 30 million are charged a negotiated interest rate that can be lower than 25% depending on the amount and the specific risk profile of the borrower.
Pricing structure. The bank’s pricing structure for agricultural lending is in line with its other
business loan products, with the exception of consumer loans that have a lower rate. The bank charges additional fees per loan, such as a 2% management fee, and a UGX 10,000 govern-ment duty fee. Monitoring fees of 0.5% to 2% are already included in the monthly interest fee. Further fees are charged in case customers do not provide sufficient collateral or in case credit insurance is added. In addition, the bank requires all customers to take out an insurance cover against death or incapacitation of the borrower. The premium of 1% for this cover is automati-cally added to the interest rate. Therefore, costs for the agricultural client are already substan-tial. If the bank purchases portfolio insurance and passes on the cost to its customers, the total borrowing costs may become unattractive to farmers. Given the increased competition, the bank
may therefore be reluctant to purchase insurance cover.15
Value chains financed. The microfinance bank applies a value chain approach to its agricul-
tural business, financing different actors along the entire agriculture value chain, in order to en-hance opportunities for the farmers as well as to reduce lending risks, market access being one
15 Obviously, one major reason for developing portfolio insurance is to allow banks to low er their interest rates due to reduced financial risk from defaults. In practice, how ever, it is unlikely that a bank w ill low er interest rates straightaway; instead, as a f irst step, the bank might try to add the additional cost for portfolio insurance to the loan fees.

Feasibility Study “Insurance f or agricultural intermediaries”
25
of the main challenges for Ugandan farmers. The bank has performed well because it does not restrict itself to specific value chains. Financing almost the entire value chain of the major crops in Uganda, the bank manages to spread agricultural risk throughout its portfolio. About 10-15% of clients benefit from a tri-partite agreement in a value chain, improving the sales potential for farmers and lowering the associated lending risk.
With the support of GIZ, the bank has conducted a value chain analysis of oil crops, especially in Northern Uganda, tea in Western Uganda, and barley, maize and wheat in Eastern Uganda. In the context of this analysis, the bank identified different potential partners in order to spread and mitigate risks. In the case of tea, for example, the bank provides credit for inputs to tea farmers who have contracts with specific tea processing companies. Partnering with the bank, the tea processors pay the farmers through the bank which facilitates loan repayments. In oil crops, an arrangement has been made with one of the largest oil mills in Uganda, linking over 60,000 smallholder farmers to the bank to access credit, while payment for their produce is also channelled through the bank for convenient loan repayment. In both tea and oil crops, the bank, the farmers, and the processors operate on the basis of a promising mutually beneficial rela-tionship: farmers receive cash to buy inputs, the bank is able to promote its financial products, and processors are assured of quality produce without bothering to advance funds to small-scale farmers.
Identification of key value chains. In order to better understand the effects of weather param-
eters on the bank’s portfolio, two branches in different agro-climatic zones were selected: one in Mbale in the coffee-growing Eastern Region and one in Hoima in the cereal-growing Western Region. As the following graphs illustrate, approximately 60% of the agricultural loan portfolio of these two branches finance the value chains of coffee and maize respectively.
Figure 11: Composition of agricultural loans in Mbale and Hoima branch
Source: Branch Managers Mbale and Hoima
The following analysis therefore focuses on the effect of risks on the coffee sector in Mbale branch and on the maize sector in Hoima branch.
3.3 Agricultural risk analysis
3.3.1 Major risks for the value chains of maize and coffee
The eco-physiological requirements of maize and coffee make these crops sensitive to climate variability (i.e. changes in factors such as temperature, moisture, carbon dioxide concentrations, pH and salinity). Different varieties of maize and coffee are cultivated in Uganda, and each may respond differently to the impacts of climate variability. Excessive or insufficient water at a cer-tain time in crop development may affect crop yield and quality negatively, and may further in-crease susceptibility to pests and diseases, especially when combined with other stresses such as poor soil fertility.
The following analysis illustrates the main risk variables which likely have affected the business performance of the two focus branches. This qualitative information is based on the opinion and experience of the bank’s staff and our local agronomic expert.
Composition of agricultural loans in Mbale branch
Coffee
Rice
Maize
others
Composition of agricultural loans in Hoima branch
Maize
Beans
Rice
others
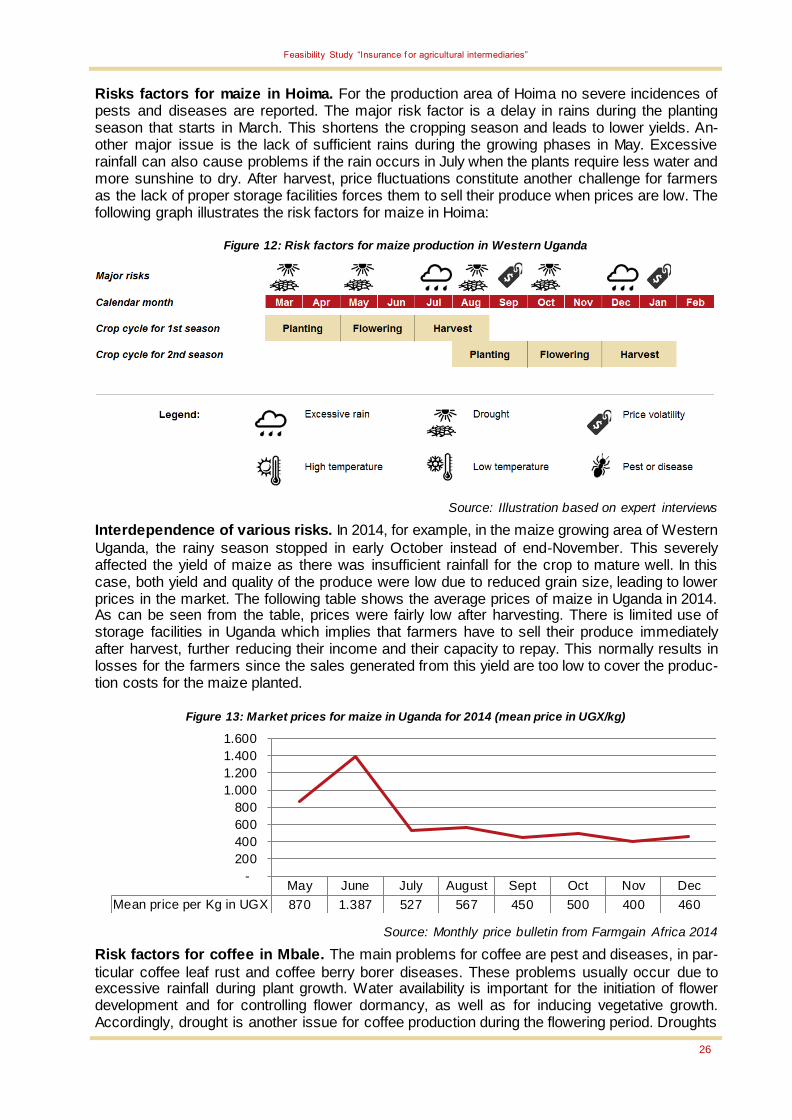
Feasibility Study “Insurance f or agricultural intermediaries”
26
Risks factors for maize in Hoima. For the production area of Hoima no severe incidences of pests and diseases are reported. The major risk factor is a delay in rains during the planting season that starts in March. This shortens the cropping season and leads to lower yields. An-other major issue is the lack of sufficient rains during the growing phases in May. Excessive rainfall can also cause problems if the rain occurs in July when the plants require less water and more sunshine to dry. After harvest, price fluctuations constitute another challenge for farmers as the lack of proper storage facilities forces them to sell their produce when prices are low. The following graph illustrates the risk factors for maize in Hoima:
Figure 12: Risk factors for maize production in Western Uganda
Source: Illustration based on expert interviews
Interdependence of various risks. In 2014, for example, in the maize growing area of Western
Uganda, the rainy season stopped in early October instead of end-November. This severely affected the yield of maize as there was insufficient rainfall for the crop to mature well. In this case, both yield and quality of the produce were low due to reduced grain size, leading to lower prices in the market. The following table shows the average prices of maize in Uganda in 2014. As can be seen from the table, prices were fairly low after harvesting. There is limited use of storage facilities in Uganda which implies that farmers have to sell their produce immediately after harvest, further reducing their income and their capacity to repay. This normally results in losses for the farmers since the sales generated from this yield are too low to cover the produc-tion costs for the maize planted.
Figure 13: Market prices for maize in Uganda for 2014 (mean price in UGX/kg)
Source: Monthly price bulletin from Farmgain Africa 2014
Risk factors for coffee in Mbale. The main problems for coffee are pest and diseases, in par-
ticular coffee leaf rust and coffee berry borer diseases. These problems usually occur due to excessive rainfall during plant growth. Water availability is important for the initiation of flower development and for controlling flower dormancy, as well as for inducing vegetative growth. Accordingly, drought is another issue for coffee production during the flowering period. Droughts
May June July August Sept Oct Nov Dec
Mean price per Kg in UGX 870 1.387 527 567 450 500 400 460
-
200
400
600
800
1.000
1.200
1.400
1.600
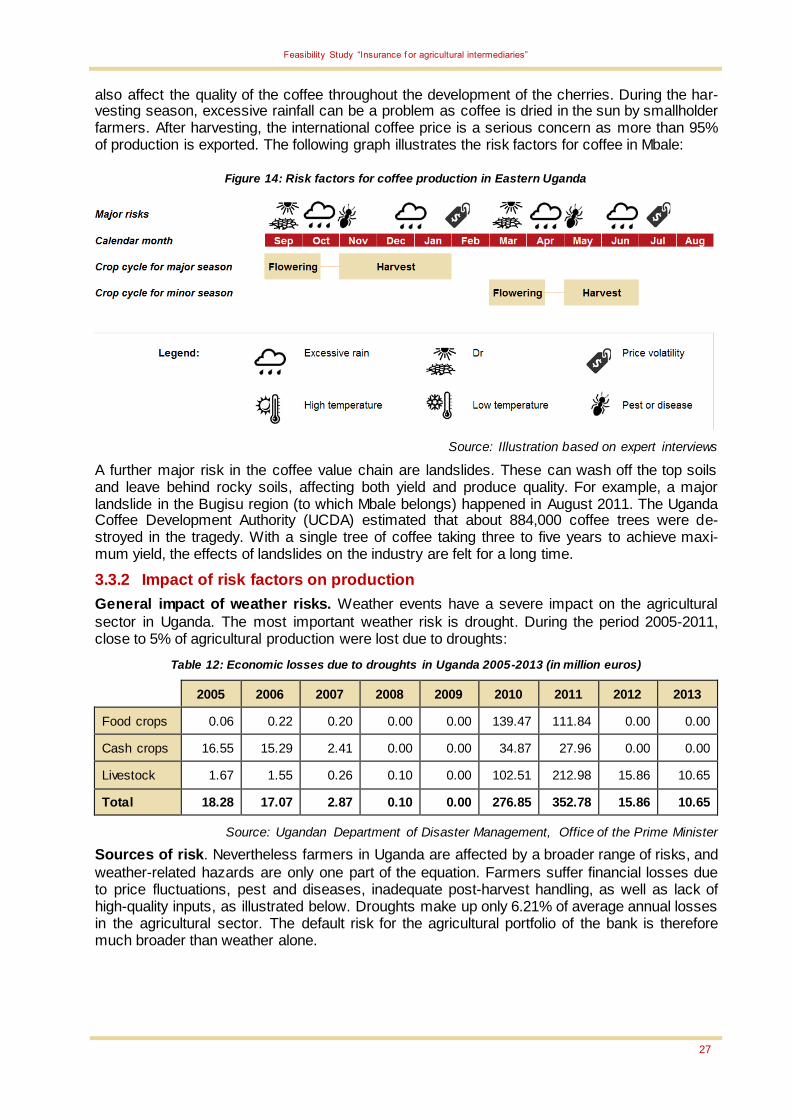
Feasibility Study “Insurance f or agricultural intermediaries”
27
also affect the quality of the coffee throughout the development of the cherries. During the har-vesting season, excessive rainfall can be a problem as coffee is dried in the sun by smallholder farmers. After harvesting, the international coffee price is a serious concern as more than 95% of production is exported. The following graph illustrates the risk factors for coffee in Mbale:
Figure 14: Risk factors for coffee production in Eastern Uganda
Source: Illustration based on expert interviews
A further major risk in the coffee value chain are landslides. These can wash off the top soils and leave behind rocky soils, affecting both yield and produce quality. For example, a major landslide in the Bugisu region (to which Mbale belongs) happened in August 2011. The Uganda Coffee Development Authority (UCDA) estimated that about 884,000 coffee trees were de-stroyed in the tragedy. With a single tree of coffee taking three to five years to achieve maxi-mum yield, the effects of landslides on the industry are felt for a long time.
3.3.2 Impact of risk factors on production
General impact of weather risks. Weather events have a severe impact on the agricultural
sector in Uganda. The most important weather risk is drought. During the period 2005-2011, close to 5% of agricultural production were lost due to droughts:
Table 12: Economic losses due to droughts in Uganda 2005-2013 (in million euros)
2005 2006 2007 2008 2009 2010 2011 2012 2013
Food crops 0.06 0.22 0.20 0.00 0.00 139.47 111.84 0.00 0.00
Cash crops 16.55 15.29 2.41 0.00 0.00 34.87 27.96 0.00 0.00
Livestock 1.67 1.55 0.26 0.10 0.00 102.51 212.98 15.86 10.65
Total 18.28 17.07 2.87 0.10 0.00 276.85 352.78 15.86 10.65
Source: Ugandan Department of Disaster Management, Office of the Prime Minister
Sources of risk. Nevertheless farmers in Uganda are affected by a broader range of risks, and
weather-related hazards are only one part of the equation. Farmers suffer financial losses due to price fluctuations, pest and diseases, inadequate post-harvest handling, as well as lack of high-quality inputs, as illustrated below. Droughts make up only 6.21% of average annual losses in the agricultural sector. The default risk for the agricultural portfolio of the bank is therefore much broader than weather alone.
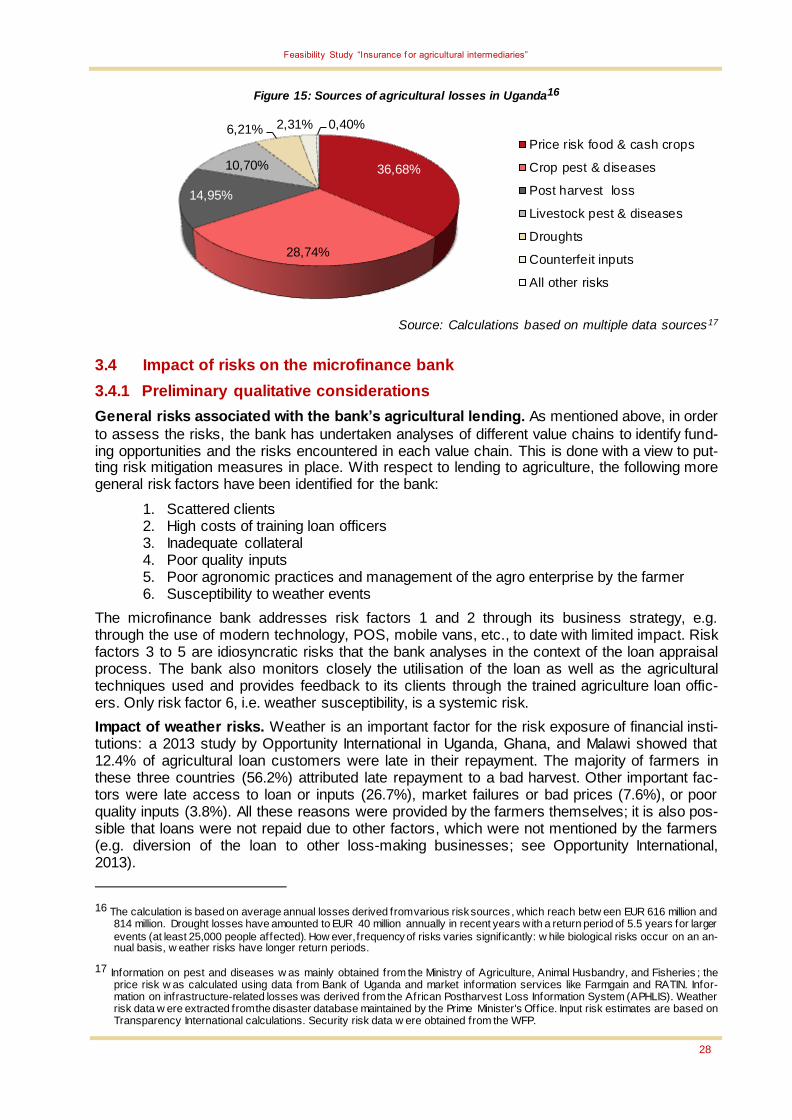
Feasibility Study “Insurance f or agricultural intermediaries”
28
Figure 15: Sources of agricultural losses in Uganda16
Source: Calculations based on multiple data sources17
3.4 Impact of risks on the microfinance bank
3.4.1 Preliminary qualitative considerations
General risks associated with the bank’s agricultural lending. As mentioned above, in order
to assess the risks, the bank has undertaken analyses of different value chains to identify fund-ing opportunities and the risks encountered in each value chain. This is done with a view to put-ting risk mitigation measures in place. With respect to lending to agriculture, the following more general risk factors have been identified for the bank:
1. Scattered clients 2. High costs of training loan officers 3. Inadequate collateral 4. Poor quality inputs 5. Poor agronomic practices and management of the agro enterprise by the farmer 6. Susceptibility to weather events
The microfinance bank addresses risk factors 1 and 2 through its business strategy, e.g. through the use of modern technology, POS, mobile vans, etc., to date with limited impact. Risk factors 3 to 5 are idiosyncratic risks that the bank analyses in the context of the loan appraisal process. The bank also monitors closely the utilisation of the loan as well as the agricultural techniques used and provides feedback to its clients through the trained agriculture loan offic-ers. Only risk factor 6, i.e. weather susceptibility, is a systemic risk.
Impact of weather risks. Weather is an important factor for the risk exposure of financial insti-tutions: a 2013 study by Opportunity International in Uganda, Ghana, and Malawi showed that 12.4% of agricultural loan customers were late in their repayment. The majority of farmers in these three countries (56.2%) attributed late repayment to a bad harvest. Other important fac-tors were late access to loan or inputs (26.7%), market failures or bad prices (7.6%), or poor quality inputs (3.8%). All these reasons were provided by the farmers themselves; it is also pos-sible that loans were not repaid due to other factors, which were not mentioned by the farmers (e.g. diversion of the loan to other loss-making businesses; see Opportunity International, 2013).
16 The calculation is based on average annual losses derived from various risk sources , which reach betw een EUR 616 million and 814 million. Drought losses have amounted to EUR 40 million annually in recent years with a return period of 5.5 years for larger
events (at least 25,000 people affected). How ever, frequency of risks varies signif icantly: w hile biological risks occur on an an-nual basis, w eather risks have longer return periods.
17 Information on pest and diseases w as mainly obtained from the Ministry of Agriculture, Animal Husbandry, and Fisheries ; the price risk w as calculated using data from Bank of Uganda and market information services like Farmgain and RATIN. Infor-mation on infrastructure-related losses was derived from the African Postharvest Loss Information System (APHLIS). Weather risk data w ere extracted from the disaster database maintained by the Prime Minister's Office. Input risk estimates are based on Transparency International calculations. Security risk data w ere obtained from the WFP.
36,68%
28,74%
14,95%
10,70%
6,21% 2,31% 0,40%
Price risk food & cash crops
Crop pest & diseases
Post harvest loss
Livestock pest & diseases
Droughts
Counterfeit inputs
All other risks
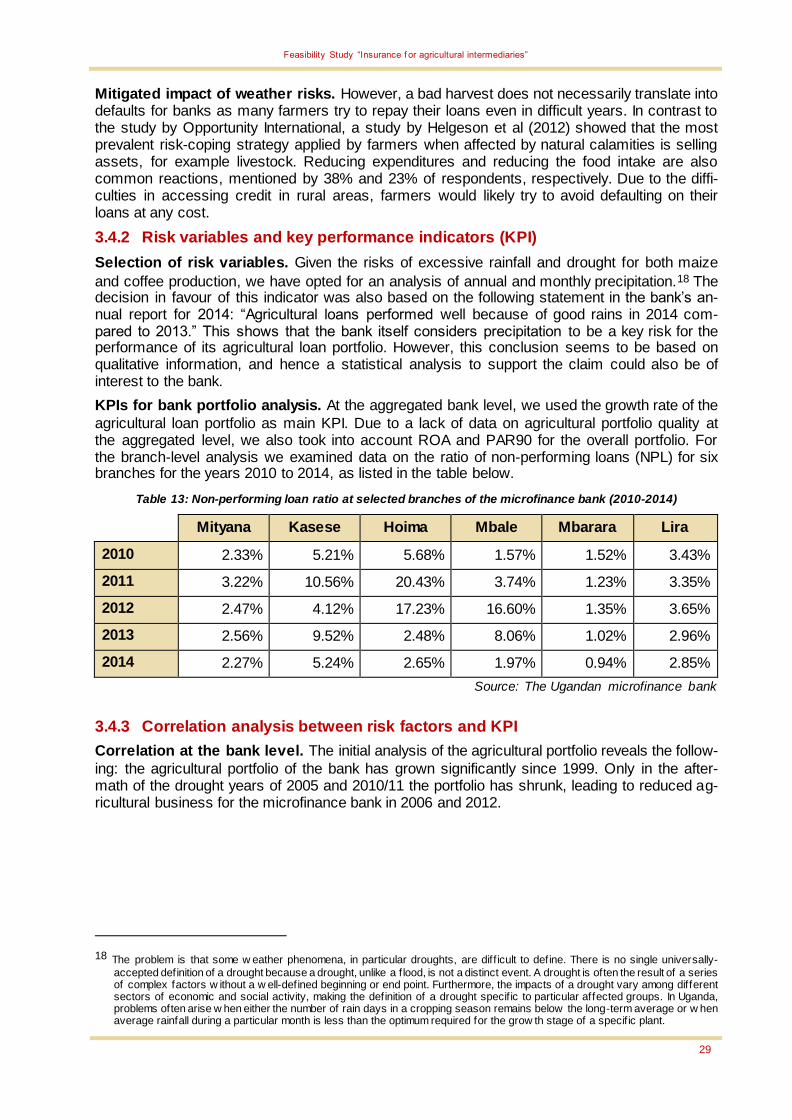
Feasibility Study “Insurance f or agricultural intermediaries”
29
Mitigated impact of weather risks. However, a bad harvest does not necessarily translate into defaults for banks as many farmers try to repay their loans even in difficult years. In contrast to the study by Opportunity International, a study by Helgeson et al (2012) showed that the most prevalent risk-coping strategy applied by farmers when affected by natural calamities is selling assets, for example livestock. Reducing expenditures and reducing the food intake are also common reactions, mentioned by 38% and 23% of respondents, respectively. Due to the diffi-culties in accessing credit in rural areas, farmers would likely try to avoid defaulting on their loans at any cost.
3.4.2 Risk variables and key performance indicators (KPI)
Selection of risk variables. Given the risks of excessive rainfall and drought for both maize
and coffee production, we have opted for an analysis of annual and monthly precipitation.18 The decision in favour of this indicator was also based on the following statement in the bank’s an-nual report for 2014: “Agricultural loans performed well because of good rains in 2014 com-pared to 2013.” This shows that the bank itself considers precipitation to be a key risk for the performance of its agricultural loan portfolio. However, this conclusion seems to be based on qualitative information, and hence a statistical analysis to support the claim could also be of interest to the bank.
KPIs for bank portfolio analysis. At the aggregated bank level, we used the growth rate of the
agricultural loan portfolio as main KPI. Due to a lack of data on agricultural portfolio quality at the aggregated level, we also took into account ROA and PAR90 for the overall portfolio. For the branch-level analysis we examined data on the ratio of non-performing loans (NPL) for six branches for the years 2010 to 2014, as listed in the table below.
Table 13: Non-performing loan ratio at selected branches of the microfinance bank (2010-2014)
Mityana Kasese Hoima Mbale Mbarara Lira
2010 2.33% 5.21% 5.68% 1.57% 1.52% 3.43%
2011 3.22% 10.56% 20.43% 3.74% 1.23% 3.35%
2012 2.47% 4.12% 17.23% 16.60% 1.35% 3.65%
2013 2.56% 9.52% 2.48% 8.06% 1.02% 2.96%
2014 2.27% 5.24% 2.65% 1.97% 0.94% 2.85%
Source: The Ugandan microfinance bank
3.4.3 Correlation analysis between risk factors and KPI
Correlation at the bank level. The initial analysis of the agricultural portfolio reveals the follow-
ing: the agricultural portfolio of the bank has grown significantly since 1999. Only in the after-math of the drought years of 2005 and 2010/11 the portfolio has shrunk, leading to reduced ag-ricultural business for the microfinance bank in 2006 and 2012.
18 The problem is that some w eather phenomena, in particular droughts, are diff icult to define. There is no single universally-
accepted definition of a drought because a drought, unlike a f lood, is not a distinct event. A drought is often the result of a series of complex factors w ithout a w ell-defined beginning or end point. Furthermore, the impacts of a drought vary among different sectors of economic and social activity, making the definition of a drought specif ic to particular affected groups. In Uganda, problems often arise w hen either the number of rain days in a cropping season remains below the long-term average or w hen average rainfall during a particular month is less than the optimum required for the grow th stage of a specif ic plant.
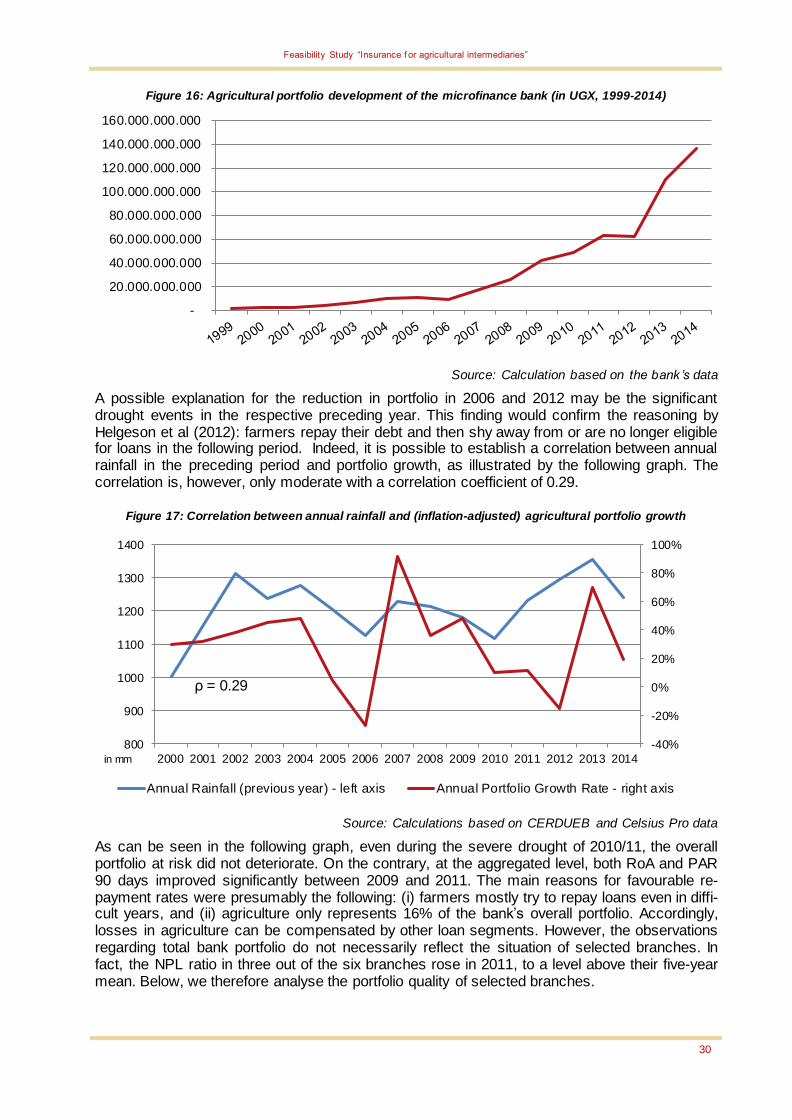
Feasibility Study “Insurance f or agricultural intermediaries”
30
Figure 16: Agricultural portfolio development of the microfinance bank (in UGX, 1999-2014)
Source: Calculation based on the bank ’s data
A possible explanation for the reduction in portfolio in 2006 and 2012 may be the significant drought events in the respective preceding year. This finding would confirm the reasoning by Helgeson et al (2012): farmers repay their debt and then shy away from or are no longer eligible for loans in the following period. Indeed, it is possible to establish a correlation between annual rainfall in the preceding period and portfolio growth, as illustrated by the following graph. The correlation is, however, only moderate with a correlation coefficient of 0.29.
Figure 17: Correlation between annual rainfall and (inflation-adjusted) agricultural portfolio growth
Source: Calculations based on CERDUEB and Celsius Pro data
As can be seen in the following graph, even during the severe drought of 2010/11, the overall portfolio at risk did not deteriorate. On the contrary, at the aggregated level, both RoA and PAR 90 days improved significantly between 2009 and 2011. The main reasons for favourable re-payment rates were presumably the following: (i) farmers mostly try to repay loans even in diffi-cult years, and (ii) agriculture only represents 16% of the bank’s overall portfolio. Accordingly, losses in agriculture can be compensated by other loan segments. However, the observations regarding total bank portfolio do not necessarily reflect the situation of selected branches. In fact, the NPL ratio in three out of the six branches rose in 2011, to a level above their five-year mean. Below, we therefore analyse the portfolio quality of selected branches.
-
20.000.000.000
40.000.000.000
60.000.000.000
80.000.000.000
100.000.000.000
120.000.000.000
140.000.000.000
160.000.000.000
-40%
-20%
0%
20%
40%
60%
80%
100%
800
900
1000
1100
1200
1300
1400
2000 2001 2002 2003 2004 2005 2006 2007 2008 2009 2010 2011 2012 2013 2014
Annual Rainfall (previous year) - left axis Annual Portfolio Growth Rate - right axis
ρ = 0.29
in mm
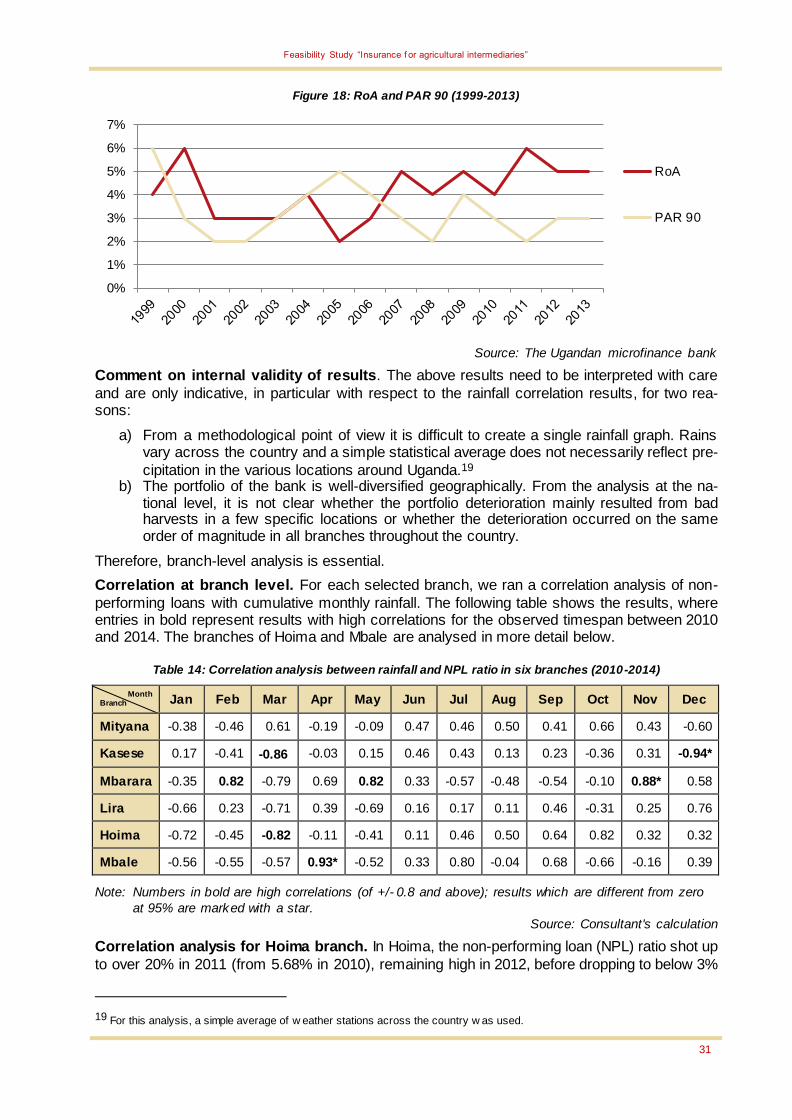
Feasibility Study “Insurance f or agricultural intermediaries”
31
Figure 18: RoA and PAR 90 (1999-2013)
Source: The Ugandan microfinance bank
Comment on internal validity of results. The above results need to be interpreted with care
and are only indicative, in particular with respect to the rainfall correlation results, for two rea-sons:
a) From a methodological point of view it is difficult to create a single rainfall graph. Rains vary across the country and a simple statistical average does not necessarily reflect pre-
cipitation in the various locations around Uganda.19 b) The portfolio of the bank is well-diversified geographically. From the analysis at the na-
tional level, it is not clear whether the portfolio deterioration mainly resulted from bad harvests in a few specific locations or whether the deterioration occurred on the same order of magnitude in all branches throughout the country.
Therefore, branch-level analysis is essential.
Correlation at branch level. For each selected branch, we ran a correlation analysis of non-
performing loans with cumulative monthly rainfall. The following table shows the results, where entries in bold represent results with high correlations for the observed timespan between 2010 and 2014. The branches of Hoima and Mbale are analysed in more detail below.
Table 14: Correlation analysis between rainfall and NPL ratio in six branches (2010-2014)
Month Branch Jan Feb Mar Apr May Jun Jul Aug Sep Oct Nov Dec
Mityana -0.38 -0.46 0.61 -0.19 -0.09 0.47 0.46 0.50 0.41 0.66 0.43 -0.60
Kasese 0.17 -0.41 -0.86 -0.03 0.15 0.46 0.43 0.13 0.23 -0.36 0.31 -0.94*
Mbarara -0.35 0.82 -0.79 0.69 0.82 0.33 -0.57 -0.48 -0.54 -0.10 0.88* 0.58
Lira -0.66 0.23 -0.71 0.39 -0.69 0.16 0.17 0.11 0.46 -0.31 0.25 0.76
Hoima -0.72 -0.45 -0.82 -0.11 -0.41 0.11 0.46 0.50 0.64 0.82 0.32 0.32
Mbale -0.56 -0.55 -0.57 0.93* -0.52 0.33 0.80 -0.04 0.68 -0.66 -0.16 0.39
Note: Numbers in bold are high correlations (of +/- 0.8 and above); results which are different from zero
at 95% are marked with a star.
Source: Consultant's calculation
Correlation analysis for Hoima branch. In Hoima, the non-performing loan (NPL) ratio shot up
to over 20% in 2011 (from 5.68% in 2010), remaining high in 2012, before dropping to below 3%
19 For this analysis, a simple average of w eather stations across the country w as used.
0%
1%
2%
3%
4%
5%
6%
7%
RoA
PAR 90

Feasibility Study “Insurance f or agricultural intermediaries”
32
in 2013 and 2014. Presumably, a main determinant of portfolio quality in Hoima was the yield of maize, since maize growers constitute 60% of the portfolio.
The total water requirement of maize, calculated as cumulative precipitation over the whole cropping season, is assumed to be 500-800mm which was reached for all observed years be-tween 2010 and 2014. In the past, major outliers for the main cropping season were the years 1998, 1999, 2002 and 2008 which were drought years on a national scale, as also shown by the weather data used for this study.
An analysis of water availability during the critical growth stages (i.e. planting, tasseling and yield formation) reveals that in 2011 and 2012, Hoima received lower-than-average rainfall in March, as illustrated in the graph below. The statistical analysis shows a strong negative corre-lation (-0.82) between the ratio of non-performing loans and rainfall in March.
Figure 19: Rainfall in March and NPL ratio at Hoima branch (2010-2014)
Sources: the Ugandan microfinance bank and CelsiusPro
This suggests that high precipitation in March contributes to a good portfolio quality, or, con-versely, insufficient rain in March might play a role in a deteriorating portfolio. This is in line with our qualitative assessment, which postulates drought during the month of March (the beginning of the planting season) as a major risk for maize production.
Apart from rainfall in March, no significant correlation was detected for other weather parame-ters such as rainfall during the entire season and rainfall during other critical growth stages in April, May and June.
Comment on internal validity of results. The significance of the above results has to be as-
sessed carefully. Since the data available cover a time period of five years only, we cannot rule out the possibility that results are driven by unobserved factors, which are incidentally correlated with rainfall in March. In fact, unofficial information from bank staff suggests that Hoima branch was facing internal management issues at the beginning of the decade. The decreasing PAR thereafter might hence be a result of the change in management that took place in 2012. To check for this alternative explanation, we would need additional information such as staff turno-ver, which, however, any bank is highly unlikely to share with third parties.
Correlation analysis for Mbale branch. In Mbale, the NPL ratio remained low in 2010 and
2011, jumping to over 16% in 2012, before decreasing in 2013 and returning to an acceptable level in 2014 (1.97%). We thus analysed the correlation between this portfolio information and weather parameters during the critical growth phases of coffee, which represents 60% of the branch portfolio. The results are significant correlations for excessive rainfall during the blos-soming phases for both the minor and the major season (April and September, respectively) as well as for the harvesting of the minor season (July). The correlation for rainfall in the blossom-ing phase in April is particularly high, with 0.93 for total rainfall received during the month and 0.97 for one-day extreme rainfall events.
0%
5%
10%
15%
20%
25%
0
50
100
150
200
2010 2011 2012 2013 2014
Rainfall March
NPL
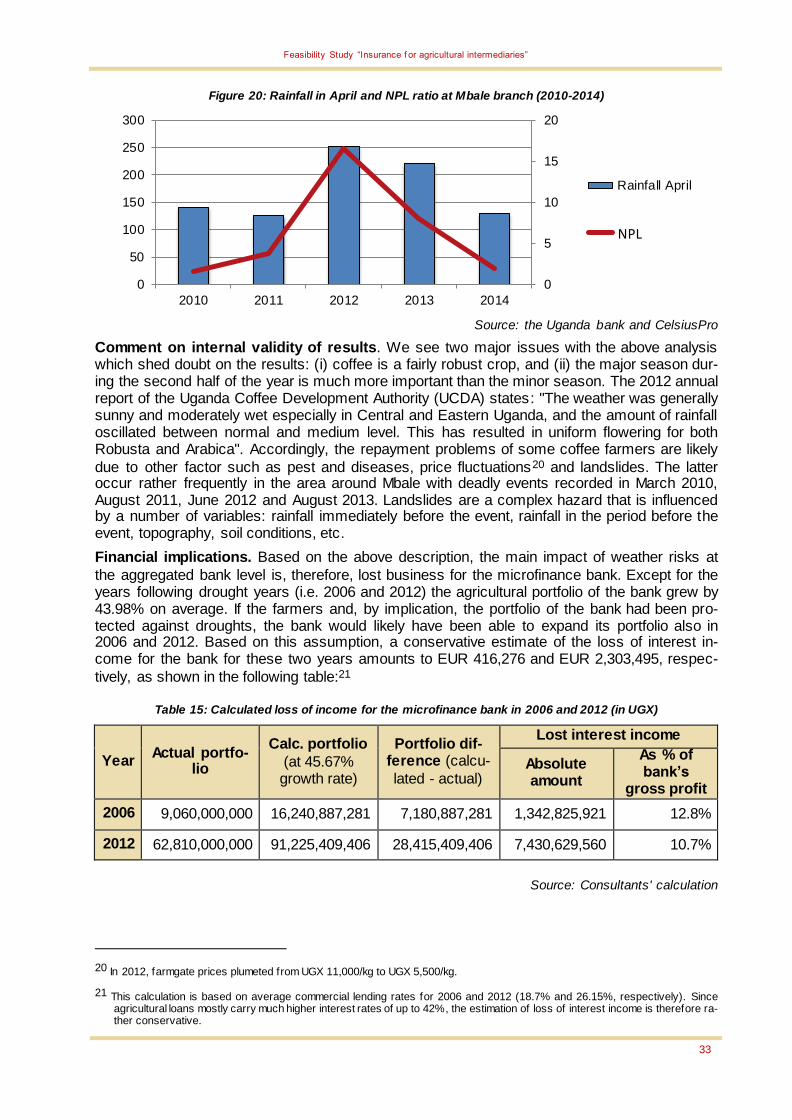
Feasibility Study “Insurance f or agricultural intermediaries”
33
Figure 20: Rainfall in April and NPL ratio at Mbale branch (2010-2014)
Source: the Uganda bank and CelsiusPro
Comment on internal validity of results. We see two major issues with the above analysis which shed doubt on the results: (i) coffee is a fairly robust crop, and (ii) the major season dur-ing the second half of the year is much more important than the minor season. The 2012 annual report of the Uganda Coffee Development Authority (UCDA) states: "The weather was generally sunny and moderately wet especially in Central and Eastern Uganda, and the amount of rainfall oscillated between normal and medium level. This has resulted in uniform flowering for both Robusta and Arabica". Accordingly, the repayment problems of some coffee farmers are likely
due to other factor such as pest and diseases, price fluctuations20 and landslides. The latter occur rather frequently in the area around Mbale with deadly events recorded in March 2010, August 2011, June 2012 and August 2013. Landslides are a complex hazard that is influenced by a number of variables: rainfall immediately before the event, rainfall in the period before the event, topography, soil conditions, etc.
Financial implications. Based on the above description, the main impact of weather risks at
the aggregated bank level is, therefore, lost business for the microfinance bank. Except for the years following drought years (i.e. 2006 and 2012) the agricultural portfolio of the bank grew by 43.98% on average. If the farmers and, by implication, the portfolio of the bank had been pro-tected against droughts, the bank would likely have been able to expand its portfolio also in 2006 and 2012. Based on this assumption, a conservative estimate of the loss of interest in-come for the bank for these two years amounts to EUR 416,276 and EUR 2,303,495, respec-
tively, as shown in the following table:21
Table 15: Calculated loss of income for the microfinance bank in 2006 and 2012 (in UGX)
Year Actual portfo-
lio
Calc. portfolio
(at 45.67% growth rate)
Portfolio dif-ference (calcu-
lated - actual)
Lost interest income
Absolute amount
As % of bank’s
gross profit
2006 9,060,000,000 16,240,887,281 7,180,887,281 1,342,825,921 12.8%
2012 62,810,000,000 91,225,409,406 28,415,409,406 7,430,629,560 10.7%
Source: Consultants' calculation
20 In 2012, farmgate prices plumeted from UGX 11,000/kg to UGX 5,500/kg.
21 This calculation is based on average commercial lending rates for 2006 and 2012 (18.7% and 26.15%, respectively). Since agricultural loans mostly carry much higher interest rates of up to 42%, the estimation of loss of interest income is therefore ra-ther conservative.
0
5
10
15
20
0
50
100
150
200
250
300
2010 2011 2012 2013 2014
Rainfall April
PARNPL

Feasibility Study “Insurance f or agricultural intermediaries”
34
3.5 Risk management of the microfinance bank
3.5.1 Description of applied risk management strategy
Portfolio diversification. The microfinance bank is trying to reduce its risk exposure through
portfolio diversification, both geographically and in terms of value chains financed. The analysis of the two branches above reveals that within each branch, diversification in terms of value chains is limited as in both branches, one crop makes up 60% of the agricultural portfolio. Nev-ertheless, different branches focus on different crops, hence inter-branch diversification seems to be successful.
Loan appraisal procedure. The loan officers use an Agricultural Loan Analysis Spreadsheet
(ALAS) that the bank has developed in-house. In addition to the regular 5Cs22 analysis of the individual and a home visit, the loan officer analyses the parameters of the cropping cycle and the costs associated with each vegetative stage of crop production, rearing of livestock, etc. The crop production activity assessment consists of a review of the parameters, which are com-pared to a benchmark:
• Years of experience in agriculture • Acreage cultivated • Yield obtained/reported (in comparison to the regional average) • Expenses incurred on inputs • Seeds usage • ‘Business’ plan
The loan appraisal sheet for agricultural loans also contains questions on the risks faced by the farmers and any measures taken by the farmers to manage these risks. Moreover, the expected income and repayment capacity are assessed conservatively (based on lower price/yield) and the applicant must have a secondary source of income to qualify for a loan. The applicant also has to provide a collateral/guarantee equivalent to 150% of loan value. Land is admissible and the microfinance bank is flexible with admissible assets for loans below UGX 5 million. Howev-er, land titles are often held by men, and many low-income households may not be able to pro-vide sufficient collateral, limiting loan eligibility.
Once the initial review is completed and eligibility has been assessed, the loan appraisal is for-warded to the branch's credit administrator and branch manager. Depending on loan amounts there are different approval limits for the Board, management credit committees and lower-level committees. Risk management thus forms part of the structure and procedures through the eli-gibility criteria and the assessment process.
The following graph summarises the loan appraisal process and the inherent risk analysis.
22 Character, Capacity, Capital, Collateral and Conditions.
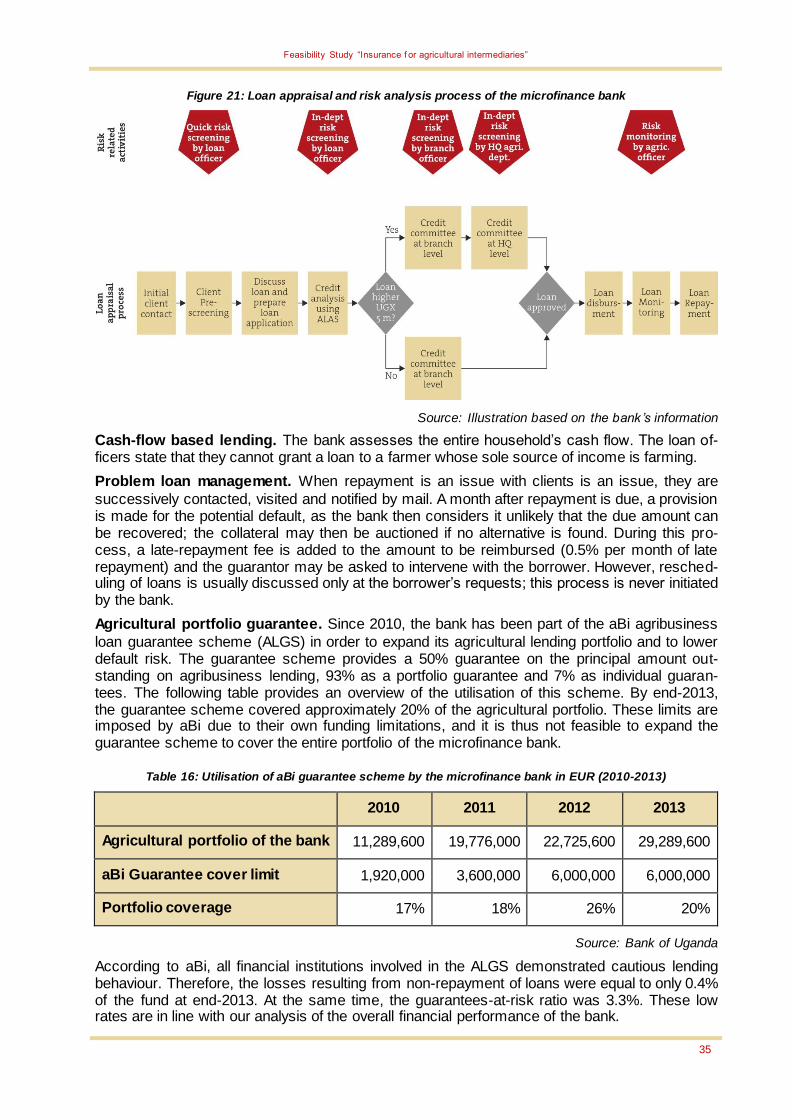
Feasibility Study “Insurance f or agricultural intermediaries”
35
Figure 21: Loan appraisal and risk analysis process of the microfinance bank
Source: Illustration based on the bank ’s information
Cash-flow based lending. The bank assesses the entire household’s cash flow. The loan of-ficers state that they cannot grant a loan to a farmer whose sole source of income is farming.
Problem loan management. When repayment is an issue with clients is an issue, they are
successively contacted, visited and notified by mail. A month after repayment is due, a provision is made for the potential default, as the bank then considers it unlikely that the due amount can be recovered; the collateral may then be auctioned if no alternative is found. During this pro-cess, a late-repayment fee is added to the amount to be reimbursed (0.5% per month of late repayment) and the guarantor may be asked to intervene with the borrower. However, resched-uling of loans is usually discussed only at the borrower’s requests; this process is never initiated by the bank.
Agricultural portfolio guarantee. Since 2010, the bank has been part of the aBi agribusiness
loan guarantee scheme (ALGS) in order to expand its agricultural lending portfolio and to lower default risk. The guarantee scheme provides a 50% guarantee on the principal amount out-standing on agribusiness lending, 93% as a portfolio guarantee and 7% as individual guaran-tees. The following table provides an overview of the utilisation of this scheme. By end-2013, the guarantee scheme covered approximately 20% of the agricultural portfolio. These limits are imposed by aBi due to their own funding limitations, and it is thus not feasible to expand the guarantee scheme to cover the entire portfolio of the microfinance bank.
Table 16: Utilisation of aBi guarantee scheme by the microfinance bank in EUR (2010-2013)
2010 2011 2012 2013
Agricultural portfolio of the bank 11,289,600 19,776,000 22,725,600 29,289,600
aBi Guarantee cover limit 1,920,000 3,600,000 6,000,000 6,000,000
Portfolio coverage 17% 18% 26% 20%
Source: Bank of Uganda
According to aBi, all financial institutions involved in the ALGS demonstrated cautious lending behaviour. Therefore, the losses resulting from non-repayment of loans were equal to only 0.4% of the fund at end-2013. At the same time, the guarantees-at-risk ratio was 3.3%. These low rates are in line with our analysis of the overall financial performance of the bank.
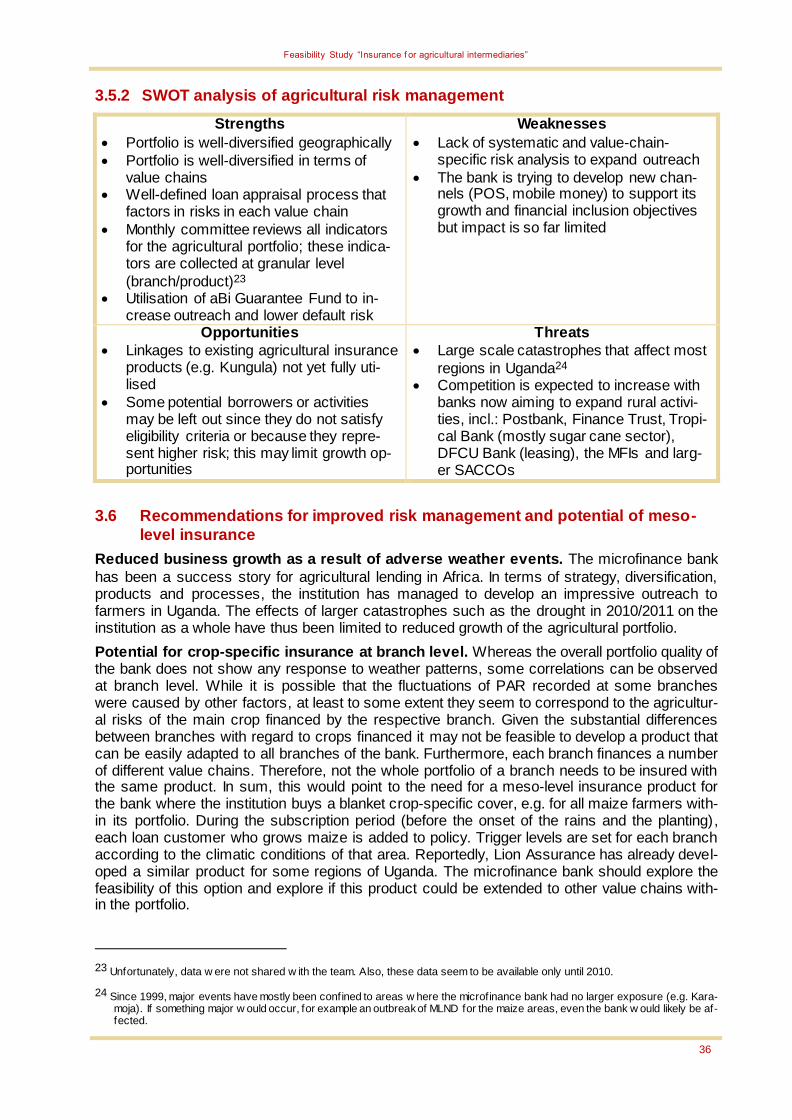
Feasibility Study “Insurance f or agricultural intermediaries”
36
3.5.2 SWOT analysis of agricultural risk management
Strengths
Portfolio is well-diversified geographically
Portfolio is well-diversified in terms of value chains
Well-defined loan appraisal process that factors in risks in each value chain
Monthly committee reviews all indicators for the agricultural portfolio; these indica-tors are collected at granular level
(branch/product)23 Utilisation of aBi Guarantee Fund to in-
crease outreach and lower default risk
Weaknesses
Lack of systematic and value-chain-specific risk analysis to expand outreach
The bank is trying to develop new chan-nels (POS, mobile money) to support its growth and financial inclusion objectives but impact is so far limited
Opportunities
Linkages to existing agricultural insurance products (e.g. Kungula) not yet fully uti-lised
Some potential borrowers or activities may be left out since they do not satisfy eligibility criteria or because they repre-sent higher risk; this may limit growth op-portunities
Threats
Large scale catastrophes that affect most
regions in Uganda24 Competition is expected to increase with
banks now aiming to expand rural activi-ties, incl.: Postbank, Finance Trust, Tropi-cal Bank (mostly sugar cane sector), DFCU Bank (leasing), the MFIs and larg-er SACCOs
3.6 Recommendations for improved risk management and potential of meso-
level insurance
Reduced business growth as a result of adverse weather events. The microfinance bank
has been a success story for agricultural lending in Africa. In terms of strategy, diversification, products and processes, the institution has managed to develop an impressive outreach to farmers in Uganda. The effects of larger catastrophes such as the drought in 2010/2011 on the institution as a whole have thus been limited to reduced growth of the agricultural portfolio.
Potential for crop-specific insurance at branch level. Whereas the overall portfolio quality of the bank does not show any response to weather patterns, some correlations can be observed at branch level. While it is possible that the fluctuations of PAR recorded at some branches were caused by other factors, at least to some extent they seem to correspond to the agricultur-al risks of the main crop financed by the respective branch. Given the substantial differences between branches with regard to crops financed it may not be feasible to develop a product that can be easily adapted to all branches of the bank. Furthermore, each branch finances a number of different value chains. Therefore, not the whole portfolio of a branch needs to be insured with the same product. In sum, this would point to the need for a meso-level insurance product for the bank where the institution buys a blanket crop-specific cover, e.g. for all maize farmers with-in its portfolio. During the subscription period (before the onset of the rains and the planting), each loan customer who grows maize is added to policy. Trigger levels are set for each branch according to the climatic conditions of that area. Reportedly, Lion Assurance has already devel-oped a similar product for some regions of Uganda. The microfinance bank should explore the feasibility of this option and explore if this product could be extended to other value chains with-in the portfolio.
23 Unfortunately, data w ere not shared w ith the team. Also, these data seem to be available only until 2010.
24 Since 1999, major events have mostly been confined to areas w here the microfinance bank had no larger exposure (e.g. Kara-moja). If something major w ould occur, for example an outbreak of MLND for the maize areas, even the bank w ould likely be af-fected.
Feasibility Study “Insurance f or agricultural intermediaries”
37
Integrated risk management approach. Given the plethora of risks faced by farmers, an in-surance scheme will not protect the bank from all agricultural default risk as the insurance will only cover certain risks. Currently, the bank limits its exposure to agricultural sub-segments in specific locations. Re-evaluating these exposure limits based on a more realistic in-depth risk analysis may offer new business opportunities. Disaggregating risk factors (as has been done above for the agricultural sector as a whole) can provide important leads in order to determine what risks farmers are facing and whether farmers themselves are taking all necessary precau-tions to reduce their risk exposure. A value chain risk assessment for the livestock sector has already been commissioned by the bank but additional internal capacity to carry out such com-plex tasks needs to be built.
Complementarity of guarantee scheme and insurance. Since 2010, the microfinance bank
has accessed the aBi Guarantee Fund. However, as the financial resources of aBi are limited, it is not possible to cover the entire agricultural portfolio of the bank with this scheme. Combining agricultural insurance with the guarantee scheme would be one option to allow the bank to fur-ther increase its outreach. The insurance scheme could cover defaults due to weather risk, whereas the guarantee scheme could cover defaults occurring for other reasons. Such a com-bination would require a change in the guarantee scheme procedures whereby the 50% guaran-tee offered by aBi could be claimed by the bank only for defaults, which have not been covered by the insurance scheme already. By reducing the risk exposure of aBi, more farmers can be included in the guarantee scheme.
Potential for institutions with less risk diversification. The microfinance bank is well-
diversified in terms of geography and value chains financed. Furthermore, the institution has taken a cautious approach to the selection of value chains to be financed in specific locations. This internal risk diversification constitutes a disincentive for meso-level insurance at the aggre-gate institutional level. In assessing the risk exposure of the rural financial sector in Uganda, it may be worthwhile to explore whether smaller financial institutions, such as SACCOs, could be more interesting targets for a meso-level insurance scheme, since they have no geographical and, often, no value chain diversification opportunities for their portfolio. As shown by our branch-level analysis for the bank, even small-scale events such as a local flood can affect their portfolio. The negative effects of a deteriorating portfolio on liquidity would also be stronger for smaller institutions compared to larger ones. Developing an insurance scheme for the many SACCOs in the country might be an opportunity to enhance the attractiveness of these institu-tions for on-lending of credit lines from institutions such as the microfinance bank.
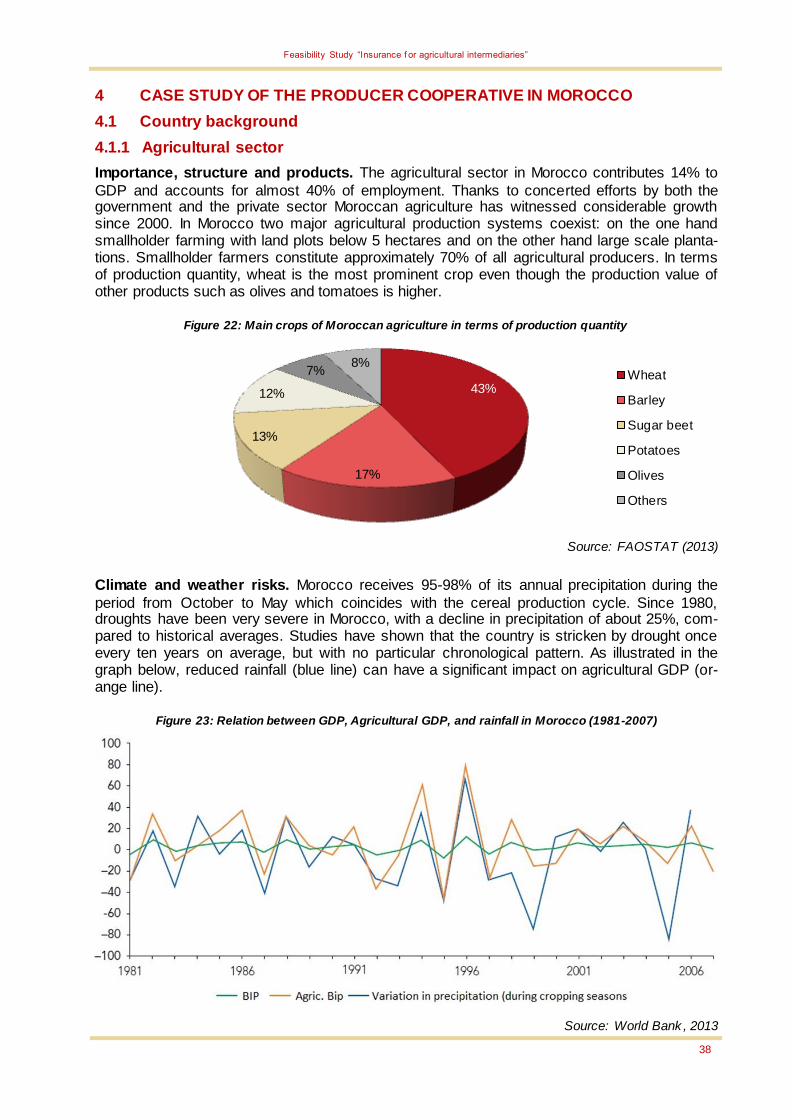
Feasibility Study “Insurance f or agricultural intermediaries”
38
4 CASE STUDY OF THE PRODUCER COOPERATIVE IN MOROCCO
4.1 Country background
4.1.1 Agricultural sector
Importance, structure and products. The agricultural sector in Morocco contributes 14% to
GDP and accounts for almost 40% of employment. Thanks to concerted efforts by both the government and the private sector Moroccan agriculture has witnessed considerable growth since 2000. In Morocco two major agricultural production systems coexist: on the one hand smallholder farming with land plots below 5 hectares and on the other hand large scale planta-tions. Smallholder farmers constitute approximately 70% of all agricultural producers. In terms of production quantity, wheat is the most prominent crop even though the production value of other products such as olives and tomatoes is higher.
Figure 22: Main crops of Moroccan agriculture in terms of production quantity
Source: FAOSTAT (2013)
Climate and weather risks. Morocco receives 95-98% of its annual precipitation during the
period from October to May which coincides with the cereal production cycle. Since 1980, droughts have been very severe in Morocco, with a decline in precipitation of about 25%, com-pared to historical averages. Studies have shown that the country is stricken by drought once every ten years on average, but with no particular chronological pattern. As illustrated in the graph below, reduced rainfall (blue line) can have a significant impact on agricultural GDP (or-ange line).
Figure 23: Relation between GDP, Agricultural GDP, and rainfall in Morocco (1981-2007)
Source: World Bank , 2013
43%
17%
13%
12%
7% 8%
Wheat
Barley
Sugar beet
Potatoes
Olives
Others

Feasibility Study “Insurance f or agricultural intermediaries”
39
4.1.2 Agricultural finance and insurance
Access to finance. Access to finance is a major bottleneck for agricultural growth as currently
only 18% of farmers are able to access loans. The government intervenes heavily in the agricul-tural finance market via subsidised interest rates offered by Crédit Agricole du Maroc, the unique conduit of government subsidies. While this scheme allows greater outreach to the agri-cultural sector, it essentially precludes the entry of private sector financial institutions into this market segment. The implementation of the Plan Maroc Vert (PMV), a roadmap for the devel-opment of Moroccan agriculture, has led to an influx of credit to the agricultural sector of more than EUR 3 billion in a time span of five years (2009-2013).
Agricultural insurance. Mutuelle agricole marocaine d’assurance (MAMDA) is Morocco's main
agricultural sector insurer. From 1994 to 2010, a programme to cover drought risk for cereal grains was initiated by the government. But the scheme with government as de-facto insurer fell short of its targets and in 2008, as part of the PMV, the government started to support MAMDA with two subsidised products: hailstone insurance since 2009 and multiple-risk weather insur-ance since 2011. Prior to that, a non-subsidised insurance scheme for hailstone damage was marketed but premiums were deemed too high. Today the hailstone insurance covers arboricul-ture, truck farming, vineyards and seed. Premiums are calculated on the basis of the geograph-ical area and crop grown. They vary between 1.62% and 4.50% and are subsidised by up to 20%-40% on the basis of farm size. In the longer term, MAMDA is expected to convert all poli-cies to multiple-risk weather insurance policies.
The multiple-risk weather insurance provides cover for grains and legumes across the entire country for the following risks: hailstorms, heavy frost, flooding, violent winds and sandstorms. Premiums are subsidised at a decreasing rate for larger landholdings: for land plots below 3 ha the subsidy is 90% leading to a premium of 26 dirham/ha (2.4 euros/ha), for a maximum com-pensation of 1,450 dirhams/ha (135 EUR/ha). The indemnity is calculated on the basis of a loss of yield rate based on loss adjustment calculated by MAMDA officers. Growth has been quite substantial with 303,000 ha covered in 2011/12, 473,000 ha in 2012/13, and 650,000 ha in 2013/14. The goal for 2015 is to reach 1 million hectares. Even though growth figures have been impressive, the insurance scheme is held back by some product and process features that farmers do not appreciate:
The trigger for the multi-risk cover is 40% of historical yields; therefore, a decreasing probability of getting a payout limits the value for clients.
No zoning for the yield assessment (elevation) is applied, therefore crop cutting ex-periments (CCE) do not reflect the actual exposure/harvest of farmers.
The insurance cover is pushed by the government in drought-prone areas but in very exposed areas with low productivity social benefits such as cash transfers are con-sidered to be more suitable than insurance.
Loss assessment by experts at the regional level may not be consistent and may even be influenced by local politics.
Reports suggests that fraud exists at farmers’ level (e.g. insuring unplanted areas, or declaring larger acreage) and also that farmers exercise considerable political pressure to get payouts. The launch of an indexed insurance scheme covering drought risks for grains and fodder is a project currently under consideration.
Selection of intermediary. The producer cooperative was founded in 1993 and produces a
variety of crops mainly under rain-fed conditions. Compared to other producer groups it has documented its historical performance. Furthermore, in 2011, the cooperative started to provide internal loans to its members, using their own capital. Before, it acted as on-lending institution for loans from Crédit Agricole Maroc to its members and participated in the credit decision pro-cess. Nowadays, members have access to individual loans from Crédit Agricole Maroc and are offered the same interest rates as if the cooperative borrowed from this bank. In general, the current position of cooperatives in Morocco is very weak. Most farmers now have land titles and each farmer handles his or her production, financing and harvest sales independently. The insti-
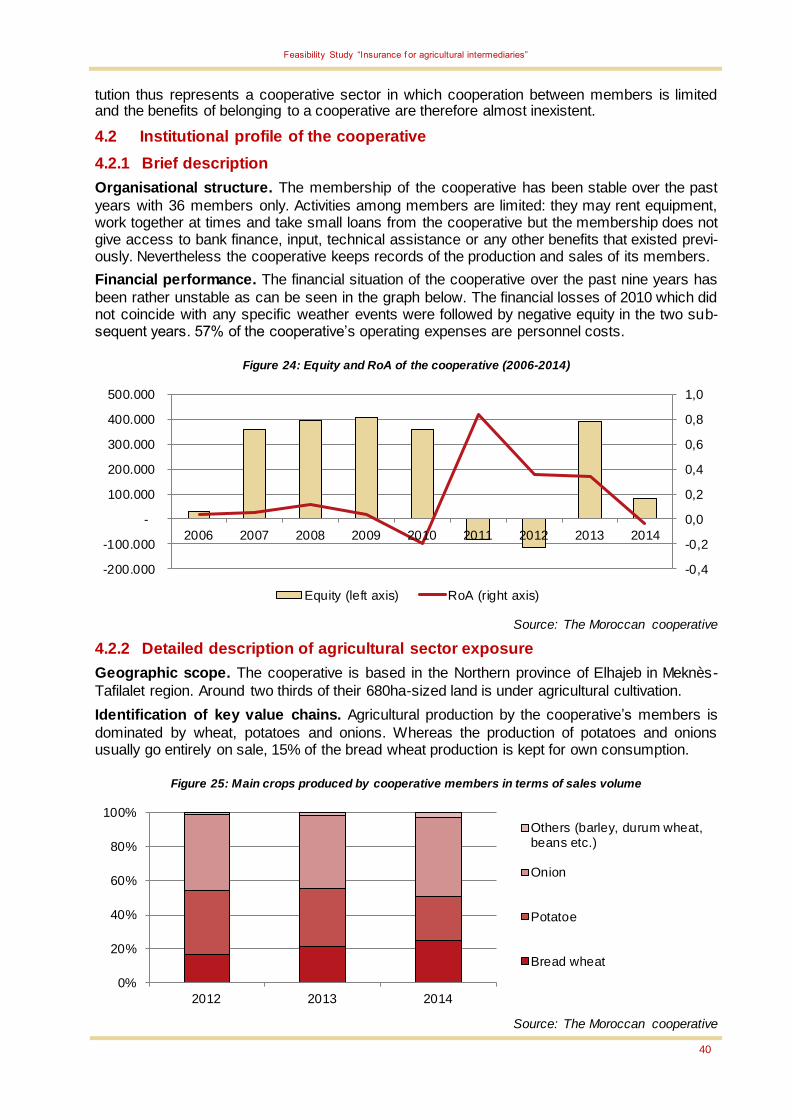
Feasibility Study “Insurance f or agricultural intermediaries”
40
tution thus represents a cooperative sector in which cooperation between members is limited and the benefits of belonging to a cooperative are therefore almost inexistent.
4.2 Institutional profile of the cooperative
4.2.1 Brief description
Organisational structure. The membership of the cooperative has been stable over the past
years with 36 members only. Activities among members are limited: they may rent equipment, work together at times and take small loans from the cooperative but the membership does not give access to bank finance, input, technical assistance or any other benefits that existed previ-ously. Nevertheless the cooperative keeps records of the production and sales of its members.
Financial performance. The financial situation of the cooperative over the past nine years has
been rather unstable as can be seen in the graph below. The financial losses of 2010 which did not coincide with any specific weather events were followed by negative equity in the two sub-sequent years. 57% of the cooperative’s operating expenses are personnel costs.
Figure 24: Equity and RoA of the cooperative (2006-2014)
Source: The Moroccan cooperative
4.2.2 Detailed description of agricultural sector exposure
Geographic scope. The cooperative is based in the Northern province of Elhajeb in Meknès-
Tafilalet region. Around two thirds of their 680ha-sized land is under agricultural cultivation.
Identification of key value chains. Agricultural production by the cooperative’s members is
dominated by wheat, potatoes and onions. Whereas the production of potatoes and onions usually go entirely on sale, 15% of the bread wheat production is kept for own consumption.
Figure 25: Main crops produced by cooperative members in terms of sales volume
Source: The Moroccan cooperative
-0,4
-0,2
0,0
0,2
0,4
0,6
0,8
1,0
-200.000
-100.000
-
100.000
200.000
300.000
400.000
500.000
2006 2007 2008 2009 2010 2011 2012 2013 2014
Equity (left axis) RoA (right axis)
0%
20%
40%
60%
80%
100%
2012 2013 2014
Others (barley, durum wheat,beans etc.)
Onion
Potatoe
Bread wheat
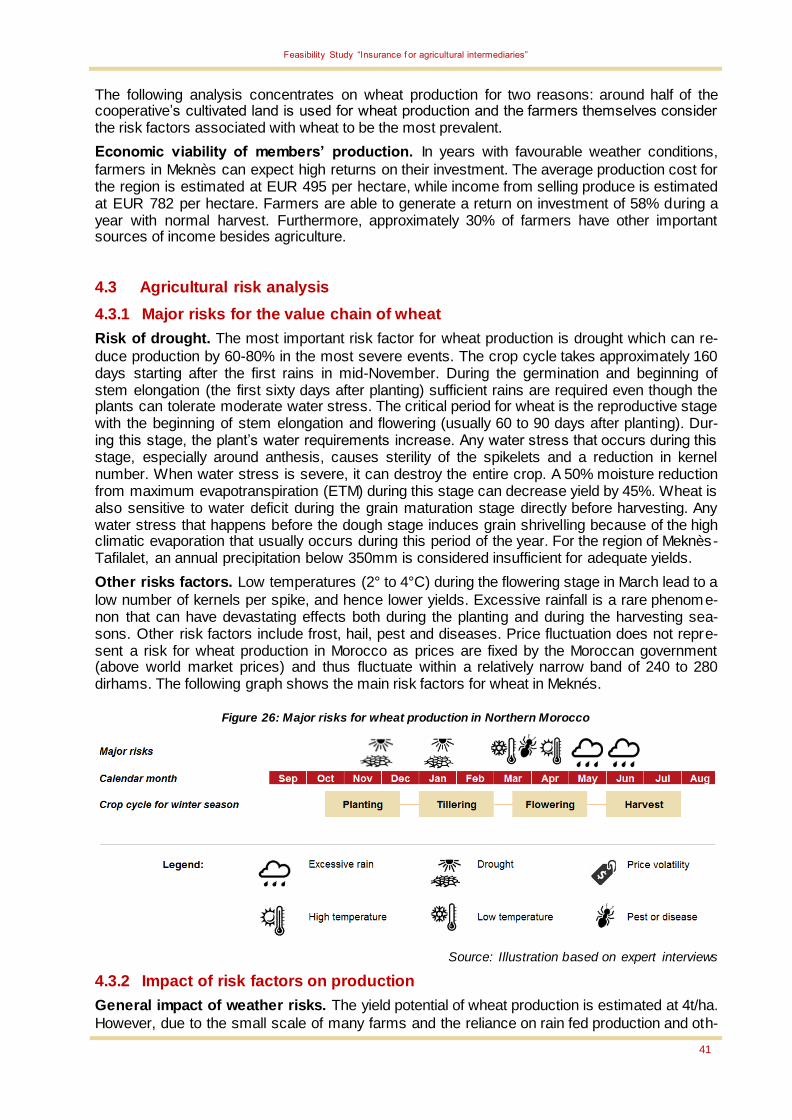
Feasibility Study “Insurance f or agricultural intermediaries”
41
The following analysis concentrates on wheat production for two reasons: around half of the cooperative’s cultivated land is used for wheat production and the farmers themselves consider the risk factors associated with wheat to be the most prevalent.
Economic viability of members’ production. In years with favourable weather conditions,
farmers in Meknès can expect high returns on their investment. The average production cost for the region is estimated at EUR 495 per hectare, while income from selling produce is estimated at EUR 782 per hectare. Farmers are able to generate a return on investment of 58% during a year with normal harvest. Furthermore, approximately 30% of farmers have other important sources of income besides agriculture.
4.3 Agricultural risk analysis
4.3.1 Major risks for the value chain of wheat
Risk of drought. The most important risk factor for wheat production is drought which can re-
duce production by 60-80% in the most severe events. The crop cycle takes approximately 160 days starting after the first rains in mid-November. During the germination and beginning of stem elongation (the first sixty days after planting) sufficient rains are required even though the plants can tolerate moderate water stress. The critical period for wheat is the reproductive stage with the beginning of stem elongation and flowering (usually 60 to 90 days after planting). Dur-ing this stage, the plant’s water requirements increase. Any water stress that occurs during this stage, especially around anthesis, causes sterility of the spikelets and a reduction in kernel number. When water stress is severe, it can destroy the entire crop. A 50% moisture reduction from maximum evapotranspiration (ETM) during this stage can decrease yield by 45%. Wheat is also sensitive to water deficit during the grain maturation stage directly before harvesting. Any water stress that happens before the dough stage induces grain shrivelling because of the high climatic evaporation that usually occurs during this period of the year. For the region of Meknès-Tafilalet, an annual precipitation below 350mm is considered insufficient for adequate yields.
Other risks factors. Low temperatures (2° to 4°C) during the flowering stage in March lead to a
low number of kernels per spike, and hence lower yields. Excessive rainfall is a rare phenome-non that can have devastating effects both during the planting and during the harvesting sea-sons. Other risk factors include frost, hail, pest and diseases. Price fluctuation does not repre-sent a risk for wheat production in Morocco as prices are fixed by the Moroccan government (above world market prices) and thus fluctuate within a relatively narrow band of 240 to 280 dirhams. The following graph shows the main risk factors for wheat in Meknés.
Figure 26: Major risks for wheat production in Northern Morocco
Source: Illustration based on expert interviews
4.3.2 Impact of risk factors on production
General impact of weather risks. The yield potential of wheat production is estimated at 4t/ha.
However, due to the small scale of many farms and the reliance on rain fed production and oth-

Feasibility Study “Insurance f or agricultural intermediaries”
42
er outdated methods, the average yield in Meknès region is approximately 2 t/ha. During years with adverse weather conditions, for example in 2005 and 2007, yields drop significantly below the long term average, leading to substantial financial losses for the farmers.
Figure 27: Wheat yields (in t/ha, left-hand scale) and rainfall (in mm, right-hand scale) in the province of Mek-
nès-Elhajeb
Source: INRA, weather station Agourai
Correlation between droughts and wheat production. Even if the relation between severe
droughts and reduced yield levels is obvious in the above graph, the statistical significance of this correlation is limited. Correlations are the highest for rainfall in November and January and cumulative precipitation from November through February. This applies to both weather data registered by the automated weather station in Agourai and satellite data registered by Celsi-usPro within a 25km radius of Meknès.
Table 17: Correlation analysis between rainfall and wheat yields in the province of Meknès-Elhajeb (2001-
2014)
W eather data Yield data
Weather station of Agourai Satellite data of Meknès
Nov Dec Jan Feb Nov-
Feb Nov Dec Jan Feb
Nov-
Feb
Regional yield of
bread wheat in
Meknès-Elhajeb
0,44 0,06 0,30 -0,02 0,39 0,47 0,03 0,15 -0,24 0,22
* Significant at 95%-level
Source: Consultant’s calculations
4.4 Impact of risks on the cooperative
4.4.1 Preliminary qualitative considerations
Droughts are recognised by the cooperative as the main risk that affects both wheat production and fodder. In the latter case, farmers respond to the loss by purchasing additional fodder or selling cattle. The risk of hailstone which mainly applies to vegetable production is experienced by the cooperative approximately once every four years. Hail nets are considered too expensive as they are imported from abroad. Damage due to frost is a rare event that can nevertheless reduce wheat production and lead to a loss of up to 100% of potatoes. Fungal infestation on wheat leaves is a controllable risk for farmers that requires a treatment costing around MAD 500 per hectare as it can otherwise reduce yield by 30%. Last but not least, in late spring or summer
0
100
200
300
400
500
0,0
0,5
1,0
1,5
2,0
2,5
3,0
3,5
2001 2002 2003 2004 2005 2006 2007 2008 2009 2010 2011 2012 2013 2014
Rainfall (feb) Rainfall (jan)
Rainfall (dec) Rainfall (nov)
Regional yield of wheat in Meknès-Elhajeb Years with adverse weather conditions as reported by local expert
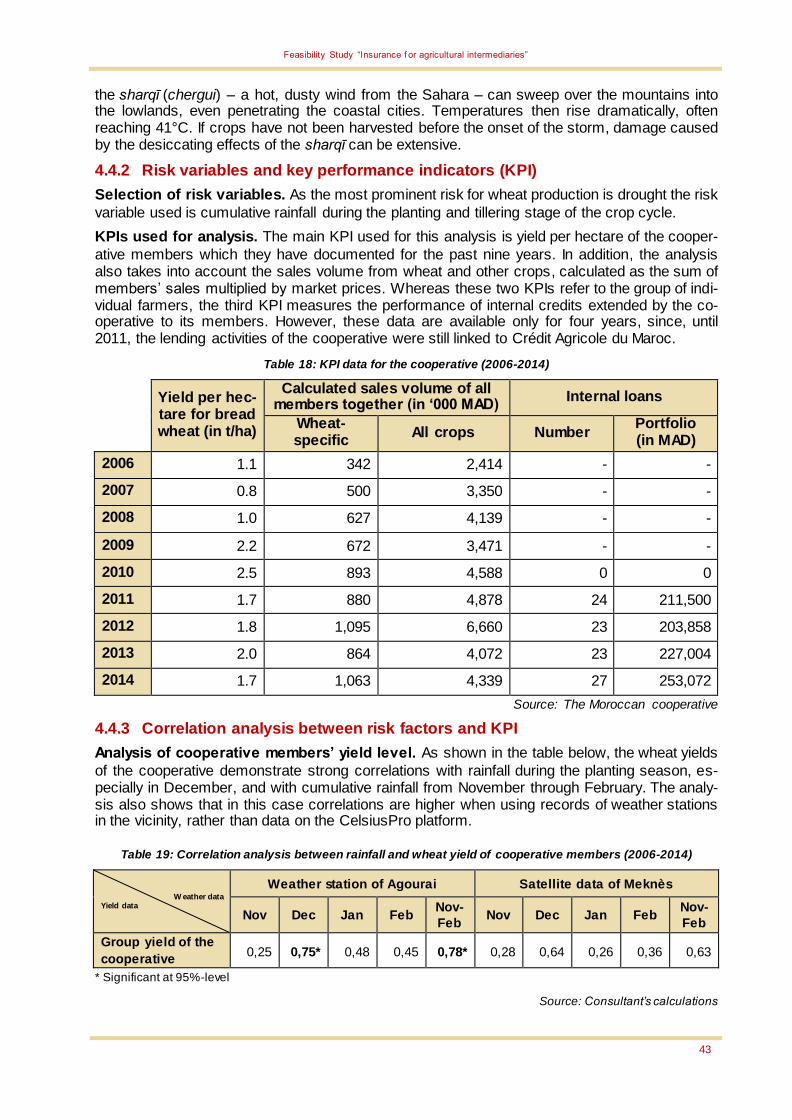
Feasibility Study “Insurance f or agricultural intermediaries”
43
the sharqī (chergui) – a hot, dusty wind from the Sahara – can sweep over the mountains into the lowlands, even penetrating the coastal cities. Temperatures then rise dramatically, often reaching 41°C. If crops have not been harvested before the onset of the storm, damage caused by the desiccating effects of the sharqī can be extensive.
4.4.2 Risk variables and key performance indicators (KPI)
Selection of risk variables. As the most prominent risk for wheat production is drought the risk
variable used is cumulative rainfall during the planting and tillering stage of the crop cycle.
KPIs used for analysis. The main KPI used for this analysis is yield per hectare of the cooper-
ative members which they have documented for the past nine years. In addition, the analysis also takes into account the sales volume from wheat and other crops, calculated as the sum of members’ sales multiplied by market prices. Whereas these two KPIs refer to the group of indi-vidual farmers, the third KPI measures the performance of internal credits extended by the co-operative to its members. However, these data are available only for four years, since, until 2011, the lending activities of the cooperative were still linked to Crédit Agricole du Maroc.
Table 18: KPI data for the cooperative (2006-2014)
Yield per hec-tare for bread wheat (in t/ha)
Calculated sales volume of all members together (in ‘000 MAD)
Internal loans
Wheat-specific
All crops Number Portfolio (in MAD)
2006 1.1 342 2,414 - -
2007 0.8 500 3,350 - -
2008 1.0 627 4,139 - -
2009 2.2 672 3,471 - -
2010 2.5 893 4,588 0 0
2011 1.7 880 4,878 24 211,500
2012 1.8 1,095 6,660 23 203,858
2013 2.0 864 4,072 23 227,004
2014 1.7 1,063 4,339 27 253,072
Source: The Moroccan cooperative
4.4.3 Correlation analysis between risk factors and KPI
Analysis of cooperative members’ yield level. As shown in the table below, the wheat yields
of the cooperative demonstrate strong correlations with rainfall during the planting season, es-pecially in December, and with cumulative rainfall from November through February. The analy-sis also shows that in this case correlations are higher when using records of weather stations in the vicinity, rather than data on the CelsiusPro platform.
Table 19: Correlation analysis between rainfall and wheat yield of cooperative members (2006-2014)
W eather data Yield data
Weather station of Agourai Satellite data of Meknès
Nov Dec Jan Feb Nov-
Feb Nov Dec Jan Feb
Nov-
Feb
Group yield of the
cooperative 0,25 0,75* 0,48 0,45 0,78* 0,28 0,64 0,26 0,36 0,63
* Significant at 95%-level
Source: Consultant’s calculations
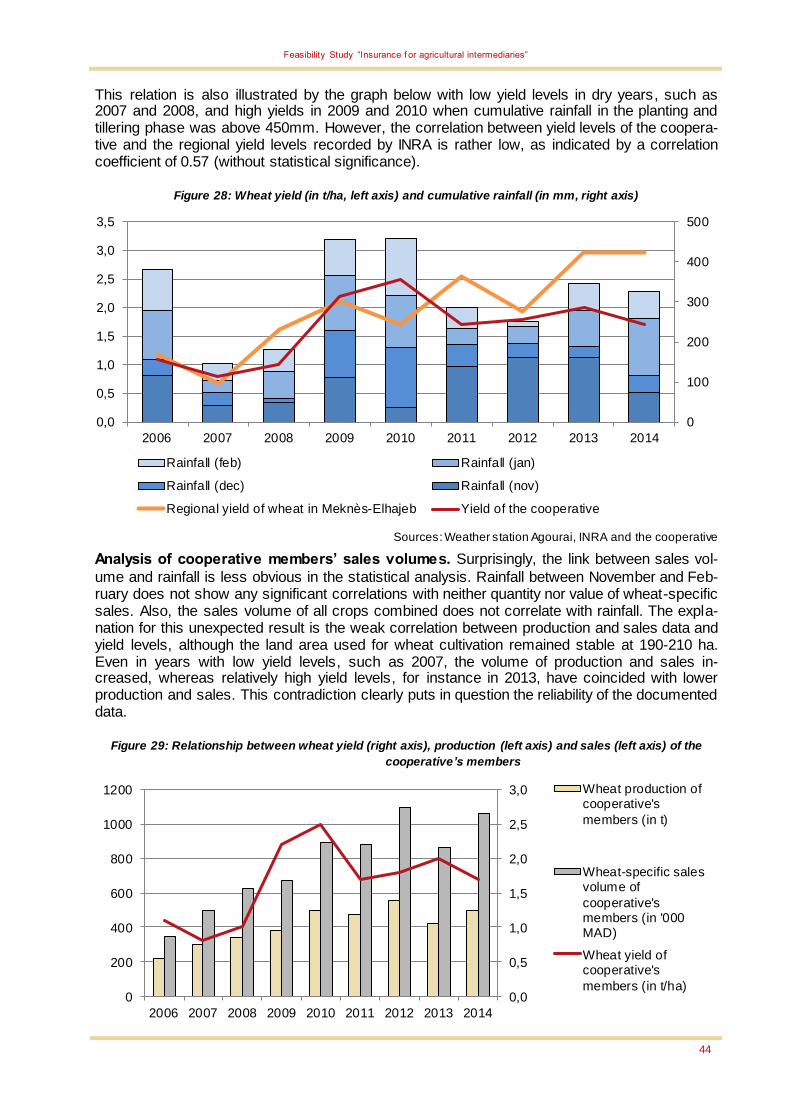
Feasibility Study “Insurance f or agricultural intermediaries”
44
This relation is also illustrated by the graph below with low yield levels in dry years, such as 2007 and 2008, and high yields in 2009 and 2010 when cumulative rainfall in the planting and tillering phase was above 450mm. However, the correlation between yield levels of the coopera-tive and the regional yield levels recorded by INRA is rather low, as indicated by a correlation coefficient of 0.57 (without statistical significance).
Figure 28: Wheat yield (in t/ha, left axis) and cumulative rainfall (in mm, right axis)
Sources: Weather station Agourai, INRA and the cooperative
Analysis of cooperative members’ sales volumes. Surprisingly, the link between sales vol-
ume and rainfall is less obvious in the statistical analysis. Rainfall between November and Feb-ruary does not show any significant correlations with neither quantity nor value of wheat-specific sales. Also, the sales volume of all crops combined does not correlate with rainfall. The expla-nation for this unexpected result is the weak correlation between production and sales data and yield levels, although the land area used for wheat cultivation remained stable at 190-210 ha. Even in years with low yield levels, such as 2007, the volume of production and sales in-creased, whereas relatively high yield levels, for instance in 2013, have coincided with lower production and sales. This contradiction clearly puts in question the reliability of the documented data.
Figure 29: Relationship between wheat yield (right axis), production (left axis) and sales (left axis) of the
cooperative’s members
0
100
200
300
400
500
0,0
0,5
1,0
1,5
2,0
2,5
3,0
3,5
2006 2007 2008 2009 2010 2011 2012 2013 2014
Rainfall (feb) Rainfall (jan)
Rainfall (dec) Rainfall (nov)
Regional yield of wheat in Meknès-Elhajeb Yield of the cooperative
0,0
0,5
1,0
1,5
2,0
2,5
3,0
0
200
400
600
800
1000
1200
2006 2007 2008 2009 2010 2011 2012 2013 2014
Wheat production ofcooperative's
members (in t)
Wheat-specific salesvolume of
cooperative'smembers (in '000MAD)
Wheat yield ofcooperative's
members (in t/ha)
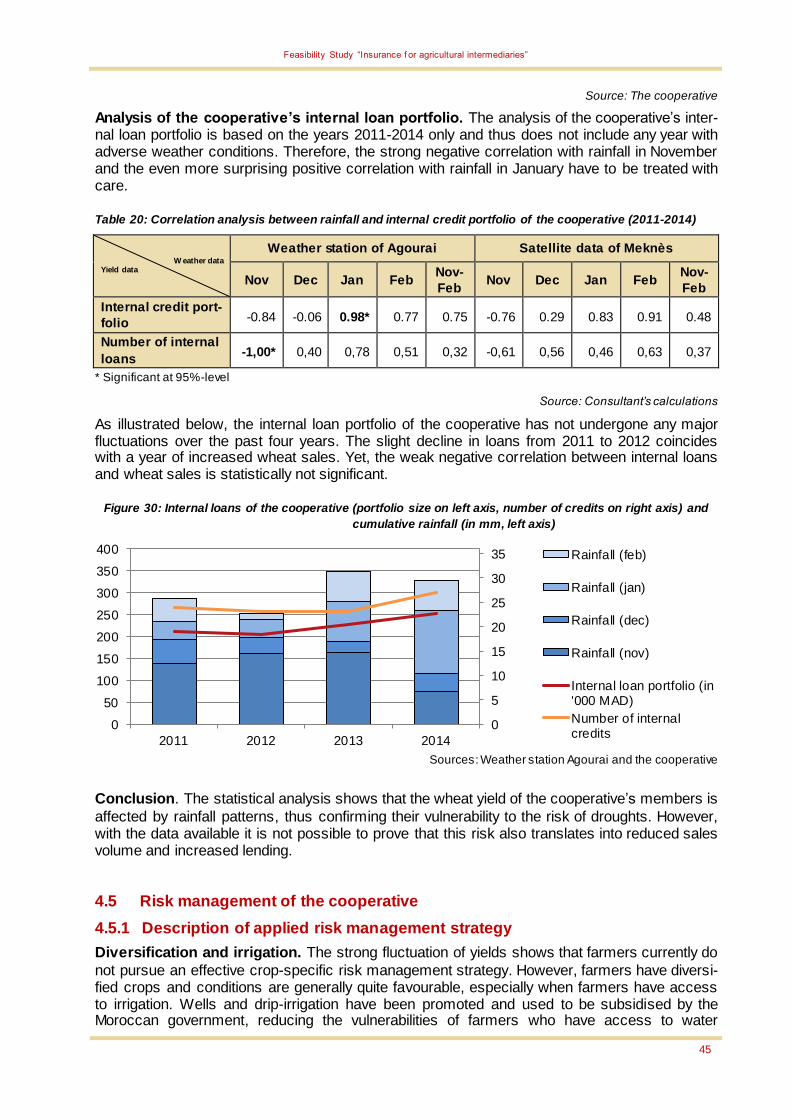
Feasibility Study “Insurance f or agricultural intermediaries”
45
Source: The cooperative
Analysis of the cooperative’s internal loan portfolio. The analysis of the cooperative’s inter-nal loan portfolio is based on the years 2011-2014 only and thus does not include any year with adverse weather conditions. Therefore, the strong negative correlation with rainfall in November and the even more surprising positive correlation with rainfall in January have to be treated with care.
Table 20: Correlation analysis between rainfall and internal credit portfolio of the cooperative (2011-2014)
W eather data Yield data
Weather station of Agourai Satellite data of Meknès
Nov Dec Jan Feb Nov-
Feb Nov Dec Jan Feb
Nov-
Feb
Internal credit port-
folio -0.84 -0.06 0.98* 0.77 0.75 -0.76 0.29 0.83 0.91 0.48
Number of internal
loans -1,00* 0,40 0,78 0,51 0,32 -0,61 0,56 0,46 0,63 0,37
* Significant at 95%-level
Source: Consultant’s calculations
As illustrated below, the internal loan portfolio of the cooperative has not undergone any major fluctuations over the past four years. The slight decline in loans from 2011 to 2012 coincides with a year of increased wheat sales. Yet, the weak negative correlation between internal loans and wheat sales is statistically not significant.
Figure 30: Internal loans of the cooperative (portfolio size on left axis, number of credits on right axis) and
cumulative rainfall (in mm, left axis)
Sources: Weather station Agourai and the cooperative
Conclusion. The statistical analysis shows that the wheat yield of the cooperative’s members is
affected by rainfall patterns, thus confirming their vulnerability to the risk of droughts. However, with the data available it is not possible to prove that this risk also translates into reduced sales volume and increased lending.
4.5 Risk management of the cooperative
4.5.1 Description of applied risk management strategy
Diversification and irrigation. The strong fluctuation of yields shows that farmers currently do
not pursue an effective crop-specific risk management strategy. However, farmers have diversi-fied crops and conditions are generally quite favourable, especially when farmers have access to irrigation. Wells and drip-irrigation have been promoted and used to be subsidised by the Moroccan government, reducing the vulnerabilities of farmers who have access to water
0
5
10
15
20
25
30
35
0
50
100
150
200
250
300
350
400
2011 2012 2013 2014
Rainfall (feb)
Rainfall (jan)
Rainfall (dec)
Rainfall (nov)
Internal loan portfolio (in'000 MAD)
Number of internalcredits

Feasibility Study “Insurance f or agricultural intermediaries”
46
sources. However, the rain-fed agriculture zones (bour) remain exposed to drought and not all areas can be irrigated. Farmers report cultivating not only cereals (wheat, durum, barley, oat, corn) but also vegetables (onions, potatoes, garlic, chickpeas, fava beans and tomatoes) and orchards (peaches and olives) as well as fodder (alfalfa). Furthermore, farmers own cattle and sufficient land in order to rotate crops (wheat every two to three years). The cooperative’s farm-ers own between 10 and 14 ha on average and hold land titles. They have diversified produc-tion, with 0.5 to 2 ha being allocated to each crop. Vegetable production is less risky, as culti-vated areas can be irrigated and production cycles are shorter. Therefore, a poor harvest can be offset by the next cycle. The farmers interviewed derive about 60% of their income from veg-etables production.
Residual risks. The diversification of the cultivated crops and access to irrigation enables
farmers belonging to this cooperative to reduce their vulnerability to weather and production risks. However, despite crop diversification their incomes are affected in the case of adverse event; the farmers therefore remain exposed as they have no formal coping mechanism to pro-tect their income levels.
Market and pest risks. Market risk is comparatively small. There are a number of established marketing channels: farmers sell approximately 50% through middlemen, 20% through the agri-cultural cooperative (coopérative agricole marocaine), and 30% on weekly markets. In order to address the technical challenges and pest/diseases issues, farmers have access to technical assistance through ONCA and private technical assistance providers for a fee. Even if their pro-duction practices leave space for improvement, they have already begun to adapt them to better cope with risks:
Early soil preparation in order to capture as much precipitation as possible Late sowing to avoid frost in March during flowering in frost-prone zones
Utilisation of drought-resistant seeds and inputs that are adapted to climatic conditions
Anti-hail systems
Cattle-rearing to complement income generation
Multi-peril crop insurance cover purchase (note: even though this option was mentioned during the discussion with farmers, none of the farmers interviewed had purchased insur-ance cover for the ongoing crop cycle).
4.5.2 SWOT analysis of agricultural risk management
Strengths
Cooperative is well integrated into mar-kets, thus reducing market and price risks
Diversified production and high income levels
Weaknesses
No active risk management carried out by the cooperative
Low cohesion among the cooperative’s members who do not perform many ac-tivities collaboratively
Limited understanding of insurance mechanisms among the cooperative’s members
Opportunities
Use of existing drought insurance on an individual basis
Technical assistance bundle
Redesign of cooperative benefits, includ-ing access to insurance (MAMDA or other cover) through the cooperative
No MAMDA staff present in the region
Threats
Droughts and other major climatic events threaten the livelihood of the farmers
Aging membership of the cooperative and possible dismantlement of the coopera-tive
The image of cooperatives is not positive
Poor opinion of MAMDA among farmers

Feasibility Study “Insurance f or agricultural intermediaries”
47
4.6 Recommendations for improved risk management and potential of meso-level insurance
The individual as main risk bearer. The analysis has not revealed any financial risks related
to weather conditions at the level of the cooperative as a unit. However, the members of the cooperative have experienced reduced wheat yields in years with insufficient rainfall during the planting and tillering season. So far, no common risk has been borne at the cooperative level which may change once the cooperative decides to disburse more internal loans in years of hardship.
Low cohesion level of agricultural cooperatives. The Moroccan cooperatives are much weaker than they used to be. Until the agrarian reform and the liberalisation of markets, the co-operatives were central to both farmers’ livelihoods and national policies. The transition to a market-led economy in the agricultural sector and the absence of policies to frame their activi-ties have made the cooperatives less relevant for farmers (except in the dairy value chain). In addition, poor governance and the utilisation of subsidies have affected the image of coopera-tives negatively. While some cooperatives still provide support and benefits to their members, the selected cooperative illustrates the common situation of members working independently, with no tangible joint cooperative project. A meso-level insurance project would require, as a pre-requisite, involving more cohesive groups and creating a conducive and positive coopera-tive environment for farmers. Cooperatives should exhibit trust, cohesion, good governance and adequate human capital in order to support the development of a meso-product. As of 2015, the cooperative does not match these criteria and would need strengthening, targeted cooperative project development and enabling policies to be a candidate for a meso-cover.
Possibility of involving the cooperative in the MAMDA insurance scheme. Morocco does
not lack agricultural insurance experience. Yet, the members of the selected cooperative do currently not subscribe to any MADMA policy and therefore cope with the risks through produc-tion techniques and other informal coping mechanisms. Since they self-finance their crop cy-cles, no distribution channel is available to them to access insurance cover at the individual lev-el. Even for farmers with medium-term loans for large agricultural equipment, the financial in-termediaries have no incentives to offer and service MAMDA’s agricultural insurance products. Moreover, the farmers do not have information on MAMDA’s current offers, nor do they have a favourable image of MAMDA’s services. The current lack of information on agricultural insur-ance and access to quality services may hamper the development of comparable products. The cooperative could fill the gap in terms of distribution channels, provided better services and in-formation are made available.
Strengthening the position of cooperatives and their role in insurance. In the current Mo-
roccan context, the development of new products or expanded penetration of agricultural insur-ance requires the following, prior to any development of services through or to the cooperatives:
Support for the cooperative from the Ministry of Agriculture and ODCO in order to ensure good governance, relevance of the benefits for the cooperative’s membership and target-ed national policies: the development and application of a new framework for cooperatives
Review of current MAMDA and government processes in order to improve governance, transparency, individual agricultural insurance cover information, outreach and service quality
Two options could be envisioned if cooperatives were to be leveraged:
1) The cooperative could be used as is, as a distribution channel only, enabling sales to groups of farmers and premium collection: An improved version of current products for individual cover could be sold through the
cooperative, on a voluntary or compulsory basis.
Group covers could be designed and sales could target cooperatives with different operation modes (e.g. those with or without credit facilitating services) or located in other areas of Morocco with different exposure or crop patterns (e.g. no diversification of production).

Feasibility Study “Insurance f or agricultural intermediaries”
48
2) MAMDA or other commercial insurers could design new products targeting cooperatives as groups of farmers:
If cohesion among farmers and governance were addressed, meso-level insurance products could be sold to cooperatives (e.g. in case of drought, wind or yield loss ob-served at the district level) which would then be re-distributed among members based
on rules established by the cooperative’s members.25 This option, while challenging, may trigger interest in membership and, on a forward-looking note, long-lasting un-derstanding of risk pooling mechanisms.
25 Refer to Uplift health mutual experience in India for claims process.
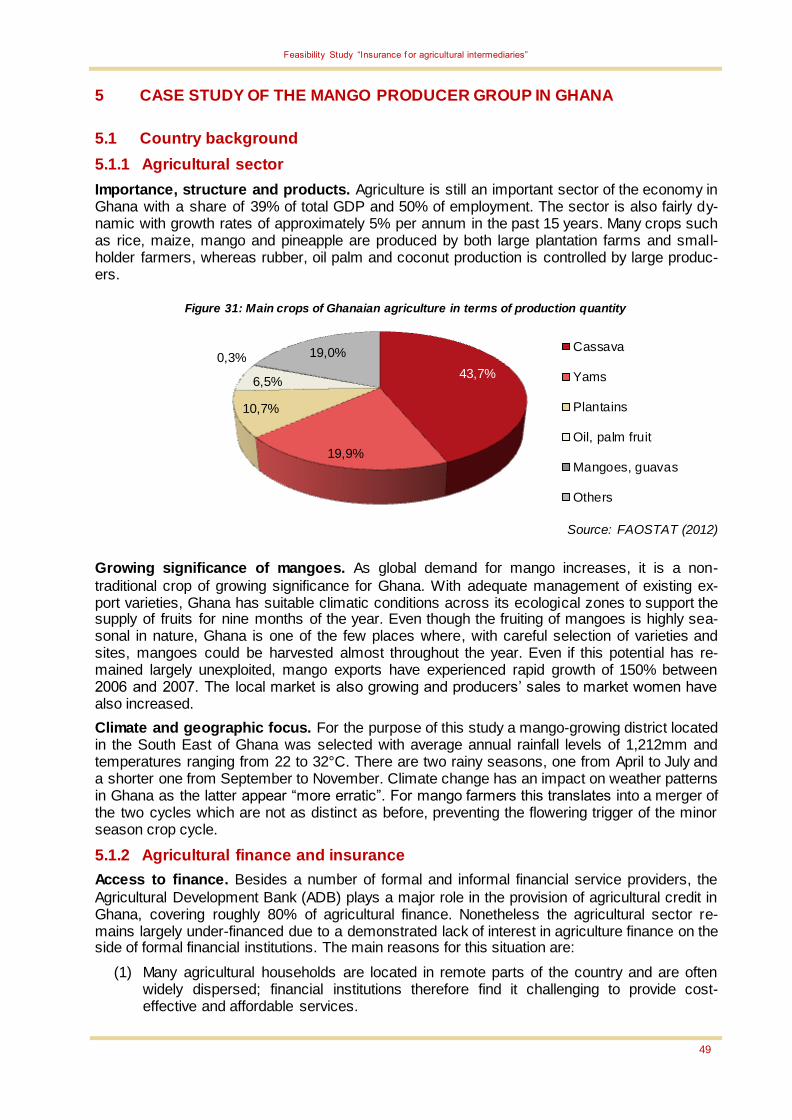
Feasibility Study “Insurance f or agricultural intermediaries”
49
5 CASE STUDY OF THE MANGO PRODUCER GROUP IN GHANA
5.1 Country background
5.1.1 Agricultural sector
Importance, structure and products. Agriculture is still an important sector of the economy in Ghana with a share of 39% of total GDP and 50% of employment. The sector is also fairly dy-namic with growth rates of approximately 5% per annum in the past 15 years. Many crops such as rice, maize, mango and pineapple are produced by both large plantation farms and small-holder farmers, whereas rubber, oil palm and coconut production is controlled by large produc-ers.
Figure 31: Main crops of Ghanaian agriculture in terms of production quantity
Source: FAOSTAT (2012)
Growing significance of mangoes. As global demand for mango increases, it is a non-
traditional crop of growing significance for Ghana. With adequate management of existing ex-port varieties, Ghana has suitable climatic conditions across its ecological zones to support the supply of fruits for nine months of the year. Even though the fruiting of mangoes is highly sea-sonal in nature, Ghana is one of the few places where, with careful selection of varieties and sites, mangoes could be harvested almost throughout the year. Even if this potential has re-mained largely unexploited, mango exports have experienced rapid growth of 150% between 2006 and 2007. The local market is also growing and producers’ sales to market women have also increased.
Climate and geographic focus. For the purpose of this study a mango-growing district located in the South East of Ghana was selected with average annual rainfall levels of 1,212mm and temperatures ranging from 22 to 32°C. There are two rainy seasons, one from April to July and a shorter one from September to November. Climate change has an impact on weather patterns in Ghana as the latter appear “more erratic”. For mango farmers this translates into a merger of the two cycles which are not as distinct as before, preventing the flowering trigger of the minor season crop cycle.
5.1.2 Agricultural finance and insurance
Access to finance. Besides a number of formal and informal financial service providers, the
Agricultural Development Bank (ADB) plays a major role in the provision of agricultural credit in Ghana, covering roughly 80% of agricultural finance. Nonetheless the agricultural sector re-mains largely under-financed due to a demonstrated lack of interest in agriculture finance on the side of formal financial institutions. The main reasons for this situation are:
(1) Many agricultural households are located in remote parts of the country and are often widely dispersed; financial institutions therefore find it challenging to provide cost-effective and affordable services.
43,7%
19,9%
10,7%
6,5%
0,3% 19,0% Cassava
Yams
Plantains
Oil, palm fruit
Mangoes, guavas
Others
Feasibility Study “Insurance f or agricultural intermediaries”
50
(2) Large segments of the agricultural population are subject to the same weather and cli-mate risks, making it hard for providers of financial services to hedge risks or operate profitable insurance pools.
(3) Service providers, mainly urban-based, do not understand the business of agriculture sufficiently and are therefore not able to devise profitable financial products.
(4) Most small agricultural producers in Ghana have only basic education and limited under-standing of modern banking institutions.
Bank loans are perceived to be very expensive with interest rates between 20 and 35% p.a., processes are lengthy, and assets such as houses and land are required as collateral . There-fore, most mango farmers do not take loans for their farming activities.
Agricultural insurance. Since 2011, the Ghana Agricultural Insurance Pool (GAIP) has provid-
ed agricultural insurance for Ghanaian producers. It has developed the first agricultural insur-ance products for the country and now provides a risk management tool for coping with the ad-verse effects of climate change and other risks related to agricultural production. The array of products includes drought index insurance for maize, soy beans, sorghum and millet, as well as multi-peril crop insurance tailor-made to cover the various risks experienced by commercial farmers and plantations. In 2013, GAIP successfully piloted an area-yield index insurance prod-uct. The product is sold to farmers individually through financial institutions, agriculture-related NGOs and farmers-based-organisations. In 2011, the first Weather Index Insurance (WII, thus the drought index insurance product) product for maize was sold through three financial institu-tions and one research organisation in Northern Ghana, covering more than 3,000 smallholder farmers. In October 2012, 136 farmers in the northern region received pay-outs under the drought insurance programme – the country’s first compensation for crop losses due to a short-fall in rain.
Selection of intermediary. The selected institution is a producer group with 124 farmers which
has been registered as a limited liability company since 2005. It is one of the largest mango producer groups in Ghana with a total acreage of 1,089. The group combines both small-scale mango farms with less than 8 acres and larger farms with up to 220 acres.
5.2 Institutional profile of the producer group
5.2.1 Brief description
Organisational structure. The mango farmers’ association was established with the vision to
become a leading supplier of high-quality mangoes for both the domestic and international mar-kets. The mission is defined as: “To provide support services to members and other mango farmers with the view of contributing substantially to growth and development of the Mango In-dustry in Ghana.”
Core business. The main purpose of the association is to provide training and demonstrate
good agricultural practices (GAP) to the farmers: timely pruning, timely flower induction, control of stone weevil, fertilisation of mango trees, control of anthracnose-fungal disease, control of the fruit fly and harvesting of fruits of high quality for the local and international markets. Members are trained in various production and management skills for international certification and the association undergoes the annual global GAP certification and is duly certified. In addition, the association assists its members in selling their produce and negotiates minimum prices for the group as a whole instead of promoting individual marketing.
Marketing channels. Produce from member is sold through the association, for example, to
Bomarts, Blue Skies and Bassam, which are among the major processors of mango in the country. Some larger export companies such as EVE-LYN FARMS support some of the small scale farmers by pre-financing their costs of production and by developing an outgrowing rela-tionship whereby they agree in advance to buy the produce from the farmers.

Feasibility Study “Insurance f or agricultural intermediaries”
51
Partnerships and cooperation. A number of NGOs and donor programmes have supported the association, most notably USAID and GIZ, by providing capacity building for the members in order to improve their production skills.
5.2.2 Detailed description of agricultural sector exposure
Geographic scope. The production area of the farmers’ association is concentrated in the prov-ince of Yilo Krobo in the South East of Ghana.
Prices. The prices are negotiated based on an on-site assessment of the quality of fruits. The
sales price trend achieved by the association over the past eight years has been consistently positive.
Table 21: Farm gate prices for mangoes in the focus province (2007-2014)
Year 2007 2008 2009 2010 2011 2012 2013 2014
Major season price 0.47 0.50 0.55 0.60 0.67 0.70 0.80 0.90
Source: Interview with farmers
5.3 Agricultural risk analysis
5.3.1 Major risks for the mango value chain
Overall challenges. Even though the mango plant grows in annual rainfall regimes ranging
from 250mm to over 1500mm, it requires dry weather for flowering and fruiting. Heavy rains during flowering lead to a reduction in pollination (mainly by insects), fruit set and fruit matura-tion. The crop grows in a wide variety of soil textures but does not withstand waterlogged soil conditions. A soil pH between 5.5 and 7.5 is the optimum, with a high Carbon/Nitrogen (C/N) ratio promoting floral induction. Optimum growth temperature ranges from 24 to 30°C. In Gha-na, the mango industry faces a number of challenges, such as poor access to credit due to high perceived risk (natural and/or man-made associated with the production cycle) and poor post-harvest management practices. Other challenges include inadequate logistics and infrastructure (roads, pack houses, etc.), pest and disease infestation (see below) and limited market access. In recent times, established plantations have been confronted with serious production challeng-es, such as inconsistent flowering, reduced flowering intensity and reduced fruit set, possibly caused by seasonal weather variability. Declining soil fertility, in particular with regard to the Carbon/Nitrogen (C/N) ratio, can also lead to reduced flowering and fruit set. In addition, irriga-tion is not well-developed and most farms produce under rain-fed conditions.
Weather risks at the flowering stage. One of the major climatic problems for mangoes in
Ghana is related to flowering: mango trees require a clear environmental signal to stop growing and start flowering. In most cases this signal is low soil moisture. If, as a result of excessive rain (and other factors like temperature and relative humidity), these signals are not given, the plant will continue to grow and abort flowering. Therefore, the largest single loss of potential yield is caused by non-flowering trees due to the inter-seasonal variance in soil conditions at flowering. The second major climate-related source of potential loss is anthracnose-caused flower mortali-ty. Heavy precipitation combined with high humidity and unfavourable temperature conditions leads to fungal infestation of the flowers. If this scenario persists during flower development, flower mortality will likely be high.
Other risks. Additional pests and diseases, in particular, rust mite, bacterial problems, canker,
stone weevil, and fruit flies have a negative impact on the quality of mango production. Farmers usually have poor control of pest, also due to low technical skills, entailing negative effects on fruit appearance and quality which are the main drivers of demand and price. Prices are set based on the quality as well as on the quantity of fruits available regionally and nationally. Therefore prices vary every year and from one season to the other. Lack of storage and ade-quate transportation adds to the risk of lower production quality, which is an issue for both in-
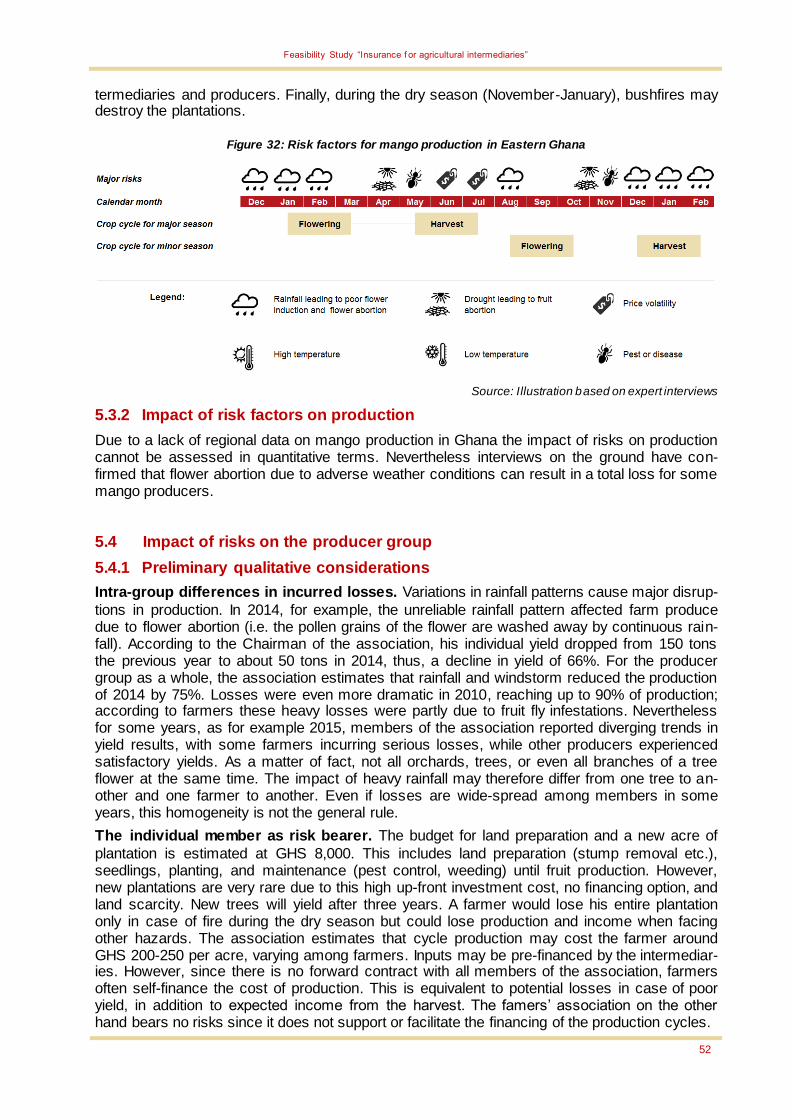
Feasibility Study “Insurance f or agricultural intermediaries”
52
termediaries and producers. Finally, during the dry season (November-January), bushfires may destroy the plantations.
Figure 32: Risk factors for mango production in Eastern Ghana
Source: Illustration based on expert interviews
5.3.2 Impact of risk factors on production
Due to a lack of regional data on mango production in Ghana the impact of risks on production cannot be assessed in quantitative terms. Nevertheless interviews on the ground have con-firmed that flower abortion due to adverse weather conditions can result in a total loss for some mango producers.
5.4 Impact of risks on the producer group
5.4.1 Preliminary qualitative considerations
Intra-group differences in incurred losses. Variations in rainfall patterns cause major disrup-
tions in production. In 2014, for example, the unreliable rainfall pattern affected farm produce due to flower abortion (i.e. the pollen grains of the flower are washed away by continuous rain-fall). According to the Chairman of the association, his individual yield dropped from 150 tons the previous year to about 50 tons in 2014, thus, a decline in yield of 66%. For the producer group as a whole, the association estimates that rainfall and windstorm reduced the production of 2014 by 75%. Losses were even more dramatic in 2010, reaching up to 90% of production; according to farmers these heavy losses were partly due to fruit fly infestations. Nevertheless for some years, as for example 2015, members of the association reported diverging trends in yield results, with some farmers incurring serious losses, while other producers experienced satisfactory yields. As a matter of fact, not all orchards, trees, or even all branches of a tree flower at the same time. The impact of heavy rainfall may therefore differ from one tree to an-other and one farmer to another. Even if losses are wide-spread among members in some years, this homogeneity is not the general rule.
The individual member as risk bearer. The budget for land preparation and a new acre of
plantation is estimated at GHS 8,000. This includes land preparation (stump removal etc.), seedlings, planting, and maintenance (pest control, weeding) until fruit production. However, new plantations are very rare due to this high up-front investment cost, no financing option, and land scarcity. New trees will yield after three years. A farmer would lose his entire plantation only in case of fire during the dry season but could lose production and income when facing other hazards. The association estimates that cycle production may cost the farmer around GHS 200-250 per acre, varying among farmers. Inputs may be pre-financed by the intermediar-ies. However, since there is no forward contract with all members of the association, farmers often self-finance the cost of production. This is equivalent to potential losses in case of poor yield, in addition to expected income from the harvest. The famers’ association on the other hand bears no risks since it does not support or facilitate the financing of the production cycles.

Feasibility Study “Insurance f or agricultural intermediaries”
53
5.4.2 Risk variables and key performance indicators (KPI)
Selection of risk variables. The analysis below focuses on the risk of excessive rainfall which
is recognised by the association as a cause of high losses in mango production. From a mete-orological point of view, defining a day with excessive rainfall is much more complex than defin-ing a drought. The duration and intensity of rainfall have to be taken into consideration in addi-tion to plant sensitivity to excess water stress. According to the farmers, even a little shower can cause flower abortion but the damage caused by major rainfall is still expected to be more sig-nificant. In the example of India, the trigger chosen to protect mango producers is rainfall during two consecutive days, the first day in excess of 35mm plus and on the subsequent days more than 5mm. Yet, the trigger for the first day depends on the location and can vary between 25mm and 40mm. In the following analysis, the definition used for a day with excessive rainfall is more than 30mm/day.
KPIs used for analysis. As the farmers’ association has no documentation of its historical
yields, the data used for this analysis are based on the association’s estimates and cross-checks with actual yield records maintained by four individual members over the past four years. Despite smaller differences between the two sources, they showed the same trends. In the absence of data on the association’s sales volume we obtained data from the outgrower scheme of an export company on the quantities purchased from selected members of the asso-ciation over the past five years. As the number of farmers contracted by this export company varies each year the quantity purchased was analysed in relation to the total acreage of con-tracted farms in the respective year.
Table 22: KPI data of the farmers’ association (2010-2014)
Average yield (t/acre)
Minor season sales to the export company
Estimate Cross-check with
four members Sales (in t)
Size of contracted farms (in acres)
2010 0.2 0.5 20.1 26
2011 2.3 1.1 14.3 15
2012 2.9 2.5 37.9 36
2013 3.6 3.0 51.6 45
2014 0.9 1.3 27.8 47
Source: The mango farmers’ association
5.4.3 Correlation analysis between risk factors and KPI
Analysis of members’ yield levels. The correlation analysis shows that the estimated yield of
the association’s farmers correlates negatively with the event of excessive rainfall between mid-August and the beginning of October. However, this correlation can only be established with satellite data but not with data obtained from the weather station in Somanya which has been operating on an automated system since January 2012. There are no indications that the data recorded are not reliable.

Feasibility Study “Insurance f or agricultural intermediaries”
54
Table 23: Correlation analysis between mango yield of the association (2010-2014) and days with excessive
rainfall (>30mm) between mid-August and beginning of October
Weather station of Somanya Satellite data of CelsiusPro
Estimated yield of the associ-
ation -0.25 -0.93*
Actual average yield of inter-
viewed farmers -0.34 -0.68
* Significant at 95%-level
Source: Consultants’ calculations
Analysis of members’ sales to the export company. In normal years, contracted farmers sell
between 0.9t and 1.1t per acre of their minor season production to the export company. Yet, the sales per acre in 2010 and 2014 were significantly lower at 0.8t and 0.6t respectively. Again, these variations in sales only correlate with satellite data of CelsiusPro but not with weather station data.
Table 24: Correlation analysis between members’ mango sales to the export company (2010-2014) and days
with excessive rainfall (>30mm) between mid-August and beginning of October
Weather station of Somanya Satellite data of CelsiusPro
Minor season sales to the
export company 0,10 -0,90*
* Significant at 95%-level
Source: Consultants’ calculations
Conclusion and financial implications. Despite the high correlation between CelsiusPro data
and mango yields as well as farmers’ sales volumes, this result is highly questionable due to substantial discrepancies with weather station data. Furthermore, the definition of a suitable trigger would require additional historical data. Yet, the financial loss in case of reduced yield is substantial, borne by each farmer individually rather than by the association. According to the association’s estimations and documented farm gate prices, the combined losses of all mem-bers of the association in 2010 and 2014, amounted to USD 1,074,317 and USD 1,197,675 re-spectively as illustrated below.
Figure 33: Mango yields and sales growth of the association and days with excessive rainfall in Somanya
(2010-2014)
Source: Mango farmers’ association, export company, CelsiusPro data
0,0
0,5
1,0
1,5
2,0
2,5
3,0
3,5
4,0
2010 2011 2012 2013 2014
Days with excessive rainfall(>30mm) between mid-August and beginning ofOctober (CelsiusPro)
Estimated yield of YiloKrobo (t/acre)
Actual average yield of fourinterviewed Yilo Krobofarmers
Yilo Krobo's minor seasonsales per acre to Eve-Lynfarms
Years with flower abortion as reported by the association
Members' estimated financial loss:
1,197,675 USD
Members' estimated financial loss:
1,074,317 USD
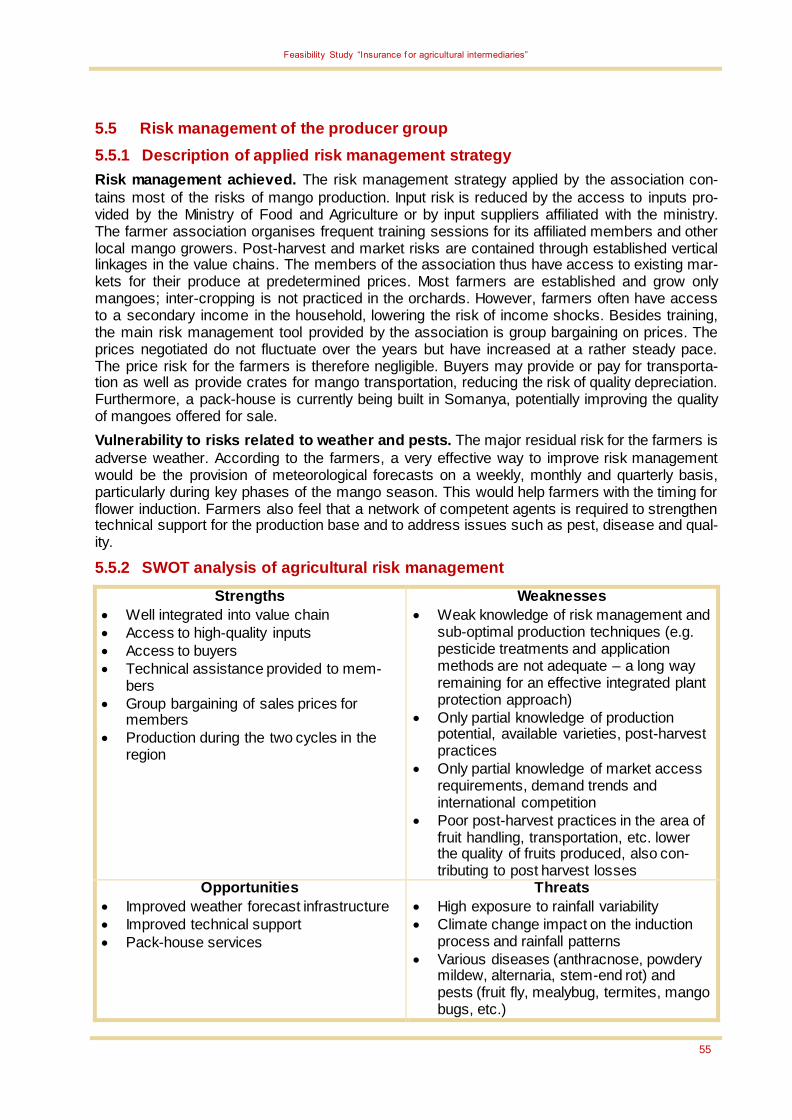
Feasibility Study “Insurance f or agricultural intermediaries”
55
5.5 Risk management of the producer group
5.5.1 Description of applied risk management strategy
Risk management achieved. The risk management strategy applied by the association con-
tains most of the risks of mango production. Input risk is reduced by the access to inputs pro-vided by the Ministry of Food and Agriculture or by input suppliers affiliated with the ministry. The farmer association organises frequent training sessions for its affiliated members and other local mango growers. Post-harvest and market risks are contained through established vertical linkages in the value chains. The members of the association thus have access to existing mar-kets for their produce at predetermined prices. Most farmers are established and grow only mangoes; inter-cropping is not practiced in the orchards. However, farmers often have access to a secondary income in the household, lowering the risk of income shocks. Besides training, the main risk management tool provided by the association is group bargaining on prices. The prices negotiated do not fluctuate over the years but have increased at a rather steady pace. The price risk for the farmers is therefore negligible. Buyers may provide or pay for transporta-tion as well as provide crates for mango transportation, reducing the risk of quality depreciation. Furthermore, a pack-house is currently being built in Somanya, potentially improving the quality of mangoes offered for sale.
Vulnerability to risks related to weather and pests. The major residual risk for the farmers is
adverse weather. According to the farmers, a very effective way to improve risk management would be the provision of meteorological forecasts on a weekly, monthly and quarterly basis, particularly during key phases of the mango season. This would help farmers with the timing for flower induction. Farmers also feel that a network of competent agents is required to strengthen technical support for the production base and to address issues such as pest, disease and qual-ity.
5.5.2 SWOT analysis of agricultural risk management
Strengths
Well integrated into value chain
Access to high-quality inputs
Access to buyers
Technical assistance provided to mem-bers
Group bargaining of sales prices for members
Production during the two cycles in the region
Weaknesses
Weak knowledge of risk management and sub-optimal production techniques (e.g. pesticide treatments and application methods are not adequate – a long way remaining for an effective integrated plant protection approach)
Only partial knowledge of production potential, available varieties, post-harvest practices
Only partial knowledge of market access requirements, demand trends and international competition
Poor post-harvest practices in the area of fruit handling, transportation, etc. lower the quality of fruits produced, also con-tributing to post harvest losses
Opportunities
Improved weather forecast infrastructure
Improved technical support
Pack-house services
Threats
High exposure to rainfall variability
Climate change impact on the induction process and rainfall patterns
Various diseases (anthracnose, powdery mildew, alternaria, stem-end rot) and pests (fruit fly, mealybug, termites, mango bugs, etc.)
Feasibility Study “Insurance f or agricultural intermediaries”
56
5.6 Recommendations for improved risk management and potential of meso-
level insurance
Hedging weather risks. Unlike cooperatives in Morocco, the Ghanaian mango farmers’ asso-
ciation is a cohesive producer group and governance seems acceptable. Farmers meetings take place on a regular basis and the association counts a large number of active members. However, the main risk bearer is still the individual farmer. The case for meso-level insurance is thus fairly weak unless the association is mandated by its member to purchase insurance cover on behalf of the group. In general, the expansion of GAIP to include mango may be feasible. Currently, no cover for mango is offered in Ghana but experience from other countries (e.g. In-dia) suggests that the design of an insurance product for mango producers is possible.
Pest control. Regardless of whether an insurance scheme is feasible at the meso-level, the
problem of pests, in particular fruit flies, will still persist as an index cover cannot address this issue. Accordingly, improved pest control and application of pesticides is essential. While ac-cess to knowhow and pesticides is less of an issue for larger companies, smaller production units such as associations will require external support to upgrade their current pest control practices.
Feasibility Study “Insurance f or agricultural intermediaries”
57
BIBLIOGRAPHY
aBi: Impact Assessment, Kampala, 2014
Malagasy MFI: Annual Reports 2013 and 2012, Antananarivo, 2014 and 2013
Bank of Uganda: Agricultural Finance Yearbook 2013/14, Kampala, 2014
Berdai H., M. Karrou, M.T. Chati, M. Boutfirass and A. Bekaoui: Irrigation water management in Morocco: a review, In: Improving water and land productivities in rainfed systems, M. Karrou, T. Oweis and A. Bahri (ed.), ICARDA, Aleppo, 2011
Harvey C.A., Rakotobe Z.L., Rao N.S., Dave R., Razafimahatratra H., Rabarijohn R.H., Rajao-fara H., MacKinnon J.L.: Extreme vulnerability of smallholder farmers to agricultural risks and climate change in Madagascar; Royal Society, London, 2014
Ugandan microfinance bank: Annual Reports 2013, 2012, 2011, 2010, 2009, Kampala
Economic Policy Research Centre: FinScope Uganda 2013, Kampala, 2014
FAOSTAT: Food and Agriculture Organization of the United Nations, Statistics Division http://faostat3.fao.org
Helgeson, Jennifer, Simon Dietz and Stefan Hochrainer-Stigler: Vulnerability to weather disas-ters: the choice of coping strategies in rural Uganda, CCCEP (Working Paper No. 107) and Grantham Research Institute on Climate Change and the Environment (Working Paper No. 91), London and Leeds, 2012
Ministry of Agriculture of Madagascar: Rice production figures 2001-2014, Statistical Depart-ment of Ministry of Agriculture in Madagascar, Antananarivo, 2015
Opportunity International: An Impact Assessment of Opportunity International’s Agricultural Lending Program in Uganda, Malawi, and Ghana, Opportunity International, 2013
Skees, Jerry; Gober, Stephanie; Varangis, Panos; Lester, Rodney; Kalavakonda, Vijay: Devel-oping rainfall-based index insurance in Morocco, World Bank, Washington, 2001
Uganda Co-operative Alliance (UCA): Feasibility study on agricultural financing in Uganda with focus on agricultural insurance, UCA, Kampala, 2011
USAID: A Climate Trend Analysis of Uganda, FEWS-NET, Kampala, 2012
Van Melle, C., and S. Buschmann: Comparative analysis of Mango Value Chain models in Be-nin, Burkina Faso and Ghana, In: Rebuilding West Africa’s Food Potential, A. Elbehri (ed.), FAO/IFAD, Rome, 2013
World Bank: Building Morocco’s Resilience - Inputs for an Integrated Risk Management Strate-gy, Washington, 2013
World Bank: Malagasy MFI - project results and lessons learned, Agriculture Finance Support Facility, Washington, 2014
World Bank: Expanding Rural Outreach with Low-Cost Delivery Channels, Experience from the Malagasy MFI, Agriculture Finance Support Facility, Washington, 2015
Zakari, Abdallah Khalifa: Ghana - National Mango Study, International Trade Centre, 2012
Imprint
Publisher
KfW Group
KfW Development Bank
Palmengartenstrasse 5-9
60325 Frankfurt am Main, Germany
Telephone +49 69 7431-0
Fax +49 69 7431 2944
www.kfw.de
Editing
Competence Centre Sustainable Economic
Development, Health and Education
Photos
Source: KfW photo archive, Fred Hoogervorst