Embed Size (px)
Citation preview
httpwwwsciforumnetconferencewsf-4
World Sustainability Forum 2014 ndash Conference Proceedings Paper
Material Flow Analysis (MFA) for Liveable Cities
Dexter VL Hunt 1
Joanne M Leach Susan E Lee Chris Bouch Peter Braithwaite
and Christopher DF Rogers 1
1 School of Civil Engineering College of Engineering and Physical Sciences University of
Birmingham Birmingham B152TT UK
E-Mails huntdbhamacuk (DVLH) cdfrogersbhamacuk (CDFR)
jleachbhamacuk (JML) seleebhamacuk (SEL) cbouchbhamacuk (CB)
pbraithwaitebhamacuk (PB)
Author to whom correspondence should be addressed Tel +44-121-414-5148 Fax +44-
121-414-3675
Received 2nd
September 2014 Accepted 29th
October 2014 Published 03 November 2014
Abstract Well-functioning lsquoliveablersquo cities should be sustainable and their
consumption of natural resources and production of waste must fit within the
capacities of the local regional and global ecosystems It is increasingly becoming
suggested that an Urban Metabolism (UM) approach could help city decision-makers
(eg planners) take account of numerous critical influencing factors related to the
inward outward flow(s) of natural resources (eg food water and energy) and
accumulation of waste The paper identifies the precursory step for any UM study
(Mass Flow Analysis - MFA) and applies it to a case study (Birmingham UK) in
order to show how it could contribute to the measurement assessment and
understanding of liveability defined as 80 reduction in carbon (from 1990 levels)
resource secure (an ethos of One planet living) with maintained or enhanced
wellbeing By provided focus upon an individual resource stream (ie water) at
multiple scales (city to individual) it is shown that MFA can be used as a starting point
to develop realistic and radical engineering solutions However further work is
required for it to be truly reflective of broader aspects of urban liveability
Keywords Urban Metabolism Energy Water
OPEN ACCESS
2
1 Introduction
Well-functioning lsquoliveablersquo cities both now and in the future are dependent upon numerous
critical influencing factors including the inward movement of natural resources (for example
food water and energy) in sufficient quantities to meet demand and effective mechanisms for
disposal of waste They must however be sustainable and their consumption of natural resources
and production of waste must fit within the capacities of the local regional and global ecosystems
[1] and operate in the same way as many natural systems do Sustainability however is a
logistically complex goal to achieve and urban planners must consider many influencing factors
and constraints not least significant growth in urban populations (94 of the UK population is
expected to live in cities by 2050 [2] and reduction in global availability of resources per capita
There are undoubtedly issues of governance carbon intensity and wellbeing that must be
addressed both now and in the future therefore barriers to achieving planning goals must be
identified and transformative solutions developed to overcome them [34] Clearly a framework is
required to help planners identify develop and assess such sustainability interventions
Based upon its growing contribution to sustainable urban development issues [56] this paper
explores the feasibility of creating a framework based on techniques developed in and borrowed
from the field of urban metabolism field Urban Metabolism is a modern anthropogenic
metabolism global analysis tool considering linear throughput of biological systems [78] or in
much simpler language it is used to analyse the resource inputs and waste outputs of a system
[45] The first author to use the term lsquoMetabolismrsquo of cities was Abel Wolman in 1965 [9] and
since then the approach has been developed by a few academics for analysing single or multiple
flows into and out of nations and cities Such an approach has rarely if ever been used in policy
development for city planning in the UK and yet we believe it could hold the potential to enhance
and enlighten decision-making therein
The research work presented here is drawn from lsquoLiveable Citiesrsquo httpliveablecitiesorguk
a 5 year (2012-2017) UK Research Council (Engineering and Physical Sciences Research
Council - EPSRC)-funded programme which aims to transform the engineering of cities to
deliver global and societal wellbeing within the context of low carbon living and resource
security In so doing it seeks to develop realistic and radical engineering solutions that
demonstrate the concept of an alternative futurersquo that meet the following criteria
1 80 reduction in carbon (from 1990 levels)
2 Resource secure (an ethos of One planet living)
3 Maintaining or enhancing wellbeing
The underlying six-step methodology is outlined in Section 2 with results being presented in
Section 3 then discussed in Section 4 Conclusions are subsequently drawn in Section 5
3
20 Methodology
The methodology adopted within this paper consists of four clear steps as shown A fuller
description can be found in the respective referenced sections
(1) Identify and classify existing urban metabolism studies (focussing on UK) (Section 21)
(2) Identify the precursory methodology for UM studies (Section 22)
(3) Apply precursory methodology to a city (Birmingham UK) at multiple scales (Section 3)
(4) Discuss methodology based on outcomes (Section 4)
21 Step 1 Identify and classify existing urban metabolism studies (focusing on UK)
The first step within the methodology was to undertake an extensive literature review with the
aim of identifying and classifying UM studies conducted over the last 15 years with a focus
toward highlighting those undertaken for the UK Approximately 150 relevant UM studies were
considered and the following key elements were identified
a) Location(s) adopted
b) Key flow(s) considered
c) Time period(s) covered
d) Methodology tool(s) adopted
e) Data source(s) used
With respect to the above 34 countries had been considered with gt50 cities being analysed in
some form or other The breakdown by region is shown in Figure 1 In total some 22 studies were
identified for the UK undertaken at various scales (Table 1) 12 at national 4 at regional (eg
North West South West etc) 6 at city (eg Manchester Liverpool York London (x3) and
Birmingham) and 1 at development scale (ie Bedzed Sutton)
The most commonly considered resource(s) in the UK studies were materials (ie timber
metals aggregates etc) followed by energy and waste (Figure 2) The least commonly considered
were products followed by food then water The earliest time considered was 1937 and the
longest time span considered was 60 yrs The most recent UM study by Arup in 2006 using IRM
(Integrated Resource Modelling) was of the Thames Gateway
4
32
33
12
15
17
UK
Europe
Americas
Asia
Africa
Australia
Figure 1 Breakdown of regions considered in UM studies
Figure 2 Breakdown of resources considered in Urban Metabolsim studies
The various tools and methodologies adopted across the UK studies seem (on the whole) to be
variations on three approaches MFA (Table 2) LCA (Table 3) and Foot-printing (Table 4) with
everything else being techniques for working with or accounting for data (Table 5) The most
comprehensive datasets for the EU15 (the European Union member countries prior to the
accession of ten candidate countries on the 1st of May 2004) were compiled by Eurostat
[10111213] and OECDrsquos Inventories of Country Activities [141516]
5
Table 1 Urban metabolism studies undertaken for the UK in the last 15 years
(Resources refer to CO2 Energy Materials Waste Food Water Land use Transport and Tourism)
Region(s) Year Assessment(s) Tools
(see Table 2)
Data sources
(see Table 3) Reference(s)
Wales ndash Cardiff 2004
Resources MFA EF ONS FAO BGS Welsh Executive [1718 19]
Scotland - Angus Aberdeen Dundee
Edinburgh Glasgow Inverness
2002 2003
2004
Resources Land use Transport Tourism MFA EF ONS FAO BGS SEPA Scottish
Executive
[212223]
UK 1937-1997 Biomass mineral materials fossil materials MFA-BIF Dti BGS Forestry Commission
Agriculture statistics Input output tables
[24]
UK 1970-1999 Resources EMFA ONS PRODCOM EUROSTAT [25]
UK 1970-2000 Resources MFA ONS PRODCOM EUROSTAT [26]
UK 2000 Resources PIOT ONS PRODCOM EUROSTAT [27]
UK 2001 Iron Steel Aluminium MFA-BIF ONS EUROSTAT [28]
UK - 60 UK Cities 2006 Resources EF - [29]
UK 1996-2003 Resources MFA (Eurostat) ONS EUROSTAT [30]
UK 1997-2004 Resources MFA-BIF ONS PRODCOM EUROSTAT [3132]
UK 2002 Resources FLAT ONS PRODCOM EUROSTAT [33]
UK ndash 10 regions 2004 Resources MFA EF REAP v1 [34]
UK 2004 Resources MRIO ONS PRODCOM EUROSTAT [35]
UK 2005 Material and Fossil Fuel MFA
(RCN DMCfossil)
ONS Defra [36]
UK Manchester 2002 Resources - - [37]
UK Manchester ndash Merseyside 2003 Transport MFA EF - [38]
UK Liverpool 2000 Resources EFA - [20]
UK SW England 2001 Resources Land use Transport Tourism MFA EF ONS FAO BGS [39]
UK NW England 1999-2000 Construction Minerals MFA - [4041]
UK York 2001 Resources Land use Transport Tourism MFA EF - [42]
UK Greater London 2000 Direct energy Materials Food Waste MFA EF - [43]
UK London 2001 EFA ES MFA - [44]
UK Thames Gateway 2006 Resources IRM - [45]
UK Birmingham 2004 Ecological Footprint Carbon footprint
Greenhouse gas footprint
EF
CF
REAP v2
ONS DfT AEA Environment Local
Authority data ACORN CACI BERR
Global Footprint Network
[464748]
UK Bedzed Sutton 2001 Construction materials LCA EP - [49]
6
Table 2 UM Analysis methodologies tools applied at UK levels Footprinting
Methodology Description Tools Reference(s)
EF
Ecological
Footprint
Designed as a readily comprehended indicator of the sustainability of the human
economy vis-a`-vis the Earthrsquos remaining lsquonaturalrsquo capacity to supply resources
(sometimes considered equivalent to the planetrsquos terrestrial lsquocarrying capacityrsquo)
The Sustainable Process Index (SPI) is an engineering tool for ecological
evaluation and a member of the ecological footprint family based upon the calculation
of the total land area required by any process technology or other economic activity to
sustainably provide natural material and energy resource flows and maintain waste
assimilation or ldquosinkrdquo services
Ecological footprints have been calculated for more than 140 countries and can be
found in the NFA (National Footprint Accounts)
REAP v1 and v2 (Resources and Energy
Analysis Programme) wwwseisereap
SPIonExcel tool httpspionexceltugrazat
[3450515253545556]
CF
Carbon Footprint
A measure of the total amount of carbon dioxide (CO2) and methane (CH4) emissions
of a defined population system or activity considering all relevant sources sinks and
storage within the spatial and temporal boundary of the population system or activity
of interest Calculated as carbon dioxide equivalent(CO2e) using the relevant 100-year
global warming potential (GWP100)
ISO 14067 (CF - Carbon footprint)
[5758]
WF
Water Footprint
The total volume (Litres) of freshwater used to produce the goods and services
consumed by a defined consumer group (ie individual family village city province
state or nation)
ISO 14046 (WF - Water footprint)
[59]
EM
Environmental
Management
Used to assess the eco-efficiency of product systems A term coined by the World
Business Council for Sustainable Development (WBCSD) in 1992 it measures the
ratio of added value to environmental impact
ISO 14045 [6061]
ES Environmental
Space
The primary function of environmental space (ES) is to quantify or track sustainable
development by comparing resource demands with available lsquoenvironmental spacersquo
(closely linked to notions of lsquocarrying capacityrsquo) or the upper and lower physical
boundaries of the Earthrsquos supply of environmental services that are available and can
be appropriated sustainably by humans
[6162]
7
Table 3 UM Analysis methodologies tools applied at UK levels LCA
Methodology Description Tools Reference(s)
LCA Lifecycle
Assessment
Lifecycle
Inventory
An environmental management tool for identifying (and comparing) the whole
lifecycle or cradle-to-grave environmental impacts of the creation marketing
transport and distribution operation and disposal of specific human artefacts
LCA strives for completeness with as many substances as possible MFA provides
an inventory for LCA for an individual component (eg concrete or steel frames) or a
complete product (eg an automobile)
ISO 140402006 ISO 140442006
ISO 140472012 ISO140492012
EIME V30 EIOLCA tool Environmental
Impact Estimator V302 Ecoinvent waste
disposal inventory tools v10 ReCiPe
Lime2 USEtox ILCD IMPACTworld WRATE (Waste and Resource Assessment)3
WRAP (tool for tracing EEEE appliances)
[61636465666768697071
72]
MIPS Material Intensity
per Unit Service
Involves the identification of a single mass-based measure of the total life-cycle-wide
(or cradle-to-grave) primary material and energy requirement of environmentally
significant economic output in the form of specific products (eg coffee orange juice)
forms of infrastructure or service delivery
Gabi V5 wwwgabi-softwarecomuk-
irelandindex developed to include
economic environmental and social metrics
Umberto V5 httpwwwumbertodeen
[61 7374]
EP
Environmental
Profiling
The Environmental Profiling methodology is a standardised method derived and used
within the UK for identifying and assessing the environmental effects associated with
building materials over their lifecycle - that is their extraction processing use and
maintenance and their eventual disposal
The approach is not dissimilar to the Lifecycle Assessment (LCA) approach
excepting the extension of the approach to use dimensionless unifying values for
impacts (using stakeholder derived weightings) called lsquoEcopointsrsquo
BRE - Environmental Profiling
BRE - Green Guide to Specification
BRE- Eco-points
[75]
8
Table 4 UM Analysis methodologies tools applied at UK levels MFA
Methodology Description Tools Reference(s)
MFA Material Flow
Analysis (See
Section 3)
Developed by Paul Brunner (Vienna University of Technology Austria) lsquoMaterial
flow analysis (MFA) is a systematic assessment of the flows and stocks of
materials within a system defined in space and timersquo Sometimes referred to as
RFA (Resource Flow Analysis) EMFA (Energy and Material Flow Analysis)
MEFA Material and Energy Flow accounting) or EW-MFA (Economy-Wide
material Flow Analysis) Based on system approach and mass balance In essence
this is a book keeping approach to what stays and leaves the anthroposphere MFA
is a suitable forecasting tool for long-term trends in material use and has been used
within Industrial symbiosis Only flows that cross the system boundary are
counted not the flows within the boundary (referred to as lsquostocksrsquo) MFA strives
for transparency and manageability with a limited number of substances
EUROSTAT
IRM (Integrated Resource Modelling ndash
developed by ARUP to track energy and
material flows in order to reduce
environmental impacts)
Main data sources for inputs are
PIOT (Table 5)
NAMEA
[8101112137677787980818283]
EFA Energy Flow
Accounting
Energy Flow Accounting (EFA) aims at the establishment of a complete balance of
energy inputs internal transformations and energy outputs of a society or of a
defined socioeconomic component in a way that is compatible with MFA In
essence it is a measure of human appropriation to nature
See MFA tools [84858687]
SFA Substance Flow
Analysis
Focuses on material flows of just one chemically defined substance (eg nitrogen
and phosphorous chromium mercury lead and other heavy metals carbon water
and organochlorine compounds) or a limited group of such substances through the
metabolism of a relatively extensive predefined geographic region
STAN subSTance flow ANalysis
STAN 113 free tool (developed in
Vienna)
[61]
MFA-BIF Material Flow
Analysis - Bulk
Internal Flow
Developed as material flow balance models that focus on both material inputs and
output flows and stock accumulations induced by the entire societal metabolism of
a given region
[1011121361888990]
MFA
Company-Level
Material Flow Accounting aspects in company-wide or plant-based ldquogate-to-gaterdquo
analyses such as materials bookkeeping eco-balance reports and material-based
eco-auditing
[91]
MMFA
Mathematical
Mass Flow
Analysis
Process-based MFA studies (as above) deliver indicator values for a systemrsquos
characteristics (eg recycling rates) performance (eg resource efficiency rates of
resource depletion) and impacts (eg range of available resource deposits or
landfill capacities)MMFA applies a mathematical formulation and modelling
where poor data availability occurs
SIMBOX
[9293]
9
Table 5 UM Analysis methodologies tools applied at UK levels Accounting techniques
Methodology Description Tools Reference(s)
IO Input Output
Input Output tables were developed by Leontief for economic analysis in the
1930s The tables connect goods production processes deliveries and demand in a
stationary and dynamic way through a network of flows of goods and provisions
The tables include emissions and wastes and are incorporated into both MFA and
LCA
COMPASS
GLODYM
[8 94 95]
PIOT Physical Input-
Output Tables
National-level analysis that extends the conventional input-output methodology
and classifications to incorporate environmental resource and waste output
ldquosectorsrdquo to provide measures of the physical flow of materials and goods within
the economic system and between the economic system and the natural
environment
- [8 61 9697]
TMRO Total Material
Requirement and
Output
Total Material Requirement and Output is a material flow accounting approach that
quantifies the physical exchange of aggregated material flows between national
economies and the environment
1SDraw (Sankey diagrams) 2eSankey 3Umberto 5
[61 9899100]
IRM Integrated
Resource
Modelling
IRM processes resource inputs and provides quantitative values for a set of key
performance indicators (eg energy consumption or total greenhouse gas
emissions) that have been defined within a framework set to appraise the
sustainability of the whole design
SUNtool calculates flows
[101]
10
Table 6 provides an indicative list of data sources that are generically applicable to the UK
This abundance of accessible UK Europe data may go some way toward explaining why
there appears to be an urban metabolism research bias shown in Figure 1
Table 6 Principal primary data sources applicable to material flows in UK cities
Product emission Frequency Source Coverage
Aggregates minerals Annual
(1970 to present)
British Geological Survey (BGS) UK
minerals Yearbook Office for
National Statistics (ONS)
UK Regions
Air emissions
Annual
National Environment Technology
Centre (NETCEN)
UK Regions
Arable livestock Annual Defra Food and Agriculture
Organisation (FAO)
UK Regions
Energy Annual Department of Environment for
Climate Change (DECC)
UK Regions
Food Annual ONS and Defra
Forestry Annual Forestry Commission (FC) UK Regions
Industrial purchases Annual
Office for National Statistics (ONS)
UK Regions
(sorted also by products)
Oil gas coal Annual Department of Trade and Industry
(DTI)
UK field mine
PRODCOM (commercial
sales by product)
Annual
Office for National Statistics (ONS)
UK manufacturers sales by product
(PRODCOM) ndash Accessed through
ONS or Eurostat
Product level
Traded goods Monthly
Her Majestys Customs and Excise
(HMCE)
UK
Water abstraction
and leakage
Annual
Environment Agency (EA) local
water providers (eg Severn Trent
Water for Birmingham) OFWAT
((The Water Services Regulation
Authority)
UK Region Company
areas District Metering
(DMA)
Waste (i) municipal
solid waste
commercial waste
Annual
Local Authorities(LArsquos) UK Regions
Waste(ii) commercial Annual Environment Agency (EA) Defra
UK Regions
22 Step 2 Identifying precursory methodology for Urban Metabolism (UM) studies
Of the international studies reviewed within this paper the most widely adopted (~50) at a
range of scales was Material Flow Analysis (MFA) or variations thereof (Table 4) The approach
appeared to be the fundamental building block for all Urban Metabolism (UM) studies the results
of which could be fed into either a footprint or Life cycle analysis As such we term this our
precursory methodology Before applying it the paper provides some more historical context is
provided with an outline of the methodological principles upon which it has been based
11
221 Methodological Principles of MFA
The basic principle of Material Flow Analysis (MFA) is not new being first postulated by Greek
philosophers more than 2000 years ago as the conservation of matter (ie input must equal
output) This principle can be applied to a person (and was by Santorio Santorio from 1561-
1636) or for management of resources wastes and the environment in such diverse fields as
medicine chemistry economics engineering and life sciences [89899] MFA is a systematic
assessment of the flows and stocks of materials within a system defined in space and time that
connects sources pathways and intermediate as well as the final sinks of a material [8] Over the
last three decades MFA has developed considerably becoming increasingly refined and precise
[5878799899102103104105] In principle there are four main objectives [831]
(1) Reduce the complexity of the system as far as possible
(2) Assess the relevant flows and stocks in quantitative terms observing sensitivities and
uncertainties
(3) Present results about flows and stocks of a system in a reproducible understandable
and transparent way
(4) Use the results as a base for the management of resources the environment and
wastes
3 STEP 3 Application of Precursory Methodological approach
Having now identified the precursory methodology this paper investigates the way(s) in which
MFA can contribute (or not) to the measurement assessment and understanding of lsquoliveabilityrsquo
as previously defined and identification of realistic and radical engineering solutions This
includes a lsquodrill downrsquo procedure at opposite ends of the spectrum ie from city scale of (Section
31) where MFA is increasingly being adopted to an individual end-use scale (Section 33)
where MFA application within the literature is less apparent
31 City scale application Birmingham UK
By using Birmingham UK as an example (Figure 3) and applying a relevant set of flow metrics
at city scale quantification of what passes into and out of the citiesrsquo political boundary can be
identified using datasets from Table 3 [106] Following a traditional MFA approach everything is
weight-based (ie tonnes) and considers yearly contributions through the city and annual stock
taking in this way undoubtedly provides simplification of what is actually quite complex
12
Figure 3 MFA for the city of Birmingham (UK) in 20112012
Whilst we have adopted comparable units throughout the question might be posed regarding
what units and quantification should be used in order to convey the messages clearly to decision-
makers The unifying internationally agreed metric for environmental impacts is typically geared
toward carbon emissions and if we were to consider only the direct carbon emissions from energy
consumption at city scale for Birmingham in 2013 these would be 5493 ktyr (511 tonnes
CO2capita) showing a reduction by 20 on 1990 levels [106]
32 City scale ndash water
In figure 4 the flow model is refined to see what new incites become apparent The more
detailed data analysis albeit still at a very course level provides a focus on water We chose this
due to its dominance (in mass terms) in material flows [102] From the MFA analysis of
Birmingham water dominated other flows - by a factor of 741 (when compared to the energy ndash
the next highest flow) Moreover when consulting the literature it appeared that except for a
handful of MFA water studies this research area was currently under-represented both globally
and within the UK [107108109110 ] Moreover it was not being totally accounted for in
traditional nationally-applied MFA particularly with respect to the total amount of material used
in an economy ie Domestic Material Consumption ndash DMC [112] The Sankey diagram
approach was chosen for representing the material flow of water in Birmingham where arrows are
sized according to their magnitude This provides a contrasting visual representation (to Figure 3)
for water volumes being used within the city This extra layering of information is useful and
required because it provides a necessary baseline for city water provisioning (ie supply demand
and disposal) by sector in Birmingham For example it identifies the water sector as a low
contributor to city carbon emissions and the domestic sector as a significant user of water
13
resources In addition it highlights that more water is lost through leakage than used by the non-
domestic sector (ie industry and commercial sectors) and this is certainly a scale at which
potentially transformative interventions start to become clearer In terms of leakage reduction and
prevention perhaps improved asset management tools are required [113] or alternative ways to
plan for place and house utilities below ground [114115] With this increased level of
refinement it becomes more apparent where water is coming from where the water is going to
however it still does not provide information on the individual or the high levels of variability
that exist in water supply volumes and the delicate balancing act that is required to ensure
demands from domestic and non-domestic end-users are met day-in and day-out [Although the
study by Kowalski et al (2011) provides a useful review of non-domestic flows and consumption
of freshwater for the UK [116] and is a good place to start such an analysis from]
Unfortunately an MFA analysis as shown in Figure 4 excludes the physical connectivity
provided for by a networked infrastructure system that links demand nodes with supply sources
nor does it make apparent the geospatial limitations or opportunities for new water and its supply-
disposal streams [117] However the results of such an MFA approach can be used to inform this
type of requirement when used in parallel
Identifying where water sources are located and what water supply boundaries exist (and
therefore with whom the environmental impact responsibility is associated) is particularly
important in this respect for both resource security and local provisioning Birmingham is a
particularly interesting case because in 1896 water scarcity issues led to the majority of the cityrsquos
water being sourced from outside its physical city boundary (from the Elan Valley Reservoir in
Wales) and at 73 miles this resides well beyond what might be considered itsrsquo hinterland The
shows that granularity of information is required
Local contextual meaning is required in order that multiple MFA datasets can be layered
interrogated and interpreted correctly [117] This is important for making existing connections
and dependencies explicit whilst identifying interconnectivity and associated nexus issues for
example between vital supply streams which include water food and energy [118119120] that
are critical to the liveability of a city and yet so often overlooked
A detailed city-scale MFA should form part of any sustainable resource efficiency process
where localised resource loops can be identified and formed within a range of sectors (ie not just
industrial) and across a range of scales City-scale MFA provides the basis of flows from which
such ideas can be explored
14
Wastewater Treatment 1825 GL
Imports
106 GL
Process Losses 55 GL
Industry and commercial 197 GL
Domestic 602 GL
Export 96 GL
Other losses 156 GL
008 MtCO2
Biogas 803 GWh
Reservoirs
1491 GL
73 GW
h
Energy Supply
192 GWh
Gas 58 G
wh
Renewables 2646 GWh
Other 448 GL
Leakage 281 GL
58 GWh
Natural
Environment
Anthroposphere
Fossil fuel(s)
Rivers
Rainfall
Water input
12 GL
Potable
mains water 1204 GL
Electricity
Figure 4 Water (and associated energy) flows for Birmingham in 2011 (embodied water excluded)
33 End-user scale domestic water
By scaling down to a single domestic end-user in the highest demand sector (Figure 5) much finer levels of
detail can be achieved with respect to improving liveability End-user scale as with all other scales requires
assumptions to be made in order to establish representative baseline resource flows Hence a flow metric of
litres per person per day (lpday) has been chosen for each water end-use This metric along with leakage
(mentioned earlier) is a key measure of efficiency within Urban Metabolism analyses [121] The quantities
of flow are drawn from previous work [122] Assignment of carbon emissions (in this case only for
cleaning mains water supplies and sewage) are made in order that carbon-critical use(s) within the domestic
sector (ie showering) are made explicit A metric of kg per person per year has been chosen (kgCO2yr)
In this example carbon is calculated considering water cleaning and transport only the additional
carbon costs associated with water heating (ie an energy flow) which occurs in all uses except water
closet (WC toilet) flushing have been omitted This shows the importance of boundary setting within
analyses and once again highlights the importance for decision-makers or those interpreting MFA figures
to identify interconnectivity and (inter)dependency issues
Figure 5 MFA showing daily resource use (lpday) and yearly carbon emissions
When a whole range of water flows are considered within the household boundary (Figure 6) potential
areas for saving water resources whilst reducing carbon emissions become clearer For example Figure 6
shows the impact of by flushing toilets with rainwater harvested from rooftops ndash Rainwater Harvesting
(RWH) The added benefits here are reduced pluvial run-off and reduced mains water use [123] For the
Material Flow Analysis to be robust the daily changes in stored water volumes and residual storage
capacities need to be measured [123] A policy intervention might seek to make household water users
responsible for the water that falls within their boundaries This is particularly so for rooftops where
continued growth in city centre pluvial run-off due in part to increases in paved over front gardens for
parking frequently overburdens existing storm water systems [123]
16
526 kg CO2pyr(-0)
173 kg CO
2 pyr
(-20)
(X + Y + Z)
ON SITE
WATER
(120)
MAINS
WATER
(265) Washing Machine
(253) Bath
(16) Hand Basin
(150)
WASTE
WATER
(273) Washing Machine
(104) Sink
(36) Dishwasher
(524) Shower
(Z-a) RUN-OFF (ROOF)
(Y + Z - a)
STORM
WATER
(Y) RUN-OFF (GROUND)
(265) WC
(X) INFILTRATION
SOIL
Figure 6 Impact of RWH on daily resource use (lpersonday) and yearly carbon emissions
An alternative transformative intervention would be the re-use of greywater (GW) from showers - Figure 7
shows this for a single-end user By extending this philosophy to other city water users the potential for
symbiosis not just industrial (as is typically linked with Urban Metabolism [124125]) can be explored
Figure 8 shows the impacts on resource use and carbon emissions when interconnecting water use and
recycling in offices and domestic dwellings The advantage in this case is that the water-using lifestyle of
the end user has not been impacted with any of these options
(120)
WASTE
WATER
(120)
MAINS
WATER
(265) Washing Machine
(265) WC
(253) Bath (16) Hand Basin
(273) Washing Machine
(104) Sink (36) Dishwasher
(524) Shower
(253) Bath
GW
RECYCLING
173 kg CO
2 yr
(-20)
421 kg CO2 yr(-20)
Figure 7 Impact of GW supplies on daily resource use (lpersonday) and yearly carbon emissions
17
(105)
(120)
DOMESTIC (265) WC
(253) Bath
(16) Hand Basin
(273) Washing Machine
(104) Sink
(36) Dishwasher
(524) Shower
(253) Bath
GW RECYCLING
(86) OFFICE
(24)
GW RECYCLING (102) WC (48) Urinal)
(06) Dishwasher (64) Sink (16) Hand Basin
WASTE WATER (OUT)
MAINS WATER (IN)
173 kg CO2 yr(-20)
368 kg CO2 yr(-30)
124 kg CO2 yr(-64)
105 kg CO2 yr(-0)
Figure 8 Impact of interconnections on daily resource use (lpersonday) and yearly carbon emissions
In addition the wastewater production has been reduced thereby increasing future local infrastructure
capacity However to truly reflect how lsquoliveabilityrsquo is or could be impacted other considerations would be
required For example by exploring long-term acceptability based on cost reliability responsibility etc
influence of additional carbon costs ie a full carbon footprint related to new localised infrastructure
provision [126] additional embodied and virtual water [110] and calculation of an overall water footprint
[127] This is particularly true when these transformative solutions are scaled-up MFA is undoubtedly the
precursory step to allow this to happen effectively Scaling-up to apply MFA at the District Metering Area
(DMA) level would provide a logical crucial linking thread between what happens at the individual
household scale and what happens at city scale However one hurdle to overcome which is well
recognised within the literature is confidentiality of water data [103104105] and issues of accountability
34 Single end-use Domestic water
The supply interventions proposed in the previous section are unlikely in isolation to achieve the
liveability aim of lsquoresource securityrsquo indicating that a combination of supply-side and demand-side
interventions are required to achieve the best decrease in water use In order to achieve a reduction in water
demand it is necessary to explore the key influences at play according to a hierarchy of key drivers This is
more easily illustrated when considering a single end-use for example showering drawn from the previous
domestic Sankey flow model (Figure 5)
To get the best out of an MFA analysis at this scale a different approach to the sankey diagram is
required Hunt et al (2013) suggests that the two key driving influences here are user behaviour (a social
driver) and technological efficiency (a technology driver) [128] [NB it is not suggested that the two are
completely divorced (eg technologies may inadvertently influence user behaviour and vice versa)
moreover they operate in a field of influence pushed and pulled by other external influences such as
economics and policy] By utilising a possibility space (Figure 9) a range of water reduction strategies and
resulting flows can be assessed
18
The possibility space provides three options to reach a specified reduction in water flows (1) improve
technological efficiency alone (ie a water efficient shower) (2) adopt a step change in user behaviour
alone (ie a much shorter showers) or (3) a combination of each
Figure 9 Reducing flows (per person) and carbon emissions during showering [126]
The current lsquoaveragersquo use (576 litres shower) is shown in the top left hand corner and a contour is
shown for each 20 reduction in flow from this starting point At this scale it is much easier to investigate
water demand reduction options and explore its impact on quality of life because it relates directly to the
individual something that is more difficult to determine at larger scales The possibility space allows for
interrogation of domestic flow reduction strategies and can be used for water (as shown) but also energy
(forthcoming publication)
Through thinking about the linkages with key drivers of change and asking whether they can push or be
pulled by the choices that are made the MFA analyses are both more informative and useful For example
what will it cost the user to invest in more efficient technologies How much water and carbon will it save
Do they deliver the expected user experience What should water resources cost to effect a change in
behaviour [129] What policies need to be put in place to ensure change Instigating technical change (eg
installing a low-flow shower) is perhaps easier to tackle than behaviour change [126] Although the starting
point may simply be to make people more aware of what they use compared to what they could use and
perhaps a band rating for water would help here [129] The richness of this approach and a band rating
option is that together they allow for the subtle differences between wants and needs to be made explicit or
perhaps as suggested by emerging findings from the POLFREE project sufficiency vs efficiency to be
explored [130] These are key threads to true urban liveability with regards to 80 carbon reduction
resource security and wellbeing
Figure 9 could easily be adopted for Water Closet (WC toilet) use and in this case the technological
intervention would seek to significantly reduce flushing volumes In essence this simplified framework
helps engineers to ask questions (eg do we really need to add water to urine andor solid waste in WC
systems) and seek innovative solutions (eg waterless urinals and composting toilets) or approaches (eg
19
reduced flush frequency during the day) which can then be scaled-up In each case the carbon and
resource use and cost can be assessed and mapped back onto the water flows in order to assess overall
household liveability implications
Figure 9 Band rating an individualsrsquo domestic water use (Hunt and Rogers 2014)
4 Discussion
This paper has proposed the use of an Urban Metabolism approach with a focus toward MFA as the
precursory methodology to assess the impacts of transformative engineering solutions designed to improve
the future liveability of cities (defined as maintaining or enhancing wellbeing whilst improving resource
security (ie moving toward one planet living) and reducing carbon (achieving 80 reduction on 1990
levels by 2050)) In this discussion section we pose two questions about MFA
Q1 What shortfalls to MFA (in approach and application) exist that could undermine its usefulness in
achieving lsquoliveablersquo cities (Section 41)
Q2 Is MFA alone sufficient to produce change (Section 42)
41 What shortfalls to MFA (in approach and application) exist that could undermine its usefulness in
achieving lsquoliveablersquo cities
The purpose of MFA analyses outlined in this paper was to convey clear messages on material flows
within our cities that ultimately could be used to invoke change and spark ideas to improve the liveability
An extensive review of the Urban Metabolism literature highlighted numerous MFA studies on the UK
However the most glaring shortfall was in the lack of regional lsquourban scalersquo studies a situation highlighted
previously by Barles [5] This was accompanied by a lack of cross-sectional studies multiple city
comparators and time series studies [131132]
20
Many studies suffered from being lsquoover precisersquo and lsquoover quantifiedrsquo invoking the questions (in the
face of uncertainty) of what level of precision is possible [133] and in order to make decisions what levels
are actually required This is important when considering difficult to obtain data related to food electricity
and water consumption that often requires proxy data [20] This is important because if policy decisions
are to be based purely on (MFA) input-output models [134] where high degrees of uncertainty will result in
calculated econometric responses (and we contest also environmental and societal responses) this
uncertainty would ultimately undermine MFArsquos usefulness as a city analysis tool within an overarching
UM city planning framework Therefore there are strong arguments for making data sets more robust or
alternatively more useful and accessible through adoption of simpler or let us say less precision-focussed
models [135] MFA at city scale is looking at city level data sets which are necessarily estimates and
should be seen as ldquomacro-datardquo rather than precise design data ndash therefore the law of diminishing
returns applies For example within the literature MFA at this scale appeared very much to be about lsquostock
takingrsquo and typically considered only what happens over a complete year so it does not include daily or
even monthly temporal changes which can significantly impact upon city design quality and ultimately
liveability For instance times when water supplies are abundant (not least through localised rainfall) or
significantly diminished This ldquomicro-datardquo would require strings of input output (IO) tables targeted data
analysis and translationinterpretation to convey key messages to stakeholders Ultimately if transformative
solutions for reducing carbon increasing resource security and wellbeing are to be successful there must be
a requirement to simulate and evaluate existing as well as future flow scenarios [212223136137] so as to
test solutions to ensure they are sufficiently robust and resilient to future changes [138139]
42 Is MFA alone sufficient to produce change
MFA undoubtedly allows for more meaningful synthesis of data sets in order that we can truly understand
lsquoliveablersquo cities Moreover it does reveal sufficient levels of detail to make it more obvious where changes
(interventions) can be made in order to limit resource use whilst reducing carbon emissions However
there are three important aspects that need to be addressed so that the methodology can work effectively
and produce city changes for the better
Firstly it can be argued that MFA (in isolation) does not give a true picture of the impact to the
environment of meeting city demands this requires per capita carbon footprints (this includes emissions
from housing transport food consumer items publicprivate services capital investment and others)
Whilst this cannot be gained directly from MFA analysis flows the results calculated therein can inform a
much broader EF analysis which includes carbon foot printing - the most widely recognized measure(s) for
environmental sustainability [140] [For example the carbon footprint for Birmingham is been estimated to
be 1078 tonnes CO2capita [29] This translates into a land requirement of 522 gha to support the
consumption of each Birmingham resident or 29 planets to support the city ranking it 17th out of 60 UK
cities [29] These should be combined with water footprinting and LCA in order that tangible performance
outputs can be easily translated to decision-makers and compared between cities What is of most interest
here is that when considering the mini-Stern review for energy in Birmingham it was clearly shown that the
highest percentage of carbon savings could only be made at the national level eg pricing national grid
etc [141] Therefore it is not inappropriate to assume this may also be the case for other areas such as
water transport and food Perhaps then MFA at Nationalinternational scale might also be considered so as
to provide a broader picture
21
Secondly from analysing the literature and applying MFA at multiple scales it becomes apparent that
MFA does not yet go far enough in terms of other more organic qualities which reflect how a city
functions This is a shortfall first noted by Newman (1999) who suggested that the methodological
approach should be broadened to include dimensions related to the dynamics of settlement (eg built
environment economic priorities cultural priorities infrastructure provision ecology and ecosystem
services) and urban living (eg Health employment income education housing leisure activities
accessibility urban design quality and community) [1] This shortfall is well known within the Industrial
Ecology community and awareness is growing that the effect(s) on flows of social dimensions and
stakeholders each with different profiles and priorities need to be considered [124] This is particularly
true for lsquowellbeingrsquo where a better understanding is gained from considering the users (ie individual end-
use scale MFA)
Lastly the fact that growth in material turnover (or flows) in our cities is closely associated with
economic progress [8] presents a significant barrier to resource reduction within the liveability umbrella
There is also a suggestion that if we are to better prepare our cities for the future we cannot ignore the
causal relationships that exist in our between economically motivated human behaviour and resource-
driven consumption [142]
60 Conclusions
In this paper MFA was shown to be a precursory step to any UM city analysis When subsequently
applied at a range of scales (ie city to individual) the paper provided a focus toward an underrepresented
sector (ie water) that dominates city movement in terms of its actual mass By applying MFA albeit at a
superficial level at increasing levels of detail a greater understanding of water flows was achieved This
leads directly to identification of interventions at varying scales that aim to decrease mains water
consumption decrease carbon flows and increase resource security (without eroding wellbeing) The visual
interpretation of the lsquostock-takingrsquo information for stakeholders and decision-makers must be conveyed
clearly if they are to aid decision-making A variety of approaches have been used herein but perhaps more
are required This paper has shown that MFA is most effective and therefore has greatest potential for
improving future liveability of cities when applied at a range of scales (ie city to household) each of
which reveals different layers of granularity of city living and each of which requires very different
transformative solutions (whether it be technical economic political or social) When parallel streams are
considered interconnectivity issues (water energy food nexus) and the potential for loop closing (eg
water re-userecycling) can be highlighted MFA should not be used in isolation it is a precursory tool
within a toolkit and in order to represent the broader impacts of city it requires footprint analyses (carbon
and water) LCA and a deeper understanding of issues related to city dynamics Aspects of infrastructure
provisioning and issues of temporal changes cannot be ignored as an excess (or lack of) flows during the
year can lead to key liveability issues for end-users When considering an individual user and a single water
use cognisance of flows is still important however it has been shown that supplementary approaches to
MFA such as a Futures Framework are required in order to start and unpick wellbeing issues
22
Acknowledgements
The authors wish to thank the Engineering and Physical Sciences Research Council for their support
under the Liveable Cities (EPJ017698) Programme Grant
Author Contributions
Dexter VL Hunt undertook the main body of the research within this paper Contributions from all co-
authors provided critical judgement on the research being undertaken
Conflict of Interest
The authors declare no conflict of interest
References and Notes 1 Newman PWG (1999) Sustainability and cities extending the metabolism model Landscape and
Urban Planning 44 219-226
2 UN (2012) World Population Prospects The 2012 Revision
httpesaunorgunpdwppunpppanel_populationhtm
3 Lombardi DR Leach JM Rogers CDF Barber A Boyko CT Brown J Bryson J Butler D Caputo S
Caserio M Coles R Cooper R Farmani R Gaterell M Hale J Hales C Hewitt CN Hunt DVL
Jancovic L Jefferson I Mackenzie AR Memon FA Phenix-Walker R Pugh TAM Sadler JP
Weingaertner C Whyatt JD (2012) Designing Resilient Cities A Guide to Good Practice (EP103)
IHS BRE Press
4 Ferrao P and Fernandez JE (2013) Sustainable Urban Metabolism The MIT Press Cambridge
London England 260 pages
5 Barles S (2010) Society energy and materials the contribution of urban metabolism studies to
sustainable urban development issues Journal of Environmental Planning and Management 53 4
439 mdash 455
6 Kennedy CA and Hoornweg D (2012) Mainstreaming urban metabolism Column in Sustainable
Urban Systems special issue Journal of Industrial Ecology 16 (6) 780-782
7 Baccini P and P Brunner (1991) Metabolism of the anthroposphere Berlin Springer-Verlag
8 Brunner PH and Rechberger H (2004) Practical Handbook of Material Flow Analysis CRC Press
Boca Raton Florida
9 Wolman A 1965 The Metabolism of Cities Scientific America 213 3 pp179-190 Nature
Publishing Group New York United States of America
10 Eurostat (2001a) Economy-wide material flow accounts and derived indicators A methodological
guide In European Commission Eurostat theme 2 Economy and finance Luxembourg Office for
Official Publications of the European Communities
23 11 Eurostat (2001b) Material use indicators for the European Union 1980-1997 In European
Commission Eurostat theme 2 Economy and finance Luxembourg Office for Official Publications
of the European Communities 110 pages
12 Eurostat (2002) Material use in the European union 1980-2000 Indicators and analysis
Luxembourg Eurostat Office for Official Publications of the European Communities
13 Eurostat (2009) Economy Wide Material Flow Accounts Compilation Guidelines for reporting to the
2009 Eurostat questionnaire Version 01 ndash June 2009
httpeppeurostateceuropaeuportalpageportalenvironmental_accountsdocumentsEurostat20M
FA20compilation20guide20for20200920reportingpdf
14 OECD (2008a) Measuring Material Flows and Resource Productivity Volume I Inventory of Country
Activities Organisation for Economic Co-operation and Development (OECD) Paris France 164
pages
15 OECD (2008b) Measuring Material Flows and Resource Productivity Volume II The Accounting
Framework Organisation for Economic Co-operation and Development (OECD) Paris France 107
pages
16 OECD (2008c) Measuring Material Flows and Resource Productivity Volume III Inventory of
Country Activities Organisation for Economic Co-operation and Development (OECD) Paris France
107 pages
17 WWF (2005a) Cardiffrsquos Ecological Footprint Cardiff County Council Wales
18 WWF (2005b) Reducing Cardiffrsquos Ecological Footprint A resource accounting tool for sustainable
consumption Cardiff County Council Cardiff Wales 183 pages
19 Collins A Flynn A and Netherwood A (2005) Reducing Cardiffrsquos Ecological Footprint Cardiff
20 Barrett J and Scott A (2001) An Ecological footprint of Liverpool Developing sustainable
scenarios 121 pages
21 Best Foot Forward (2003) An ecological footprint analysis of Angus Scotland Angus Available at
httpwwwangusgovuksustainabilitypdfsAngusEcologicalFootprintFinalDraftpdf
22 Best Foot Forward (2002) Five Cities Footprint Estimating the Ecological Footprint of Aberdeen
Dundee Edinburgh Glasgow and Inverness Oxford
23 Vergoulas G Lewis K and Jenkin N (2003) An ecological footprint of Angus Scotland Best
Foot Forward Oxford UK
24 Schandl H Schulz N (2000) Using Material Flow Accounting to operationalise the concept of
Societys Metabolism A preliminary MFA for the United Kingdom for the period of 1937-1997 ISER
Working Paper No 2000-3 University of Essex Colchester
25 Bringezu S and Helmut S (2001) Total Material Resource Flows of the United Kingdom
Wuppertal Wuppertal Institute for Climate Environment Energy A study undertaken for DEFRA
(Department for Environment Food amp Rural Affairs)rsquo London DEFRA
24 26 Sheerin C (2002) UK Material Flow Accounting Economic Trends No 583 pp 53ndash61 Available at
http wwwstatisticsgovukcciarticleaspid=140
27 Linstead C and Ekins P (2001) Mass balance UK Mapping UK resource and material
flows Royal Society for Nature Conservation
28 Dahlstroumlm K Ekins P Heb J Davis J and Clift R (2004) Iron Steel and Aluminium in the UK
Material Flows and their Economic Dimensions Executive Summary Report April Policy Studies
Institute (PSI) 38 pages
29 Calcott A and Bull J (2007) Ecological Footprint of British Residents A publication for World
Wildlife Fund (WWF) 40 pages
30 ONS (2005) UK Material Flow Review Office for National Statistics London 99 pages
31 Wiedmann T Minx J Barrett J Vanner R and Ekins P (2006) Sustainable Consumption and
Production - Development of an Evidence Base Resource Flows Stockholm Environment Institute
(SEI) and Policy Studies Institute (PSI)
32 Wiedmann T Minx JC Barrett J and Wackernagel M (2006) Allocating Ecological Footprints to
Household Consumption Activities by Using Input-Output Analysis Ecological Economics 56(1) 28-
48
33 Barrett J and Simmons C (2003) An Ecological Footprint of the UK Providing a Tool to Measure
the Sustainability of Local Authorities 81 pages
34 Barrett J Ravetz J amp Bond S (2006) Counting Consumption CO2 emissions material flows and
ecological footprint of the UK by region and devolved country Godalming WWF-UK
35 Carbon Trust 2011 International Carbon Flows London Available at
httpswwwcarbontrustcommedia38075ctc795-international-carbon-flows-global-flowspdf
36 Papathanasopoulou E and Jackson E (2010) The UKs fossil Resource Consumption between 1968
and 2000 Journal of Industrial Ecology 14(2) 354-370
37 Douglas I Rob Hodgson R and Lawson N (2002) Industry environment and health through 200 yrs
in Manchester Ecological Economics 41 235ndash255
38 Barrett J and Scott A (2003) The Application of the Ecological Footprint A case of passenger
transport in Merseyside Local Environment The International Journal of Justice and Sustainability
82 167-183 [Accessed April 15 2014]
39 Best Foot Forward (2005) Stepping Forward A resource flow and ecological footprint analysis of the
SW of England 34 pages
40 McEvoy D J Ravetz and Handley J (2001) 4 sight Resource flow audit for sustainability A
framework strategy for the North West Centre for Urban and Regional Ecology University of
Manchester
41 McEvoy D J Ravetz and Handley J (2008) Managing the Flow of Construction Minerals in the
NorthWest Region of England A Mass Balance Approach Journal of Industrial Ecology 8(3)121-
140
25 42 Barrett J Vallack H Jones A Haq G (2002) A Material Flow Analysis and Ecological
Footprint of York Technical Report Stockholm Environment Institute Stockholm Sweden
43 CIWM (2002) A resource flow and ecological footprint analysis of Greater London Chartered
Institute of Wastes Management London Best Foot Forward
44 GLA (2003) Londonrsquos Ecological Footprint Greater London Authority London UK 32 pages
45 Nates M and Bartlett J (2008) Feasibility study to examine making the Thames Gateway a low
carboncarbon neutral development area Department for Communities and local Government
(DCLG) London 166 pages
46 SEI (2007) An Introduction to the Resources and Energy Analysis program
httpwwwfcrnorguksitesdefaultfilesREAP_UK_Methodologypdf
47 SEI (2008a) Environmental Accounting for People and Places Fact Sheet Stockholm Environmental
Institute httpsei-internationalorgmediamanagerdocumentsPublications Climatereappdf
48 SEI (2008b) REAP v2 Experimental release data for Birmingham 15-10-08 Published by SEI
Stockholm
49 Lazarus (2002) BedZED Toolkit Part 1 A guide to construction materials for carbon neutral
dvelopments httpwwwoneplanetcommunitiesorgwp-contentuploads201003BedZED-Toolkit-
Part-1-Materials-Report-screenpdf
50 European Commission (2008) Potential of the Ecological Footprint for monitoring environmental
impacts from natural resource use Analysis of the potential of the Ecological Footprint and related
assessment tools for use in the EUrsquos Thematic Strategy on the Sustainable Use of Natural
Resources2008 httpwwweceuropaeuenvironmentnatrespdffootprintpdf
51 Barrett J Birch R Cherrett N and Simmons C (2004) An Analysis of the Policy and Educational
Application of the Ecological Footprint Technical Report Stockholm Environment Institute
Stockholm Sweden 39 pages
52 Hertwich EG and Peters GP (2009) Carbon Footprint of Nations A Global Trade-Linked
Analysis Environ Sci Technol 43 (16) pp 6414ndash6420
53 Krotscheck C and Narodoslawsky M (1996) The sustainable process index A new dimension in
ecological evaluation Ecological Engineering 6 241ndash258
54 Collins A and Flynn A (2007) Engaging with the Ecological Footprint as a Decision-Making Tool
Process and Responses Local Environment 12(3) pp295ndash312
55 Wackernagel M and Rees W (1996) Our ecological footprint Reducing human impact on the earth
Gabriola Island BC New Society Publishers
56 Monfreda C Wackernagel M Deumling D 2004 Establishing national natural capital accounts
based on detailed ecological footprint and biological capacity accounts Land Use Policy 21 231 ndash 246
57 Wright L Kemp S Williams I (2011) Carbon footprinting towards a universally accepted
definition Carbon Management 2 (1) 61ndash72
26 58 ISO (2013) Greenhouse gases -- Carbon footprint of products -- Requirements and guidelines for
quantification and communication (ISOTS 140672013) International Organisation for
Standardisation (ISO) Geneva 52 pages
59 ISO (2014) ISO140462014 Environmental Management Water Footprint Principles requirements
and Guidelines International Organisation for Standardisation (ISO) Geneva
60 Huppes G and Mansanobu I (2007) Quantified eco-efficiency An introduction with applications
(Vol 22) Springer London UK
61 Daniels PL and Moore S (2012) Approaches for Quantifying the Metabolism of Physical
Economies Part I Methodological Overview Journal of Industrial Ecology 5 (4) 69-93
62 Opschoor JB and Reijnders L (1991) Towards sustainable Development Indicators In search of
Indicators of Sustainable Development Environment and management Volume 1 7 -27
63 Maclean H and Lave L (1998) Life-cycle of an automobile Environmental Science and Technology
32(13) 322Andash328A
64 Jonsson A T Bjorklund and AM Tillman (1998) LCA of concrete and steel frames International
Journal of Life Cycle Assessment 3(4) 216ndash224
65 ISO (2006a) Environmental Management- Life Cycle Assessment ndash Principles and Framework (ISO
140402006) International Organisation for Standardisation (ISO) Geneva 20 pages
66 ISO (2006b) Requirements and Guidelines (ISO 140442006) International Organisation for
Standardisation (ISO) Geneva 46 pages
67 ISO (2012b) Environmental management -- Life cycle assessment -- Illustrative examples on how to
apply ISO 14044 to impact assessment situations (ISOTR 140472012) International Organisation for
Standardisation (ISO) Geneva 85 pages
68 ISO (2012b) Environmental management -- Life cycle assessment -- Illustrative examples on how to
apply ISO 14044 to goal and scope definition and inventory analysis (ISOTR 14049) International
Organisation for Standardisation (ISO) Geneva 48 pages
69 Saouter R and van Hoof G (2002) A database for the life-cycle assessment of Proctor and Gamble
laundry detergents International Journal of Life Cycle Assessment 7(2) 103ndash114
70 WRAP tools httpwwwwraporgukcontentmodel-market-flows-electrical-products
71 WRAP (2011) Market Flows of Electronic Products amp WEEE Materials 13 pages
72 WRAP (2012) Electrical product material composition Waste and Resource Action Programme
Banbury Oxford 9 pages
73 Lehmann H and F Schmidt-Bleek (1993) Material flows from a systematical point of view
Fresenius Environmental Bulletin 2 413ndash418
74 Ritthoff M Rohn H and Liedtke C (2003) Calculating MIPS ndash Resource productivity of products
and services httpwwwwupperinstorguploadstx_wibeitragws27epdf
75 BRE (2008) Global Methodology for Environmental Profiles of Construction Products SD6050
British Research Establishment Watford UK106 pages
27 76 Brunner P H (2002) Beyond Materials Flow Analysis Journal of Industrial Ecology 6 8ndash10
77 Cencic O and Rechberger H (2008) Material Flow Analysis with Software STAN Journal of
Environmental Engineering and Management 18 3
78 Fischer-Kowalski M and Huumlttler W (1998) Societys Metabolism The Intellectual History of
Materials Flow Analysis Part I 1860-1970 Journal of Industrial Ecology 2 (1) 61-78
79 Fischer-Kowalski M and Huumlttler W (1999) Societys Metabolism The Intellectual History of
Materials Flow Analysis Part II 1970-1998 Journal of Industrial Ecology 2 (4) 107-136
80 Luks F and Hammer M (2003) Material Flow Analysis Discourse Analysis and the Rhetorics of
(Ecological) Economics SERI Working Paper 32 pages httpseriatpublicationsother-working-
papers20090920material-flow-analysis-discourse-analysis-and-the-rhetorics-of-ecological-
economics
81 Hinterberger F Giljum S and Hammer M (2003) Material Flow Accounting and Analysis (MFA)
ndash A valuable tool for analyses of society-nature interrelationships Entry prepared for the Internet
Encyclopedia of Ecological Economics 19 pages httpwwwisecoecoorgpdfmaterialpdf [Accessed
30042014]
82 Barles S (2007) A material flow analysis of Paris and its region Paper presented at the International
Conference CISBAT
83 Barles S (2009) Urban metabolism of Paris and its region Journal of Industrial Ecology 13(6) 898-
913
84 Haberl H Erb KH Krausmann F Loibl W Schulz N Weisz H (2001) Changes in ecosystem
processes induced by land use human appropriation of net primary production and its influence on
standing crop in Austria Global Biogeochemical Cycles 15 (4) 929ndash942
85 Haberl H Fischer-Kowalski M Krausmann F Weisz H Winiwarter V (2004) Progress towards
sustainability What the conceptual framework of material and energy flow accounting (MEFA) can
offer Land Use Policy 21 199-213
86 Krausmann F and Haberl H (2002) The process of industrialisation from the perspective of
energetic metabolism socio-economic energy flows in Austria 1830-1995 Ecological Economics 41
(2) 177-201
87 Schandl H Grunbuhel CM Haberl H and Weisz H (2002) Handbook of Physical Accounting
measuring bio-physical dimensions of socio-economic activities Social Ecology Working paper 81
pages
88 Huttler W Payer H and Schandl H (1997) National material flow analysis for Austria 1992
Societyrsquos metabolism and sustainable development Schriftenreihe des IFF-Soziale O kologie Vol 45
Klagenfurt Vienna Institut fur Interdisziplinare Forschung und Fortbildung Abeitlung Soziale
Okologie
28 89 Bringezu S (2000) History and overview of material flow analysis Paper presented to the OECD
Special Session on Material Flow Accounting 30th Meeting of the Working Group on the State of the
Environment 24 October Organisation for Economic Cooperation and Development Paris
90 Hendriks C Obernosterer R Muller D Kytzia S Baccini P amp Brunner PH (2000) Material
Flow Analysis a tool to support environmental policy decision making Case-studies on the city of
Vienna and the Swiss Lowlands Local Environment 5(3) 311ndash328
91 Diener DL Tillman AM and Harris S (2013) Lessons Learned from Conducting a Company-
level Downstream MFA Re-engineering Manufacturing for Sustainability 559-564
92 Baccini P and H-P Bader (1996) Regionaler Stoffhaushalt Erfassung Bewertung und Steuerung
Heidelberg Berlin Oxford Spektrum Akademischer Verlag
93 Streicher-Porte Bader H Scheidegger R and Kytzia S (2007) Material flow and economic
analysis as a suitable tool for system analysis under the constraints of poor data availability and quality
in emerging economies Clean Techn Environ Policy 9 325ndash345
94 Hendrickson C Horvath A Joshi S and Lave LB (1998) Economic Input-Output Models for
Environmental Life Cycle Analysis Environmental Science amp Technology April 184-191
95 Meyer B Uno K (1999) COMPASS - Ein globales Energie-Wirtschaftsmodell ifo Studien 4 703
719
96 Gravgard Pederson O (1998) Physical input-output tables for Denmark Copenhagen Statistics
Denmark
97 Stahmer C M Kuhn and N Braun (1997) Physical input-output tables for Germany 1990 Report
prepared for DG XI and Eurostat Luxembourg Eurostat Directorate B Unit B6
98 Bringezu S Schuumltz H and Moll S (2002) Towards Sustainable Resource Management in the
European Union Wupertal Papers 50 pages
99 Bringezu S Fischer-Kowalski M Kleijn R and Palm V (1997) Regional and national Material
Flow Accounting From paradigm to practice of sustainability Proceedings of the ConAccount
workshop 21-23 January 1997 Leiden The Netherlands
100 Matthews E Amann C Bringezu S Fischer-Kowalski M Huumlttler W Kleijn R Moriguchi Y
Ottke C Rodenburg E Rogich D Schandl H Schuumltz H van der Voet E and Weisz H (2000)
The Weight of Nations Material Outflows from Industrial Economies Washington DC World
Resources Institute
101 Page J Grange N KirkpatrickN (2008) The Integrated Resource Management (IRM) model ndash a
guidance tool for sustainable urban design PLEA 2008 ndash 25th Conference on Passive and Low Energy
Architecture Dublin 22nd to 24th October 2008 httpplea-
archorgARCHIVE2008contentpapersoralPLEA_FinalPaper_ref_506pdf
102 Kleijn R (2001) Adding It All Up The Sense and Non-Sense of Bulk-MFA Journal of Industrial
Ecology 4(2) 7-8
29 103 Hammer M Hubacek K (2002) Material flows and economic development Material flow
analysis of the Hungarian economy Interim Report No 02-057 International Institute for Applied
Systems Analysis (IIASA) Laxenburg
104 Hammer M Giljum S Bargigli S and Hinterberger F (2003) Material flow analysis on the
regional level questions problems solutions NEDS Working Paper No 2 Hamburg
105 Hammer and Giljum (2006) Material flow analysis of Hamburg Vienna and Leipzig (in German)
SERI Working Paper 94 pages
106 Lee SE Leach JM Hunt DVL Rose K and Rogers DDF (2013) A City Analysis
Methodology to elucidate Urban Challenges Energy and material flows of Birmingham Liveable
Cities Conference 21st October Birmingham UK 6 pages
107 Chambers N Griffitihs P Lewis K and Jenkin N (2004) Scotlandrsquos Footprint A resource flow
and ecological footprint analysis of Scotland Oxford Viridis Available at httpwwwscotlands-
footprintcomdownloadsFull Reportpdf
108 Kane M and Erickson JD (2007) Urban Metabolism and Payment for Ecosystem Services History
and Policy Analysis of the New York City Water Supply in Jon D Erickson Frank Messner Irene
Ring (ed) Ecological Economics of Sustainable Watershed Management (Advances in the Economics
of Environmental Resources Volume 7) Emerald Group Publishing Limited pp307-328
109 Theacuteriault J Laroche A-M 2009 Evaluation of the urban hydrologic metabolism of the Greater
Moncton region New Brunswick Canadian Water Resources Journal 34(3) 255-268
110 Kenway S Gregory A and McMahon J (2011) Urban Water Mass Balance Analysis Journal of
Industrial Ecology 15(5) pages 693ndash706
111 Venkatesh G and Bratteboslash H (2011) Analysis of chemicals and energy consumption in water and
wastewater treatment as cost components Case study of Oslo Norway Urban Water 8(3) 189-202
112 Hass J and Popescu C (2011) Economy-wide material flows European countries required more
materials between 2000 and 2007 Eurostat publication European Community 8 pages
113 Shah J Jefferson I and Hunt DVL (2014) Resilience Assessment for Geotechnical Infrastructure
Assets Proc Institute of Civil Engineers Asset Management
httpdxdoiorg101680iasma1400007
114 Rogers C D F and Hunt D V L (2006) Sustainable Utility Infrastructure via Multi-Utility Tunnels
In proceedings of the Canadian Society of Civil Engineering 2006 conference Towards a sustainable
future Calgary May 23rd 2006 Paper CT-001
115 Hunt DVL Nash D and Rogers CDF (2014) Sustainable utility placement via multi utility
tunnels Special issue of Tunnelling and Underground Space Technology 39 15-26
116 Kowalski M Waylen C Clist S Wilcox S Lynn S and Garrow D (2011) Freshwater
availability and use in the United Kingdom Banbury WRAP 123 pages
117 Makana LO Jefferson I Hunt DVL and Rogers CDF (2014) 3D Geospatial Visualization of
Underground Space to Enhance Geo-governance Geocongress 2014 pp 3455-3464
30 118 Bazilian M Rogner H Howells M Hermann S Arent D Dolf Gielen D Steduto
P Mueller A Komor P Tol R and Yumkella K (2011) Considering the energy water and food
nexus Towards an integrated modelling approach Energy Policy 39 (12) 7896-7906
119 De Laurentiis V Hunt DVL and Rogers CDF (2014) Food security challenges influences of an
energywaterfood nexus Proceedings of the 4th World Sustain Forum 1-30 November 2014
Sciforum Electronic Conference Series Vol 4 2014
120 Hoff H (2011) Understanding the Nexus - Background Paper for the Bonn2011
121 Kennedy C Ibrahim N Stewart I Facchini A and Mele R (2014) An urban metabolism survey
design for megacities Working Paper 22014 Enel Foundation Rome Italy 40 pages
122 Hunt DVL Lombardi DR Farmani F Jefferson I Memon FA Butler D and Rogers CDF
(2012b) Urban Futures and the code for sustainable homes Institution of Civil Engineers Engineering
Sustainability 165 (1) 37ndash58
123 Hunt DVL and Rogers CDF (2014) Rainwater harvesting Trade-offs between pluvial flood risk
alleviation and mains water resource savings Proceedings of the 4th World Sustain Forum 1-30
November 2014 Sciforum Electronic Conference Series Vol 4 2014
124 Boons F and Howard-Grenville J (2009) The social embeddedness of industrial ecology Cheltenham
[ua] Edward Elgar ISBN 978-184-720-782-1 - 2009 p 273-281
125 Clift R (2013) System Approaches Life cycle assessment and industrial ecology Chapter 17 pp385-
416 in Pollution Causes Effects and Control 5th ed (Ed G Harrison) Royal Society of Chemistry
London
126 Zadeh SM Hunt DVL Lombardi D R and Rogers CDF (2014) Carbon costing for mixed-use
greywater recycling systems Proc Institute of Civil Engineers Water Management 1-15
httpdxdoiorg101680wama1200093
127 Feng K Hubacek K Minx J Siu Y Chapagain A Yu Y Guan D Barrett J (2011) Spatially
Explicit Analysis of Water Footprints in the UK Water 3 no 1 47-63
128 Hunt DVL Rogers CDF and Jefferson I (2013) Scenarios analysis through a futures
performance framework Special themed issue of Earth Systems Engineering within Engineering
Sustainability 166 (5) 258-271
129 Hunt DVL and Rogers CDF (2014) A Benchmarking system for Domestic Water Use
Sustainability 6 2993-3018 httpdoi103390su6052993
130 Ekins (2014) Updates on the European funded project Policy Options for a Resource Efficient
Economy (POLFREE) including publications dissemination activities and ongoing research
httpus5campaign-archive2comu=b0b49001d0568fd41fbba5c22ampid=b9dfe1765b
131 Kennedy CA Cuddihy J and Engel Yan J (2007) The changing metabolism of cities Journal of
Industrial Ecology 11 (2) 43-59
31 132 Kennedy C Steinberger J Gasson B Hillman T Havraacutenek M Hansen Y Pataki D
Phdungsilp A Ramaswami A Villalba Mendez G (2009) Greenhouse gas emissions from global
cities Environmental Science and Technology 43 7297-7302
133 Rechberger H Cencic O and Fruhwirth R (2014) Uncertainty in Material Flow Analysis Journal
of Industrial Ecology Volume 18 Issue 2 pages 159ndash160
134 Keirstead J (2014) Fit for Purpose Rethinking Modelling of Industrial Ecology Journal of Industrial
Ecology 18(2) 161-163
135 Grimm V E Revilla U Berger F Jeltsch W M Mooij S F Railsback H -H Thulke J Weiner
T Wiegand and D L DeAngelis (2005) Pattern-oriented modeling of agent-based complex systems
Lessons from ecology Science 310 (5750) 987-991
136 Hinterberger F Omann I Stocker A (2002) Employment and Environment in a Sustainable
Europe Empirica 29 113-130
137 Spangenberg J Omann I Hinterberger F (2002) Sustainable growth criteria Minimum
benchmarks and scenarios for employment and the environment Ecological Economics 42 429-443
138 Lombardi DR Leach JM Rogers CDF Barber A Boyko CT Brown J Bryson J Butler D
Caputo S Caserio M Coles R Cooper R Farmani R Gaterell M Hale J Hales C Hewitt CN
Hunt DVL Jancovic L Jefferson I Mackenzie AR Memon FA Phenix-Walker R Pugh TAM
Sadler JP Weingaertner C Whyatt JD (2012) Designing Resilient Cities A Guide to Good
Practice (EP103) IHS BRE Press
139 Hunt DVL Lombardi DR Atkinson S Barber A Barnes M Boyko CT Brown J Bryson
J Butler D Caputo S Caserio M Coles R Farmani R Gaterell M Hale J Hayes C
Hewitt CN Jankovic L Jefferson I Mackenzie AR Memon FA Whyatt D Weingaertner
Cand Rogers CDF (2012a) Scenario Archetypes Converging rather than Diverging Themes In
Sustainability 4 (4) 740-772
140 Chang Ma HW and Cui G (2012) Ecological Footprint Model Using the Support Vector Machine
Technique PLoS ONE 7(2)
141 Gouldson A Kerr N Topi C Dawkins E Kuylenstierna J and Pearce R (2013) The Economics
of Low Carbon Cities A Mini-Stern Review for Birmingham and the Wider Urban Area - Preliminary
Findings Centre for Low Carbon Futures Leeds UK 56 pages
142 Kytzia S Faist M and Baccini P (2004) Economically-extended ndash MFA A material Flow
Approach for a better understanding of Food Production Chain Journal for Cleaner production
12(810) 877-889
copy 2014 by the authors licensee MDPI Basel Switzerland This article is an open access article
distributed under the terms and conditions of the Creative Commons Attribution license
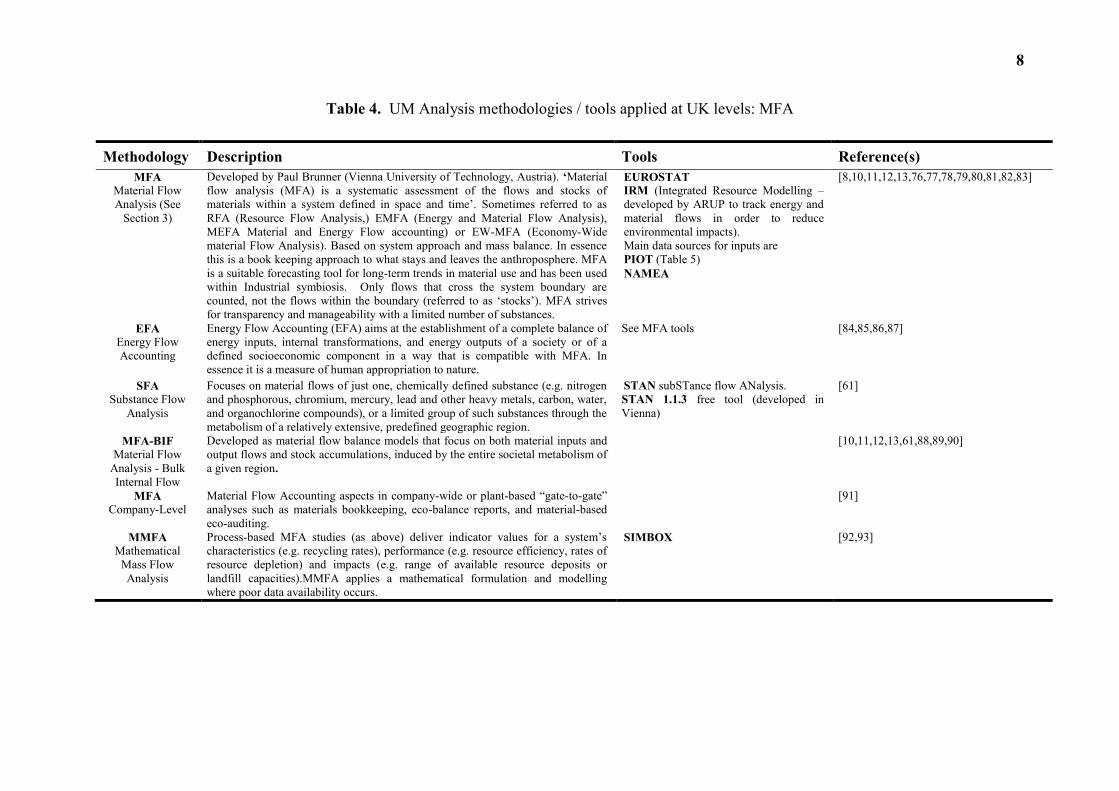