Embed Size (px)
Citation preview

MASTER'S THESIS
Impact of Drilling in Embankment DamsA Comparative study between Water Powered DTH Hammer Drilling
Technology and Hydraulic Top Hammer Drills
Jörg Riechers
Master of Science in Engineering TechnologyCivil Engineering
Luleå University of TechnologyDepartment of Civil, Environmental and Natural Resources Engineering

Impact of Drilling in Embankment Dams
A comparative study between water powered DTH hammer drilling
technology and hydraulic top hammer drills
by
Jörg Riechers, B.Sc.
Luleå 2012
Master of Science in Civil Engineering
Luleå University of Technology Department of Civil, Environmental and Natural Resources Engineering
Division of Mining and Geotechnical Engineering


Impact of Drilling in Embankment Dams
A comparative study between water powered DTH hammer drilling
technology and hydraulic top hammer drills
by
Jörg Riechers, B.Sc.
Approved by: Prof. Dr. Sven Knutsson, Luleå University of Technology
Adj. Prof. Dr. Peter Viklander, Luleå University of Technology
Prof. Dr. Rolf Bracke, Bochum University of Applied Sciences
Luleå 2012
Master of Science in Civil Engineering
Luleå University of Technology Department of Civil, Environmental and Natural Resources Engineering
Division of Mining and Geotechnical Engineering SE – 971 87 Luleå


II
Abstract
Large geotechnical structures such as embankment dams and tailings dams are subject
to high safety requirements. One of the key requirements is long-term stability in order
to avoid incidents and failures as well as to ensure environmental safety during and after
the operational phases. To ensure security, the instrumentation of existing embankment
dams and tailings dams, using drilling technologies, is necessary for surveillance.
Drilling in the structures of dams or in their foundations, however, always entails
certain risks. Therefore, the selection of drilling technologies must be carried out
carefully, taking into account the condition and sensitivity of each dam section.
A continuous evaluation and development of existing drilling requirements is an
important safety aspect.
The main objective of this comparative study, implemented in collaboration between
LKAB, Wassara AB, Sweco Infrastructure AB and Luleå University of Technology in
Malmberget, Sweden, is to analyse the influence on surrounding soil of a water powered
DTH hammer system and top hammer drillings with different setups during the drilling
process. Covering an area of 800 m², an artificial dam with a height of 3 m was built
and compacted in layers. The soil used was characterised as gravelly sand. Drillings
were done vertical and inclined. Weight sounding tests before and after drilling,
excavation of boreholes as well as soil sampling for further laboratory analysis have all
been conducted. Complementing this research project, one vertical borehole with a
depth of 30 m has been drilled with Wassara’s Lost Hammer concept (LHC) in the
tailings dam of LKAB in Malmberget.
This study concludes by stating that, for the analysed drilling formation, the average
radius of influence on soil was identical (0.49 m along the borehole axis) for both the
water powered DTH and the hydraulic top hammer system with a pre-drilling protective
casing. Top hammer drillings in combination with a casing drilling system (Symmetrix)
indicate an increased average zone of influence of 0.72 m around the boreholes.
Measurements collected while drilling, correlated with laboratory analyses and weight
sounding tests, reveal that the rearrangement of soil particles depends on the interaction
of applied down-thrust, the vibration of the drill string, the amount of drained flushing
water towards the adjacent soil and existing pressure conditions within the embankment
structure.

III
Zusammenfassung
Große geotechnische Bauwerke unterliegen hohen Sicherheitsanforderungen. Dazu
zählen unter anderem Staudämme sowie Dämme zum Rückhalt und Lagerung von
Minenabraum, sogenannte Tailings. Sowohl während als auch nach der Nutzungsphase
von Dämmen ist die Langzeitstabilität, zur Vermeidung von strukturellen
Versagenserscheinungen mit Auswirkungen auf den Menschen und der Natur, eine der
wesentlichen Anforderungs-kriterien. Eine nachträgliche Instrumentierung von Stau-
und Tailings-Dämmen ist meist nur durch die Verwendung von Bohrtechnik zu
realisieren. Bohrungen in den Dammkörper sowie in dessen Fundament stellen jedoch
immer ein Risiko dar. Die Auswahl eines geeigneten Bohrverfahrens in Abhängigkeit
der Eigenschaften und des Zustandes eines jeden Dammbereiches ist daher besonders
wichtig. Das Hauptziel dieser Vergleichsstudie ist die Analyse eines mit
Hochdruckwasser betriebenen Imlochhammers (DTH) sowie eines hydraulischen
Bohrhammers in verschiedenen Ausführungen hinsichtlich der Auswirkungen des
Bohrprozesses auf einen empfindlichen Bodenaufbau. Die Studie wurde in Kooperation
zwischen den schwedischen Unternehmen LKAB, Wassara AB und
Sweco Infrastructure AB sowie Luleå University of Technology durchgeführt.
Für Testbohrungen wurde ein künstlicher Damm auf einer Fläche von 800 m² mit einer
Höhe von 3 m aus Kiessand mit einer lagenweisen Verdichtung errichtet. Umfangreiche
in-situ und Laboruntersuchungen wurden vor und nach den Bohrungen durchgeführt.
Unabhängig davon wurde eine 30 m tiefe Bohrung mit Wassara’s „Lost Hammer
Concept (LHC)“ in den Tailing-Damm der LKAB in Malmberget, Schweden, abgeteuft.
Innerhalb dieser Studie konnte ein Einflussradius um die Bohrlochachse von 0.49 m für
den mit Hochdruckwasser betriebenen DTH Hammer sowie für den hydraulischen
Bohrhammer, unter Verwendung einer vorbohrenden Schutzverrohrung sowie eines
nicht kontinuierlichen Spülprozesses, ermittelt werden. Der hydraulische Bohrhammer
in Kombination mit einer kontinuierlich mitgeführten Schutzverrohrung (Symmetrix)
weißt hingegen einen erhöhten Einflussradius von 0.72 m auf. Die Korrelation von
Bohrinformationen, Ergebnisse von Laboruntersuchungen und in-situ Gewichts-
sondierungen verdeutlicht den Umlagerungsprozess von Lockergesteinen, welcher von
den Wechselwirkungen zwischen Andruckkraft, Gestängevibration, der Menge des
Spülmediums sowie den vorhandenen Druckverhältnissen in der Dammstruktur
abhängt.

IV
Acknowledgements
Following my bachelor’s thesis, carried out in collaboration with Wassara AB in
Stockholm 2010, I always had the wish to complete my master studies with a further in
Sweden.
Therefore I would like to thank sincerely Professor Sven Knutsson and Johan Jeansson,
R&D manager at Wassara AB, for making it possible to write this master thesis at Luleå
University of Technology at Luleå. Furthermore I want to thank Peter Viklander,
associate professor at Luleå University of Technology and consultant at
WSP Sweden AB, group manager in geotechnics Peder Hansson at
Sweco Infrastructure AB and development engineer Magnus Hörman at Wassara AB
for the support and guidance I received during the project and completion of this final
report. I also want to thank LKAB for supplying us with test fields in Malmberget as
well as the supply of material and machinery for constructing of the embankment.
The research presented in this thesis was carried out as a part of "Swedish Hydropower
Centre - SVC". SVC has been established by the Swedish Energy Agency, Elforsk and
Svenska Kraftnät together with Luleå University of Technology, The Royal Institute of
Technology, Chalmers University of Technology and Uppsala University, and more
than 20 hydropower companies in Sweden are members.

V

VI
Table of Contents
Table of Contents ................................................................................................................... VI
List of Figures ........................................................................................................................ IX
List of Tables ....................................................................................................................... XIII
1 Introduction ...................................................................................................................... 1
2 Design and Construction of Embankment Dams .......................................................... 2
2.1 Types of Embankments Dams ...................................................................................... 3
2.2 Structural Components .................................................................................................. 5
2.2.1 Foundation..................................................................................................................... 6
2.2.2 Impervious Core ............................................................................................................ 8
2.2.3 Filter and Drain ........................................................................................................... 10
2.2.4 Supporting Fill ............................................................................................................ 15
2.2.5 Further Components of Embankment Dams ............................................................... 16
3 Tailings Dams and Impoundments ............................................................................... 18
3.1 Impoundment Types .................................................................................................... 19
3.1.1 Cross-Valley Design ................................................................................................... 20
3.1.2 Ring-Dike Design........................................................................................................ 20
3.2 Structures and Design Methods .................................................................................. 22
3.2.1 Dams with Tailings and a Low Permeable Zone ........................................................ 23
3.2.2 Dams with Tailings in Structural Zone ....................................................................... 23
3.3 Swedish Tailings Dams ............................................................................................... 28
3.3.1 Remediation ................................................................................................................ 30
4 Instrumentation and Monitoring .................................................................................. 31
4.1 Monitoring Wells and Piezometers ............................................................................. 32
4.2 Inclinometer ................................................................................................................ 34

VII
5 Drilling in Embankment Dams ..................................................................................... 37
5.1 Drilling Risks .............................................................................................................. 37
5.2 Hydraulic Top Hammer Drilling ................................................................................. 39
5.2.1 Performance and Drilling Accuracy ............................................................................ 42
5.3 Water Powered DTH Hammer Drilling Technology .................................................. 43
5.3.1 Pump and Drilling Fluid.............................................................................................. 44
5.3.2 Hammer Design .......................................................................................................... 47
5.3.3 Operating Principle ..................................................................................................... 48
5.3.4 Drill Bits and RPM...................................................................................................... 51
5.3.5 Performance and Drilling Accuracy ............................................................................ 55
5.4 Wassara W 35 DTH hammer for Embankment Dam Instrumentations ..................... 57
5.4.1 Construction Details of the Lifting Device ................................................................. 59
5.4.2 Suitable Dam Instrumentation ..................................................................................... 61
6 Reference Project ............................................................................................................ 63
6.1 Test Field I .................................................................................................................. 63
6.1.1 Test Field Construction ............................................................................................... 65
6.1.2 Soil Characteristics ...................................................................................................... 67
6.1.3 Drilling Operations and Drill Setups........................................................................... 76
6.1.4 Measurement While Drilling (MWD) ......................................................................... 82
6.1.5 Weight Sounding ......................................................................................................... 85
6.1.6 Sampling ..................................................................................................................... 89
6.2 Test Field II ................................................................................................................. 90
6.2.1 Borehole Position and Dam Characteristics ................................................................ 92

VIII
7 Results .............................................................................................................................. 94
7.1 Test Field I .................................................................................................................. 94
7.1.1 Measurements While Drilling (MWD) ....................................................................... 94
7.1.2 Weight Sounding (WST) ............................................................................................. 96
7.1.3 Grain-size Distribution ................................................................................................ 99
7.2 Test Field II ............................................................................................................... 102
7.2.1 Measurements While Drilling (MWD) ..................................................................... 102
8 Discussion ...................................................................................................................... 104
8.1 Measurements While Drilling (MWD) ..................................................................... 104
8.1.1 Setup 1 (W) ............................................................................................................... 104
8.1.2 Setup 2 (S) ................................................................................................................. 106
8.1.3 Setup 3 (OD) ............................................................................................................. 108
8.2 Weight Sounding (WST) and Grain-size Distribution .............................................. 110
8.2.1 Setup 1 (W) ............................................................................................................... 110
8.2.2 Setup 2 (S) ................................................................................................................. 112
8.2.3 Setup 3 (OD) ............................................................................................................. 114
9 Conclusion ..................................................................................................................... 117
10 Recommended Future Studies ..................................................................................... 118
References.............................................................................................................................. 119
Appendix A: Site plan of Test Field I ................................................................................. 122
Appendix B: Drilling and Measured Parameters .............................................................. 123
Appendix C: Laboratory Analyses ..................................................................................... 137
Appendix D: Photos .............................................................................................................. 142

IX
List of Figures
Figure 1: Large hydropower dams in Sweden arranged by year of completion (ICOLD 1998). ....... 2
Figure 2: Cross-section of a homogeneous earth dam (Narita 2000). ................................................ 3
Figure 3: Cross-section of a rock-fill dam with a core in the centre (Narita 2000)............................ 4
Figure 4: Cross-section of a rock-fill dam with an inclined core (Narita 2000). ............................... 4
Figure 5: Cross-section of a rock-fill dam with a facing (Narita 2000). ............................................ 4
Figure 6: Cross-section of a typical embankment dam with component terms (FEMA 2011). ......... 5
Figure 7: Setup of a Lugeon Test (Quiñones-Rozo 2010). ................................................................ 7
Figure 8: Acceptable zone of moraine material concerning dry density, water content and
air space ratio (RIDAS 2012). Figure modified by Jörg Riechers. .................................... 9
Figure 9: Movement of s. particles in a cracked zone is stopped at the filter face (FEMA 2011). .. 10
Figure 10: High gradients between water in the crack and the adjacent filter material
caused a widening of the pipe within the soil (FEMA 2011). ......................................... 11
Figure 11: Further widening of the filter cake until the water gradient is reduced (FEMA 2011). . 11
Figure 12: Cross-section: Tailings dam water cycle (European Commission 2004). ...................... 18
Figure 13: Overview on Valley Impoundments. a) Single Cross-Valley,
b) Multiple Cross-Valley (Vick 1990). ............................................................................ 20
Figure 14: Overview on Ring-Dike impoundments. a) Single, b) Segmented design (Vick 1990). 21
Figure 15: Cross-section of a tailings retention dam, comparable to typical WRDs
(Environmental Protection Agency 1994, Vick 1990). ................................................... 22
Figure 16: Cross-section of a tailings dam with a low permeable core zone (beach)
(European Commission 2004). ........................................................................................ 23
Figure 17: Tailings dams design methods: a) Upstream, b) Centerline,
c) Downstream (Vick 1990). ........................................................................................... 24
Figure 18: Incremental raising upstream tailings dam (Vick 1990). ................................................ 24
Figure 19: Incremental raising downstream tailings dam (Vick 1990). ........................................... 25
Figure 20: Hydrocyclones on a dam crest (European Commission 2004). ...................................... 25
Figure 21: Incremental raising upstream tailings dam (Vick 1990). ................................................ 27
Figure 22: Swedish mines and tailings dams in operation, 2005 (left hand side)
(Bjelkevik 2005a) and Swedish dams including the classification of height
(right hand side) (Swedish National Grid 2011). ............................................................. 28
Figure 23: Different types of failure mechanism of embankment dams (Bettzieche 2008).
Modified and translated by Jörg Riechers. ...................................................................... 31
Figure 24: Schematic view of monitoring well (left hand side) and of open standpipe
piezometer (U.S. Army Corps of Engineers 1995). ......................................................... 32

X
Figure 25: An embankment dam with impervious core and installed piezometers
(DWA-M 514 2011). Modified and translated by Jörg Riechers. ................................... 33
Figure 26: Possible positions for measurements of vertical and horizontal displacement
in an embankment dam (DWA-M 514 2011). ................................................................. 34
Figure 27: Example of displacement measurement (left hand side) and a schematic
drawing of inclinometer operation (MSHA 2009). .......................................................... 35
Figure 28: Detail of inclinometer, configuration and installation (Stark, Choi 2008). .................... 35
Figure 29: Rotary percussive methods: Top hammer (left side), and down-the-hole hammer
(right side) (Rabia 1985). ................................................................................................. 39
Figure 30: Operation principle of hydraulic top hammers (Zablocki 2006). ................................... 40
Figure 31: Hydraulic percussive hammer (hydraulic drifter) for underground
applications (Corcoran 2009). .......................................................................................... 40
Figure 32: Swivel including high-pressure hose mounted on a rotating head (Riechers 2010). ...... 43
Figure 33: Distance to the borehole wall; hammer and additional stabiliser (Riechers 2010). ........ 47
Figure 34: Operation principle: 1. Cross-section of a DTH hammer (Riechers 2010). ................... 48
Figure 35: Operation principle: 2. Cross-section of a DTH hammer (Riechers 2010). ................... 48
Figure 36: Operation principle: 3. Cross-section of a DTH hammer (Riechers 2010). ................... 49
Figure 37: Operation principle: 4. Cross-section of a DTH hammer (Riechers 2010). ................... 49
Figure 38: Operation principle: 5. Cross-section of a DTH hammer (Riechers 2010). ................... 50
Figure 39: Check valve between hammer and drill string (Riechers 2010). .................................... 50
Figure 40: Different rock properties (Dessureault 2003). ................................................................ 51
Figure 41: Relative quartzite content in different rock types (Dessureault 2003)............................ 52
Figure 42: Characteristics of drill bits for water powered DTH hammers (Riechers 2010). ........... 53
Figure 43: Advantages of an optimum RPM (Riechers 2010). ........................................................ 54
Figure 44: Measured borehole deviations (Riechers 2010). ............................................................. 56
Figure 45: View and cross-section of Wassara W 35 DTH hammer (Wassara AB 2012a). ........... 57
Figure 46: Principle of the LHC: lifting device is in position before lock into place
(upper figure), hydraulic connection is opened (lower figure) (Wassara AB 2012a). ..... 58
Figure 47: View and cross-section of the lifting device (Wassara AB 2012a). ............................... 59
Figure 48: View of the filter pipe and lifting device that is connected to a steel cable.................... 60
Figure 49: Hollow plug connection on the filter pipe (left); detail of filter pipe and
installed flow tube (right). ............................................................................................... 60
Figure 50: Schematic drawing of an installed SAA in LH. .............................................................. 61
Figure 51: SAA rolled on a reel (left hand side); schematic recording and processing
principle (right hand side) (Measurand 2012). ................................................................ 61
Figure 52: Example of measured soil movements in a highway embankment (Dasenbrock
2010). ............................................................................................................................... 62

XI
Figure 53: Completed test field. ....................................................................................................... 63
Figure 54: Location of Test Field I on the mine site in Malmberget, LKAB (Brännström 2012). .. 64
Figure 55: Top view and cross-section of the planned test field. ..................................................... 65
Figure 56: Construction of the first layer: material delivery, material distribution
and pre-compaction.......................................................................................................... 65
Figure 57: Construction of the second layer. ................................................................................... 66
Figure 58: Finished construction of Test Field I. See also Figure 59. .............................................. 66
Figure 59: Compaction with a 6 t vibratory roller pulled by a wheel loader. .................................. 67
Figure 60: Compaction test: Impact of compaction in a soil volume (Bardet 1997). ...................... 68
Figure 61: Proctor curve for Test Field I. ......................................................................................... 68
Figure 62: Sieving apparatus. ........................................................................................................... 69
Figure 63: Grain-size distribution cuve (Sample 1) for Test Field I. ............................................... 71
Figure 64: Schematic view of the rubber balloon apparatus (left hand side) (Jantzer 2009)
and its use in field I (right hand side). ............................................................................. 72
Figure 65: Used drilling rig: Geomek GM 75 GT. ........................................................................... 76
Figure 66: Drilling with inclination: W 35 (left hand side) and top hammer with Symmetrix
(right hand side). .............................................................................................................. 77
Figure 67: Starting point for drilling with W 35. ............................................................................. 79
Figure 68: Symmetrix drilling principle (left hand side) (Atlas Copco 2008) and view
before drilling (right hand side). ...................................................................................... 80
Figure 69: Filterpipe. ........................................................................................................................ 80
Figure 70: Inner drill bit (left hand side) and casing bit (right hand side) (Boart Longyear
2012). ............................................................................................................................... 81
Figure 71: Drilling rig in position for the first WST in the middle of the test field. ........................ 85
Figure 72: WST – distances: 20 cm (left hand side) and 50 cm (right hand side). .......................... 86
Figure 73: Overview of a WST system (ENV 1997:3-2000) and a used screw shaped point
(right hand side) (Smoltczyk 2003). ................................................................................ 87
Figure 74: Example of relations between different parameters based on weight
sounding resistances (BS EN 1997-2:2007). ................................................................... 88
Figure 75: Excavation of a pit with a depth of approximately 3.5 m after drilling. ......................... 89
Figure 76: Removal of the remaining soil close to drill pipe, soil sampling and documentation. .. 89
Figure 77: Position of the deep borehole for long-term measurements. .......................................... 90
Figure 78: LHC before drilling. ....................................................................................................... 91
Figure 79: Location of Test Field II in the C-D-E-F dam at the mine site in
Malmberget (Brännström 2012). ..................................................................................... 92
Figure 80: Position of the borehole parallel to the cross-section of section M1 (LKAB 2012). ...... 92
Figure 81: Cross-section of M1 and marked borehole (LKAB, 2012). ............................................ 93

XII
Figure 82: A typical grain-size distribution curve for used material in the downstream shell. ........ 93
Figure 83: Overall average values: Rate of penetration (left hand side), down-thrust
(right hand side). .............................................................................................................. 94
Figure 84: Overall average values: Comparison between the process of ROP and
down-thrust per setup....................................................................................................... 95
Figure 85: Overall average values: Flow rate. ................................................................................. 95
Figure 86: Percentage difference in soil resistance between different distances per setup
and WST F1. .................................................................................................................... 97
Figure 87: Process of percentage difference in sieve passing and calculated linear forecast lines. . 98
Figure 88: Average grain-size distribution cuve for each drill setup. .............................................. 99
Figure 89: Difference in percentage for each mesh size in the drill setups. ................................... 100
Figure 90: Absolute values of difference in sieve result between the drill setups. ........................ 101
Figure 91: Comparison between DH1 and the overall average of setup W in Test Field I
in terms of ROP (left hand side) and down-thrust (right hand side). ............................ 102
Figure 92: Comparison between the process of ROP and down-thrust and presenting
an ROP trendline. ........................................................................................................... 103
Figure 93: Comparison between DH1 and the overall average of setup 1 (W) in
Test Field I in terms of flow rate. .................................................................................. 103
Figure 94: Example of borehole details of setup 1 (W): inclined borehole (left hand side),
vertical borehole (middle) and sedimentation of cuttings and fines (right hand side). .. 105
Figure 95: Example of borehole details of setup 2 (S): inclined borehole (left hand side)
and influence by installation of a filter pipe in a vertical borehole (right hand side). ... 107
Figure 96: Example of borehole details of setup 3 (OD): inclined borehole (left hand side)
and influence by installation of a filter pipe in a vertical borehole (right hand side). ... 109
Figure 97: Visualization of each drill setup and the corresponding visible (blue dotted line)
and calculated (red dashed line) radius of influence. ..................................................... 116

XIII
List of Tables
Table 1: Common grain-size distribution of filter material (Kjærnsli, Valstad et al. 2003). ........... 13
Table 2: Size limits of filter material to avoid separation (RIDAS 2012). ....................................... 13
Table 3: Overview on safety factors for different loading conditions (RIDAS 2012). .................... 15
Table 4: General data about Swedish tailings dams and capacities
(Benckert, Eurenius 2001). Foot print area, according to (Bjelkevik 2005b). ................. 29
Table 5: Operating pressure and water consumption of Wassara DTH hammers
(Wassara AB 2012b). ....................................................................................................... 44
Table 6: High-pressure pumps, usually used to drive DTH hammers of Wassara
(Wassara AB 2012b). ....................................................................................................... 45
Table 7: DTH drill bits: surface designs and button forms (Riechers 2010). ................................... 52
Table 8: Gradation resuls for Test Field I. ....................................................................................... 70
Table 9: Values of rubber balloon tests. ........................................................................................... 73
Table 10: Specific gravity and porosity. .......................................................................................... 74
Table 11: Estimated soil parameters based on weight sounding and experiences
after BS EN 1997-2:2007. ............................................................................................... 75
Table 12: Performance overview of GM 75 GT (Geomek 2012). ................................................... 76
Table 13: Grain-size distribution in the downstream shell (WSP, 2011). ........................................ 93
Table 14: Estimated soil parameters based on weight soundings after drilling and experiences
after BS EN 1997-2:2007. ............................................................................................... 97

1 Introduction
1
1 Introduction
The instrumentation of embankment dams as well as tailings dams for different
surveillance purposes is necessary for an early detection of structural changes in order to
prevent incidents and failures. The installation of stand pipes in order to measure the
seepage line or inclinometer devices to measure lateral displacements of dam shoulders,
for instance, during operation of dams is possible by the use of drilling technology.
Drilling applications in existing dam structures or in the foundation, however, represent
always risks. Therefore, the selection between different existing drilling technologies must
be carried out carefully, taking into account the condition and sensitivity of different dam
sections. Over the recent decades, several national authorities and dam operators
established different regulation concerning drilling operations. A continuous evaluation
and development of drilling requirements is an important safety aspect.
In contrast to the development efforts in the area of enhanced and efficient drilling
technologies, the share of research for the investigation of influences of drilling
technologies on different soil structures is still limited. Thus, this research study,
implemented in collaboration between LKAB, Wassara AB, Sweco Infrastructure AB and
Luleå University of Technology in Malmberget, Sweden, can be considered as an
important first research step of a planned comprehensive drill research program in Sweden.
The main objective of this comparative study is to analyse the influence of drilling
technologies on gravely sand, a sensitive soil characteristic to the drilling process, in
connection with its use in embankment dam structures. In this context, a direct comparison
between hydraulic top hammer drilling and a water powered DTH hammer, used in
connection with Wassara’s Lost Hammer Concept (LHC) for dam instrumentation, has
been implemented within a reference project. In addition to a detailed technical
explanation of the top hammer system and the LHC, the design and construction
characteristics of embankment dams and tailings dams as well as general drilling risks are
comprehensively discussed within the thesis.

2 Design and Construction of Embankment Dams
2
2 Design and Construction of Embankment Dams
Embankment dams, usually constructed for use as Water Retention Dams (WRD) for
several industrial purposes, are divided in two groups depending on main construction
material used, i.e. earth-filled and rock-filled embankment dams (Narita 2000).
The International Commission on Large Dams (ICOLD) defined an earth-filled dam as an
embankment dam, consisting of soil with more than 50 volume-% of fill. In this context
soil is understood as clay, silt, sand, or gravel (Kjærnsli et al. 2003). A Rock-fill dam on
the other hand, after ICOLD, is described as an embankment dam, consisting of rock with
more than 50 volume-% of fill. Thus, rock material is obtained from rock quarry or rock
excavation of natural boulders and stones (Kjærnsli et al. 2003). Between 1998 and 2000
approximately 1,000 high dams, defined as dams with a height of more than 15 m after
ICOLD, have been constructed. 80 % of them are embankment dams and 20 % concrete
dams (Narita 2000). Embankment dams are very common in Norway and Sweden, whereas
natural moraine is mainly used in the construction of the impervious embankment core
(Kjærnsli et al. 2003). In Figure 1 the year of completion and number of large dams of
altogether about 10,000 in Sweden during the 20th century is shown.
Figure 1: Large hydropower dams in Sweden arranged by year of completion (ICOLD 1998).
Approximately 60 % of Sweden is covered by moraine, defined as carried and deposited
material by a glacier (Benckert and Eurenius 2001). After Kjærnsli et al. (2003), moraine is
a broadly sorted combination of stones, gravel, sand, silt and clay.
The following sections describe typical embankment dam and construction types and
a discussion of general structural elements and their function.

2 Design and Construction of Embankment Dams
3
2.1 Types of Embankments Dams
Earth-fill and rock-fill dams are common classifications of embankment dams, as
described previously. Furthermore, two types of embankment dams are characterised as
“homogeneous embankment” and “zoned embankment”, after Stephens (2010).
According to this, a homogeneous earth-fill embankment dam is constructed by one main
kind of low permeability material having flat slopes, which provides structural and seepage
resistance in combination with a drainage system, see Figure 2 (Narita 2000).
Zoned embankment dams usually are constructed as rock-fill dams, on the other hand, they
are consisting of several main structural elements as an impervious core, filters, draining
and transition zones, and supporting fill. The foundation represents the basic stable level
for the construction of an embankment dam.
Nowadays, several construction types are available and some common types are illustrated
below from Figure 2 to Figure 5. In general, the embankment dam type is determined by
careful consideration concerning the geology and topography conditions on site,
environmental and climate restrictions, the availability and quality of construction material,
and the operation purpose.
Figure 2: Cross-section of a homogeneous earth dam (Narita 2000).
Swedish embankment dams are usually constructed as zoned dams with an impermeable
central core, see Figure 3, respectively an inclined core, after Figure 4 (RIDAS 2012).

2 Design and Construction of Embankment Dams
4
Figure 3: Cross-section of a rock-fill dam with a core in the centre (Narita 2000).
The inclined core variant, for instance, is used in case of a steep inclined dam foundation,
where a vertical connection between an impervious foundation and dam core is not
possible, and where different construction processes are performed for material insertion
(Narita 2000).
Figure 4: Cross-section of a rock-fill dam with an inclined core (Narita 2000).
Figure 5 shows a rock-fill dam with an impervious facing and a transition downstream.
This construction tends to have problems caused by external erosion due to the location of
this leak-proof layer. Asphalt concrete and bituminous sealings are common used facing
materials (Narita 2000).
Figure 5: Cross-section of a rock-fill dam with a facing (Narita 2000).

2 Design and Construction of Embankment Dams
5
2.2 Structural Components
Within this section the emphases in connection with embankment dams are discussed
according to the following list on the basis of Figure 6:
foundation,
impervious core,
filter and drain including filter criteria and layer construction,
and supporting fill.
Further components, illustrated in Figure 6, are explained in section 2.2.5.
Besides the used international English literature, this section considered as well the
Swedish guideline RIDAS (2012), known as “Hydropower Industry Dam Safety
Guidelines” published by Svensk Energi AB.
Figure 6: Cross-section of a typical embankment dam with component terms (FEMA 2011).
2 Design and Construction of Embankment Dams
6
2.2.1 Foundation
The foundation of an embankment dam is in general depending on local topography, loads
of the embankment dam itself and the reservoir, and the permeability conditions of the
overburden respectively the foundation rock (Kjærnsli et al. 2003). Consequently, the
foundation and overlaying dam elements must form an effective and stable unit.
Furthermore, it is important that the selected dam design and monitoring system,
for seepage and pore pressure analyses in the foundation, are suitable for the specific
ground conditions (Kjærnsli et al. 2003).
In the case of a thin cover by overburden or an exposed rock foundation surface, the rock
may be analysed by geological mapping (Kjærnsli et al. 2003). For more details it is
common, after Kjærnsli et al. (2003), to perform drillings for core sampling and pumping
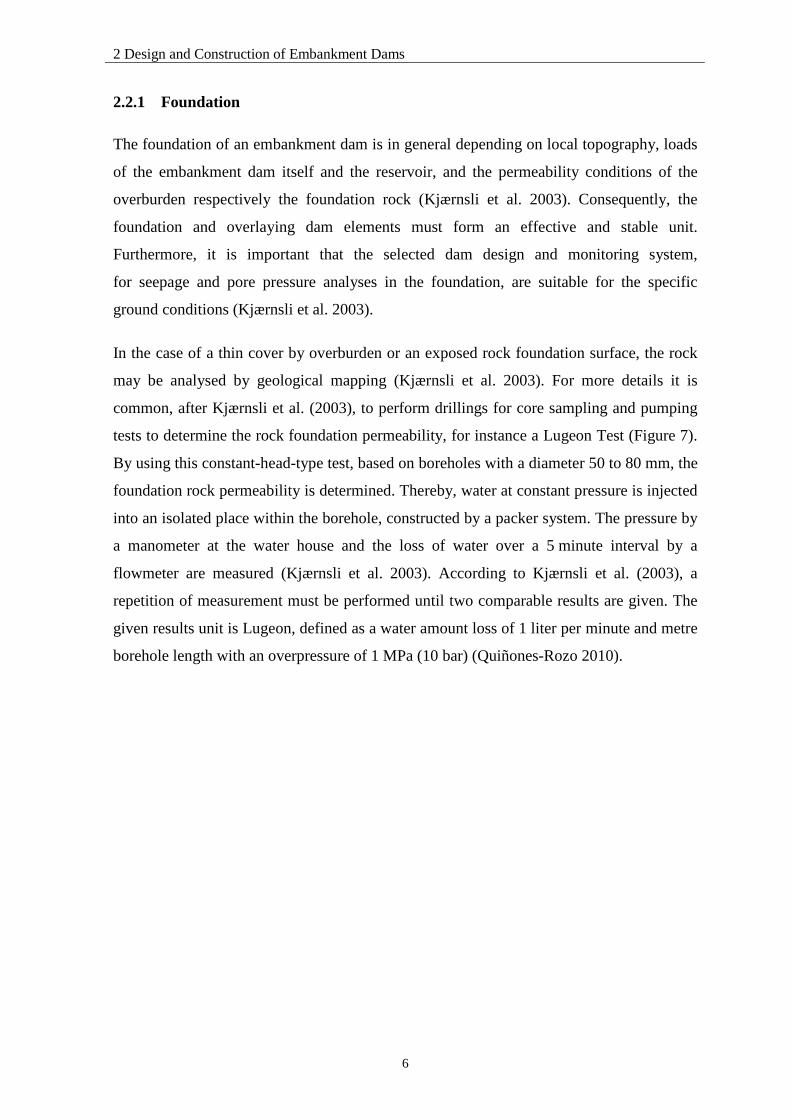
tests to determine the rock foundation permeability, for instance a Lugeon Test (Figure 7).
By using this constant-head-type test, based on boreholes with a diameter 50 to 80 mm, the
foundation rock permeability is determined. Thereby, water at constant pressure is injected
into an isolated place within the borehole, constructed by a packer system. The pressure by
a manometer at the water house and the loss of water over a 5 minute interval by a
flowmeter are measured (Kjærnsli et al. 2003). According to Kjærnsli et al. (2003), a
repetition of measurement must be performed until two comparable results are given. The
given results unit is Lugeon, defined as a water amount loss of 1 liter per minute and metre
borehole length with an overpressure of 1 MPa (10 bar) (Quiñones-Rozo 2010).

2 Design and Construction of Embankment Dams
7
Figure 7: Setup of a Lugeon Test (Quiñones-Rozo 2010).
It can be assumed that the measured water loss (lugeon-value) occur due to an existing
crack mesh in the borehole adjacent to the rock. Thus, the lugeon-value can be converted,
after Kjærnsli et al. (2003), to the following coefficient of permeability (hydraulic
conductivity).
1 L (lugeon) ≈ 1.5 ∙ 10-7 m/s
In this context, embankment dam foundations on bedrock can be considered as suitable, if
the lugeon values do not overstep 1 to 4 L (Kjærnsli et al. 2003). So, a foundation having
slightly higher permeability than a typical moraine core, with a permeability range from
10-7 m/s to 10-9 m/s, can be assumed (Kjærnsli et al. 2003). RIDAS recommend a more
stringent permeability value of dam foundations. According to this guideline, a value of
water loss less than 1.0 l/min, m, MPa 1 L, is appropriate (RIDAS 2012). The target value
of less than 1 L is lower than the recommended range of 1-4 L, after Kjærnsli et al. (2003),
and may provide a higher foundation quality.
Treatments and preparation of rock foundations and used overburden on site are required,
if hydraulic conductivity limits are exceeded. The state of art is to perform grouting
drillings until a stable and impervious rock zone is reached respectively down to a depth of
two thirds of the dam height (Kjærnsli et al. 2003). In addition, weathered or effected
surface rock of unusable quality has to be removed by excavation down to an unweathered
rock layer and weak zones must be covered by concrete.

2 Design and Construction of Embankment Dams
8
2.2.2 Impervious Core
Following, specification requirements of core material for the use in embankment dams
with an impervious core of moraine, common in Sweden and Norway, are described.
The key function of the impermeable core is to ensure an effective sealing against water
movements downstream respectively upstream through the embankment body.
The impervious core of an embankment dam can be classified into two groups, i.e. with a
centrally located vertical core and an inclined core respectively, see section 2.1
(Narita 2000). Regardless of the type, they are usually divided into several horizontal
layers as filter, drain, and supporting zones (Kjærnsli et al. 2003).
Most suitable materials for cores are impervious materials with well graded properties that
provide appropriate compactions (RIDAS 2012). Thus, the moraine should consist of silty
sand with a relatively low proportion of stones (RIDAS 2012). In general, the maximum
stone size of layered zones, after Kjærnsli et al. (2003), should be limited to 1/2 to 2/3 of
the used layer thickness.
Swedish moraine frequently contains 30 % of fine material, defined after RIDAS (2012),
with a particle diameter < 0.06 mm. Moraine, used as core material, should have a fine
content at least 15 % of dry weight with regards to material < 20 mm (RIDAS 2012).
According to this, the aim is to achieve a hydraulic conductivity of 3 x 10⁻⁷ m/s or less
(RIDAS 2012).
Additionally, the guideline RIDAS recommend maximum water content of 3 % in the
moraine above the optimal water content (Wopt) on the “wet site” to ensure core reliability.
In order to ensure settlement safety, the air content ratio of the moraine is limited to 10 %
(RIDAS 2012). The observance of a certain compaction degree was used in Sweden before
the described regulation on air content ratios. Both requirements exist, after Narita (2000),
in order to maintain required strength and permeability in the field. Thus, strength and
permeability of compacted soils are related in advance with dry density by use of
laboratory test results (Narita 2000).
These laboratory analyses on impervious soils are primarily conducted by Proctor tests
where maximum dry density and optimum water content values are measured
(FEMA 2011). According to this, the maximum dry density is also known in international
literature as “Proctor Density” (FEMA 2011).

2 Design and Construction of Embankment Dams
9
The following Figure 8, after RIDAS (2012), illustrates paradigmatic the acceptable zone
(green parallelogram) giving a satisfied compaction of the moraine unity on the basis of a
moisture-density curve. Gained results are provided on the basis of laboratory tests of
samples from the used construction material.
Figure 8: Acceptable zone of moraine material concerning dry density, water content and air space ratio (RIDAS 2012). Figure modified by Jörg Riechers.
For the compaction of impermeable moraine, vibratory roller machines usually use in
contrast to coarse filter and drain material higher frequencies and lower amplitudes
(Kjærnsli et al. 2003). A range of 6-8 passes for compaction of each layer with a usual
height of 0.5 m, after Kjærnsli et al. (2003), is performed by a 10-15 t vibratory roller.
Generally, the compaction work and layer thickness must be coordinated between the
existing water content and the content of fines to ensure an effective degree of compaction
(Kjærnsli et al. 2003). During construction several samples must be taken for laboratory
tests concerning water content, dry density, permeability and grain-size distribution to
ensure acceptable quality (Kjærnsli et al. 2003). Such tests are also carried out during
construction of other zones of embankment dams, for instance, the filer and drainage zone,
despite the number of samples are less.
ρ dm
ax
Wopt

2 Design and Construction of Embankment Dams
10
2.2.3 Filter and Drain
Filters, used to prevent movements of soil particles due to water flow from respectively
between zones and foundations of embankment dams, are known historically since
hundreds of years (FEMA 2011). In this context, after Kjærnsli et al. (2003),
the upstream filter prevents the washing out of fine particles due to waves and rapid
drawdowns of the reservoir level. The downstream filter opposite the impervious core
filters the existing seepage water (Kjærnsli et al. 2003). Two basic mechanisms generate
the particle movements within and below the embankment, after FEMA (2011): internal
erosion and backward-erosion (piping). Internal erosion can lead to mobilization of soil
particles due to excessive flow rates. On the other hand a backward-erosion, also known as
piping effect, is caused by internal erosion and can be explained as a removal of
embankment respectively foundation material by flowing fluids through small cross
sections “pipes” from the downstream side to the upstream side (FEMA 2011).
In this context, a filter protects the embankment dam against leakages that could cause
water loss or structural failure. According to FEMA (2011), approximately 50 % of all
embankment dam failures are caused of a high flow rate of seepage water.
The principle of a self-healing by clogging is described in detail by Figure 9 to Figure 11,
after FEMA (2011). Eroded soil from a crack is stopped at the surface of the filter and
therefore the flow in the crack is stopped, as shown in Figure 9.
Figure 9: Movement of soil particles in a cracked zone is stopped at the filter face (FEMA 2011).
High water gradient causes hydraulic fracturing around the crack and filter zone.
As a result, a widening of the open pipe in the soil occurs by high water pressures and
velocities, as illustrated in Figure 10.

2 Design and Construction of Embankment Dams
11
Figure 10: High gradients between water in the crack and the adjacent filter material caused a widening of the pipe within the soil (FEMA 2011).
The widening of adjacent soil continues until the hydraulic gradient is reduced, see Figure
11. The produced filter cake has a very low permeability and prevents a soil movement
through the filter range. The spaces within the filter zone below the filter cake are open and
enable seepage drainage towards the drain system.
Figure 11: Further widening of the filter cake until the water gradient is reduced (FEMA 2011).
A filter, as described before, intercepts the seepage flow (water) from the zone with a high
hydrostatic gradient and reduces them to nearly 100 % by using the adjacent drainage zone
(FEMA 2011). Typical proceeds of the phreatic surface and the drop down of the
hydrostatic head over a certain distance are illustrated in Figure 2 to Figure 5, section 2.1.
Filters are designed in combination with an efficient drain system. This system enables the
drainage of incoming water through the filter away from the embankment dam, mainly
build of particles in size of sand and gravel (Kjærnsli et al. 2003). Thus, the pressure
behind the core is reduced.
Following, filter criteria, layer thickness, and compaction specifications of filter materials
are explained.

2 Design and Construction of Embankment Dams
12
Filter Criteria
Sand, gravel and crushed rock are usually used in a certain distribution for filter
constructions (RIDAS 2012). In this context, specific requirements exist concerning the
grain size distribution of filter materials. A broad range of filter material is used for dam
constructions with different criteria and requirements for each country
(Kjærnsli et al. 2003).
After Kjærnsli et al. (2003), it is necessary that the grains resist compaction loads during
the construction without breakage to a large scale, which would change the required grain-
size distribution and, thus, the properties of the soil. A weather and crumble resistance
during the period of dam use must also be guaranteed (Kjærnsli et al. 2003). International
literature commonly uses the material, which has to be protected as a starting point (design
criteria) for considerations. In practice, that means that a certain level (layer thickness)
represents the starting point for the construction of a different dam element, for instance.
Thus, the grain-size distribution of the filter material is determined according to the
existing respectively planned impervious moraine core. Another starting point, for
instance, is the filter material when the transition zone to the adjacent rock-fill zone is
determined.
In Table 1, after Kjærnsli et al. (2003), standard criteria for the grain-size distribution of
filter materials is presented. Thereby, the letters D represents the filter grain size and d the
size of the core material. The suffixes represent the percentage by weight of the material
that is finer than the determined size (Kjærnsli et al. 2003).

2 Design and Construction of Embankment Dams
13
Table 1: Common grain-size distribution of filter material (Kjærnsli, Valstad et al. 2003).
Filter material Uniform material (design criteria)
𝑑60𝑑10
< 1.5
Well graded material (design criteria)
𝑑60𝑑10
> 4
Uniform filter
𝐷60𝐷10
< 1.5
5 <𝐷50𝑑50
< 10
5 <𝐷50𝑑50
< 15
𝐷15𝑑85
< 5
Well graded filter
𝐷60𝐷10
> 4
4 <𝐷15𝑑15
< 6
𝐷50𝑑50
< 25
𝐷15𝑑85
< 5
4 <𝐷15𝑑15
< 40
𝐷50𝑑50
< 25
𝐷15𝑑85
< 5
It is practical to judge the suitability of filer material by its grain-size distribution curve
compared to the moraine core (Kjærnsli et al. 2003). After Kjærnsli et al. (2003), ideal
materials for filter zones adjacent to a Norwegian moraine core are broadly graded gravelly
sands without stones with a size of not more than 20-50 mm. Swedish moraine frequently
contains 30 % of fine material (RIDAS 2012). Thus, the percentage of fines is defined as
the proportion of particles with a grain-size < 0.06 mm from a material with a maximum
size smaller than 20 mm. In the majority of cases, the criteria D15 < 0.7 mm is sufficient for
efficient downstream filters (RIDAS 2012). In addition it is important to avoid grain
separation. This can be ensured by using uniform grain-size distribution curves without
sharp turns (RIDAS 2012).
The following Table 2, after RIDAS (2012), presents the maximum stone size of filter
material to avoid separation. Further criteria details and information are given in the
guideline RIDAS.
Table 2: Size limits of filter material to avoid separation (RIDAS 2012).
Minimum D10 of filter material, mm Maximum D90* of filter material, mm
< 0.5 0.5-1.0 1.0-2.0 2.0-5.0
5.0-10.0 10.0-50.0
20 25 30 40 50 60
* D90 = Regulations for filter sand < 20 mm are not necessary

2 Design and Construction of Embankment Dams
14
Layers and Compaction
Filter zones are commonly constructed, according to RIDAS (2012) with a width of 2-3 m.
The filter material is usually spread out into several horizontal layers and the compaction
should be conducted with heavy vibratory rollers (Kjærnsli et al. 2003). In certain narrow
areas walk-behind vibratory plate compactors can be used, after FEMA (2011). Limitations
of each compacting machine must be respected, after Kjærnsli et al. (2003), to achieve an
optimal compaction rate for each filter layer. The layer thickness is limited due to
important requirements concerning density, strength and deformation resistance (Kjærnsli
et al. 2003). Therefore, the layer thickness should be equal to the optimal compacting
depth to ensure a connection effect on the layer boundary (Kjærnsli et al. 2003).
Furthermore, (Kjærnsli, Valstad et al. 2003), recommend the same layer thickness as used
in the adjacent core.
In general, the compaction effect depends on the compactor weight, amount and speed of
passes, the frequency and amplitude of the produced vibrations by the compactor and soil
properties (Kjærnsli et al. 2003). For the compaction of coarse filter materials the vibratory
machines use normally low frequencies and greater amplitudes than for cohesive materials
(core) (Kjærnsli et al. 2003). A range of 2-4 passes for compaction of each layer, after
Kjærnsli et al. (2003), is performed by medium weight rollers (6-8 t) or heavy weight
compactors (> 15 t). Thereby, the highest density is obtained at a depth of 0.4-0.5 m below
the subsurface (Kjærnsli et al. 2003).
Furthermore, several recommendations are given by RIDAS (2012) for the period of
construction. According to that, on site managers should take into consideration:
prevent soiling (clogging by fine contents) of the filter and drainage zone,
control and evaluation of filter material,
ensure the composite between the filter and adjacent material,
monitoring of layer thickness and uniformity,
and measurement of layer compaction.

2 Design and Construction of Embankment Dams
15
2.2.4 Supporting Fill
The stability of an embankment dams is mainly provided by the thickness and density
(mass) of the supporting fill, and the slope inclination (RIDAS 2012). High pore pressure
due to an insufficient filter and drainage system and high rates of leakages due to failures
in the core, for instance, affects the supporting fill and reduces the embankment dam
stability (RIDAS 2012). Therefore, a high resistance against internal erosion, caused by
leakage flows, is important. In this context, the leakage is known from literature as design
leakage flow (Kjærnsli et al. 2003). Knowledge about the shear strength along the sliding
surface, after RIDAS (2012), is also necessary. A critical stability situation emerges, after
Kjærnsli et al. (2003), due to rapid drawdown. Thus, the transient pore pressure during the
drawdown is equal to the static pressure at maximum water level, including a lower decline
of the total stress, and on the other hand the external pressure adapts to the actual
drawdown level (Kjærnsli et al. 2003). This topic is considered in Table 3 by safety factors
for different loading conditions. According to RIDAS (2012), long time experiences and
laboratory test must be taken into account.
Table 3: Overview on safety factors for different loading conditions (RIDAS 2012).
Loading condition Status Safety factor
1 Finished dam construction, empty impoundment 1,5
2 Operation of the dam with static water flow through the embankment 1,5
3 Extreme condition: dam crest overtopping due to high water inflow (higher than design flood) 1,3
4 After a fast decrease of water level 1,3
Kjærnsli et al. (2003) recommend, as in the prior filter section, that the same layer
thickness for the supporting fill should be used as in the adjacent material. Furthermore, a
layer thickness of up to 2 m for the supporting fill, compacted by heavy vibratory rollers
> 15 t with 6-8 passes, is possible in practice (Kjærnsli et al. 2003).

2 Design and Construction of Embankment Dams
16
2.2.5 Further Components of Embankment Dams
In addition to the previously described main components, this subsection describes further
typical elements of embankment dams in relation to Figure 6, section 2.2.
The following terms and explanations, unless otherwise marked, refer to the manual in
design and construction of filters for embankment dams of the Federal Emergency
Management Agency (FEMA 2011).
The CUTOFF TRENCH is located within an excavation in the foundation soil below the
impervious core and is integrated in this construction. It is intended to reduce the seepage
below the dam construction. An UPSTREAM SHELL respectively the DOWNSTREAM
SHELL, also known as supporting fill is as a zone with soil to stabilise and support the
core. In case of a rock-fill dam, this section is constructed with blasted rock (Kjærnsli
et al. 2003). The internal zone between the filter zone and the supporting fill is called
TRANSITION ZONE. The main task is to enable a transition in grain size between two
non-compatible material zones, i.e. supporting fill and filters. A filter zone, usually build in
a one respectively two layer type is not shown in Figure 6. In the context of rock-fill
embankments, normally fine blasted rock is used for construction of the transition zone
(Kjærnsli et al. 2003). A CHIMNEY DRAIN, is built mainly of particles in size of gravel,
enables the drainage of incoming water through the chimney filter into the horizontal
blanket drain system.
Furthermore, this component has a transition function between the chimney filter and the
downstream shell. An efficient drainage system is essential, preventing the water table
flowing towards the downstream slope (Berghe et al. 2011). The mentioned BLANKET
DRAIN zone enables a hydrostatic pressure relief for pervious foundations.
Thus, a protection against particle movements should be guaranteed and occurring seepage
water can be discharged to the toe drain. A TOE DRAIN therefore is the last element of a
drain system that discharge drained water away from the dam toe. The zone between the
impervious core and the chimney drain is defined as CHIMNEY FILTER.

2 Design and Construction of Embankment Dams
17
This component is primarily consisting of sand-size particles and protects the core from
internal erosion and piping. The piping effect has already been described in subsection
2.2.3. This process can lead to critical backward rising erosions, which can be prevented by
a cutoff wall (Huber 2008). This CUTOFF WALL, also known as a grout curtain, backfills
joints, fractures within the rock to prevent seepage flow and piping. A mixture from soil,
cement and bentonite is used for grout curtains. A RELIEF WELL is usually used for
collecting seepage water that cannot be collected by toe drains. This collected water can be
transferred to a collecting drainage ditch. A DRAINAGE DITCH constructed as an open
trench downstream, also collect seepage water. Upstream located IMPERVIOUS
BLANKETS are normally integrated into the core and is most often used to seal the
foundation soil. This element extends the seepage water way and increments the head loss
zone for and embankment dam on permeable foundations. The last explanation of this
section is the RIPRAP and BEDDING. The riprap is an external security layer protecting
layer on the upstream slope against erosion by reservoir waves and ice movements.
Below this layer the bedding is building up a transition zone to the supporting fill
protecting against particle movements of the riprap after reservoir drawdown.
This transition zone is also designed according to the filter criteria in order to prevent a
flush out when the riprap is eroded respectively destroyed.

3 Tailings Dams and Impoundments
18
3 Tailings Dams and Impoundments
The previously described types of embankment dams are usually constructed to be used as
WRD for the production of drinking water, as well for irrigation and hydropower
applications. Tailings dams, on the other hand, enables tailings impoundments due to its
damming function. Geotechnical constructions as tailings impoundments are constructed in
layers of soil and rock, usually based on a soil foundation, and retained by embankments,
i.e. tailings dams (Bjelkevik 2005b).
The main purpose of a tailings impoundment is to store tailings and process water from
industrial activities as mining (Environmental Protection Agency 1994). According to
Benckert and Eurenius (2001), normally the ore in the mining process has a size less than
0.01-1.0 mm, the iron content is removed and the remaining waste product (tailings) are
pumped in a slurry to an impoundment. These tailings facilities often consist of tailings
ponds and subsequent clarification ponds. In that case the process water from the tailings
pond discharges into the clarification ponds and afterwards the clarified water is reused
either as process water or as a fluid for the transport of tailings to the tailings dams
(European Commission 2004). Excess water from this cycle, which complies with the
European and Swedish water quality standards, is diverted to the receiving water,
as described in the reference document of the European Commission (2004).
In Figure 12, a paradigmatic cross-section of a typical tailings dam is shown, including a
schematic water cycle of a Tailing Management Facility (TMF), after European
Commission (2004).
Figure 12: Cross-section: Tailings dam water cycle (European Commission 2004).

3 Tailings Dams and Impoundments
19
In general civil engineers are familiar with construction details of standard embankment
dams in use of a WRD. Being an expert in the area of tailings facilities, including
impoundments and tailings constructions, more further knowledge are necessary.
After Benckert and Eurenius (2001), tailings are, by volume, one of most handled products
in the world, with approximately 25-30 Mt per year only in Sweden. Due to remaining ore
in tailings, with possible negative impacts for the phreatic water (ground water), special
construction measures have to be implemented (Benckert and Eurenius 2001).
The Swedish guideline GruvRIDAS (2007), known as “Mining Industry Guidelines for
dams” and published by Svensk Energi AB / SveMin, has been prepared on the basis of
RIDAS. Therefore, the structural components and requirements are similar to WRDs,
described in section 2. The following sections describe typical impoundment types,
structures and design methods as well as characteristics of Swedish tailings dams.
3.1 Impoundment Types
Just like embankment dams, several types of impoundments can be used and some of them
are more common than others. According to the Environmental Protection Agency (1994)
the Ring-Dike, In-Pit, Specially Dug Pit, and some Valley designs are the four main types
of impoundments. In addition the choice of impoundment type, after Environmental
Protection Agency (1994), is mainly dependent on place conditions, topography, and of
course economic considerations. The amount of fill material used to construct a dam is
related to costs and therefor most operating tailings dams correspond to the Valley design,
due to a minimized material requirement by using the valley topography (Environmental
Protection Agency 1994).
Following, important topographic and design differences between the impoundment
designs Valley and Ring-Dike are explained.

3 Tailings Dams and Impoundments
20
3.1.1 Cross-Valley Design
As described in the introduction of this chapter, financial advantages arises by using
topographic depressions as a store basin for tailings and as well by a reduced dam size and
construction effort. Another advantage, according to Environmental Protection Agency
(1994), is a reduction of air dispersion of tailing particles. In Figure 13, typical variations
of valley impoundments are shown.
Figure 13: Overview on Valley Impoundments. a) Single Cross-Valley, b) Multiple Cross-Valley (Vick 1990).
It is obvious that a Single Cross-Valley (a) is comparable with WRD by general
construction and topographic conditions. According to Environmental Protection Agency
(1994), valleys should be located near the head of the drainage basin to minimize inflows.
The Multiple Cross-Valley is to be considered as a variation of several Single Cross-Valley
constructions.
3.1.2 Ring-Dike Design
In contrast to the Valley design, the Ring-Dike impoundment is used in areas with a flat
topography without depressions. In that case, embankment dams are required to enclose
the whole impoundment (Environmental Protection Agency 1994).

3 Tailings Dams and Impoundments
21
In some cases, the site topography enables a reduction or, on the other hand, an expansion
of needed embankment parts, see Figure 14.
Figure 14: Overview on Ring-Dike impoundments. a) Single, b) Segmented design (Vick 1990).
After Environmental Protection Agency (1994), the construction of these dams with a low
height is comparable to dams for valley impoundments concerning the use of tailings,
waste rock and additional natural materials. In general, the material requirement for dam
constructions is higher than for all other existing impoundment designs, whereby the cost
is affected. Due to the typical flat topography, after Environmental Protection Agency
(1994), their configuration enables a high flexibility. The quantity of pond water is limited
to the inflow of process water and precipitation (Environmental Protection Agency 1994).
As already described, the increased demand of dike material is influencing the construction
costs. Furthermore, an increased length of embankment dams may increase the hazard of
failures (Environmental Protection Agency 1994). An impairment of the landscape
painting and possible wind erosion of the tailings, after Environmental Protection Agency
(1994), are possible disadvantages of this impoundment design. On the other hand, the
Environmental Protection Agency (1994) points out that it may be possible to achieve a
total containment and collection of waste water using an appropriate combination of low
permeable cores, liners, and drainages.
Seepage control, i.e. acid and heavy metal drainage, is an environmental concern with
tailings impoundments and ring-dikes therefore have an advantage over most other
impoundment designs (Environmental Protection Agency 1994).

3 Tailings Dams and Impoundments
22
3.2 Structures and Design Methods
Embankment structures can be distinguished by construction type. The first type is a non-
permeable tailings retention dam, constructed at full height at the beginning and similar to
WRDs, and the second type is a much more common permeable raising tailings dam
(Environmental Protection Agency 1994). Due to the fixed dam height of retention dams
the availability of storage capacity for tailings is limited. According to Environmental
Protection Agency (1994) this construction type, as shown in Figure 15, is comparable to a
water retention dam with regards to soil quantities and qualities, surface and groundwater
controls, and statically considerations.
Figure 15: Cross-section of a tailings retention dam, comparable to typical WRDs (Environmental Protection Agency 1994, Vick 1990).
The construction of raised tailings dams, however, starts with a starter dam (dike),
followed by successive lifts of dam height with increasing volume of tailings in the
impoundment (Environmental Protection Agency 1994). Raised tailings dams impound
high volume of tailings and even a high water level. According to Berghe et al. (2011), the
water is leaking through the dam body and the foundation soil. Therefore it is indicated
that an efficient drainage system is essential, preventing the water table flowing towards
the dam slope. It is common to install a network of drainage pipes connected to a main
pipe at the embankment bottom to drain the seepage water (Berghe et al. 2011).
However, all tailings dams have to be constructed with greatest possible safety, and also
continuously reviewed as conditions change with time (Benckert and Eurenius 2001).
In addition, raised tailings dams can be classified in two categories (European
Commission 2004):
Dams with tailings and a low permeable core, and
dams with tailings in structural zone.

3 Tailings Dams and Impoundments
23
3.2.1 Dams with Tailings and a Low Permeable Zone
This dam category enables a low permeable zone due to tailings deposition in the range of
the upstream dam slope (European Commission 2004). Between this deposition and the
starter dam a filter zone is installed, see Figure 16. The deposited tailings are building up a
beach, after Bjelkevik (2005b) an area of tailings between the water edge and the dam crest
as a result of a sedimentation process. Inflowing process water must not rise above the
upper edge of the beach, because this water would enter dam material with a higher
permeability (European Commission 2004). Due to this existing sensitive area, a
continuous monitoring program must be implemented and therefore a permeability barrier
must be installed before beach developments (European Commission 2004).
Figure 16: Cross-section of a tailings dam with a low permeable core zone (beach) (European Commission 2004).
Description of letters: A) Supporting fill (normally gravel), B) Filter drain (if required), C) Permeability barrier, D) Water in reservoir, E) Deposited tailings, F) Water in reservoir, G) Current embankment profile, H) Future embankment profile, J) Starter dam
3.2.2 Dams with Tailings in Structural Zone
Upstream, downstream, centerline, and a combination of the types are the main design
methods of raised tailings dams, after Vick (1990), detailed described below. In contrast to
non-permeable tailings retention dams, these dams are usually constructed of natural soil,
tailings from the mining process, and crushed waste rocks (Vick 1990). As a consequence
of using waste rocks and tailings, these tailings dams provides financial advantages for the
industrial companies (Environmental Protection Agency 1994). The incremental raising
structure of each design method is shown in Figure 17.
Beach
3 Tailings Dams and Impoundments
24
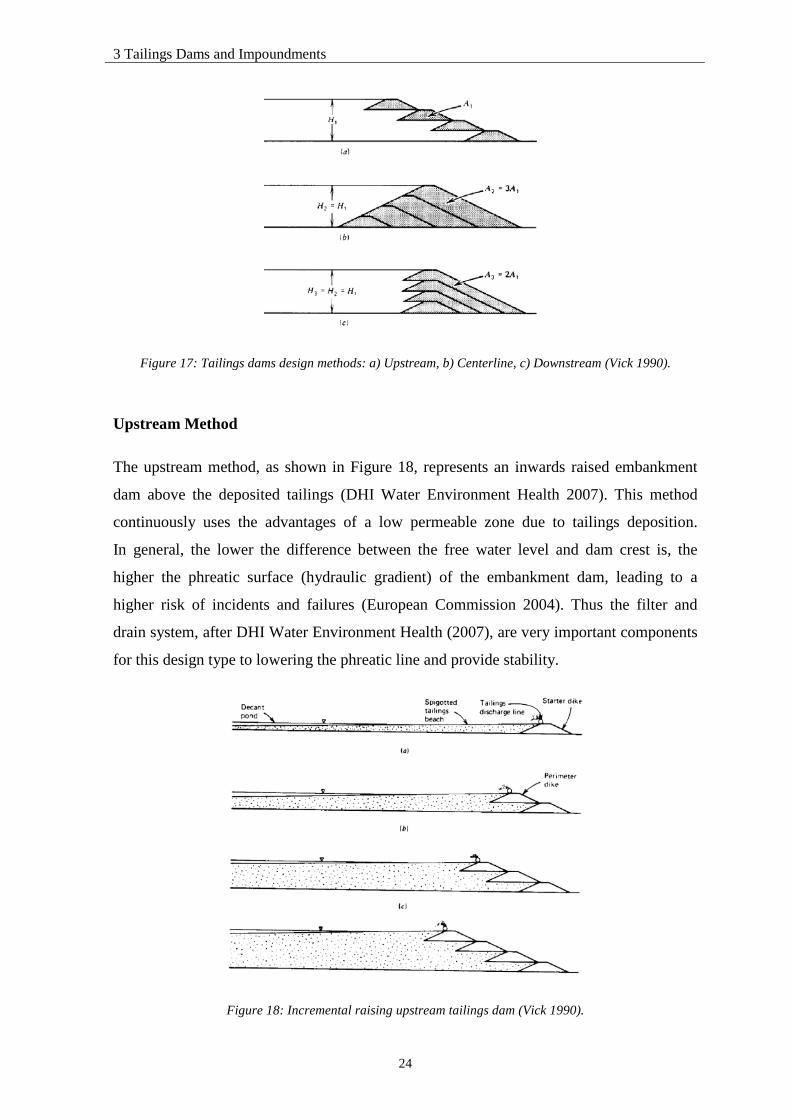
Figure 17: Tailings dams design methods: a) Upstream, b) Centerline, c) Downstream (Vick 1990).
Upstream Method
The upstream method, as shown in Figure 18, represents an inwards raised embankment
dam above the deposited tailings (DHI Water Environment Health 2007). This method
continuously uses the advantages of a low permeable zone due to tailings deposition.
In general, the lower the difference between the free water level and dam crest is, the
higher the phreatic surface (hydraulic gradient) of the embankment dam, leading to a
higher risk of incidents and failures (European Commission 2004). Thus the filter and
drain system, after DHI Water Environment Health (2007), are very important components
for this design type to lowering the phreatic line and provide stability.
Figure 18: Incremental raising upstream tailings dam (Vick 1990).

3 Tailings Dams and Impoundments
25
Downstream Method
The downstream design method, as shown in Figure 19, represents a downstream raised
and expanding dam structure with a crest movement as the dam height is rising (DHI
Water Environment Health 2007). Based on a starter dam constructed of borrow material,
comparable to the upstream design method, the next raise is placed on the downstream
slope by reaching the maximum impoundment level (European Commission 2004).
Therefore, in contrast to the upstream method, this variant enables a rising tailings storage
space with each dam heightening. On the other hand the dam toe is moving at each
construction step.
Figure 19: Incremental raising downstream tailings dam (Vick 1990).
Tailings, normally are used as construction material and separated by hydrocyclones
(Figure 20), may be used for the major dam construction (European Commission 2004).
Figure 20: Hydrocyclones on a dam crest (European Commission 2004).

3 Tailings Dams and Impoundments
26
After the tailings slurry is dewatered to a pulp density of approximately 60 to 70 %, the
remaining slime is removed by passing the stream through the hydrocyclones (European
Commission 2004). According to the European Commission (2004), hydraulic backfill by
hydrocyclones presents permeability coefficients in the range of 1x10⁻⁷ to 1x10⁻⁴ m/s.
Also this design method enables the installation of a filter and drain system to control the
phreatic line. After Environmental Protection Agency (1994), it is recommended to place a
pervious sandy drainage layer or other drain systems prior to each downstream increase to
reduce the hydraulic gradient. An example is, after Environmental Protection Agency
(1994), to incorporate, at each raise of the embankment dam, a chimney drain (Figure 19)
near the upstream surface slope with a connection to a blanket drain at the embankment
basement.
Centerline Method
The centerline design method, as shown in Figure 21, is a compromise between the
downstream and upstream design method, also based on a starter dam constructed of
borrow material (Bjelkevik 2005b). From the tailings discharge line (Figure 21-a) on the
dam crest the deposited tailings are building up a low permeable beach zone, as described
before in this chapter. Prior to the impoundment is full, the next embankment stage is built
on the beach and on the downstream slope of the starter dam, see Figure 21-b (Bjelkevik
2005b).
The staged construction is comparable to the downstream method and also the maintenance
of the beach, in order to lower and control the phreatic surface, is necessary. The centerline
design method is also equipped with a filter and drain system, as also integrated the
downstream and upstream method (Bjelkevik 2005b).

3 Tailings Dams and Impoundments
27
Figure 21: Incremental raising upstream tailings dam (Vick 1990).
Other combinations of engineering methods are also possible and existing. Construction
changes are also conceivable with changing conditions concerning mining processes and
topographical limitations. On example is the tailings dam in Malmberget, Sweden, whose
design method was changed at a specific level from upstream to downstream design
(European Commission 2004). More details about Malmbergets tailings dam are discussed
in chapter 6.

3 Tailings Dams and Impoundments
28
3.3 Swedish Tailings Dams
Swedish mining companies belong to the largest enterprises of Europe. Mines and
neighbouring tailings dams in operation as well as hydropower dams are illustrated in
Figure 22. Due to a large amount of process waste accrues companies and authorities are
dealing with construction, operation, and remediation of tailings storage facilities (TSF),
including tailings dams, impoundments, decant facilities and spillways (Bjelkevik 2005b).
After mining companies have dealt with TSFs themselves in the beginning of the twentieth
century, during 1960 and 1970 consultancy service became more important when problems
occurred (Benckert and Eurenius 2001). The big expansion of consulting and monitoring
activities is a result of the increasing height of tailings dams, the public and authority
awareness of risks and the appearance of incidents and failures (Benckert and
Eurenius 2001).
Figure 22: Swedish mines and tailings dams in operation, 2005 (left hand side) (Bjelkevik 2005a) and Swedish dams including the classification of height (right hand side) (Swedish National Grid 2011).

3 Tailings Dams and Impoundments
29
Furthermore, in 1997 the Swedish mining company Boliden started an initiative to develop
manuals for operation tailings dams, based on the Swedish Dam Safety Guidelines
(RIDAS) (Benckert and Eurenius 2001). Other mining enterprises followed this,
after Benckert and Eurenius (2001), with site specific operation manuals. In addition, the
Swedish guideline GruvRIDAS, published by Svensk Energi AB / SveMin, has been
prepared on the basis of RIDAS.
The following Table 4 shows general data about Swedish tailings dams and storage
capacities of the tree main mining companies LKAB, Boliden Mineral and Zinkgruvan
Mining (Benckert and Eurenius 2001).
Table 4: General data about Swedish tailings dams and capacities (Benckert, Eurenius 2001). Foot print area, according to (Bjelkevik 2005b).
Name, Owner Start Ore type Construction Foundation material
Height Capacity **
Foot print area
Type * Material
Gillervattnet, Boliden
1953 Zn,Cu, Pb,Ag, Au
ds moraine moraine 12 m 20 Mm³
Ryllshytte-magasinet, Boliden
1965 Cu,Zn ds moraine moraine 19 m 6.5 Mm³
Svappavaara, LKAB
1965 From Kiruna
us moraine moraine 18 m 6 Mm³ 1.2 m²
Aitik, Boliden 1967 Cu,Ag, Au
us moraine, tailings & waste rock
moraine 50m 250 Mm³ 12.0 m²
Enemossen, Zinkgruvan
1976 Zn,Pb, Ag
ds, cl & us
moraine waste rock
moraine/ rock
25 m 7 Mm³
Kiruna, LKAB 1976 Fe cl moraine moraine 15 m 10 Mm³ 2.6 m² Laisvall, Boliden 1978 Pb,Zn,
Ag us tailings &
moraine moraine 40 m 20 Mm³
Malmberget, LKAB
1978 Fe ds moraine & waste rock
moraine 32 m 20 Mm³ 1.8 m²
* ds = downstream, us = upstream, cl = centerline
** includes tailings and clarifications impoundment storage space
All operating tailings dams according to Table 4 in Sweden have a separate water pond and
clarification pond for a second sedimentation step and recirculate stored water to the
mining process, as described in section 3 (Benckert and Eurenius 2001). After Benckert
and Eurenius (2001), the largest TSF is situated at the Aitik mine, including a clarification
pond with a water reservoir capacity of 15 Mm³.

3 Tailings Dams and Impoundments
30
Moraine as construction material for tailings has always been used in Sweden because
approximately 60 % of Sweden is covered by moraine (Benckert and Eurenius 2001).
Based on knowledge and experience of WRDs the tailings dams has being constructed
with a moraine core, filter layers, a drainage system and supporting fills (Bjelkevik 2005b).
After Bjelkevik (2005b), the use of moraine for dam constructions was probably affected
by the availability of this material on site. Nowadays, due to international experience in the
90s concerning the hydraulic gradient and the phreatic surface, the dam design changed
from standard earth fill dams to the upstream and centerline design, as described in
section 3.2, with a limited moraine use for the dike and sometimes for the core, and use of
tailings for the remaining dam construction (Bjelkevik 2005b).
3.3.1 Remediation
As mentioned earlier in this section, the public as well as the mining industries increasing
environmental awareness led to a new way of environmental thinking (Benckert and
Eurenius 2001). Thus, the philosophy of tailings dams remediation in Sweden, according
to Benckert and Eurenius (2001), is equated with nuclear wastes. So, for design purposes a
long-term period is defined to be 1000 years. Within this period the tailings dam passes the
phases operation, transition and long-term phase, whereas mining companies also have to
ensure environmental safety after when mining process is closed (Benckert and
Eurenius 2001). Environmental safety is determined by the factors physical and chemical
stability of the dam, whereby the fundamental failure mechanisms for the cases long-term
stability, extreme events and slow degradation must be considered (Benckert and
Eurenius 2001).

4 Instrumentation and Monitoring
31
4 Instrumentation and Monitoring
Instrumentation of embankment dams for different surveillance respectively monitoring
purposes is necessary for an early detection of structural changes in order to prevent
incidents and failures. Possible failure mechanisms within the embankment structure, as
piping in embankment dams (section 2.2.3), are illustrated in Figure 23 based on long-term
experience of existing structures (Bettzieche 2008).
Figure 23: Different types of failure mechanism of embankment dams (Bettzieche 2008). Modified and translated by Jörg Riechers.
Description: a) Overtopping, b) Instability foundation slip due to soft subsoil, c) Seepage/ piping within and below the embankment dam, d) Slope breakage due to rapid drawdowns of the reservoir, e) Lost of freeboard due to settlement, f) Slope breakage on downstream side due to insufficient shell stability, g) Cracks due to dehydration and shrinkage, h) Liquefaction
In 2012 the German Association for Water, Wastewater and Waste (DWA) developed and
published recommendations on structural surveillance of water barrages as embankment
dams and concrete dams (Regulation No. DWA-M 514). Each of the following subsections
discusses its application purpose, installation process respectively measurement
characteristics. Furthermore, proposed number and position of each surveillance method,
according to DWA-M 514, are taken into account. Thereby the focus is on water level
monitoring in order to keep the seepage line under control, pore water pressure
measurements with piezometers and displacement measurements by means of an
inclinometer system.

4 Instrumentation and Monitoring
32
4.1 Monitoring Wells and Piezometers
Monitoring wells, also known as observation wells, are used to monitor the water level of
the embankment dam in order to oversee the seepage line. In reverse, the functionality of
the filter adjacent to the impervious core can be controlled. Generally, the seepage line
decreases from the core to the downstream side of the dam shoulder. Monitoring wells
which are arranged in a row, installed after drilling as exemplary shown in Figure 24,
enables the measurement of single water level values.
Figure 24: Schematic view of monitoring well (left hand side) and of open standpipe piezometer (U.S. Army Corps of Engineers 1995).
Piezometer are usually installed prior to or during construction of the dam as well as
during its operating life in form as an open standpipe piezometer, see Figure 24.
Most Piezometers have been installed for the surveillance of construction performance
during the first filling and/ or for long-term monitoring (U.S. Army Corps of
Engineers 1995). The objective of this measurement device is to measure the pore water
pressure at a certain position. The pore water pressure is known as the total stress
transmitted through pore water, whereby the total stress can be described as an acting force
within a certain area (U.S. Army Corps of Engineers 1995). Generally, different types of
piezometer as pneumatic, electrical devices, etc. are available. Piezometers and monitoring
wells can be used for slope stability analyses due to the acting seepage line.

4 Instrumentation and Monitoring
33
Furthermore, the measurement of pore water pressure enables monitoring of the
performance of a cutoff wall, as far as available. In addition, the acting hydraulic pressure
can be measured to control the foundation stability. A seepage control is possible by
monitoring the water level changes in combination with a measurement device in the
horizontal/ blanket drain, see Figure 25.
Figure 25 shows an example of positions for pore water pressure measurements
(piezometers) in an impervious core as well as monitoring wells for water level
measurements and seepage control in the downstream shelf of an embankment dam,
according to DWA-M 514. Generally, regulations respectively requirements concerning
drilling operations in embankment dams and its foundations must be observed,
see subsection 5.1.
Figure 25: An embankment dam with impervious core and installed piezometers (DWA-M 514 2011). Modified and translated by Jörg Riechers.

4 Instrumentation and Monitoring
34
4.2 Inclinometer
This deviation measurement instrument is used for a wide variety of applications, such as
slope monitoring for water retention dams and tailings dams as well as in the context of
highway and railway constructions. Usually it is installed, after MSHA (2009), into a
vertical or inclined borehole to measure lateral displacements of slopes or soil structures.
Figure 26 shows examples of positions for geodetic measurements on the dam crest and the
berm dam crest of an embankment dam, according to DWA-M 514. It is recommended to
use at least three geodetic measurement points at a distance of 50 m in a row on the dam
crest. In addition, inclinometers can be installed during to or after construction in boreholes
at surveillance spots.
Figure 26: Possible positions for measurements of vertical and horizontal displacement in an embankment dam (DWA-M 514 2011).
Furthermore, horizontal applications are available for receiving profiles beneath structures
or embankments (MSHA 2009). The distribution of displacement (Figure 27) along the
borehole depth can be measured whereby, after Berghe et al. (2011), a data processing
enables the derivation of cumulative movements at any depth. Thus, measured and derived
parameters, by using an inclinometer, allow a risk assessment for the embankment slopes
(Berghe et al. 2011).

4 Instrumentation and Monitoring
35
Figure 27: Example of displacement measurement (left hand side) and a schematic drawing of inclinometer operation (MSHA 2009).
In this context, the most commonly used in-situ inclinometers monitor displacements
normal to the axis of a pipe by passing a measuring probe along the pipe, see schematic
installation in Figure 27 (MSHA 2009). This measuring device, is illustrated in detail in
Figure 28, and consists of the following elements (MSHA 2009):
guide casing including tracking grooves (permanently installed in the borehole),
backfill between guide casing and adjacent material (location fixation),
probe with a pair of wheels,
electrical cable connecting the probe and the readout equipment,
readout equipment (manually respectively continuously monitoring).
Figure 28: Detail of inclinometer, configuration and installation (Stark, Choi 2008).

4 Instrumentation and Monitoring
36
Inclinometers are usually installed during construction in embankment or concrete dams.
Furthermore, the installation is normally fixed in a stable layer with very low movements
like natural rock. Without a fixed base, after MSHA (2009), the top of the inclinometer
casing must be measured before each measurement. Displacement measurements are taken
to enable a comparison of measurements at different times. Subsequently installations are
possible, but Berghe et al. (2011) recommends a quick implementation after the dam has
reached a certain height to avoid measurement failures due to increasing shear load by
heightening.
The accuracy of normal measurement devices is an important factor for their usability.
Important parameters for inclinometers by contrast are the repeatability of measurements
and the resolution of readings. The main objective by using of inclinometers is to measure
the movement of the soil relative to a starting point respectively day. Thus, the
repeatability determines the accuracy of readings at each repeated reading
(Measurand 2012). On the other hand, the resolution, after Measurand (2012), describes
the smallest change in a reading which is able to display. Hence, this parameter is limited
by the logging equipment due to the supported number of bits carrying measuring
information (Measurand 2012). Inclinometers of the company Durham Geo Slope
Indicators, for instance, have a repeatability of 20 arc-seconds (± 0.1 mm/m) with a
resolution of 9 arc-seconds (0.04 mm/m).
The installation of an inclinometer instrument is also possible during operation of dams,
tailings dams, etc., by drilling a borehole in the structure and insertion of a suitable
instrument. One example worth to be mentioned here is a flexible accelerator array,
installable within drill pipes or other pipes with a narrow diameter, for monitoring of slope
displacements and featured additional measurement possibilities. Further details of this
special inclinometer array are described in subsection 5.4.2.

5 Drilling in Embankment Dams
37
5 Drilling in Embankment Dams
This chapter deals with drilling in embankment dams for geotechnical investigation,
instrumentation and remediation. Apart from the description of possible drilling risks, an
overview on conventional drilling technologies is given. The main focuses are the
description of the standard hydraulic top hammer drilling technology and the water
powered DTH hammer drilling technique, especially the Wassara W35 for dam
instrumentations, their mode of operation, as well as their applicability.
5.1 Drilling Risks
Drilling applications in existing embankment dams or in their foundations as boreholes for
exploration and surveillance purposes represent always an interference in the structure.
Nevertheless, drilling may be the only option available, after U.S. Army Corps of
Engineers (1995), when the installations of new subsurface instruments or, for instance,
simple water wells for surveillance purposes are needed in operating dam structures.
Therefore, the choice between different drilling technologies and eventual drill fluids must
be analysed carefully in advance (U.S. Army Corps of Engineers 1995).
The use of compressed air or water, after U.S. Army Corps of Engineers (1995), during
drilling can negatively affect the embankment respectively foundation material by
fracturing and erosion of material. Fracturing can be described as a process of cracking
soil/ rock by pressurised media. Generally, these effects are not only linked to embankment
dams but also to other interferences by drilling operations in soil and underground
formations. Therefore, conventional geotechnical investigations have been conducted in
this thesis before and after drilling within the framework of the reference drilling project,
as described in chapter 6.
Drilling in the sensitive impervious core of an embankment must be performed with the
greatest of care and precision (U.S. Army Corps of Engineers 1995). Generally, dam
owners avoid penetrating the dam core unless it is really necessary. According to
U.S. Army Corps of Engineers (1995), several incidents occurred in the past among
drillings with compressed air, air with foam and other circulating drilling fluids in
boreholes. Consequently, different regulations respectively requirements concerning
drilling operations in embankment dams and its foundations were established by several
national authorities and dam operators.
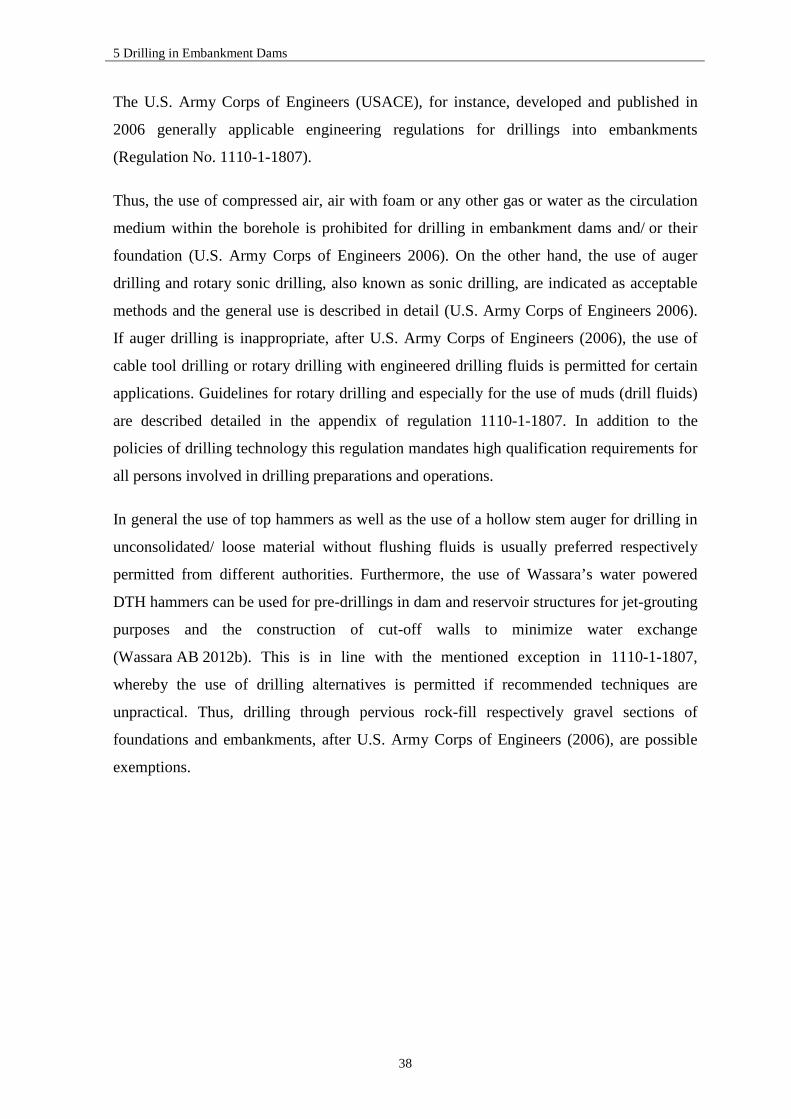
5 Drilling in Embankment Dams
38
The U.S. Army Corps of Engineers (USACE), for instance, developed and published in
2006 generally applicable engineering regulations for drillings into embankments
(Regulation No. 1110-1-1807).
Thus, the use of compressed air, air with foam or any other gas or water as the circulation
medium within the borehole is prohibited for drilling in embankment dams and/ or their
foundation (U.S. Army Corps of Engineers 2006). On the other hand, the use of auger
drilling and rotary sonic drilling, also known as sonic drilling, are indicated as acceptable
methods and the general use is described in detail (U.S. Army Corps of Engineers 2006).
If auger drilling is inappropriate, after U.S. Army Corps of Engineers (2006), the use of
cable tool drilling or rotary drilling with engineered drilling fluids is permitted for certain
applications. Guidelines for rotary drilling and especially for the use of muds (drill fluids)
are described detailed in the appendix of regulation 1110-1-1807. In addition to the
policies of drilling technology this regulation mandates high qualification requirements for
all persons involved in drilling preparations and operations.
In general the use of top hammers as well as the use of a hollow stem auger for drilling in
unconsolidated/ loose material without flushing fluids is usually preferred respectively
permitted from different authorities. Furthermore, the use of Wassara’s water powered
DTH hammers can be used for pre-drillings in dam and reservoir structures for jet-grouting
purposes and the construction of cut-off walls to minimize water exchange
(Wassara AB 2012b). This is in line with the mentioned exception in 1110-1-1807,
whereby the use of drilling alternatives is permitted if recommended techniques are
unpractical. Thus, drilling through pervious rock-fill respectively gravel sections of
foundations and embankments, after U.S. Army Corps of Engineers (2006), are possible
exemptions.

5 Drilling in Embankment Dams
39
5.2 Hydraulic Top Hammer Drilling
Drilling systems, after Bruce (2002), must generally offer continuous and straight
penetration properties in varying drill applications from soft to hard material respectively
stable to fractured formations. Rotary, rotary percussive and rotary vibratory (sonic),
after Bruce (2002), are the main categories of rock drilling. The focus of this master thesis
is on rotary percussive systems, in terms of drilling technologies. A distinction is made
between down-the-hole hammers (DTH), also referred to as in-the-hole hammers (ITH) for
underground work, and top hammers. This section describes the working principle of top
hammers and typical areas of application. Drill characteristics of DTH hammers, as well as
the differences between air and water powered hammer systems are given in
section 5.3 to 5.3.5.
A hydraulic top hammer system, also known as hydraulic drifter, is equipped with a
regular up and downward moving piston inside of a cylinder, see Figure 29 (Rabia 1985).
The repetitive down stroke of the piston converts potential energy of compressed hydraulic
oil into kinetic energy (force) (Rabia 1985). This kinetic energy is transmitted to the drill
string and forwarded to the drill bit down the hole in the form of compressive waves
(Rabia 1985).
Figure 29: Rotary percussive methods: Top hammer (left side), and down-the-hole hammer (right side) (Rabia 1985).

5 Drilling in Embankment Dams
40
As a result, the drill bit crushes the rock respectively soil and subsequently the returning
force causes a backward movement of the piston to the starting position. The described
operation principle is illustrated in Figure 30.
Figure 30: Operation principle of hydraulic top hammers (Zablocki 2006).
The energy, in form of travelling strain waves, after Rabia (1985), decreases with
increasing length of the drill string (borehole depth). Energy losses occur, after
Dessureault (2003), due to the pipe resistance, friction at couplings and joints, vibration,
noise and as well as the wearout on the bit. The percentage of losses by pipe joints, after
Corcoran (2009), varies between 4 % and 6 %. Stresses in the steel components as piston
and drill string, for instance, must be limited because of durability requirements
(Dessureault 2003). Thus, the maximum borehole depth respectively borehole length is
limited to approximately 60 m, according to Bruce (2002), depending on the available
torque, piston weight and the impact power of the hydraulic drifter (Figure 31).
Thereby, the penetration rate noticeable decreases from a length of 20 m (Corcoran 2009).
Figure 31: Hydraulic percussive hammer (hydraulic drifter) for underground applications (Corcoran 2009).

5 Drilling in Embankment Dams
41
In the 1960, top hammers employed compressed air with approximately 6 bar operating
pressure (Atlas Copco Rock Drills AB 2008). Step by step, after Atlas Copco Rock Drills
AB (2008), they were replaced by hydraulic top hammers with higher efficiency and a
working pressure up to 25-28 bar. Around 25 to 30 % of the energy input is transferred to
the rock on the bottom at hydraulic top hammers, compared approximately 5 % at
pneumatic top hammers (Dessureault 2003). Another advantage, after Dessureault (2003),
is a noise reduction of 8-10 dB (decibels) with the hydraulic hammer type. Nowadays,
operating pressures around 180 bar and a maximum impact stroke repetition of
approximately 2,000 1/min are usually used for different applications above ground and
underground. These data are based on product information of different companies.
The hydraulic drifter is mounted on the mast of the drill rig and usually works with a
rotation speed of approximately 80 to 160 RPM to generate borehole diameters of around
102 mm (Bruce 2002). Unlike DTH hammers, due to historical reasons, top hammers
drillings are rotating counter clockwise. Besides the dependencies mentioned for optimal
drillings with high rates of penetration, an optimal feed is important to keep the drill bit in
contact with the formation surface, i.e. weight-on-bit (Rabia 1985). Compressed air, water
or a mix of both mediums is transmitted to the bit through the annular space between drill
string and casing to clean the borehole and flushing out the soil respectively rock
fragments, i.e. cuttings (Rabia 1985).
Underground applications for hydraulic top hammers and air powered DTH hammers,
for instance, are slot and production drillings. Furthermore, top hammers are used for
several structural applications with limited depth as boreholes for exploration and
surveillance purposes in embankment dams or foundation drillings, for instance.
In the context of drilling in existing embankment dams, the use of top hammers as well as
the use of auger drilling without flushing fluids is usually preferred respectively permitted
from different authorities. More details are given in the previous section 5.1.

5 Drilling in Embankment Dams
42
5.2.1 Performance and Drilling Accuracy
The purpose of this section is to provide a performance overview of the top hammer
system in terms of penetration rate and drilling accuracy (deviation), in comparison with
air powered DTH hammers. Differences between applications above ground and
underground are taken into account. Generally, it not easy to execute direct comparisons
between different systems because of varying ground conditions.
The mine profitability, after Corcoran (2009), is influenced by the borehole deviation in
terms of an inadequate fragmentation and low ore recovery. Furthermore he points out that
approximately 71 % of Canadian and US underground drilling applications are performed
by DTH hammers for borehole diameters between 76 mm-305 mm (3”-12”) and 27 % by
top hammers for smaller hole diameter from 41 mm-113 mm (1 5/8”-4.5”). Thus, top
hammer drilling tends to have deviations of 5 % to 10 %, with a significant increase of the
inaccuracy after approximately 20 m depth. The deviation of air driven DTH hammers can
be specified in the range of +/- 1 %, based on past experience (Corcoran 2009). Based on
similar experience in the use of top hammers, according to Atlas Copco Rock Drills AB
(2008), many mines restrict the drilling length to 20 m without utilisation of guide rods
behind the drill bit respectively to a length of 30 m with guidance equipment.
A comparative drilling study obtained in a hard limestone with a borehole diameter of
165 mm (6 1/2”) showed, after Halco (2012), a ROP of 40 m/hr for the DTH system and a
ROP of 35 m/hr for the top hammer alternative. Unlike drilling in hard formations, top
hammers usually do not drill efficient in soft rock respectively soil conditions in
comparison with DTH hammers. The experience also shows that the ROP of a top hammer
system decrease in not solid formations (Halco 2012). In addition to the already presented
applications, long-term experience of the company Sweco Infrastructure AB exist in
geotechnical drillings for exploration and surveillance purposes in embankment dams or
foundations, for instance, in Sweden and Norway. Accordingly, the drilling of a water
observation well (20-25 m deep) with a top hammer system including a filter installation in
the downstream filter section of an embankment dam, for instance, takes about 2-4 days
depending on the soil structure. The most time-consuming tasks are the installation of the
filter pipe in connection with the subsequent removal of casing rods.

5 Drilling in Embankment Dams
43
5.3 Water Powered DTH Hammer Drilling Technology
All information on water powered DTH hammer drilling technology correlates to
technological developments by Wassara AB, hereinafter referred to as ‘Wassara’.
The following terms and explanations in this section, which apply to all available hammer
sizes, unless otherwise marked, refer to Riechers (2010). Beyond that, the emphasis is on
Wassara’s W35 hammer development for embankment dam instrumentations, see
section 5.4.
Water powered DTH percussion hammer drilling technology is designed for drilling in soil
as well as hard and abrasive rock as granite and sandstone, for instance. Underground
applications of this system, for example, are slot and production drillings. Furthermore,
water powered DTH hammers are also used for several structural engineering applications
as boreholes for exploration, surveillance and production purposes, anchor drillings as well
as for investigation and remediation drillings in different dam types (Wassara AB 2012c).
The DTH hammer is guided by a clockwise rotating drill string, which is used to transfer
pressurised water to the hammer operating down the hole. Pressurised water is fed by a
swivel (Figure 32) above the rotating head at the drill rig. This water is used to drive the
hammer, whereas the water after each hammer operating cycle is used to clean the
borehole and flushing out the cuttings.
Figure 32: Swivel including high-pressure hose mounted on a rotating head (Riechers 2010).
After each blow, the water is transmitted to the bit to cool it and to flush the cuttings out of
the borehole through the annular space between drill pipe and borehole wall
(Smoltczyk 2003).

5 Drilling in Embankment Dams
44
Below in this section, the operating principle of the hammer is described in particular.
The displaced drilling fluid, a mix of cuttings and process water, is forwarded to a
sedimentation container respectively under certain circumstances to a recirculation unit to
minimise water loss (Nordell et al. 1998).
5.3.1 Pump and Drilling Fluid
The required operating pressure and the flow rate of the water, generated by a high
pressure pump, depend on the size of the used DTH hammer and its condition, see Table 5.
The selection of the hammer, in turn, depends on the desired borehole diameter.
The need of water pressure and flow rate is influenced as follows:
the larger the hammer diameter the, the higher the water flow rate,
working pressure is depending on the hammer diameter and its condition,
working pressure is also based on existing soil/ rock strength,
the larger the cracks in the formation, the higher the water consumption,
by increased hammer wear, the water consumption of the hammer increases.
It should be noted that, unlike air driven DTH hammers, existing phreatic water is not
affecting the penetration rate of water powered DTH hammers.
Table 5: Operating pressure and water consumption of Wassara DTH hammers (Wassara AB 2012b).
Ø Hole/ bit
[mm] Hammer A
[mm] B
[mm] C
[mm] Rec. Oper. pres. [bar] Water consumption
(new-worn)
64 W 50 895 950 54-58 170 80-130 [l/min]
82 W 70 1098 1170 78-87 180 130-260 [l/min]
95 W 80 977 1049 80-92 180 130-260 [l/min]
115 W 100 1185 1270 102-111 180 225-350 [l/min]
140 W 120 1495 1572 120-128 180 300-450 [l/min]
165 W 150 1495 1605 140-162 150 350-500 [l/min]

5 Drilling in Embankment Dams
45
The supply of fresh water takes usually place through a hydrant and a temporarily water
tank in avoidance of pressure changes. In general, the used water should be clean of
impurities and abrasive fine particles as quartzite as well as having a high pH value to
obtain a corrosion protection. Alternatively, lake water can be used by a submersible
drainage pump equipped with a pre-filter able to filter greater particles than 50 µm
(0.05 mm).
In contrast to air, water can be described as an incompressible fluid due to a very low rate
of volume change. The modulus of elasticity (E-value), defined as the ratio between stress
and strain, of water (2.1·109 N/m²) is approximately 10,000 times higher than of air
(1.5·105 N/m²). Pressure (stress) is given as the quotient of the force and a surface area.
P = FA
[Pa] ⟹ 1 Pa = 1 Nm²
⟹ 100 kPa = 100 kNm²
= 1 bar = water column of 10 m
The hydrostatic distinguished by consideration of pressure between water pressure and
absolute water pressure. As a result, the absolute water pressure included the atmospheric
pressure (P0 = 101325 Pa) on the water surface. On the other hand, the water pressure
increases with depth (z) without consideration of atmospheric pressure, see the following
equations (6.1) and (6.2).
Water pressure: P = ρ ∙ g ∙ z [Pa] (6.1)
Absolute water pressure: P = ρ ∙ g ∙ z + P0 [Pa] (6.2)
P0 = 101325 Pa
Due to the previous described incompressibility of the water, the required pump power is
lower than of usually used air compressors for air driven DTH hammers, despite a
significant higher pressure rate. The possible drilling depth by using air powered DTH
hammers is limited due to compaction effort and maximal available pump capacity unlike
to the innovative water driven DTH hammers.
Table 6: High-pressure pumps, usually used to drive DTH hammers of Wassara (Wassara AB 2012b).
Pump model Max. flow rate [l/min]
Max. water pressure [bar]
Required max. power [kW]
WASP 50 Diesel 137 170 43
WASP 80 Diesel 219 200 80
WASP 150 Diesel 476 200 173

5 Drilling in Embankment Dams
46
In opposition to air pressure hoses, a water pressure hose presents no danger in case of
bursting despite a higher pressure around 180 bar due to the incompressible characteristics
of water. Generally, the drilling fluid is referred to a controlled circulating fluid or gas in
the borehole. In this context the fluid is defined as a mix of gas respectively water and
additives like weighting agents, for instance, to enable a higher level of borehole stability.
The main functions are to clean the borehole and flushing out the cuttings, cooling the drill
bit and to guarantee optimum borehole stability. In case of drilling operations in unstable
rock or fine grained soil formations, additional protective casings must be used to stabilise
the borehole wall. The upflow velocity of the drilling fluid is depending on the used
medium, the volume of flow, borehole and drill pipe diameter. In addition to the borehole
stability, an optimal matching drilling fluid to the respective drilling reduces the
mechanical wear of used tools. More details are given in section 5.3.4.
Due to the already described hammer requirements, water powered DTH hammers are
used without additives in the water. Uncompressed water, escaping from flushing channels
of the drill bit after each hammer operating cycle, cleans the borehole and flushing out the
cuttings. The cuttings are flushed out of the borehole as slurry of water and broken rock/
soil fragments through the annular space between drill pipe and borehole wall, i.e. reverse
circulation drill (Smoltczyk 2003). Through the use of water as a flushing medium, unlike
air DTH hammers, a risk by fracturing of adjacent formations does not exist. Furthermore,
the hydrostatic pressure stabilise the borehole and the specific heat capacity of water,
c = 4,187 J/kg·k, removes process heat of the drilling from the borehole. Besides the
hydrostatic pressure, the fluid of water and solids is building a filter cake around the
borehole wall to stabilise the hole and reduce the drill fluid loss. The maintenance of an
efficient filter cake is generally an important task of the operator during drilling.

5 Drilling in Embankment Dams
47
In contrast to the high upflow velocities between 20 and 60 m/s of air, used for air powered
DTH hammers, the water driven hammer alternative indicates velocities from
0.4 to 2.0 m/s despite higher working pressures, depending on the annular space in the
borehole. Thus, the uncompressed water does not influence the stability and structure of
adjacent ground whereby drillings besides respectively below sensible structures are
possible. Other differences compared to air powered DTH hammers and Top-hammer
drillings exists. Water driven percussion DTH hammers provide a reduction of noise
emission and air pollution as a result of the position of the working hammer (down the
hole) and due to the dust binding effect of the water. Furthermore, no additives as oil, for
instance, are used to lubricate Wassara’s DTH hammers, usually used during drillings with
standard DTH air hammers.
5.3.2 Hammer Design
Water powered DTH hammers, as already described, are designed for operation down-the-
hole and belong to the group of rotary percussive technology. The piston casing is
manufactured with passive stabilisers and defined as a ribbed piston casing. This design,
amplified by the use of an additional guided tube above the hammer, enables guided
drillings with reduced annual space of 2 mm between the hammer body (steering ribs) and
borehole wall, see Figure 33.
Figure 33: Distance to the borehole wall; hammer and additional stabiliser (Riechers 2010).
These passive stabilisers in combination with a low upflow velocity of the drill fluid, low
water pressure after the kinetic energy is transmitted as a stroke of the piston to the
underground, an optimal feed force and optimised drill bit revolutions enables straight
boreholes and high penetration rates (see subsection 5.3.1). The following subsection 5.3.3
discusses the operating principle of the hammer in detail followed by information on drill
bits and drilling adjustments.

5 Drilling in Embankment Dams
48
5.3.3 Operating Principle
In general, the operation principle of water powered DTH hammers distinguishes from the
pneumatic DTH variant in the used working and flushing medium. The function of DTH
hammers essentially depends on two related hammer parts, the valve and piston
(Riechers 2010). Following, the internal process of the hammer is described, after
Riechers (2010), step by step.
The cycle starts with the lowest position of the piston towards the drill bit (left side of
Figure 34). In this position, the kinetic force is transmitted as a stroke of the piston to the
bit shank and forwarded to the rock. The piston movement is achieved by the acting
potential energy of compromised high-pressure water. Subsequently the returning force
causes a backward movement of the piston to the starting position. In this process, the low-
pressure connection between the piston and the control valve is open and the control valve
is also moving upwards.
Figure 34: Operation principle: 1. Cross-section of a DTH hammer (Riechers 2010).
High-pressure water is entering the low-pressure connection due to a valve connection
opening by the upward movement of the piston. This pressure change in the control valve
drive area causes a turnaround of the control valve movement towards the bit shank
(Figure 35).
Figure 35: Operation principle: 2. Cross-section of a DTH hammer (Riechers 2010).

5 Drilling in Embankment Dams
49
The piston drive area can be pressurised when the piston has reached its down position,
due to a reopening of the valve connection. A striking movement of the piston towards the
bit starts, due to acting high-pressure water (Figure 36).
Figure 36: Operation principle: 3. Cross-section of a DTH hammer (Riechers 2010).
The previously sealed valve port opens due to the downward movement of the piston and
the dewatering process of the control valve area begins (Figure 37). The drainage causes a
water pressure reduction whereby the control valve moves towards the opposite direction
of the piston back into its initial position.
Figure 37: Operation principle: 4. Cross-section of a DTH hammer (Riechers 2010).
After the kinetic force is transmitted as a stroke of the piston to the bit shank, and the
control valve area is completely dewatered, the operating cycle of the hammer starts again
(Figure 38). The discharged water is used to clean the borehole bottom and to flush the
fragments out of the borehole. Depending on the hammer size, pressure level and
mechanical soil/ rock properties, the repetition of this related hammer parts takes place
with high frequencies.

5 Drilling in Embankment Dams
50
An example is the Wassara W100 hammer, normally operating with a frequency of
approximately 60 Hz in hard rock. Hz is the symbol of frequency with the SI unit 1/s,
defined as the number of cycles per seconds of periodic execution.
Figure 38: Operation principle: 5. Cross-section of a DTH hammer (Riechers 2010).
Water powered DTH hammers as well as the pneumatic DTH variants normally utilise an
additional check valve to prevent upward movements of fine drill cuttings during drill
stops through the hammer body. These cuttings represent a high potential risk of damage
for internal hammer parts by the resumption of drill operation. Wassara’s DTH hammers
are not equipped with an internal check valve. In order to achieve an additional protection
of the threat of the hammer and to enable a quick exchange of a worn out check valve it is
commonly mounted within a short pipe above the hammer, see Figure 39.
Figure 39: Check valve between hammer and drill string (Riechers 2010).

5 Drilling in Embankment Dams
51
5.3.4 Drill Bits and RPM
The rotation of the drill string respectively of the drill bit is specified as revolution per
minute (RPM) with the SI unit 1 rpm = 1·(60s)-1. More often used is the unit 1/min
(per minute) with a 60 times higher numerical value. The aim is to loosen sufficiently large
rock/ soil fragments that can be flushed out as fast as possible off the borehole with a
minimum of energy input. Therefore, an effective borehole cleaning reduce the amount of
re-crushed cuttings whereby the energy input and bit wear can be reduced.
The penetration rate, after Kahraman et al. (2003), is an important parameter for drilling
cost estimation and project planning. This value is usually indicated in the unit m/min or
cm/min and also known as rate of penetration (ROP). Rock properties like compressive
strength [MPa] (Figure 40) and abrasiveness influences the penetration rate of percussion
drill and erosive wear of the bit Kahraman et al. (2003). The abrasiveness of rock, after
Dessureault (2003), is basically influenced by the proportion of quartzite, see Figure 41.
Figure 40: Different rock properties (Dessureault 2003).

5 Drilling in Embankment Dams
52
Figure 41: Relative quartzite content in different rock types (Dessureault 2003).
Therefore, various DTH drill bit designs exists with different buttons/ inserts on the surface
for a variety of applications, as illustrated in Table 7.
Table 7: DTH drill bits: surface designs and button forms (Riechers 2010).
Type of surface Button form
Flat front
Conical (ballistic)
Concave front
Semiballistic
Convex front
Spherical
The selection of surface design and button form in order to achieve high rates of
penetration and long bit life is depending on formation properties as described before.
Nowadays, buttons/ cutters made of tungsten carbide are often covered by a thin layer of
special carbon mixture to improve the penetration rate and reduce the button wear.
These PDC bits, using polycrystalline diamond compact buttons respectively cutters and
provide high shear strength resistance.

5 Drilling in Embankment Dams
53
Drill bits with full ballistic buttons and a concave front, for instance, are suitable for
applications in medium hard to hard and abrasive formations. For applications in very hard
and stable formations bits with a convex front and full ballistic buttons are preferred.
For drilling in hard and fractured rock formations by contrast it is important to secure an
evenly rock erosion to enable effective drillings and boreholes with a high level of
accuracy. Drill bits with a flat front and spherical buttons support this intention.
Typical formations are granite, limestone and basalt, for instance. For less hard formations
and unconsolidated soil a concave respectively convex front can be used with full ballistic
buttons. For drilling in formations with intrusions of clay and silt the focus is on the
amount of inserts and the spacing respectively an efficient bit cleaning to avoid clustering
and wearout of the bit.
Generally, different DTH drill bit brands can be used with water powered DTH hammers.
Wassara recommends using drill bits semiballistic buttons. During different R&D projects
very good penetration rates in hard rock could be achieved with the latter variant.
Special drill bits for Wassara’s DTH hammers are equipped with drainage notches on the
bit shaft to avoid cavitation damage on the bit and hammer piston, see Figure 42.
Cavitation is described, after Franc and Michel (2005), as the arising of vapour cavities
within liquid mediums like water in conditions of reduced pressures and constant ambient
temperature. If this vapour phases collapse close to material surfaces, damage caused by
acting forces arise.
The second difference is a constant diameter of the flushing channel at DTH drill bits of
Wassara, unlike bits for air driven DTH hammers. Due to lower flushing velocities, the
channel diameter of Wassara hammers and drill bits are lower than that of a bit for an air
system. Thus, an air drill bit used for drillings with water powered DTH hammers damages
the piston of the hammer (Figure 42).
Figure 42: Characteristics of drill bits for water powered DTH hammers (Riechers 2010).

5 Drilling in Embankment Dams
54
In addition to the drill bit, an optimal clockwise rotation of the bit and drill string reduces
the amount of re-crushed cuttings and bit wear respectively enables high rates of
penetration. RPM and feed force during drillings are regulated by operator of the drilling
rig. Theoretically, the optimal RPM is depending on the outer diameter of the drill bit,
diameter of the used buttons as well as the used operating frequency of the hammer, see
Figure 43. The standard operating frequency is 60 Hz, used for most Wassara percussion
hammers. In this context, the optimal range of RPM of a W 100 water powered DTH
hammer can be specified with 50 to 90 revolutions per minute. In contrast, standard air
DTH equipment usually rotates with 20 to 30 revolutions per minute.
Figure 43: Advantages of an optimum RPM (Riechers 2010).
According to Wassara, a maximum and optimum rotation can be calculated by the
following equations in consideration of the outer diameter of the bit, penetration depth of
the buttons and a maximum speed of 0.5 m/s at the outmost button of the bit.
The maximum speed is based on experience to reduce the wear of the buttons.
Maximum RPM: Nmax = f ∙d ∙60D ∙ π
� 1min� (6.3)
Optimal RPM: NV = 30.000D ∙ π
� 1min� (6.4)
f = hammer/ percussion frequency, often 60 Hz
d = Ø button [mm]
D = Ø drill bit [mm]

5 Drilling in Embankment Dams
55
5.3.5 Performance and Drilling Accuracy
The purpose of this section is to provide a performance overview of water powered DTH
hammers in terms of penetration rate and drilling accuracy, in comparison with standard air
DTH hammers. The following data, unless otherwise marked, was published in July 2010
and presented at the Geothermal Conference in Karlsruhe (Germany) as well as at the
1. Sustainable Earth Science Conference in Valencia (Spain) by Riechers (2010). It is not
possible to make a direct comparison between top hammers, presented in sections 5.2, and
this DTH system based on already existing data bases. Chapter 6 presents performance
details based on a reference project that has been implemented for this research project.
In Stockholm, 29 geothermal wells (Ø 115 mm) were drilled with a planned depth of
220 m and 250 m for supplying two adjacent terrace houses. For clarity and avoidance of
mutual influence all boreholes were separated according to the used drilling technology
into drilling fields. In field I, 14 boreholes were drilled with an air powered DTH drilling
system (Atlas Copco TD 40/ COP 44 Gold). Wassara’s water powered DTH hammer
(W 100) was used in Field II for 15 boreholes.
According to the Swedish Geological Survey the bedrock in the drilling area has an
irregular alternation of granite and gneiss. The gneiss shows intrusions of granite with a
compressive strength of > 200 MPa and pegmatite courses. The plastically deformed rock
is very fragile and an increased water flow in the subsurface is normally expected.
Despite the demanding drill formation, good drilling results could be achieved with the
water powered DTH system. Comparing the average ROP of drilled boreholes in each
field, the water powered DTH hammers offers a penetration rate of 0.52 m/min which is
24.6 % lower than the ROP of 0.69 m/min in field I. However, the performance of water
driven DTH system is not affected by increasing borehole length and surrounding phreatic
water.

5 Drilling in Embankment Dams
56
Three-dimensional measurements have been implemented for almost all boreholes to
analyse the borehole accuracy in terms of deviation. In general, the deviations of the
boreholes from the perpendicular axis in field I up to a depth of approximately 40 m were
50 % higher compared to field II, see Figure 44. Furthermore, the maximum deviation of
the boreholes, which were drilled with the water powered DTH system, is 48 m.
This correspondents to a 65 % lower deviation compared to the straightest borehole drilled
with an air powered DTH hammer, see Figure 44.
Figure 44: Measured borehole deviations (Riechers 2010).
Similar empirical values are described in a report from 1998, according to Nordell
et al. (1998). Thus, Wassara’s penetration rate is clearly higher at greater depth and the
technology enables drilling in hard, fractured and water rich formations (Nordell
et al. 1998). Within a drilling project for the Swedish telephone company TELIA with
water powered DTH hammers, penetration rates could be logged for 57 boreholes.
Drill speeds between 0.5 m/min and 1.0 m/min as well as the average penetration rate of
0.6 m/min, after Nordell et al. (1998), could be determined.
0
10
20
30
40
50
60
70
80
90
100
110
120
130
140
0 10 20 30 40 50 60 70 80 90 100110120130140150160170180190200210220230240250
Devi
atio
n [m
]
Drilling depth [m] Drill field I - air powered DTH hammer Drill field II - water powered DTH

5 Drilling in Embankment Dams
57
5.4 Wassara W 35 DTH hammer for Embankment Dam Instrumentations
Research and developments on existing DTH hammer versions and
drilling equipment as well as the development of technologies for new
fields of application are an important part of Wassara’s business
activities. The new W 35 DTH hammer and accessories, as illustrated
in Figure 45, is one of the latest developments. The hammer and a
special drill pipe between the piston casing and the ordinary pipes
together forming a drilling system for new fields of applications.
Thus, the objective is not only to develop a new hammer, but instead to
design an advanced system for instrumentation installations in dams or
other constructions respectively formations.
The basic idea is to develop a complete drill system with a small
diameter which enables after drilling subsequent utilisation for dam
instruments. Thereby, the drill pipes are used in the subsurface after
completion of the borehole as casing rods for different measurement
instruments down the hole. Consequently, this concept for drilling and
instrumentation is referred to as Lost Hammer Concept (LHC) due to
the remaining small W 35 DTH hammer in the borehole.
In order to ensure an adequate hydraulic connection between the
internal pipe volume and the borehole surrounding ground water a flow
tube is mounted in the first perforates drill pipe, as shown in the centre
of Figure 45. This flow tube, which is kept in place by the acting water
head, enables water feeding to the W 35 hammer during drilling.
Figure 45: View and cross-section of Wassara W 35
DTH hammer (Wassara AB 2012a).

5 Drilling in Embankment Dams
58
After completion of the drilling, the flow tube must be pulled out of the borehole by a
special lifting device, see Figure 46. The mentioned lifting device is described and
illustrated in subsection 5.4.1.
Figure 46: Principle of the LHC: lifting device is in position before lock into place (upper figure), hydraulic connection is opened (lower figure) (Wassara AB 2012a).
As a result, the hydraulic connection is opened, whereby measurement instruments can be
installed and starting the record of data. The usable internal pipe diameter is limited to
28 mm. With a suitable measuring device the distribution of displacements and
temperature information, for instance, can be measured. One possibility and its benefit is
described in subsection 5.4.2. Furthermore, this system can be used as a water observation
well for different purposes in embankment dams or other soil construction applications.
The decisive advantage is the simple and fast installation without a protective casing and
conventional procedures such as drilling, flushing, installation of the observation well
including a filter pipe and final insertion of filter sand. Furthermore, the small borehole
diameter of 43 mm as well as the reduced drill pipe diameter of 35 mm reduces the
interference in the embankment structure respectively in other soil or rock formations.
The W 35 DTH hammer, except its small size, is similar to other hammer variants of
Wasara. Design and operating principle, as described in chapter 5.3, are also comparable.
The main differences lie in the smaller diameter, whereby the internal parts had to be
adjusted, the hammer frequency and especially a reduced flow rate. According to this, the
operating frequency is 110 Hz at 180 bar working pressure for drilling in hard rock with a
compressive strength > 200 MPa as Swedish granite, for instance. Unlike the frequency,
the needed water flow is reduced due to the reduced internal hammer volume.

5 Drilling in Embankment Dams
59
This prototype hammer is currently undergoing different field tests. Based on these drilling
investigations a reference project for application of the complete LHC in embankment
structures has been implemented. Additional information on this project can be found in
chapter 6, followed by the presentation of analyses and results in chapter 7.
5.4.1 Construction Details of the Lifting Device
The purpose of this section is to describe and illustrate the lifting device, which has been
mentioned in the introduction of chapter 5.4.
This lifting equipment consists principally of a threaded rod, a connection device at the
upper end of the rod and a female part (sleeve) of the catch equipment at the lower end.
Principally, the catch equipment works like a slot and key system. In detail, the lifting
device, illustrated in Figure 47, consists of the following elements:
Sleeve (1), Guiding and connection device (4),
Locking arm (2), Threaded rod (5),
Cylindrical pin (3), O-ring (6)
Figure 47: View and cross-section of the lifting device (Wassara AB 2012a).
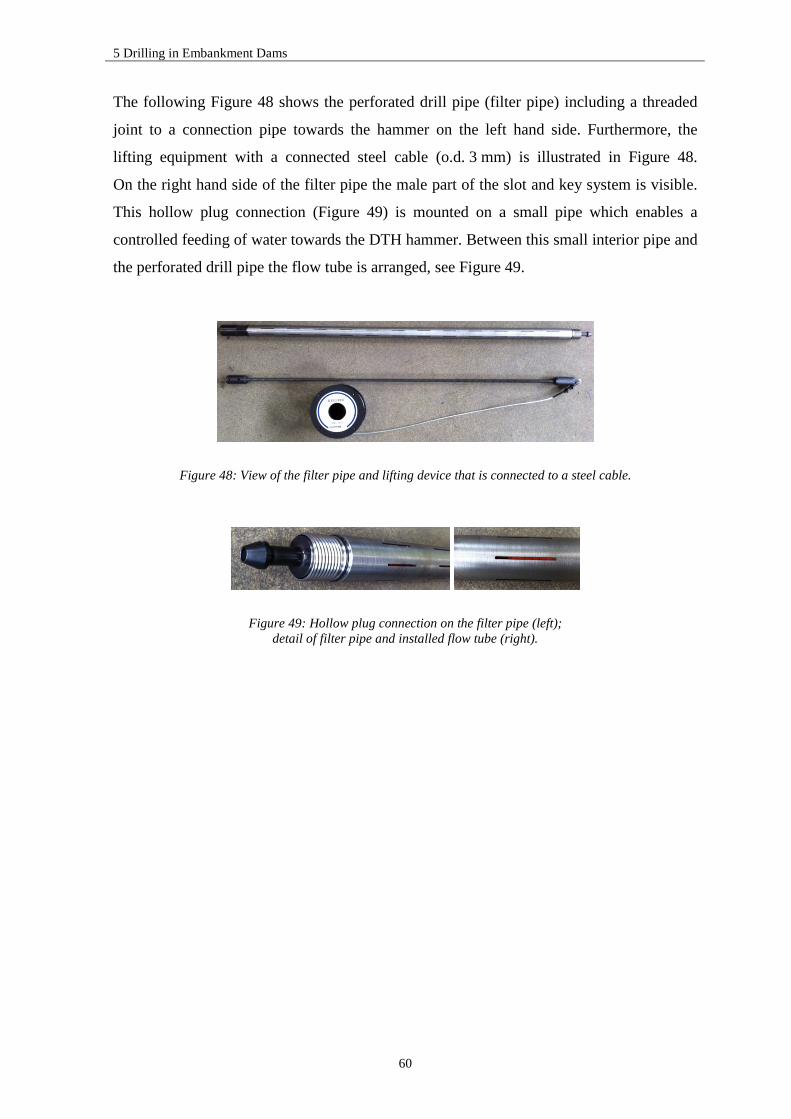
5 Drilling in Embankment Dams
60
The following Figure 48 shows the perforated drill pipe (filter pipe) including a threaded
joint to a connection pipe towards the hammer on the left hand side. Furthermore, the
lifting equipment with a connected steel cable (o.d. 3 mm) is illustrated in Figure 48.
On the right hand side of the filter pipe the male part of the slot and key system is visible.
This hollow plug connection (Figure 49) is mounted on a small pipe which enables a
controlled feeding of water towards the DTH hammer. Between this small interior pipe and
the perforated drill pipe the flow tube is arranged, see Figure 49.
Figure 48: View of the filter pipe and lifting device that is connected to a steel cable.
Figure 49: Hollow plug connection on the filter pipe (left); detail of filter pipe and installed flow tube (right).

5 Drilling in Embankment Dams
61
5.4.2 Suitable Dam Instrumentation
This subchapter describes a measurement device for determining horizontal
displacements of soil piles respectively engineered constructions, installable
in the drill rods (i.d. 28 mm) of the LHC, see Figure 50. This instrument of
the Canadian company Measurand is called ShapeAccelArray (SAA). This
array uses tri-axial chip based accelerometers, located either in 0.5 m or
0.3 m intervals within connected segments covered by a waterproof layer
(Rollins et al. 2009). It is available up to a length of 100 m and can be
installed in any kind of conduits with a minimum inner diameter of 27 mm
(Measurand 2012). Thereby, the upper end of this array has to be fixed at
the pipe by a clamp, for instance, to enable a fixed position above ground.
Figure 50: Schematic drawing of an installed SAA in LH.
Relating to the LHC, drilling down to a stable formation without horizontal movements is
recommended in context with installation of SAA (red line, Figure 50), also described for
standard inclinometer systems in section 4.2. In complementary to the recording of
magnitude and direction, vibration and temperature data area are also recorded at each
increment of eight segments. These additional parameters are logged, by the use of a
segment length of 0.5 m, every 4 m along the installed array and are processed according
to the principle in Figure 51.
Figure 51: SAA rolled on a reel (left hand side); schematic recording and processing principle (right hand side) (Measurand 2012).

5 Drilling in Embankment Dams
62
The temperature data along the array enables the detection of seepage water respectively
the scope seepage changes within an embankment dam for instance. This is possible due to
the interconnection of water (λ ≈ 0.56 W/mK) inside of the LHC pipes and the surrounding
water gradient. Furthermore, the heat conductivity, λ, of steel with approximately 46
W/mK encourages the detection of temperature anomalies along the borehole wall.
These temperature anomalies in turn can be used for seepage estimations. On the other
hand, vibration information enables the determination of influences on embankment dams
due to earthquakes for instance. Another advantage compared to commonly used
inclinometer is the possibility of reuse. Due to a non-existing permanently installed guide
casing, unlike normal inclinometers, this measurement system can be usually pulled up and
reinserted in another observation hole.
According to Rollins et al. (2009), SAA provides a comparable precision
as standard inclinometer systems, described in section 4.2. This complies
with information based on long-term field measurements (two years) on
repeatability and resolution of the producing company Measurand.
Thus, repeatability of 20 arc-seconds (0.1 mm/m) with a resolution of
2 arc-seconds (0.01 mm) by using a 32-bit data system could be
determined. Figure 52 presents an example of measured soil movements
during a slope monitoring project in a highway embankment.
Figure 52: Example of measured soil movements in a
highway embankment (Dasenbrock 2010).

6 Reference Project
63
6 Reference Project
This chapter presents an overview of the reference project implemented in collaboration
between Luossavaara-Kiirunavaara (LKAB), Wassara AB, Sweco Infrastructure AB and
Luleå University of Technology in 2012. The aim was to make a direct comparison
between hydraulic top hammer drilling, presented in section 5.2, and the new Lost
Hammer Concept which includes a water powered DTH hammer of Wassara, as described
in chapters 5.3 and 5.4, in embankment structures. In this context, this comparative study
aims to examine the influence of the drilling process on a certain soil characteristic in
connection with its use as filter material in embankment dam structures. Drillings and
measurements were conducted in Malmberget (Sweden) on the mine site of LKAB within
the area of the tailings impoundment. On site, the reference project has been carried out in
two steps and on two different sites (test fields) with a variety of objectives. The following
sections include descriptions of the test fields, characteristics of the test material used in
the embankment, explanations of the used drilling setups and measurement equipment as
well as the documentation of the drilling and measuring work.
6.1 Test Field I
Test Field I (Figure 53) represents the main field for drilling and measuring work in an
artificial dam respectively levee, which has been prepared for this research project.
Figure 53: Completed test field.
The embankment was constructed on the mine site of LKAB in Malmberget, see Figure 54.
To be more exact, it is located on the north-west area of the tailings dam and created
around the GPS-Position (X-7458750,966; Y-167377,314; Z-365,835), according to the
Swedish coordinate system SWEREF 99 20 15 - RH2000.
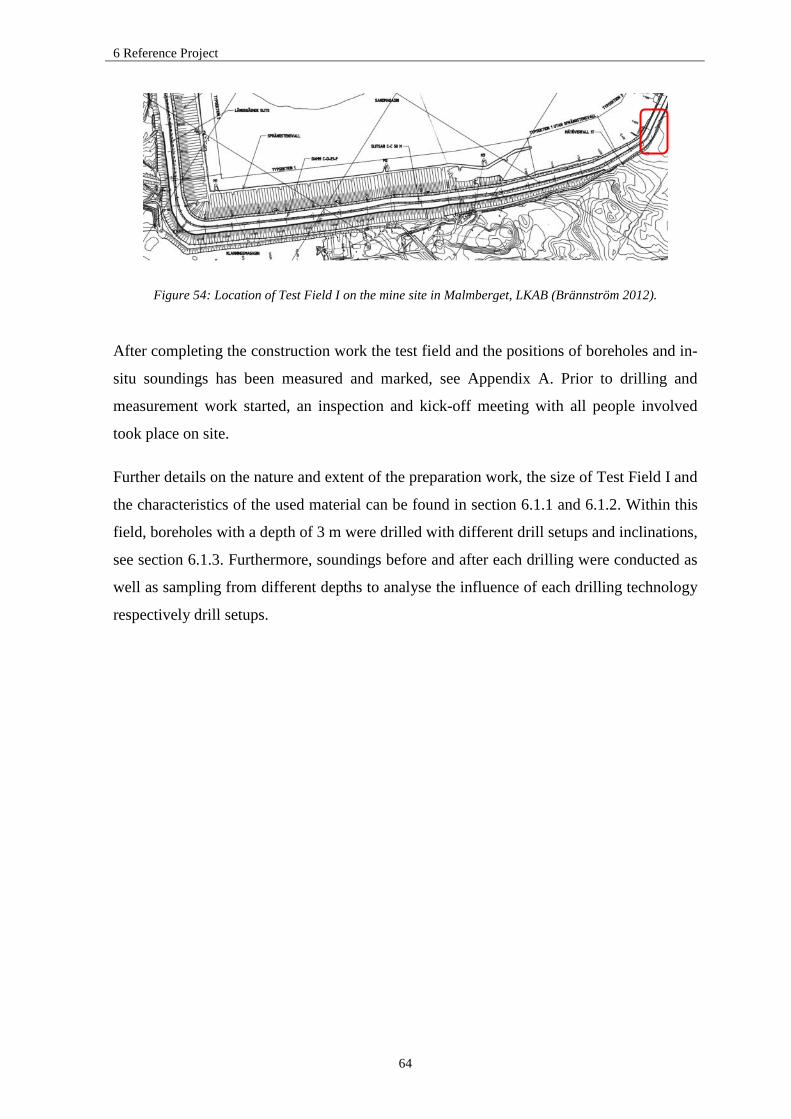
6 Reference Project
64
Figure 54: Location of Test Field I on the mine site in Malmberget, LKAB (Brännström 2012).
After completing the construction work the test field and the positions of boreholes and in-
situ soundings has been measured and marked, see Appendix A. Prior to drilling and
measurement work started, an inspection and kick-off meeting with all people involved
took place on site.
Further details on the nature and extent of the preparation work, the size of Test Field I and
the characteristics of the used material can be found in section 6.1.1 and 6.1.2. Within this
field, boreholes with a depth of 3 m were drilled with different drill setups and inclinations,
see section 6.1.3. Furthermore, soundings before and after each drilling were conducted as
well as sampling from different depths to analyse the influence of each drilling technology
respectively drill setups.
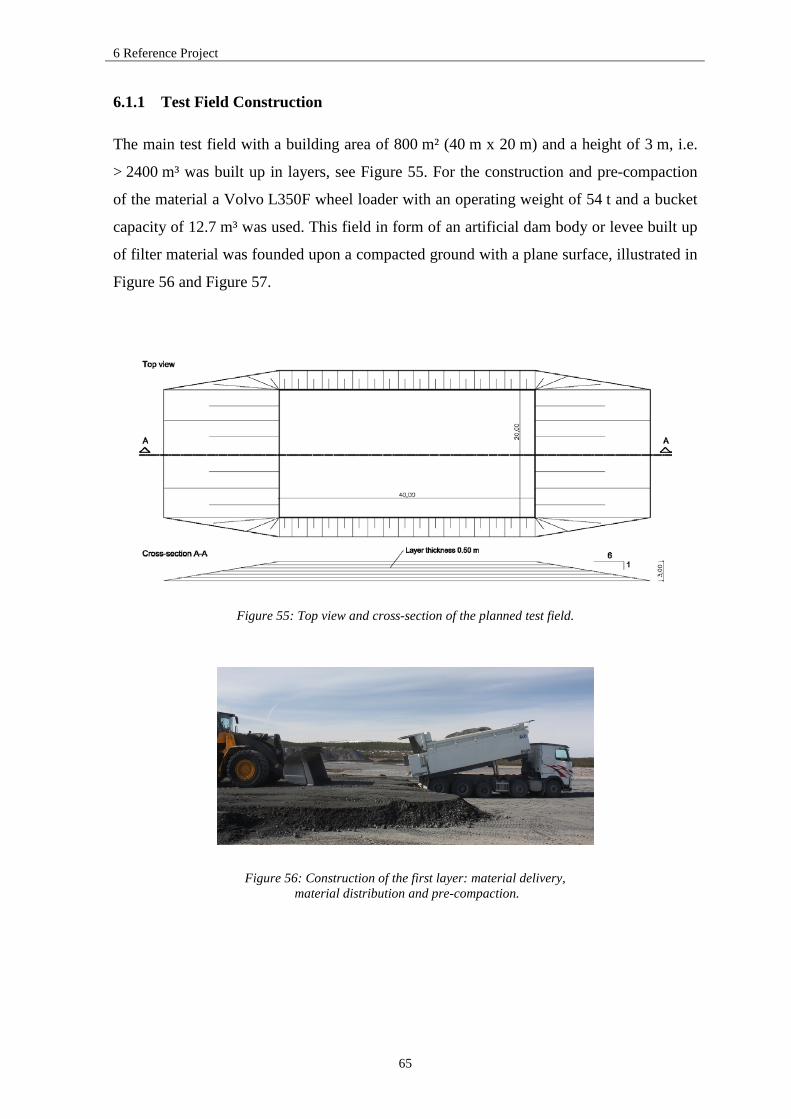
6 Reference Project
65
6.1.1 Test Field Construction
The main test field with a building area of 800 m² (40 m x 20 m) and a height of 3 m, i.e.
> 2400 m³ was built up in layers, see Figure 55. For the construction and pre-compaction
of the material a Volvo L350F wheel loader with an operating weight of 54 t and a bucket
capacity of 12.7 m³ was used. This field in form of an artificial dam body or levee built up
of filter material was founded upon a compacted ground with a plane surface, illustrated in
Figure 56 and Figure 57.
Figure 55: Top view and cross-section of the planned test field.
Figure 56: Construction of the first layer: material delivery, material distribution and pre-compaction.
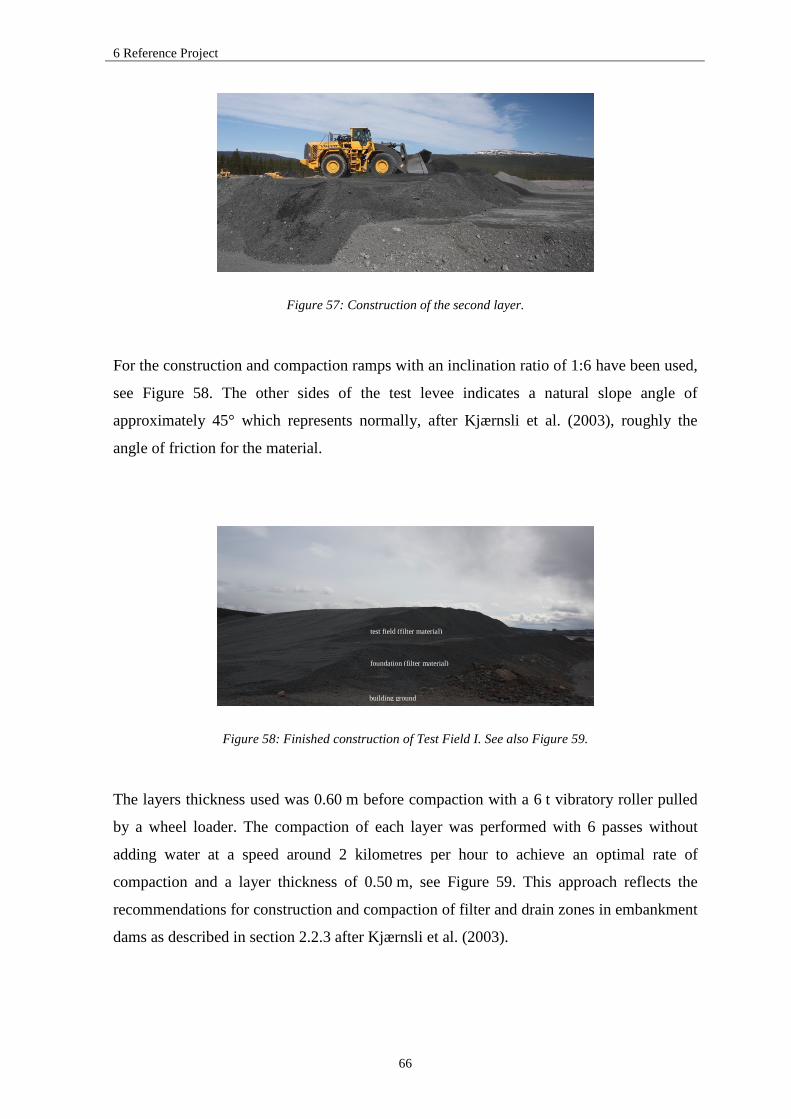
6 Reference Project
66
Figure 57: Construction of the second layer.
For the construction and compaction ramps with an inclination ratio of 1:6 have been used,
see Figure 58. The other sides of the test levee indicates a natural slope angle of
approximately 45° which represents normally, after Kjærnsli et al. (2003), roughly the
angle of friction for the material.
Figure 58: Finished construction of Test Field I. See also Figure 59.
The layers thickness used was 0.60 m before compaction with a 6 t vibratory roller pulled
by a wheel loader. The compaction of each layer was performed with 6 passes without
adding water at a speed around 2 kilometres per hour to achieve an optimal rate of
compaction and a layer thickness of 0.50 m, see Figure 59. This approach reflects the
recommendations for construction and compaction of filter and drain zones in embankment
dams as described in section 2.2.3 after Kjærnsli et al. (2003).
building ground
foundation (filter material)
test field (filter material)

6 Reference Project
67
Figure 59: Compaction with a 6 t vibratory roller pulled by a wheel loader.
The material used for construction is remaining rock material from the mining process in
Malmberget with a grain-size distribution less than 100 mm and a high proportion of fines
as well as a low percentage of stones. Soil parameters have been determined on the basis of
rubber balloon tests, in-situ soundings on site and analyses of samples in the laboratory of
Luleå University of Technology. The following, section describes these tests and the
determined characteristics of Test Field I.
6.1.2 Soil Characteristics
In order to describe the properties of the soil/ material used for construction of Test Field I
in detail, field investigations on site and laboratory analyses at Luleå University of
Technology were carried out. These included, among other things, soil sampling of
approximately 30 kg in the middle of the test field at a depth of 30 cm below ground
surface in order to determine the Proctor density and the grain-size distribution by a wet
sieving analysis.
The soil consisted of a mixture of coarse to fine particles including voids. The majority of
soil particles, after Bardet (1997), are of mineral origins and the voids are filled with water
or air respectively with a combination of these mediums (Figure 60). The degree of soil
compaction basically depends on the water content and the grain-size distribution and the
compaction method used i.e. compacting energy. By implementation of a compaction test,
by literature known as Proctor test, the air fraction of a soil sample is reduced whereby the
water content is not affected due its incompressibility (Bardet 1997).

6 Reference Project
68
In practice, the proportion of air cannot be reduced totally by compaction effort
(Bardet 1997). Nevertheless, the ratio of moisture in soil affects the degree of compaction.
Figure 60: Compaction test: Impact of compaction in a soil volume (Bardet 1997).
Thus, this laboratory analysis enables the determination of optimal water content (OWC)
and a maximum dry density (MDD) for a soil sample (Bardet 1997). This special level of
dry density is also known in international literature as “Proctor Density”. By plotting dry
density versus water content a Proctor curve becomes visible including one (usually) peak
point that reflects the point of intersection between OWC and MDD. In the field of
moraine cores for embankment dams, for instance, a maximum moraine water content of
3 % above the optimal water content on the “wet site” (upstream) is recommended to
ensure core reliability, after RIDAS (2012). Additional general embankment dam
characteristics are described in section 2.2. The modified heavy Proctor test has been
implemented by a compaction machine with a compaction cylinder. Each of a total of five
soil layers were compacted with 25 blows by a hammer with a weight of 4.5 kg and a drop
height of 45.7 cm. Altogether five compaction tests with different water contents were
carried out. In this process a MDD value of 2.44 g/cm³ (Proctor density) and an OWC
value of 6.4 % were determined. A Proctor compaction curve with the maximum dry
density on its peak point for the embankment material is illustrated in Figure 61.
Figure 61: Proctor curve for Test Field I.
2,282,3
2,322,342,362,38
2,42,422,442,46
3 4 5 6 7 8 9 10 11
Dry
Den
sity
(g/c
m3 )
Water content (%)

6 Reference Project
69
Analysing the grain-size distribution, also known as gradation, of granular material by wet
or dry sieving is a commonly used procedure in the area of civil engineering.
The main objective is the determination of different percentages of grain sizes within a soil
sample (Bardet 1997). The grain-size distribution curve of a soil probe is determined by
weight of passing particles through different sieve layers, see Figure 62. For the sieving
different mesh sizes were used in the following order: 20.0 mm, 11.2 mm, 5.6 mm,
2.0 mm, 1.0 mm, 0.5 mm, 0.25 mm, 0.125 mm and 0.063 mm.
Figure 62: Sieving apparatus.
The proportion of fines less than 0.063 mm, normally analysed with a hydrometer or the
pipette method after Bardet (1997), was not analysed. As a consequence of a visible high
percentage of plastic fines wet sieving were carried out. Thereby, an unused proportion of
the soil from the sample used for the proctor test was dried for 24 hours in an oven at
105°C. After implementation of the sieving the retained soil at each sieve layer has been
washed and dried in small marked basins for 24 hours at a temperature of 105°C.
Thereafter, weightings were carried out again and the cumulative weight has been used for
presenting the grain-size distribution. An error-analysis in terms of identical weights was
considered by the comparison of the accumulated weight and the initial sample weight
(Bardet 1997).
All values can be plotted as a grain-size distribution curve on a graph with the cumulative
percentage of passing particles on the vertical axis and the logarithmic scale of particle
sizes on the horizontal axis. Furthermore, the resulting curve can be divided into uniform,
well graded or poorly graded grain-size distribution types (Bardet 1997).

6 Reference Project
70
In this context, the coefficient of uniformity, CU, and the coefficient of curvature, CC, were
calculated for a generally description of the shape and slope of the particle size distribution
curve (Bardet 1997):
Coefficient of uniformity [-]: CU = D60
D10 (7.1)
where: D10 = grain-size; suffix represents the percentage by weight of the material that is finer than the determined diameter [10 %], D60 = grain-size; suffix represents the percentage by weight of the material that is finer than the determined diameter [60 %], CU = Average slope of distribution between 10 % and 60 %. CU = 1.0 is the smallest possible value and refers to a well uniform composition of comparable grain sizes.
Coefficient of curvature [-]: CC = D302
D10 ∙D60 (7.2)
where: D10 = grain-size share; suffix represents the percentage by weight of the material that is finer than the determined diameter [10 %], D30 = grain-size share; suffix represents the percentage by weight of the material that is finer than the determined diameter [30 %], D60 = grain-size share; suffix represents the percentage by weight of the material that is finer than the determined diameter [60 %], CC = Shape/ curvature of the distribution curve.
After literature, a well graded gravel exists when CU > 4 and 1 < CC < 3 (Bardet 1997).
Calculated values in the context of grain-size distribution are presented in the following
Table 8. The corresponding particle size distribution curve is illustrated in Figure 63.
Table 8: Gradation resuls for Test Field I.
Soil type Percentage of retained [%]
Grain-size share Particle size [mm]
CU CC
Gravel 36.0 D10 0.063
79.4 0.79 Sand 54.8 D30 0.50
Fine 9.2 D60 5.00
D50 2.00
D15 0.17
D90 17.00
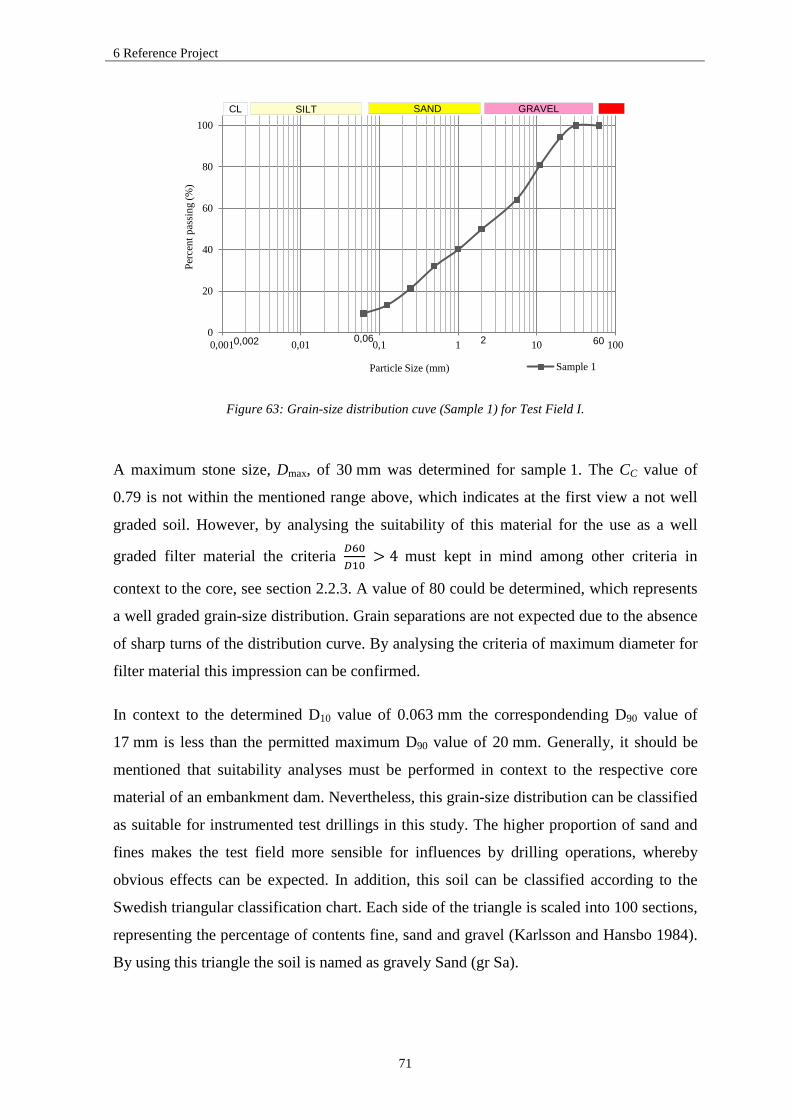
6 Reference Project
71
Figure 63: Grain-size distribution cuve (Sample 1) for Test Field I.
A maximum stone size, Dmax, of 30 mm was determined for sample 1. The CC value of
0.79 is not within the mentioned range above, which indicates at the first view a not well
graded soil. However, by analysing the suitability of this material for the use as a well
graded filter material the criteria 𝐷60𝐷10
> 4 must kept in mind among other criteria in
context to the core, see section 2.2.3. A value of 80 could be determined, which represents
a well graded grain-size distribution. Grain separations are not expected due to the absence
of sharp turns of the distribution curve. By analysing the criteria of maximum diameter for
filter material this impression can be confirmed.
In context to the determined D10 value of 0.063 mm the correspondending D90 value of
17 mm is less than the permitted maximum D90 value of 20 mm. Generally, it should be
mentioned that suitability analyses must be performed in context to the respective core
material of an embankment dam. Nevertheless, this grain-size distribution can be classified
as suitable for instrumented test drillings in this study. The higher proportion of sand and
fines makes the test field more sensible for influences by drilling operations, whereby
obvious effects can be expected. In addition, this soil can be classified according to the
Swedish triangular classification chart. Each side of the triangle is scaled into 100 sections,
representing the percentage of contents fine, sand and gravel (Karlsson and Hansbo 1984).
By using this triangle the soil is named as gravely Sand (gr Sa).
0
20
40
60
80
100
0,001 0,01 0,1 1 10 100
Perc
ent p
assi
ng (%
)
Particle Size (mm) Sample 1
0,002 0,06 2 60
SILT CL SAND GRAVEL

6 Reference Project
72
Grain-size distribution analyses including sieving and the calculation of uniformity
coefficients were also implemented for all samples taken after instrumented test drillings
from excavation pits, as described in section 6.1.6. These results are presented in relation
to other analyses and to this basic distribution curve, named Sample 1, in chapter 7.1.3.
Furthermore, four rubber balloon tests were carried out on site at four different points at a
depth of 30 cm below ground surface. Thereby, the achieved dry density of the compacted
soil can be determined with a rubber balloon apparatus, as illustrated in Figure 64.
Figure 64: Schematic view of the rubber balloon apparatus (left hand side) (Jantzer 2009) and its use in field I (right hand side).
The overall objective is to control the compaction degree of the same material/ soil as
investigated by a Proctor test in the laboratory. In this context, the determination of bulk
density and water content of the compacted soil as well as the calculation of the dry density
is possible by using the following formulas (ASTM D 2167-94 2001):
Bulk density (wet): ρwet = Mwet
Vh (7.3)
where: ρwet = wet bulk density (in-place wet density) in g/cm³, Mwet = mass of the moist soil from the excavated test hole in g, Vh = soil volume of the test hole in cm³, measured my rubber balloon method.

6 Reference Project
73
Dry density: ρd = ρwet
�1+ w100�
(7.4)
where: ρd = dry density (in-place dry density) in g/cm³, ρwet = wet bulk density (in-place wet density) in g/cm³, w = moisture (water) content of the soil from the excavated hole, expressed as a percentage of the dry mass of soil. w = mwet
md
Degree of compaction (Bardet 1997): Rd = ρd
ρpr ∙ 100 % (7.5)
where: Rd = Degree of compaction on site in %, ρd = Maximum dry density (in-place dry density) by the rubber balloon test in g/cm³, ρpr = Proctor density by a compaction test in the laboratory in g/cm³.
The water content has been determined by soil samples from the excavated small holes for
the balloon tests. Great care was taken in sampling and carrying out the balloon test to
ensure representative samples. These samples were sealed on site in air-tight sample bags
and marked for subsequent laboratory tests.
Calculated single values for the rubber balloon test are given in the following Table 9 and
in more detail in Appendix C2. Furthermore, average values determined as a reference for
the description of Test Field I are included.
Table 9: Values of rubber balloon tests.
No. Bulk density
ρwet [g/cm³]
mwater [g]
Water content
[-]
Dry density ρd
[g/cm³]
Average ρd [g/cm³]
Proctor density
ρpr [g/cm³]
Degree of compaction
[%]
Average degree of
compaction [%]
B1 2.01 14 0.02 1.98
2.11 2.44
81.12
87 B2 2.22 20 0.03 2.16 88.69
B3 2.07 17 0.02 2.02 82.93
B4 2.38 22 0.04 2.29 93.83
The average in-place density (dry density) of 2.11 g/cm³ differs only moderately from the
optimal Proctor density of 2.44 g/cm³, determined with an optimal water content of 6.4 %
in the laboratory. Hence, an average degree of compaction of 87% could be identified.
This value represents a good compaction, taking into account that no additional water has
been used during compaction of Test Field I.

6 Reference Project
74
The soil samples obtained in balloon tests were also used to determine the specific gravity,
GS, known from literature also as particle density or specific density. The specific gravity
specifies the ratio of the weight of a unit volume of a material to the identical volume of a
reference volume as water, for instance (Bardet 1997). The pycnometer method was used
according to the standard ASTM D 854-92 for determining this soil parameter. For each soil
sample two pycnometer tests have been implemented.
Specific gravity [-] (Bardet 1997): 𝐺𝑠 = (𝑊2−𝑊1)[(𝑊4−𝑊1)−(𝑊3−𝑊2)] (7.6)
where: W1 = weight of a dry and clean pycnometer in g, W2 = weight of a pycnometer filled with dry soil in g, W3 = weight of a pycnometer filled with soil and water addition in g, W4 = weight of a pycnometer filled with distilled water in g.
The degree of soil porosity essentially determines the resistance to dewatering. In other
words, the porosity determines the ratio between the volume of cavity (volume filled
with air) and the total volume of a certain soil sample. Thus, the porosity affects the
density of materials. The porosity has been determined according the following formula.
Porosity [%] (Bardet 1997): 𝑛 = 1 − ρd
ρS∙ 100 (7.7)
where: ρd = dry density (in-place dry density) from the field g/cm³, ρS = particle density from the pycnometer test in g/cm³.
Average values of five pycnometer tests and a decisive mean value of the specific gravity
as well as the porosity were calculated by using the formulas above, see Table 10.
Table 10: Specific gravity and porosity.
Test No. Average GS
[g/cm³]
Bulk density ρwet
[g/cm³]
Dry density ρd
[g/cm³]
Porosity [%]
B1 2.978 2.013 1.979 33.53 B2 3.119 2.219 2.164 30.63 B3 2.953 2.072 2.024 31.48 B4 3.096 2.257 1.968 36.44 B5 2.970 2.376 2.290 22.92
Overall average 3.023 2.187 2.085 31.00

6 Reference Project
75
The determined overall average of specific gravity of 3.02 g/cm³ is about 11.85 % higher
than of 2.70 g/cm³, usual assumed for typical soil. This increase can be attributed to the
enclosed iron ore content in the soil.
Beyond these laboratory analyses, an in-situ weight sounding test (WST) was conducted
before drilling in the centre of the test field, as described in section 6.1.5, in order to
achieve initial values of the constructed field. Based on this sounding resistance
information, a density range and the effective angle of shearing resistance (φ’) have been
estimated according to Swedish experience on cohesionless soils, see Table 11.
Further details on the objectives respectively on the development of these commonly used
in-situ technique can be found in section 6.1.5. A site plan with sampling respectively test
positions can be found in Appendix A.
Table 11: Estimated soil parameters based on weight sounding and experiences after BS EN 1997-2:2007.
Test No. Used weight [kg]
Average resistance over 3 m
[half-turns /0.20 m] (range)
Effective angle of shearing
resistance, φ’ [° ]
Density index (very soft to very
dense)
F1 centre 100 125.7 (> 80) 40-42 very dense
The determined average resistance of 125.7 half-turns/ 0.20 m, over a depth of 3 m,
represents a very dense soil. By reverse conclusion this value confirms the determined
degree of compaction, presented above.
Finally, it should be noted, that the determined characteristics of Test Field I are assumed
to be homogeneous over the whole field for subsequent analyses, although there are
variations in reality.

6 Reference Project
76
6.1.3 Drilling Operations and Drill Setups
All boreholes within Test Field I and the deep borehole
(Test Field II) were drilled with an instrumented drilling
rig of Sweco Infrastructure AB. A GM 75 GT drilling rig
of Swedish Geomek AB (Figure 65) was used to drill a
total of nine boreholes with a depth of 3 m in Test Field I
with different drilling technologies, setups and
inclinations. Test Field I represents an artificial dam
respectively levee with specific soil characteristics as
presented in the previous sections. This drilling rig is
extremely manoeuvrable and usable for all terrains.
Furthermore, it is equipped with a rotating head and a
hydraulic drifter (top hammer).
Figure 65: Used drilling rig:
Geomek GM 75 GT.
In Table 12 general performance data of the used drilling rig GM 75 GT are shown.
Table 12: Performance overview of GM 75 GT (Geomek 2012).
Dimensions
Weight 3200 kg without rods Length 3800 mm Width 1850 mm Height 2100 mm
Undercarriage and power pack
Steel reinforced, rubber tracks, hydraulic tightening 8 wheels, 2 track pairs, 2 driving motors-brakes, max travelling speed 5km/h Capacity of fuel and hydraulic tanks 100 l Diesel engine to power two hydraulic pumps 70 kW
Mast
Feed Hydraulic cylinder and chain Stroke 2400 mm Pull down force 40 kN Pull up force 70 kN Two spindle Hammer and coring or drilling Mast displacement 600 mm Clamp Single Mast lifting Sideway +/- 10 dec.; back and front 10 dec.

6 Reference Project
77
Rotary head, top hammer
Torque 2500 Nm Speed range 0-120 rpm Top hammer Work pressure 100-140 bar; net weight 65 kg
Miscellaneous
Hydraulic water pump 50 l / 50 bar Pulling force of the electric winch 40 kN Hydraulic support legs Hydraulic compressor 2.5 m³ / 7 bar Hydraulic bulldozer blades Radio control for driving, drilling and winch Data logger for MWD and soundings Portable computer
The instrumented drilling tests have been conducted separately in lines depending on the
drilling technology respectively the technology in combination with a certain drill setup.
Within each line three boreholes were drilled with two vertical holes and one inclined test
hole (18°) each, see Figure 66.
Figure 66: Drilling with inclination: W 35 (left hand side) and top hammer with Symmetrix (right hand side).

6 Reference Project
78
Generally, inclined drilling applications between 10° and 20° in embankment dams are a
very common procedure and cause high demands on the drilling equipment. Further details
on every line are described below. In addition, a distance of 4 m between each borehole
and line enabled drillings and soundings in undisturbed test material. This security distance
is four times larger as the recommended distance of 1 m for geotechnical in-situ
investigations, according to Svenska Geotekniska Föreningen (SGF).
Line one represents test drillings with Wassara’s W 35 water powered DTH hammer,
drilling component of the LHC, as described in section 5.4. Drillings in the second line
have been conducted with a top hammer and the Symmetrix overburden drilling method.
In contrast to line one and three, a filter pipe including an insertion of filter sand has been
carried out within the second vertical borehole. This procedure has been carried out in the
same way with standard equipment as commonly used for water observation wells in
embankment dams or other geotechnical soil formations. Line three represents
instrumented drillings with a top hammer and a standard OD overburden drilling method.
The execution of drillings within line three is identically to line one. The variations
between each drill setup (Symmetrix and OD) as well as the general explanations of
drilling tools are described below. In addition, a site plan with the borehole positions of
each drilling setting can be found in Appendix A.
During all drillings Measurement While Drilling (MWD) technology of Environmental
Mechanics AB, following referred to as Envi, has been used to monitor up to eight drilling
parameters, as described below in section 6.1.4. Furthermore, data of weight sounding tests
were recorded automatically by this logging system, as described in section 6.1.5, and used
for analyses.

6 Reference Project
79
Drill Setups and Applications
Following, all drill setups and applications used for instrumented drillings within Test
Field I are explained exemplarily. Thereby, (1) refers to the water powered W 35 DTH
hammer, (2) describes the Symmetrix setup including the filter pipe installation, and (3)
refers to the standard OD setup. In contrast to (1), the latter two variants have been used
with a top hammer.
1 W 35 (W): Setup 1 refers to Wassara’s water powered DTH hammer for the LHC,
which has been used for three boreholes with a diameter of 43 mm along line one. The
drill bit with a flat front and semiballistic button/ inserts has been used.
The hammer casing with a diameter of 39 mm was mounted on drill rods with a
diameter of 35 mm. A perforated drill rod, as normally used within the LHC above the
hammer, was not used for these short test holes. For further details of W 35 and the
LHC, see section 5.4.
Figure 67: Starting point for drilling with W 35.
2 Symmetrix (S): The second setup refers to the Symmetrix drilling method that is
commonly used for different overburden drilling applications in combination with
different drilling technologies as top hammer and DTH systems. Within this project the
Symmetrix drilling and casing system was used with a top hammer. Symmetrix consists
of pilot pit that drills the main hole and guides the drill string as well as a casing shoe as
a basis for the ring bit (casing bit) (Atlas Copco 2008). The casing bit rotates without
rotations of the casing rods by the connection to the rotating pilot drill bit, whereby the
area for the casing rods is drilled in advance down the hole.

6 Reference Project
80
Thus, the drilling takes place in cooperation of both bits and the casing pipe is pulled
down simultaneously (Atlas Copco 2008). After reaching the final depth the pilot bit
will be unlocked by a reversed drill string rotation and removed out of the borehole,
leaving the casing pipe in the ground, see Figure 68.
Figure 68: Symmetrix drilling principle (left hand side) (Atlas Copco 2008) and view before drilling (right hand side).
With the simultaneous use of the pilot and ring bit, the drilling and casing process can
be accelerated. On the other hand, the distinguished drill bit and the subsequent
following casing cause a direct influence of the adjacent soil respectively rock
formation by the drilling process and used drill mediums. For the instrumented drilling
a pilot bit (o.d. 85 mm) screwed onto drill pipes with a diameter of 44 mm was used.
The casing bit (o.d. 115 mm, i.d. 100 mm) was screwed on a casing (o.d. 115 mm) by
the use of a casing shoe.
In borehole number one of line two a filter pipe were installed including an insertion of
filter sand. This procedure has been carried out in the same way with standard
equipment as commonly used for stand pipes (water observation). A filter pipe with a
length of 1.18 m (o.d. 50.8 mm) and a filter mesh size of approximately 0.9 mm was
installed after a thorough flushing of the borehole. Approximately 60 kg of filter sand
(grain-size 1.2-2.0 mm) was used for backfilling the annular space between filter pipe
and soil, see Figure 69. A final closing by using a concrete plug above the filter distance
was not carried out.
Figure 69: Filterpipe.

6 Reference Project
81
3 Overburden drilling (OD): The third drilling setup refers to the overburden drilling
method, abbreviated as “OD”. This cased drilling setup can flexible be used for drilling
in varying and sensitive conditions. Within the project the OD setup was used in
combination with a top hammer. The system consists of two independent drill strings,
see Figure 70. Extension rods for the use as an inner drill string, specially designed to
withstand percussive forces of the top hammer and a screwed inner bit. A rotary
percussive casing equipped with a casing bit represents the second component of the
OD drilling method.
Figure 70: Inner drill bit (left hand side) and casing bit (right hand side) (Boart Longyear 2012).
Both drill strings can be used for drilling independently. In comparison with the
customary used double head rotary-percussive systems, the OD system in Sweden is
commonly used with a top hammer. In this context, the inner drill rods as well as the
casings can be connected with the top hammer. For the test drillings an x-type faced
inner bit (o.d. 79 mm) screwed onto extension rods with a diameter of 44 mm was used.
The casing bit (o.d. 115 mm, i.d. 79 mm) was screwed on a casing (o.d. 115 mm) by the
use of a casing shoe.
The drill process starts with drilling down the casing up to a certain depth without using
any drilling fluids by using the top hammer and rotation of the casing rods. Afterwards,
the casing rods are disconnected from the top hammer and the inner drill string is
connected for drilling the main area within the casing by using penetration forces and if
needed drill fluids in small volumes. Thereby, a certain layer of approximately 50 cm
down the hole is undrilled in order to avoid hydraulic connection to the adjacent soil/
material.
6 Reference Project
82
By using this natural plug in combination with casing rods a controlled flushing is
achieved. The flushing medium is transferred to the drill bit within the inner drill string.
After the water discharge through the bit the cuttings are flushed out of the borehole as
slurry of water and broken rock fragments through the annular space between inner pipe
and casing. Thus, this drill setup enables drillings with less disturbances of adjacent soil
respectively rock due to its independently applicable drill strings and a more secure use
of drilling fluids. For drilling in unstable formation or sensitive structures as
embankment dams, for instance, this setup is generally used more frequently than
Symmetrix.
In borehole number one of line three a filter pipe were installed including an insertion of
filter sand, as described for setup 2 (S).
6.1.4 Measurement While Drilling (MWD)
Instrumented drillings for ground explorations also referred to as Measurement While
Drilling (MWD), have been implemented in the oil and gas industry for decades (Gui and
Hamelin 2004). Within the previous years the use of this technique has increased in the
field of on-shore drilling for geotechnical applications, for instance. MWD can be
described as an approach for continuous recording, measuring, visualizing and processing
of drilling parameters (Bruce 2002). According to this, parameters such as penetration rate,
hold back, thrust, torque, rotation speed, flow rate, pressure and of course the
corresponding time and borehole depth are usually recorded and processed. The general
objective of using monitored drilling data, after Gui and Hamelin (2004), is to qualify soil
formations and soil respectively rock properties through several drilling parameters in
addition to detailed formation investigations. Furthermore, monitored drilling parameters
can be used for quantitative and qualitative investigations of the used drilling technology
as well as for the detection of subsurface reaction by drilling operations.
All boreholes within Test Field I and the deep borehole (Test Field II) were drilled with an
instrumented drilling rig of Sweco Infrastructure AB. Drilling data were recorded and
processed according to the Swedish JB-3 standard of SGF with the data recorder “G1” of
Envi.

6 Reference Project
83
Thus, up to eight drilling parameters were recorded during each instrumented borehole
drilling. Following, each drilling parameter is described briefly including correlations with
soil respectively rock properties. The second name of each parameter represents the
Swedish translation.
1 Time [Tid]: The time is specified in s/0.20 m and represents the time required to drill
20 cm in soil respectively rock formations. This internal resolution represents a standard
configuration to record drilling data at every 20 cm. This high resolution allows a visual
control during drilling with a very low speed. Furthermore, this parameter indicates the
reciprocal of the average drilling speed over 20 cm. According to Envi, this value is
recorded and processed to certain Swedish demand. Thus, this value is slightly different
to the ROP (2) after conversion.
2 Rate of penetration (ROP) [Borrhastighet]: This drilling parameter, also known as
drilling speed respectively penetration rate, is specified in mm/s according to the JB-3
standard. In the case of deeper boreholes this value is usually indicated in m/min or
cm/min. Properties of rock and soil formations as well as the experience of drilling
operator have a significant effect on the drillability and therefore also on the ROP.
Further details are explained in section 5.3.4. In general, the harder the rock respectively
the dense the soil the lower the drill speed, taking into consideration a reasonably
constant down-thrust (Gui, Hamelin 2004).
3 Down-thrust [Matningskraft]: This parameter indicates the thrust on the bit which
particularly affects the drill speed, specified in kN. According to Gui and
Hamelin (2004), the rate of penetration is almost proportional to the down-thrust, also
known as feed force. In order to obtain information from the ROP the down-thrust
should be kept as constant as possible during drilling. By reverse conclusion this
parameter can help to describe the penetration resistance respectively the drillability of
ground formations. The bigger the grain-size of the soil respectively the higher the
density, compressive strength and abrasiveness of rock, the higher the penetration
resistance and the lower the penetration rate. Especially for deep drillings the weight on
bit (WOB), calculated by subtracting the down-thrust from the hold-back force, is
important for an optimal ROP.

6 Reference Project
84
4 Rotation speed [Varvtal]: The rotation of the drill string respectively of the drill bit is
specified as revolution per minute (RPM) with the SI unit 1 rpm = 1•(60s)-1.
More often used is the unit 1/min. The aim is to loosen sufficiently large rock fragments
that can be flushed as fast as possible out of the borehole with a minimum of energy
input. Further details are explained in section 5.3.4. In order to obtain reasonable
information in terms of penetration rate and torque a reasonably constant rate of RPM
should be used (Gui and Hamelin 2004).
5 Drilling fluid pressure [Spoltryck]: This parameter describes the pressure of the drill
fluid, specified in MPa (1 MPa = 10 bar). For drillings in this study water was used for
cleaning the borehole and also for driving the W 35 DTH hammer. Hence, the water
pressure represents the pressurised water used to drive the W 35 hammer.
Thereby, uncompressed water after each hammer operating cycle is used to clean the
borehole and flushing out the cuttings.
6 Drilling fluid flow rate [Spolflöde]: Water was used as a drilling fluid on site and the
respective flow rates have been measured in l/min. Flow rate values correlate directly to
the used drilling technology and possible negative interferences of soil and rock
formations. Possible risks of drilling in existing embankment dams and foundations are
explained in section 5.1. Nevertheless, a sufficient water supply to drive the DTH
system respectively to ensure an effective borehole cleaning is necessary as explained in
particular in chapter 5.
7 Standby hammer pressure [Tryck på hammare]: This parameter must not be confused
with the parameter of hammer pressure used drilling with a DTH hammer, for instance.
It represents a standby pressure of the hydraulic system of the drilling rig and the
hydraulic drifter, specified in MPa. (Geomek 2012)
8 Force input [Tryck på motor]: The force input [MPa] represents an indirect
measurement of the torque by drilling with rotating drill rods based on hydraulic
pressure of the drilling rig. (Geomek 2012)
Based on the recorded data during instrumented drilling, in-situ soundings (6.1.5) as well
as sampling and laboratory tests (6.1.6) have been conducted for determining the sphere
and proportion of influence by drilling technology. Detailed measurement while drilling
information of each borehole can be found in Appendix B.

6 Reference Project
85
6.1.5 Weight Sounding
Apart from the drilling works, in-situ weight sounding tests (WST), in Sweden known as
“Viktsondering”, were carried out by Sweco Infrastructure AB. After the following
description of the sounding process in connection with the test drillings the WST method
and the purpose of the use of this equipment is described.
Before beginning the drilling work one WST investigation was conducted in the middle of
the Test Field I in order to achieve an initial value of the constructed levee, see Figure 71.
Following, WST were carried out for each borehole after drilling to investigate the change
of in-situ parameters of the filter material by drilling operation in contrast to the first WST
before drilling. As already mentioned above in section 6.1.3, in total nine boreholes were
drilled with three different drill setups and two different drilling technologies.
Figure 71: Drilling rig in position for the first WST in the middle of the test field.
In the area of the first borehole of each drilling technology respectively drill setup WST
were implemented with two different distances from the drilled borehole. In order to
investigate the sphere and proportion of influence by drilling technology respectively the
drilling fluid these tests were realized in steps with distance of 20 cm (Figure 72, left) and
50 cm (Figure 72, right) from the borehole.

6 Reference Project
86
Figure 72: WST – distances: 20 cm (left hand side) and 50 cm (right hand side).
Due to the high time requirement for each WST of about 40 minutes and a low difference
of the measured sounding values, estimated on site, the amount of WST and the distance
from the borehole have been modified for the following investigations. Thus, WST next to
the remaining six boreholes has been carried out with a medium distance of 35 cm. WST
next to the last borehole of each setup has been carried out with the same inclination of 18°
as the boreholes. In general, all weight soundings were carried out in steps between 30 cm
and 50 cm with increasing sounding depth. At each step the amount of half rotations has
been increased up to the load limited of the sounding pipes by using a weight of 100 kg.
Pushing forces between 500 kg and 800 kg have been used to reach the next sounding
level.
Weight sounding data were recorded automatically by the measurement equipment of the
drilling rig and used for analyses. Furthermore, the WST information next to each
borehole, in addition to the MWD data, can be found in Appendix B. Following,
background information as well as objectives of this in-situ technique are described.

6 Reference Project
87
Background and Objectives
The weight sounding test, included in the European standardisation ENV 1997-3.7, is the
most commonly used in-situ penetration test in Scandinavia, Finland as well as in Japan
(Smoltczyk 2003). It was developed, after Smoltczyk (2003), by the geotechnical section
of the Swedish railway administration and was standardized in 1917. This test is usually
used for ground investigations in different soil formations in context with other
geotechnical applications and construction purposes as foundations and piles, for instance
(Smoltczyk 2003). WST can be carried out in most common soils but are, according to
Smoltczyk (2003), primarily applied in very soft to stiff cohesive soils and very loose to
dense cohesionless soils.
A WST system (Figure 73) consists of a penetrometer build as a screw shaped point with a
diameter of 25 mm, different weights (one 5 kg, two 10 kg and three 25 kg), extension rods
with a diameter of 22 mm and a handle respectively a rotation head at hydraulic machines
(Smoltczyk 2003). By using a hydraulic machine, loads and the number of halfturns can be
monitored and processed automatically by electrical sensors (Smoltczyk 2003).
Figure 73: Overview of a WST system (ENV 1997:3-2000) and a used screw shaped point (right hand side) (Smoltczyk 2003).
The objective of this weight sounding method was to measure the resistance of soil in-situ
to the static respectively rotational down thrust of a screw shaped point prior and after
drilling (BS EN 1997-2:2007).

6 Reference Project
88
According to the European standardization, WST should be carried out as a static sounding
in soft soil while a penetration resistance less than 1 KN (a total load of 100 kg) exists. If
the value is exceeding this level, the penetrometer should be rotated and the number of
halfturns required for 0.2 m penetration (ht/0.2 m) must be recorded.
Static loads are available in different steps as 0, 5 kg, 25 kg, 50 kg, 75 kg and 100 kg
(BS EN 1997-2:2007).
By using this sounding method different soil properties can be derived from the monitored
data to describe the soil resistance. Based on the sounding resistance in halfturns for 20 cm
of penetration a density index, the effective angle of shearing resistance (φ’) as well as the
a drained Young’s-Modulus (E’) can be estimated for natural cohesionless soils based on
Swedish experience (BS EN 1997-2:2007), see Figure 74.
Figure 74: Example of relations between different parameters based on weight sounding resistances (BS EN 1997-2:2007).

6 Reference Project
89
6.1.6 Sampling
After each test drilling a walkable pit with a depth of approximately 3.5 m was excavated
step by step with an 8 t excavator next to the drill pipe, see Figure 75. Thereby, the bucket
was guided along the pipe with a graduated reduction of the distance from 30 cm to 15 cm.
The remaining adjacent soil has been removed by the use of shovel (Figure 76, left).
Figure 75: Excavation of a pit with a depth of approximately 3.5 m after drilling.
In addition to the WST next to each borehole, as described in section 6.1.5, samples from
the adjacent soil of the drill pipes were taken. For each test hole, three disturbed samples,
each weighting not less than 2 kg, were taken with a vertical distance of 1 m from the
surface and within a radius of approximately 10 cm around the pipe (Figure 76, left).
Great care was taken in sampling to ensure representative samples. These samples have
been analysed in the geotechnical laboratory of Luleå University of Technology in terms of
the grain-size distribution by wet sieving tests as described in section 6.1.2.
Figure 76: Removal of the remaining soil close to drill pipe, soil sampling and documentation.
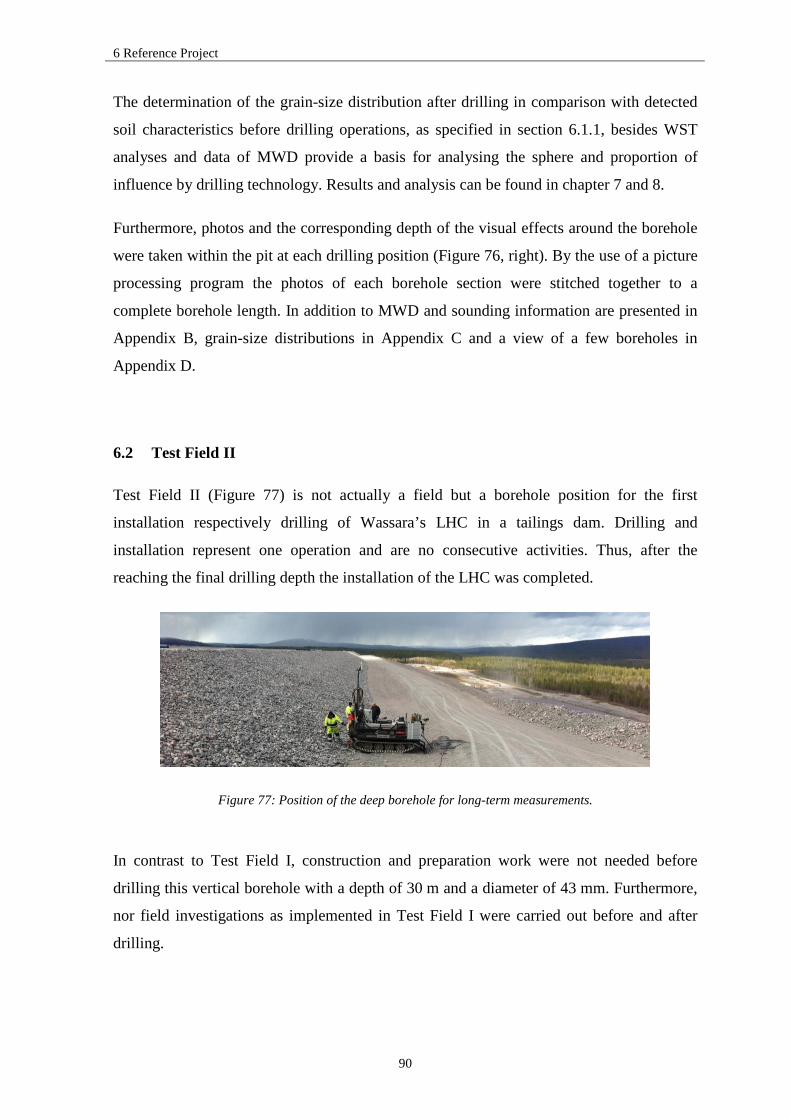
6 Reference Project
90
The determination of the grain-size distribution after drilling in comparison with detected
soil characteristics before drilling operations, as specified in section 6.1.1, besides WST
analyses and data of MWD provide a basis for analysing the sphere and proportion of
influence by drilling technology. Results and analysis can be found in chapter 7 and 8.
Furthermore, photos and the corresponding depth of the visual effects around the borehole
were taken within the pit at each drilling position (Figure 76, right). By the use of a picture
processing program the photos of each borehole section were stitched together to a
complete borehole length. In addition to MWD and sounding information are presented in
Appendix B, grain-size distributions in Appendix C and a view of a few boreholes in
Appendix D.
6.2 Test Field II
Test Field II (Figure 77) is not actually a field but a borehole position for the first
installation respectively drilling of Wassara’s LHC in a tailings dam. Drilling and
installation represent one operation and are no consecutive activities. Thus, after the
reaching the final drilling depth the installation of the LHC was completed.
Figure 77: Position of the deep borehole for long-term measurements.
In contrast to Test Field I, construction and preparation work were not needed before
drilling this vertical borehole with a depth of 30 m and a diameter of 43 mm. Furthermore,
nor field investigations as implemented in Test Field I were carried out before and after
drilling.

6 Reference Project
91
Wassara’s W 35 DTH hammer for the LHC was used for
drilling, as described in section 5.4. A drill bit with a flat front
and semiballistic button/ inserts (o.d. 43 mm) was used for
drilling. The DTH hammer with a diameter of 39 mm was
mounted on the drill rods with a length of 3 m and a diameter
of 35 mm. These drill rods have a reduced wall thickness to
achieve additional financial benefits, compared to standard
drill rods as used for drillings in Test Field I. A reduced wall
thickness is possible, because of the unique use of these drill
pipes. Thus, the resistance of pipe steal and its threaded
connections can be reduced. According to the LHC concept, a
perforated drill rod above the hammer was used during
drilling respectively the installation of this special stand pipe
(observation well), see Figure 78. Figure 78: LHC before drilling.
During drilling, MWD technology of Envi has been used to monitor eight drilling
parameters, as described in section 6.1.4.
The main objective of this first installation of LHC was to figure out whether it is possible
to use the prototype DTH hammer W 35, a perforated pipe and special manufactured drill
rods, in this new field of application. After drilling, the objective was to pull out the inner
flow tube of the perforated drill pipe in order to open the hydraulic connection,
as described in section 5.4.1. Furthermore, the recorded drilling information is used for
analysing the performance of LHC as well as to determine influences by this drilling
technique.
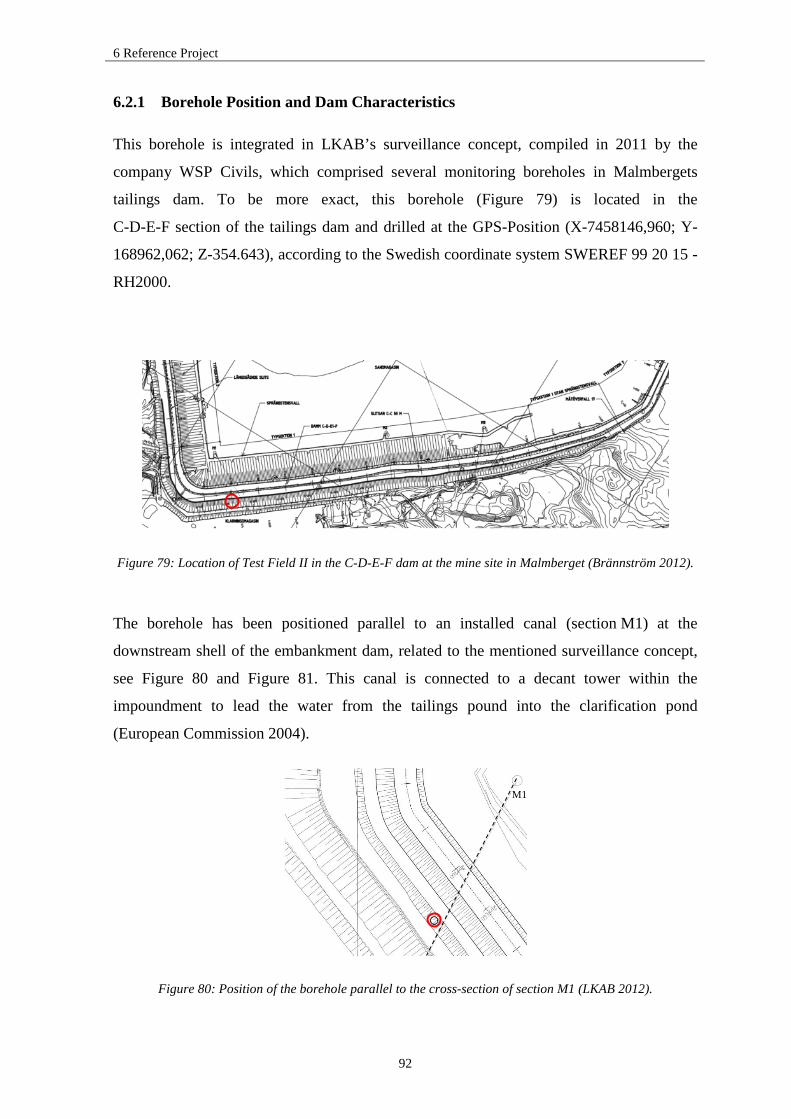
6 Reference Project
92
6.2.1 Borehole Position and Dam Characteristics
This borehole is integrated in LKAB’s surveillance concept, compiled in 2011 by the
company WSP Civils, which comprised several monitoring boreholes in Malmbergets
tailings dam. To be more exact, this borehole (Figure 79) is located in the
C-D-E-F section of the tailings dam and drilled at the GPS-Position (X-7458146,960; Y-
168962,062; Z-354.643), according to the Swedish coordinate system SWEREF 99 20 15 -
RH2000.
Figure 79: Location of Test Field II in the C-D-E-F dam at the mine site in Malmberget (Brännström 2012).
The borehole has been positioned parallel to an installed canal (section M1) at the
downstream shell of the embankment dam, related to the mentioned surveillance concept,
see Figure 80 and Figure 81. This canal is connected to a decant tower within the
impoundment to lead the water from the tailings pound into the clarification pond
(European Commission 2004).
Figure 80: Position of the borehole parallel to the cross-section of section M1 (LKAB 2012).
M1

6 Reference Project
93
Figure 81: Cross-section of M1 and marked borehole (LKAB, 2012).
The tailings dam at Malmberget was constructed in 1977 and has been increased several
times (European Commission 2004). This tailings dams section C-D-E-F, is constructed as
a downstream type, has a current height of 42 m with an inclination ratio of 1:2 for the
upstream slope and a ratio of 1:1.5 for the downstream slope (European
Commission 2004). The downstream shell (shoulder) is constructed by the use of the
material characterised in Table 13 and grain-size distribution curve in Figure 82.
Table 13: Grain-size distribution in the downstream shell (WSP, 2011).
Grain-size share Description D15 > 4 mm
The suffix represents the percentage by weight of the material that is finer than the determined diameter. The diameter of this soil must be larger than 4 mm.
D50 = 20-50 mm 50 % by weight of the material has to be finer than the range of 20-50 mm
Dmax = 300 mm The maximal stone size is 300 mm.
Figure 82: A typical grain-size distribution curve for used material in the downstream shell.
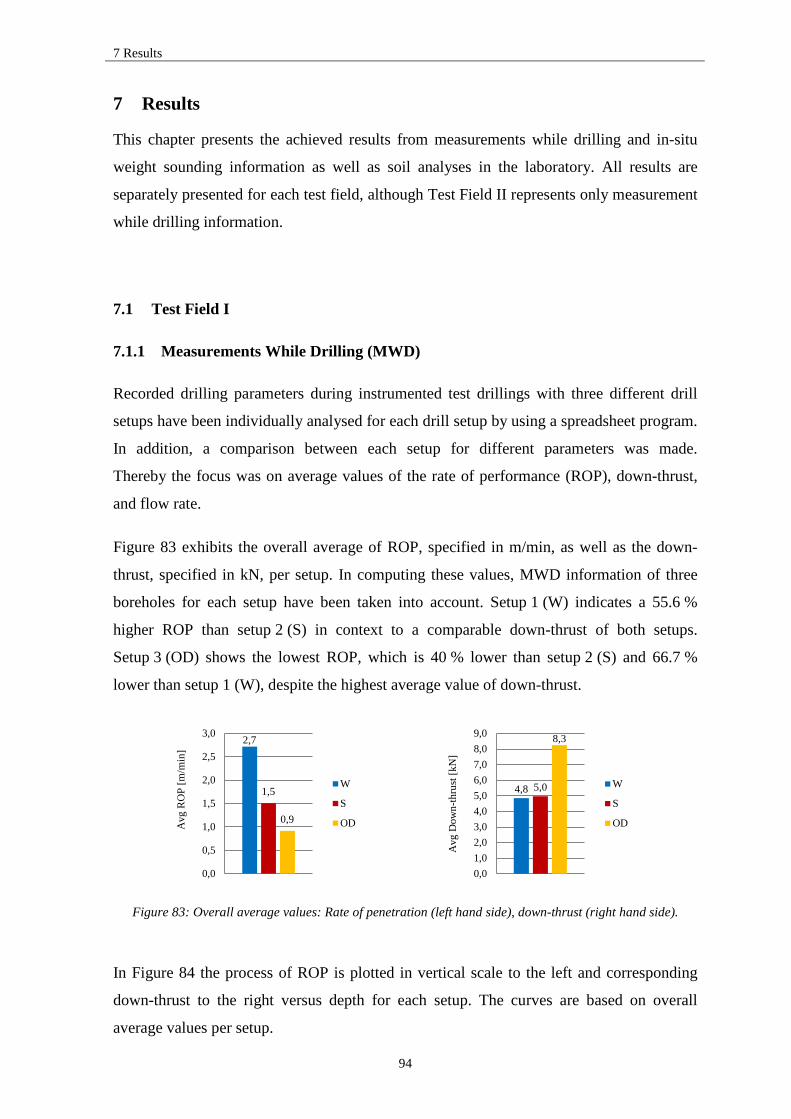
7 Results
94
7 Results
This chapter presents the achieved results from measurements while drilling and in-situ
weight sounding information as well as soil analyses in the laboratory. All results are
separately presented for each test field, although Test Field II represents only measurement
while drilling information.
7.1 Test Field I
7.1.1 Measurements While Drilling (MWD)
Recorded drilling parameters during instrumented test drillings with three different drill
setups have been individually analysed for each drill setup by using a spreadsheet program.
In addition, a comparison between each setup for different parameters was made.
Thereby the focus was on average values of the rate of performance (ROP), down-thrust,
and flow rate.
Figure 83 exhibits the overall average of ROP, specified in m/min, as well as the down-
thrust, specified in kN, per setup. In computing these values, MWD information of three
boreholes for each setup have been taken into account. Setup 1 (W) indicates a 55.6 %
higher ROP than setup 2 (S) in context to a comparable down-thrust of both setups.
Setup 3 (OD) shows the lowest ROP, which is 40 % lower than setup 2 (S) and 66.7 %
lower than setup 1 (W), despite the highest average value of down-thrust.
Figure 83: Overall average values: Rate of penetration (left hand side), down-thrust (right hand side).
In Figure 84 the process of ROP is plotted in vertical scale to the left and corresponding
down-thrust to the right versus depth for each setup. The curves are based on overall
average values per setup.
2,7
1,5
0,9
0,0
0,5
1,0
1,5
2,0
2,5
3,0
Avg
RO
P [m
/min
]
W
S
OD
4,8 5,0
8,3
0,01,02,03,04,05,06,07,08,09,0
Avg
Dow
n-th
rust
[kN
]
W
S
OD

7 Results
95
Thus, the differences in respect of penetration rate and down-thrust between each setup, as
described above, are visualized with a higher resolution for the entire length of test
boreholes. Each curve indicates ups and downs in values during drilling. The highest
decrease of ROP in direct relationship to high values of down-thrust appears from a depth
of approximately 0.50 m independently of the setup. Single graphs plotted for each
measured parameter are shown in Appendix B2.
Figure 84: Overall average values: Comparison between the process of ROP and down-thrust per setup.
In addition to ROP and down-thrust, overall average values of flow rate (l/min) per setup
are shown in Figure 85. In computing these values, MWD information of three boreholes
for each setup have been taken into account.
Figure 85: Overall average values: Flow rate.
0,0
2,0
4,0
6,0
8,0
10,0
12,0
14,0
16,0
0,0
1,0
2,0
3,0
4,0
5,0
6,0
7,0
8,0
0,0 0,2 0,4 0,6 0,8 1,0 1,2 1,4 1,6 1,8 2,0 2,2 2,4 2,6 2,8 3,0
Avg
Dow
n-th
rust
[kN
]
Avg
RO
P [m
/min
]
Depth [m]
W - ROP
S - ROP
OD - ROP
W - down-thrustS - down-thrustOD - down-thrust
22,1
31,3
0,0
5,0
10,0
15,0
20,0
25,0
30,0
35,0
Avg
Flo
w ra
te [l
/min
]
W
S
OD
0

7 Results
96
In connection with Setup 1 (W) unpressurized water is used to clean/ flush the borehole.
Setup 1 (W) shows an average flow rate of 22.1 l/min. Setup 2 (S) on the other hand shows
an average flow rate of 31.3 l/min. As a result setup 1 (W) indicates a reduction of 29.4 %
in flow rate in comparison with setup 2 (S). In contrast to the other setups, no values are
available for setup 3 (OD) due to the absence of a continuous water flow during drilling.
7.1.2 Weight Sounding (WST)
Weight soundings tests were carried out after drilling at different distances from the
borehole as well as one in the centre of Test Field I (number F1) in order to achieve an
initial soil resistance value of this test field, see section 6.1.5.
In total, 12 weight soundings were implemented after drilling, see Appendix A. Based on
recorded sounding resistances per borehole a density range and the effective angle of
shearing resistance (φ’) have been estimated according to Swedish experience on
cohesionless soils, see Table 14. Thus, a soil density index for each WST distance were
estimated in context with a calculated average soil resistance over a sounding depth of
3.0 m, see Table 14. Weight soundings next to the drill setup 1 (W) and setup 3 (OD)
indicate the highest soil density “very dense”. In contrast, setup 2 (S) represents, with the
exception of FS3, a lower density range “dense”.

7 Results
97
Table 14: Estimated soil parameters based on weight soundings after drilling and experiences after BS EN 1997-2:2007.
Setup & hole No.
WST distance
[m]
Used weight [kg]
Average resistance over 3 m
[half-turns /0.20 m] (range)
Effective angle of shearing
resistance, φ’ [° ]
Density index (very soft to very
dense)
FW1 0.20 100 80.7 (> 80) 40-42 very dense 0.50 100 106.8 (> 80) 40-42 very dense
FW2 0.35 100 88.4 (> 80) 40-42 very dense FW3 0.35 100 130.0 (> 80) 40-42 very dense
FS1 0.20 100 52.5 (40-90) 37-40 dense 0.50 100 68.8 (40-90) 37-40 dense
FS2 0.35 100 73.6 (40-90) 37-40 dense FS3 0.35 100 117.9 (> 80) 40-42 very dense
FOD1 0.20 100 85.3 (> 80) 40-42 very dense 0.50 100 116.3 (> 80) 40-42 very dense
FOD2 0.35 100 99.8 (> 80) 40-42 very dense FOD3 0.35 100 84.8 (> 80) 40-42 very dense
Monitored WST data and average soil resistances over a depth of 3.0 m in comparison to
the first sounding F1 for each borehole respectively setup are presented in Appendix B3 to
B5.
In addition to individual average values of soil resistance and an estimated range of soil
density, average percentages shown in Figure 86 indicates the change of the soil resistance
of Test Field I. To be more specific, the percentages represent the difference in soil
resistance between the initial value F1 (before drilling) and the average values of WST
next to the borehole. Distinctions between the three drill setups used and test distances
from the borehole are taken into account. The values within the third column (Avg. WST
0.20 m, 0.50 m) of the figure represent an average of the first two columns.
Figure 86: Percentage difference in soil resistance between different distances per setup and WST F1.
Avg WST(0,20m)
Avg WST(0,50m)
Avg WST(0,20 m, 0,50 m)
Avg WST(0,35 m)
OD 32,2 7,5 19,8 26,6S 58,3 45,3 51,8 23,8W 35,8 15,0 25,4 13,1
0,0
10,0
20,0
30,0
40,0
50,0
60,0
∆ in
soil
resi
stan
ce [%
]
setups

7 Results
98
In context with drill setup 1 (W) and setup 3 (OD), the average values of difference in soil
resistance decreased with an increased distance to the borehole. That, in turn, indicates a
decreasing influence through the drilling process with increasing distance to the borehole.
Thereby, the difference between (W) and (OD) is 3.6 % for a distance of 0.20 m, 7.5 % for
a spacing of 0.50 m, 13.5 % for a distance of 0.35 m and 5.6 % for the calculated average
of the distances 0.20 m and 0.50 m. Setup 2 (S) exhibits significant higher values, except
the value for a distance of 0.35 m.
The process of decreasing differences in soil resistances with increasing distances to the
borehole is shown in Figure 87 on the basis of the representative values for the distances
0.20 m, 0.35 m and 0.50 m from Figure 86. A zero-point per setup could be determined for
each calculated function respectively forecast trendline (dashed lines). Each zero-point
indicates 0 % difference in soil resistance in comparison to the initial value F1. To be more
specific, these meter values represents the boundary to an estimated uninfluenced area
around the borehole. Setup 1 (W) and setup 3 (OD) indicates a similar zero-point in a
distance of 0.49 m to the axis of the borehole. In contrast, setup 2 (S) shows an increased
distance of 0.72 m.
Figure 87: Process of percentage difference in sieve passing and calculated linear forecast lines.
y = -173,65x + 86,572 y = -124,62x + 89,549 y = -176,53x + 87,899 0,0
20,0
40,0
60,0
80,0
100,0
120,0
0,00 0,05 0,10 0,15 0,20 0,25 0,30 0,35 0,40 0,45 0,50 0,55 0,60 0,65 0,70 0,75
∆ in
soil
resi
stan
ce [%
]
Distance to the borehole [m]
W
S
OD
W linearforecastS linearforecastOD linearforecast
uninfluenced area
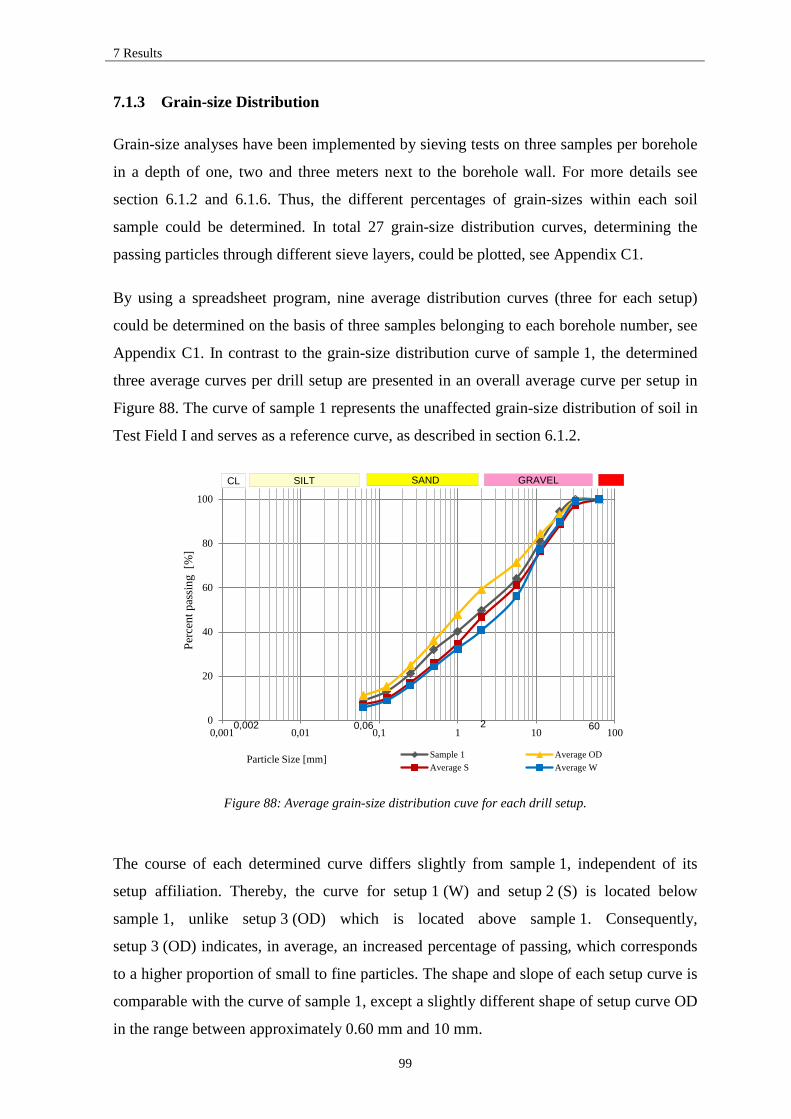
7 Results
99
7.1.3 Grain-size Distribution
Grain-size analyses have been implemented by sieving tests on three samples per borehole
in a depth of one, two and three meters next to the borehole wall. For more details see
section 6.1.2 and 6.1.6. Thus, the different percentages of grain-sizes within each soil
sample could be determined. In total 27 grain-size distribution curves, determining the
passing particles through different sieve layers, could be plotted, see Appendix C1.
By using a spreadsheet program, nine average distribution curves (three for each setup)
could be determined on the basis of three samples belonging to each borehole number, see
Appendix C1. In contrast to the grain-size distribution curve of sample 1, the determined
three average curves per drill setup are presented in an overall average curve per setup in
Figure 88. The curve of sample 1 represents the unaffected grain-size distribution of soil in
Test Field I and serves as a reference curve, as described in section 6.1.2.
Figure 88: Average grain-size distribution cuve for each drill setup.
The course of each determined curve differs slightly from sample 1, independent of its
setup affiliation. Thereby, the curve for setup 1 (W) and setup 2 (S) is located below
sample 1, unlike setup 3 (OD) which is located above sample 1. Consequently,
setup 3 (OD) indicates, in average, an increased percentage of passing, which corresponds
to a higher proportion of small to fine particles. The shape and slope of each setup curve is
comparable with the curve of sample 1, except a slightly different shape of setup curve OD
in the range between approximately 0.60 mm and 10 mm.
0
20
40
60
80
100
0,001 0,01 0,1 1 10 100
Perc
ent p
assi
ng [
%]
Particle Size [mm] Sample 1 Average ODAverage S Average W
0,002 0,06 2 60
SILT CL SAND GRAVEL

7 Results
100
In this context, the coefficient of uniformity, CU, and the coefficient of curvature, CC, were
determined for a generally description of the shape and slope of the curves. Single vales for
each sample and average values per borehole have been calculated, see Appendix C1.
Further general information is presented in section 6.1.2.
In depth investigations were necessary for detailed analyses of the differences between
each average particle size distribution curve in comparison with sample 1.
Consequently, the percentage difference in sieve retaining of grains for each drill setup has
been calculated on the basis of sample 1, see Figure 89. The percentage change for each
mesh size is shown.
Figure 89: Difference in percentage for each mesh size in the drill setups.
Setup 2 (S) and Setup 3 (OD) indicate generally a similar distribution of percentage
difference in sieve retaining between different sizes, whereas setup 3 (OD) shows a higher
loss of larger sized grains between 11.2 to 2.0 mm. On the other hand setups 3 (OD) shows
a completely opposite trends in the range from 0.25 to 0.063 mm. Setup 1 (W) and
setup 2 (S) show a similar pattern with washed out of fines while setup 3 (OD) indicates an
increase. Unlike the setups 2 (S) and 3 (OD), setup 1 (W) shows the highest percentage
increase for a mesh size of 5.6 mm (4.3 %) and a decreased grain-size distribution between
mesh sizes 1.0 and 0.063 mm.
63 31,5 20 11,2 5,6 2 1 0,5 0,25 0,125 0,063OD 0,0 0,7 0,6 -4,5 -4,1 -1,9 1,8 3,2 0,9 1,3 0,1S 0,0 2,8 3,0 -1,4 -1,6 0,3 2,6 0,3 -1,9 -0,9 -1,2W 0,0 0,8 3,8 -1,0 4,3 1,3 -1,1 -0,4 -2,0 -1,2 -1,1
-5,0
-4,0
-3,0
-2,0
-1,0
0,0
1,0
2,0
3,0
4,0
5,0
Diff
eren
ce in
per
cent
reta
inin
g [%
]
Mesh size [mm]

7 Results
101
The described differences in sieve test result of grains for each setup, in relation to the
grain-size distribution of sample 1, are illustrated in Figure 90 as absolute values.
Individual figures for each setup can be found in Appendix C1.
Figure 90: Absolute values of difference in sieve result between the drill setups.
The calculated sum of overall differences for each setup show that setup 3 (OD) indicates
the highest value (19.1 %), followed by setup 1 (W) with 17.0 % and setup 2 (S) with
15.9 %.
63 31,5 20 11,2 5,6 2 1 0,5 0,25 0,125 0,063FOD 0,0 0,7 0,6 4,5 4,1 1,9 1,8 3,2 0,9 1,3 0,1FS 0,0 2,8 3,0 1,4 1,6 0,3 2,6 0,3 1,9 0,9 1,2FW 0,0 0,8 3,8 1,0 4,3 1,3 1,1 0,4 2,0 1,2 1,1
0,0
0,5
1,0
1,5
2,0
2,5
3,0
3,5
4,0
4,5
5,0D
iffer
ence
in p
erce
nt re
tain
ing
-
abso
lute
val
ues
[%]
Mesh size [mm]

7 Results
102
7.2 Test Field II
7.2.1 Measurements While Drilling (MWD)
During the installation respectively installation of Wassara’s first LHC, referred to as DH1,
measurement while drilling technique has been used for recording 30 m of drilling depth.
The LHC concept is described in detail in subsection 5.4. Logged parameters were
prepared and analysed by using a spreadsheet program as in Test Field I. The focus was
directed on average values of the rate of performance (ROP), down-thrust, and flow rate.
Certain parameters of DH1 were compared with setup 1 (W) of Test Field I.
Figure 91 indicates the average ROP (m/min) as well as the average down-thrust (kN),
over a depth of 30 m. DH1 shows a ROP of 4.4 m/min, which is 38.6 % higher than the
overall average of setup 1 (W) in Test Field I. In this context, the down-thrust of 3.1 kN for
DH1 is 35.42 % lower than the average value of setup 1 (W) in Test Field I.
Figure 91: Comparison between DH1 and the overall average of setup W in Test Field I in terms of ROP (left hand side) and down-thrust (right hand side).
In addition, Figure 92 shows a comparison between the process of ROP and the down-
thrust of DH1 including a trendline (dashed line) for each parameter over a depth of 30 m.
The curve relating to each parameter shows ups and downs during drilling. The trendline
of the ROP indicates an exponential decrease with increasing depth. In contrast, the down-
thrust shows an opposite trend with a distinct asymptotic increase with growing depth.
4,4
2,7
0,0
1,0
2,0
3,0
4,0
5,0
RO
P [m
/min
]
DH1
Avg W Field I
3,1
4,8
0,0
1,0
2,0
3,0
4,0
5,0
Dow
n-th
rust
[kN
]
DH1Avg W Field I

7 Results
103
Figure 92: Comparison between the process of ROP and down-thrust and presenting an ROP trendline.
Single process graphs for each measurement parameter can be found in Appendix B6.
In purpose of clearness these graphs indicates average values per meter of drilling.
Figure 93 shows overall average values of the flow rate (l/min) of DH1 in comparison with
setup 1 (W) of Test Field I. DH1 indicates an average flow rate of 25.2 l/min. Thus, the
average flow rate of DH1 is 12.55 % higher than the average value of setup 1 (W) in Test
Field I.
Figure 93: Comparison between DH1 and the overall average
of setup 1 (W) in Test Field I in terms of flow rate.
0,0
0,5
1,0
1,5
2,0
2,5
3,0
3,5
4,0
0,0
2,0
4,0
6,0
8,0
10,0
12,0
14,0
16,0
0,0 2,0 4,0 6,0 8,0 10,0 12,0 14,0 16,0 18,0 20,0 22,0 24,0 26,0 28,0 30,0
Dow
n-t
hru
st [
kN
]
RO
P [
m/m
in]
Depth [m] ROP Down-thrust
ROP trendline Down-thrust trendline
25,2
22,0
20,0
21,0
22,0
23,0
24,0
25,0
26,0
Flo
w r
ate
[l/m
in]
DH1
Avg W Field I

8 Discussion
104
8 Discussion
This chapter combines all listed parameter values in order to analyse the sphere and
proportion of influence by different drilling technologies on soil particles in context with
embankment dams. The analysis starts with a brief discussion on MWD information
(subsection 8.1), followed by the analyses of the correlation between drilling parameters
and the results of grain-size distributions and weight soundings (subsection 8.2). Finally,
discussed aspects are linked to drillings in embankment dams.
8.1 Measurements While Drilling (MWD)
8.1.1 Setup 1 (W)
In the analysis of MWD information it is generally important to discuss single parameters
in correlation to each other. Setup 1 (W) in Test Field I indicates the highest average ROP
(2.7 m/min), derived from three boreholes, although significant differences between each
borehole exists. The third borehole, drilled with an inclination of 18°, indicates the lowest
average ROP (1.5 m/min) as well as the lowest down-thrust of 4.2 kN. This is contrasted
with the highest ROP (3.9 m/min) in context of a slightly higher down-thrust (4.6 kN) of
the first borehole drilled with setup 1 (W). Single diagrams can be found in Appendix B1.
Considering, in addition, the average values of each borehole drilled with setup 1 (W) in
terms of flow rate and photos of excavated drill pipes, the correlation between these
parameter and the influence of adjacent soil becomes clear.
The flow rate of the third inclined borehole indicates, unlike the previous parameter, a
decreased value (15.8 l/min) in comparison with identical flow rates of the first two
boreholes (25.2 l/min). By analysing these four parameters the significant reduction of
ROP despite a comparable value of down-thrust of the third borehole is attributable to a
reduced flow rate by 37.3 %. Since the corresponding operating pressure is not influenced,
it is highly probable that the cleaning performance of the borehole bottom respectively the
drill bit and the discharge of water/- cuttings is reduced.

8 Discussion
105
This is once again attributable to the fact that the discharge area has been reduced, because
the DTH hammer itself worked without problems. It seems to be obvious that the applied
down-thrust was too high to drill an inclined borehole with setup 1 (W). However, this
effect is not expected within this soil characteristic. Due to an insufficient bottom cleaning
energy is normally lost by recrushing of cuttings. The previous analysis is further
evidenced by Figure 94, which shows the influenced soil adjacent to the drill pipes. More
photographs are shown in Appendix D1.
Figure 94: Example of borehole details of setup 1 (W): inclined borehole (left hand side), vertical borehole (middle) and sedimentation of cuttings and fines (right hand side).
In particular, visible observation after excavating of the boreholes, indicate a higher
proportion of soil disturbance in terms of flushed away fine grains by acting water along
the top surface of the inclined drill pipes. This can be attributed to the natural behaviour of
groundwater flow which takes the path of least resistance. On the other hand, both vertical
boreholes drilled with setup 1 (W) indicates a significant evenly radius of disturbance of
approximately 5 cm around the pipe walls, see Figure 94. Furthermore, all boreholes of
setup 1 (W) showed a sedimentation of drill cuttings and rearranged fine soil particles
around the drill pipe within the previous influenced/ flushing zone.
Generally, the rearrangement and sedimentation of fine grains by an acting water flow is
also described as suffosion. The more uneven the grain-size distribution of soil, the higher
the risk of suffosion and larger/- more cavities in the soil structure.
8 Discussion
106
Thus the permeability of the soil and, for instance, the degree of compaction of a certain
soil structure can be influenced. An excessive level of down-thrust can enhance this effect
by vibration transferred from the drill string to the adjacent soil.
In contrast to MWD information of Test Field I, the drilling respectively installation of
DH1 with setup 1 (W) at Test Field II cannot be compared with on-site visual observations
below surface nor laboratory analyses. DH1 exhibits a considerably increased average
ROP (4.4 m/min) in contrast to a decreased down-thrust by 35.4 % (3.1 m/min) in direct
comparison with the overall average of setup 1 (W) in Test Field I. In addition,
the existing average flow rate of 25.2 l/min is only slightly increased compared to the
overall average of setup 1 (W) in Test Field I. Furthermore, the average flow rate of DH1
is exactly equal to both values of vertical boreholes drilled with setup 1 (W) in Test Field I.
As a result of apparently well matching values of down-thrust, RPM and water flow the
cleaning performance of the borehole has been improved, whereby the average ROP
increased considerably. By analysing the more detailed process lines of ROP and down-
thrust of DH1 it becomes apparent that the process of each parameter is levelling off from
a depth of approximately 6 m. Visible ups and downs in values are attributable to an
irregular subsoil with different grain-sizes up to 300 mm, as described in subsection 6.2.1.
General information on used types of stones/ blocks characteristics do not exist. In
summary, the drilling process of DH1 went very evenly and controlled with a remarkable
low average flow rate and a high ROP.
8.1.2 Setup 2 (S)
Setup 2 (S) in Test Field I exhibits a decreased overall average ROP of 1.5 m/min and a
less strongly defined difference between each single borehole. The inclined borehole
presents the lowest average ROP (1.2 m/min) and down-thrust (3.7 m/min) as identified
above in connection with setup 1 (W). The average ROP of both vertical boreholes drilled
with setup 2 (S) is significantly reduced despite a roughly comparable down-thrust applied
at setup 1 (W). Single diagrams can be found in Appendix B1 for details. Furthermore, the
average value of each borehole drilled with setup 2 (S) in terms of flow rate must be taken
into account.

8 Discussion
107
Unfortunately, no flow rate values could be determined for the second borehole. Hence, the
computed overall flow rate of setup 2 (W) subject to inaccuracies. Comparing the average
flow rate of one vertical borehole (25.2 l/min) with the average flow rate of the inclined
borehole (68.7 l/min) an increase of 63.3 % can be determined. Moreover, an increased
flushing effort as well as a particular loosened soil formation with cavities adjacent to the
borehole (visible after excavation) was noted in the drill protocol. By analysing these
parameters it becomes apparent that the lowest average values of ROP and down-thrust as
well as the visible disturbance of soil adjacent to the inclined borehole of setup 2 (S) are
caused by a significant influenced cleaning performance of the borehole. The nature of this
influence of soil respectively the drilling performance is comparable with setup 1 (W),
whereas the sphere and proportion is visible increased due to a 77.0 % higher flow rate
compared to the inclined borehole of setup 1 (W).
It is highly probable that the upflow of flushing water and cuttings, crushed primarily
through the slightly distinguished (eccentric) pilot bit, was prevented by blocked openings
between the ring bit and the pilot bit. Hence an increased amount of water was needed to
remove the clogging, which in turn enabled suffosion and therefore an unevenly and large
radius of disturbance up to 20 cm around the pipe walls was visible, see Figure 95.
Figure 95: Example of borehole details of setup 2 (S): inclined borehole (left hand side) and influence by installation of a filter pipe in a vertical borehole (right hand side).

8 Discussion
108
Setup 2 (S) indicates also a higher share of soil disturbance in terms of flushed away fine
grains by acting water along the top surface of the drill pipe compared with the lower side.
This effect is considerably stronger compared to setup 1 (W). On-site observation of both
vertical boreholes drilled with setup 2 (S) shows a more evenly disturbance around the
borehole due to a well working drilling respectively borehole cleaning. It should be noted,
however, that the occurring suffosion led to a high amount of unevenly distributed small to
big cavities next to the vertical boreholes as well.
In addition, the excavated vertical borehole of setup 2 (S) with an installed filter pipe as
normally is used for different water observation stand pipes purposes exhibited particularly
large cavities and an irregular filling of filter sand along the filter pipe, see Figure 95.
After lifting up the drill sting and the removal of filter sand by hand, a visible share of
filter sand stuck on the achieved cavities due increased moisture of soil by acting flushing
water. Furthermore, the process of filter sand insertion leads to disjointed sections of filter
sand by generated soil plugs vertical to the borehole wall, see the arrows in Figure 95.
This is once again attributable to up and downward movements of the casing/ pipe during
filter sand insertion. Further figures are shown in Appendix D2.
8.1.3 Setup 3 (OD)
The third drill setup (OD) indicates the lowest overall average ROP of 0.9 m/min and only
slightly differences between each single borehole. This parameter is related to the highest
values of down-thrust per borehole as well as to an overall average of down-thrust with
8.3 kN. Comparable to the other setups the third inclined borehole of setup 3 (OD) shows
the lowest average ROP (0.8 m/min) and down-thrust (6.9 kN). Also vertical boreholes of
setup 3 (OD) indicate similar average values of ROP in connection with slightly variation
in applied down-thrusts. Single diagrams can be found in Appendix B1. Unlike previous
analysed drill setups, no values could be monitored for setup 3 (OD) in terms of flow rate.
The measurement device was not available at that time. This fact is attributable to the
absence of a continuously water flow during drilling. Consequently, correlations between
these values and previous mentioned values of ROP and down-thrust were not possible.
By analysing the existing parameters it becomes apparent that the lowest average values of
ROP in connection with the highest values of down-thrust are attributable to the absence of
water during drilling, the influence of friction as well as to the process of a gradual drilling
with casing and pilot bit.

8 Discussion
109
Applied down-thrust forces during drilling cause friction and visible stress marks at soil
adjacent to the casing rods/- casing bit, see Figure 96. Probably Setup 1 (W) and
setup 2 (S), on the other hand, indicate a reduced degree of friction because of a lubricating
effect by discharged water from the drill bit to adjacent soil. Referring to drill protocols
and on-site observations all boreholes of setup 3 (OD) show a very small proportion on
loosen soil formations without noticeable cavities adjacent to the drill pipes. The radius of
influence can be specified within a range of 5 to 7 cm. In context with the inclined
borehole it becomes apparent that the high effort to clean the borehole bottom is connected
with the lowest average value of down-thrust. According to remarks in the associated drill
protocol, large quantities of water were used to flush out cuttings within the casing pipe
after certain drill intervals. This is once again attributable to bigger drill cuttings
respectively an insufficient upflow velocity of the flushing medium.
The excavated vertical borehole of setup 3 (OD) with an installed filter pipe as
implemented in context with setup 2 (S) exhibited no noticeable cavities and a less notable
irregular filling of filter sand along the filter pipe, see jointed Figure 96. After lifting up the
drill sting a removal of filter sand by hand was not necessary and only small share of filter
sand stuck on the soil adjacent to the casing pipes. Hence, only the natural moisture of the
soil was present without additional flushing water.
Figure 96: Example of borehole details of setup 3 (OD): inclined borehole (left hand side) and influence by installation of a filter pipe in a vertical borehole (right hand side).

8 Discussion
110
Furthermore, the process of filter sand insertion appears to be softer to the adjacent soil
respectively due to not influenced soil during drilling only a slightly admixtures of soil is
visible at the end of the filter pipe. Generally, it is clearly visibly that the filter installation
worked very well in context with setup 3 (OD) due to evenly disturbed filter sand along
and above the filter pipe having a constant diameter, Figure 96. It seems to be obvious that
the process of filter pipe installation and filter sand insertion without previously acting
flushing water has less negative effects on the quality of water observation standpipes.
Further figures are shown in Appendix D3.
8.2 Weight Sounding (WST) and Grain-size Distribution
In contrast to MWD information, results of implemented weight soundings (WST) on-site
respectively grain-size distribution analyses are only available in connection with drillings
in Test Field I.
8.2.1 Setup 1 (W)
The evaluation of calculated weight sounding results in term of average soil resistance
values over a depth of 3 m for different distances to each borehole drilled with setup 1 (W)
shows an increasing average resistance with increasing distance to the borehole axis.
That, in turn, indicates a decreasing influence of the drilling process with increasing
distance to the borehole. The calculated average soil resistance values for a distance of
0.20 m (80.7 ht/0.20 m) and 0.50 m (106.8 ht/0.20 m) next to the first vertical borehole of
setup 1 (W) indicate an increase in average resistance of 24.4 % over a distance of 0.30 m.
The second vertical borehole shows a comparable WST value of 88.7 ht/0.20 m.
In contrast to both vertical boreholes, the average soil resistance in a distance of 0.35 m to
the inclined borehole of setup 1 (W) indicates a value of 130.0 ht/0.20 m, which is higher
than the initial value of 125.7 ht/0.20 m (F1, before drilling). Results are shown in
Appendix B3 to B5. The comparatively high mean value of WST besides the inclined
borehole of setup 1 (W) confirms the assumptions of already analysed MWD parameters
and eye observations. This weight sounding were carried out parallel and below to the
inclined borehole axis. Thus, the lower proportion of soil disturbance by acting water
below the surface of the inclined drill pipe initiated no relevant negative effects on the
average soil resistance.

8 Discussion
111
In fact, it is highly probable that the decrease of grain-sizes between 1.0 and 0.063 mm
caused the slight improvement of average soil resistance due to the fill of small voids by
washed away fine particles.
A zone of influence for each drill setup could be calculated on the basis of overall
percentage difference in soil resistance between average WST values for certain distances
and the value of F1. Hence, setup 1 (W) indicates a limited sphere of influence to 0.49 m
around the borehole axis in the soil structure of Test Field I. Furthermore, analysis of the
results of grain-size distribution tests on samples taken after drilling beside of each
borehole allow conclusions regarding the change in grain-size distribution by suffosion.
Referring to figures in Appendix C1, grain-size distribution curves for each borehole
drilled with setup 1 (W) as well as the overall average distribution curve of setup 1 (W) lie
below the initial gradation curve of sample 1 (before drilling). Thus, a percentage
reduction of passing fine particles is visible. That, in turn, indicates a reduced part of soil
particles with a low/ fine diameter retained during sieving analyses. Grain-size distribution
analysis of the third inclined borehole of setup 1 (W) shows a major difference in curve
shape compared to the curve of sample 1 due to the lowest amount of retained fine
particles. Nevertheless, the shape of the overall average distribution curve of setup 1 (W) is
comparable to the curve of sample 1.
In addition, percentage differences in sieve retaining of soil in relation to each drill setup
were estimated, as presented in subsection 7.1.3 and Appendix C1. The rearrangement and
sedimentation of fine soil contents (suffosion) by acting water flow of setup 1 (W) affects
the grain-size range between 1.0 and 0.063 mm, identifiable by negative values of
percentage difference in sieve retaining. The reduced amount of sieve retaining for a mesh
size of 11.2 mm (- 1.0 %) in connection with an increased proportion of 2.0 mm (+ 1.3) is
attributable to the drilling/ crushing process of setup 1 (W). A significant proportional
increase of grains with a size of 20 and 5.6 mm is once again attributable to crushing of
existing large rock fragments/ boulders up to 100 mm. Furthermore, the destabilisation of
the soil structure, as a result of suffosion and acing flushing water, in combination with
vibration due to the reaction between the DTH hammer and the drill bit may cause
rearrangements of coarse grain-sizes towards the borehole. Finally, it should be mentioned
that already the reduced drilling diameter to 43 mm, which is 62.6 % lower than the outer
diameter of the casing bit of setup 2 (S) and setup 3 (OD) minimise the risk of soil
disturbance adjacent to the borehole.

8 Discussion
112
8.2.2 Setup 2 (S)
In the surroundings of setup 2 (S), however, the average soil resistance over a depth of 3 m
increase to a significant lower extent compared to setup 1 (W) with increasing distance
from the borehole axis. Thus, setup 2 (S) indicates a considerable higher zone of
influenced soil through the drilling process and a slower reduction of the sphere of
influence with increasing distance to the borehole. The calculated average soil resistance
values from soundings for a distance of 0.20 m (52.5 ht/0.20 m) and 0.50 m
(68.8 ht/0.20 m) next to the first vertical borehole of setup 2 (S) indicate an increase in
average resistance of 23.7 % over a distance of 0.30 m. Despite this small percentage
increase in average resistance per 0.30 m, a significant reduction in average soil resistance
of 34.9 % for a distance of 0.20 m and 35.6 % for a distance of 0.50 m could be determined
in comparison with setup 1 (W). The second vertical borehole shows an average WST
value of 73.6 ht/0.20 m, measured and calculated in a distance of 0.35 m to the borehole
axis. This value is 16.7 % lower than the value for the second borehole of setup 1 (W). The
average WST of 117.9 ht/0.20 m in connection to the third inclined borehole of setup 2 (S)
indicates only a 6.0 % reduction of average soil resistance compared to the initial average
WST value of F1. Details are shown in Appendix B3 to B5. The high mean value of WST
besides the tilted borehole of setup 2 (S), as previously indicated in context with
setup 1 (W), is attributable to natural behaviour of water flow which takes the path of least
soil resistance above the pipe wall. Nevertheless, the slightly reduced average WST value
is connected to the lowest monitored average ROP and highest average flow rate of
setup 2 (S) and visible unevenly and large radius of soil disturbance. Thus, it becomes
apparent that soil structure is more affected below the pipe wall due to acting flushing
water in comparison with setup 1 (W). Furthermore, it should be mentioned that in
comparison with other drillings and drill setups only the both average WST values besides
vertical drilling of setup 2 (S) indicate a lower soil density “dense”.
In addition, setup 2 (S) indicates a calculated zone of influence by drilling of 0.72 m
around the borehole axis, which is an increase of 31.9 % compared with setup 1 (W).
Based on analysis of the results of grain-size distribution tests the average distribution
curve of setup 2 (S) as well as the average single curves per borehole lie below the initial
gradation curve of sample 1 with an reduced distance compared to setup 1 (W).

8 Discussion
113
The visible percentage reduction of fine particles becomes particularly obvious at the third
inclined borehole of setup 2 (S). In reverse, a reduced part of soil particles with low/ fine
diameters retained during sieving is visible which, in turn, is attributable to acting
suffosion during drillings.
Referring to presented figures in Appendix C1, the percentage differences in sieve result
retaining of soil in connection to the undisturbed gradation curve of sample 1 shows that
the soil is affected by the drilling process of setup 2 (S). The rearrangement and wash out
of fines affects the grain-size distribution and especially the range between coarse sand
(1.0 – 2.0 mm) and the content of fines (0.063 mm). A comparable high average
percentage difference in sieve retaining (+ 2.6 %) on mesh size 1 mm is attributable to
filter sand residuals as a result of the filter pipe installation in the first borehole of
setup 2 (S). Particularly obvious is a significant proportional increase of grains with a size
of 31.5 and 20 mm compared to sample 1 respectively values of setup 1 (W). This is once
again attributable to crushing of existing large stones up 100 mm in the soil as well as
rearrangement of the soil structure towards the borehole. Normally more excessive
vibrations of the drill string, by reactions between the drill bit and drill pipes,
in combination with flushing water and a larger drilling diameter cause more soil
disturbance, leading to a higher permeability and increased influenced zone compared to
setup 1 (W).
8 Discussion
114
8.2.3 Setup 3 (OD)
Drillings with the third drill setup, OD, also cause an increased average soil resistance over
a depth of 3 m with an increased distance from the borehole axis. However, it becomes
apparent that even the average WST value in a distance of 0.2 m to the first vertical
borehole of setup 3 (OD) is significantly higher (38.5 %) compared to drillings with
setup 2 (S) and slightly increased (5.4 %) related to setup 1 (W). Generally, calculated
average WST values for a distance of 0.20 m (85.3 ht/0.20 m) and 0.50 m
(116.3 ht/0.20 m) next to the first vertical borehole of setup 3 (OD) indicate an increase in
average resistance of 26.7 % over a distance of 0.30 m. The second vertical borehole
shows an average WST value of 99.8 ht/0.20 m in a distance of 0.35 m to the borehole
axis. This value is 11.4 % higher than setup 1 (W) and increased by 26.3 % compared with
setup 2 (S) in relation to each second vertical borehole.
The average WST of 84.8 ht/0.20 m in connection to the third inclined borehole of
setup 3 (OD) indicates, however, the highest reduction (32.5 %) of average soil resistance
compared to the initial average WST value of F1. Details are shown in Appendix B3 to B5.
The described high average WST values in connection with both vertical boreholes of
setup 3 (OD), which in turn means that soil adjacent to the borehole is considerably less
influenced by suffosion, is attributable to the absence of an continuously water flow during
drilling and an efficient handling of the casing. The not expected low value of average
WST besides the inclined borehole of setup 3 (OD) is attributable to comparatively high
values of down-thrust and the effect of a vibrating and rotating casing. Thus, the larger
stones within the soil are ripped during the feeding operation of the casing/- casing bit and
deposited elsewhere. During this process, fine (1 mm) to very fine (0.063 mm) grain-sizes
are moving due to acting vibrations towards the casing wall and refill the created empty
spaces. As a result these soil particles are missing within the grain-size distribution in the
area of the implemented weight sounding. Hence, it can be assumed that the porosity has
increased, whereby the decreased average value of WST over a depth of 3 m could be
determined. Nevertheless, the density index “very dense” for all average WST values in
connection with setup 3 (OD) could be derived, as previously determined for setup 1 (W).

8 Discussion
115
Setup 3 (OD) exhibits exact the same zone of influence by drilling of 0.49 m as
setup 1 (W) around the borehole axis. Based on analysis of the results of grain-size
distribution tests the average distribution curve of setup 3 (OD) as well as the average
single curves per borehole lie above the initial gradation curve of sample 1.
This calculated percentage increase of passing fine particle becomes particularly obvious at
both vertical boreholes of setup 3 (OD). The increased part of soil particles with low to
fine sizes retained during sieving is visible which, in turn, is attributable to the previously
described assumption of particle movement towards the casing wall and the refill of small
cavities. On the other hand, the drill process with the casing bit in combination with high
values of down-thrust acts rather like a grinding and displacement process. Thus, fine
cuttings are pressed into directly adjacent soil. Both possible effects in turn influence the
grain-size distribution of analysed samples next to each borehole of setup 3 (OD).
In this connection, a rearrangement of fine to very fine soil contents is visible due to
percentage differences in sieve retaining of soil in connection to the undisturbed gradation
curve of sample 1.
Unlike setup 1 (W) and setup 2 (S), a considerably high positive difference in sieve results
is visible in the mesh size range of 1 to 0.063 mm, which supports previously discussed
assumptions. Furthermore, it can be assumed that the percentage difference in sieve
retaining (+ 1.8 %) on mesh size 1 mm is influenced by filter sand residuals as a result of
the filter pipe installation at the first borehole of setup 3 (OD). The part of filter sand,
however, is considered to be very low. A relatively low percentage difference in sieve
retaining of grain-sizes in the mesh size rage of 31.5 to 20 mm is due to the fact of less
destabilised soil without cavities adjacent to the borehole. Generally it should be
mentioned that the grain-size distribution of the used soil in Test Field 1 can be influenced
by the construction and compacting process as well as by natural variations due to the
mining process and therefore some spread in content is expected. Furthermore, the
significance of laboratory results of sample 1 (before drilling) is limited because only one
sample was taken from one spot in the middle of the constructed embankment.
The comparatively high percentage difference of accumulated weight of particles in the
mesh size range from 11.2 to 5.6 mm compared to sample 1 might be attributable to a
general change in soil gradation within this drilling area.
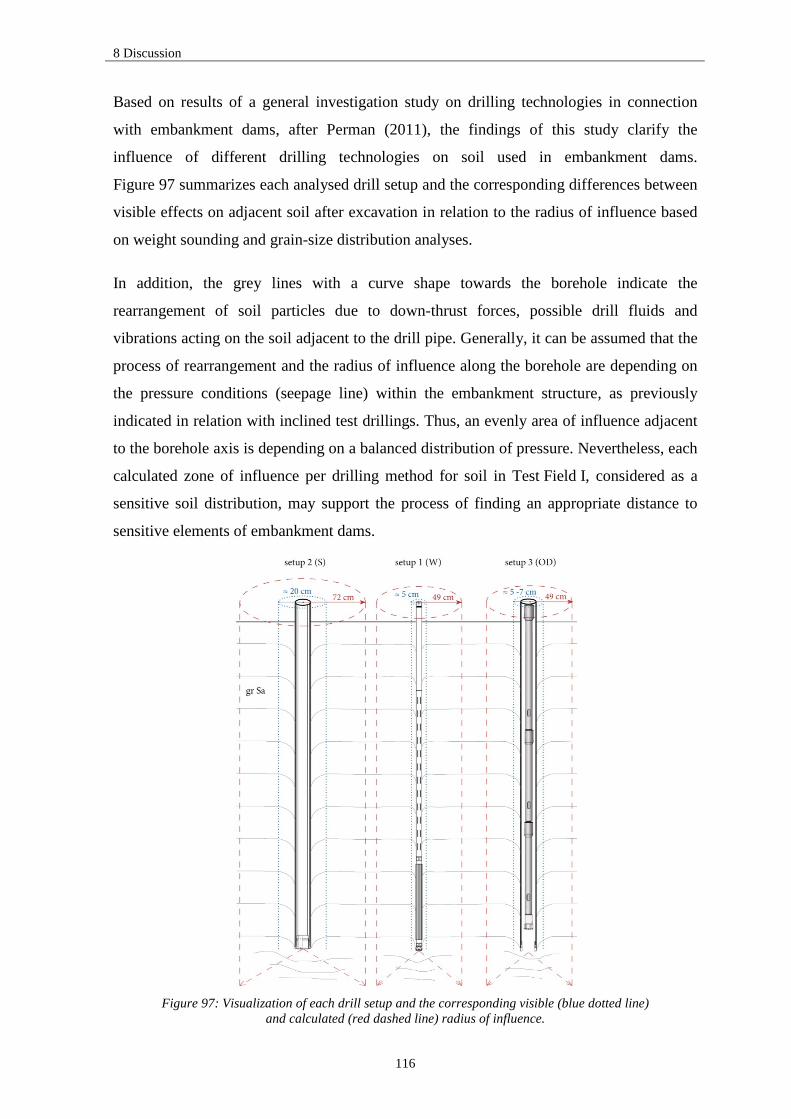
8 Discussion
116
Based on results of a general investigation study on drilling technologies in connection
with embankment dams, after Perman (2011), the findings of this study clarify the
influence of different drilling technologies on soil used in embankment dams.
Figure 97 summarizes each analysed drill setup and the corresponding differences between
visible effects on adjacent soil after excavation in relation to the radius of influence based
on weight sounding and grain-size distribution analyses.
In addition, the grey lines with a curve shape towards the borehole indicate the
rearrangement of soil particles due to down-thrust forces, possible drill fluids and
vibrations acting on the soil adjacent to the drill pipe. Generally, it can be assumed that the
process of rearrangement and the radius of influence along the borehole are depending on
the pressure conditions (seepage line) within the embankment structure, as previously
indicated in relation with inclined test drillings. Thus, an evenly area of influence adjacent
to the borehole axis is depending on a balanced distribution of pressure. Nevertheless, each
calculated zone of influence per drilling method for soil in Test Field I, considered as a
sensitive soil distribution, may support the process of finding an appropriate distance to
sensitive elements of embankment dams.
Figure 97: Visualization of each drill setup and the corresponding visible (blue dotted line)
and calculated (red dashed line) radius of influence.

9 Conclusion
117
9 Conclusion
The aim of this study was to analyse the impact of three types of drilling methods and their
corresponding setups on soil. The methods/setups were: water powered DTH hammer
(setup 1), top hammer with a casing drilling system (setup 2) as well as a top hammer with
a pre-drilling protective casing (setup 3). Drilling was carried out in a 3 m high
embankment consisting of compacted gravelly sand. Complementing to this study,
recorded information of drilling one 30 m deep borehole with setup 1 in a tailings dam in
Malmberget, Sweden, was evaluated. The main conclusions from this research project are
summarised below.
The analysis of average values of soil resistance indicates an average radius of influence
from the borehole per drill setup of 0.49 m in connection with setup 1 and setup 3 and of
0.72 m for setup 2. There is a clear distinction between the estimated zones of soil
disturbance observed (by eye) on-site and the larger calculated radius of influence.
The existing radius of soil disturbance for setup 3 is, despite the use of a protective casing
in order to prevent a hydraulic connection to adjacent soil, attributable to the highest values
of down-thrust and casing vibration. Laboratory analyses show that setup 3 registers the
highest loss of larger particles and an increased proportion of low to fine grain-sizes.
Setup 1 and setup 2 show an opposite trend in a comparable pattern.
Setup 1 exhibits performance advantages in terms of highest average penetration rates in
connection with lowest values of down-thrust and lower flow rates. The drilling with
setup 1 in the tailings dam shows an improved performance as a result of apparently well-
coordinated values of down-thrust. The water powered DTH hammer offers significant
advantages compared with top hammer setups: controlled and environmental friendly
drillings with reduced complexity in combination with highest penetration rates in soft and
hard formations reduced the total drilling time and provide financial advantages.
In summary, the rearrangement of soil particles and the radius of influence along the
borehole are, respectively, dependant on the interaction between applied down-thrust, the
vibration of the drill string, the amount of drained flushing water towards the adjacent soil
and existing pressure conditions within the embankment structure. Apart from differences
in drilling technologies it is obvious that education, experience and the reliability of the
drilling operator as well as knowledge concerning the subsurface significantly affect
borehole safety and the resulting influence on geotechnical structures.

10 Recommended Future Studies
118
10 Recommended Future Studies
A continuous evaluation of existing drilling requirements and further development of
existing drilling technologies is an important safety aspect in connection with drilling
applications in sensitive geotechnical structures. An extract of possible and recommended
future studies are listed below.
Drilling investigations in other soil types e.g. moraine respectively formations with
different water contents.
Drilling in a laboratory scale in correlation with theoretical simulations
(finite element method).
Measurement of the existing water pressure around the drill bit.
Further investigations of the effect of applied down-thrust forces.
Use of CFD (computational fluid dynamics) software for analysing the fluid flow in
connection with different drill bits.
Further development of drill bit designs.
Using geotechnical or geophysical methods to detect structural changes in the soil
profile around the borehole.

References
119
References
ASTM D 2167-94, 2001. Standard Test Method for Density and Unit Weight of Soil in Place by the Rubber Balloon Method. West Conshohocken, United States of America: American Society for Testing and Materials (ASTM).
ATLAS COPCO, 2008. Figure and information on symmetrix drilling principle. Örebro, Sweden: Atlas Copco Rock Drills AB.
ATLAS COPCO ROCK DRILLS AB, 2008. Production Drilling in Underground. 5, 198, pp. 32.
BARDET, J.P., 1997. Experimental Soil Mechanics. Los Angeles, USA: Civil Engineering Department of University of Southern California.
BENCKERT, A. and EURENIUS, J., 2001. Tailings dam constructions, EUROPEAN COMMISSION, DIRECTORATE A, SUSTAINABLE DEVELOPMENT AND POLICY SUPPORT, ed. In: Seminar on safe tailings dam construction, 20.-21./09/ 2001, European Commission, Directorate A, Sustainable Development and Policy Support, pp. 30-36.
BERGHE, J.F.V., BALLARD, J., PIRSON, M. and REH, U., 2011. Risks of Tailings Dams Failure, 3rd International Symposium on Geotechnical Risk and Safety (ISGSR), 2.-3./06/ 2011, Bundesanstalt für Wasserbau, pp. 209-216.
BETTZIECHE, V., 2008. Empfehlungen für die Ausstattung von Staumauern und Staudämmen - Einführung in die Kapitel 6 und 7 des Merkblatts DWA-M 514. Hennef, 2008: DWA - German Association for Water, Wastewater and Waste.
BJELKEVIK, A., 2005a. Stability of tailings dams: focus on water cover closure, Luleå University of Technology.
BJELKEVIK, A., 2005b. Water cover closure design for tailings dams. Luleå, Sweden: Luleå University of Technology.
BOART LONGYEAR, 2012. Information and figures on overburden drilling equipment. Utah, United States of America: Boart Longyear.
BRÄNNSTRÖM, D., 2012. Site plans and photos of LKAB's tailings impoundment in Malmberget. Malmberget, Sweden.
BRUCE, D.A., 2002. The Basics of Drilling for Specialty Geotechnical Construction Processes. Geotechnical Special Publication, 1, pp. 752-771.
CORCORAN, P., 2009. In The Hole (ITH) vs. Top Hammer Drilling in Underground Applications. Brisbane, Australia.
DASENBROCK, D., 2010. Automated Landslide and Instrumentation Programs on US Route 2. (58th Annual Geotechnical Engineering Conference), pp. 165-185.
DESSUREAULT, S., 2003. Rock Excavation. Tucson, United States of America: The University of Arizona, Department of Mining and Geological Engineering.
DHI WATER ENVIRONMENT HEALTH, 2007. Classification of mining waste facilities. Final Report edn. European Commission, DG Environment.

References
120
DWA-M 514, 2011. Bauwerksüberwachung an Talsperren. Germany, Hennef.
ENVIRONMENTAL PROTECTION AGENCY, 1994. Technical Report: Design and evaluation of tailings dams. EPA 530-R-94-038. Washington, D.C.: U.S. Environmental Protection Agency, Office of Solid Waste.
EUROPEAN COMMISSION, 2004. Reference document on best available techniques for management of tailings and waste-rock in mining activities. Reference Document edn. Seville, Spain: European Commission,Institute for Prospective Technological Studies (IPTS).
FEMA, 2011. Filters for Embankment Dams. FEMA Federal Emergency Management Agency.
FRANC, J. and MICHEL, J., 2005. Fundamentals of Cavitation. United States of America: Springer Science + Business Media, Inc.
GEOMEK, 2012. Information on the GM 75 GT drilling rig and logging parameters. Stockholm, Sweden: Geomek - Stockholms Geomekaniska AB.
GUI, M.W. and HAMELIN, J.P., 2004. Development of an instrumented borehole drilling system for ground investigation. Electronic Journal of Geotechnical Engineering, 9.
HALCO, 2012. A-Z of Drilling. Halifax, Great Britain: Halco Rock Tools Limited.
Huber N.P., 2008. Probabilistische Modellierung von Versagensprozessen bei Staudämmen [dissertation]. Universitätsbibliothek RWTH Aachen; 2008.
ICOLD, 1998. ICOLD's World Register of Dams. Paris, France: ICOLD - International Commission on Large Dams.
JANTZER, I., 2009. Critical Hydraulic Gradients in Tailings Dams - Comparison to Natural Analogies, Luleå University of Technology.
KAHRAMAN, S., BILGIN, N. and FERIDUNOGLU, C., 2003. Dominant rock properties affecting the penetration rate of percussive drills. 40 (International Journal of Rock Mechanics & Mining Sciences), pp. 711-723.
KARLSSON, R. and HANSBO, S., 1984. Jordarternas indelning och benämning. Stockholm, Sweden: Svenska geotekniska föreningen (SGF).
KJÆRNSLI, B., VALSTAD, T. and HÖEG, K., 2003. Rockfill Dams - Design and Construction. Trondheim, Norway: The Norwegian University of Science and Technology, Department of Hydraulic and Environmental Engineering.
MEASURAND, 2012. Product information on the shape accelerator array. Fredericton, Canada: Measurand Inc..
MSHA, 2009. Engineering and Design Manual - Coal Refuse Disposal Facilities. 2 edn. Pittsburgh, U.S.: MSHA - U.S. Department of Labor Mine Safety and Health Administration.
NARITA, K., 2000. Design and construction of embankment dams. Dept.of Civil Eng., Aichi Institute of Technology, , pp. 18.
NORDELL, B., FJÄLLSTRÖM, K. and ÖDERYD, L., 1998. Water driven down-the-hole well drilling equipment for hard rock. 1 (Underground Thermal Storage and Utilization).

References
121
PERMAN, M., 2011. Borr- och arbetsmetoder vid instrumentering av fyllningsdammar. Luleå, Sweden: Luleå University of Technology.
QUIÑONES-ROZO, C., 2010. Lugeon Test Interpretation, Revisited, Collaborative Management of Integrated Watersheds, 30th Annual USSD Conference, 12.-16. 2010405 2010, United States Society on Dams, pp. 405-1434.
RABIA, H., 1985. A unified prediction model for percussive and rotary drilling. Mining Science and Technology, 2(3), pp. 207-216.
RIDAS, 2012. Kraftföretagens riktlinjer för dammsäkerhet (Hydropower Industry Dam Safety Guidelines), Avsnitt 7.2 - Fyllningsdammar Tillämpningsvägledning (Embankment Dams Application Guide). Sweden: SVENSK ENERGI – Swedenergy AB.
Riechers J., 2010. Innovatives hydraulisches Bohrverfahren für die oberflächennahe Geothermie als Alternative zum pneumatischen Bohrstandard. Bochum, Germany.
ROLLINS, K., GERBER, T., CUMMINS, C. and HERBST, M., 2009. Monitoring Displacement vs. Depth in Lateral Pile Load Tests with Shape Accelerometer Arrays. Proceedings of the 17th International Conference on Soil Mechanics and Geotechnical Engineering (ICSMGE 2009), (Proceedings of the 17th International Conference on Soil Mechanics and Geotechnical Engineering (ICSMGE 2009) Pages: 4), pp. 4.
SMOLTCZYK, U., 2003. Geotechnical Engineering Handbook. Böblingen, Germany: Ernst & Sohn.
STARK, T.D. and CHOI, H., 2008. Slope inclinometers for landslides. 5, 3 (Landslides - Journal of the International Consortium on Landslides).
STEPHENS, T., 2010. Manual on small earth dams - A guide for siting, design and construction. Rome, Italy: Food and Agriculture Organization of the United Nations.
SWEDISH NATIONAL GRID, 2011. Dammsäkerhetsutveckling i Sverige år 2011. Sundbyberg, Sweden: Swedish National Grid (Svenska Kraftnät).
U.S. ARMY CORPS OF ENGINEERS, 2006. Procedures for Drilling in Earth Embankments (ER 1110-1-1807). Washington DC, United States of America: U.S. Army Corps of Engineers.
U.S. ARMY CORPS OF ENGINEERS, 1995. Instrumentation of Embankment Dams and Levees (EM 1110-2-1908). Washington DC, United States of America: U.S. Army Corps of Engineers.
VICK, S.G., 1990. Planning, Design, and Analysis of Tailings Dams. Vancouver, Canada: BiTech Publishers Ltd.
WASSARA AB, 2012a. Construction drawings and figures. Stockholm, Sweden.
WASSARA AB, 2012b. General product information of Wassara's water driven percussion DTH hammers and accessories. Stockholm, Sweden.
WASSARA AB, 2012c. Personal communication/ meeting notes, April to July. Stockholm, Sweden.
ZABLOCKI, A., 2006. Desarrollo de la perforadoras súper rápidas y su influencia sobre la productividad de perforación. Santiago, Chile: International Conference on Mining Innovation.
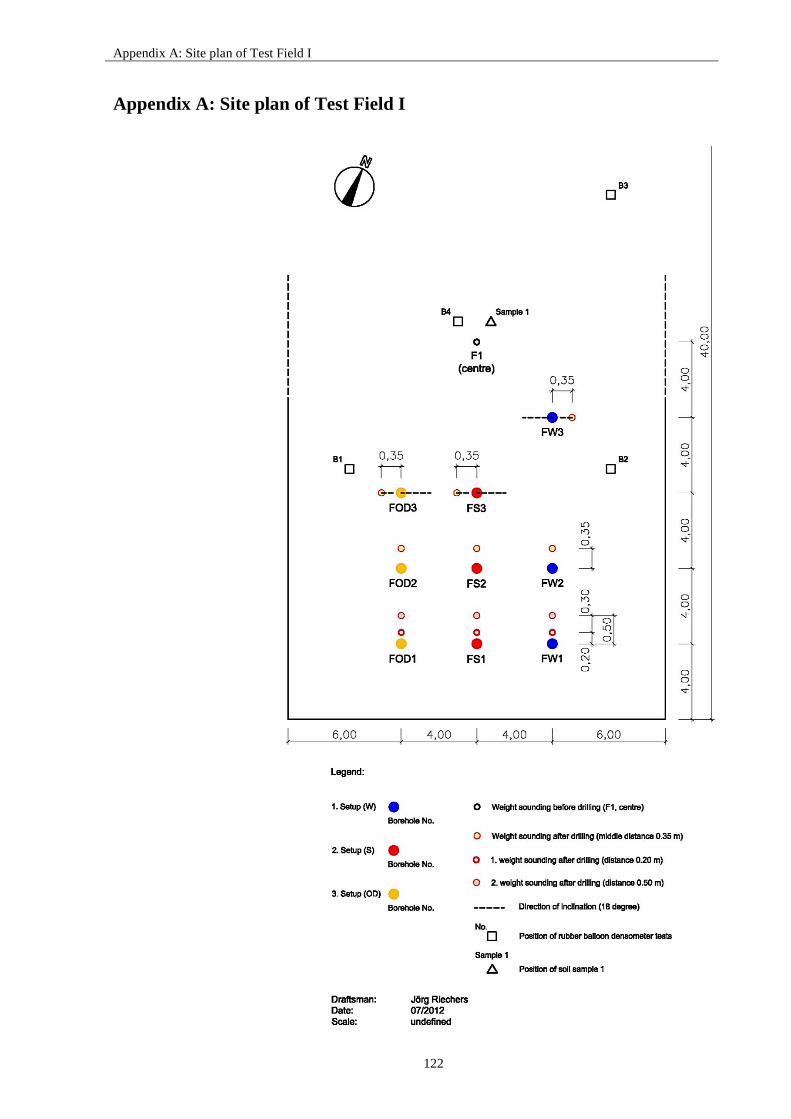
Appendix A: Site plan of Test Field I
122
Appendix A: Site plan of Test Field I

Appendix B: Drilling and Measured Parameters
123
Appendix B: Drilling and Measured Parameters
Appendix B1 Test Field I, comparison of MWD parameters P. 124
Appendix B2 Test Field I, process of MWD parameters P. 126
Appendix B3 MWD and WST information on setup 1 (W):
Test Field I, setup 1 (W), 1. borehole
P. 128
Test Field I, setup 1 (W), 2. borehole P. 129
Test Field I, setup 1 (W), 3. borehole, inclination of 18° P. 129
Appendix B4 MWD and WST information on setup 2 (S):
Test Field I, setup 2 (S), 1. borehole
P. 130
Test Field I, setup 2 (S), 2. borehole P. 131
Test Field I, setup 2 (S), 3. borehole, inclination of 18° P. 131
Appendix B5 MWD and WST information on setup 3 (OD):
Test Field I, setup 3 (OD), 1. borehole
P. 132
Test Field I, setup 3 (OD), 2. borehole P. 133
Test Field I, setup 3 (OD), 3. borehole, inclination of 18° P. 133
Appendix B6 MWD of Test Field II and comparison with Test Field I:
Test Field II, setup 1 (W), borehole DH1
P. 134
Test Field II, setup 1 (W), borehole DH1, process of MW parameters
P. 135

Appendix B: Drilling and Measured Parameters
124
Appendix B1: Test Field I, comparison of MWD parameters
Average: Rate of penetration (ROP) per borehole [m/min] Overall average: Rate of penetration (ROP) per setup [m/min]
Average: Down-thrust per borehole [kN] Overall average: Down-thrust per setup [kN]
Average: Revolution per minute (RPM) per borehole [1/min] Overall average: Revolution per minute (RPM) per setup [1/min]

Appendix B: Drilling and Measured Parameters
125
Average: Flow rate per borehole [l/min] Overall average: Flow rate per setup [l/min]

Appendix B: Drilling and Measured Parameters
126
Appendix B2: Test Field I, process of MWD parameters
Overall average: Rate of penetration (ROP) per setup [mm/min]
Overall average: Down-thrust per setup [kN]
Overall average: Revolution per minute (RPM) per setup [1/min]

Appendix B: Drilling and Measured Parameters
127
Overall average: Flow rate per setup [l/min]

Appendix B: Drilling and Measured Parameters
128
Appendix B3: Test Field I, setup 1 (W), 1. borehole
MWD information
1. weight sounding after drilling (distance 0.20 m) 2. weight sounding after drilling (distance 0.50 m)
Weight sounding: Average soil resistance over a depth of 3 m.
Weight sounding: Average soil resistance with averaged WST values.

Appendix B: Drilling and Measured Parameters
129
Appendix B3: Test Field I, setup 1 (W), 2. borehole
MWD information
Weight sounding after drilling (middle distance 0.35 m) Weight sounding: Average soil resistance over a depth of 3 m.
Appendix B3: Test Field I, setup 1 (W), 3. borehole, inclination of 18°
MWD information
Weight sounding after drilling (middle distance 0.35 m) Weight sounding: Average soil resistance over a depth of 3 m.

Appendix B: Drilling and Measured Parameters
130
Appendix B4: Test Field I, setup 2 (S), 1. borehole
MWD information
1. weight sounding after drilling (distance 0.20 m) 2. weight sounding after drilling (distance 0.50 m)
Weight sounding: Average soil resistance over a depth of 3 m.
Weight sounding: Average soil resistance with averaged WST values.

Appendix B: Drilling and Measured Parameters
131
Appendix B4: Test Field I, setup 2 (S), 2. borehole
MWD information
Weight sounding after drilling (middle distance 0.35 m) Weight sounding: Average soil resistance over a depth of 3 m.
Appendix B4: Test Field I, setup 2 (S), 3. borehole, inclination of 18°
MWD information
Weight sounding after drilling (middle distance 0.35 m) Weight sounding: Average soil resistance over a depth of 3 m.

Appendix B: Drilling and Measured Parameters
132
Appendix B5: Test Field I, setup 3 (OD), 1. borehole
MWD information
1. weight sounding after drilling (distance 0.20 m) 2. weight sounding after drilling (distance 0.50 m)
Weight sounding: Average soil resistance over a depth of 3 m.
Weight sounding: Average soil resistance with averaged WST values.

Appendix B: Drilling and Measured Parameters
133
Appendix B5: Test Field I, setup 3 (OD), 2. borehole
MWD information
Weight sounding after drilling (middle distance 0.35 m) Weight sounding: Average soil resistance over a depth of 3 m.
Appendix B5: Test Field I, setup 3 (OD), 3. borehole, inclination of 18°
MWD information
Weight sounding after drilling (middle distance 0.35 m) Weight sounding: Average soil resistance over a depth of 3 m.

Appendix B: Drilling and Measured Parameters
134
Appendix B6: Test Field II, setup 1 (W), borehole DH1
MWD information
Performance comparison: DH1 vs. avg values of drilling with setup 1 (W 35) at Test Field II
Rate of penetration Down-thrust Revolution per minute Flow rate

Appendix B: Drilling and Measured Parameters
135
Appendix B6: Test Field II, setup 1 (W), borehole DH1, process of MWD parameters
Average values per meter of drilling: Rate of penetration (ROP) per setup [mm/min]
Average values per meter of drilling: Down-thrust per setup [kN]
Average values per meter of drilling: Revolution per minute (RPM) per setup [1/min]

Appendix B: Drilling and Measured Parameters
136
Average values per meter of drilling: Flow rate per setup [l/min]

Appendix C: Laboratory Analyses
137
Appendix C: Laboratory Analyses
Appendix C1: Analyses of grain-size distributions
Test Field I, setup 1 (W), 1. – 3. borehole
P. 138
Test Field I, setup 2 (S), 1. – 3. borehole P. 139
Test Field I, setup 3 (OD), 1. – 3. borehole P. 140
Appendix C2: Density, porosity and specific gravity of Test Field I P. 141

Appendix C: Laboratory Analyses
138
Appendix C1: Test Field I, setup 1 (W), 1. – 3. borehole
Average: Grain-size distribution per borehole Overall average: Grain-size distribution per setup vs. sample 1
Sieving analyses: Percentage of retaining per setup vs. sample 1
Effects on soil by drilling: ∆ percentage of retaining per setup
Average: CU per borehole; per setup vs. sample 1 Average: CC per borehole; per setup vs. sample 1
Single values: CU and CC per borehole and sample
Sample No. per borehole
Coefficient of uniformity,
CU
Coefficient of curvature, CC
W1-1 22,00 1,34 W1-2 44,80 0,91 W1-3 18,00 0,50 W2-1 38,40 0,60 W2-2 48,00 1,33 W2-3 40,00 3,60 W3-1 37,50 0,67 W3-2 45,00 0,56 W3-3 40,00 2,03
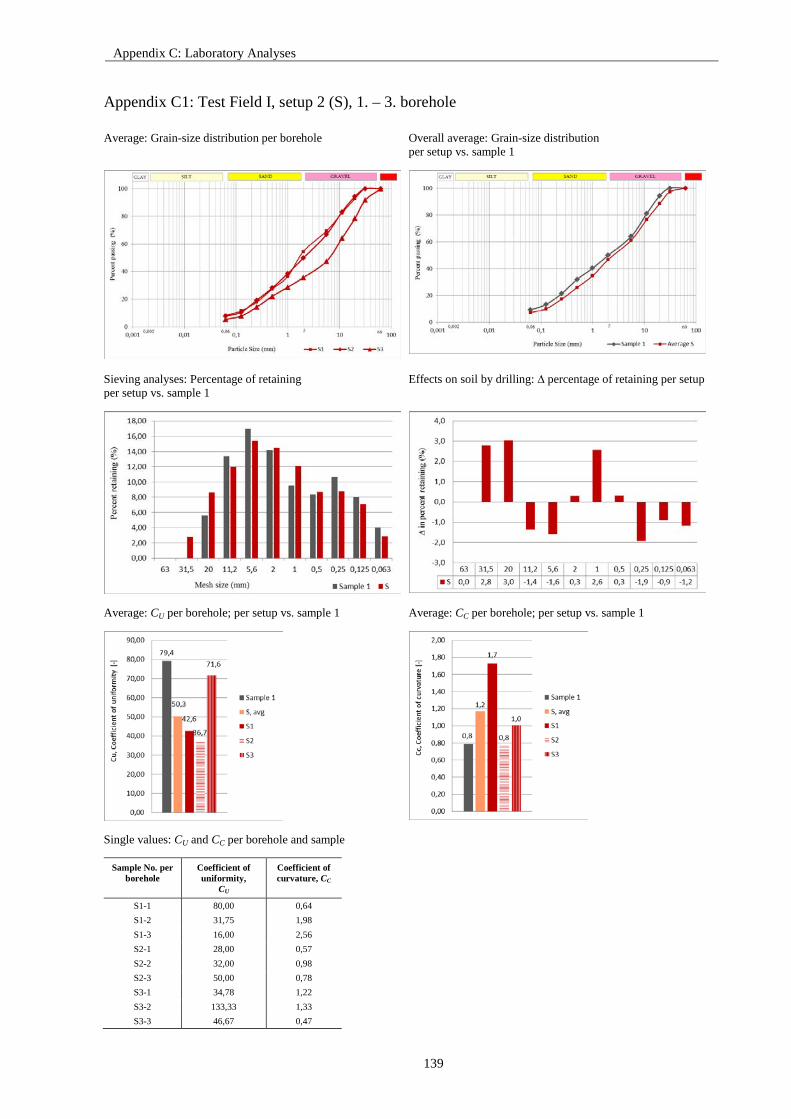
Appendix C: Laboratory Analyses
139
Appendix C1: Test Field I, setup 2 (S), 1. – 3. borehole
Average: Grain-size distribution per borehole Overall average: Grain-size distribution per setup vs. sample 1
Sieving analyses: Percentage of retaining per setup vs. sample 1
Effects on soil by drilling: ∆ percentage of retaining per setup
Average: CU per borehole; per setup vs. sample 1 Average: CC per borehole; per setup vs. sample 1
Single values: CU and CC per borehole and sample
Sample No. per borehole
Coefficient of uniformity,
CU
Coefficient of curvature, CC
S1-1 80,00 0,64 S1-2 31,75 1,98 S1-3 16,00 2,56 S2-1 28,00 0,57 S2-2 32,00 0,98 S2-3 50,00 0,78 S3-1 34,78 1,22 S3-2 133,33 1,33 S3-3 46,67 0,47
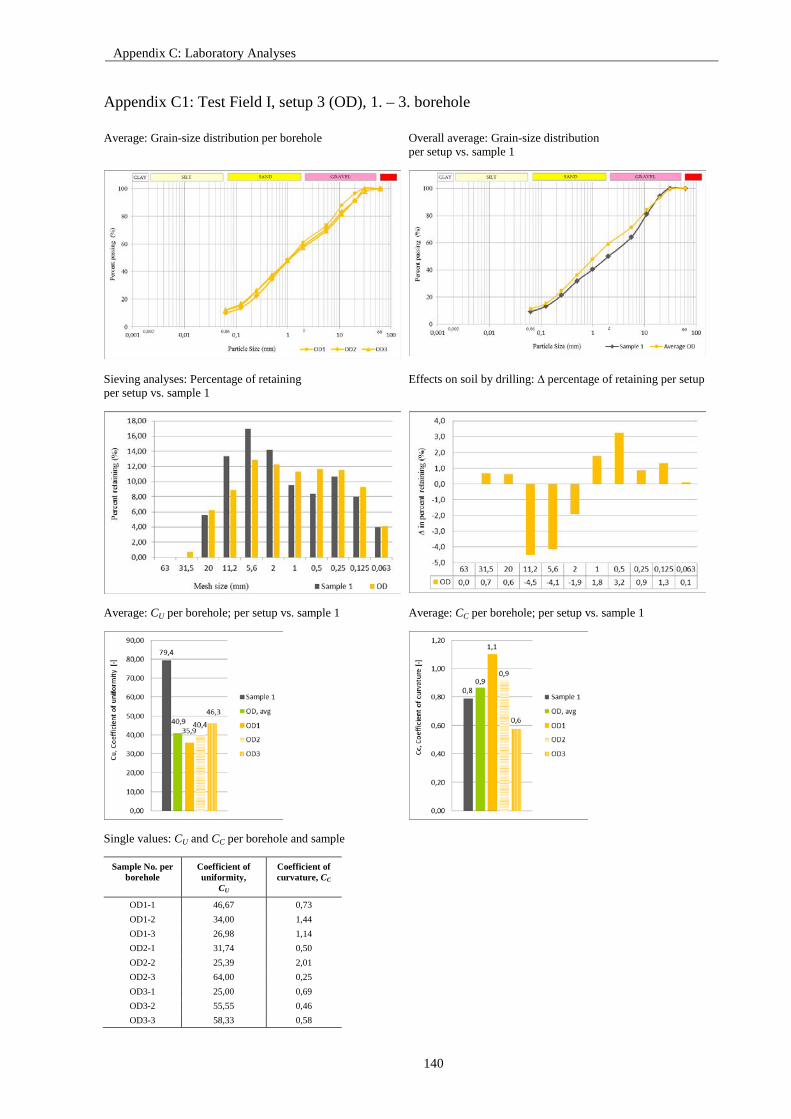
Appendix C: Laboratory Analyses
140
Appendix C1: Test Field I, setup 3 (OD), 1. – 3. borehole
Average: Grain-size distribution per borehole Overall average: Grain-size distribution per setup vs. sample 1
Sieving analyses: Percentage of retaining per setup vs. sample 1
Effects on soil by drilling: ∆ percentage of retaining per setup
Average: CU per borehole; per setup vs. sample 1 Average: CC per borehole; per setup vs. sample 1
Single values: CU and CC per borehole and sample
Sample No. per borehole
Coefficient of uniformity,
CU
Coefficient of curvature, CC
OD1-1 46,67 0,73 OD1-2 34,00 1,44 OD1-3 26,98 1,14 OD2-1 31,74 0,50 OD2-2 25,39 2,01 OD2-3 64,00 0,25 OD3-1 25,00 0,69 OD3-2 55,55 0,46 OD3-3 58,33 0,58

Appendix C: Laboratory Analyses
141
Appendix C2: Density, porosity and specific gravity of Test Field I
Sample No.
Depth [m]
WP = Mass of empty, clean pycnometer [g]
(W1)
WPS = Mass of empty pycnometer + dry soil [g] (W2)
WB = Mass of pycnometer +
dry soil + water [g]
(W3)
WA = Mass of pycnometer
+ water [g] (W4)
Specific gravity (GS) G=(W2-W1) /
[(W4-W1)-(W3-W2)] [-]
Temp. corrected Specific
Gravity of soil [-]
Average Gs [-]
Bulk Density [g/cm³]
Dry Density [g/cm³]
Porosity [%]
B1 0,3
206,5 373,24 602,31 491,43 2,985 2,985
2,978 2,013 1,979 33,53 206,5 382,42 608,11 491,43 2,970 2,970
B2 0,3
194,18 356,94 592,94 480,35 3,244 3,244
3,119 2,219 2,164 30,63 196,65 352,07 585,36 481,85 2,994 2,994
B3 0,3
194,18 350,71 584,38 480,35 2,982 2,982
2,953 2,072 2,024 31,48 196,79 378,32 601,49 482,03 2,925 2,925
B4 0,3
194,18 350,25 584,62 480,35 3,013 3,013
2,970 2,376 2,290 22,92 206,5 354,25 588,71 491,43 2,927 2,928

Appendix D: Photos
142
Appendix D: Photos
Appendix D1: Test Field I, setup 1 (W), jointed photos of borehole 1 P. 143
Appendix D2: Test Field I, setup 2 (S), jointed photos of borehole 1
with filter pipe
P. 144
Appendix D3: Test Field I, setup 3 (OD), jointed photos of borehole 1
with filter pipe
P. 145

Appendix D: Photos
143
Appendix D1: Test Field I, setup 1 (W), jointed photos of borehole 1

Appendix D: Photos
144
Appendix D2: Test Field I, setup 2 (S), jointed photos of borehole 1 with filter pipe

Appendix D: Photos
145
Appendix D3: Test Field I, setup 3 (OD), jointed photos of borehole 1 with filter pipe