Embed Size (px)
Citation preview

Massive Pulmonary Embolism - CT scan
Sehar Resad, MS4
Ashley Davidoff, MD
CT

CASE HISTORY
81 y.o. male with no significant past medical history presents after syncopal fall complicated by head strike, loss of consciousness, and multiple facial fractures. Hospital course complicated by development of bradycardia resulting in hypotension on hospital day one.
Labs:- Troponin: neg (0.031)
- ABG: pH: 7.24- pCO2: 47
- pO2: 165
- HCO3: 20.1
144 110 22
5.5 20.1 2.81103
4.215.8
48.9102

CTPA Bilateral Pulmonary Artery Emboli with Segmental & Subsegmental Extension
CTPA of the chest in the axial projection at the level of the main pulmonary artery bifurcation shows large filling defects of the right and left pulmonary arteries (yellow arrows in a) with extension into multiple segmental (blue arrows in b) and subsegmental branches (red arrows in b) bilaterally.

CTPA Iodine Density Mapping with Subsequent Ischemia
Spectral CT iodine density mapping in the axial projection at the levels of the pulmonary artery bifurcation (a) and common venous trunk (b) showing multifocal, multi-segmental and subsegmental areas of decreased iodine density (yellow asterisks) suggestive of ischemia.

CTPA/CT Massive Bilateral Pulmonary Emboli with Right Heart Failure
CTPA in the axial projection at the levels of the mid ventricles (a), hepatic veins (b), and CT at level of kidneys (c) showing signs of right heart strain as evidenced by right atrial enlargement of 5.7cm (pink line) and right ventricular enlargement of 5.3cm (orange line) with subsequent paradoxical bowing of the interventricular septum toward the left ventricle (blue arrow). Inferior vena caval contrast layering and reflux (red asterisk), contrast reflux into the hepatic veins (red arrows), and gallbladder edema (yellow arrows) further suggest right heart failure.

CT Abdomen & Pelvis Indicating Shock in Setting of Massive Bilateral Pulmonary Emboli
CT abdomen & pelvis with contrast in the axial projection at the level of the right adrenal gland (a) and left adrenal gland (b) and coronal projection (c) at the level of the adrenals showing hyperenhancement of the adrenal glands bilaterally (blue arrows) consistent with hemodynamic shock in the setting of massive pulmonary emboli.

CLINICAL FOLLOW UP
Patient was treated with systemic TPA as he was unable to tolerate catheter-directed lysis due to hemodynamic instability. His course was complicated by shock, and he rapidly deteriorated despite resuscitation, pronounced deceased on hospital day two.
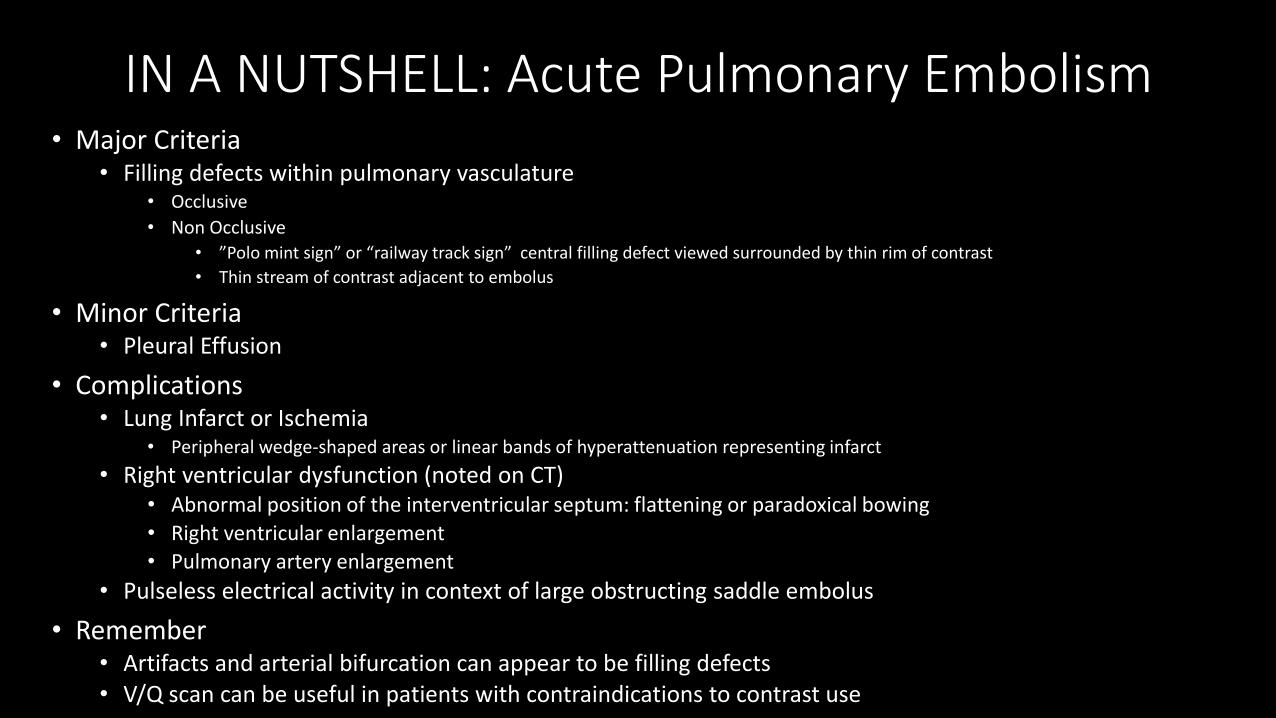
IN A NUTSHELL: Acute Pulmonary Embolism• Major Criteria
• Filling defects within pulmonary vasculature• Occlusive
• Non Occlusive• ”Polo mint sign” or “railway track sign” central filling defect viewed surrounded by thin rim of contrast
• Thin stream of contrast adjacent to embolus
• Minor Criteria • Pleural Effusion
• Complications • Lung Infarct or Ischemia
• Peripheral wedge-shaped areas or linear bands of hyperattenuation representing infarct
• Right ventricular dysfunction (noted on CT) • Abnormal position of the interventricular septum: flattening or paradoxical bowing
• Right ventricular enlargement
• Pulmonary artery enlargement
• Pulseless electrical activity in context of large obstructing saddle embolus
• Remember• Artifacts and arterial bifurcation can appear to be filling defects• V/Q scan can be useful in patients with contraindications to contrast use

IN A NUTSHELL: Pulmonary Embolism Classification Based on Position, Acuity, and
Hemodynamic Severity • Classifications
• Vessel • Saddle (main pulmonary artery)• Lobar (large branch of pulmonary artery)• Segmental • Sub segmental
• Temporal • Acute • Subacute • Chronic
• Hemodynamic • Small: low risk w/o hypotension, RV dysfunction on imaging, or elevation of biomarkers• Submassive: normal blood pressure with evidence of right ventricular dysfunction• Massive: sustained hypotension (systolic BP < 90 mmHg or requiring pressors)

OLA
In comparison to non-massive pulmonary embolism, patients with massive pulmonary embolism:
A) More often present with significant chest pain
B) Are more likely to have underlying cancer
C) Have significantly higher 90-day mortality risk
D) Are more likely to be older

90-Day Mortality in Patients with Massive Pulmonary Embolism
Courtesy of Kucher N, et al. 2006
Overall mortality (A) (log-rank P<0.001) and cardiovascular mortality (B) (log-rank P<0.001) in 108 patients with massive PE and in 2284 patients with non–massive PE.

Pathology: Pulmonary Infarction in Setting of Pulmonary Embolism
Autopsy specimen from (a & b) a patient with metastatic lung carcinoma and a hypercoaguable state complicated by PE and wedge shaped hemorrhagic pulmonary infarction (white asterisks). The clot in the vessel (b) represents subacute thrombus as the vessel remains distended and the distal end is compacted with the clot. A similar post mortem specimen of a lung (c) shows a small pulmonary embolus (yellow arrow) with resultant pulmonary infarct (white asterisk c2) in the left upper lobe.

Imaging Spectrum: Hampton’s Hump
Chest x-ray in a 64 y.o. male presenting with tachycardia and pleuritic chest pain shows a pleural based opacification of the right lung (yellow arrow) representing a wedge shaped defect, consistent with pulmonary infarction in the setting of pulmonary embolism.

Imaging Spectrum: Hampton’s Hump
CTPA in the axial plane (a.) showing large filling defect in the right pulmonary artery (red arrow) with resultant opacification (white arrow) representing wedge shaped pulmonary infarct of the right lower lobe . Coronal plane (b.) shows large filling defect of the right pulmonary artery (blue arrow) and a subsegmental branch at the base of the right upper lobe (yellow arrow) with resultant wedge shaped pulmonary infarct (green arrow).

Imaging Spectrum: Westermark’s Sign
Chest x-ray (a) in a 69 y.o. male shows a complete white out of the right lung (red arrow) and a magnified view of the left lung (b) shows a mid-region focal hyperlucency secondary to oligemiaresulting in a paucity of blood vessels of the left lung (red triangle). This is known as Westermark'ssign and represents decreased perfusion of the left lung.

Imaging Spectrum: Westermark’s Sign
CTPA in the axial plane in a 69 y.o. male (preceding patient) shows large filling defect (white arrows and red region in d.) of the left lung with no evidence of distal flow.

Imaging Spectrum: Pulmonary Angiogram with Pulmonary Emboli
The angiograms of a right pulmonary artery from a normal patient (a.) and from a patient with pulmonary embolus (b.) showing linear thrombi in both the upper and lower pulmonary vessels (blue arrows). Relative constriction of the distal vessels in the patient with embolism compared to the normal patient is also noted (yellow dotted circles).

Imaging Spectrum: Nuclear Medicine Perfusion Scan with Subsegmental Perfusion Defect
Nuclear medicine perfusion scan in the coronal plane in a 20 y.o. female presenting with left sided pleuritic chest pain, dyspnea, and elevated d-dimer showing subsegmental perfusion defect of the left lower lobe (red arrow).

Imaging Spectrum: Reverse Halo Sign
CTPA in the axial plane in a 20 y.o. female presenting with left sided pleuritic chest pain, dyspnea, and elevated d-dimer showing a small filling defect (red arrow in a.) and in lung window (b.) showing a resultant reverse halo sign (yellow circle), defined as central ground-glass opacity surrounded by denser consolidation of crescentic shape, indicating pulmonary infarct.

Imaging Spectrum: Saddle Embolism
CTPA in the axial plane at the level of the pulmonary artery branch point showing a large filling defect that is straddling the pulmonary arterial bifurcation (red arrows) representing a saddle embolism.

Imaging Spectrum: Fat Embolism
CTPA of the chest in the axial plane at the level of the pulmonary artery bifurcation show ill defined fluffy nodules with ground glass changes (yellow arrows) and thickening of the interlobular septa (blue arrows) at the lung bases, without evidence of filling defects. The clinical presentation together with the location of the fractures and CT appearance suggest a diagnosis of fat embolism.

Imaging Spectrum: DVT & PE in Setting of Casted Fracture & Immobilization
Lateral (a.) and AP (b.) views of the left ankle show a minimally displaced simple oblique fracture of the distal fibula (red arrow). The left lower extremity was placed in a cast (blue arrow) and the patient was immobilized for some time as he was non-weightbearing in the left lower extremity.

Imaging Spectrum: DVT & PE in Setting of Casted Fracture & Immobilization
CT of the bilateral lower extremities in the axial plain (a.) shows a non-occlusive filling defect in the venous vasculature of the left lower extremity with a polo-mint sign (red arrow) representing a DVT. CTPA at the level of the right pulmonary artery (b.) shows a large filling defect of the right main pulmonary artery (yellow arrow).

Imaging Spectrum: Paget’s Sarcoma of Humeruswith Metastasis to Right Ventricle
AP radiograph left proximal humerus (a.) showing Paget’s sarcoma (white arrow) with metastasis to the right ventricle (blue arrow) seen on lateral chest radiograph (b).

Imaging Spectrum: Paget’s Sarcoma Right Ventricle Metastasis and Pulmonary Embolism
CT chest in the axial plane showing right ventricular metastasis (white arrow) with pulmonary emboli (red arrows) and subsequent distal infarct of the right lower lobe (yellow arrow).

Imaging Spectrum: Prostate Cancer Radiation Seeds Embolization
CT pelvis of a 56 y.o. male with prostate cancer s/p radiation seed placement as seen by radiopaque pellets in prostate gland (red arrow).

Imaging Spectrum: Prostate Cancer Radiation Seeds Embolization
Chest X-ray (a.) following the procedure shows at least 4 of the seeds in the base of the right lung (b.) and 3 of the seeds in the mid left lung field (c.) (red arrows).

Imaging Spectrum: Paradoxical Embolism
CTPA in the axial plane of the chest at the level of the pulmonary artery bifurcation (a.) and hepatic veins (b.) in a 68 y.o. patient with sudden chest pain and dyspnea associated with a cold, painful right foot showing large filling defect of the right pulmonary artery (red arrow) and subsequent infraction of the right lower lobe (white arrow) and tricuspid regurgitation with reflux into the hepatic veins (blue arrow).

Imaging Spectrum: Paradoxical Embolism
CT abdomen and pelvis in the axial plane (a.) at the level of the left kidney shows aortic thrombus (red arrow) and left renal infarction (blue arrow). At the level of the (b.) right internal and external iliac arteries we see filling defects (yellow arrows) representing paradoxical embolus occluding blood supply to the right lower extremity.

Imaging Spectrum: Septic Emboli
CT of the chest show in the axial plane and lung window showing multiple irregular lung nodules bilaterally (red arrows), some of which show cavitation (yellow arrows). Right lung shows a subpleural nodule with cavitation and feeding vessel sign (blue arrow).
Case courtesy of Radswiki. Radiopaedia.org

Imaging Spectrum: Air Emboli
CTPA at the levels of the (a.) right ventricle, (b.) pulmonary artery bifurcation, and (c.) pulmonaryarteries showing decreased intensity consistent with air in the pulmonary vasculature (whitearrows) and a filling defect of the right lower lobe artery (blue arrow) after air was inadvertentlyinjected through the right antecubital vein.
Case courtesy of Lanfranco et al. Am J Case Rep. 2017

Imaging Spectrum: Heparin Induced Hypercoagulable State
Chest CT sequence in the axial plane showing filling defects in the aorta representing thrombosis (white arrows) and filing defects in the pulmonary vasculature representing pulmonary emboli (pink arrows) in a patient with a heparin induced hypercoagulable state.

Imaging Spectrum: IVC Filter
CT abdomen with contrast in the axial plane at the level of the superior mesenteric vein showing IVC filter placement (red arrow).

Imaging Spectrum: Pulmonary Web from Chronic PE
Examples of pulmonary webs (green overlay) defined as a fibrotic band anchored to pulmonary artery vessel wall at two ends with a free unattached mid portion seen as a late sequelae or residual of a chronic pulmonary embolism. Magnified image (b.) shows closer look at fibrotic band (white arrow).

DISCUSSION
• Our patient presented to the ED with a chief complaint of syncope without cardiac symptoms or clinical signs of pulmonary embolism, when in fact the cause of his syncopal episode was massive bilateral pulmonary emboli. • Chest radiographs and trauma CT protocols were obtained without evidence
suggestive of PE, but his rapid decline in hemodynamic stability led to evaluation with CTPA.
• No D-dimer was obtained initially due to low clinical suspicion for PE.
• Classification of pulmonary emboli as “massive” is based on based on clinical findings of hemodynamic instability, not the size or extension of the pulmonary embolism on imaging.
• In the setting of massive bilateral pulmonary embolism, it is important to evaluate imaging for signs of right heart strain and left ventricular failure with subsequent hemodynamic shock.

Recalling Pulmonary Segments
Case courtesy of Dr Peter Jenvey, Radiopaedia.org, rID: 54511

Systematic Work-Up for PE Among Patients Presenting with Syncope
Courtesy of Badertscher P, et al. 2019

LINKS AND REFERENCES• National Guidelines
• Kligerman SJ, Bykowski J, Hurwitz Koweek LM , et al. ACR Appropriateness Criteria® Syncope. Available at https://acsearch.acr.org/docs/3128014/Narrative/. American College of Radiology. Accessed 10/20/2020.
• Kirsch J, Brown RKJ, Henry TS, et al. ACR Appropriateness Criteria® Suspected Pulmonary Embolism. Available at https://acsearch.acr.org/docs/69404/Narrative/. American College of Radiology. Accessed 10/20/2020
• Image References:
• Case courtesy of Dr. Ashley Davidoff, TheCommonVein.net, 15146-86255c.8s
• Case courtesy of Dr. Peter Jenvey, Radiopaedia.org, rID: 54511
• Other Journals and Texts
• Findik S, Erkan L, Light RW, Uzun O, Atici AG, Akan H. Massive pulmonary emboli and CT pulmonary angiography. Respiration. 2008;76(4):403-12. doi: 10.1159/000147765. Epub 2008 Jul 22. PMID: 18645243.
• Weerakkody, Y, et al. (2018). Massive pulmonary embolism: Radiology Reference Article. Retrieved October 20, 2020, from https://radiopaedia.org/articles/massive-pulmonary-embolism?lang=us
• Badertscher P, du Fay de Lavallaz J, Hammerer-Lercher A, Nestelberger T, Zimmermann T, Geiger M, Imahorn O, Miró Ò, Salgado E, Christ M, Cullen L, Than M, Martin-Sanchez FJ, Di Somma S, Peacock WF, Keller DI, Costabel JP, Walter J, Boeddinghaus J, Twerenbold R, Méndez A, Gospodinov B, Puelacher C, Wussler D, Koechlin L, Kawecki D, Geigy N, Strebel I, Lohrmann J, Kühne M, Reichlin T, Mueller C; BASEL IX Investigators. Prevalence of Pulmonary Embolism in Patients With Syncope. J Am Coll Cardiol. 2019 Aug 13;74(6):744-754. doi: 10.1016/j.jacc.2019.06.020. PMID: 31395124.
• OLA
• Kucher N, Rossi E, De Rosa M, Goldhaber SZ. Massive pulmonary embolism. Circulation. 2006 Jan 31;113(4):577-82. doi: 10.1161/CIRCULATIONAHA.105.592592. Epub 2006 Jan 23. PMID: 16432055.