Embed Size (px)
Citation preview

Adaptive Urban Planning for Climate Change | ID589 | Systems Workshop | Fall 2006 | Ahn : Chong : Crimmin : Lee : Montgomery : Wilmot �
Massive Change: Adaptive Urban Planning for Climate Change
Yoo-Jung AhnIrene ChongErik Van CrimminSang-Ho LeeJohn MontgomeryEric Wilmot
ID 589Systems WorkshopFall 2006Institute of Design
SAN FRANCISCO
SEATTLE
MEXICO CITY
CHICAGO
TORONTONEW YORK
LONDON
BARCELONA
PARIS
COPENHAGENBERLIN
CAPE TOWN
BEIJING TOKYO
MELBOURNE

Adaptive Urban Planning for Climate Change | ID589 | Systems Workshop | Fall 2006 | Ahn : Chong : Crimmin : Lee : Montgomery : Wilmot 2
I Preface Background Relevant Trends Project Statement Goals Process Core Issues Structured Planning Teams
II Introduction Process Overview
III System Elements
1. Resource & Solution Network Climate Net RSS Red Alert Help!
2. Threats & Consequences Climate Change Group Advisory Committee City Link Climate Wiki
3. Analyze Vulnerabilities Threat Prioritization Matrix Performance Web CO2 Monitor
CO2 Census Climate Change Simulator
4. Solution Development ChallengeKit Idea Stock Market Solution Filter Solution Variation
5. Implementation Practices Alliances Connector Project Management Feed Leadership Training 3Cs Challenge Green Text Concept Communication
6. Chicago Solutions FreeRide Green Roofs City Farm Bio-Hydrant Neighborhood Water Monitor Water Work Power Meter Exhaust Breathalyzer Yellow Light
IV Appendix
Table of Contents

Adaptive Urban Planning for Climate Change | ID589 | Systems Workshop | Fall 2006 | Ahn : Chong : Crimmin : Lee : Montgomery : Wilmot �
Background Global warming is now recognized as fact almost without question. Arguments to the contrary put forth twenty years ago are no longer credible, and only the most extreme critics still contend that the changes we see are natural - not caused by human activities. The question now is not whether global warming is taking place, but how serious its consequences will be.
Over the twentieth century, the Earth’s average global surface temperature increased .6° Celsius (1.08° Fahr-enheit). Estimates made in 2004 of the amount of warming we will experience in this century suggested a likely range of 2.4 to 5.4°C (4.3 to 9.7°F), but a more recent paper (2005) by a team of Oxford University scientists suggests a significantly hotter range of possibilities: 2 to 11°C (3.6 to 19.8°F), pushing the most likely value upward.
Darkening the picture further, the greenhouse gases already put into the atmosphere will have effects lasting centuries. The concentration of carbon dioxide and its greenhouse gas equivalents in the atmosphere before land-clearing and industrialization in the 18th century was about 265 parts per million (ppm). It is now nearly 400 ppm. To stabilize concentrations at 450-550 ppm will require major reductions in carbon emissions beginning immediately. And the 450-550 level is not safe; stabilization must be succeeded by reductions in concentration, which will take more than a century at natural rates of absorption. Warming at this magnitude is likely to be greater than any since the large and abrupt Younger Dryas event 11,000 years ago. “Warming as large and rapid as that projected for the twenty-first century might be expected to create severe problems for natural ecosystems and human societies. Indeed, evidence from past climate changes of similar mag-nitude point to major impacts, which, if humans had been present in numbers like today, would have been disastrous” (Pittock 2005, 21).
A. Barrie Pittock. Climate Change. Turning Up the Heat. Collingwood, Vic., Australia: CSIRO Publishing, 2005.
Preface

Adaptive Urban Planning for Climate Change | ID589 | Systems Workshop | Fall 2006 | Ahn : Chong : Crimmin : Lee : Montgomery : Wilmot �
It is too late to avoid the effects of global warming. But it is not too late to assemble and project strategies and tools to allow us to adapt (Figure 1). To be able to deal with the great challenges of emissions reductions that will be necessary on a global scale to mitigate the worst of the greenhouse changes—while improving or even maintaining our quality of life—will require that we rise above the widely diverse environmental challenges that now will confront local regions and communities. Change will not be uniform. Some regions will be hotter and drier; some will be wetter. Around the world’s coastlines, all habitats will experience rising waters (16 of the world’s 19 cities rated as megacities in 2005 were on a coast). Weather events will become more intense and more frequent. And a host of induced plagues will follow on from these climatic disrup-tions. Our passport to survival will be our capacity to adapt, and the ability to plan for those adaptations will be critical.
Stationary Climateand Coping Range
Changing Climate Vulnerable
Adaptation
CopingRange
Vulnerable
Figure 1. Adaptation buys time by extending the coping range. (adapted from Pittock 2005, 73)
Preface

Adaptive Urban Planning for Climate Change | ID589 | Systems Workshop | Fall 2006 | Ahn : Chong : Crimmin : Lee : Montgomery : Wilmot 5
Relevant Trends Trends initiated by emerging technologies, changing environmental conditions, and evolving social change will have real impact on the situation. Among such trends are:
Population GrowthPopulation growth continues to soar around the world. Particularly in developing countries, but also in coun-tries with significant immigration (such as the United States), rates of population increase are putting heavy demands on available resources. Although estimates for a final asymptote have decreased, world population is still expected to top 9 billion by 2050. It is now 6.64 billion.
Population MovementsA combination of forces is creating a movement of people from rural to urban environments. In the develop-ing countries, it is the perception that better jobs are in the cities. In the developed countries, it is the renais-sance of the city as a cultural center coupled with the progression of societies from agriculture to manufactur-ing to service to information economies. In 2005 for the first time, the world’s population was more urban than rural.
Energy Resource DepletionWorld petroleum resources are reaching the point where additions to reserves no longer equal reductions from production. Estimates for final peak production vary from 2005 to a just a few years from now. The world economy, deeply committed to petroleum as fuel resource, must meet its energy needs by other means in the near future.
Diminishing Water ResourcesWater supplies are already becoming precious resources in many parts of the world. Today, one-third of the world lives in water-stressed countries; by 2050, two-thirds will be in similar circumstances—including sig-nificant parts of the U.S. As regions are strained by greater demand, new efficiencies in water distribution, use, purification and reuse will be mandatory.
Preface

Adaptive Urban Planning for Climate Change | ID589 | Systems Workshop | Fall 2006 | Ahn : Chong : Crimmin : Lee : Montgomery : Wilmot 6
Increasing expectationsThe growing availability and capabilities of communications such as cellular telephones, satellite and ca-ble TV, and the Internet are providing people with daily knowledge of living conditions, problems, prod-ucts, threats and services everywhere. As the media create new and faster avenues of communication, they also raise levels of awareness and create expectations that both fuel demand and encourage willingness to change.
Internet PenetrationComputer use and Internet access grow exponentially every year. Information of encyclopedic detail can be obtained more and more easily, and complex, sophisticated processes can be used remotely. Access to high-quality communications and sophisticated computer tools are increasingly available to individuals and groups anywhere. In the United States, Internet penetration reached 67% in 2005, and some Asian and Euro-pean countries surpass that.
Emerging TechnologiesThe pace of technological change continues to accelerate, bringing new science to industrial, institutional and governmental uses at an ever quickening pace. Most notable among many promising fields, major tech-nological innovations can be expected in the new disciplines of molecular nanotechnology, robotics and the biosciences.
Evolving Planning TechnologyIncreasingly sophisticated information technology now is being routinely applied to planning and design processes, requiring organizations to “plan for how they plan”. Good planning now must include means for instituting continuing review, appraisal, revision of and extension to the planning process itself. New Rela-tionships, greater public mobility and access to information is changing the nature of association for many individuals and organizations. Organizations that once operated in isolation are now players in a common environment. Sometimes the emerging relationships are competitive, sometimes cooperative, and new forms of relationship can be expected to be created as conditions evolve.
Preface

Adaptive Urban Planning for Climate Change | ID589 | Systems Workshop | Fall 2006 | Ahn : Chong : Crimmin : Lee : Montgomery : Wilmot �
Project StatementUsing Structured Planning methodology, develop concepts for a continuous, adaptive planning process for urban communities confronting climate change. Integrate conventional economic, social and physical plan-ning with planning for environmental and energy sustainability and the disruptions expected locally from global warming. Build recursively upon Structured Planning methods, custom tailoring them and strength-ening them with other effective urban planning methods and tools. Use the city of Chicago to demonstrate elements of the process, and draw on the concepts developed in other Massive Change planning projects as applications may dictate.
The proposal should:
1. Shape the planning process itself as well as the objectives of its methods and tools to be adaptive over time to changing capabilities and conditions.
2. Consider the full spectrum of environmental planning from anticipation to preparedness to response to recovery.
3. Incorporate as part of the process best practices as they are known or being developed by organizations, agencies and planning experts within the environmental planning community.
4. Anticipate and plan for networked operational cooperation among affected and spared communities locally, regionally and internationally.
5. Implement procedures that seek out tools that will create economic, social and/or environmental benefits in addition to alleviating the effects of global warming.
Preface

Adaptive Urban Planning for Climate Change | ID589 | Systems Workshop | Fall 2006 | Ahn : Chong : Crimmin : Lee : Montgomery : Wilmot 8
Project Goals As general guidelines an Adaptive Urban Planning for Climate Change should:
• Explore a full range of possibilities, paying especial attention to appropriate technologies and user needs. Include means for inspiring the development of processes, tools, systems and products—including procedures, services, activities, organizational concepts and any relevant relationships among them.• Explore revolutionary as well as evolutionary ideas.• Plan for communication processes by means of which other localities, regions and states can learn of and implement successful procedures.• Consider the impacts of costs and funding thoughtfully; plans should not be unnecessarily limited, but should not be so unconstrained as to be unattainable in practicality.• Incorporate as possible the special characteristics of design thinking in the structure and operation of the methods and tools of the planning process.• Conceive the properties and features of the process as means to build trust and cooperation between planning, executive and user communities.
Overall, the solution should:
• Assume that the proposal can be acted upon as it is conceived. Do not underpropose on the assumption that a concept might be politically opposed.• Demonstrate what might be achieved. The value of the proposal is in its ideas, not its certain attainability. Ideas that might not be fully attainable or feasible today may be achieved tomorrow—if they are known.
Preface
Adaptive Urban Planning for Climate Change | ID589 | Systems Workshop | Fall 2006 | Ahn : Chong : Crimmin : Lee : Montgomery : Wilmot 9
The Process The semester-long Systems and Systematic Design course is a project-based course in which teams of gradu-ate students, deliberately of mixed international origins and different academic backgrounds, apply the com-puter-supported Structured Planning process to complex design and planning problems. The goal for each project is to develop information thoroughly, propose innovative solutions that take maximum advantage of the information, and integrate these ideas into system concepts that can both be evaluated in their own right and (in a real situation) be the comprehensive project specifications for a follow-on detail design phase of development.
ComplexityWhat is the nature of “systems” concepts, where products, processes, services and settings are organized to act together to achieve multiple goals? What can be done to assure that a concept is as complete as possible, covering many functions and attaining a high degree of “wholeness” and organic reliability?
Design and planning methodsWhat is Structured Planning and how can its took-kit of methods be used to collect, structure and handle information in projects of greater complexity than can be comfortably dealt with intuitively? How can such methods be used by a team to extend the effectiveness of all?
TeamworkHow do individuals with different cultural origins and different academic backgrounds work together suc-cessfully on teams? What roles are there to be played and what difficulties must be overcome?
Preface
Course Issues

Adaptive Urban Planning for Climate Change | ID589 | Systems Workshop | Fall 2006 | Ahn : Chong : Crimmin : Lee : Montgomery : Wilmot �0
Structured Planning Structured Planning, the systematic planning process taught in the course, is a process for finding, structur-ing, using and communicating the information necessary for design and planning activities. It is a front-end process for developing concepts thoroughly and cohesively.
A number of projects have been undertaken with it and used to further its development. Among nearly 100 of these, an early published project for Chicago’s transit authority (CTA) was Getting Around: Making the City Accessible to Its Residents (1972). In 1983, the House of the Future project won the Grand Prize in the Japan Design Foundation’s First International Design Competition. In 1985, the design of a habitation module for Space Station was undertaken for NASA. In 1987, the Aquatecture project won the Grand Prize again in the Japan Design Foundation’s Third International Design Competition. In 1991, Project Phoenix on global warming was honored as Environmental Category Grand Winner in Popular Science magazine’s “100 Greatest Achievements in Science and Technology” for the year. In 1993, two award winning projects, NanoPlastics and Aerotecture, were widely publicized in Europe and Japan; in 1995, the National Parks proj-ect developed plans for the future of the U. S. National Park Service. In 2001, Access to Justice, a project sponsored by the National Center for State Courts, was implemented for use in state courts across the United States, and in 2005, four projects on Home, Play, Work and Health were finalists in four of the five competi-tion categories for Denmark’s INDEX Awards, the world’s richest design prizes. As the process has evolved, it has become an increasingly useful planning tool for products, systems, services, processes and organiza-tions. It is now being used commercially.
A diagram of the process, shown in two figures (pages 14 and 15), outlines the activities that make up Struc-tured Planning and the working documents and final products that are produced along the way. Where prod-ucts of the process are discussed here in the abstract, it is possible to see specific examples produced for this project in the appendices that accompany this report.
Preface

Adaptive Urban Planning for Climate Change | ID589 | Systems Workshop | Fall 2006 | Ahn : Chong : Crimmin : Lee : Montgomery : Wilmot ��
I Project Definition
The Structured Planning process begins with Project Initiation and the production of a Charter. This is a “brief” that serves as an initial communication vehicle between client and planners. It contains background, context, basic goals, a project statement that cuts to the heart of the planning task, resources to be used, and an initial set of issues to be investigated.
Defining Statements are mini “white papers” produced in the Framework Development portion of Project Definition. They focus the project within the direction of the Charter, concentrating on the issues and arguing specific directions that the project should follow with regard to them. Together with the Charter, they define the project.
II Action Analysis
Any system can be viewed as a complex entity working with its users in different ways appropriate to its modes of operation. To plan effectively, a planning team must recognize these Modes, identify Activities that occur within them, and isolate the Functions that the users and system are intended to perform within each Activity. The result of the Activity Analyses conducted is a Function Structure.
Half of the purpose of Action Analysis is the enumeration of Functions. The other half is the development of information about these Functions that reveals insight about what happens as they are performed. During Action Analysis, insights are sought about why things go wrong in performing some Functions, and how other Functions manage to be performed well. These insights are uncovered in the Design Factor Description procedure and developed in documents that become part of a qualitative knowledge base. Activity Analyses record information at the Activity level; Design Factors document insights and ideas associated with Func-tions.
Preface

Adaptive Urban Planning for Climate Change | ID589 | Systems Workshop | Fall 2006 | Ahn : Chong : Crimmin : Lee : Montgomery : Wilmot �2
To capture as fully as possible the ideas suggested on Design Factors, Solution Element documents are writ-ten as part of Action Analysis. These are one-page documents designed to capture enough detail about ideas to give them substance when they are needed later. They have three important sections: “Description” — a short explanation, “Properties” — what the idea is, and Features — what the idea does. The Solution Element form is the tool used for committing ideas to paper. The product of Action Analysis is three sets of critical information: a set of Functions (the Function Structure), a set of insights (Design Factors) and a set of pre-liminary ideas (Solution Elements)
III Information Structuring
Paradoxically, as useful as the Function Structure is for establishing coverage, it is not the best form of orga-nization for developing concepts. Reorganizing information for use in concept development is the job of two computer programs, RELATN and VTCON.
The controlling factor for whether two Functions are associated from the planning standpoint is not whether they are categorically “related” in some manner, but whether a significant number of their potential solutions are of concern to both. Which Solution Elements are of concern to each Function is established in an Interac-tion Analysis procedure. The RELATN program then uses this information in a Graph Construction process to establish links between Functions.
Another program, VTCON, completes the information structuring process. The graph establishes paths through the Functions by linking them when they are related, but, unlike a road map, a graph is not naturally arranged nicely for visual comprehension. In the Hierarchy Construction activity, VTCON finds clusters of highly interlinked Functions and organizes them into a semi-lattice hierarchy, a very general form of hierar-chy most appropriate for planning. The hierarchy is called an Information Structure.
Preface

Adaptive Urban Planning for Climate Change | ID589 | Systems Workshop | Fall 2006 | Ahn : Chong : Crimmin : Lee : Montgomery : Wilmot ��
IV Synthesis
In its form from the VTCON program, the Information Structure is simply a hierarchical organization. Nodal points do not have names. The task of Means/Ends Analysis is to create labels for all nodal points in the hierarchy. Moving bottom-up from the known Functions in the bottom level clusters, the question is asked, “To what end are these Functions means?” The answering purpose, in turn is grouped with its sibling nodes and viewed as means to a higher level end. The process continues to a completely labeled Information Struc-ture.
The process is then reversed as a top-down, structured brainstorming procedure: Ends/Means Synthesis. In this process, the planning team asks of high level nodes, “what means do we need to meet this end?” As means are established, they are treated in turn as new ends for which means must be found, until the means become concrete enough to be described as final elements of the system (System Elements). Solution Ele-ments originally conceived for the Functions involved are constantly reviewed as possible end products. New ideas, however, are encouraged, and original ideas are modified or combined in the light of the means that evolve.
During Solution Evaluation, features of the System Elements are evaluated for their contribution to fulfill-ment of Functions in their part of the Information Structure. If there are unfulfilled Functions, this is the signal to return to the Ends/Means process for additional development.
System Element Interaction compares System Element with System Element in a search for additional syner-gies that can contribute to systemic qualities. More than simply recognizing relationships, the planning team proactively seeks out ways for System Elements to work together — to the extent of modifying one, the other, or both. Changes are incorporated in the properties and features of the individual System Elements.
Preface

Adaptive Urban Planning for Climate Change | ID589 | Systems Workshop | Fall 2006 | Ahn : Chong : Crimmin : Lee : Montgomery : Wilmot ��
The last task, System Element Description, completes the write-up of System Elements as specifications, including a succinct description, all relevant properties and features, and extensive Discussion and Scenario sections that contain detailed expositions of the ideas in both conceptual and operational terms.
V Communication
Because the result of the Structured Planning process is a complex system, usually with a number of System Elements, a Communication Structure is frequently included as an aid to understanding. This is created during Concept Organization by the VTCON program from an assessment of how important the System Ele-ments are to each other’s operation. Using this structure, the reader can understand the system and navigate its concepts with greater efficiency.
The product of the Structured Planning process, assembled in the Project Completion section, is a Conceptual Plan, made up of an Overview that provides background and introduces the system, the System Elements that describe the ideas and their relationships, and Appendices that contain all relevant support information, including the Defining Statements, Design Factors, Function Structure and Information Structure.
Preface

Adaptive Urban Planning for Climate Change | ID589 | Systems Workshop | Fall 2006 | Ahn : Chong : Crimmin : Lee : Montgomery : Wilmot �5
Preface
WorkingHierarchy
CHARTER
FrameworkDevelopment
ActivityAnalysis I
ActivityAnalysis II
ActivityStructure
Design FactorDescription
Solution ElementDescription
InteractionAnalysis
GraphConstruction
Examination of criticalissues and articulationof framework positions
QUESTION ATISSUE
ALTERNATIVEPOSITIONS
ACTIVITIESPurposeful
performance(s) withineach Mode
POSITION
DEFININGSTATEMENTS
white papersframing project
Identification of Modes of operation
andActivities
of the system
Analysis of Activitiesto uncover Functions
and insights about them(Design Factors)
MODESMajor conditions of
operation or behavior(may have
SUBMODES)
ARGUMENT
FUNCTIONSActions performed by
the system or byusers working with
the system
ACTIVITIES
worksheets formodeling activities
Recognition andelaboration of insights
Creation of ideas forusing the insights
OBSERVATION
EXTENSION
DESIGN STRATEGIES
SOLUTIONELEMENTS
insights withassociated ideas
Description andannotation of ideas
inspired by theinsights of Design
Factors
BRIEFDESCRIPTION
PROPERTIES"what it is"
FEATURES"what it does"
Fun
ctio
ns
Designation ofrelationships between
Functions andSolution Elements
RelationshipData File
Bi-directional Scale
Graph ofFunctions
+2 Strongly supportsfulfillment
+1 Supports fulfillment0 No effect
–1 Obstructs fulfill-ment
–2 Strongly obstructsfulfillment
Operations with theVTCON computer
program
Selection of thresholdfor link strength from
histogram
Operations with theRELATN computerprogram (Phase 2)
Operations with theRELATN computerprogram (Phase 1)
Evaluation, rerunsand refinement
Operations with theVTCON computer
program
HIERARCHICALCONDENSATION
System Functionsorganized by
analysis
• Modes• Activities• Functions
GRAPH
ProjectInitiation
Establishment ofproject intent and
assembly of meansfor proceeding
1. PROJECT
project guidelines
SolutionElements
STATEMENT2. BACKGROUND 3. TRENDS4. GOALS 5. RESOURCES6. SCHEDULE 7. METHODOLOGY 8. ISSUES
COEFFICIENTS OFINTERACTION
DECOMPOSITIONPRIMARY CLUSTERS
III Information StructuringII Action AnalysisI Project Definition
what needs should the project address?
what resources can bebrought to bear?
what relevant trends arecreating new needs?
how strongly should thepositions be regarded?
what are some of the keyissues involved?
what happens within this system? orwhat should happen within this system?
how can the system best be represented as a balancedcollection of activities?
who are all the users of this projected system?What insights can begained about why thingsgo right or wrong?
what problems arisewhen Functions are per-formed?
what ideas can be gener-ated to take advantage ofthese insights?
what is it that makes thissolution work?
what does this solution doto make it useful?
which Functions are related?
how do the solution ideas support or obstruct the performance of Functions?
which Functions should we look at together in order to create a more systemic solution?
what positions should theproject take on theissues?
what additional issues sur-face from research?
Project Statement<action><possible modifiers><object of planning><goal><possible modifiers>
Constraint"must" must be done
Objective"should" should be done
Directive"ought to" ought to be done
Title:content-descriptivephrase
Observation:distilled sentence
Extension:open-ended explanation ofinsight
Design Strategies: <imperative verb phrase>
Solution Elements: <evocative adjective> <noun>
Properties:<noun phrase>
Features:<verb phrase>
Writing Formats
Mode<noun> class format
Activity<gerund> duration format
Mode<noun> class format
Activity<gerund> duration format
Function<verb phrase> action format
HierarchyConstruction
Activity Analyses
DESIGNFACTORS
FUNCTIONSTRUCTURE
workingdocuments
finaldocuments
ActivityStructure
DesignFactors
milestoneclient checkpoint
milestoneclient checkpoint
milestoneclient checkpoint

Adaptive Urban Planning for Climate Change | ID589 | Systems Workshop | Fall 2006 | Ahn : Chong : Crimmin : Lee : Montgomery : Wilmot �6
The Structured Planning process: phases IV through V.
Preface
Means/EndsAnalysis
Ends/MeansSynthesis
SolutionEvaluation
System ElementDescription
PreliminarySystem
Elements
ElaboratedSystemElements
ConceptOrganization
System Functionsorganized for
synthesis
• bottom-uprecomposition
• cross-functionalassociations
specifications fordesign
SYSTEMELEMENTS
System ElementInteraction
System ElementRelationship
Matrix
ProjectCompletion
concept brief fordesign project
System Elementsorganized forunderstanding
• linkage fornavigation
• associations byfunctionality
Labeling of primaryFunction clustersand higher-level
superset clusters;the rediscovery ofpurpose — seen
freshly
What END are thesubset clusters the
MEANS to?
MEANS END
Final synthesis ofconcepts to
accomplish purposes
What MEANS arenecessary to
accomplish this END?
END MEANS
SYSTEM ELEMENTS
Check of conceptsagainst Functions of
the cluster
Do Features satisfyFunctions?
YES: CONTINUE
NO: ADD, ADD TO,OR MODIFY SYSTEMELEMENTS
Comparison ofSystem Elements with
each other for theaddition of synergistic
features
SYSTEM ELEMENTvs
SYSTEM ELEMENT
Final description ofconcepts
1. Description2. Properties3. Features4. Discussion5. Scenario6. Related System
Elements7. Fulfilled Functions8. Associated Design
Factors
Organization ofSystem Elements forcommunication and
understanding
RELATIONSHIPS(from System Element
Interacton)
Consolidation ofinformation into aConceptual Plan
1. Existing solutions2. Modified solutions3. Speculative new
solutions
FEATURES andPROPERTIES
FEATURESvs
FUNCTIONS
Establishment of newrelationships;
Determination ofrelationship strengths
COMPONENTS
GRAPH
Graph decompositionand condensation by
VTCON computerprogram
1. Overview2. Communication
Structure3. System Elements
1. Defining Statements2. Function Structure3. Design Factors4. Information Structure
MAIN COMPONENTS
APPENDICES
SYSTEM ELEMENTRELATIONSHIPS
IV Synthesis V Communication
what additional featuresneed to be incorporated?
is there coverage for allFunctions in the SystemElements?
how can the functionalityof both System Elementsbe improved if they worktogether?
what organizationalinsights does the newstructure suggest?
which of the Solution Ele-ments can be used as is?
what new ideas are sug-gested by the associationof Functions?
which Solution Elementscan be used if modified toreflect newly revealedassociations?
what functionalities shouldbe shared on a broaderbasis system-wide?
what would happen to thesystem if these relation-ships were extended? what else can be commu-
nicated as a help to thedetail design team?
what properties and fea-tures are essential to theworking of the concept?
how can the ideas beexplained best, both forwhat they are and howthey are used?
how can the reader bestnavigate the SystemElements?
how should the systemconcept be introduced?
what supplementary mate-rials will be of the greatesthelp?
how can the reader trackback ideas to the prob-lems that inspired them?
what additional under-standing can be gainedthrough hierarchicalorganization?
Level 1-2 nodes:Activity format
Level 3+ nodes:Mode format
Means:<imperative verb phrase>
Features:<verb phrase> working
documents
finaldocuments
ActivityStructure
DesignFactors
COMMUNICATIONSTRUCTURE
CONCEPTUALPLAN
INFORMATIONSTRUCTURE
Writing Formats
milestoneclient checkpoint
milestoneclient checkpoint

Adaptive Urban Planning for Climate Change | ID589 | Systems Workshop | Fall 2006 | Ahn : Chong : Crimmin : Lee : Montgomery : Wilmot ��
Planning Team
Yoo-Jung AhnBA Product DesignMFA Product DesignHong-Ik University (Seoul, Republic of South Korea)Team Leader, Phase 4
Irene ChongBS Environmental EconomicsUniversity of Guelph (Guelph, Ontario, Canada)Team Leader, Phase 1
Erik CrimminCertificate, Industrial Design FoundationsUMEÅ Institute of Design (Umeå, Sweden)BA EconomicsColby College (Waterville, Maine)Team Leader, Phase 2
Sang-Ho LeeBA Textile EngineeringDankook University (Seoul, Republic of South Korea)Team Leader, Phase 3
John MontgomeryBArch ArchitectureUniversity of Tennessee (Knoxville, Tennessee)Team Leader, Phase 5
Eric WilmotBA Industrial DesignCarnegie Mellon University (Pittsburgh, Pennsylvania)Team Leader, Phase 6
Team
Preface

Adaptive Urban Planning for Climate Change | ID589 | Systems Workshop | Fall 2006 | Ahn : Chong : Crimmin : Lee : Montgomery : Wilmot �8
Eric Wilmot brings a diverse background to the process of strategic innovation planning. He received a degree in Industrial Design from Carnegie Mellon and is currently finalizing a Masters Degree at the Institute of Design, IIT. With over a decade of international experience in the corporate and consulting environment, he has received many patents and awards as a designer and recognized director. His dedication to environmental initiatives traces to his childhood spent on a dairy farm, and his global travels in development adgendas. When he’s not working, he can be found sailing, hiking, archery hunting, or reading.
Yoo Jung Ahn was born and lived in Korea before moving to Chicago where she received a Masters of Design Methods from the Institute of Design, IIT in 2006. She previously received undergraduate and graduate degrees in Industrial design from Hong-Ik University in Korea.Professionally, Yoo Jung spent five years at LG electronics as a product designer. There she designed many consumer-electronic appliances and worked across marketing and engineering roles. Along with a passion for design, she holds great cultural diversity as an important factor in design planning and strategy. When not practicing, Yoo Jung loves cooking and enjoying cinima, especially horror movies.
John Montgomery moved to Chicago in 2005 from Memphis, where he was in private practice as an architect, focused on sustainable development. He received a Bachelor of Architecture degree with Honors from the School of Architecture at the University of Tennessee. His work there included foreign studies in earthquake design in Managua Nicaragua. John works for the Public BuildingCommission of Chicago where he is manager of green building programs. Whennot working and not studying at ID, John enjoys cinema and bicycling around Chicago.

Adaptive Urban Planning for Climate Change | ID589 | Systems Workshop | Fall 2006 | Ahn : Chong : Crimmin : Lee : Montgomery : Wilmot �9
Erik Van Crimmin brings much international training and experience to the team. Origanlly from Boston, Erik studied Economics in New England and Design in Sweden. His ability to blend a deep undersanding of market forces with creative thinking empowers his experience at the Insititute of Design where he is attaining a Masters of Design Methods. His interest in developing more efficient, holistic solutions is driven by his commitment to leverage his experiences to innovate at the meta level. When he’s not working on climate change agendas, Erik can be found biking, hiking, playing guitar, or enjoying the outdoors from a photographers perspective.
Sang-Ho Lee studies Design Planning, Institute of Design, Illinois Institute of Technology (IIT), and Stuart Graduate School of Business, IIT. He focuses on combining the design and business strategies to create innovative business concepts from initiation to management by developing insights about people and using those insights to create valuable user experiences that support business goals. He believes design can create high value for customers and organizations. Sang-Ho Lee has diverse experiences, working for DNS (Digital Network System) as a business development researcher, Dong-A Study Abroad Agency as a sales negotiator and project manager, and Korea Trade Center in Chicago as a business strategy specialist.
Irene Maria Chong is from Toronto, Canada, but has been living in Chicago since August 2005 pursuing graduate studies. She spent her undergraduate years at the University of Guelph, Ontario, and did a BSc Environmental, majoring in Environmental Economics. Prior coming to Chicago, Irene worked at the Design Exchange, a not-for-profit museum focused on promoting Canadian design and also spent a summer studying urban planning and design at the Harvard Graduate School of Design. Currently she is doing her Master of Design at the IIT Institute of Design, focused on human-centered design, and MBA at IIT Stuart School of Business. Irene likes to cook, and aspires to one day live, eat and work in healthy ways all at the same time.

Adaptive Urban Planning for Climate Change | ID589 | Systems Workshop | Fall 2006 | Ahn : Chong : Crimmin : Lee : Montgomery : Wilmot 20
Project Advisors
Charles L. Owen Distinguished Professor EmeritusIllinois Institute of Technology
John Pipino Adjunct ProfessorDoblin Inc.
Advisory Board
Samuel AssefaDeputy Commissioner for Urban Design & Planning,Department of Planning and DevelopmentCity of Chicago
Sadhu A. Johnston CommissionerDepartment of EnvironmentCity of Chicago
Kathleen Dickhut Assistant Commissioner Department of Planning and DevelopmentCity of Chicago
Preface

Adaptive Urban Planning for Climate Change | ID589 | Systems Workshop | Fall 2006 | Ahn : Chong : Crimmin : Lee : Montgomery : Wilmot 2�
Process overview This report provides considerations and advice for urban initiatives concerned with climate change. It is not in-tended as policy and planning guidance, although the pro-cesses and tools herein may provide useful in supporting such agendas.
This report supports a city’s initiative to adapt to climate change by providing a host of tools along with organiza-tional and communication competencies in order to as-sess, evaluate, develop, and amplify possible solutions their city may employ to reduce their vulnerability to the economic, social, and environmental effects of climate change.
This document takes for certain that the impact of climate change will continue to affect planning and development process for entire regions and municipalities. Critical to this effort are short and long term strategies for adapting, rather than purely mitigating the effects of climate change on an urban center. Already, cities across the world are adapting Kyoto protocol initiatives- even in countries that have refused to ratify the treaty on a national level.
This plan however, is contingent on a vital element. The development of a central location for data entry, sorting, reference, and retrieval.
Introduction

Adaptive Urban Planning for Climate Change | ID589 | Systems Workshop | Fall 2006 | Ahn : Chong : Crimmin : Lee : Montgomery : Wilmot 22
ClimateNet: Central to the successful management of information, the inclusion of this network is critical to the design of this process. ClimateNet represents an information sharing and organizational hub where cities can utilize tools and share information, and store data in a manner that interconnects the many levels of administration
This plan in comprised of 4 key process areas:
1. .Discover Threats & Consequences: This section represents organizational and partnership agendas critical to the success of a systemic design and development program.
2. Analyze Vulerabilities: New dynamic ranking tools are introduced here to evaluate a city’s vulner-abilities by scoring their capacities and infractructure in the face of climate change threats.
3. Solution Development: A host of suggested network and forecasting tools and processes that allow an organization to evaluate the holistic nature of suggested solutions.
4. Implementation Practices: Administration training and competency metrics that must be integral to an organizations functions for successful continuation of systems design programs.
The following pages represent solutions to be employed within the Network and each of the four categories. With each set of solutions, the context of Threat Discovery, Analysis, Solution Development and Evaluation, and Implementation are explored in the various areas across the many functions of an administration.
Presented as a suggested roadmap for the planning process, this report contains a range of suggestions that can be used in conjunction with other parts of the system, or alone according to specific needs.
Introduction

Adaptive Urban Planning for Climate Change | ID589 | Systems Workshop | Fall 2006 | Ahn : Chong : Crimmin : Lee : Montgomery : Wilmot 2�
DescriptionClimateNet is a suite of applications allowing users access to a wide array of tools and information. Us-ers include city hall planners and affiliates, climate experts, and the general public. It serves as the com-munications hub of the climate change initiative.
ClimateNet
System Elements
private sector
city hall
experts
challenge kit
Properties• Platform of co-created information and tools• Portal to the tools in the adaptive planning system, including Challenge Kit, CO2 Monitor, Partnerships and Alliances, Threat Matrix, ClimateWiki.• Accessible anywhere • Managed by Climate Change Group and its partner, the Advisory Committee.• Information center for climate data• Home base for city planners and affiliates
Features• Collection of living documents related to climate change• Shares information, challenges and solutions be-tween planners, scientists, inventors, and the general public• Links information through Challenge Kit and Solu-tion Validation• Adaptable education tool• Serves as central hub for city to monitor issues and progress• Connects cities and regions across globe through Partnerships and Alliances• Advanced searching and monitoring capabilities• Easy to locate information from a variety of sources• Links to useful external sites• Leverages wisdom of crowds through ClimateWiki and encourages social content

Adaptive Urban Planning for Climate Change | ID589 | Systems Workshop | Fall 2006 | Ahn : Chong : Crimmin : Lee : Montgomery : Wilmot 2�
System Elements
DiscussionClimateNet is a platform of co-created information and tools. It is a digital working environment used by city hall staff, affiliates, and the general public.
It contains a series of tools, applications and infor-mation portals relating to climate change. It is the home base for planners and their affiliates.
ClimateNet serves as the communication hub for the climate change initiative. The Climate Change Group downloads the Threat Matrix from Climate-Net, presents their problems as Challenge Kits, and respondents reply using SolutionKit. Their sub-missions are reviewed by the Advisory Committee (and others), and selected using the Solution Filter, which is a component of ClimateNet.
ClimateNet is the home of other specific tools such as the Idea Stockmarket, which allows city em-ployees to post and support a range of solutions that are reviewed by planners and policy makers.
ClimateWiki is also available on ClimateNet, which allows for user-generated content on the topic of climate change.
Households and companies can upload their per-sonal CO2 production data from Power Meter onto
ClimateNet, which compiles and publishes CO2 emission data.
ScenarioSam Johnson, a senior city planner in Chicago, would like to check on the status of the Challenge Kit he sent out earlier in the week. It posed the question of how the fire department could reduce water use during times of drought.
Sam opens his browser on his office computer and his homepage, ClimateNet, pops up. The computer recognizes him as the user, so he is already logged in. Sam clicks on Challenge Kit and two lists of challenges sorted by date populate the screen. One is the general pool of challenges and the other is a list of the challenges that he has outstanding. He notices that two entries have been submitted for review for his fire department challenge. Sam clicks on the first entry and a new window opens a pdf of the solution entry. The submission describes a new type of fire hydrant in both text and pictures. Sam can see from the creator’s rating that he has won a challenge before, and this idea seems prom-ising.
Sam selects the check box next to the solution and hits the “Solution Filter” button. The submission is electronically sent to his team, who is responsible for reviewing submissions.

Adaptive Urban Planning for Climate Change | ID589 | Systems Workshop | Fall 2006 | Ahn : Chong : Crimmin : Lee : Montgomery : Wilmot 25
System Elements
DescriptionA messaging email/PDA system that connects users with article and events of interest based on internet search and choice areas of interest.
Properties• Linked through ClimateNet to inform individuals on specific news and alerts• Network through member alliances and partners for information sources• Selection of alert types: For example - News, Policy, Climate Data, Planning Agendas.
Features• Text and Graphic based RSS feed to email account or hand held device.• Bi-Weekly delivery of information • Optional dedicated desktop porthole with scrolling text headlines
DiscussionThroughout the beginning of the 21st century, the topic of awareness building has blossomed as a first response to curbing human influences on Global Warming. For those who heed the advice of social and environmental advocates, the RSS Red Alert is a system that bolsters individual agendas by pro-viding specific information to those who are most affected. As a general awareness building tool, the RSS Red Alert can elevate the quality of discussion and debate among supporters and objectors.
Informed by Partnership and Alliances through the ClimateNet source site, RSS Red Alert constantly stays on the front line of leading topics, discus-sions, and discoveries of Climate Change, Sustain-ability, and best practices for cities and organiza-tions to move toward solutions to the effects of Climate Change.
This feature is the unique capacity that sets RSS Red Alert apart from other dashboard or RSS feed services. Since alerts feed from ClimateNet, the information is filtered by the city’s preferences, issues, and problem statements. Cities showing more involvement in the ClimateNet site are then privy to more accurate and directed feeds due to the ability of ClimateNet to filter specific informa-tion to city leaders and managers.
RSS Red Alert

Adaptive Urban Planning for Climate Change | ID589 | Systems Workshop | Fall 2006 | Ahn : Chong : Crimmin : Lee : Montgomery : Wilmot 26
System Elements
These bits of information feasibly range from gen-eral news items that inform debates through to net-work city solutions created in other locations that may apply to another city with similar threats.
ScenarioA national survey has rated your city as the worst performer in the face of energy challenges and threats posed by climate change. Lacking any clear leadership on the issues facing your city, you de-cide to become better informed and present a case for change at the next city council meeting. As a departmental manager however, you feel intimi-dated by the political ramifications and the need to compose a strong argument to back your case.
As part of your research, you find ClimateNet and through the primary research tools find that there are some cities involved in the network who match your cities characteristics and challenges. You want to learn more, but don’t have the time to dedi-cate to the in depth research across the multitude of areas that face your city. Much more, you don’t consider yourself an expert, and so the challenge of stepping into this realm of research is a bit over-whelming on its own merit! In searching ClimateNet, you see the announce-ment of the RSS Red Alert tool and decide to down-load the link. As you sign up for the service, you are surprised to find out the specificity to which the sign-up form provides you options related to your interests and your city. From the little bit of research you’ve done already, you adequately fill out several areas that you feel are important to your city and sign up for alerts related to WATER, TRANSPORTATION, and CASE STUDIES.
Immediately, you are verified and emailed a list of related tags and links that are related to your re-quests that already exist on the ClimateNet site. Subsequently, you are updated on a regular basis with environmental trends regarding water con-sumption and political forces affecting bio-fuels and alternative transportation regulation. There are also several economic arguments and forecast-ing models that make the case for transformation in the near term to avoid larger costs in the long term.
Most interesting to you however, are several case studies that you are directed to that outline the full process, challenges, and pressure that other cities have overcome in their quest to make positive envi-ronmental, social, and economic change in the face of climate change agendas. With this background and argument, you are informed and empowered to make a substantial case for your city to embark on several missions to improve their performance against climate change, and improve the poor per-formance ranking for the next annual survey.
You position your arguments referencing the sources from RSS Red Alert and ClimateNet, and provide a compelling case for your city to become an official member to the ClimateNet network of participating cities. Not only is this a first step in making your city better prepared to face the threats of climate change, but you are recognized as a first mover, and promoted to a new position as representative on the Climate Change Group that is comprised of other department leaders through-out the city who are also interested in making real progress.

Adaptive Urban Planning for Climate Change | ID589 | Systems Workshop | Fall 2006 | Ahn : Chong : Crimmin : Lee : Montgomery : Wilmot 2�
System Elements
DescriptionAn information storage and referral system that em-powers the public to act as “eyes and ears” for iden-tifying areas of the city that may be more vulnerable than others in the face of escalating climate change threats.
Properties• Network with existing city reporting systems for non-emergency calls• Online public forum• “Tagging” compilations for requests of similar type for evaluative purposes
Features• Counter: IT solution for calculating calls and hits• Simple Graphic interface for tallying location of call origination and observation
DiscussionHELP! is an tracking tool that provides data for solution development when assessing the capacity of city infrastructure to handle the threats and con-sequences of climate change.
Intended to capitalize on existing links and ser-vices between the public and city hall, HELP! is a coding solution. In a larger urban system where non-emergency call centers accept a range of com-plaints, HELP! leverages that volume as informa-tion through two key attributes of the service. First, by tracing the general source of a call, HELP! can provide ranking data on geographic locations that produce the most calls. This likely could be orga-nized by zip code or neighborhood. Secondly, a coding option would exist for help center represen-tatives to key in a “category code” following the transfer extension. This would simply be captured as a ranking.
The goal of such a system would be to act as a user-based input system that is blind to the user, requiring no extra effort.
A second method of information cataloguing and retrieval would be through an online forum where the public could post observations, complaints, and
HELP!

Adaptive Urban Planning for Climate Change | ID589 | Systems Workshop | Fall 2006 | Ahn : Chong : Crimmin : Lee : Montgomery : Wilmot 28
suggestions for infrastructure performance or im-provements.
Online requests would also follow the same “cod-ing” process through a questionnaire which would allow sorting at the central database. As an regu-lar process, the city administration could access HELP! to validate improvements against public opinion. Likewise, they could use this informa-tion as insights to areas that may be vulnerable to certain threats, and adjust planning measures ac-cordingly.
Scenario: In some cities, the effects of climate change will be observed through heavier and more intense peri-ods of rainfall. Initially, this adjustment to weather patters may seem trivial. But from a city planner and management perspective, dealing with large volumes of runoff from streets, roofs, and park-ing lots can pose a significant challenge with just a relatively small amount of inch/hour rainfall in-crease.
As it stands, Judy lives in an area that has been prone to flooding. Over the past fifteen years that she has lived in her house, the basement has flood-ed on average once every other year, with the past five years proving to be more frequent. Although her location is outside of a 100-year flood plain, her insurance has refused to cover damages in full, and her premium has risen due to risk of the past years flooding trends.
This past summer, her basement flooded twice. She has attended neighborhood meetings and learned that her friends and neighbors in the area have also
been dealing with the same issues. Clearly some-thing needs to be done.
Climate change effects are likely to get worse, not better. Judy decides to go directly to city hall and find out what she can do. There, department offi-cials tell her about HELP! Judy can have her voice heard in a virtual petition by having her friends call and email the HELP! network.
She emails the link to her friends and tells her neighbors about the site as well. A painless pro-cess, they simply log on to the site, enter their gen-eral area and voice the issue. In this case, Judy goes to the HELP! site, types in her zip code and checks a box called “FLOODING”.
This information is a “shout” of sorts for the city to recognize issue hot spots in the city. With the eventual collection of similar requests from all of Judy’s neighbors and friends who have witnessed the degree of flooding in Judy’s home, a petition like effect takes place. The city can utilize this data in planning for infrastructure updates or overhauls. Similarly, the city can begin to valuate systemic vulnerabilities to different consequences brought on by climate change. If the city is currently show-ing signs of strain under the pressure of heavy rain, they can forecast that the future is only going to get worse, and significant investment should be af-forded to innovations in rain water handling.
In Judy’s case, her use of HELP! was instrumental in having her neighborhood move up in priority for the next WaterWork project to reduce just the type of flooding she had been experiencing.
System Elements

Adaptive Urban Planning for Climate Change | ID589 | Systems Workshop | Fall 2006 | Ahn : Chong : Crimmin : Lee : Montgomery : Wilmot 29
Climate Change Group
DescriptionClimate Change Group is a committee of city em-ployees from nearly department in the city that acts as a clearinghouse and maintains focus within each city department to deal with adaptivity to climate change.
Properties• Member representatives for individual depart-ments to plan climate adaptation strategies for the city
Features• Facilitates discussion and generation of ideas to maintain focus of adaptive process• Meets with and manages interaction with Advi-sory Committee• Manages the ClimateNet
DiscussionThe Climate Change (C2) Group is an interde-partmental committee with members from every department within the city. The formation of this group is based on the success of an existing group within the city – the Green Building Task Force.
The consequences of global climate change will be so far reaching and extensive that it requires a strong oversight committee to effectively manage all the related activities within the city. Equally important, nearly every level of city operations must incorporate a great many changes. Some of these changes are evolutionary in nature, but many of the changes are revolutionary and require the support of a strong oversight committee to insure that all employees buy into the plan.
System Elements

Adaptive Urban Planning for Climate Change | ID589 | Systems Workshop | Fall 2006 | Ahn : Chong : Crimmin : Lee : Montgomery : Wilmot �0
System Elements
Because the city of Chicago has already exhibited such strong leadership in its effort to green the city, the Climate Change Group is a natural evolution of those previous efforts. It is a natural extension of the existing focus groups and task forces to ad-dress issues such as green buildings, green roofs, urban forestry, private sector incentives, transit, and many more. It is only natural that Chicago would once again be an early adopter of planning strategies that acknowledge the realities of climate change and that its effects are already occurring. The C2 Group will help Chicago grow from the greenest city in the country to the greenest city in the world and will ensure that Chicago acts as a model to help others cities do as well.
Monthly meetings of the group are devoted to re-viewing progress and looking ahead to anticipate potential problems or areas that deserve special fo-cus. Each member reports to the Group concern-ing the activities within his department and works with other Group members for needed support or in-kind services. With a city the size of Chicago, with the very many services that the city must provide to its citizens, and with the very complex problems associated with climate change, it is vital that the Climate Change Group makes coordina-tion a strong focus of its activity.
In addition to its monthly meetings that focus on keeping routine adaptive planning activities on track, the C2 Group devotes much of its effort to the adoption and annual revision of a citywide Adaptivity Agenda, modeled after the city’s highly successful Environmental Action Agenda.
To make this difficult process more manageable, the Climate Change Group identifies special areas of focus that need the formation of a special ad hoc committee or task force to address specific items that require attention. To accomplish this, the C2 Group relies on the analysis generated by the Threat Prioritization Matrix to identify those de-partments and agencies that should form a special team to deal with a specific issue. The subcommit-tees meet as needed to address the issues common to those agencies and then report their findings to the C2 Group.
As the work of the C2 Group progresses and poten-tial solutions to threat consequences develop, this data is posted to the ClimateNet that the C2Group is charged with managing. For those threats that do not have a readily discernable solution, the C2 Group will post a ChallengeKit to ClimateNet so-liciting help in resolving those problems. For both potential solutions posted and for ChallengeKit problems, the public ad other concerned experts have access through the ClimateNet to offer solu-tions or improvements to solutions.
By coordinating all the activities relating to Chi-cago’s climate change adaptivity strategies, the Climate Change Group maintains the proper com-mitment level throughout the city. For a city the size of Chicago, the tendency to develop a large bureaucracy is almost unavoidable. The Climate Change Group makes handling that bureaucracy manageable.

Adaptive Urban Planning for Climate Change | ID589 | Systems Workshop | Fall 2006 | Ahn : Chong : Crimmin : Lee : Montgomery : Wilmot ��
System Elements
ScenarioMayor Daley just announced Chicago’s Adaptiv-ity Agenda in a major public event at Daley Plaza. Yoo-Jung was a big part of making that happen. She joined the Department of Environment two years ago and has been a very active member of the Climate Change Group from the beginning.
The work of the Climate Change (C2) Group was initially performed by the Green Building Task force, since it was already in place and seemed to be dealing with many of the same issues. Within just a few months, the Green Building Task Force was being overwhelmed by work associated with climate change and it became quickly obvious that the Task Force was much too small.
The Climate Change Group was formed to address this growing list of interdepartmental activities for the city. Also, the size of the committee grew to in-clude a representative from every city department and sister-agency – much larger than the Green Building task Force is.
One of the first tasks for the C2 Group was to get that large group of representatives together and develop the initial draft of the Agenda. It was considerably different from the final version just announced by the Mayor, but you could still see the framework of that initial work in the published Agenda.
After that first outline, the C2 Group began work to form the Advisory Committee. In addition to the local volunteer CEO’s on the Committee, Yoo-
Jung worked hard to ensure that the city contracted with internationally renowned experts to join the Advisory Committee as well. The C2 Group had worked closely with Committee members Janine Benyus and James Hansen in those early months to ensure that the C2 Group had a good foundation for its challenging work.
After the first few meetings of the full C2 Group, they began analyzing the threats ahead using the Threat Prioritization Matrix to understand which departments should form smaller subcommittees and task forces to deal with each potential threat. Those task force meetings were much more man-ageable and allowed members to work more quick-ly to generate potential solutions that were then vetted at the full C2 Group meetings and reviewed by the Advisory Committee.
The C2 Group work and its process proved success-ful based on the policy evident in the Adaptation Agenda. The Agenda that Mayor Daley proudly presented that day clearly identified the entire car-bon footprint for the city of Chicago – both public and private sectors. It also laid out a plan for both short-term and long-term strategies to reach the goal of a completely carbon-neutral city. It was not going to be easy, but the work of the C2 Group as shown in the Agenda made it obvious that the goal was attainable – and made it clear just why that goal had to be met. Yoo-Jung also took great pride that day knowing the part she had played in helping the city take a great step forward in ap-proaching this goal.

Adaptive Urban Planning for Climate Change | ID589 | Systems Workshop | Fall 2006 | Ahn : Chong : Crimmin : Lee : Montgomery : Wilmot �2
Advisory Committee
DescriptionAn association which consists of various experts, concerned with decision-making of city’s environ-mental policy and gives professional advice with expert knowledge to the city’s commissioners and to the Climate Change Group. They are not public officers but exercise an essential influence on the city’s important policy decision regarding envi-ronmental problems.
Properties• An advisory association which affects city’s en-vironmental programs and policy decisions• A group of people who have professional knowl-edge regarding environment problems• They consist of ecologists, scientists, professors, CEOs, and environmental consultants
Features• Concerned with city's environmental policy de-cision• Provides expert knowledge/advice to commis-sioners and the Climate Change Group• Holds regular conference with various experts and city officers• Studies and researches environmental issues• Communicates with other experts out of the city or country• Promotes awareness of the dangers caused by en-vironmental disruption
DiscussionAlthough the city of Chicago has a Department of Environment, it is impossible for that department alone to predict and prepare for every upcoming problem related to environmental issues. Many problems require high-level expert knowledge and in-depth analysis. To solve these problems, the city organization must utilize people who deal with advanced research and study about the issues, pro-vide expert knowledge, and help to decide policies or standards regarding the environmental issues.
The Advisory Committee is an association com-posed of prominent experts who have specialized knowledge about energy use, pollution, recycling, green city planning, etc. Also volunteer CEOs and citizen representatives are included.
The Advisory Committee will take on a wide va-riety of tasks all varying in depth. The main duty is to focus on upcoming city environmental policy. All recommendations will be deliberated and can be appropriately decided by those with the knowl-edge for a correct course of action. The Advisory Committee can also be used as a resource that can be called upon regarding environmental issues. Having a group of experts in the environmental field can be utilized in by many different offices, including the Mayors office, building commis-sions, Police and Fire Departments, as well as zon-ing commissions. The Advisory Committee will
System Elements

Adaptive Urban Planning for Climate Change | ID589 | Systems Workshop | Fall 2006 | Ahn : Chong : Crimmin : Lee : Montgomery : Wilmot ��
System Elements
be an on-going entity that will conduct research, and be able to compile data for comparison nation-ally.
The Advisory Committee will help guide the Cli-mate Change Group in communicating with the media, as well as other experts throughout the world.
Another major responsibility of the committee is to promote and raise awareness of environmental concerns. By having a united group of experts and local business leaders, the city will earn respect from the public as well as other cities and nations. This will show that the city has the environment as a priority and citizens should follow in order.
ScenarioThe city of Chicago has decided to create an Ad-visory Committee to aid city policy when environ-mental issues are concerned. The group will be headed by the new chairman of the committee, John Lee. John Lee has assembled a team of experts from a number of disciplines, including chemical engineering, ecology, green architecture, etc. He has also assembled a “green team” with natural and renewable resource experts and recycling experts.The team’s first task is to adopt a new sustainable energy source. Mr. Lee chooses to research many different possible energy sources. Through com-munication with other large cities worldwide, he

Adaptive Urban Planning for Climate Change | ID589 | Systems Workshop | Fall 2006 | Ahn : Chong : Crimmin : Lee : Montgomery : Wilmot ��
is able to gather a great deal of data on all avail-able energy sources. Through cross analysis, Mr. Lee is able to focus his choices to several viable sources, including Bio-fuel, Solar Heat, and Wind Power. The committee has been comprised of not only experts, but also business executives, repre-sentatives of NGOs, and citizens. A well rounded discussion ensues concerning the decision making, in attempting to select the appropriate fuel.
The experts involved in the creation of this initia-tive of sustainable energy sources are integral in briefing, not only the Mayor’s office and city of-ficials, but also the media and by extension, the public. Because of the group that John Lee has assembled, the final decision that was reached is under less scrutiny.
The advisory committee also must secure appro-priate funding from the city and state governments. Mr. Lee must go before the budget office to state his case for funding, and is able to gain sufficient funding for his project.
Once the final decision is made, the advisory com-mittee assists in investigating the manufacturers responsible for Chicago’s energy infrastructure. Under the watchful eye of Mr. Lee, the commit-tee has advised to reduce the dependency on fossil fuel by using wind power. There is research that must be done on wind power suppliers, windmill
contractors and operators. Not only will experts in this type of energy be useful, but the business executives have extensive experience in this selec-tion and negotiation.
Through discussion with other cities promoting wind, such as Palm Springs California, a quality developer is located. Once building has begun, the advisory committee shifts its focus from deci-sion making to one of its other main duties. That is the duty of promotion and increase of awareness of environmental concerns and disruptions. By mak-ing the public and other governmental departments aware of environmental concerns, the process of gaining funding and public approval in the future will be easier. Mr. Lee also makes it a priority for his team to interact with the public to educate the youth on the benefits of renewable resources and environmental issues.
By creating a system of wind power, Mr. Lee and the advisory committee are able to lay the groundwork for a fully sustainable energy system for Chicago. Through the decrease in fossil fuel dependence, and the development of renewable sources, the ad-visory committee is working towards a cleaner and more responsible city for future generations.
System Elements

Adaptive Urban Planning for Climate Change | ID589 | Systems Workshop | Fall 2006 | Ahn : Chong : Crimmin : Lee : Montgomery : Wilmot �5
System Elements
DescriptionA wiki-based section of ClimateNet that allows for user-generated content related to climate change. The critical difference from a typical wiki is the requirement that the author uses his or her real name.
Properties• User generated content section of ClimateNet• Requires authors to use real names, which is traceable• Searchable• Indexed• Provides for links to outside network
Features• Encourages participation and generation of vast amounts of information• Extremely inexpensive to implement and main-tain• Encourages multi-lingual content• Easy to locate information across multiple fields• Promotes more trustable information due to use of real names• Allows database to cover many issues quickly• Leverages wisdom of crowds• Allows users to link to useful information outside of network
Climate Wiki

Adaptive Urban Planning for Climate Change | ID589 | Systems Workshop | Fall 2006 | Ahn : Chong : Crimmin : Lee : Montgomery : Wilmot �6
System Elements
ScenarioMargaret Shu is an ornithologist in Maine. She tracks the migratory pattern of birds on the islands off the Maine coast.
Early in April, Margaret spots a species that has never lived in Maine. She photographs the bird, notes its behavior, appearance and location, and heads home to share her findings.
Once home, Margaret logs onto ClimateNet’s Cli-mateWiki and clicks on the “biodiversity” tab. She creates a new section dedicated to the her spotting the new species and populates the section with her newly discovered data. She presses “save” and ex-its the page.
Instantly her findings are shared throughout the world.
DiscussionBecause climate change is such a large topic that is continuously evolving, understanding it over time will require a multitude of people working in con-cert.
ClimateWiki allows for users of ClimateNet to contribute to the base of knowledge about cli-mate change on an ongoing basis. Rather than relying on webhosts to update sites, ClimateWiki is built to encourage participation from anybody who is interested in and knowledgeable about cli-mate change. Leveraging the wisdom of crowds to adapt to climate change makes especially good sense given the complexity and evolving nature of global warming.
Registration requires authors to use real names to better ensure accuracy of reports and information.

Adaptive Urban Planning for Climate Change | ID589 | Systems Workshop | Fall 2006 | Ahn : Chong : Crimmin : Lee : Montgomery : Wilmot ��
System Elements
DescriptionCityLink Solution is a tool to search possible solu-tions from other cities which have similar threats. If one city suffers with hotter and drier climate, there must some cities have same problems. But it is not easy to share knowledge or solutions because there is no place to consolidate all the information. CityLink Solution provides not only a simple map-ping tool to search the city groups that have simi-lar threats, but well organized information such as detailed city information, and solution description. In addition, CityLink Solution provides a function to compare one city to others in terms of general city information, threats and solutions.
Properties• Web-based searching tool• A tool to provide information• A tool to categorize city groups
Features• Identify cities that have similar climate threats• Provide simple and efficient searching system• Provide general information of cities• Provide threat description to cities• Provide solutions to cities• Share knowledge or processes with other people• Compare one city to the otherDiscussionWith an information-oriented society, most in-formation is available on the internet. Climate change planners could search hours and hours to
CityLink Solution
Threat Mapping City Infor
Water
Population
Food
Transprota-
tion
Threats : Hotter & WetterCurrently, over 1 billion people on the planet
do not have regular access to fresh water.
About twice that number, 2.4 billion people,
lack adequate sanitation. Water-related dis-
eases, that are preventable, kill one child every
eight seconds, and are responsible for 80%
of all illnesses and deaths in the developing
world. See June 5, 2003 UN Press Release
Out of all the water on this planet, only 2.5%
of it is freshwater. Most of the 2.5% is derived
from glaciers and permanent snow cover. See
UNESCO Study Solutions
Solutions : Rainwater On the Harvard
Law School
campus, Robert
France, associate
professor of land-
scape ecology at
the Design School,
looks at ways
that rainwater
can be used in
a more efficient
way through
building and
landscape design.
Rainwater
Under-
ground
Water
recycle
Reservoir
City Comparision
Threats & Solution

Adaptive Urban Planning for Climate Change | ID589 | Systems Workshop | Fall 2006 | Ahn : Chong : Crimmin : Lee : Montgomery : Wilmot �8
System Elementstheir own. Solutions are listed in terms of detailed descriptions of solutions and implementation pro-cesses. This tells managers how solutions are initi-ated and implemented. Project managers can adapt the solutions to their own cities’ capabilities, cul-ture, and public awareness.
After search all the cities, managers can compare one city to others in terms of general information, threats and solutions to prioritize best-suited solu-tions for their cities.
ScenarioJinho is a project manager in Korean Climate Change Adaptation. Recently, his country started a project to adapt to climate changes. His team is in charge of finding solutions for sufficient wa-ter resources. He visited CityLink Solution and typed ‘Insufficient Water’ on the search engine. The display screen showed cities which have the same threats as Korea. He clicked Japan. He could see all the general information about Tokyo. He thought Tokyo has lot of similar capabilities, cul-ture and public awareness to Seoul. He clicked ‘Threat vs. Solution’ button and could see how the threat become serious and how it was different from Seoul. Tokyo plans to develop underground water resources as a solution. Jinho could see all the information that how Tokyo initiated the proj-ect such as finance, information, technology and human resources, and how Tokyo implemented it. Jinho understands what and how to develop under-ground water resources, and adds more ideas to improve the solutions.
find climate change solutions on the internet, but it is hard to say they have all the information they need. In addition, visiting many website is not pro-ductive and is time consuming. CityLink Solution provides not only a simple mapping tool to search the city groups that have similar threats, but well organized information such as detailed city infor-mation, and solution description. In addition, City-Link Solution provides a function to compare one city to others in terms of general city information, threats and solutions.
Threat Mapping is a search tool to find a city group that suffers similar threats. Threat Mapping is an Important tool in CityLink Solution because it nar-rows down cities from hundreds to about twenty.
CityInfor provides all the cities’ general informa-tion, listed as demographics, culture, location, energy, weather, health care, transportation and etc. To adapt other cities’ solutions, it is critical to understand them; even thought one city has the same threats as others, it doesn’t mean they would have same solutions due to different city capabili-ties, culture or public awareness to implement so-lutions.
Threat vs. Solution is the main information that project managers need. It starts with a short de-scription of major threats and solutions. By click-ing the threats, managers can see the detailed infor-mation of threats. Threats are listed in the general order of magnitude of threat. The goal is for man-agers to fully understand how threats become seri-ous in their own city and in those different from
Adaptive Urban Planning for Climate Change | ID589 | Systems Workshop | Fall 2006 | Ahn : Chong : Crimmin : Lee : Montgomery : Wilmot �9
Threat Prioritization Matrix
DescriptionA sorting matrix that performs various organization-al level evaluations against climate change threats. Using inputs to determine Climate Change related threats, this matrix values those threats against de-partment functions.
Properties• A sorting Matrix based in a spreadsheet program• Downloadable from server, or used in conjunc-tion with other input tools• Accessible by many parties for information shar-ing• Inputs are tallied to weigh Departmental vulner-abilities against climate change factors
Features• Primary “Department Level” input screen• Secondary “City Level” evaluation screen• Ranking inputs from 1-10 (least - most vulnerable)• Color coded “Red, Orange, Green” fields according to threat levels
DiscussionOrganization of information is a compelling chal-lenge in an organization’s capacity to develop strategies. A similar challenge is how to efficiently utilize that information in order to drive discovery and insight as competitive advantage.
Similarly, in the quest to adapt to climate change, a certain amount of foresight must be generated in
order to understand vulnerabilities and the conse-quences of those vulnerabilities on a greater scale. In some cases this calls for preventative measures to be taken well in advance, whereas other solu-tions may be more straightforward and relatively simple.
But how does an organization balance its operations against threats as widespread as Climate Change?
The organization of threats and vulnerabilities re-lies on three key factors for evaluation:
1. Living DocumentA necessary practice in establishing accuracy in data delivery is to ensure complete and current in-puts. A challenge to most organizations, this tactic requires a dedication by familiar voices to evaluate fluctuations in threats or enterprise performance.
2. Accurate Diagnostic InputsAs the effects and likely impacts of Climate Change become more clear, there will consistently evolve new insights, data, and threats not originally con-ceived. These fluctuations and changes need to inform the organization by representing the most current information available.
3. Accurate Evaluative InputsJust as the threats require regular update, so too does the performance of the organization against these threats need to receive regular attention. As
System Elements

Adaptive Urban Planning for Climate Change | ID589 | Systems Workshop | Fall 2006 | Ahn : Chong : Crimmin : Lee : Montgomery : Wilmot �0
departments adopt different practices, they need to account for the nature of the change when weighed against the threats of climate change.
Scenario: An administration sees the need to develop a ho-listic evaluation of its operations and functions in accordance to the threats posed by climate change. This may require infrastructure changes, it may require phase out scenarios, or it may require pre-ventative solutions development. But how does a large organization identify where and at what mea-sure to fund and initiate such tasks?
Evaluating entire cities vulnerability can be a daunt-ing task. However, the Threat Prioritization Matrix makes this task fairly straightforward to complete. This design represents a “plug & play” solution that can be easily installed and updated through in-ternet preferences. Evaluations take place within each department and are then entered into a larger framework in order to optimize City wide efforts to adapt to the effects of climate change.
Enter Threats and Consequences:A first step in maximizing the utility of this tool is to accurately capture the consequences of climate change factors to your city.
Department Level Evaluation:The department director is responsible for the in-tensive initial task of filling out the matrix to value the functions of his department against the likely conditions that will accompany the effects of Cli-mate Change. This is a living document, so as threats and challenges shift, the matrix can be up-dated to represent the current state of the art within
each department.
City-wide Evaluation:Once the department’s information and valuations are tallied, it is saved and compiled in a central lo-cation with all the other city’s evaluations. A larg-er, second tier matrix represents an entire city and the departments within that city as they have been scored in the previous exercise.
By compiling all department rankings in one cen-tral matrix, evaluations by threat allow the program to “sort” by identifying and grouping those depart-ments most affected by a particular threat.
In this example, WATER SCARCITY is the threat, and four departments rank as “HIGHLY VUL-NERABLE”. The Threat Prioritization Matrix identifies those department representatives, and al-lows a concentrated effort in the development of design strategies and constraints. By introducing multiple departments to the scenario, solutions can be generated that benefit multiple stakeholders and maximizes return on investment across a triple bot-tom line
This method of evaluation streamlines solution development by allowing the right people from the most affected departments to gather and focus on specific topics and solutions that can be imple-mented in their regular planning activities.
System Elements

Adaptive Urban Planning for Climate Change | ID589 | Systems Workshop | Fall 2006 | Ahn : Chong : Crimmin : Lee : Montgomery : Wilmot ��
System Elements
10 10 10 9 8 8 8 7 7 7 6 7 6
10 10 9 9 8 8 7 6 7 7 7 6 6
10 9 9 9 7 7 7 6 7 6 6 5 6
10 9 9 9 8 7 6 5 7 6 6 5 6
10 9 9 9 8 7 6 5 6 7 6 6 5
9 9 8 8 7 6 5 5 6 6 6 6 6
9 9 8 8 7 7 6 5 6 5 6 5 5
9 8 7 7 7 7 6 4 6 6 6 5 6
Dept
. of S
treet
s & S
anita
tion
Dept
. Wat
er M
anag
emen
t
Fire
Dep
artm
ent
Dept
. of B
uild
ings
Dept
. of P
lann
ing
Dept
. of H
ealth
Dept
. of H
ousi
ngDe
pt. o
f Env
ironm
ent
Water Scarcity
24” Lake Level Drop
Flooding
Urban Heat Island Effects
Heat Related Deaths
Heat Waves
Extended Electrical Peaks
Population Increase
Dept
. of T
rans
port
atio
n
Dept
. of Z
onin
gDe
pt. o
f Em
erge
ncy M
anag
emen
t
Dept
. of H
uman
Ser
vices
Dept
. of C
onst
ruct
ion
& Pe
rmits

Adaptive Urban Planning for Climate Change | ID589 | Systems Workshop | Fall 2006 | Ahn : Chong : Crimmin : Lee : Montgomery : Wilmot �2
System Elements
DescriptionAn tool that allows national or international stand-ings based on vulnerabilities to the threats and con-sequences anticipated by Climate Change.
A mapping solution available in common software that allows information to be easily understood. Moreover, inputs are easy to adjust, add, or modify given the nature of change required by the organiza-tion.
Properties• Rose or Spider graphing techniques associated with spreadsheet programs• Downloadable from server, or used in conjunc-tion with other input tools• Accessible by many parties for information sharing• Multiple city comparison capabilities• Scalable as additional threats or performance metrics are required for monitoring
Features• Color coded threat points• Historical tracking by shading improvement zones• Real time dynamic updates from multiple input channels
DiscussionYou can’t fight the enemy if you don’t know where he is. This is the underlying premise for the devel-opment of this performance measurement tool. By evaluating a city’s geography, growth, infrastruc-ture, and consumption trends,
In staging a proper response to the specific threats Climate Change poses to a city structure, the state of the city must first be recorded and examined. Performance Web is a way of compiling already available, but disparate sources of information, in a manner that is easy to comprehend and evaluate.
Specifically, Performance Web allows a macro view of a city’s performance against the variety of risks and ecosystem crises connected to climate change. Performance Web plots a performance rating of the city against these threats. Shown as a rose, or spider graph, this chart not only allows a snapshot of a single city’s vulnerabilities to the threats and consequences of climate change, but also provides a vehicle for performance comparison with mul-tiple cities who are facing similar threats and con-sequences.
As a recording process, Performance Web allows an organization to evaluate performance measures from year to year - marking improvements or ne-
Performance Web

Adaptive Urban Planning for Climate Change | ID589 | Systems Workshop | Fall 2006 | Ahn : Chong : Crimmin : Lee : Montgomery : Wilmot ��
System Elements
gating gains that previous accomplishments may have delivered. Ultimately, the goal of attaining Net-Zero process is easily identified as the “bulls eye” of the chart - and an organizations processes are constantly striving toward that goal.
Scenario: This tool operates with the understanding that adapting to climate change is an ongoing process, and not a procedure. There are two preceding re-quirements necessary for this tool to be used ac-curately: 1) evaluation of threats and the conse-quences of those threats to an organization related to climate change, and 2) a comprehensive rating of the organizations functions as they may be af-fected by those threats. (See Threat Matrix)
Initiated by a Commission level authority or by the Climate Change Group, Performance Web would run analysis of the current annual standings of the city against threats such as water scarcity, heat waves, energy production, pollution, biodiversity loss, etc. For this scenario, the City of Portland has run the Performance Web, and has found that it is particularly vulnerable to the effects of increased heavy snowfall.
As a first step, this informs Portland officials of the severity of the threat. Moreover, by utilizing the comparison utility of this tool, Portland can evalu-
Water ScarcityFood Shortages
Flooding
Island Effects
Heat Related Deaths
Heat Waves
Electrical PeaksPopulation Increase
�995 2005
co2 regulation
Drought
Pollution Control
20�5 goal

Adaptive Urban Planning for Climate Change | ID589 | Systems Workshop | Fall 2006 | Ahn : Chong : Crimmin : Lee : Montgomery : Wilmot ��
System Elements
ate it’s performance ranking against heavy snow-fall with other cities who may also be particularly vulnerable to this specific threat. Networking in this manner allows for more robust solutions gen-eration as the different actors involved will likely have unique perspectives on problem solving.
In this case, Portland has found some interesting agendas already underway in London and Seattle - where winter climes have shown increasing snow-fall over the past decade.
After developing some solutions to deal with this issue, the programs are put into testing and proto-typing by the City of Portland. As a performance measurement, Portland’s capacity to handle the next series of heavy snowfalls are rated and ranked by the officials involved. This new ranking is re-corded in the Performance Web, and the overall standing against the threat is updated.
With the new measures and procedures in place, Portland has seen a reduction in traffic conges-tion, better public awareness communications, and less structural damage due to standing snow loads. These improvements are recorded as a net gain in the City’s ability to deal with heavy snowfall, and the rating is moved “upward” from a “7” to a “5”, and that historical ranking improvement serves as a model for recording progress toward that specific threat.
The Performance Web allows for this type of sce-nario to be run across multiple departments and against multiple threats - allowing multiple agen-das to be performed simultaneously, and for the impacts of those agendas to be valuated against other department functions and solutions for over-all progress reporting.

Adaptive Urban Planning for Climate Change | ID589 | Systems Workshop | Fall 2006 | Ahn : Chong : Crimmin : Lee : Montgomery : Wilmot �5
CO2 Monitor
DescriptionA dynamic information display tool that sorts and displays carbon contributions from macro (Coun-try, State, Region) to micro (city, industry, process) level.
Properties• Monitors past and present rates of CO2 produc-tion• “War Games” simulation options • Historical data display for CO2 reduction plan-ning• National, Industry, and Sector level information levels
Features• Main screen feed for overall CO2 output monitor-ing• Sub panels for detailed information regarding specific activities• Historical monitoring capabilities for progress evaluation• Provides reports per department for their activi-ties and areas for improvement• Provides track record of cause & effect relation-ship between improvement tactics and realized re-turn on investment• Allows different levels of access for different de-partments requiring informationDiscussionAdaptive urban planning for Climate Change is a process focused on the mitigation and adaptation means necessary for urban centers to plan for the likely effects of climate change.
Given current scientific majority opinion and trends of climate change factors, enterprise is quickly re-alizing the need to consider these factors in their planning strategies. City planners are especially interested in these trends given the scale and poten-tially large scale effect climate change can have on a dense urban population.
In the adaptive planning process, the need to un-derstand the state of the art precedes any action. This proposed solution allows for CO2 Monitoring in real time that allows a visual comparison of real data for the continuous reduction of CO2 emissions as a contributor to climate change.
System Elements
Level 1: General Information Level 2: Historical Performance Level 3: Speci c Performance Tracking

Adaptive Urban Planning for Climate Change | ID589 | Systems Workshop | Fall 2006 | Ahn : Chong : Crimmin : Lee : Montgomery : Wilmot �6
This tool is best used as a supporting agent with all future planning agendas. In the example shown, data is revealed from macro to micro level instruc-tion. Having compiled a range of carbon contribu-tions using inputs from the Carbon Footprint Kit, this database allows a visual comparison of targets for future reduction.
Although this could be utilized and referenced by any computer in a network, the full effect of this tool could be seen best at the Joint Operations Cen-ter (JOC). The purpose of this tool is to provide an easy to understand, easy to monitor interface that conveys complex information in a simple manner.
Using carbon output data as initial inputs, visual identification of worst violators and fluctuating contributors can easily be identified and traced. Should the user need to identify more specific in-formation regarding a sector, the CO2 Monitor tool can organize by filters to provide in depth, specific information on an as needed basis.
Parallel with supporting proactive agendas, the de-tection tool can also support RSS Red Alert tool by sending high alerts when any performance metric exceeds an acceptable threshold when compared with performance level benchmarks. Likewise, the CO2 Monitor tool would dynamically update information on the Threat Prioritization Matrix which analyzes a wider range of threats facing a city structure. In this case short, midterm, and lon-ger range outlooks would serve to inform policy and directives given a city center’s ability to act, or need to temporarily offset carbon emissions with the purchase of Carbon Credits or similar trading schemes.
Scenario: From the control room: This tool is launched as a small group of department leaders choose to tackle yet another step toward CO2 emission reduction. Making their job easier in the order of magnitudes, they quickly leverage the capacity of this detection and development program to access real-time in-formation in order to provide accurate monitoring of CO2 emissions by output source.
Data contributions range from national historical averages to specific industry sectors for more ho-listic solutions development. The detection tool is accessed in order to provide in-depth information regarding the real estate sector contribution of CO2 output for Chicago. By accessing information on an increasing level of detail, the team can quickly see that within the real estate sector, the biggest contributor to green house gases is not commer-cial, but residential building sources. From this information, the accuracy of action agendas can be validated by addressing poor performance areas specific to the residential sector.The city team leverages this information to then develop suggestions through the Threat Prioritiza-tion Matrix for what measures the Department of Buildings, Department of Planning. Department of Construction and Permits, and other associated groups may employ to reduce CO2 emissions.
System Elements

Adaptive Urban Planning for Climate Change | ID589 | Systems Workshop | Fall 2006 | Ahn : Chong : Crimmin : Lee : Montgomery : Wilmot ��
System Elements
DescriptionA tractor-trailer sized, analysis and display unit for simulation of environmental scenarios.
Properties• A custom trailer with high definition video screens and sophisticated computer simulation equipment.• A simulation tool for city planners to analyze various adaptation strategies and evaluate their ap-plicability.• A virtual reality simulator.
Features• Provides space and equipment for joint operations analysis of climatological and urban planning sce-narios• Provides education to the public through virtual re-ality generation.
DiscussionThe C2 (Climate Change) Simulator is a portable, tractor-trailer sized unit. It has two primary func-tions. First it functions as a research, training and operational center for detailed analysis by spe-cialists working with the Climate Change Group. Second, it travels throughout the city or region, for public education and dissemination of detailed in-formation about the climate change issue.
In the first mode it is connected to the Joint Op-erations Center (JOC) to provide supplementary support for detailed analysis of both on-going monitoring of a diverse range of city functions and simulations of adaptation strategies. Parked at the JOC location and fully connected to the citywide monitoring and control center, the C2 Simulator provides a conference facility that allows a very broad range of analysis operations at an extremely detailed level.
Its second primary function is for public educa-tion and specifically to effect widespread change in public perceptions and attitudes surrounding the climate change issue. In order to accomplish this, it must make a compelling case for the very real dangers we already face. It must make an equally compelling case that there are reasonable and at-tainable solutions to the problem. And finally, it is
C2 Simulator

Adaptive Urban Planning for Climate Change | ID589 | Systems Workshop | Fall 2006 | Ahn : Chong : Crimmin : Lee : Montgomery : Wilmot �8
System Elements
intended to personalize this experience to the larg-est extent possible.
Virtual reality simulation has a long history. With attractions like the Universal Studios’ Amazing Adventures of Spiderman, many Americans are familiar with the compelling reality created today by computers and video screens. Similar technolo-gies have been used for decades in flight training simulators and similar military applications, like NASA’s virtual landscapes projected on multiple screens giving a 180-degree view. Much simpler simulators, running fixed video synchronized to the movement of a ‘cabin’, have been available at funfairs throughout the country. These rides are often among the most popular draws at their vari-ous venues.
On an even smaller scale, a similar experience can be created with electronic goggles or a helmet. Later developments extended the process to in-clude data gloves to relay a user’s hand and finger movements to a virtual reality system, which then translates the wearer’s gestures into manipulations of virtual objects. As these virtual reality genera-tors have become more detailed, more immersive and less costly, people have used these apparatus for a wide variety of entertainment, inspiration, socializing and training activities. Many of these
recent adaptations have allowed the users to signif-icantly alter the virtual reality in real time by their interactions, further advancing the reality of the simulations. With the use of virtual simulation so widespread and common, it is a visualization tech-nique perfectly suited for public education about global climate change issues.
For this use, the trailer is transported to various neighborhoods or to special festival venues where large public attendance is likely. Small groups of people (6 - 15) enter the trailer. Initially they are exposed to a preview exhibit and short movie to set up the story. Next they are exposed to a 10 - 20 minute virtual reality simulation experience specifically designed to simulate climate changes and affect a change in public attitudes. The pro-cess shows participants what will happen to their city when – not if – climate change effects begin to become too severe to ignore.
Generally, the walls and ceiling consist of full size high-definition video screens. The trailer includes a robust, full function super-computer system to drive analysis and simulations software. The sim-ulations software produces customized images to replicate the particular surroundings of the city, or even of a specific neighborhood.

Adaptive Urban Planning for Climate Change | ID589 | Systems Workshop | Fall 2006 | Ahn : Chong : Crimmin : Lee : Montgomery : Wilmot �9
System Elements
The HD video screens generate a compelling virtu-al reality to indicate various conditions: 1) current situations or conditions of city/neighborhood; 2) anticipated changes in global climate and the con-sequences of business-as-usual, localized for the specific audience, and for a wide range of clima-tological threats; 3) various proposed adaptation strategies and the short- and long-term improve-ments for society based on those strategies.
The virtual reality experience is intended to cre-ate the maximum effect by combining the full-sur-round, HD-coordinated video images with sound, heat, wind, even smell.
The business as usual scenario will include effects of various severe climate change elements: • Extreme shortage of petroleum• Shortage of food• Various consequences of water issues – both shortages and over-abundance events• Insect infestation• Both Hotter/dryer and Wetter overall climates• Changing lake levels The result is intended to help the public understand that they can both mitigate and delay climatologi-cal effects, and that they must take an active part in urban adaptation that will be necessary because
of effects that will certainly result from the high concentrations of CO2 already generated over the last century and currently in the atmosphere. At the conclusion of the simulation experience, par-ticipants are encouraged to take a pledge to imme-diately begin personal action to affect change and to support the city administration in its efforts to do the same.
ScenarioParked outside the city’s Joint Operations Center, the C2 Simulator was buzzing with activity. The Climate Change Summit had just closed at the con-vention center and there were several internation-ally known climate scientists still in town, visiting the Join Operations Center and participating in simulations scenarios in the C2 Simulator.
The visiting scientists were divided into three teams partnered with members of the city’s Cli-mate Change Group and the staff at the JOC. Each team was concentrating on various adaptation strategies. Initially they had met in the front area of simulation trailer around the large conference table to discuss the overall plan and the roles for each team. Later that afternoon, after each team had completed its analysis, they would meet again

Adaptive Urban Planning for Climate Change | ID589 | Systems Workshop | Fall 2006 | Ahn : Chong : Crimmin : Lee : Montgomery : Wilmot 50
to review and compare outcomes and to find the best way to combine various solutions for the best synergistic result.
The large HD video screens were ideal for this analysis because they allowed a very large amount of information to be displayed along with maps, and detailed images of any part of the city. The da-tabase included all of the demographic and infra-structure information for each neighborhood. The robust computer equipment running the simulation software and analyzing the city’s existing capabili-ties was state of the art and provided the analysts with all the capabilities they needed. By the end of the day, the group had a significant update to the city’s adaptation plan and the Climate Change Group had scheduled another session five weeks later with several of the participants.
These was still a long way to go before the city would consider the work complete, but the work to date had provided an accurate analysis of the city’s carbon footprint and had identified the primary ar-eas that needed immediate attention. The work of the past three years had made a significant impact – the carbon footprint had been reduced by more than 18% and the city had a credible plan to get to 65% reduction within another four years.
System Elements
As soon as the group left the Simulator, the crew came in to begin the transformation for its sched-uled trip to the Target store the next day. The C2 Simulator made a few of these trips each month, but this was an especially busy period. Still, with their past experience, the transition was easy. The conference table and chairs were removed and the visual display boards were arranged in this front area that would served as the introduction for to-morrow’s crowd. The seating in the video/analysis area was quickly swapped out and the transforma-tion was essentially complete. In many ways the most dramatic change was the easiest – simply running a different computer program to perform the localized simulation for the public education event.
The C2 Simulator arrived at the Target on Roos-evelt parking lot on a busy Saturday morning with great fanfare. Target stores throughout Chicago-land had been promoting the Simulator visit for all week with in-store signage, newspaper inserts and underwriting announcements on WBEZ. Tar-get had even done shelf promotions of its green-est items in the store to encourage customers to buy green. Finally, the Simulator’s tour of Target stores was beginning.
As people arrived to do their weekly shopping at Target, about one in three took time to enter the C2
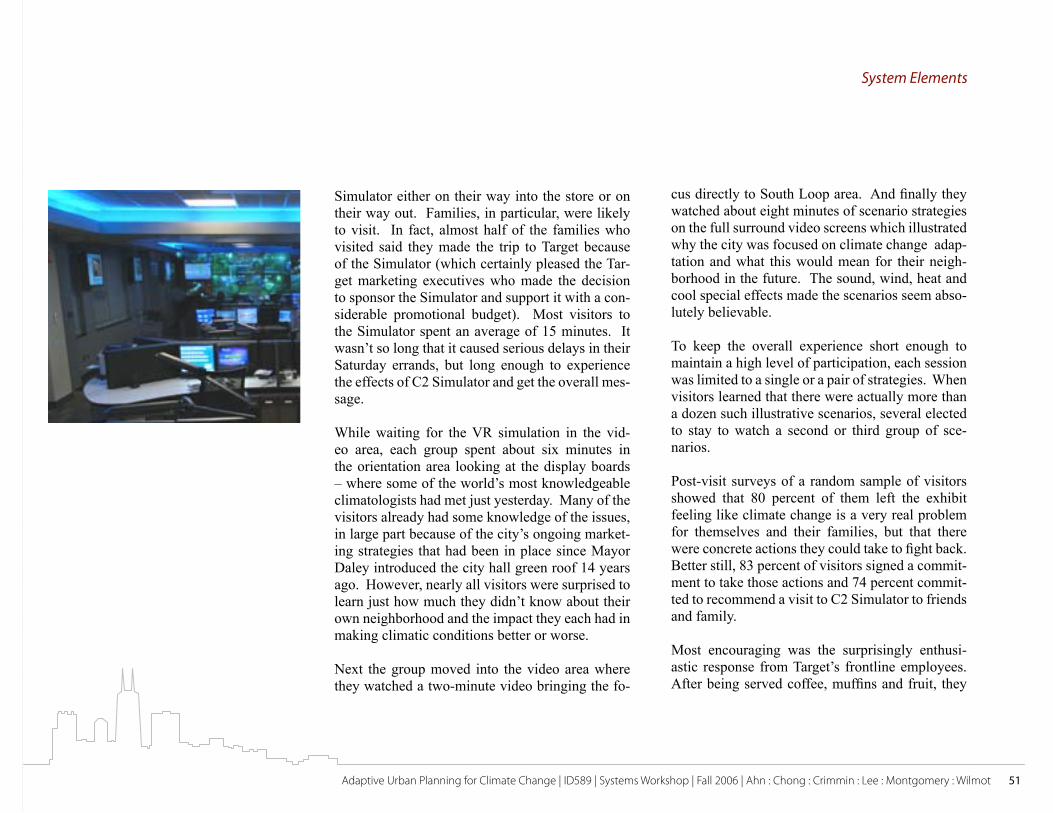
Adaptive Urban Planning for Climate Change | ID589 | Systems Workshop | Fall 2006 | Ahn : Chong : Crimmin : Lee : Montgomery : Wilmot 5�
System Elements
Simulator either on their way into the store or on their way out. Families, in particular, were likely to visit. In fact, almost half of the families who visited said they made the trip to Target because of the Simulator (which certainly pleased the Tar-get marketing executives who made the decision to sponsor the Simulator and support it with a con-siderable promotional budget). Most visitors to the Simulator spent an average of 15 minutes. It wasn’t so long that it caused serious delays in their Saturday errands, but long enough to experience the effects of C2 Simulator and get the overall mes-sage.
While waiting for the VR simulation in the vid-eo area, each group spent about six minutes in the orientation area looking at the display boards – where some of the world’s most knowledgeable climatologists had met just yesterday. Many of the visitors already had some knowledge of the issues, in large part because of the city’s ongoing market-ing strategies that had been in place since Mayor Daley introduced the city hall green roof 14 years ago. However, nearly all visitors were surprised to learn just how much they didn’t know about their own neighborhood and the impact they each had in making climatic conditions better or worse.
Next the group moved into the video area where they watched a two-minute video bringing the fo-
cus directly to South Loop area. And finally they watched about eight minutes of scenario strategies on the full surround video screens which illustrated why the city was focused on climate change adap-tation and what this would mean for their neigh-borhood in the future. The sound, wind, heat and cool special effects made the scenarios seem abso-lutely believable.
To keep the overall experience short enough to maintain a high level of participation, each session was limited to a single or a pair of strategies. When visitors learned that there were actually more than a dozen such illustrative scenarios, several elected to stay to watch a second or third group of sce-narios.
Post-visit surveys of a random sample of visitors showed that 80 percent of them left the exhibit feeling like climate change is a very real problem for themselves and their families, but that there were concrete actions they could take to fight back. Better still, 83 percent of visitors signed a commit-ment to take those actions and 74 percent commit-ted to recommend a visit to C2 Simulator to friends and family.
Most encouraging was the surprisingly enthusi-astic response from Target’s frontline employees. After being served coffee, muffins and fruit, they
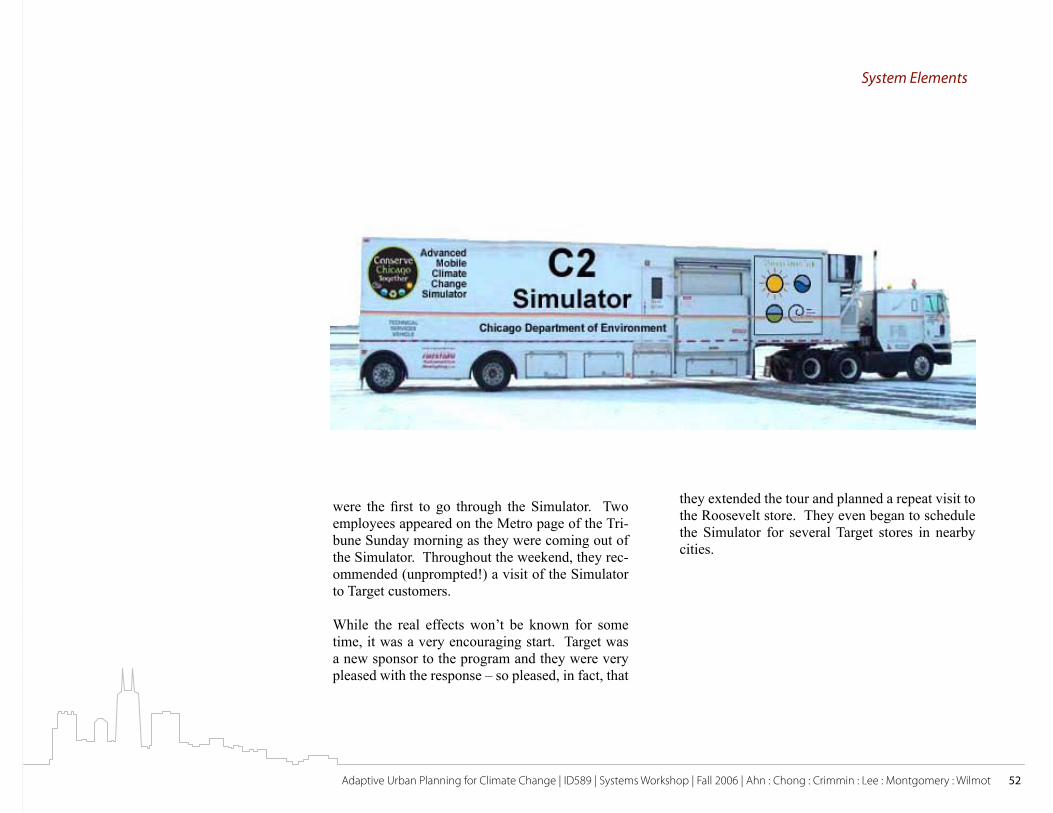
Adaptive Urban Planning for Climate Change | ID589 | Systems Workshop | Fall 2006 | Ahn : Chong : Crimmin : Lee : Montgomery : Wilmot 52
System Elements
were the first to go through the Simulator. Two employees appeared on the Metro page of the Tri-bune Sunday morning as they were coming out of the Simulator. Throughout the weekend, they rec-ommended (unprompted!) a visit of the Simulator to Target customers.
While the real effects won’t be known for some time, it was a very encouraging start. Target was a new sponsor to the program and they were very pleased with the response – so pleased, in fact, that
they extended the tour and planned a repeat visit to the Roosevelt store. They even began to schedule the Simulator for several Target stores in nearby cities.

Adaptive Urban Planning for Climate Change | ID589 | Systems Workshop | Fall 2006 | Ahn : Chong : Crimmin : Lee : Montgomery : Wilmot 5�
System Elements
DescriptionThe Challenge Kit is a section of ClimateNet. The Challenge Kit is a collection of interfaces that en-courage participation from outside city hall to help solve problems associated with climate change.
Properties• Section of ClimateNet• Collection of digital interfaces with interactive fields• Gateway for planners and for competition en-tries• Searchable by multiple criteria• Private and public sections
Features• Clearly identifies problems/challenges• Advertises demand for specific solutions• Opens up solution generation to anybody with in-ternet connection• Connects solutions to problems
DiscussionGlobal warming is perhaps the greatest issue fac-ing modern society. Adapting to it and mitigating our contribution to it will require a concerted ef-fort of all concerned parties. It will certainly be too complex a problem to be solved by a single city organization, especially as new risks and threats arise. The Challenge Kit gives individuals or com-panies outside the city an opportunity to contribute to the adaptation process and help communities solve problems as they arise, and provides finan-cial compensation for workable solutions.
The Challenge Kit is a set of tools that encourag-es outside participation in the fight against global
ChallengeKit
Challenge

Adaptive Urban Planning for Climate Change | ID589 | Systems Workshop | Fall 2006 | Ahn : Chong : Crimmin : Lee : Montgomery : Wilmot 5�
System Elements
tiative to open up its doors to outside designs from a news conference held by the city, and decides to pursue it as a potential avenue.
Harold accesses ClimateNet from his work computer and sees the link for solution sub-missions. He clicks through and opens the site for ChallengeKit. There he sees a list of outstanding challenges posed by the city. In the search field he types “water” and a list of challenges relating to water appear. He finds one that discusses the city’s need to reduce the amount of water used to fight fires.
Harold believes that some of his products, if retrofitted, could be a solution to the city’s is-sue. He contacts his design team and engineer and they develop sketches and a prototype for submission to the city’s request. Their submis-sion will be a new type of fire hydrant that uses 20% of the water of a normal hydrant because the water activates a more powerful foam that is used to extinguish the fire.Harold downloads the SolutionKit form, a part of the Challenge Kit, from ClimateNet. He populates the appropriate fields with informa-tion about his product. He then uploads the completed form onto ClimateNet, after which he receives an email confirmation that it has been received by the city.
Harold logs off his computer and waits for the city’s reply, which they say will take four to six weeks.
warming. It structures proposed solutions from outside city hall, collects them in a central place on ClimateNet, and allows planners to select the most appropriate solutions through Solution Filter. When the city selects a solution and implements it, the creator of the solution is rewarded.
First, a Challenge is identified by the Climate Change Group. If no solutions are generated from the Idea Stockmarket the Challenge is formally written and posted onto ClimateNet in the Chal-lenge Kit area. The Challenge resides, for an allot-ted amount of time, among other Challenges that are outstanding requests for solutions.
These Challenges are publicly accessible, in fact the public is encouraged to view them and help solve the problems posted. If an individual believes he or she has developed a solution to a given prob-lem (Challenges are not necessarily products, they can be services, techniques, methods, etc) they are encouraged to complete a SolutionKit form. On the SolutionKit form they detail the solution in what-ever format is appropriate, be it diagrams, written form, and/or photographs or drawings.
Once submitted, these SolutionKit forms reside within a ChallengeKit until the submission dead-line passes. They are then reviewed by the tech-niques outlined in the Solution Filter. If a solution is selected and implemented, the creator of the So-lutionKit form is rewarded.
ScenarioStyro is a small company specializing in con-densed foam used to extinguish fires at gas sta-tions. Its founder and president, Harold Mau-pin, is marketing his devices and searching for new customers. He learns about Chicago’s ini-

Adaptive Urban Planning for Climate Change | ID589 | Systems Workshop | Fall 2006 | Ahn : Chong : Crimmin : Lee : Montgomery : Wilmot 55
System Elements
DescriptionThe solution filter is a search engine tool that en-ables effective filtering of information and solu-tions about global climate change.
Properties• An online search engine tool main screen with four different sections of searchable information: geographic, climatic, economic, and contact
Features• Each section has its own page• Each page has various related fields with drop down options which the user can select• Provides a wide breadth of current information on global warming issues• Provides adaptation and mitigation solutions implemented by other cities• Allows information to be searched based on dif-ferent criteria such as geographic region, economic status and climatic zone• Able to search for information on cities facing similar threats
DiscussionThroughout the adaptive planning process, a wealth of research and solutions are generated by both the public and private sectors. This information is con-tinuously uploaded to the ClimateNet database, which is used by cities or individuals seeking cur-rent information on climate change. However, the problem lies wherein there is so much information, it becomes difficult to filter out irrelevant informa-tion and find exactly what is needed.
The solution filter would alleviate this problem, by providing the interface to filter out information by general or specific criteria, such as climatic zone, economic levels or geographic region.
The filter solution works similarly like the Google search engine, or a library database. The inter-face offers a series of search fields to be filled, or drop down menu to select from, which enable Cli-mateNet to search for specific solutions only. This makes expedite the research process.
Solution Filter

Adaptive Urban Planning for Climate Change | ID589 | Systems Workshop | Fall 2006 | Ahn : Chong : Crimmin : Lee : Montgomery : Wilmot 56
System Elements
ScenarioFaced with the problem of climate change, Felix, a city worker wants to seek solutions to adapt to the problem, but not know where to even begin. He does not know much about climate change. What he does know is extensive knowledge about the history and current context his local region, To-peka, Kansas, such as the annual budget, the popu-lation, the seasonal climate, annual gross domestic product etc.
Felix recognizes that Topeka faces the threat of rising temperatures, and wants to search for other cities that have begun implementing solutions that would be feasible for Topeka. He recognizes that Topeka faces certain constraints, such as budgetary matters since it is a small town of just over 122,000, and cannot implement costly solutions that a large urban city like Chicago would.
Entering the appropriate fields, Topeka hits enter, and waits for the results.

Adaptive Urban Planning for Climate Change | ID589 | Systems Workshop | Fall 2006 | Ahn : Chong : Crimmin : Lee : Montgomery : Wilmot 5�
System Elements
DescriptionNet Present Value Calculator for triple bottom line based benefits given an applications life cycle over a period of time.
Properties• Economical tool• Risk assessment tool
Features• Calculates the current cost of future benefits• Enables effective cost-benefit analysis
DiscussionThe effects of climate change happen in such small and steady incremental steps, it’s hard to really grasp the real breadth of the issue. With so many stakeholders, and so many facets to the problem, it can be daunting to even begin to uncover the cost of global warming.
The recent Stern report, released by Sir Nicholas Stern, Former World Bank chief economist pres-ents the stark reality of the financial implications of global warming if action is not taken now. “The benefits of strong, early action” he says, “consider-ably outweigh the costs.” By investing in our future now, we stand to reap benefits that far outweigh the cost of global warming affects in the future.
It is estimated that the cost of global warming could be has high a twenty percent of the world’s gross domestic product (GDP), simply by invest-ing a mere one percent of the annual GDP could significantly reduce emissions at the expected im-pacts to follow. Coupled with stringent mitigation policies, Stern values the future benefits a $2.5 tril-lion annually. If we were to continue to act accord-ing to current day policy standards, our inaction would result in poorer quality of life in the future due to the disruption caused by global warming, hence shrinking the economy anywhere from 5-20 percent.
The net present value (NPV) is a way to evaluate the long-term financial costs of a problem, but in terms of current day dollars. In a case such a global warming, future implications are uncertain, but in order to adapt the cost of action must be valuated in discrete terms.
The underlying idea behind NPV is that the value of money today is not necessarily worth the same in the future. In other words, if you had $100 to-day, its purchasing power would be less ten years down the road, because it would have been eroded by factors such as inflation.
Solution Variation

Adaptive Urban Planning for Climate Change | ID589 | Systems Workshop | Fall 2006 | Ahn : Chong : Crimmin : Lee : Montgomery : Wilmot 58
System Elements
A key component in evaluating the NPV is the dis-count rate, which can significantly alter the valua-tion of a proposition. The discount rate is used in determining the present value of future cash flows. It enables you to compare the costs and benefits that do not occur at the same time.
PV = present valueFV = future valuer = discount ratet = time
PV = FV / (1+r)t
In order to adapt to global warming, there are sig-nificant costs to planning for adaptation. The ben-efits of these actions may not be clearly evident for quite some time, so calculating the NPV of a future problem can help make it understandable in cur-rent day terms.
The challenge behind this is selecting the correct discount rate. Though it may seem to be an arbi-trarily chosen number, it is guided by how people understand and view the future to their current day context. It must be cautioned, however, that whichever discount rate is selected, it may influ-ence which course of action is chosen.
For example, imagine if you had a loan repayment of $1,000 to pay in the future, say ten years from now. If the current day interest rate offered by the bank was five percent compounded annually, you would need to put aside $613.90 in order to have that money ready ten years down the road.
Now let us assume a higher interest rate of eight percent, but for the same period of time. The pres-ent value when then be lower, at $463.20
PV = FV / (1+r)t = 1000 / (1+0.05)10 = $613.90
PV = FV / (1+r)t = 1000 / (1+0.08)10 = $463.20 (worth more in future)
The higher the discount rate, there is more motiva-tion to put place resources in initiatives that have a higher return on investment in the short run. The cost of future benefits is cheaper if the money is invested earlier rather than later. On the other hand, the lower the discount rate, there is more motiva-tion to put resources into initiatives that have a higher payoff in future, because a dollar today is not worth that much more in the future. In other words, the future cost is not more than what it is now, so there is no incentive to invest or save mon-ey.

Adaptive Urban Planning for Climate Change | ID589 | Systems Workshop | Fall 2006 | Ahn : Chong : Crimmin : Lee : Montgomery : Wilmot 59
System Elements
ScenarioThomas McDonald is the facilities manager at DMB Engineers. It is the largest engineering firm in North America, with around the world. With the recent release of the Stern report on global climate change, DMB Engineers has decided to take part in the green initiative and do their part to help combat this problem. Their goal is to reduce their carbon footprint by modifying the way they do business and how they operate.
One of the plans of action to initiate this paradigm shift is to assess what they can do at their own of-fice and facilities. Thomas suggested that they try changing their outdated heating systems, which are not very energy efficient. With energy resource prices on the rise, it has been putting a strain on the facilities budget. The new cooling system would use less energy, reduce costs and they were guar-anteed to last longer as well. However, newer cool-ing systems that are more energy efficient have high capital cost of $100,000 a pieces seems quite prohibitive. The current systems still had at least another ten years of good use in them. The ques-tion for Thomas then is should he invest in the new systems now, or wait until they break down.
Thomas decides to do a cost-benefit analysis of the energy efficient systems, by calculating the net
present value. Using an 8 percent discount, Thomas discovers that the cost per year of the new cooling system is actually less, given that it is built to last longer. So despite the high upfront price of the sys-tem, the benefits will stretch over a longer period of time. Thomas makes his decision to purchase the new system, placing DMB Engineers one step closer to reducing their carbon footprint.

Adaptive Urban Planning for Climate Change | ID589 | Systems Workshop | Fall 2006 | Ahn : Chong : Crimmin : Lee : Montgomery : Wilmot 60
System Elements
DescriptionAlliance Connector is a data analysis system to find the best-suited alliance combinations between private and public institutions. Alliances are criti-cal to process projects and implement solutions ef-ficiently and productively. Alliance Connector cat-egorize and prioritize all the institutions in terms of strengths, weaknesses and capabilities, and connect the best-suited partners based on specific requests from project managers by satisfying other institu-tions’ needs like technology, information, finance, and human resources.
Properties• Proposal collection website• Data analysis and prioritization system• Data transmission process software• Alliance data storage• Customized alliance connection system• Automatic data delivery software
Features• Collect detailed alliance proposals from the out side private/public institutions • Transmit the proposal information to main alli-ance database • Categorize and prioritize the data based on tech-nology, information, finance, and human resources• Receive alliance requests from project managers
in terms of technology, finance and human/ infor-mation resources• Search on the main database to determined best-suited alliances based on specific requests from project managers• Provide project managers potential alliance can-didates¡¯ information in terms of what they de-mand and offer to establish an alliance
Discussion1. Alliance ConnectorAlliance Connector looks for an agreement between public and private institutions to achieve different goals and interests by sharing each institution’s advanced resources like technology, information, finance, and human. Most of public and private in-stitutions try hard to establish good alliances with the institutions which have superior resources. Al-liance seekers spend tons of time and money for that because they know even though an alliance is hard to achieve and maintain, it provides core ca-pabilities once it set. Alliance Connector will be a tool to help City of Chicago establish an advanced alliance network.
Alliance Connector is consisted of 4 main func-tions listed as 1. Collect detailed alliance proposals from the out side private/public institutions
Alliance Connector

Adaptive Urban Planning for Climate Change | ID589 | Systems Workshop | Fall 2006 | Ahn : Chong : Crimmin : Lee : Montgomery : Wilmot 6�
System Elements
2. Transmit the data to Ally database, and catego-rize and prioritize the data based on technology, information, finance, and human resources3. Receive alliance requests from project managers and search best-suited alliances4. Provide project managers’ potential alliance candidates’ information
2. Ally.orgAll the functions are operated by six elements. Ally.org is a website to collect proposals from out side organizations or individuals, alliance seek-ers. Proposals are submitted with a digital format on the web page by clicking boxes and writing a proposal and company summary. The boxes are categorized by two main groups such as OFFER and DEMAND. OFFER section is the informa-tion, what they can offer or contribute to City of Chicago. OFFER sector will give full information to understand alliance seekers’ superior resources. DEMAND sector is the information, what they want from City of Chicago. Surely, there are some volunteers and donators to help City of Chicago in terms of technology, finance and human/ informa-tion resources.
3. Data Trans & Ally StorageThe submitted proposals are transmitted to Ally Storage by Data Trans. Data Trans is a data trans-
mission system. It categorizes the proposals in terms of technology, finance and human/ informa-tion resources, and prioritizes each categorized group in terms of value and urgency and cost.
4. ReceiverReceiver is a tool to submit alliance requests from project managers in City of Chicago. After devel-oping solutions in projects, managers identify what they need to implement best-suited solutions effi-ciently and productively, and evaluate their own capabilities of implementation in the organization. Whatever they come up with needs, they submit their needs by using Receivers. A request can be completed by submitting a description of project and insufficient resources.
5. Dot ConnectorDot Connector is a search engine to find the best-suited public and private institutions to ally with City of Chicago. After identifying and prioritizing potential institutions in the Ally Storage, Dot Con-nector gathers more information about the selected institutions or individuals on other business intel-ligence websites to increase the possibility of suc-cessful alliance establishment.

Adaptive Urban Planning for Climate Change | ID589 | Systems Workshop | Fall 2006 | Ahn : Chong : Crimmin : Lee : Montgomery : Wilmot 62
System Elements
Collect detailed alliance pro-posals from Alliance See kers
Exp lore alliance, donaiton or volunteering opportunities with go vernment organigations
Alliance Seekers
Ally.org
Data Trans
Ally Storage Dot Connector
Best-suited Alliances
Project managers
Store all the data transmited from Ally.org
Find the best-suited public and Private
institutions
Categorize and prioritize the pro-posals during transmiting them Ally.
org to Ally Storage
Receive all the data and contact po tential alliances
Give and Take, Stra tegic Alliance Network
ReceiverReceive alliance re-quests fro m p roject
managers
Alliance Connector
Alliance Connector Process Map

Adaptive Urban Planning for Climate Change | ID589 | Systems Workshop | Fall 2006 | Ahn : Chong : Crimmin : Lee : Montgomery : Wilmot 6�
System Elements
ScenarioMark is a project manager, Climate Change De-partment in City of Chicago. Two months ago, he received information from Threats Analysis De-partment that by increasing temperature, Chicago will become significantly hotter and drier by the end of the century, causing severe air pollution, a drop in the water supply and up to six times more heat-related deaths in major urban centers. Among the threats, dropping water supply is the most ur-gent.
Mark’s team look for possible solutions to reduce the level of threat, dropping water supply. At the end of the project, they end up few possible solu-tions listed as saving water campaign, developing underground water resources and building reservoir. City of Chicago has capacities to implement two solutions, saving water campaign and building reservoir, but they are lack of resources to develop underground water resources; no technology to find underground water resources and pump up the water, insufficient finance, and no experts to plan the project.
After the capability evaluation, Mark submits a de-scription of project and insufficient resources. 20 minutes later, a screen opens with well organized potential alliance institutions’ detailed information,
categorized and prioritized in terms of technology, finance and human resource. Mark establishes an alliance with UNCOVER WATER COPERATION, which has an advanced technology to find under-ground water resources and pump up the water by accepting their demands such as City of Chicago’s future projects involvement priority. Mark also en-sures sufficient finance from David Foundation, financial donation, no demands. In addition, five individuals, experts in developing underground water, volunteer for help to plan the developing plan.

Adaptive Urban Planning for Climate Change | ID589 | Systems Workshop | Fall 2006 | Ahn : Chong : Crimmin : Lee : Montgomery : Wilmot 6�
Leadership Training DescriptionA series of training program that provides con-sistent knowledge and useful information about environmental issues to project managers of each department. This program includes on-line and off-line education and also provides opportunities to attend special activities which build the qualities of good leaders for urban sustainability.
Properties• A training program for management staff and project leaders• On-line and off-line education relevant to leader-ship and sustainable development• A course which builds up environmental special-ists
Features• Conducts regular workshops and seminars• Invites experts for special lectures • Provides on-line education programs• Sends managers on an environmental field trip• Provides mentoring program• Performs community service• Educates ethical decision-making for sustainable development• Offers credits and certificates if managers com-plete the program
DiscussionThe leadership role is very important in every proj-ect and every department of each organization. Leaders must manage entire projects including people, resources, communication, and schedules. Therefore managers need good leadership qualities along with a broad range of knowledge about their work.
Leadership Training is one of the necessary pro-grams which develop the competencies of organi-zation for urban planning under climate change. It is through Leadership Training that management will gain the abilities and knowledge that will carry them to success. Building leaders is a key, as they will be the driving force in creating an effective plan.
Leadership Training consists of several programs which collaborate to create a well-rounded and ef-fective leader for city projects. Programs will con-sist of both online and offline courses, which will enable users to work both on company time, and away from the office. Online education will provide managers with a great amount of knowledge from various courses. All managers should complete credit hours every month and the result will be re-ported to chief managers. These programs are not only for improving managers’ working efficiency,
System Elements

Adaptive Urban Planning for Climate Change | ID589 | Systems Workshop | Fall 2006 | Ahn : Chong : Crimmin : Lee : Montgomery : Wilmot 65
but may also be a type of evaluation methods. Team leaders will be able to learn on their own schedule using the online courses, but will also learn in person from expert sources through special lectures. These offline courses will allow leaders to learn directly from experts in various fields, giving those proficient in the planning process the neces-sary background to accomplish their tasks. Manag-ers can also discuss key issues and problems regard-ing their projects through workshops and seminars regularly. It will broaden their understanding about work that other managers are doing, as well create a strong network among different departments. If needed, managers will visit certain places to gain knowledge in the field and gain first hand experi-ence. Through other programs such as mentoring programs, ethical decision-making sessions, and community service, managers will qualify them-selves as good leaders. These courses will create environmental specialists of the team leaders, and allow them to teach their subordinates. When these programs are used as a system, the team leaders will be able to transfer knowledge to team mem-bers, delegate and evaluate them, therefore making a more effective team.
In the end, Leadership Training helps managers are able to fully understand their roles, and can execute an effective plan for the city’s programs.
System Elements
LeadershipTraining
Off-line
On-line
Workshops
Seminars
Special Lectures
Field trip
CommunityService
CertificationProgram
On-line educationProgram
e-evaluation
Informationmailing
e-book
Structure of Leadership Training

Adaptive Urban Planning for Climate Change | ID589 | Systems Workshop | Fall 2006 | Ahn : Chong : Crimmin : Lee : Montgomery : Wilmot 66
ScenarioJim Smith has been appointed as the chief man-ager of the Chicago Department of Environment, and has been given a new initiative to reduce CO2 emissions from the city of Chicago. He has been given complete control over the cities public works and utilities as resources to complete his task. To complete this momentous task, Jim needs the help of many well trained individuals on his team. Jim will follow the principles used in Leadership Train-ing to create a task force well trained enough to make an impact citywide.
The first action that Jim takes is to locate experts in the field of carbon dioxide emissions. Upon gain-ing their assistance, Jim sets up mandatory training sessions for the leaders of his task force. The task force will include managers of many different pub-lic departments including: Energy Management and Air Quality, Permitting and Enforcement, Natural Resources and Water Quality, Urban Management and Brownfields Redevelopment, Government Relations and Policy, Administrative, Fiscal and Communications, and Community Programming and Education Outreach. These managers will be taking a wide range of training courses on the re-moval of CO2 emission sources. Jim decides that an effective way to teach his managers is to take them on a trip to Copenhagen, a city currently at the forefront of CO2 emission reduction. Copenha-gen has reduced CO2 emission by 23% from 1990 to 2000 and still trying to reduce CO2 emissions by
30% compared with 1990 levels. By viewing the successful example, leaders can see first hand what they hope to accomplish, and they will be able to meet those to have accomplished the task in the clean environment.
Jim also uses online software to create online courses to train team leaders during off time. This allows team members to learn necessary informa-tion at there own schedule, while Jim is able to dictate what is accomplished during work hours. Jim’s training program is so strong that he creates his own set of requirements that must be accom-plished so leaders may achieve accreditations. The certificates awarded will allow leaders to partici-pate in future city programs, and at higher levels of management.
The Leadership Training that Jim provides cre-ates a sense of team unity and common knowledge that the team will draw upon when forced to spend long hours working apart towards a common goal. Once Jim’s team is properly trained to his speci-fications, he will be able to execute a much more efficient plan that can be properly delegated. The communication between departments should be stronger because of the common knowledge that the team shares, as well as the relationship that the leaders have developed. Jim will be lauded for his performance, as having strong leaders will insure the success of his carbon dioxide emission reduc-tion plan.
System Elements

Adaptive Urban Planning for Climate Change | ID589 | Systems Workshop | Fall 2006 | Ahn : Chong : Crimmin : Lee : Montgomery : Wilmot 6�
3Cs Challenge DescriptionA program which develops organizational competi-tiveness and promotes interdepartmental collabora-tions and cooperation. 3Cs means ‘Competition’, ‘Collaboration’, and ‘Cooperation.’ It can be apply for not only internal departments but also outside of the city organizations. The interrelationships among the 3Cs improve work efficiency and strengthen net-works.
Properties• An innovative program to enhance organizational competencies• A interdepartmental or interorganizational com-petition, collaboration, and cooperation• A technical method to connect and develp both inside and outside of the organization• Strong networks between many different entities to improve work efficiency
Features• Connects people, departments, organizations and cities• Promotes collaborations and cooperation with many different sectors such as academia or NGO• Creates or strengthens inside/outside networks • Shares ideas, information and resources with oth-er department
• Facilitates communication with other people, de-partment, organization, and cities • Provides training or education using floating staff• Makes strategic partnership with other cities
DiscussionWhen working on a project, it is difficult to com-plete tasks individually if the project regards com-plex issues. As the world moves towards global-ization, no organization that can complete its work alone. Therefore, collaborations between organiza-tions and departments are crucial for the develop-ment of an organization. They are especially im-portant when environmental issues are concerned, because they require much effort and communica-tion among many different areas.
3Cs challenge is a program which was designed for developing organizational competitiveness and promoting interdepartmental collaborations and cooperation. It strengthens networks between orga-nizations, cities and countries. Therefore the 3Cs: competition, collaboration, and cooperation, are essential elements which enhance organizational competencies.
Competition means friendly rivalry while achieving common objectives. For example, an idea contest
System Elements

Adaptive Urban Planning for Climate Change | ID589 | Systems Workshop | Fall 2006 | Ahn : Chong : Crimmin : Lee : Montgomery : Wilmot 68
or competitions among departments may be a good opportunity to gain new ideas from staff members and also inspire enthusiasm for their work.
Secondly, collaboration is the link that connects each person or department. It includes direct par-ticipation by two or more people in designing, pro-cessing, and producing. The relationships between these people are often internal arrangements that are usually vertical, sometimes among divisions in the same organization. Normally those collab-orative arrangements take more time to build than those cooperative ones. Therefore for good collab-orations, organizations should encourage not only improving skill but also building trust among staff members. Teambuilding, workshops and interde-partmental trainings can be good examples to build teamwork. Through these programs, an organiza-tion can improve not only individual abilities but also overall organizational competencies.
Lastly, cooperation means a series of effort to share information, support managerial and tech-nical training, and provide useful information. Cooperation is normally external and horizontal: the people do not need to work together. Floating staff is a type of traditional cooperative method for training and improving staff’s skills. Also open source and public databases may be advanced ver-
sions of cooperation. Cooperative relationships are more public because they allow for non-exclusion principle, whereas collaborative relationships are generally exclusionary. Cooperative relationships can be achieved among department, organization, cities, and even countries. Therefore cooperation is a good way for an organization has to expand its organizational and spatial boundaries. An organization can enhance its competitive power and maximize organizational capabilities through 3Cs challenge.
Scenario
System Elements

Adaptive Urban Planning for Climate Change | ID589 | Systems Workshop | Fall 2006 | Ahn : Chong : Crimmin : Lee : Montgomery : Wilmot 69
System Elements
Competition Collaboration
Cooperation
3Cs Challenge
Adaptive Urban Planning for Climate Change | ID589 | Systems Workshop | Fall 2006 | Ahn : Chong : Crimmin : Lee : Montgomery : Wilmot �0
The City of Chicago has planned a “Green City Idea Contest” aimed at all staff members in city departments. There is a prize of $3000 for the first prize and the results of the contest can be adopted as city’s policies.
Sarah Winston is the manager of “Green City Idea Contest” and is busily preparing the event. First, she reorganized the city’s database system for everyone who participates in the event to search information which they need. This system is based on an intra-net server and contains massive materials in many different fields. Anyone can search the database if they are identified using ID and password. Also, all past project reports are saved in project gallery and may be reviewed by staff. These reports may be used with a manager’s permission.
Scott Macdonald, a staff member of the Energy Management and Air Quality department is pre-paring the contest. He is interested in recycling and separate trash collection and researching other cities’ precedents. Trash problems correlate close-ly with both air and water pollution, therefore he thought this problem should be solved as soon as possible. Scott began his research from the city’s database system and reviewing past project reports. However Scott could not find a good solution, so he extended his research out of the city. He found cities which had adopted environmental policy and
decided Freiburg, a southern city of Germany, as the perfect model. Freiburg instituted an environ-mental policy in the 1980s and is considered the cleanest city in Germany. Scott requested detailed data using international city information network. It is a network which is established for information exchange and international cooperation, and many famous cities are joined as member cities. Member cities share data with each other, sometimes there are joint projects if needed. Two days ago, Scott re-ceived a report from a Freiburg city office. Through the report, he learned strong leadership, good poli-cies and citizen’s sense of environment pride are the major power for success. Based on thorough research and planning, successive environmental education, and consistent policy, Freiburg became world’s best cleanest city. Now Scott is planning a high-level recycling system idea for the upcom-ing contest modeled on the successful example of Freiburg.
This is a successful example of how the 3Cs chal-lenge encourages interdepartmental competition and collaboration for common objectives. This program also highlights external cooperation us-ing networks and sharing information. The final goal of 3Cs challenge is maximizing organization-al competencies.
System Elements

Adaptive Urban Planning for Climate Change | ID589 | Systems Workshop | Fall 2006 | Ahn : Chong : Crimmin : Lee : Montgomery : Wilmot ��
System Elements
DescriptionGreen Text is a content distribution system. In gen-eral, searching or sending data is a very painful task due to no means to inform the latest update data or availability. Green Text provides members of ClimateNet a capability to avoid searching the same topics or projects to check the latest news or achievements. It not only informs members the most relevant and latest information by simple registerations and distributions, but provides Navi-gator, a personal data storage, to check registered issues immediatly. In addition, Green Text pro-vides Focus Dicussion, linked with Navigator, to discuss about the issues with others including publishers.
Properties• A web based system• Personal data storage• A tool to distribute data• A place to discuss about issues
Features• Get registrations from members• Categorize updated data• Prioritize updated data in terms relevancy• Inform updated data information to registered mem-bers through emails with green text.• Provide a personal data storage place to organize registered issues
• Provide group discussion places in ClimateNetDiscussionGreen Text is a data distribution system to help members of ClimateNet get specific information efficiently. Register receives registrations from individual members. Whenever network members are interested in specific topics or projects, they go to Register to be informed the latest information in the future. The process of registeration is consisted of two sections, listed as the catagory of issue and the level of relevancy; Members choose category by clicking boxes from broad to detail. Determin-ing the level of relevancy is critical not to miss very important information by receive too many emails that not useful or irrelevant.
LevelSet is a tool to determine the relevant level of newly updated information. Setting levels of in-formation importance or relevancy is very critical specially nowadays due to an information-orient-ed society; people spend too much time to search highly relevant data.
Feeder informs data updating news to registered members. Members are informed the updating news through emails. The subjects of updating news on the email are green text that members won’t miss to check them or confused with other spam emails. Data updating news contains short descriptions of projects, updating dates, publishers and link to
Green Text

Adaptive Urban Planning for Climate Change | ID589 | Systems Workshop | Fall 2006 | Ahn : Chong : Crimmin : Lee : Montgomery : Wilmot �2
System Elements
ClimateNet.Navigator is a personal data storage place to or-ganize registered issues. After informed updated projects, members go to Navigator to check the information. Simplely clicking the linked titles of projects, members can get the information.
Focus Discussion is an web place to share opinions with others, including original project publishers. Members have questions or objections after read-ing projects, but it is hard to meet others due to geographical distance. They can ask questions each other to understand the processes and ideas better.
You have to search for information
Information comes to you
Without Green Text With Green Text
Members
REGISTER
LEVELSET
Publishers
NAVIGATOR
FOCUS DISCUSSION
FEEDER
Members
Register
LevelSet
Feeder
Navigator
Focus Discussion

Adaptive Urban Planning for Climate Change | ID589 | Systems Workshop | Fall 2006 | Ahn : Chong : Crimmin : Lee : Montgomery : Wilmot ��
System Elements
ScenarioMinho is a member of ClimateNet. He started to work for Korean Adaptive Environmental Change three weeks ago. Recently, his team has been work-ing on a project to find a better way to provide food to Seoul, capital city of Korea. During the research on the ClimateNet, he found that City of Chicago has been working on “Urban Green Roof Project” to increase food supply capability and reduce CO2 level.
Minho visited ClimateNet more than 5 times a day to check whether Urban Green Roof Project is up-dated or other similar projects are comming. Few days later, he felt checking and searching many times a day is very inefficient. And one of his team members told him about Greet Text. His team member said that Green Text is a content distribu-tion system. It provides members of ClimateNet a capability to avoid searching the same topics or projects. It informs members the most relevant and latest information by simple registerations and dis-tributions, provides Navigator to check registered issues immediatly, and provides Focus Dicussion, linked with Navigator, to discuss about the issues with others including publishers.
After the conversation, Minho simplely registered urban agriculture capability as a category, and set
level two as a level of relevancy; one is the most relevant data and five is the least relevant data. One hour later, he got an e-mail with green text. There are lists of projects with short discriptions, update dates and publishers. He clicked one of them, linked to ClimateNet. He loged in ClimateNet as usual and visited to his personal place, Nevigator. There are all the issues and projects that he registered. He clicked Urban Green Roof Project. As reading, he found that there is a Focus Discussion button, linked to group discuss pages. He clicked the but-ton and discuss the project with others, working on similar projects for other cities.

Adaptive Urban Planning for Climate Change | ID589 | Systems Workshop | Fall 2006 | Ahn : Chong : Crimmin : Lee : Montgomery : Wilmot ��
System Elements
DescriptionAn expansive transit system of busses and light rail serving the city without fare.
Properties• Robust free transit system serving all areas of the city.• Means of significantly reducing automobile use and associated CO2 contribution.
Features• Fully integrated transit system serving entire city.• Busses operate in large part on dedicated right-of-way to speed service.• Transit stops planned for rapid boarding and de-boarding.• Significantly reduced headway to increase conve-nience and ridership.
DiscussionTransit is one of the largest contributor in the Unit-ed States to CO2 contribution in the atmosphere. Private automobile use, and much of that single occupant trips, is the largest sector by far of that transit slice.
There are three primary considerations. First, pri-vate vehicles do not pay their own way – private car use is one of the most heavily subsidized ac-tivities in the US, through both public and private sources. Current externalized costs include normal road construction and maintenance, sprawl associ-ated with parking and widened roadways, lost time associated with congestion, health and other soci-etal costs, noise pollution, and many more. The city’s reversal of its subsidy policy would influ-ence how much people drive and their willingness to switch to public transit. The second, and much more important consideration is the environmen-tal burden. Third is the pending crisis of peak oil. Within a very few years, it will become clear that we have passed the point of peak oil production and fuel prices will begin a sustained steep price increase.
Numerous sources, including the Federal Highway Administration, list the conservative or mid-point estimates for unrecognized, externalized costs for
FreeRide

Adaptive Urban Planning for Climate Change | ID589 | Systems Workshop | Fall 2006 | Ahn : Chong : Crimmin : Lee : Montgomery : Wilmot �5
System Elements
automobile use at $59 billion annually and the so-cial costs at $125 billion – and these are only the beginning of the hidden subsidies.
A massive cost often ignored is the cost of ‘free’ parking. Because private car use is so pervasive, and because we generally expect to park for free, there are four ‘free’ parking spaces for every car in America – almost all required by zoning codes. These spaces include the residential space plus the many free spaces at various retail locations and many places of work. The vast amount of land area devoted to free parking is in no way free. Its value is added to the operating costs of all of the estab-lishments providing the parking, and those costs are passed along to the consumer. Donald Shoup, in his book ‘The High Cost of Free Parking,’ cal-culates the subsidy for this free parking to be at least $127 billion and perhaps as much as $374 bil-lion annually. Development of the land currently devoted to parking can be a source for funding the move away from dependence on the automobile.
Another factor, congestion, causes 3.9 billion hours of travel delay annually, which equates to $67 bil-lion in annual cost. The effect of longer delivery times, missed meetings, business relocations and other congestion results are not included in this fig-ure. The total cost for these societal subsidies is
more than $475 billion nationwide, and Chicago’s portion of the subsidy is more than $31 billion.
Obviously, there are much better ways to approach the task of moving citizens around the city. If even a small portion of this $31 billion were transferred to public transit, CTA ridership could grow sever-al-fold and replace much of the private automobile use.
FreeRide is a proposal to completely subsidize the cost of public transit, just the way we completely subsidize public benefits ranging from primary and secondary education, to police service, fire service, and the public right of ways used for all forms of transportation. All CTA’s bus and rail service would become completely free – the FreeRide.
This plan draws on two examples already in place. First, Portland’s TriMet bus and rail system includes an area downtown known as Fareless Square, for which all transit has been free for more than 30 years. Fareless Square is an area of approximate-ly 2 square miles, 330 blocks, and includes all of downtown Portland and the near northeast neigh-borhood. Fareless Square is frequently cited as a significant factor in the success of Saturday Market and numerous downtown merchants since 1975, and in significantly reducing private automobile

Adaptive Urban Planning for Climate Change | ID589 | Systems Workshop | Fall 2006 | Ahn : Chong : Crimmin : Lee : Montgomery : Wilmot �6
System Elements
use downtown.
Fareless Square has been an unqualified success in meeting its original objectives of:• improving air quality standards,• increasing awareness of transit service and transit ridership,• reducing the need for parking,• reducing auto congestion.
The second example is found in the astound-ing success of Curitiba, Brazil’s bus rapid transit (BRT) system. BRT was invented in the 1970’s by Curitiba‘s architect-Mayor Jaime Lerner. BRT has helped give that city’s transit system the high-est daily ridership numbers in the world – equaling its population count. With three-quarters of com-muters on buses – the world’s highest transit usage – the streets have become unclogged. And to top that off, it is the only major urban public transit system in the world with no subsidy.
While Curitiba’s population tripled and transit use increased ten-fold during the last 30 years, air pol-lution has declined, and overall fuel consumption dropped by 25 percent – a 75% reduction in per capita fuel consumption.
More recently, Bogota has constructed a 41-kilo-meter BRT system, which has become the world’s busiest bus system in less than two years. Car traf-fic has dropped 10 percent, and they have started car-free days on Sundays, holidays, and even se-lected workdays.With FreeRide in place, ridership will certainly increase several-fold, and BRT is the best way to accommodate the increased ridership for two pri-mary reasons. It has been shown to be the most cost effective solution per passenger mile. Also, it has been shown to increase ridership by its user-friendly nature.
Basically, BRT is a bus system with attributes like a train – including fast service on a dedicated bus-way, absence of fair handling on the vehicle (so riders can get on and off quickly), and traffic signal prioritization (so the bus does not compete with au-tomobile traffic). But its cost is a fraction of what rail costs – 10% or less of the cost of rail service.The BRT vehicle is an 80-foot double articulated bus capable of carrying 270 passengers and is highly maneuverable on the street even with their extra length. On a dedicated guideway the busses can be operated as several 270-passenger double-articulated buses coupled in tandem, forming a bus-train.

Adaptive Urban Planning for Climate Change | ID589 | Systems Workshop | Fall 2006 | Ahn : Chong : Crimmin : Lee : Montgomery : Wilmot ��
System Elements
In order to pay for the significant increase in ve-hicles and service that FreeRide will generate, the city will have to increase its current subsidy to CTA several-fold. The source of the additional bus sub-sidy will come from significantly decreasing the current subsidy to the automobile. For instance, even if we limit the analysis of car subsidies to the consequences of congestion alone, the average de-lay per Chicago traveler in the peak commute pe-riods is 58 hours per year and the cost burden for Chicago is $4.3 billion. This is four times CTA’s current annual operating budget.
One specific source for funding of the increased transit subsidy can be the leasing of development rights for the overabundance of parking spaces throughout the city. With four parking spaces per car and with the significantly increased transit rid-ership, there will be a very large stock of unused parking spaces. The city can offer the right to de-velop some of this area for a fee. A commercial or retail development would petition to be allowed to reduce its parking by 50% or more and pay to be permitted to develop that land. The petition would include a planning process with CTA to analyze the transit routes for compatibility with the proposed new development. If the planning analysis con-firmed that this was an appropriate site for develop-ment, the agreement would include a transit stop(s)
at that location to provide a convenient replacement for the reduced parking availability. The fee paid access to that development area would go directly to CTA for increased service.

Adaptive Urban Planning for Climate Change | ID589 | Systems Workshop | Fall 2006 | Ahn : Chong : Crimmin : Lee : Montgomery : Wilmot �8
System Elements
FreeRide: Bus and Train CTA Map

Adaptive Urban Planning for Climate Change | ID589 | Systems Workshop | Fall 2006 | Ahn : Chong : Crimmin : Lee : Montgomery : Wilmot �9
System Elements
ScenarioFor the last year, Eric had been setting his alarm an hour later than he had for the previous ten years. A year ago he reluctantly took the advice of his wife Irene and began taking CTA rather than driv-ing to work. Within a few days, he was desperately looking for ways to avoid having to admit he had been wrong. Yes, the FreeRide was much quicker than his automobile commute, plus it turned out to be very convenient, and he found he liked talking with many of the other regular commuters. And there was that other thing – it was free. He knew the “I told you so” was coming, and he was right. Irene was not going to pass up the opportunity to remind him that she had been urging this for six months.
Eric walked three blocks to the transit station where he boarded the city’s new Bus Rapid Transit (BRT) system. Initially Eric thought the boarding process was sort of odd – it was more like boarding a train. But it sure seemed to work well. Also, it was a better shelter for the Chicago weather and it took less than 10 seconds to board the 20 - 30 people that we usually at Eric’s stop. Eric generally tried to make sure he got to the station as close to 7:30 as possible, but in fact it didn’t much matter. With headways consistently less than 5 minutes apart, he
could miss his regular bus and make it to work on time without any trouble.
After boarding, the long, double-articulated bus sped up rapidly and made relative few stops from Eric’s far northwest suburb on its way to the south side. The trip only took about 30 minutes, which was less than half the time it took Eric to commute by car, and when the traffic was bad the old com-mute was even longer still. That is why he was able to set his alarm an hour later now. In hindsight, he was not sure why he held out so long before switching to CTA for most all of his in-city travel, especially since gas was now more than $7.50 a gallon. Since we had passed peak oil almost two years ago, gasoline seemed to be on a steep and steady climb.
Chicago had planned for this transition for quite a few years. The city had made the commitment to significantly increase CTA’s funding while drasti-cally cutting back on automobile subsidies. Ini-tially the transition was a little tough and there was more than a little public resistance, but the results had been nothing but positive. Ridership had risen more than three-fold already and was still climb-ing. Automobile use had dropped significantly and the air quality numbers showed a big improvement. For those who still chose to drive and pay the $100

Adaptive Urban Planning for Climate Change | ID589 | Systems Workshop | Fall 2006 | Ahn : Chong : Crimmin : Lee : Montgomery : Wilmot 80
System Elements
or more to fill up, the roads were considerably less congested, even with quite a few roads dedicated as busways to separate the BRT system from au-tomobile traffic. Since the BRT vehicles didn’t compete on the same roadway with autos and had priority signaling at intersections, they were able to maintain their schedules easily.
For other commuters who took the El, things were better as well. Fares had been eliminated for the trains as well, and CTA had added quite a few new cars. They had the same commitment to headways of less than five minutes for all vehicles in the CTA system. The planning had been well thought out, in part because Jaime Lerner, the former mayor of Curitiba and the inventor of BRT, had been re-tained as a consultant when CTA had decided to move forward with FreeRide. His experience in setting up Curitiba’s transit system was invaluable to the City during the planning and transition.
One of Jaime’s suggestions seemed particularly odd at first and was extremely hard to swallow for the CTA management. But like most everything else Jaime recommended, this proved to be crucial to the success of the transit system. He had in-sisted that all full-time employees, all executives, and board members – especially the executives and board members – had to use CTA as their primary
mode of travel if they were to stay on. It is not sur-prising that any system works much better when those who manage it are faced every day with the consequences of their actions. They had daily re-minders of what was working and what was not.
But then, so did Eric. And as far as he could see, things were working pretty well. Yes, Irene was not going to let him forget how much time and money he was saving now, and she had a plan for how to spend at least a little of what they were saving at the upcoming sales along North Michigan Ave.

Adaptive Urban Planning for Climate Change | ID589 | Systems Workshop | Fall 2006 | Ahn : Chong : Crimmin : Lee : Montgomery : Wilmot 8�
System Elements
Description??????
Properties• A human-made extension of an existing roof • A garden on top of a roof• Green space in the urban city
Features• Lowers building temperatures• Lowers utility bills• Extends life of rooftops• Replaces the green space lost to building devel-opment• Supports growth of vegetation• Promotes biodiversity• Cleans the air• Reduce the urban island heat effect• Absorbs excess storm water
DiscussionAs cities become denser with people, develop-ment is sure to follow, thus expanding the urban concrete jungle. Cities like Chicago that are lined with skyscraper after skyscraper become suscep-tible to urban heat effects. Coupled with the onset of global warming, Chicago is undoubtedly feeling the pressures of excessive heat. In 1995, the city experienced its worst heat wave, where tempera-tures rose to 106 degrees fahrenheit, but with fac-tor in humidity and the ambient air felt more like 120 degrees fahrenheit. Temperatures remained in the low 90s to low 100s for a week, and as a result over 700 people died.
With rising temperatures caused by global warm-ing, the urban environment becomes an ideal target for this type of climatic disaster. Though development is necessary to accommodate popu-lation growth, it reduces the city’s green footprint which is necessary for the existence of a healthy urban environment. One of the key contributors to Chicago’s urban island heat effect is the materials used to construct buildings, such as concrete and asphalt. These materials have significantly differ-ent thermal bulk properties and surface radiative properties than surrounding rural areas, which help balance out negative environmental stresses. For
Green Roofs

Adaptive Urban Planning for Climate Change | ID589 | Systems Workshop | Fall 2006 | Ahn : Chong : Crimmin : Lee : Montgomery : Wilmot 82
System Elements
example, the dark color of asphalt is non-reflective and very heat absorbent.
One successful way to counter overheating in the city is through green roof initiatives. They are an extension of the existing infrastruc-ture, but replace green space lost to the footprint of the building. Green roofs are lightweight, engi-neered systems that allow for the growth of veg-etation without compromising the integrity of the original roof.
There are two types of green roofs: extensive and intensive. Extensive green roofs are lower in weight, cost and maintenance. Usually sedums, grasses, and wildflowers will be grown in these types of green roofs, which only require a few inches of soil and very little irrigation. However these types of green roofs do not accommodate hu-man traffic. Intensive green roofs on the other hand are heavier, costlier and require more maintenance. Typical vegetation includes flowers, shrubs, tress, and vegetables.
Green roofs are an effective way of cooling the air in urban centers where temperatures are gener-ally a few degrees hotter than rural surroundings. They provide many benefits which are enjoyed by all. Environmentally, they can help clean the
air, reduce noise pollution, increase biodiversity, dampens the urban heat island effect, and reduce up to 75% of storm water runoff, which can carry contaminants such from the building surface and into the water system. Socially, they provide an aesthetic benefit and return lost green space. Eco-nomically, they help conserve energy, reduce util-ity bills by up to 10%, lengthen the longevity of the roof and increases property value.
ScenarioMadeleine works at Outdoor Gear on King Street West at the Toronto location. It is a retail store that specializes in outdoor clothing and equipment. Her reasons for working here is that she is very passionate about environmental issues. One of the favorite things she enjoys doing is going up to the green rooftop garden for lunch everyday, where she gets a great view of the city, while in a green space.
At Outdoor Gear, they have an extensive green rooftop, where wild grasses flourish. Bird, bees and other bugs flock to this small urban green oasis, and seeing this makes Madeleine feel good about the company that she works for. Though they are not widely popular, green rooftops are definitely catch-ing on in Toronto, and Outdoor Gear is a leader in this movement.

Adaptive Urban Planning for Climate Change | ID589 | Systems Workshop | Fall 2006 | Ahn : Chong : Crimmin : Lee : Montgomery : Wilmot 8�
System Elements
When Madeleine first started working at Outdoor Gear two years ago, the building did not have a green roof and was far less energy efficient. Dur-ing the summer, the baking heat would be sucked into the building, making it overly warm and un-comfortable. To mitigate this, the building facili-ties manager would increase the air conditioning output, which resulted in high energy bills, and gave Bill, her manager the incentive to build a green roof. Since then, the building has been kept cooler thus reducing energy bills and leaving more resources to other store improvements.
Green Roof

Adaptive Urban Planning for Climate Change | ID589 | Systems Workshop | Fall 2006 | Ahn : Chong : Crimmin : Lee : Montgomery : Wilmot 8�
System Elements
DescriptionA system of small-scale urban farms set up on va-cant property, or as an amenity for new develop-ment. The farms are constructed of topsoil and mulch brought onto the site and irrigated primarily with stormwater from WaterWork.
Properties• An urban farm for raising local produce.• A method of increasing local employment, par-ticularly for low-income residents.• A new amenity for urban apartment and condo dwellers.• A strategy to reduce the transportation and other petroleum based burdens for food.• A method for reducing soil erosion from agriculture
Features• Provides organic produce for local consumption.• Provides local employment.• Adds new amenity to increase urban residential de-velopment.• Reduces city’s carbon footprint from food growth and consumption.• Reduces demand for irrigation water from tradi-tional aquifers.
DiscussionAs one shops at the local grocery store, it is not often obvious where fresh produce has been grown or how far it traveled to get to the produce aisle – more than 1500 miles as a national average. In Chicago the distances traveled for specific produce is:
• 2143 miles for grapes• 2095 miles for broccoli• 1671 miles for asparagus• 1555 miles for apples• 813 miles for corn• 781 miles for squash• 233 miles for pumpkins
As a result of this long distance travel – much of it by airfreight – large amounts of CO2 are added to the already-significant problem of global warming. This excessively large distance food travels from farm to table, when coupled with the extreme de-pendence of agriculture on petroleum products for everything from combines to pesticides to fertil-izers, makes what should be a green process to one that is anything but.
Even a decade ago it took $1.00 worth of petro-leum based products (in fuel for farm equipment plus the base for duratives of pesticides and fer-
CityFarm

Adaptive Urban Planning for Climate Change | ID589 | Systems Workshop | Fall 2006 | Ahn : Chong : Crimmin : Lee : Montgomery : Wilmot 85
System Elements
tilizer) to produce $1.50 worth of crops. While petro-based pesticide production use has increased 33 fold in the past 50 years, crop loss to pests has increased 20%, largely because more than 500 pests have become resistant to our most powerful chemical weapons.
Additionally, our heavy dependence on repeated tilling has resulted in six bushels of topsoil washed into the ocean for every bushel of corn produced. Over the past century, the North American prairie has lost more than a quarter of its topsoil and a third of its fertility. And finally, the agricultural industry accounts for 70 percent of total worldwide water use taking 60 gallons of water to produce 1 pound of grain. Much of this irrigation water is from fossil water reserves, which are rapidly being depleted.
These problems can be addressed within the city by CityFarm.
The Resource Center in Chicago has more than 30 years of experience in non-profit recycling and re-use. Recently the center has put that experience to use in developing urban farming. They have con-verted city-owned lots of rocks, dirt and chunks of wood to one-acre farms each with 1,500 tomato plants and nearly year-round growth of carrots,
beets and other root crops, producing high-qual-ity produce for consumption at a number of local restaurants.
In order to have the significant impact needed for a global adaptation strategy, this small example will be greatly expanded to a citywide initiative. Al-ready, cities like Hong Kong and other Asian cities produce much of their produce needs within their city limits with similar strategies. America’s own experience with Victory Gardens of WW2 also shows the clear applicability of widespread urban farming on small individual parcels.
Because there are plenty of vacant lots in the city, particularly in distressed neighborhoods with de-pressed property values, this is a strategy with great potential. One-acre farms such as those by Chicago‘s Resource Center can employ three people from the neighborhood, generating a salary of $20,000 each derived from sale of the produce. The farms can be established quickly and on a tem-porary basis for vacant lots that may later return to traditional residential or commercial develop-ment.
As the founder of this concept, Ken Dunn, has said, “The areas where this is available is where there is a need for jobs.”

Adaptive Urban Planning for Climate Change | ID589 | Systems Workshop | Fall 2006 | Ahn : Chong : Crimmin : Lee : Montgomery : Wilmot 86
System Elements
But the concept is not limited to the more distressed neighborhoods. With the very large increase in condominium and loft apartment development in the urban core, CityFarm is a great option for a common amenity. Upscale apartment and condo-minium dwellers will value the opportunity to ex-ercise their ‘green thumbs’ while taking advantage of the potential for high quality produce. Further-more, this is a demographic likely to buy into the environmental aspects that this brings to the com-munity.
To establish the farm plot, topsoil and mulch are brought in and placed atop the existing site for an optimum organic growing medium. This approach eliminates much of the problems of the current agri-business. The tilling and erosion problems are eliminated; organic farming and polyculture help to eliminate the pesticide and petro-fertilizer issues. Irrigation needs are greatly reduced by the methods used to establish the growing medium; and finally, the source of this irrigation water can come from WaterWork, another urban adaptation strategy.
This strategy works in many ways to advance ur-ban adaptation to climate change. It provides an extensive source of reliable produce production
within the heart of the city. It essentially eliminates the dependence on petroleum and the pesticide and fertilizer derived from petroleum. It eliminates the rampant erosion typical of traditional tilling. And it is much less water intensive and relies on recy-cled water within the city. The CityFarm produce replaces an equal amount that would otherwise be produced in ways very unfriendly to the environ-ment and/or be transported over great distances.
Beyond all these environmental benefits, the quali-ty of produce for the consumer can be significantly increased because the produce can be picked at its optimum time, due to the short distance for trans-port within the city.
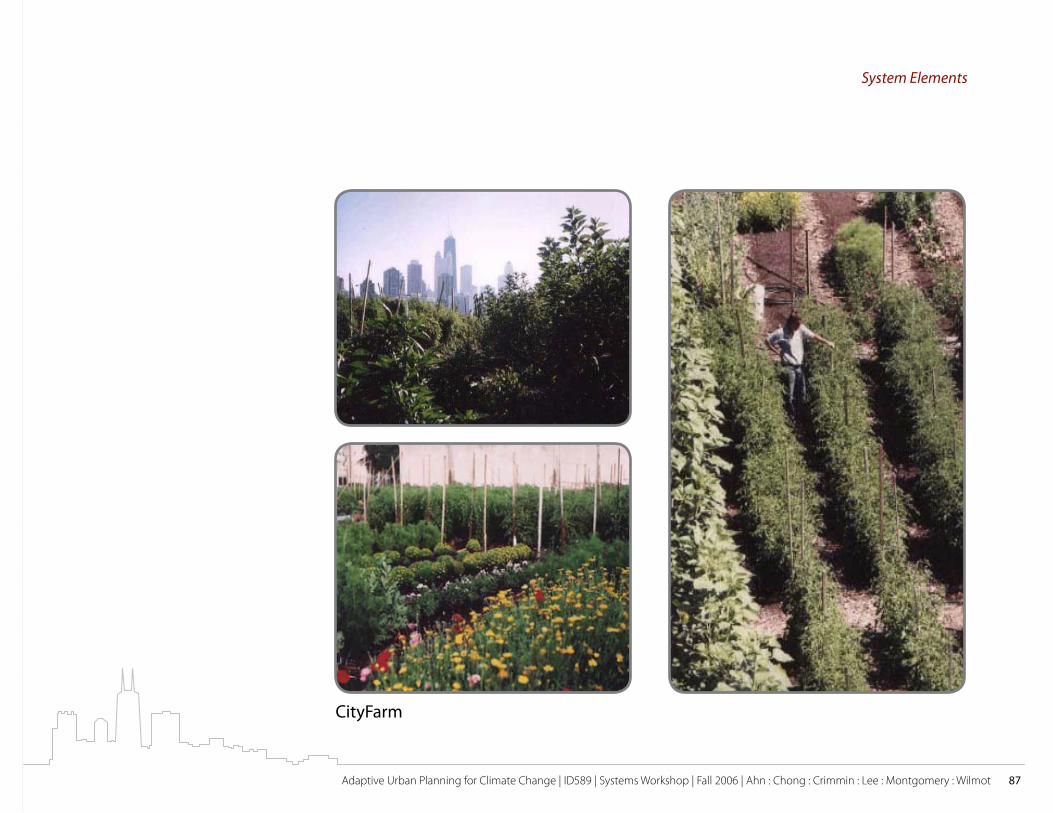
Adaptive Urban Planning for Climate Change | ID589 | Systems Workshop | Fall 2006 | Ahn : Chong : Crimmin : Lee : Montgomery : Wilmot 8�
System Elements
CityFarm

Adaptive Urban Planning for Climate Change | ID589 | Systems Workshop | Fall 2006 | Ahn : Chong : Crimmin : Lee : Montgomery : Wilmot 88
System Elements
ScenarioThree Chicago families living very different lives in very different parts of the city share one surpris-ing thing. Each Saturday morning, they are tending their plots at a CityFarm.
Tom stays on the West Side. Life there can be hard, especially when you have no regular job and “home” is elusive. But Tom had been watching the development of CityFarm in his neighborhood and as the farm started to take shape, he decided to stop by and check it out. When he found out he could work at CityFarm without a work history and a background check, he decided it might be worth signing on.
He showed up the first day his neighborhood City-Farm opened and never left. The satisfaction of producing something that feels real and complete is a new experience for Tom. By the end of the season, Tom had learned that hard work at City-Farm produced a living wage. The unexpected benefit of learning small business skills, along with basic farming skills taught at the site helped Tom move into the lower management ranks of City-Farm. His life is more organized than it has been in years, and he takes a lot of pride and satisfaction in his work.
Tomeka is the mother of three young children. Two are now in school, with one just about to enter kin-dergarten. Tomeka works as a clerk at City Col-lege. The job doesn’t pay particularly well, but it does offer her the opportunity to take classes free at the college. During her workday, she takes a class in the morning before work begins and again at noon, bringing her lunch along.
Taking care of the kids, studying for her classes and working doesn’t leave Tomeka a lot of time for much else. However, when CityFarm opened in her neighborhood, the kids were curious and so was she. Tomeka saw families working together at the farm and decided that she and the kids would benefit from working together of a project as equals where the outcome was concrete and non-debatable. Try-ing to keep three young kids traveling the straight and narrow leads to a lot of fussing and tension. At the farm, Tomeka and her kids were taught the basics of urban farming – what crop worked best for this soil or that season, which crops were easier to grow for novices like her family, and how and when to plat, water and tend for potential pests. They worked alongside each other as a team with a shared goal. It has brought them closer together as a family and helped Tomeka realize each child’s particular talents. She plans to communicate that

Adaptive Urban Planning for Climate Change | ID589 | Systems Workshop | Fall 2006 | Ahn : Chong : Crimmin : Lee : Montgomery : Wilmot 89
System Elements
to their teachers in hopes that she can improve their chances for success in the classroom.
John and Carol are a couple of 50-something emp-ty nesters who recently moved to Chicago. Their home is a small condo in a converted mid-rise industrial building in the West Loop near Union Station. The couple shares green sensibilities, recycling as much as possible and taking public transportation daily. Although most of their food still comes from Dominic’s or from Whole Foods, they appreciate the fresh herbs and produce that they grow themselves. John has a green thumb and grew his own herbs on the balconies at their previ-ous urban home.
They chose their current condo in part because they saw the CityFarm in their neighborhood as a way to meet new neighbors, to connect to Chi-cago, and to live their green values. But they see the farm as just a beginning. They would like to add a recycling center and a coffee bar to the farm to make it the gathering place that the immediate neighborhood is missing. The CityFarm in their neighborhood is not directly associated with their condo development but is a part of the develop-ment next door. It was part of the redevelopment of that building two years ago. As that develop-ment was being planned, the developer learned
that the Department of Construction and Permits had a green roof initiative that had recently been expanded to include CityFarm as part of that strat-egy. The city has certain requirements for green development and CityFarm was one of the options. In choosing this option, the developer was required to devote a certain portion of the top deck for the parking garage that was already planned. In ad-dition, the CityFarm is open for use by all local residents at a small fee.
Over the past five years, CityFarm has been so suc-cessful throughout the city that there are now more than 700 locations. There is an overall manage-ment organization that now has a steady supply of produce that is large enough that they have con-tracted with Whole Foods as a supplier.

Adaptive Urban Planning for Climate Change | ID589 | Systems Workshop | Fall 2006 | Ahn : Chong : Crimmin : Lee : Montgomery : Wilmot 90
System Elements
DescriptionA new water saving fire hydrant design
Properties• Provides advanced solutions over traditional uses of hydrants• Utilizes advanced agent technologies that im-prove duties of all users
Features• Bio-foam chamber containing high expansion foam cartridge chambers• Keyed operation that prevents unauthorized use and waste of water• Bio Foam Cartridges (inserted at time of use) allow firefighting and street cleaning with significant water reduction.
DiscussionThe Bio-Hydrant is a new product design stem-ming from insights provided by the Threat Prioriti-zation Matrix. Answering the challenge of system-ic solutions providing for the reduction of water consumption, the Bio-Hydrant combines chemical engineering with product and process design to solve three major use challenges of today’s fire hy-drant system.
First, the primary function of a fire hydrant is for easy access to water for fire suppression. This is challenged in colder climates as winter use can prove a challenge as hydrants sometimes malfunc-tion due to freezing. Also, fire fighting has pro-gressed in the use of agents and compounds that are proven to fight fire more effectively and safely than water.
The new Bio-Hydrant couples this technology with a cartridge type of approach the uses water sup-ply from existing hydrant infrastructure to catalyze the expanding foam reactions from the cartridges. Supplementing this design is the capability of fire fighters to swap different cartridge types as appro-priate to the type of fire they are fighting.
A secondary challenge of the fire hydrants tradi-tional design is it’s use by street cleaning machines
Bio-Hydrant

Adaptive Urban Planning for Climate Change | ID589 | Systems Workshop | Fall 2006 | Ahn : Chong : Crimmin : Lee : Montgomery : Wilmot 9�
System Elements
that depend on water for dust suppression and superior cleaning capability. This new cartridge system also extends to save water consumption in this case in similar fashion to popular bathroom cleaning products. Filling the street cleaner with a foaming solution allows for minimum water use in performing street cleaning activities. Addition-ally, since the cartridge contexts are designed to be biodegradable no harm is done to the environ-ment with residue that is left on the street. And as an added benefit, the foaming solution can be de-signed to provide cleaning capability beyond that provided by water alone. This allows for oils and fluids typically leaked out by cars to be collected an processed in the street cleaner processing cen-ter rather than by infiltrating ground water systems during rain storms.
A third benefit of this hydrant design is the water savings recognized by minimizing the amount of water spent in summer months when unauthorized groups open hydrants, creating intersection floods that waste large amounts of water. By requiring the cartridge for operation, the water flow is capped well below ground level. This also addresses the freezing troubles cited earlier. Even in a citizen had access to a cartridge, the product of the hydrant would be a foaming agent, and not conducive to water play.
ScenarioAs mentioned, this new product benefits the prima-ry function of the fire hydrant in enabling fire sup-pression. In this scenario, City firefighters show up to the scene of a fire with all the same equipment that they would usually use to fight a fire. How-ever, this fire happens to be at a chemical plant, and typical water suppression techniques only serve to spread the fire.
This new hydrant design allows the firefighters to adapt to the situation by accessing the cartridge kits now carried by all fire engines throughout the city. In this case, a different type of cartridge is selected- One that expands quickly at first, and then slowly after application. This cartridge agent serves for dousing chemical and electrical fires more safely than standard cartridges used in put-ting out household fires that mainly include lumber as a fuel source.
By using these cartridges along with water supply from the Bio-Hydrant, the fire is suppressed sig-nificantly faster which saves the amount of water used in the emergency, and ultimately reduces the amount of damage by containing the fire with the new formula foaming agents.

Adaptive Urban Planning for Climate Change | ID589 | Systems Workshop | Fall 2006 | Ahn : Chong : Crimmin : Lee : Montgomery : Wilmot 92
System Elements
DescriptionAttached to water “mains” throughout the city, this solution is a metering tool that calculates flow to dif-ferent neighborhoods throughout the year. Data is gathered by a handheld device that allows city of-ficials to evaluate and plan new agendas for water consumption and development.
Properties• Plumbing coupling attached to water mains sup-plying different grids/neighborhoods• CPU in unit provides current monitoring and his-torical data• Graph outputs showing peak draw times, days, weeks with associated volumes• Underground application in manhole or vault en-vironment
Features• CPU hardwired to permanent or battery backup sys-tem• Monitor ‘reader’ used by officials to point-and-read• Graphic display• Computer upload capacity
DiscussionThe lack of water is a global threat that will increas-ingly affect our planet over the next generations. The issue of how water is used and monitored is already a hot topic in cities in drier climates such as Phoenix and Las Vegas. As an example, these cit-ies have recognized water scarcity and responded by requiring the removal and replacement of sod and non-natural landscaping and with natural des-sert landscaping.
Through other agendas such as the US based LEED system for building, water consumption is credit worthy with 20%-30% reductions easily realized by simple choices of low flow fixtures for potable use and rain barrel and drip systems for landscap-ing. Other city agendas often request watering to occur at night when less water is lost to evapora-tion. But how else can a city manifest its interest in conserving water?
The Water Monitor system allows for accurate information collection that categorizes use per neighborhood on a per/capita basis. With this in-formation, city planning can leverage this empiri-cal evidence to then target technical solutions for developers and homeowners as well as fine tune messaging campaigns to heavy use areas.
Water Monitor

Adaptive Urban Planning for Climate Change | ID589 | Systems Workshop | Fall 2006 | Ahn : Chong : Crimmin : Lee : Montgomery : Wilmot 9�
System Elements
Data is transferred in two steps. The first collec-tion of data occurs at the underground location where the monitor lives. In frequently scheduled readings, city officials collect this data on their handheld monitor capture device. This device is equipped to capture inputs from multiple loca-tions. Once rounds are completed by the official, the handheld device is taken back to the city office, and data is uploaded to a desktop application that compiles and integrated the new information with previously collected data for comparison. This data informs ClimateNet as an input that informs the dynamic nature of Performance Web and the Threat Prioritization Matrix.
Scenario: Water Action CampaignWith fresh water supplies becoming increasingly strained, a city recognizes the need to conserve wa-ter. As a first step, knowledge of where the most water is being used, and at what times consump-tion is peaking is critical data to support further ac-tion agendas. As a prototype, the Water Monitor is a product that is chosen to be installed on water mains that supply several neighborhoods across a range of demographic criteria.
Over the course of a 2 year test, a single city official is designated as being responsible for the monthly collection of data from individual sites that contain the underground monitors. With a handheld, wire-less reading device similar to those used by many utility companies, data is collected with the simple press of an “upload” button.
With this transaction, the previous months water flow and activity recordings are uploaded from the underground unit to the handheld unit. This frees data space on the underground unit for recording the next month’s usage. The handheld unit be-comes the carrier of the information between the on site location and the home base computer.
Once back to the office, the information is upload-ed to a mainframe database. Via a standard USB or fire wire connection, all the collected data from the many sites is uploaded to a main database. This new information is already formatted form the out-put of the underground monitor, and syncs up to the previous month’s data that has already been in-put from previous rounds by the city official.
As the database grows, patterns of use can be ob-served and evaluated. The longer the data is col-lected, the more accurate city officials can pinpoint seasonal and location water consumption trends. With this data, the city can appropriate PR cam-paigns to specific neighborhoods who are shown to be the heaviest users of water. It can also help to survey housing types and landscaping trends that may cause over consumption. This may help city departments such as Buildings and Zoning to evaluate potential rules and regulations for new de-velopment agendas.

Adaptive Urban Planning for Climate Change | ID589 | Systems Workshop | Fall 2006 | Ahn : Chong : Crimmin : Lee : Montgomery : Wilmot 9�
System Elements
DescriptionA system of neighborhood scale waterways to transport stormwater along the surface to mitigate the problems associated with combined sewer sys-tems and to replicate the natural drainage system that existed before urbanization.
Properties• A series of surface water transport and storage structures.
Features• Reduces the demand on the city’s sanitary sewer system.• Provides use of stormwater to offset demand on the city’s potable water system.• Provides aesthetic water features within neigh-borhoods.• Helps to revitalize distressed neighborhoods.
DiscussionFour Philadelphia architects, Charles Loomis, Cha-riss McAfee, Juliet Geldi and Gavin Riggall, have designed a comprehensive system they called Wa-terwork that envisions using stormwater manage-ment to rehabilitate urban areas in decline. This proposal won the grand prize in a year-long design competition in Philadelphia, completed earlier this year.
Chicago, like most American cities, has a perpetual problem in dealing with stormwater impact on its combined sanitary and storm sewer system. Ide-ally these should be separated. (See sidebar.) For mild events, the system has the capacity to deal with total flow, although the cost to treat stormwa-ter is a large burden on the city. However, peak events (summer storms and similar events) over-whelm the city’s wastewater treatment plants and oily street sewage mixed with human sludge is dumped into the Chicago River. The system designed by the Philadelphia team con-tains excess rainwater, using simple principles now used in large-scale projects in Germany and Amer-ica. The plan replicates the effect of a crisscross of streams and creeks to capture, store, purify and return the water to the aquifer. This new system closely replicates the original stormwater drainage
WaterWork

Adaptive Urban Planning for Climate Change | ID589 | Systems Workshop | Fall 2006 | Ahn : Chong : Crimmin : Lee : Montgomery : Wilmot 95
System Elements
system and keeps stormwater drainage out of the wastewater system.
As team architect Juliet Geldi put it, the plan was to re-create that original ecology with a “new ur-ban watershed” that would follow “the path of the water from the rooftop, through local cleaning and storage devices, eventually returning the water to the aquifer” or to the local rivers in a clean state.
The plan uses water features like pebbled ponds and grassy swales to carry and purify stormwater. Canals and surface streams will carry the water now introduced into underground pipes. The clean water will be carried along the surface from neigh-borhood to neighborhood on its way to the rivers, and will provide a resource for irrigation and other uses. This is a greatly expanded stormwater plan to supplement Chicago’s current rain-barrel plan and to reduce the burden on the city’s sanitary sewer.
The new plan called WaterWork aims to return the water cycle to one that employs natural processes and provides a visual amenity through form and function of the system. This system will be em-ployed in Chicago to combine with CityFarm in a synergistic way to increase mitigation effects. In effect this will begin the separation of the city’s sewer system into two distinct storm and sanitary
systems, customized to deal with very different conditions. The existing combined sewer system will increasingly become a sanitary sewer system relieved of the burden of stormwater. Increasingly, stormwater will be intercepted before it enters the sanitary system and will be treated naturally in the new WaterWork system.
WaterWork need not displace any occupied land, because the new planned waterways follow the ex-isting grid of streets and rights-of-way. The system is completely expandable and scalable, because one-by-one, households can divert water from their roofs and yards into the neighborhood WaterWork. Also in the same expandable and scalable manner, the water carried by the WaterWork will be able to act as a sink in the changing rainfall patterns result-ing from global climate change.
WaterWork will increasingly become a resource for the growing CityFarm. Wherever possible, and particularly where paired with CityFarm, a loca-tion will be sought for each block or group of up to 4 blocks, where a small storm pond will be created to reduce the effect of larger rain events and as a temporary reservoir for irrigation.

Adaptive Urban Planning for Climate Change | ID589 | Systems Workshop | Fall 2006 | Ahn : Chong : Crimmin : Lee : Montgomery : Wilmot 96
System Elements

Adaptive Urban Planning for Climate Change | ID589 | Systems Workshop | Fall 2006 | Ahn : Chong : Crimmin : Lee : Montgomery : Wilmot 9�
ScenarioAs Sang-Ho came home from work, he had to struggle to stay dry. The thunderstorms were getting quite intense lately. It was surpris-ing to see just how much water a storm like this would generate, especially now that it was clearly visible in the WaterWork system that carried storm drainage along the surface, as opposed to within the underground sewage system.
Just a few years ago, all of this water would have been introduced into the city’s sanitary sewer system and would have greatly overwhelmed it. Even with the deep tunnel system in Chica-go, there was not enough capacity for storms such as these. Since the WaterWork system had begun a few years, the number of events where the sewer system was overwhelmed was becoming fewer and fewer – even with the in-crease in storm severity.
If it weren’t for the struggle to keep at least a little bit dry, Sang-Ho might have enjoyed the walk. He had to admit that the aesthetic fea-tures of WaterWork were impressive and add-ed significantly to the beauty of the walkway. With a combination of grassy swales mixed with small rain gardens adjacent to the street,
nicely detailed surface drainage structures along other parts of his path, and small reser-voirs every block or so, it was quite a wonderful addition to the streetscape. The Chicago Park District had done a commendable job of inte-grating WaterWork into neighborhood parks and even the larger campus parks throughout the city.
In some neighborhoods, WaterWork was di-rectly integrated with CityFarm plots. If the weather improved as predicted, Sang-Ho would be at his local CityFarm on Saturday. In spite of the general drought of the past several months, this rain would likely mean he would not have to irrigate his plot this weekend, but WaterWork would allow this rain to recharge the reservoir in case it was needed next week.

Adaptive Urban Planning for Climate Change | ID589 | Systems Workshop | Fall 2006 | Ahn : Chong : Crimmin : Lee : Montgomery : Wilmot 98
System Elements
DescriptionPower Meter is a tool that monitors and displays the CO2 produced by a household or company. It taps into touchpoints of power use and compiles CO2 in-formation.
Properties• System that monitors household or compa-ny-wide CO2 production• Connects to electric meter, oil tank, gas me-ter, hot water heater and records use• Compiles information in central local data-base and converts use data into CO2 produc-tion data• Disseminates and displays critical informa-tion on interactive LCD• Connects via local network with ClimateNet and uploads data
Features• Allows individuals to track CO2 production over time• Programmable to set weekly, monthly, yearly goals• Downloadable to computer and ClimateNet to compile large samples of data• Allows green companies to display results as part of advertising campaign• Allows households and companies to com-
pare their CO2 production with each other and with foreign counterparts• Programmable to flexibly account for renew-able resource useProduction of rating may be used for future tax incentives or other initiatives
DiscussionIn an urban environment buildings contribute a substantial amount to the generation of greenhouse gases primarily through their heating and electric-ity use.
Technology exists to assist buildings in decreasing energy use. The problem is that there is no user friendly platform that allows individuals to moni-tor their building’s CO2 generation.
There is evidence that demand for such a product exists. Despite our reputation (and track record), the American population cares deeply about envi-ronmental concerns. A recent Gallop Poll reported that 40% of Americans “personally worry about the environment a great deal,” and 37% “worry about the environment a fair amount.” Recent successes of hybrid vehicles and organic food point toward a trend of ecological friendliness.
The Power Meter allows homeowners to play an
Power Meter

Adaptive Urban Planning for Climate Change | ID589 | Systems Workshop | Fall 2006 | Ahn : Chong : Crimmin : Lee : Montgomery : Wilmot 99
System Elements
active role in the mitigation of climate change. The Power Meter has remote connections to each major energy gauge: the oil tank (or gas meter), the elec-tric meter, and the hot water heater. It wirelessly sends its information directly to a wall-mounted interface or a home computer, where it operates as a background widget.
Power Meter translates energy use into CO2 pro-duction and continuously records and plots use. This allows the user to view peak use times of day, week, month or year. It also allows users to more directly quantify efforts that they themselves may have taken to improve energy efficiency. For ex-ample, they would immediately know how much more efficient a new refrigerator is compared with an old model.
Additionally, the results from Power Meter are au-tomatically uploaded onto ClimateNet whenever a user checks the widget. This allows not only for household tallying of CO2 production but it gives private companies a chance to publicize their gains in efficiency, should they choose to do so.
ScenarioPhil turns on his home computer to check his email. After checking it and closing his brows-er he sees on his desktop the widget for Power Meter. It quietly displays a graph of energy use for the month. He clicks it.
A small applet instantly boots up and displays the most important information about Phil’s home energy consumption: heat, electricity, and gas. The figures show that his family’s ef-forts to reduce their energy consumption are slowly starting to take effect. Their new clothes drier was installed a month ago and they had the old windows upstairs replaced.
In the bottom right corner the applet neatly shows their expected savings this month: $33.47.
Phil closes the applet and puts his computer to sleep.

Adaptive Urban Planning for Climate Change | ID589 | Systems Workshop | Fall 2006 | Ahn : Chong : Crimmin : Lee : Montgomery : Wilmot �00
System Elements
DescriptionYellow Light is educational TV programs for all the people, affected climate changes, to not only increase their awareness of regional climate changes, but acknowledge them how to cope with the changes. Yellow Light is implimented in the programs, existing popular TV programs such as Sesame Street, Simpsons or CNN News. All the programs will be deliverd and organized by the tones, detemined in Concept Communication, and supported by alliance institutions, established by Alliance Connector. It is customized in terms of different geographical threats and age groups to increase their interests and comprehension. It will deliver the knowledge of climate changes, such ascauses, changes, impacts, adaptive and mitigative soluitons, and etc. Moer importantly, it can deliver many different ranges of tones and subjects due to verious capabilities of programs.
Properties• A communicational and educational channel • A tool to increase public awareness
Features• Increase public awareness• Acknowledge how to cope with climate changes• Inform city’s adaptive actions and achievements• Select programs by different communication tones• Costomize contents in terms of different geo-
graphical threats and age groups • Interconnect with Alliance Connector
DiscussionDetermining tones of communication is very im-portant to achieve goals, and also determining communication channels is critical. There are many different communication channels. Each channels have strangths and weaknesses. A communication-al and educational channel, Yellow Linght is one of communication channels. Yellow Light is imple-mented in the programs, existing popular TV pro-grams such as Sesame Street, Simpsons or CNN News. It is very flexible to inform and educate ve-rious ranges of tones and age groups because TV programs have different target groups ans tones. Following paragraphs are examples that how Yel-low Light can be implemented in different kinds of programs with verious tones.
Next generation will be the victims of climate changes. We have a obligation to educate and train them to cope with acute situations. Cartoon for Children can do the role on TV. To increase young children’s participation, programs directors and the managers of the Ministary of Education should discuss how to approach young children with the program and what messages the program delivers. Yellow Light would provide various depth of mes-sages by different programs to different age groups,
Yellow Light

Adaptive Urban Planning for Climate Change | ID589 | Systems Workshop | Fall 2006 | Ahn : Chong : Crimmin : Lee : Montgomery : Wilmot �0�
System Elements
even adults. In USA, King Of the Hill and The Simpsons have not only very high popularity rat-ings, but extensive audience groups. Even though the both cartoon movies deal with heavy topics, audiences don’t feel a repugnance for the cartoons. Like other heavy topics, climate changes can be handled in a effective way by Cartoon for Adult.
Dacumentary should be delivered with a story. Knocking people’s sensitivity is a highly recom-mendable approach to deliver knowledge and mes-sages. Dacumentary could be watched various age groups. All the family members can watch it to-gether and understand the threats of climate chang-es through the indirect experiences. For instance, Dacumentary tells a story of a penguin family, liv-ing south pole. Due to global warming, they are in danger of losing their roosts. Young penguins even die because of the difficulty of adaptation. Whole story could personify the penguin family.
Movies will deliver the messages of the urgency of climate changes. Most movies, handling acute global warming situations, are based on future events. Even though the stories are extrem and fiction, they are enough to warn audiences what might happen if we don’t act now, or at least give people a chance to talk and think about whether the serious situations could happen.
News is to inform the laest events to audiences
and to warn and commend what to do when the situation is urgent. It also announces not only how city or government is doing to adapt and mitigate climate changes, but what government achieved.
ScenarioJin is 10 years old elementary school student. One day, he comes back home from school with his friends, and they sit on the living room and turn on the TV to watch their favorite program, Sesame Street. They saw one character has a hard time us-ing Green Bag, Separate Garbage Collection Cam-pain. He and his friends laugh and giggle because they think they could do better. Few days later, Jin trys to help his mother seperate garbage. He learns how to seperate from the TV program.
Jimi is 20 years old college student and lives in Chicago. He goes to his friend’s house to do ge-ography homework together. Around 8 pm, they are tried, and turn on the TV to take a break. They watch Game Show, a quiz competition between three people. One competitor chooses a subject on the quiz category board. Subject is “Hurricane”. All the questions are how to adapt climate changes. Jimi and his friend are also answering queations and competing each other. At the end of the show, they realize that they know very little about climate changs. And they decide to do research for Chica-go’s climate threats as a school assignment.

Adaptive Urban Planning for Climate Change | ID589 | Systems Workshop | Fall 2006 | Ahn : Chong : Crimmin : Lee : Montgomery : Wilmot �02
System Elements
Sesame Street
The Simpsons
Documentary
Game Show
CNN News
The day after
tomorrow
Program
5:�0 pm
6:�0 pm
�:00 pm
8:00 pm
9:�0 pm
�0:�0 pm
Time Audience
Fun
Satire
Knocking
Sensitivity
Exciting
Informing
Fun & Exciting
Approch
Being familiar with the topic
Bring the topic to public
Develop emotional attachment
Educate knowledge of emergency,
adaptation and mitigation
Inform urgency of people’s act and
the newest events
Understand what would happen in the future
�+ yrs
��+ yrs
8+ yrs
�5+ yrs
�8+ yrs
�8+ yrs
Example