Embed Size (px)
Citation preview

EXPERIMENT 5 Fischer Esterification
MASSACHUSETTS INSTITUTE OF TECHNOLOGY Department of Chemistry
5310 Laboratory Chemistry
EXPERIMENT 5
Fischer Esterification The Organic Synthesis Isolation Purification and Characterization of a Natural Flavoring Agent
The Use of Boiling Point Density Refractive Index NMR and Mass Spectrometry as Laboratory Tools for Analyzing the Product obtained Using
Wet Chemistry Techniques
I PURPOSE OF THE EXPERIMENT
This is an integrated experiment which combines techniques from Organic Thermodynamics Physical and Analytical chemistry It has been designed to introduce the student to
bull Organic Synthesis Synthesizing an ester from an acid catalyzed reaction of a carboxylic acid and alcohol
bull Fundamental Chemical Engineering Separation Process principles on refluxing bull Two phase solvent extraction using a Separatory Funnel bull Distillation at atmospheric pressure bull Precise handling and measurement techniques for volatile organic liquids bull Correct handling and operation of a Mass Spectrometer amp NMR Spectrometer bull Thermodynamics solution chemistry intermolecular bonding and organic nomenclature
II Safety of Chemicals1
You will be handling a number of chemicals during this experiment all of which must be treated with care in order to avoid harm to yourself or to the surroundings None of these chemicals should be ingested or allowed to come in contact with your skin and eyes You must take extra precautions to avoid breathing the vapors from these chemicals Assume that all of these volatile organic chemicals are flammable and each could be irritable to the eyes skin and respiratory system Descriptions of each of the chemicals follow with a brief summary of their properties
1 Various Material Safety Data Sheets Mallinckrodt Chemicals J T Baker Phillipsburg NJ Fisher Scientific MSDS Pittsburgh PA
Fischer Esterification-1
EXPERIMENT 5 Fischer Esterification
Methanol Flammable liquid and vapor Harmful if inhaled May be fatal or cause blindness if swallowed May cause central nervous system depression May cause digestive tract irritation with nausea vomiting and diarrhea Causes respiratory tract irritation May cause liver kidney and heart damage Target Organs Kidneys heart central nervous system liver eyes
Ethanol Flammable liquid and vapor May cause central nervous system depression Causes severe eye irritation Causes respiratory tract irritation Causes moderate skin irritation This substance has caused adverse reproductive and fetal effects in humans Warning May cause liver kidney and heart damage Target Organs Kidneys heart central nervous system liver
1-Propanol Flammable volatile organic liquid Harmful if swallowed inhaled or absorbed through the skin may affect central nervous system Causes irritation to skin eyes and respiratory tract Aspiration may cause lung damage
2-Propanol May cause central nervous system depression May form explosive peroxides Flammable liquid and vapor Hygroscopic Causes respiratory tract irritation Aspiration hazard if swallowed This material has been reported to be susceptible to autoxidation and therefore should be classified as peroxidizable Causes eye irritation Breathing vapors may cause drowsiness and dizziness Prolonged or repeated contact causes defatting of the skin with irritation dryness and cracking Target Organs Central nervous system respiratory system eyes skin
1-Butanol An eye and skin irritant A sensitizer which is hazardous in case of contact with skin Contact may be characterized by itching redness and sometimes blister formation
2-Butanol Avoid direct heat open flame Avoid contact with strong oxidizing agents and strong acids and bases Exposure can cause irritation to the respiratory tract dizziness headache nausea and narcosis Liquid and high vapor concentrations can be irritating and can cause conjunctivitis and corneal burns
2-Methyl-1-Propanol Flammable Irritating to respiratory system and skin Vapor may cause drowsiness and dizziness
1-Pentanol Hazardous irritant in case of skin (permeator) or eye contact Hazardous in case of ingestion or inhalation
Fischer Esterification-2
EXPERIMENT 5 Fischer Esterification
1-Hexanol An irritant if exposed to skin eyes and respiratory tract May cause inflammation in the eyes with characteristic redness watering and itching Repeated exposure can result in target organ damage
1-Octanol Skin eye and respiratory tract irritant Prolonged repeated skin contact may cause dermatitis
3-Methyl-1-butanol Highly flammable High vapor concentrations are irritating to eyes and upper respiratory tract Contact with skin may cause irritation
Benzyl alcohol Sensitizer slightly hazardous in case of skin contact Repeated prolonged exposure can produce target organ damage May be toxic to liver and central nervous system (CNS)
Benzoic Acid Eye skin and respiratory irritant Dust and liquid may cause mild irritation and redness Ingestion of large amounts can cause coughing nausea and vomiting
Formic Acid Contact with the eyes causes severe burns Could result in scarring and ulceration Causes severe burns on skin contact Can sensitize the skin causing an allergic reaction Could result in blistering of the skin on contact Ingestion or breathing in the vapor could cause sever burning in the digestive tract resulting in abdominal pain vomiting and possible death Vapors can cause dizziness nausea itching burning and swelling of the eyes
Butyric Acid Hazardous in terms of contact with skin eyes or respiratory system Contact with skin could cause burns The vapor or mist can produce tissue damage targets include the mucous membranes of the eyes mouth and respiratory tract Inhalation could cause coughing choking and shortness of breath
Propanoic Acid Hazardous in terms of contact with skin eyes or respiratory system Contact with skin could cause burns The vapor or mist can produce tissue damage targets include the mucous membranes of the eyes mouth and respiratory tract Inhalation could cause coughing choking and shortness of breath Eye inflammation will show up as redness itching and watering Skin inflammation is generally characterized by redness itching and blistering
Acetic Acid Hazardous in terms of contact with skin eyes or respiratory system Contact with skin could cause burns The vapor or mist can produce tissue damage targets include the mucous membranes of the eyes mouth and respiratory tract Inhalation could cause coughing choking and shortness of breath Eye inflammation will show up as redness itching and watering Skin
Fischer Esterification-3
EXPERIMENT 5 Fischer Esterification
inflammation is generally characterized by redness itching and blistering Repeated or prolonged breathing of the mist or vapor can result in respiratory tract irritation eventually leading to frequent attacks of bronchial infection
Isobutryric Acid Hazardous in terms of contact with skin eyes or respiratory system Contact with skin could cause burns The vapor or mist can produce tissue damage targets include the mucous membranes of the eyes mouth and respiratory tract Inhalation could cause coughing choking and shortness of breath Eye inflammation will show up as redness itching and watering Skin inflammation is generally characterized by redness itching and blistering Repeated or prolonged breathing of the mist or vapor can result in respiratory tract irritation eventually leading to frequent attacks of bronchial infection
Pentanoic Acid Hazardous in terms of contact with skin eyes or respiratory system Contact with skin could cause burns The vapor or mist can produce tissue damage targets include the mucous membranes of the eyes mouth and respiratory tract Inhalation could cause coughing choking and shortness of breath Eye inflammation will show up as redness itching and watering Skin inflammation is generally characterized by redness itching and blistering Repeated or prolonged breathing of the mist or vapor can result in respiratory tract irritation eventually leading to frequent attacks of bronchial infection
Iso-Pentanoic Acid (3-Methyl-butanoic) (Isovaleric Acid) Hazardous in terms of contact with skin eyes or respiratory system Contact with skin could cause burns The vapor or mist can produce tissue damage targets include the mucous membranes of the eyes mouth and respiratory tract Inhalation could cause coughing choking and shortness of breath Eye inflammation will show up as redness itching and watering Skin inflammation is generally characterized by redness itching and blistering Repeated or prolonged breathing of the mist or vapor can result in respiratory tract irritation eventually leading to frequent attacks of bronchial infection Severe over exposure can result in death
Sulfuric Acid Concentrated sulfuric acid is used in this lab and causes severe burns on skin and clothing Do not inhale the vapor severe lung damage can result An extremely corrosive acid handle carefully Causes sever eye burns which could result in irreversible eye injury A corrosive oxidizer may be fatal if inhaled ingested or absorbed through the skin If inhaled may cause severe damage to respiratory tract resulting in coughing shortness of breath and delayed lung edema Destructive to tissue in mucous membranes Can cause severe burns to the respiratory tract Prolonged breathing of the vapors may cause nosebleeds chest pain and bronchitis Contact with many organic chemicals can cause fire and explosion
Fischer Esterification-4
EXPERIMENT 5 Fischer Esterification
Table 1 Physical Properties of Some Organic Esters Ester BP
0C Density gcm3
20nD Aroma
Amyl acetate 149 0876 14023 Banana Benzyl acetate 212 1054 15232 Peach Butyl acetate 1261 0883 13941 BananaApple Ethyl acetate 771 0902 13724 Pear Hexyl acetate 1715 0867 14092 Plum Isoamyl acetate 142 0876 14000 Banana Isobutyl acetate 118 0875 13902 Fruityfloral Octyl acetate 203-211 0868 plusmn14205 Orange Prenyl acetate 1497 0917 plusmn14290 Juicy Fruit Propyl acetate 102 0888 13844 Pear Ethyl benzoate 211-213 1045 15040 Fruity Amyl butyrate 186 0883 14100 Apricot Ethyl isobutyrate 112-113 0865 1387 Fruity Butyl butyrate 165 0869 plusmn14060 Pineapple Ethyl butyrate 120-121 0879 1392 Pineapple Isopentyl butyrate 184-185 0862 1411 Fruity Methyl butyrate 102 0898 1385 Apple Ethyl formate 54 0921 13597 Rum Isobutyl formate 984 0885 1385 Raspberry Methyl Isovalerate 116-117 0881 plusmn13950 Perfumes Methyl pentanoate 126 0890 1397 Fruity Isoamyl valerate 204 0872 plusmn14140 Apples Ethyl propanoate 989 0888 13844 Pineapple Isobutyl propanoate 1368 0869 1397 Rum Methyl propanoate 80 0915 13775 Rum like Propyl propanoate 122-124 0881 1393 Pineapple Sigma Aldrich amp Handbook of Chemistry and Physics 84th Edition CRC Press
Fischer Esterification-5
EXPERIMENT 5 Fischer Esterification
III INTRODUCTION
General References
These provide background information on the techniques and theory and are provided to improve your understanding and provide practical hints that may help you avoid mistakes that may prove costly in terms of laboratory time
bull Measuring Mass amp Volume bull Using Pasteur Pipettes to Transfer bull Thermometer Calibration bull Refluxing a Reaction Mixture bull Extraction Separatory Funnel bull Boiling Point amp Distillation bull Refractive Index bull Nuclear Magnetic Resonance bull Mass Spectrometry bull Infrared Spectroscopy bull Distillation bull Boiling bull Esters bull Clausius-Clapeyron Equation
Videos Digital Technique Manual
bull 1 Volumetric techniques bull 5 Reaction Work-Up I bull 7 Filtration bull 11 Using a Balance
MHS Chapter 5 pp 52-61 MHS Chapter 5 pp 55-62 MHS Chapter 54 pp 63 MHS Chapter 7 pp 59-60 MHS Chapter 11 pp 113-124 MHS Chapter 12 pp 174-176 MHS Chapter 13 pp 206-211 MHS Chapter 22 pp 350-405 MHS Chapter 24 pp 441-462 MHS Chapter 21 pp 311-344
ATKINS Chapter 10 pp 404-406 ATKINS Chapter 104 pp 373-374 ATKINS Chapter 20 pp 828-829 ATKINS Chapter 103 pp 371-373
bull 15 Distillation I Simple amp Fractional Distillations bull 17 Refluxing a Reaction
Fischer Esterification-6
EXPERIMENT 5 Fischer Esterification
A EsterificationmdashBackground
Esters are found naturally in a variety of fruits vegetables herbs and spices Odors can be complex and generally pleasantly smelling usually the odor of the ester stands out Esters are made by condensing an alcohol with a carboxylic acid The reaction is generally catalyzed with concentrated sulfuric acid (H2SO4) Esters have a general formula as illustrated in (51)
O
C
R OR (51)
There are many possible combinations possible between an alcohol and various acids each combination producing different esters with characteristic identifiable odors See Table 1 on page 5 of this manual The forward reverse reaction is rapid and is illustrated in (52)
OO
OH
HO+ H+
+ H2OR C RC R OR (52)
Fischer Esterification-7
EXPERIMENT 5 Fischer Esterification
Generally equilibrium exists between reactants on one side and products on the other This equilibrium predominantly favors the reactants Under acidic conditions using concentrated sulfuric acid as a catalyst the water on the product side is removed causing the equilibrium to shift in favor of the products The mechanism for the fisher acid catalyzed esterification reaction is shown in (53)
(53)
Reaction mechanism copy V8rik at English Wikipedia Wikimedia Commons License CC BY-SA All rights reserved This content is excluded from our Creative Commons license For more information see http ocwmiteduhelpfaq-fair-use
In this classic reaction scheme the H+ acts as a Lewis acid activating the carbonyl group which becomes a good electrophile At the same time the -OH is converted into a good leaving group as water which breaks off The pathway presented lowers the energy barrier speeding up the reaction to products
Fischer Esterification-8
EXPERIMENT 5 Fischer Esterification
B Esterification LabmdashOverview
Day 1mdash ldquoIntroduction to Refluxing Extraction and Drying the Productrdquo Assembling a ground-glass reflux apparatus in the hood for Fisher synthesis of an ester from an unknown alcohol and unknown carboxylic acid After refluxing remove any acid impurities from the ester by extraction with aqueous base separating out the ester from the reaction mixture Dry the ester with an anhydrous chemical drying agent and store in a clean scintillation vial for Day 2
Day 2mdash ldquoIntroduction to Atmospheric Distillationrdquo Assemble a distillation apparatus
Day 3mdash ldquoProduct Characterization using Infrared Spectroscopy (IR) Boiling Point (BP) Density Refractive Index (20nD) and NMR Spectroscopyrdquo
Day 4mdash ldquoFurther Product Characterization using Mass Spectrometry (MS) Final Product Identificationrdquo
Fischer Esterification-9
EXPERIMENT 5 Fischer Esterification
C Hewlett Packard GCMass Spectrometer and Varian Saturn 2200 GCMSMS
The GC-Mass Spectrometer has become one of the most sensitive and powerful instruments for the identification of organic compounds Analysis of trace quantities of organic compounds has advanced to a stage greater than 1 part in 1015 Many impurities and contaminants found in food and water can now be identified unambiguously in trace amounts To make the process easier many thousands of spectra including insecticides and industrial pollutants have been compiled into databases and are now readily available as packages that can be purchased and downloaded to computers hooked directly to GCMS systems
The Organic volatile unknown will be injected neat into the heated injector port of the GCMS using a special custom-designed 001-microliter syringe The volatilized compound is carried in the helium flow to a splitter with a split-out ration set at 1300 whereby only 033 of the sample is diverted to the GC column (the rest is vaporized and exits the system) The GC column used in this instrument is a capillary column which is 10-30 meters long and only 04 mm in diameter The conditions above insure that no more than 10-9 gram of the sample is applied to this column
Schematic Diagram of HP GCMS Quadrupole Mass Spectrometer
In the Hewlett Packard GCMS as the organic compounds elute from the GC they are introduced immediately into a Quadrupole Mass Spectrometer and a series of mass spectra are repeatedly recorded for each two-second interval In the ionization chamber electrons traveling across a 70-eV potential bombard the molecules When a molecule is struck by one of these high-energy electrons it loses one of its own electrons and becomes a radical cation M + Many of the molecular ions will be formed with enough excess energy to undergo subsequent reactions in the ionization chamber From the ionization chamber the positively charged ions are attracted through the magnetic field of a quadrupole ion chamber maintained under high vacuum For a given strength of the magnetic field only those ions having the correct chargemass ratio (me) will be deflected through the magnetic field and reach the detector The instrument varies the magnetic field continuously to produce a spectrum of me peaks
Fischer Esterification-10
EXPERIMENT 5 Fischer Esterification
In the next section are detailed mechanisms for common fragmentation and ionization reactions It is much more difficult to solve the structure of an organic compound from the mass spectrum alone than it is to match the spectrum with that of the known compound With the help of NMR and IR spectroscopy mass spectrometry can play an important role in structure determination
Fischer Esterification-11
EXPERIMENT 5 Fischer Esterification
D Reactions Observed in Mass Spectroscopy
A Fragmentation Reaction involves the cleavage of one bond of the radical cation M+ to form a cation A+ and a radical B The reaction is especially facilitated by substituents which stabilize the cation A+
a-Cleavage Reaction The a-cleavage reaction is driven by the formation of a stable carbocation as shown in the examples listed below In the first case ethers readily undergo the a-cleavage reaction forming a stable oxonium ion (also common for similar N S compounds) In the second example alkenes undergo a-cleavage reaction to form a stable allylic cation (also common for aryl compounds and alkynes) In the third example ketones readily undergo a-cleavage to produce stable acylium ions
Inductive Cleavage Reaction Alkyl halides often undergo the inductive cleavage reaction in which the halogen atom (eg Cl) simply breaks off the initial radical cation This is most prevalent for bromides and iodides and for compounds which can produce a stable carbocation
Fischer Esterification-12
EXPERIMENT 5 Fischer Esterification
In each case fragmentation reactions above produce both a radical and a cation from the initial radical cation M+ Also as a consequence of the nitrogen rule For molecules that do not contain nitrogen fragmentation reactions of the even-massed radical cations will produce odd-massed A+ ions This can be a useful method for finding which ions are produced by one of the above reactions
A Rearrangement Reaction involves the cleavage of more than one bond of the radical cation M+ to ultimately form a new radical cation A+
and a neutral compound B Often rearrangement reactions may proceed by complementary pathways so that the mass numbers for both parts of the molecule can be found in the mass spectrum
Rearrangement of Cyclic Structures When a cyclohexene derivative is ionized in the mass spectrum a particularly facile cleavage of the ring is reminiscent of a retro-Diels-Alder reaction
Fischer Esterification-13
EXPERIMENT 5 Fischer Esterification
Radical Site Rearrangements (McLafferty Rearrangement) Carbonyl derivatives readily undergo a rearrangement reaction in which the M+ undergoes intramolecular H atom transfer to the carbonyl oxygen atom The best geometry involves a six-membered transition state and subsequent a-cleavage or inductive cleavage leads to the fragment ions of each piece
Fischer Esterification-14
EXPERIMENT 5 Fischer Esterification
For each example of rearrangement reactions the observed ions are radical cations For a molecule which does not contain nitrogen the McLafferty rearrangement of the even-massed M+ ion produces an even mass A+ ion and so are easily distinguished from the odd-massed ions from a simple fragmentation reaction Also many molecules display a peak in the mass spectrum arising from a McLafferty +1 rearrangement For the ester above the mechanism involves a second H atom transfer
Fischer Esterification-15
EXPERIMENT 5 Fischer Esterification
D NUCLEAR MAGNETIC RESONANCE
I Purpose
The Nuclear Magnetic Resonance portion of the course is designed to introduce 5310 students to the basic concepts of nuclear magnetic resonance (NMR) spectroscopy including spin energy levels absorption of radiation and a number of other NMR spectral parameters Most importantly to provide experience in the identification of unknowns from 1H (proton) NMR spectra All students will be given a tour of the Varian 300 MHz operation room in the Undergraduate lab which will include observing the running of a sample (subject to the availability of the instruments) You will then receive a recorded spectrum of your Unknown volatile organic sample and will use this spectrum along with your mass spectrum and wet chemistry results to determine the structure and identity of your unknown sample
II Safety
One of the main safety considerations that you should be aware of when walking into the instrument room is the field generated by the 300 MHz NMR magnet The field is strong enough to wipe out data on magnetic credit cards (Master charge VISA American Express and others) Thus when working in the vicinity of an NMR spectrometer it is a good practice to leave these items in some alternate location In fact bringing any type of metal objects near a strong magnet is not a good idea because they could be sucked away ending up under the NMR
III Theory Energy Levels of Nuclei in a Magnetic Field
Many isotopes of elements in the periodic table but not all possess spin angular momenta which results from coupling the spin and orbital angular momenta of the protons and neutrons in the nucleus In Principles of Chemical Science 5111 you learned that the orbital angular momentum of an electron can be oriented in 2 + 1 discrete states (eg a p electron (=1) can have m = -1 0 +1 orientation states) With NMR we will be conducting experiments on the nuclei of atoms not the electrons Nuclear spin angular momenta behave the same way Nuclei with spin I can have 2I + 1 values of the spin orientation characterized by quantum numbers mI which are [-I -(I-1)helliphellip(I-1) I] For I = frac12 the allowed mI are +12 and -12 and for I = 1 the allowed mI are -1 0 +1 If I is non-zero the nucleus has a magnetic moment and when placed in a magnetic field the component of the moment along the field direction (conventionally taken as the z direction) is microz = gmI where g which is a constant specific for each isotope termed the gyro magnetic ratio is the Planckrsquos constant divided by 2p ( = 1055 x 10-34 J s) and mI is the quantum number Some g values for chemically important nuclei are given in Table I Note that nuclei such as 12C and 16O are not included in the table since they have I=0
Fischer Esterification-16
EXPERIMENT 5 Fischer Esterification
The rules for determining whether a nucleus has a net spin (I) are fairly simple
1 If a nucleus has an odd number of protons and an odd number of neutrons then the effective spin of the nucleus will be an integer number such as 1 2 and 3
2 If in a nucleus the sum of the protons and neutrons is odd then the effective spin of the nucleus will be on the order of a half-integer such as frac12 32 52
3 If the sum of the protons and neutrons is even then the effective spin of the nucleus will be zero
Table 1 Spin gyro magnetic ratios NMR frequencies (in a 1 T (10 kG) field) and thenatural abundance of selected nuclides)
T stands for Tesla (1 Tesla = 104 Gauss The earthrsquos magnetic field is around 05 Gauss) What is the physical meaning of a negative gyro magnetic constant
In a laboratory field B0 the nuclei can assume 2I + 1 orientations corresponding to the values of mI each value of mI corresponds to an energy given by (Figure 1)
EmI = - micro B0 = - microz B0 = - g B0 mI (1)
Fischer Esterification-17
EXPERIMENT 5 Fischer Esterification
Which can be rewritten as
EmI = - mI w0 (2)
Where the Larmor frequency is w0 = g B0
z
B0
micro
microz
Figure 1 The relationship between the laboratory magnetic field B0 and the magnetic moment of the nucleus micro and its microz component (micro component along the z axis)
Fischer Esterification-18
EXPERIMENT 5 Fischer Esterification
As shown in Figure 2 the energy separation between the two levels a and b of an I = frac12 system with the magnetic field turned on is shown below Note in the absence of the magnetic field the two energy levels are degenerate resulting in the same energy with the field applied the two levels move apart
DE = E(b) - E(a) = 12 g B0 - (-12) g B0 = g B0 (3)
(h2π) γB0
β
α
mI = - 12
mI = + 12
Zero field Magnetic field on
Figure 2 The nuclear spin energy levels of a spin-12 nucleus (eg 1H or 13C) in a magnetic field Resonance occurs when the energy separation of the levels as determined by the magnetic field strength matches the energy of the photons in the electromagnetic field
Thus when the sample resides in a magnetic field and is bathed with radiation of frequency w02p = no (energy = w0) matching the difference between the levels resonance occursmdashie energy is absorbed causing the excited nucleus to jump for the a to the b energy level as illustrated schematically in Figure 2 When the nucleus in the higher b energy level drops back down to the lower a energy state a quantum of energy is released in the radio frequency range and itrsquos this energy that produces the NMR signal Equation (3) is the resonance condition Using the values for g in Table 1 we can calculate that for 1H in a 47 T field the resonance frequency is 200 MHz and for an 117 T field no = 500 MHz
The method of obtaining the NMR spectrum that we use includes FT (Fourier Transform NMR) A short pulse of RF energy is applied to the sample tilting the net magnetization vector off its equilibrium The decaying oscillations of the magnetization vector are recorded in real time with a magnetic coil as it decays to equilibrium (FID) A computer program uses Fourier transform mathematics to convert the FID which is a function of time to an NMR spectrum as a function of frequency
Fischer Esterification-19
EXPERIMENT 5 Fischer Esterification
The amount of energy absorbed (and therefore the NMR signal strength) is proportional to the population difference between the a and b energy levels The NMR signal that we are plotting is basically the energy difference between the energy absorbed by the spins that causes them to move from the lower parallel a energy level to the upper antiparallel b energy level and the energy reemitted by the spinning nucleons as they make the transition back down from the higher b energy level to the lower a energy level In the Charles River Experiment we used the Beer-Lambert law to calculate the amount of light transmitted by an absorbing sample
-A e-ecl T = IIo = e =
The absorbance A=ecl can be written as A = kabs Nabs l where kabs is an absorption coefficient and Nabs represents the number of absorbing molecules in the beam path Because excited molecules can re-radiate light the effective Nabs is actually N (lower a level) ndash N (upper b level) The ratio of the population of nuclear spins in the upper b state N(b) to the population of nuclear spins in the lower a state N(a) can be calculated using the Boltzmann equation
Nβ minusΔE
P = = e kT (4)Nα
where DE equals the energy difference between spin states k is the Boltzmann constant (13805 x 10-23 JK-mole) and T is the absolute temperature in K At room temperature the number of spins in the a lower energy state N(a) just slightly outnumbers the number of spins in the b higher energy state N(b) For a proton in an applied field with a strength of 70 T (eg the magnetic field of the Varian 300 MHz) using DE = hn the difference g B0 between two spin states of the proton is 199x10-25J per molecule The kT at room temperature (T = 298 K) is 411 x 10-21 J therefore DEkT = 484 x 10-5 substituting
Nβ minusΔE Nβ NβkT = eminus484 xE minus5 = e = 0999952 Nβ = 0999952 NαNα Nα Nα
With such small population differences highly sensitive detection techniques are required The NMR signal depends on the N(b) N(a)a population ratio As the temperature decreases the ratio decreases and as the temperature increases the ratio approaches 1
Fischer Esterification-20
EXPERIMENT 5 Fischer Esterification
IV Chemical Shifts
Every nucleus in a molecule is surrounded by an electron cloud which possesses an electronic angular momentum induced by the laboratory field B0 This angular momentum results in a local magnetic field Bloc at the nucleus which is opposed to the applied field because it arises from negatively charged electrons Putting a molecule into a magnetic field causes the electrons to circulate inducing a current that has a magnetic field associated with it Thus the induced magnetic field from the micro current of circulating electrons shields the nucleus from the applied field according to the following formula where s is the shielding constant
Bloc = (1 - s) B0 (5)
So the net field felt at each nucleus (Bloc) is less than the applied field The feature that makes NMR so interesting and extremely important to chemists is that s varies markedly from chemical group to chemical group Thus s for a -C1H3 is different from s for a -C1H2- and that in turn is different from s for an -O1H These features of NMR spectra illustrated for the 1Hs in ethanol in Figure 3 are referred to as chemical shifts They are important since they facilitate the identification of each type of 1H (or 13C) present in a molecule
All of the shifts in Figure 3 are referenced to the shift of the standard tetramethylsilane(TMS) and are calculated from the formula
ν 0 minusν refδ = x106 (6)ν ref
where n0 and nref is the frequency of the unknown and reference (TMS) respectively As mentioned above the amount of shielding and therefore the frequency separation between two lines will increase with increasing field However the chemical shifts calculated from Equation (6) are field independent Thus shifts measured at 100 MHz can be compared directly with those obtained at 500 MHz Note that positive d values correspond to higher frequencies or lower magnetic fields
Fischer Esterification-21
EXPERIMENT 5 Fischer Esterification
Figure 3 ndash The proton NMR spectrum of ethanol TMS (the rightmost signal) stands for tetramethylsilane (Si(CH3)4) TMS is the widely-used reference signal The step-like curve is the integrated signal proportional to the number of spins in each signal JT Arnold and co-workers first recorded this spectrum in 1951 [Journal of Chemical Physics 19 p 507]
Figure 4 illustrates the dependence of proton chemical shifts on the various functional groups in more detail Note that Figure 4b also shows chemical shifts for 13C another important NMR nucleus (a)
Fischer Esterification-22
EXPERIMENT 5 Fischer Esterification
(b)
Figure 4 Bar graph illustrating the range of chemical shifts expected for various types of (a) 1H resonances and (b) 13C resonances referenced to TMS
V J-Couplings and Spectral Intensities
The spectral lines of ethanol in Figure 3 exhibit fine structure -- ie the -CH3 line consists of three lines and the -CH2- has four components2 This coupling occurs because each magnetic nucleus also contributes to the local field of adjacent nuclei -- an effect referred to as spin-spin coupling The strength of this coupling is described by a field independent coupling constant J measured in Hertz (Hz)
2 JT Arnold Phys Rev 102 136 (1955)
Fischer Esterification-23
EXPERIMENT 5 Fischer Esterification
X3 IntensityX2 Intensity
1
2
1
1
3
3
1
Figure 5 (a) Orientations of the spins in the X2 group (-CH2-) of an AX2 spin system which give rise to a 121 triplet in the A resonance The two nuclei may have the 22 = 4 spin arrangements shown (b) The 23 = 8 arrangements of the three spins in an AX3 group which lead to the 1331 quartet in the A resonance
The spectral pattern in Figure 3 can be understood by examining the simple diagrams shown in Figure 5 If two spins that correspond to the two 1Hs on a -CH2- are present they can be aligned in four different ways Each spin is either parallel or opposed to the field Therefore two spins can be aligned both up both down and one up and one down (in two different ways spin one upspin two down and spin one downspin two up) Thus the local field at the -CH3 due to the adjacent -CH2- should have three components with an intensity ratio of 121 corresponding to both up one up and one down (2 ways) and both down Correspondingly there are eight ways to align the three spins on the methyl group as illustrated in the figure resulting in a quartet for the -CH2- with intensities of 1331 By extending these arguments to larger numbers of spins it is possible to show that N equivalent spins split the resonance of a coupled group into N+1 lines with intensities corresponding to the coefficients of a binomial expansion or Pascals Triangle A Pascals triangle is shown on the following page where N is the total number of equivalent spins
The size of J-couplings depends on the structure and the nuclei involved 1H-1H couplings are ~10 Hz while 1H-13C and 31P-1H couplings can be ~100 Hz and ~600 Hz respectively
Another noteworthy feature of Figure 3 is the integrated spectral intensity of each set of lines The integrals which are performed electronically in an experiment are shown as the step-like curves in the figure and are in the ratio 123 corresponding to the number of each type of 1H present Thus intensities in 1H spectra can be employed to determine the relative numbers of each type of 1H present in a molecule
In summary chemical shifts and spectral intensities provide information on the types and number of nuclei respectively associated with each functional group present in a molecule Further J-couplings permit a determination of which groups are chemically bonded Together these parameters permit the structures of most organic molecules to be determined by simply recording and interpreting their NMR spectra
Fischer Esterification-24
EXPERIMENT 5 Fischer Esterification
PASCALrsquoS TRIANGLE
N INTENSITY DISTRIBUTION
0 1 1 1 1 2 1 2 1 3 1 3 3 1 4 1 4 6 4 1 middot middot N Expand (1+x)N and select the coefficients
VI Experimental Procedure Sample Preparation
General The NMR sample tubes should be clean and free of dust and particulate matter Solid
samples should be dissolved in a deuterated solvent and liquid samples can be run neat or diluted in a deuterated solvent as described further below A good 1H NMR sample contains about 10 mg of compound The solution should contain no solids or paramagnetic impurities Your deuterated NMR solvent should be free of water and your NMR spectrum should contain no solvent peaks
An NMR sample tube is typically 175 mm in length with a 5 mm OD Minimum filling level is a distance of approximately 2 cm up from the bottom of the tube which is equal to a volume of about 03 mL However the optimum filling level is a distance of approximately 4-6 cm up from the bottom of the tube (06-09 mL) You must determine the minimum height of a sample by checking the depth gauge in the NMR room Over filling can distort the homogeneity and lead to lower resolution When the tube is inserted into the probe the position of the transmitter coil is about 1 cm from the bottom of the tube
As mentioned above the solvent must dissolve the sample material It is generally desirable to use as concentrated a solution as possible -- ie about 10 In difficult cases where the sample is not very soluble it may be necessary to find an alternative solvent Hydrogen-containing solvents should be avoided whenever possible The selected solvent should not produce strong signals of its own in the spectral region of interest Some solvents commonly employed for proton NMR spectroscopy include
deuterochloroform -- CDCl3 deuterated watermdashD20 hexadeuteroacetone (acetone-d6) -- (CD3)2C=O
Fischer Esterification-25
EXPERIMENT 5 Fischer Esterification
hexadeuterodimethylsulfoxide (DMSO-d6) -- (CD3)2S=O deuterodacetonitrile ndash CD3CN deuterotetrahydrofuran ndash C4D8O
Chloroform is by far the most popular and will be used almost exclusively in 5310 The TA will prepare the bottle of CDCl3 that you will use for your samples The CDCl3 will be spectral grade already treated with TMS Just keep in mind that you donrsquot want water getting into your deuterochloroform so keep the bottle open to the atmosphere as little as possible As long as the bottle remains open water from the air will dissolve in your NMR solvent
For preparing your NMR tube with an unknown liquid it is recommended that you take 50 uL of sample and dilute with 900 uL of deuterated chloroform in a small scintillation vial Mix well and using a 9-inch glass pastuer pipette place the pipette into the NMR tube as far in as it will go then gently release the sample up to the tip of the pipette The NMR tube should now be prepared perfectly with the correct volume of sample The TArsquos will demonstrate the technique for you during the pre-lab lecture When your sample has finished running the NMR tube should be opened up and turned over into a glass beaker located under the hood provided and labeled by the TArsquos
It is most important that the sample tube to be absolutely clean within and without its surfaces must be completely dust-free Particles just visible with the unaided eye may degrade the resolution if they are within the irradiation region
Reference Material It is usual to provide a reference line in each spectrum from which the chemical shifts of
other signals can be measured The normal method is to add a reference material (known as an internal standard) directly to the sample The reference material should not interact with the test sample If a symmetrical and non-polar type of molecule is used as the reference material these effects will be very small For this purpose tetramethylsilane (TMS) is most suitable An additional advantage of using TMS is that the spectral line it produces is at a higher field position than almost all other signals so that the chemical shifts of nearly all lines measured with respect to TMS are of the same low field direction As an alternative method the reference material may be contained in a sealed capillary tube which is inserted into the sample tube There can be no intermolecular effects by this method TMS will already have been added to the deuterochloroform which we will be using
Fischer Esterification-26
EXPERIMENT 5 Fischer Esterification
E This page intentionally left blank
Fischer Esterification-27
EXPERIMENT 5 Fischer Esterification
Day 1 Assembling a Ground-Glass Reflux Apparatus for Synthesis of an Ester Extraction of Acidic Impurity from Product Drying the Product
The apparatus for synthesis of the unknown ester requires assembling a ground-glass reflux apparatus similar to that shown in Figure 5-1 Obtain from the stockroom a kit containing a 250mL ground-glass round bottom flask 1420 condenser and an electric heating mantle which fits the 250mL round bottom flask Secure an unknown organic alcohol and acid from your instructor and record the unknown number into your laboratory notebook
wwwaus-e-tutecomau
Figure 5-1 Reflux Apparatus Fischer Ester Synthesis
copy AUS-e-TUTE All rights reserved This content is excluded from our Creative Commons license For more information see httpocwmiteduhelpfaq-fair-use
Fischer Esterification-28
EXPERIMENT 5 Fischer Esterification
When pouring the reactants into the 250mL round bottom flask do not allow the reactants to make any contact with the ground glass opening of the flask (See Figure 5-2) Rather use a funnel this will keep the reactants from coming into contact with the ground glass opening of the flask Both the sulfuric acid and the carboxylic acid are corrosive and should be handled carefully
Figure 5-2 Use a Funnel for Pouring Reactants into the Reflux Flask
To a 250mL round bottom flask set up in a laboratory hood add 40 mL of the unknown carboxylic acid followed by 30mL of the unknown alcohol Gently swirl the flask to mix the alcohol and carboxylic acid then carefully add 3 mL of concentrated sulfuric acid H2SO4 Obtain the sulfuric acid from the small dropper bottles provided Swirl the flask during the addition of the sulfuric acid the reaction is exothermic and heat will be released Use caution in handling the acid it is highly corrosive and the liquid and vapors are harmful Add a small magnetic
Fischer Esterification-29
EXPERIMENT 5 Fischer Esterification
stir bar to the flask then attach the reflux condenser with lightly greased joints as shown in Figure 5-3 Attach a drying tube to the top of the condenser
Figure 5-3 Reflux Apparatus amp Heating Mantle Fischer Esterification
Fischer Esterification-30
EXPERIMENT 5 Fischer Esterification
Using a heating mantel connected to a rheostat apply heat (approximately 75 electrical units) bringing the solution to a boil and reflux the solution for 1 hour Objective is to achieve a slow rate of reflux with liquid boiling and condensed vapor dripping back into the flask While the reaction is refluxing set up a 250 mL separatory funnel with a ring clamp support as shown in Figure 5-4
Figure 5-4 Separatory Funnel with Ring Stand Support
Once the reflux has completed cool reaction mixture to room temperature Transfer the reaction solution to a 250 mL separatory funnel and add 60 mL of cold distilled water Use an additional 20 mL of water to rinse out the reaction flask and add that to the separatory funnel as well Swirl the solution allowing the layers to separate and remove the aqueous layer Pour the Organic layer into a 500- mL clean dry beaker Extract the Organic layer with two 40 mL aliquots of 5 sodium bicarbonate solution to remove any traces of the carboxylic acid CO2 gas is released during the extraction and this can cause a high pressure inside the separatory funnel Because of this the first addition of 40 mL 5 sodium bicarbonate should be carried out in the 500-mL beaker slowly adding the sodium bicarbonate solution while stirring with a glass stirring rod Once the fizzing subsides transfer the contents of the beaker back to the separatory funnel and continue with the remaining extractions DO NOT INSERT THE GLASS
Fischer Esterification-31
EXPERIMENT 5 Fischer Esterification
STOPPER into the separatory funnel until the bubbling subsides Test the second extracted aqueous layer with litmus paper and make sure that it turns litmus paper blue and is basic If not repeat the extraction with two more 40 mL portions of 5 sodium bicarbonate solution until the aqueous extract tests basic Once the aqueous extraction layers have been removed extract the organic layer with two 10mL portions of saturated aqueous sodium chloride solution The sodium chloride will help to pull any trace amounts of water out of the organic layer Pour off the top organic layer into a 125 mL Erlenmeyer flask and dry with an anhydrous chemical drying agent such as MgSO4 or Na2SO4 Add approximately 4 grams of the drying agent swirling the flask gently allowing the drying agent to clump up indicating that it is pulling water out of the sample Add an additional 1-2 grams of the drying agent if needed until it stops clumping (caking) up in the flask Typical set up is shown in Figure 5-5 After drying the liquid should be very clear Decant the organic layer into a clean scintillation vial and store it in your desk drawer until the next lab Take great care to make sure that the drying agent stays in the original Erlenmeyer flask
Figure 5-5 Drying Sample with an Anhydrous Drying Agent
Fischer Esterification-32
EXPERIMENT 5 Fischer Esterification
Day 2 Atmospheric Distillation
Set up a simple distilling apparatus as shown in Figures 5-6
Figure 5-6 Atmospheric Distillation Apparatus with Vigruex Column
Fischer Esterification-33
EXPERIMENT 5 Fischer Esterification
Now carefully loosen the condenser clamp and disconnect the condenser and the distilling head from the 250mL distilling flask Insert a funnel containing a small loose cotton plug into the 250mL distilling flask Using the funnel carefully pour the saved ester product into the clean dry 250 mL distilling flask Add a magnetic stir bar to the distilling flask and re-attach to the distilling apparatus Be sure that the adapter is open to the atmosphere Have the system checked by your instructor prior to starting the distillation Collect the distillate in labeled test tubes that are cooled in ice (See Figure 5-7) Fill a beaker with ice chips and use it to hold the test tubes during collection of the distillate Make sure the test tube is positioned to capture any drops which drip from the condenser
Figure 5-7 Test Tube Receiver
Fischer Esterification-34
EXPERIMENT 5 Fischer Esterification
Re-check that the cooling water has been turned on When all has been checked then carefully begin heating the distilling flask For heating your apparatus start off at 40 electrical units on the rheostat control and go up 5 units every 5 minutes until you start collecting product Try to aim for a distillation rate of approximately 1 drop of distillate every 2-3 seconds Initially it may appear that nothing is happening check to make sure the heating element is working and getting warm Gradually as the heat is increased condensation should begin to appear on the interior of the vigreux column and distilling head Keep track of the thermometer readings as the vapor begins to condense off the tip of the thermometer bulb At that point the liquid should begin to collect inside the condenser and the first drop of distillate should reach your receiver test tube At this point carefully adjust the rate of heating on the rheostat such that you are collecting about 1 drop of distillate every 2-3 seconds Continue at this heating rate and regularly record the temperature on the thermometer in the laboratory notebook After collecting about 10-15 drops of distillate into the first test tube change the collection flask by inserting and collecting into a second test tube Collect the distillate in this second test tube as long as the temperature remains constant within a few degrees If the temperature changes or if the test tube is more than half filled with product change to another third clean test tube Keep records of the temperature range that each fraction was collected at in the laboratory notebook Make sure each of the tubes is clearly labeled in the order that product was collected Continue the distillation until about 2-3 mL remains in the distillation flask The clear colorless product should have an intense fruity odor Under no circumstances should you distill your product to dryness Once finished shut off and unplug the rheostat from the wall turn off the condenser water and allow the entire apparatus to cool to room temperature Using one of the flat pan balances in the lab tear 150 mL beaker on the balance then place your first test tube receiver into the beaker recording the mass of the test tube and contents Then it might be good to also make a note on the odor of your product Repeat this procedure for each receiver test tube that was used in collecting your product recording the mass and odor of each fraction Once the distillation apparatus is cool disassemble the entire apparatus and wash and clean all of the parts with soap hot water and acetone air drying all components Similarly clean the separatory funnel and the reflux apparatus Make sure all the glassware is absolutely clean and dry with no trace of any ester smell in the kit Take the kit to the TA and have the TA initial the kit is being returned clean Once you obtain the signature of your TA return the kit to the stockroom Do NOT store the equipment in your desk drawers
Fischer Esterification-35
EXPERIMENT 5 Fischer Esterification
Day 3 Characterize the Product by Infrared Spectroscopy (IR) Boiling Point (BP) Density and Refractive Index (20nD) and NMR
Day 3 will begin with the TA demonstrating the sample preparation and operation of the IR spectrometer refractometer and NMR spectrometer Students will then prepare an NMR sample tube and run their spectrum on the 60MHz NMR spectrometer Following this studentrsquos will proceed to determine the BP Density Refractive Index and run an IR spectrum on the Unknown Ester
The thermometer calibration part of the experiment is performed to check the accuracy of the digital thermometer or regular thermometer that will be used in this experiment The boiling point and freezing point of water can be used to calibrate the thermometer for this experiment Take two readings on the thermometer one for the freezing point of water and one for the boiling point and compare those readings with the true values For the freezing point fill a 150 mL beaker with ice and add distilled water Let it sit for 10-15 minutes until itrsquos cold then take the temperature of the ice water mixture Record the measured value and note the theoretical value which should be 0oC While waiting for the water to get cold fill a 150 mL beaker about frac34 full with water and heat it up on a hot plate to boiling (cover the beaker with aluminum foil to speed up the process) This may take 20 minutes While the water is heating take a reading for the barometric pressure in the lab from the barometer in inches of mercury Do a quick calculation to find the correct theoretical boiling point of water at that pressure Temperature corrections to the boiling point of water can be calculated using the following formula
Theoretical BP correction = (atmospheric pressure ndash 760 mm Hg) x (0037oC mm) Theoretical BP = 100 0C plusmn correction above
Check the temperature of the boiling water as it is heating up Be sure not to touch your thermometer to the sides or bottom of the beaker Record the experimental boiling point of the water Using excel construct a thermometer-calibration curve by plotting observed temperature values versus true theoretical values
Boiling point can be measured very accurately using an electronic digital thermometer and the apparatus pictured in Figure 5-8ab This device can be used
Fischer Esterification-36
EXPERIMENT 5 Fischer Esterification
to measure the boiling point of our unknown organic liquid Check with the TAs to see if this reaction should be running under the hoods Pour about 03 mL of liquid into a 12 x 75 mm test tube Add a boiling chip to the test tube Note in particular the position of the thermometer probe which should be placed about 5 mm above the liquid and is positioned so that it does not touch the test tube at any point The test tube sits in an 80 x 40 pyrex heating dish filled with sand which is heated by an electric hotplate Heat the sand until the liquid boils gently in the test tube so that the vapor is condensing about 3 cm from the top of the test tube but gently enough so that the liquid does not boil out of the apparatus After a few minutes you should begin to see condensation on the thermometer tip and droplets falling from the thermometer element After a few more minutes the temperature should become reasonably steady This is the boiling point of your volatile unknown organic liquid record it into your laboratory notebook Avoid unnecessarily breathing and inhaling the vapors from your system the unknown liquids should be assumed to be flammable and toxic
Fischer Esterification-37
EXPERIMENT 5 Fischer Esterification
FIGURE 5-8a Photo of Boiling Point Apparatus
Fischer Esterification-38
EXPERIMENT 5 Fischer Esterification
Figure 5-8b Schematic Drawing of Boiling Point Apparatus
1 13x100mm test tube 2 80x40 pyrex heating dish 3 digital thermometer 4 white sand 5 electric hot plate
Fischer Esterification-39
EXPERIMENT 5 Fischer Esterification
To determine the density of the unknown pour 10 mL of the unknown liquid into a clean dry 10 mL graduated burette The easy way to do this is to use a flexible plastic Pasteur pipette do not use a glass pipette as it could break and clog the burette tip It should only take 2-3 fills of the plastic pipette to fill the burette with unknown The hole on a 10mL burette is too small to try pouring the liquid in with a beaker Use the plastic disposable pipette Dispose of the plastic pipette in the solid waste container not the glass box Determine volume readings of the liquid to plusmn001 mL then take mass readings of the liquid on a Sartorius balance to plusmn0001 g Place a clean glass weighing bottle on a top-loading Sartorius balance and cover with the aluminum balance cover so that the head of the bottle just sticks out the covers opening Tare the balance to zero Using a burette clamp carefully add approximately 150 mL of unknown liquid to the weighing bottle and immediately record the mass in your lab notebook Cover the top of your weighing bottle amp the top of the burette with a plastic weighing boat while you take the volume reading from the burette The plastic weigh boat fits perfectly over the bottle and burette and will prevent any of the volatile liquid from evaporating Record the volume reading into your lab notebook Remove the plastic weighing boat cover the weight should be the same to within a few thousandth of a decimal place Now add another 1 to 2 mL of liquid to the weighing bottle and follow the same procedure recording the total volume and new mass Continue this until six or seven data points are collected Make sure to take the last mass reading after adding around 950 mL or so of the unknown Enter data into an excel spreadsheet and create a graph of data plotting mass on the y-axis versus volume on the x-axis Find the best least squares line through the data points with an equation for the line Make sure when adding a trend line that you set the intercept at zero and display the equation in chart The equation gives you the slope of the line which should be the density of the unknown volatile liquid For the molar mass and density do a detailed error analysis with 95 confidence limits
Measure the refractive index of the sample following the procedure demonstrated by your TA and outlined in Appendix IV Remember refractive index varies inversely with temperature (T) Make sure to record the temperature on the thermometer in the refractometer You can then make an adjustment to the refractive index when comparing with a literature value that may have been obtained at a different temperature Use the following formula for calculating the correction Dn = 45E-4 (T1-T2) where T1= temperature of the refractometer and T2= temperature you are comparing to Then add the correction to the measured refractive index obtained from the instrument The Abbe Refractometer is shown below in Figure 5-9
Fischer Esterification-40
EXPERIMENT 5 Fischer Esterification
Figure 5-9 Photo of Auto Abbe Refractometer
NMR Sample Tube Preparation Obtain a clean dry 5mm NMR tube from the stockroom Check the tube carefully for any cracks andor chips Obtain a bottle of deuterated chloroform (CDCl3) from the stock room Dissolve 50 microL of the ester in 900 microL of CDCl3 If the solution is clear add the solution to the NMR tube using a 9rdquo glass Pasteur pipette Insert the pipette filled with your sample into the NMR tube as far as it will go then release the sample until it reaches the opening (tip) of the pipette At that mark withdraw the glass pipette and the NMR sample tube now contains the correct amount of liquid If the solution is cloudy filter using a small piece of kim wipe inserted into a glass Pasteur pipette Cap the NMR tube and label with your name See Appendix III for the operation of the NMR 60
Fischer Esterification-41
EXPERIMENT 5 Fischer Esterification
Day 4 Identification of the Unknown Ester followed by running a Mass Spectrum
From the observed boiling point density refractive index and NMR spectrum of the unknown ester students will fill out the Preliminary Identification of Unknown Ester form and turn it in to your instructor at the start of the lab on Day 4 The first identification is worth 5 points Once the identification form has been turned in to your instructor run a mass spectrum on the previously identified ester Then fill out the final Identification of Unknown Ester form and turn it in to your instructor prior to the end of lab on Day 4 The second identification is worth an additional 5 points If it is correct you are ready to begin writing your report If it is not correct you may try to determine the source of your error and verify it with your TA All of the laboratory work must be completed in the allotted four days for this experiment and incorrect attempts at identification in no way affects the written report due date If you missed the identification you will be given the name of the correct ester for work up and analysis in your report
Mass Spec Sample Preparation Obtain a small scintillation vial from the stockroom Dissolve three drops of the ester in 1 mL of Pentane Proceed to the Mass Spectrometer and inject 001 microL of your sample into the GC-MS Each run takes 10 minutes + 3 minutes for data analysis Your TA will have a sign-up sheet for the GC-MS Please follow the direction of the TA
Fischer Esterification-42
EXPERIMENT 5 Fischer Esterification
Analysis and Discussion
1 Indicate the structural formula of the ester and how it was obtained from the proton NMR Describe how the structure is consistent in terms of the proton NMR spectrum Compare the calculated chemical shifts with the actual values obtained from the NMR If you missed the identification of the unknown ester present reasoning and indicate what it should have been in terms of being consistent with the data collected
2 Summarize the data in table form that indicates the identity of the ester Talk about the IR spectrum and what peaks were presentabsent that indicated an ester Which features of the IR spectrum can be assigned to the ester Be sure to identify and label as many functional groups as you can
3 Compare the boiling point density refractive index and composition of the ester identified from your data with literature values Explain any discrepancies
4 Comment on the quantities of alcoholacid used in the experiment as well as the sulfuric acid in terms of Kinetics andor Thermodynamic reasoning Discuss the yield of the product in terms of both of the above How would each of the following shift the equilibrium in the esterification reaction (a) removal of H2O as its formed (b) adding more H2SO4 catalyst
5 Write out the synthesis steps for the ester that you identified Include all of the names structures catalysts products and reaction conditions that were used in the synthesis Identify the limiting reagent and show calculations including a table or results Calculate the theoretical yield and percent yield of product formed
6 Comment on the odor of the ester (this should be carefully obtained and you should not inhale or breathe the ester directly but waft the air to obtain the scent Research the ester and determine if the smell observed was accurate in addition describe clearly where this ester is found and how it is used What are the association of acidalcohol and the odor of your ester
Fischer Esterification-43
EXPERIMENT 5 Fischer Esterification
7 Talk about sources of error in this experiment and how the experiment could be improved
8 Aside from any improvements in experimental techniques used in this experiment describe how the yield of the product might be increased
9 Write out the full mechanism (with arrows) for the formation of the ester that was synthesized
10Analyze the IR spectrum by reporting the observed bands in a table and assigning (labeling) those bands on the spectrum Identify and label as many functional groups as you can
11Analyze the NMR spectra by reporting tabulated results and assigning (labeling) those peaks to H atoms in the identified molecules Identify label and explain all of the peaks
12Analyze the MS spectrum reporting on the major peaks and assigning (labeling) those peaks
13Your well written discussion should address the following (within the text NOT as a numerical series of answers to questions)
bull Comparison of your distillation results (temperature ranges) fractions collected with your GC results
bull Explanation of how the separation of components could be improved
bull Comparison of your results with literature values (boiling pointscompositionsyields)
bull Discussion what information gas chromatography provides bull Discussion what information infrared spectroscopy provides bull Discussion what information mass spectroscopy provides bull Discussion what information nuclear magnetic resonance
spectroscopy provides bull Describe the odor of your carboxylic acid and alcohol prior to
the reaction
Fischer Esterification-44
EXPERIMENT 5 Fischer Esterification
APPENDIX I
Perkin Elmer FT-IR Operation Guide 1 Turn on Computer Screen and Printer IR stays on all the time
do not turn IR off 2 Click FTIR 3 On right side double click spectrum express 4 Put in User name and Password studentsstudents 5 In left margin click on sample view 6 Once the computer is on and the menu appears turn on the laser
on the FTIR located on left rear back side of instrument 7 Make sure nothing is in the instrument and run an air blank 8 Click background for the air blank after it runs prepare your
sample on an IR card using a glass pipette (See instructions under Day 3 FTIR Sample preparation) Pull up on the instrument door and insert the IR card into the card holder pushing it down gently all the way then shutting the instrument door (cover)
9 Click scan at top right after it runs click baseline adjust 10 Click on text to add a name to the spectrum 11 Click on label to mark peaks with wave numbers 12 Use left mouse to move labels around on the spectrum 13 Right click on spectrum then appearance to change color for
printing 14 Click on file then print 15 Delete all your sample files 16 Remove your samples from IR 17 Clean area around IR and take all your samples with you 18 TArsquos X out of the menu once all samples have been run 19 Choose turn off computer from start menu 20 Shut of printer and screen 21 Turn off laser on back of FTIR 22 IR REMAINS ON AT ALL TIMES
Fischer Esterification-45
EXPERIMENT 5 Fischer Esterification
APPENDIX II3
Procedure for Operating the Hewlett Packard GC-MS
1 Turn on the computer (Pump and GC should already be on) if its already on go to step 6 skip steps 1-5
2 Strike F1 key when prompted on computer screen 3 When program manager appears left muscles on cessation then restore or
maximize 4 Left click to highlight MS Top then go to file and select open 5 Top Default screen should now be open 6 Go to methods and Load and Run Methods Select Chem532m and OK 7 Fill in your last name followed by (D) for the file name operator sample
unknown and any notes then click on Run Method 8 Now take a 001 micro liter syringe and fill with your sample (neat) with
one swift movement inject the sample into the GC and quickly press start on the GC until the solid green light appears on GC console The spectrum appears on the computer and will be blank for the first 200 minutes as the solvent delay keeps the MS from turning on when the bulk of the sample hits the source After 200 minutes you should see the tail end of your sample appear on the GC trace
9 A message appears Override Solvent Delay 200 minutes Select ldquoNOrdquo and enter to get rid of the message
10Once spectrum finishes running it disappears into the data file and you are returned to TOP Chem 532m
11Click on the link data analysis and select main panel from drop down menu 12From file choose load data file click on your file name and open 13Move your cursor to a point under your peak (220 minutes) and right click
twice and your mass spectrum appears under your GC trace you can move it to another location on the GC trace and right double click until you get the cleanest looking mass spectrum that you want to print from
14Go to file and select Print Trace + Spectrum click only once and wait after a minute you will see message in lower left of computer Printout sent to background spooler be patient it takes a few minutes and then prints
15Go to the link Spectra then select tabulate spectra then Print and then click Done
3 Written by John J Dolhun
Fischer Esterification-46
EXPERIMENT 5 Fischer Esterification
16Go to Integrate select Generate report respond generate report then Done this may have nothing on it depending on your spectrum
17You should leave the machine with the MS Top screen open for the next student
Fischer Esterification-47
EXPERIMENT 5 Fischer Esterification
APPENDIX III
Department of Chemistry Undergraduate Lab60 MHz NMR Operation Guidelines
John Dolhun adopted from NMReady Userrsquos Manual amp DCIF NMR Guide
Objective Obtain well-shimmed NMR spectra to determine chemical shifts integration (1H only) splitting patterns coupling constants
This document is intended as an introductory guide to the NMReady 60MHz NMR acquisition and processing software catering to the needs of the MIT Undergraduate Lab For those interested a large amount of additional NMR related information can be found on the DCIF website at httpwebmiteduspeclabwwwulabhtml
Magnet Safety
bull CAUTION NMR Magnets are ALWAYS ON bull People with pacemakers cochlear and other medical implants should not enter the NMR room without a doctorrsquos permission
bull Keep all metal objects electronic and magnetic devices at least 5 feet from the magnet This includes cell phones iPods jump drives chairs wallets keys hair clips and pins
bull If a tube breaks inside the magnet contact the Undergraduate Lab Staff immediately
Fischer Esterification-48
EXPERIMENT 5 Fischer Esterification
Fig NMR Equipment (A) NMR Console with Magnet (B) Sample Warmer
Fischer Esterification-49
EXPERIMENT 5 Fischer Esterification
Sample Preparation
bull Use a clean and dry 5 mm NMR tube that is free of cracks and chips
bull Choose an NMR solvent by testing the solubility of the compound in the non-deuterated solvent Unless otherwise noted use deuterated chloroform
bull Dissolve 50 uL of the compound in 900 uL of the chosen deuterated4 solvent
bull If the solution is clear add the solution to the NMR tube using a 9rdquo glass Pasteur pipette Insert the pipette filled with your sample into the NMR tube as far as it will go then release sample until it reaches the opening (tip) of the pipette At that mark withdraw the glass pipette and you have the correct amount of sample in the NMR tube
bull If the solution is cloudy filter using a small piece if a Kim Wipe inserted into a glass Pasteur pipette
bull Cap and label the NMR tube
Sample Warmer
The sample warmer is used to keep the NMR samples and solvent reference tubes at the same temperature as the instrumentrsquos magnet
While the instrument is warming up turn on the sample warmer (switch on the back) and place the solvent reference tubes in it
Any student samples that will be tested should also be placed in the warmer for at least 5 minutes before running in the machine
Performance can be degraded if un-heated samples andor references are used
4 Deuterated solvent is used for two purposes 1) Serve as internal reference (lock) for the spectrometer to correct for magnetic field drift 2) Prevent large solvent 1H signals
Fischer Esterification-50
EXPERIMENT 5 Fischer Esterification
Placing a sample in the NMReady
The NMReady uses standard 5mm NMR tubes There is no air no sample spinners and no additional sample requirements so the tube glides directly into the magnet bore until it is located in the coil and then the operator will fee resistance When you guide the sample in hold the tube straight up and insert it gently When pulling it out pull it out carefully straight up until it is completely out of the magnet bore
It is strongly recommended that you warm your sample in the warmer NdFeB magnets can be affected by temperature so to prevent line broadening due to temperature gradients it is recommended that the sample equilibrate to the same temperature as the magnet for several minutes prior to introduction into the magnet coil before acquiring NMR data on the sample
To begin an experiment simply take out the reference sample insert your sample and press lsquoGOrsquo button and the NMR will obtain your spectrum If needed you can change some of the acquisition parameters easily using the scan calculator if the defaults are not suitable for your needs
Solvent Selector
The first person using the NMR ready will power up the system taking it off standby Then the solvent being used must be selected The instrument will not be correctly calibrated until a solvent is chosen
After solvent selection the system will prompt for a color-coded (blue yellow or red) shim standard to be inserted into the magnet Once the reference is inserted into the spectrometer the appropriate configuration files are automatically loaded and the NMReady performs internal system tests (eg lock receiver gain auto-shim) A notification message will confirm that the solvent change was successful If running a series of samples in the same solvent the solvent does not need to be re-selected between each sample
To acquire a spectrum simply insert the sample into the magnet bore and press lsquoGOrsquo This is One-touch-NMR
Fischer Esterification-51
EXPERIMENT 5 Fischer Esterification
Once the lsquoGOrsquo button has been activated the spectrometer will begin to acquire the data This includes a quick lock and automatic receiver gain and before the NMR pulse protocol begins The first scan will be presented (post Fourier transform) on the screen and the spectrum will be updated with SN improvements every additional four scans Once the spectrum has appeared you are ready for analysis saving or exporting your spectrum
Visual Appearance
Full Screen The two-headed arrow in the lower right-hand corner of the data display area can be used to toggle to full screen mode if it is necessary to increase the viewing area for data processing
Ppm Hz Toggle A spectrum can be viewed with the chemical shift displayed in ppm (parts per million) or in Hz
Grid Toggle A grid can be turned onoff by pushing the Grid button in the upper right hand corner of the screen
Adjust The lsquoAdjustrsquo menu enables 1) baseline adjustment 2) spectrum phasing and 3) spectrum referencing These adjustments are beneficial in improving the accuracy of the integrations
View Menu
Zoom Width To zoom into a specific chemical shift range along the x-axis of a spectrum push lsquoZoom Widthrsquo then touch the screen on either side of the area you want to zoom to
Zoom Height To adjust the height of the displayed peak(s) first press the lsquoZoom Heightrsquo button (vertical zoom) and then touch the screen above the peak that you want to extend How far above the peak that you touch will determine the extent of the vertical zoom
Fischer Esterification-52
EXPERIMENT 5 Fischer Esterification
Show All The show all button restores the original size of the spectrum
Cursor Touching the lsquoCursorrsquo toggle button places a cursor on the screen adjustable by touch The cursor can be used to quickly ascertain the position of a resonance or by switching the Hz mode used to quickly determine coupling constants
Integrate Touching the integrate button shows the automatically generated integrals of the peaks in the current spectrum The integrals give lsquoarea under the curversquo information and can be used to determine relative concentrations of protons in the sample at analysis
Peaks Touching the peaks button places a list of all detected peaks on the screen The peak list can be used for comparative purposes or to measure coupling constants
Process The process functions enable dynamic changes to be applied to the spectrum during processing Depending on the complexity of the spectrum and the quality of the data the spectrum can be smoothed (apodization) or enhanced (zero-filling)
Apodize LB Line broadening increases the smoothness of the lines so for a well resolved spectrum increasing this number can improve the look of the spectrum However this smoothness also results in line broadening and can therefore reduce the resolution
Zero Fill Increasing the zero filling enhances the digital resolution of the spectrum Enhanced digital resolution will make feature-to-feature measurements more accurate Increased zero filling is recommended for accurate coupling constant determination
Fischer Esterification-53
EXPERIMENT 5 Fischer Esterification
Saving and Exporting Data
After data processing is complete the data can be saved (as either a jdx or a png) directly to the NMReady exported to a network folder or printed to a network laser printer
Print Push the print button to send the spectral image (including integrations peaks and coupling constants) to the laser printer in the room The image will print in a frame and will be accompanied by experimental parameters
JDX Export Push the JDX to export the current spectrum directly to a USB drive that you insert into the NMReady DO NOT PRESS SAVE and DO NOT PRESS Screenshot as these will save your spectrum on the spectrometer which we donrsquot want You can however export your file to our network folder which is hooked up on the computer next to the NMR The Dell computer is equipped with the latest Mestrelab software to analyze the spectrum further if you so desire It is however not necessary to export your spectrum here once you get your printout and are satisfied
Fischer Esterification-54
EXPERIMENT 5 Fischer Esterification
APPENDIX IV Operation of Refractometer
1 Turn on unit from switch on back of instrument 2 Turn on water pump next to instrument 3 Let instrument warm up for at least 10 minutes 4 When word ldquoinitiaterdquo appears on bottom right corner of screen
press initiate and wait until word ldquoHELLOrdquo appears 5 Now place distilled water on prism using plastic pipette and
close cover wait for 2 minutes select then press Calibrate if all OK the refractive index of water should appear on the screen 13329
6 Machine is now ready for routine operation 7 Dab off water with a soft tissue then place two drops of sample
in the sample well use plastic pipette press read switch to get a reading
8 Immediately clean off your sample wipe off gently with dry lens tissue Then use methanol Finally do a water wash and dry off with lens tissue
9 Press temperature switch and record value 10 Make sure to do a temperature correction for the temperature
you are comparing to 11 Turning off machine turn off water pump first then
refractometer 12 Any other questions read manual by instrument
Fischer Esterification-55
MIT OpenCourseWare httpsocwmitedu
5310 Laboratory Chemistry Fall 2017
For information about citing these materials or our Terms of Use visit httpsocwmiteduterms

EXPERIMENT 5 Fischer Esterification
IV Chemical Shifts
Every nucleus in a molecule is surrounded by an electron cloud which possesses an electronic angular momentum induced by the laboratory field B0 This angular momentum results in a local magnetic field Bloc at the nucleus which is opposed to the applied field because it arises from negatively charged electrons Putting a molecule into a magnetic field causes the electrons to circulate inducing a current that has a magnetic field associated with it Thus the induced magnetic field from the micro current of circulating electrons shields the nucleus from the applied field according to the following formula where s is the shielding constant
Bloc = (1 - s) B0 (5)
So the net field felt at each nucleus (Bloc) is less than the applied field The feature that makes NMR so interesting and extremely important to chemists is that s varies markedly from chemical group to chemical group Thus s for a -C1H3 is different from s for a -C1H2- and that in turn is different from s for an -O1H These features of NMR spectra illustrated for the 1Hs in ethanol in Figure 3 are referred to as chemical shifts They are important since they facilitate the identification of each type of 1H (or 13C) present in a molecule
All of the shifts in Figure 3 are referenced to the shift of the standard tetramethylsilane(TMS) and are calculated from the formula
ν 0 minusν refδ = x106 (6)ν ref
where n0 and nref is the frequency of the unknown and reference (TMS) respectively As mentioned above the amount of shielding and therefore the frequency separation between two lines will increase with increasing field However the chemical shifts calculated from Equation (6) are field independent Thus shifts measured at 100 MHz can be compared directly with those obtained at 500 MHz Note that positive d values correspond to higher frequencies or lower magnetic fields
Fischer Esterification-21
EXPERIMENT 5 Fischer Esterification
Figure 3 ndash The proton NMR spectrum of ethanol TMS (the rightmost signal) stands for tetramethylsilane (Si(CH3)4) TMS is the widely-used reference signal The step-like curve is the integrated signal proportional to the number of spins in each signal JT Arnold and co-workers first recorded this spectrum in 1951 [Journal of Chemical Physics 19 p 507]
Figure 4 illustrates the dependence of proton chemical shifts on the various functional groups in more detail Note that Figure 4b also shows chemical shifts for 13C another important NMR nucleus (a)
Fischer Esterification-22
EXPERIMENT 5 Fischer Esterification
(b)
Figure 4 Bar graph illustrating the range of chemical shifts expected for various types of (a) 1H resonances and (b) 13C resonances referenced to TMS
V J-Couplings and Spectral Intensities
The spectral lines of ethanol in Figure 3 exhibit fine structure -- ie the -CH3 line consists of three lines and the -CH2- has four components2 This coupling occurs because each magnetic nucleus also contributes to the local field of adjacent nuclei -- an effect referred to as spin-spin coupling The strength of this coupling is described by a field independent coupling constant J measured in Hertz (Hz)
2 JT Arnold Phys Rev 102 136 (1955)
Fischer Esterification-23
EXPERIMENT 5 Fischer Esterification
X3 IntensityX2 Intensity
1
2
1
1
3
3
1
Figure 5 (a) Orientations of the spins in the X2 group (-CH2-) of an AX2 spin system which give rise to a 121 triplet in the A resonance The two nuclei may have the 22 = 4 spin arrangements shown (b) The 23 = 8 arrangements of the three spins in an AX3 group which lead to the 1331 quartet in the A resonance
The spectral pattern in Figure 3 can be understood by examining the simple diagrams shown in Figure 5 If two spins that correspond to the two 1Hs on a -CH2- are present they can be aligned in four different ways Each spin is either parallel or opposed to the field Therefore two spins can be aligned both up both down and one up and one down (in two different ways spin one upspin two down and spin one downspin two up) Thus the local field at the -CH3 due to the adjacent -CH2- should have three components with an intensity ratio of 121 corresponding to both up one up and one down (2 ways) and both down Correspondingly there are eight ways to align the three spins on the methyl group as illustrated in the figure resulting in a quartet for the -CH2- with intensities of 1331 By extending these arguments to larger numbers of spins it is possible to show that N equivalent spins split the resonance of a coupled group into N+1 lines with intensities corresponding to the coefficients of a binomial expansion or Pascals Triangle A Pascals triangle is shown on the following page where N is the total number of equivalent spins
The size of J-couplings depends on the structure and the nuclei involved 1H-1H couplings are ~10 Hz while 1H-13C and 31P-1H couplings can be ~100 Hz and ~600 Hz respectively
Another noteworthy feature of Figure 3 is the integrated spectral intensity of each set of lines The integrals which are performed electronically in an experiment are shown as the step-like curves in the figure and are in the ratio 123 corresponding to the number of each type of 1H present Thus intensities in 1H spectra can be employed to determine the relative numbers of each type of 1H present in a molecule
In summary chemical shifts and spectral intensities provide information on the types and number of nuclei respectively associated with each functional group present in a molecule Further J-couplings permit a determination of which groups are chemically bonded Together these parameters permit the structures of most organic molecules to be determined by simply recording and interpreting their NMR spectra
Fischer Esterification-24
EXPERIMENT 5 Fischer Esterification
PASCALrsquoS TRIANGLE
N INTENSITY DISTRIBUTION
0 1 1 1 1 2 1 2 1 3 1 3 3 1 4 1 4 6 4 1 middot middot N Expand (1+x)N and select the coefficients
VI Experimental Procedure Sample Preparation
General The NMR sample tubes should be clean and free of dust and particulate matter Solid
samples should be dissolved in a deuterated solvent and liquid samples can be run neat or diluted in a deuterated solvent as described further below A good 1H NMR sample contains about 10 mg of compound The solution should contain no solids or paramagnetic impurities Your deuterated NMR solvent should be free of water and your NMR spectrum should contain no solvent peaks
An NMR sample tube is typically 175 mm in length with a 5 mm OD Minimum filling level is a distance of approximately 2 cm up from the bottom of the tube which is equal to a volume of about 03 mL However the optimum filling level is a distance of approximately 4-6 cm up from the bottom of the tube (06-09 mL) You must determine the minimum height of a sample by checking the depth gauge in the NMR room Over filling can distort the homogeneity and lead to lower resolution When the tube is inserted into the probe the position of the transmitter coil is about 1 cm from the bottom of the tube
As mentioned above the solvent must dissolve the sample material It is generally desirable to use as concentrated a solution as possible -- ie about 10 In difficult cases where the sample is not very soluble it may be necessary to find an alternative solvent Hydrogen-containing solvents should be avoided whenever possible The selected solvent should not produce strong signals of its own in the spectral region of interest Some solvents commonly employed for proton NMR spectroscopy include
deuterochloroform -- CDCl3 deuterated watermdashD20 hexadeuteroacetone (acetone-d6) -- (CD3)2C=O
Fischer Esterification-25
EXPERIMENT 5 Fischer Esterification
hexadeuterodimethylsulfoxide (DMSO-d6) -- (CD3)2S=O deuterodacetonitrile ndash CD3CN deuterotetrahydrofuran ndash C4D8O
Chloroform is by far the most popular and will be used almost exclusively in 5310 The TA will prepare the bottle of CDCl3 that you will use for your samples The CDCl3 will be spectral grade already treated with TMS Just keep in mind that you donrsquot want water getting into your deuterochloroform so keep the bottle open to the atmosphere as little as possible As long as the bottle remains open water from the air will dissolve in your NMR solvent
For preparing your NMR tube with an unknown liquid it is recommended that you take 50 uL of sample and dilute with 900 uL of deuterated chloroform in a small scintillation vial Mix well and using a 9-inch glass pastuer pipette place the pipette into the NMR tube as far in as it will go then gently release the sample up to the tip of the pipette The NMR tube should now be prepared perfectly with the correct volume of sample The TArsquos will demonstrate the technique for you during the pre-lab lecture When your sample has finished running the NMR tube should be opened up and turned over into a glass beaker located under the hood provided and labeled by the TArsquos
It is most important that the sample tube to be absolutely clean within and without its surfaces must be completely dust-free Particles just visible with the unaided eye may degrade the resolution if they are within the irradiation region
Reference Material It is usual to provide a reference line in each spectrum from which the chemical shifts of
other signals can be measured The normal method is to add a reference material (known as an internal standard) directly to the sample The reference material should not interact with the test sample If a symmetrical and non-polar type of molecule is used as the reference material these effects will be very small For this purpose tetramethylsilane (TMS) is most suitable An additional advantage of using TMS is that the spectral line it produces is at a higher field position than almost all other signals so that the chemical shifts of nearly all lines measured with respect to TMS are of the same low field direction As an alternative method the reference material may be contained in a sealed capillary tube which is inserted into the sample tube There can be no intermolecular effects by this method TMS will already have been added to the deuterochloroform which we will be using
Fischer Esterification-26
EXPERIMENT 5 Fischer Esterification
E This page intentionally left blank
Fischer Esterification-27
EXPERIMENT 5 Fischer Esterification
Day 1 Assembling a Ground-Glass Reflux Apparatus for Synthesis of an Ester Extraction of Acidic Impurity from Product Drying the Product
The apparatus for synthesis of the unknown ester requires assembling a ground-glass reflux apparatus similar to that shown in Figure 5-1 Obtain from the stockroom a kit containing a 250mL ground-glass round bottom flask 1420 condenser and an electric heating mantle which fits the 250mL round bottom flask Secure an unknown organic alcohol and acid from your instructor and record the unknown number into your laboratory notebook
wwwaus-e-tutecomau
Figure 5-1 Reflux Apparatus Fischer Ester Synthesis
copy AUS-e-TUTE All rights reserved This content is excluded from our Creative Commons license For more information see httpocwmiteduhelpfaq-fair-use
Fischer Esterification-28
EXPERIMENT 5 Fischer Esterification
When pouring the reactants into the 250mL round bottom flask do not allow the reactants to make any contact with the ground glass opening of the flask (See Figure 5-2) Rather use a funnel this will keep the reactants from coming into contact with the ground glass opening of the flask Both the sulfuric acid and the carboxylic acid are corrosive and should be handled carefully
Figure 5-2 Use a Funnel for Pouring Reactants into the Reflux Flask
To a 250mL round bottom flask set up in a laboratory hood add 40 mL of the unknown carboxylic acid followed by 30mL of the unknown alcohol Gently swirl the flask to mix the alcohol and carboxylic acid then carefully add 3 mL of concentrated sulfuric acid H2SO4 Obtain the sulfuric acid from the small dropper bottles provided Swirl the flask during the addition of the sulfuric acid the reaction is exothermic and heat will be released Use caution in handling the acid it is highly corrosive and the liquid and vapors are harmful Add a small magnetic
Fischer Esterification-29
EXPERIMENT 5 Fischer Esterification
stir bar to the flask then attach the reflux condenser with lightly greased joints as shown in Figure 5-3 Attach a drying tube to the top of the condenser
Figure 5-3 Reflux Apparatus amp Heating Mantle Fischer Esterification
Fischer Esterification-30
EXPERIMENT 5 Fischer Esterification
Using a heating mantel connected to a rheostat apply heat (approximately 75 electrical units) bringing the solution to a boil and reflux the solution for 1 hour Objective is to achieve a slow rate of reflux with liquid boiling and condensed vapor dripping back into the flask While the reaction is refluxing set up a 250 mL separatory funnel with a ring clamp support as shown in Figure 5-4
Figure 5-4 Separatory Funnel with Ring Stand Support
Once the reflux has completed cool reaction mixture to room temperature Transfer the reaction solution to a 250 mL separatory funnel and add 60 mL of cold distilled water Use an additional 20 mL of water to rinse out the reaction flask and add that to the separatory funnel as well Swirl the solution allowing the layers to separate and remove the aqueous layer Pour the Organic layer into a 500- mL clean dry beaker Extract the Organic layer with two 40 mL aliquots of 5 sodium bicarbonate solution to remove any traces of the carboxylic acid CO2 gas is released during the extraction and this can cause a high pressure inside the separatory funnel Because of this the first addition of 40 mL 5 sodium bicarbonate should be carried out in the 500-mL beaker slowly adding the sodium bicarbonate solution while stirring with a glass stirring rod Once the fizzing subsides transfer the contents of the beaker back to the separatory funnel and continue with the remaining extractions DO NOT INSERT THE GLASS
Fischer Esterification-31
EXPERIMENT 5 Fischer Esterification
STOPPER into the separatory funnel until the bubbling subsides Test the second extracted aqueous layer with litmus paper and make sure that it turns litmus paper blue and is basic If not repeat the extraction with two more 40 mL portions of 5 sodium bicarbonate solution until the aqueous extract tests basic Once the aqueous extraction layers have been removed extract the organic layer with two 10mL portions of saturated aqueous sodium chloride solution The sodium chloride will help to pull any trace amounts of water out of the organic layer Pour off the top organic layer into a 125 mL Erlenmeyer flask and dry with an anhydrous chemical drying agent such as MgSO4 or Na2SO4 Add approximately 4 grams of the drying agent swirling the flask gently allowing the drying agent to clump up indicating that it is pulling water out of the sample Add an additional 1-2 grams of the drying agent if needed until it stops clumping (caking) up in the flask Typical set up is shown in Figure 5-5 After drying the liquid should be very clear Decant the organic layer into a clean scintillation vial and store it in your desk drawer until the next lab Take great care to make sure that the drying agent stays in the original Erlenmeyer flask
Figure 5-5 Drying Sample with an Anhydrous Drying Agent
Fischer Esterification-32
EXPERIMENT 5 Fischer Esterification
Day 2 Atmospheric Distillation
Set up a simple distilling apparatus as shown in Figures 5-6
Figure 5-6 Atmospheric Distillation Apparatus with Vigruex Column
Fischer Esterification-33
EXPERIMENT 5 Fischer Esterification
Now carefully loosen the condenser clamp and disconnect the condenser and the distilling head from the 250mL distilling flask Insert a funnel containing a small loose cotton plug into the 250mL distilling flask Using the funnel carefully pour the saved ester product into the clean dry 250 mL distilling flask Add a magnetic stir bar to the distilling flask and re-attach to the distilling apparatus Be sure that the adapter is open to the atmosphere Have the system checked by your instructor prior to starting the distillation Collect the distillate in labeled test tubes that are cooled in ice (See Figure 5-7) Fill a beaker with ice chips and use it to hold the test tubes during collection of the distillate Make sure the test tube is positioned to capture any drops which drip from the condenser
Figure 5-7 Test Tube Receiver
Fischer Esterification-34
EXPERIMENT 5 Fischer Esterification
Re-check that the cooling water has been turned on When all has been checked then carefully begin heating the distilling flask For heating your apparatus start off at 40 electrical units on the rheostat control and go up 5 units every 5 minutes until you start collecting product Try to aim for a distillation rate of approximately 1 drop of distillate every 2-3 seconds Initially it may appear that nothing is happening check to make sure the heating element is working and getting warm Gradually as the heat is increased condensation should begin to appear on the interior of the vigreux column and distilling head Keep track of the thermometer readings as the vapor begins to condense off the tip of the thermometer bulb At that point the liquid should begin to collect inside the condenser and the first drop of distillate should reach your receiver test tube At this point carefully adjust the rate of heating on the rheostat such that you are collecting about 1 drop of distillate every 2-3 seconds Continue at this heating rate and regularly record the temperature on the thermometer in the laboratory notebook After collecting about 10-15 drops of distillate into the first test tube change the collection flask by inserting and collecting into a second test tube Collect the distillate in this second test tube as long as the temperature remains constant within a few degrees If the temperature changes or if the test tube is more than half filled with product change to another third clean test tube Keep records of the temperature range that each fraction was collected at in the laboratory notebook Make sure each of the tubes is clearly labeled in the order that product was collected Continue the distillation until about 2-3 mL remains in the distillation flask The clear colorless product should have an intense fruity odor Under no circumstances should you distill your product to dryness Once finished shut off and unplug the rheostat from the wall turn off the condenser water and allow the entire apparatus to cool to room temperature Using one of the flat pan balances in the lab tear 150 mL beaker on the balance then place your first test tube receiver into the beaker recording the mass of the test tube and contents Then it might be good to also make a note on the odor of your product Repeat this procedure for each receiver test tube that was used in collecting your product recording the mass and odor of each fraction Once the distillation apparatus is cool disassemble the entire apparatus and wash and clean all of the parts with soap hot water and acetone air drying all components Similarly clean the separatory funnel and the reflux apparatus Make sure all the glassware is absolutely clean and dry with no trace of any ester smell in the kit Take the kit to the TA and have the TA initial the kit is being returned clean Once you obtain the signature of your TA return the kit to the stockroom Do NOT store the equipment in your desk drawers
Fischer Esterification-35
EXPERIMENT 5 Fischer Esterification
Day 3 Characterize the Product by Infrared Spectroscopy (IR) Boiling Point (BP) Density and Refractive Index (20nD) and NMR
Day 3 will begin with the TA demonstrating the sample preparation and operation of the IR spectrometer refractometer and NMR spectrometer Students will then prepare an NMR sample tube and run their spectrum on the 60MHz NMR spectrometer Following this studentrsquos will proceed to determine the BP Density Refractive Index and run an IR spectrum on the Unknown Ester
The thermometer calibration part of the experiment is performed to check the accuracy of the digital thermometer or regular thermometer that will be used in this experiment The boiling point and freezing point of water can be used to calibrate the thermometer for this experiment Take two readings on the thermometer one for the freezing point of water and one for the boiling point and compare those readings with the true values For the freezing point fill a 150 mL beaker with ice and add distilled water Let it sit for 10-15 minutes until itrsquos cold then take the temperature of the ice water mixture Record the measured value and note the theoretical value which should be 0oC While waiting for the water to get cold fill a 150 mL beaker about frac34 full with water and heat it up on a hot plate to boiling (cover the beaker with aluminum foil to speed up the process) This may take 20 minutes While the water is heating take a reading for the barometric pressure in the lab from the barometer in inches of mercury Do a quick calculation to find the correct theoretical boiling point of water at that pressure Temperature corrections to the boiling point of water can be calculated using the following formula
Theoretical BP correction = (atmospheric pressure ndash 760 mm Hg) x (0037oC mm) Theoretical BP = 100 0C plusmn correction above
Check the temperature of the boiling water as it is heating up Be sure not to touch your thermometer to the sides or bottom of the beaker Record the experimental boiling point of the water Using excel construct a thermometer-calibration curve by plotting observed temperature values versus true theoretical values
Boiling point can be measured very accurately using an electronic digital thermometer and the apparatus pictured in Figure 5-8ab This device can be used
Fischer Esterification-36
EXPERIMENT 5 Fischer Esterification
to measure the boiling point of our unknown organic liquid Check with the TAs to see if this reaction should be running under the hoods Pour about 03 mL of liquid into a 12 x 75 mm test tube Add a boiling chip to the test tube Note in particular the position of the thermometer probe which should be placed about 5 mm above the liquid and is positioned so that it does not touch the test tube at any point The test tube sits in an 80 x 40 pyrex heating dish filled with sand which is heated by an electric hotplate Heat the sand until the liquid boils gently in the test tube so that the vapor is condensing about 3 cm from the top of the test tube but gently enough so that the liquid does not boil out of the apparatus After a few minutes you should begin to see condensation on the thermometer tip and droplets falling from the thermometer element After a few more minutes the temperature should become reasonably steady This is the boiling point of your volatile unknown organic liquid record it into your laboratory notebook Avoid unnecessarily breathing and inhaling the vapors from your system the unknown liquids should be assumed to be flammable and toxic
Fischer Esterification-37
EXPERIMENT 5 Fischer Esterification
FIGURE 5-8a Photo of Boiling Point Apparatus
Fischer Esterification-38
EXPERIMENT 5 Fischer Esterification
Figure 5-8b Schematic Drawing of Boiling Point Apparatus
1 13x100mm test tube 2 80x40 pyrex heating dish 3 digital thermometer 4 white sand 5 electric hot plate
Fischer Esterification-39
EXPERIMENT 5 Fischer Esterification
To determine the density of the unknown pour 10 mL of the unknown liquid into a clean dry 10 mL graduated burette The easy way to do this is to use a flexible plastic Pasteur pipette do not use a glass pipette as it could break and clog the burette tip It should only take 2-3 fills of the plastic pipette to fill the burette with unknown The hole on a 10mL burette is too small to try pouring the liquid in with a beaker Use the plastic disposable pipette Dispose of the plastic pipette in the solid waste container not the glass box Determine volume readings of the liquid to plusmn001 mL then take mass readings of the liquid on a Sartorius balance to plusmn0001 g Place a clean glass weighing bottle on a top-loading Sartorius balance and cover with the aluminum balance cover so that the head of the bottle just sticks out the covers opening Tare the balance to zero Using a burette clamp carefully add approximately 150 mL of unknown liquid to the weighing bottle and immediately record the mass in your lab notebook Cover the top of your weighing bottle amp the top of the burette with a plastic weighing boat while you take the volume reading from the burette The plastic weigh boat fits perfectly over the bottle and burette and will prevent any of the volatile liquid from evaporating Record the volume reading into your lab notebook Remove the plastic weighing boat cover the weight should be the same to within a few thousandth of a decimal place Now add another 1 to 2 mL of liquid to the weighing bottle and follow the same procedure recording the total volume and new mass Continue this until six or seven data points are collected Make sure to take the last mass reading after adding around 950 mL or so of the unknown Enter data into an excel spreadsheet and create a graph of data plotting mass on the y-axis versus volume on the x-axis Find the best least squares line through the data points with an equation for the line Make sure when adding a trend line that you set the intercept at zero and display the equation in chart The equation gives you the slope of the line which should be the density of the unknown volatile liquid For the molar mass and density do a detailed error analysis with 95 confidence limits
Measure the refractive index of the sample following the procedure demonstrated by your TA and outlined in Appendix IV Remember refractive index varies inversely with temperature (T) Make sure to record the temperature on the thermometer in the refractometer You can then make an adjustment to the refractive index when comparing with a literature value that may have been obtained at a different temperature Use the following formula for calculating the correction Dn = 45E-4 (T1-T2) where T1= temperature of the refractometer and T2= temperature you are comparing to Then add the correction to the measured refractive index obtained from the instrument The Abbe Refractometer is shown below in Figure 5-9
Fischer Esterification-40
EXPERIMENT 5 Fischer Esterification
Figure 5-9 Photo of Auto Abbe Refractometer
NMR Sample Tube Preparation Obtain a clean dry 5mm NMR tube from the stockroom Check the tube carefully for any cracks andor chips Obtain a bottle of deuterated chloroform (CDCl3) from the stock room Dissolve 50 microL of the ester in 900 microL of CDCl3 If the solution is clear add the solution to the NMR tube using a 9rdquo glass Pasteur pipette Insert the pipette filled with your sample into the NMR tube as far as it will go then release the sample until it reaches the opening (tip) of the pipette At that mark withdraw the glass pipette and the NMR sample tube now contains the correct amount of liquid If the solution is cloudy filter using a small piece of kim wipe inserted into a glass Pasteur pipette Cap the NMR tube and label with your name See Appendix III for the operation of the NMR 60
Fischer Esterification-41
EXPERIMENT 5 Fischer Esterification
Day 4 Identification of the Unknown Ester followed by running a Mass Spectrum
From the observed boiling point density refractive index and NMR spectrum of the unknown ester students will fill out the Preliminary Identification of Unknown Ester form and turn it in to your instructor at the start of the lab on Day 4 The first identification is worth 5 points Once the identification form has been turned in to your instructor run a mass spectrum on the previously identified ester Then fill out the final Identification of Unknown Ester form and turn it in to your instructor prior to the end of lab on Day 4 The second identification is worth an additional 5 points If it is correct you are ready to begin writing your report If it is not correct you may try to determine the source of your error and verify it with your TA All of the laboratory work must be completed in the allotted four days for this experiment and incorrect attempts at identification in no way affects the written report due date If you missed the identification you will be given the name of the correct ester for work up and analysis in your report
Mass Spec Sample Preparation Obtain a small scintillation vial from the stockroom Dissolve three drops of the ester in 1 mL of Pentane Proceed to the Mass Spectrometer and inject 001 microL of your sample into the GC-MS Each run takes 10 minutes + 3 minutes for data analysis Your TA will have a sign-up sheet for the GC-MS Please follow the direction of the TA
Fischer Esterification-42
EXPERIMENT 5 Fischer Esterification
Analysis and Discussion
1 Indicate the structural formula of the ester and how it was obtained from the proton NMR Describe how the structure is consistent in terms of the proton NMR spectrum Compare the calculated chemical shifts with the actual values obtained from the NMR If you missed the identification of the unknown ester present reasoning and indicate what it should have been in terms of being consistent with the data collected
2 Summarize the data in table form that indicates the identity of the ester Talk about the IR spectrum and what peaks were presentabsent that indicated an ester Which features of the IR spectrum can be assigned to the ester Be sure to identify and label as many functional groups as you can
3 Compare the boiling point density refractive index and composition of the ester identified from your data with literature values Explain any discrepancies
4 Comment on the quantities of alcoholacid used in the experiment as well as the sulfuric acid in terms of Kinetics andor Thermodynamic reasoning Discuss the yield of the product in terms of both of the above How would each of the following shift the equilibrium in the esterification reaction (a) removal of H2O as its formed (b) adding more H2SO4 catalyst
5 Write out the synthesis steps for the ester that you identified Include all of the names structures catalysts products and reaction conditions that were used in the synthesis Identify the limiting reagent and show calculations including a table or results Calculate the theoretical yield and percent yield of product formed
6 Comment on the odor of the ester (this should be carefully obtained and you should not inhale or breathe the ester directly but waft the air to obtain the scent Research the ester and determine if the smell observed was accurate in addition describe clearly where this ester is found and how it is used What are the association of acidalcohol and the odor of your ester
Fischer Esterification-43
EXPERIMENT 5 Fischer Esterification
7 Talk about sources of error in this experiment and how the experiment could be improved
8 Aside from any improvements in experimental techniques used in this experiment describe how the yield of the product might be increased
9 Write out the full mechanism (with arrows) for the formation of the ester that was synthesized
10Analyze the IR spectrum by reporting the observed bands in a table and assigning (labeling) those bands on the spectrum Identify and label as many functional groups as you can
11Analyze the NMR spectra by reporting tabulated results and assigning (labeling) those peaks to H atoms in the identified molecules Identify label and explain all of the peaks
12Analyze the MS spectrum reporting on the major peaks and assigning (labeling) those peaks
13Your well written discussion should address the following (within the text NOT as a numerical series of answers to questions)
bull Comparison of your distillation results (temperature ranges) fractions collected with your GC results
bull Explanation of how the separation of components could be improved
bull Comparison of your results with literature values (boiling pointscompositionsyields)
bull Discussion what information gas chromatography provides bull Discussion what information infrared spectroscopy provides bull Discussion what information mass spectroscopy provides bull Discussion what information nuclear magnetic resonance
spectroscopy provides bull Describe the odor of your carboxylic acid and alcohol prior to
the reaction
Fischer Esterification-44
EXPERIMENT 5 Fischer Esterification
APPENDIX I
Perkin Elmer FT-IR Operation Guide 1 Turn on Computer Screen and Printer IR stays on all the time
do not turn IR off 2 Click FTIR 3 On right side double click spectrum express 4 Put in User name and Password studentsstudents 5 In left margin click on sample view 6 Once the computer is on and the menu appears turn on the laser
on the FTIR located on left rear back side of instrument 7 Make sure nothing is in the instrument and run an air blank 8 Click background for the air blank after it runs prepare your
sample on an IR card using a glass pipette (See instructions under Day 3 FTIR Sample preparation) Pull up on the instrument door and insert the IR card into the card holder pushing it down gently all the way then shutting the instrument door (cover)
9 Click scan at top right after it runs click baseline adjust 10 Click on text to add a name to the spectrum 11 Click on label to mark peaks with wave numbers 12 Use left mouse to move labels around on the spectrum 13 Right click on spectrum then appearance to change color for
printing 14 Click on file then print 15 Delete all your sample files 16 Remove your samples from IR 17 Clean area around IR and take all your samples with you 18 TArsquos X out of the menu once all samples have been run 19 Choose turn off computer from start menu 20 Shut of printer and screen 21 Turn off laser on back of FTIR 22 IR REMAINS ON AT ALL TIMES
Fischer Esterification-45
EXPERIMENT 5 Fischer Esterification
APPENDIX II3
Procedure for Operating the Hewlett Packard GC-MS
1 Turn on the computer (Pump and GC should already be on) if its already on go to step 6 skip steps 1-5
2 Strike F1 key when prompted on computer screen 3 When program manager appears left muscles on cessation then restore or
maximize 4 Left click to highlight MS Top then go to file and select open 5 Top Default screen should now be open 6 Go to methods and Load and Run Methods Select Chem532m and OK 7 Fill in your last name followed by (D) for the file name operator sample
unknown and any notes then click on Run Method 8 Now take a 001 micro liter syringe and fill with your sample (neat) with
one swift movement inject the sample into the GC and quickly press start on the GC until the solid green light appears on GC console The spectrum appears on the computer and will be blank for the first 200 minutes as the solvent delay keeps the MS from turning on when the bulk of the sample hits the source After 200 minutes you should see the tail end of your sample appear on the GC trace
9 A message appears Override Solvent Delay 200 minutes Select ldquoNOrdquo and enter to get rid of the message
10Once spectrum finishes running it disappears into the data file and you are returned to TOP Chem 532m
11Click on the link data analysis and select main panel from drop down menu 12From file choose load data file click on your file name and open 13Move your cursor to a point under your peak (220 minutes) and right click
twice and your mass spectrum appears under your GC trace you can move it to another location on the GC trace and right double click until you get the cleanest looking mass spectrum that you want to print from
14Go to file and select Print Trace + Spectrum click only once and wait after a minute you will see message in lower left of computer Printout sent to background spooler be patient it takes a few minutes and then prints
15Go to the link Spectra then select tabulate spectra then Print and then click Done
3 Written by John J Dolhun
Fischer Esterification-46
EXPERIMENT 5 Fischer Esterification
16Go to Integrate select Generate report respond generate report then Done this may have nothing on it depending on your spectrum
17You should leave the machine with the MS Top screen open for the next student
Fischer Esterification-47
EXPERIMENT 5 Fischer Esterification
APPENDIX III
Department of Chemistry Undergraduate Lab60 MHz NMR Operation Guidelines
John Dolhun adopted from NMReady Userrsquos Manual amp DCIF NMR Guide
Objective Obtain well-shimmed NMR spectra to determine chemical shifts integration (1H only) splitting patterns coupling constants
This document is intended as an introductory guide to the NMReady 60MHz NMR acquisition and processing software catering to the needs of the MIT Undergraduate Lab For those interested a large amount of additional NMR related information can be found on the DCIF website at httpwebmiteduspeclabwwwulabhtml
Magnet Safety
bull CAUTION NMR Magnets are ALWAYS ON bull People with pacemakers cochlear and other medical implants should not enter the NMR room without a doctorrsquos permission
bull Keep all metal objects electronic and magnetic devices at least 5 feet from the magnet This includes cell phones iPods jump drives chairs wallets keys hair clips and pins
bull If a tube breaks inside the magnet contact the Undergraduate Lab Staff immediately
Fischer Esterification-48
EXPERIMENT 5 Fischer Esterification
Fig NMR Equipment (A) NMR Console with Magnet (B) Sample Warmer
Fischer Esterification-49
EXPERIMENT 5 Fischer Esterification
Sample Preparation
bull Use a clean and dry 5 mm NMR tube that is free of cracks and chips
bull Choose an NMR solvent by testing the solubility of the compound in the non-deuterated solvent Unless otherwise noted use deuterated chloroform
bull Dissolve 50 uL of the compound in 900 uL of the chosen deuterated4 solvent
bull If the solution is clear add the solution to the NMR tube using a 9rdquo glass Pasteur pipette Insert the pipette filled with your sample into the NMR tube as far as it will go then release sample until it reaches the opening (tip) of the pipette At that mark withdraw the glass pipette and you have the correct amount of sample in the NMR tube
bull If the solution is cloudy filter using a small piece if a Kim Wipe inserted into a glass Pasteur pipette
bull Cap and label the NMR tube
Sample Warmer
The sample warmer is used to keep the NMR samples and solvent reference tubes at the same temperature as the instrumentrsquos magnet
While the instrument is warming up turn on the sample warmer (switch on the back) and place the solvent reference tubes in it
Any student samples that will be tested should also be placed in the warmer for at least 5 minutes before running in the machine
Performance can be degraded if un-heated samples andor references are used
4 Deuterated solvent is used for two purposes 1) Serve as internal reference (lock) for the spectrometer to correct for magnetic field drift 2) Prevent large solvent 1H signals
Fischer Esterification-50
EXPERIMENT 5 Fischer Esterification
Placing a sample in the NMReady
The NMReady uses standard 5mm NMR tubes There is no air no sample spinners and no additional sample requirements so the tube glides directly into the magnet bore until it is located in the coil and then the operator will fee resistance When you guide the sample in hold the tube straight up and insert it gently When pulling it out pull it out carefully straight up until it is completely out of the magnet bore
It is strongly recommended that you warm your sample in the warmer NdFeB magnets can be affected by temperature so to prevent line broadening due to temperature gradients it is recommended that the sample equilibrate to the same temperature as the magnet for several minutes prior to introduction into the magnet coil before acquiring NMR data on the sample
To begin an experiment simply take out the reference sample insert your sample and press lsquoGOrsquo button and the NMR will obtain your spectrum If needed you can change some of the acquisition parameters easily using the scan calculator if the defaults are not suitable for your needs
Solvent Selector
The first person using the NMR ready will power up the system taking it off standby Then the solvent being used must be selected The instrument will not be correctly calibrated until a solvent is chosen
After solvent selection the system will prompt for a color-coded (blue yellow or red) shim standard to be inserted into the magnet Once the reference is inserted into the spectrometer the appropriate configuration files are automatically loaded and the NMReady performs internal system tests (eg lock receiver gain auto-shim) A notification message will confirm that the solvent change was successful If running a series of samples in the same solvent the solvent does not need to be re-selected between each sample
To acquire a spectrum simply insert the sample into the magnet bore and press lsquoGOrsquo This is One-touch-NMR
Fischer Esterification-51
EXPERIMENT 5 Fischer Esterification
Once the lsquoGOrsquo button has been activated the spectrometer will begin to acquire the data This includes a quick lock and automatic receiver gain and before the NMR pulse protocol begins The first scan will be presented (post Fourier transform) on the screen and the spectrum will be updated with SN improvements every additional four scans Once the spectrum has appeared you are ready for analysis saving or exporting your spectrum
Visual Appearance
Full Screen The two-headed arrow in the lower right-hand corner of the data display area can be used to toggle to full screen mode if it is necessary to increase the viewing area for data processing
Ppm Hz Toggle A spectrum can be viewed with the chemical shift displayed in ppm (parts per million) or in Hz
Grid Toggle A grid can be turned onoff by pushing the Grid button in the upper right hand corner of the screen
Adjust The lsquoAdjustrsquo menu enables 1) baseline adjustment 2) spectrum phasing and 3) spectrum referencing These adjustments are beneficial in improving the accuracy of the integrations
View Menu
Zoom Width To zoom into a specific chemical shift range along the x-axis of a spectrum push lsquoZoom Widthrsquo then touch the screen on either side of the area you want to zoom to
Zoom Height To adjust the height of the displayed peak(s) first press the lsquoZoom Heightrsquo button (vertical zoom) and then touch the screen above the peak that you want to extend How far above the peak that you touch will determine the extent of the vertical zoom
Fischer Esterification-52
EXPERIMENT 5 Fischer Esterification
Show All The show all button restores the original size of the spectrum
Cursor Touching the lsquoCursorrsquo toggle button places a cursor on the screen adjustable by touch The cursor can be used to quickly ascertain the position of a resonance or by switching the Hz mode used to quickly determine coupling constants
Integrate Touching the integrate button shows the automatically generated integrals of the peaks in the current spectrum The integrals give lsquoarea under the curversquo information and can be used to determine relative concentrations of protons in the sample at analysis
Peaks Touching the peaks button places a list of all detected peaks on the screen The peak list can be used for comparative purposes or to measure coupling constants
Process The process functions enable dynamic changes to be applied to the spectrum during processing Depending on the complexity of the spectrum and the quality of the data the spectrum can be smoothed (apodization) or enhanced (zero-filling)
Apodize LB Line broadening increases the smoothness of the lines so for a well resolved spectrum increasing this number can improve the look of the spectrum However this smoothness also results in line broadening and can therefore reduce the resolution
Zero Fill Increasing the zero filling enhances the digital resolution of the spectrum Enhanced digital resolution will make feature-to-feature measurements more accurate Increased zero filling is recommended for accurate coupling constant determination
Fischer Esterification-53
EXPERIMENT 5 Fischer Esterification
Saving and Exporting Data
After data processing is complete the data can be saved (as either a jdx or a png) directly to the NMReady exported to a network folder or printed to a network laser printer
Print Push the print button to send the spectral image (including integrations peaks and coupling constants) to the laser printer in the room The image will print in a frame and will be accompanied by experimental parameters
JDX Export Push the JDX to export the current spectrum directly to a USB drive that you insert into the NMReady DO NOT PRESS SAVE and DO NOT PRESS Screenshot as these will save your spectrum on the spectrometer which we donrsquot want You can however export your file to our network folder which is hooked up on the computer next to the NMR The Dell computer is equipped with the latest Mestrelab software to analyze the spectrum further if you so desire It is however not necessary to export your spectrum here once you get your printout and are satisfied
Fischer Esterification-54
EXPERIMENT 5 Fischer Esterification
APPENDIX IV Operation of Refractometer
1 Turn on unit from switch on back of instrument 2 Turn on water pump next to instrument 3 Let instrument warm up for at least 10 minutes 4 When word ldquoinitiaterdquo appears on bottom right corner of screen
press initiate and wait until word ldquoHELLOrdquo appears 5 Now place distilled water on prism using plastic pipette and
close cover wait for 2 minutes select then press Calibrate if all OK the refractive index of water should appear on the screen 13329
6 Machine is now ready for routine operation 7 Dab off water with a soft tissue then place two drops of sample
in the sample well use plastic pipette press read switch to get a reading
8 Immediately clean off your sample wipe off gently with dry lens tissue Then use methanol Finally do a water wash and dry off with lens tissue
9 Press temperature switch and record value 10 Make sure to do a temperature correction for the temperature
you are comparing to 11 Turning off machine turn off water pump first then
refractometer 12 Any other questions read manual by instrument
Fischer Esterification-55
MIT OpenCourseWare httpsocwmitedu
5310 Laboratory Chemistry Fall 2017
For information about citing these materials or our Terms of Use visit httpsocwmiteduterms
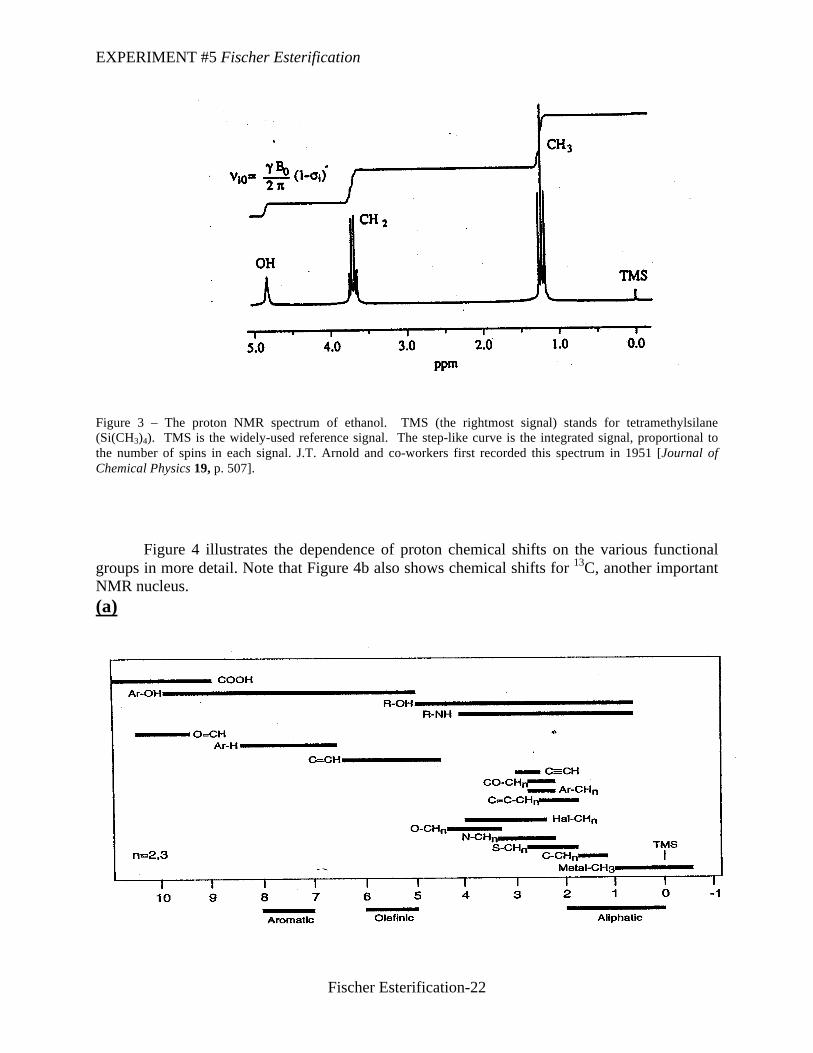
EXPERIMENT 5 Fischer Esterification
7 Talk about sources of error in this experiment and how the experiment could be improved
8 Aside from any improvements in experimental techniques used in this experiment describe how the yield of the product might be increased
9 Write out the full mechanism (with arrows) for the formation of the ester that was synthesized
10Analyze the IR spectrum by reporting the observed bands in a table and assigning (labeling) those bands on the spectrum Identify and label as many functional groups as you can
11Analyze the NMR spectra by reporting tabulated results and assigning (labeling) those peaks to H atoms in the identified molecules Identify label and explain all of the peaks
12Analyze the MS spectrum reporting on the major peaks and assigning (labeling) those peaks
13Your well written discussion should address the following (within the text NOT as a numerical series of answers to questions)
bull Comparison of your distillation results (temperature ranges) fractions collected with your GC results
bull Explanation of how the separation of components could be improved
bull Comparison of your results with literature values (boiling pointscompositionsyields)
bull Discussion what information gas chromatography provides bull Discussion what information infrared spectroscopy provides bull Discussion what information mass spectroscopy provides bull Discussion what information nuclear magnetic resonance
spectroscopy provides bull Describe the odor of your carboxylic acid and alcohol prior to
the reaction
Fischer Esterification-44
EXPERIMENT 5 Fischer Esterification
APPENDIX I
Perkin Elmer FT-IR Operation Guide 1 Turn on Computer Screen and Printer IR stays on all the time
do not turn IR off 2 Click FTIR 3 On right side double click spectrum express 4 Put in User name and Password studentsstudents 5 In left margin click on sample view 6 Once the computer is on and the menu appears turn on the laser
on the FTIR located on left rear back side of instrument 7 Make sure nothing is in the instrument and run an air blank 8 Click background for the air blank after it runs prepare your
sample on an IR card using a glass pipette (See instructions under Day 3 FTIR Sample preparation) Pull up on the instrument door and insert the IR card into the card holder pushing it down gently all the way then shutting the instrument door (cover)
9 Click scan at top right after it runs click baseline adjust 10 Click on text to add a name to the spectrum 11 Click on label to mark peaks with wave numbers 12 Use left mouse to move labels around on the spectrum 13 Right click on spectrum then appearance to change color for
printing 14 Click on file then print 15 Delete all your sample files 16 Remove your samples from IR 17 Clean area around IR and take all your samples with you 18 TArsquos X out of the menu once all samples have been run 19 Choose turn off computer from start menu 20 Shut of printer and screen 21 Turn off laser on back of FTIR 22 IR REMAINS ON AT ALL TIMES
Fischer Esterification-45
EXPERIMENT 5 Fischer Esterification
APPENDIX II3
Procedure for Operating the Hewlett Packard GC-MS
1 Turn on the computer (Pump and GC should already be on) if its already on go to step 6 skip steps 1-5
2 Strike F1 key when prompted on computer screen 3 When program manager appears left muscles on cessation then restore or
maximize 4 Left click to highlight MS Top then go to file and select open 5 Top Default screen should now be open 6 Go to methods and Load and Run Methods Select Chem532m and OK 7 Fill in your last name followed by (D) for the file name operator sample
unknown and any notes then click on Run Method 8 Now take a 001 micro liter syringe and fill with your sample (neat) with
one swift movement inject the sample into the GC and quickly press start on the GC until the solid green light appears on GC console The spectrum appears on the computer and will be blank for the first 200 minutes as the solvent delay keeps the MS from turning on when the bulk of the sample hits the source After 200 minutes you should see the tail end of your sample appear on the GC trace
9 A message appears Override Solvent Delay 200 minutes Select ldquoNOrdquo and enter to get rid of the message
10Once spectrum finishes running it disappears into the data file and you are returned to TOP Chem 532m
11Click on the link data analysis and select main panel from drop down menu 12From file choose load data file click on your file name and open 13Move your cursor to a point under your peak (220 minutes) and right click
twice and your mass spectrum appears under your GC trace you can move it to another location on the GC trace and right double click until you get the cleanest looking mass spectrum that you want to print from
14Go to file and select Print Trace + Spectrum click only once and wait after a minute you will see message in lower left of computer Printout sent to background spooler be patient it takes a few minutes and then prints
15Go to the link Spectra then select tabulate spectra then Print and then click Done
3 Written by John J Dolhun
Fischer Esterification-46
EXPERIMENT 5 Fischer Esterification
16Go to Integrate select Generate report respond generate report then Done this may have nothing on it depending on your spectrum
17You should leave the machine with the MS Top screen open for the next student
Fischer Esterification-47
EXPERIMENT 5 Fischer Esterification
APPENDIX III
Department of Chemistry Undergraduate Lab60 MHz NMR Operation Guidelines
John Dolhun adopted from NMReady Userrsquos Manual amp DCIF NMR Guide
Objective Obtain well-shimmed NMR spectra to determine chemical shifts integration (1H only) splitting patterns coupling constants
This document is intended as an introductory guide to the NMReady 60MHz NMR acquisition and processing software catering to the needs of the MIT Undergraduate Lab For those interested a large amount of additional NMR related information can be found on the DCIF website at httpwebmiteduspeclabwwwulabhtml
Magnet Safety
bull CAUTION NMR Magnets are ALWAYS ON bull People with pacemakers cochlear and other medical implants should not enter the NMR room without a doctorrsquos permission
bull Keep all metal objects electronic and magnetic devices at least 5 feet from the magnet This includes cell phones iPods jump drives chairs wallets keys hair clips and pins
bull If a tube breaks inside the magnet contact the Undergraduate Lab Staff immediately
Fischer Esterification-48
EXPERIMENT 5 Fischer Esterification
Fig NMR Equipment (A) NMR Console with Magnet (B) Sample Warmer
Fischer Esterification-49
EXPERIMENT 5 Fischer Esterification
Sample Preparation
bull Use a clean and dry 5 mm NMR tube that is free of cracks and chips
bull Choose an NMR solvent by testing the solubility of the compound in the non-deuterated solvent Unless otherwise noted use deuterated chloroform
bull Dissolve 50 uL of the compound in 900 uL of the chosen deuterated4 solvent
bull If the solution is clear add the solution to the NMR tube using a 9rdquo glass Pasteur pipette Insert the pipette filled with your sample into the NMR tube as far as it will go then release sample until it reaches the opening (tip) of the pipette At that mark withdraw the glass pipette and you have the correct amount of sample in the NMR tube
bull If the solution is cloudy filter using a small piece if a Kim Wipe inserted into a glass Pasteur pipette
bull Cap and label the NMR tube
Sample Warmer
The sample warmer is used to keep the NMR samples and solvent reference tubes at the same temperature as the instrumentrsquos magnet
While the instrument is warming up turn on the sample warmer (switch on the back) and place the solvent reference tubes in it
Any student samples that will be tested should also be placed in the warmer for at least 5 minutes before running in the machine
Performance can be degraded if un-heated samples andor references are used
4 Deuterated solvent is used for two purposes 1) Serve as internal reference (lock) for the spectrometer to correct for magnetic field drift 2) Prevent large solvent 1H signals
Fischer Esterification-50
EXPERIMENT 5 Fischer Esterification
Placing a sample in the NMReady
The NMReady uses standard 5mm NMR tubes There is no air no sample spinners and no additional sample requirements so the tube glides directly into the magnet bore until it is located in the coil and then the operator will fee resistance When you guide the sample in hold the tube straight up and insert it gently When pulling it out pull it out carefully straight up until it is completely out of the magnet bore
It is strongly recommended that you warm your sample in the warmer NdFeB magnets can be affected by temperature so to prevent line broadening due to temperature gradients it is recommended that the sample equilibrate to the same temperature as the magnet for several minutes prior to introduction into the magnet coil before acquiring NMR data on the sample
To begin an experiment simply take out the reference sample insert your sample and press lsquoGOrsquo button and the NMR will obtain your spectrum If needed you can change some of the acquisition parameters easily using the scan calculator if the defaults are not suitable for your needs
Solvent Selector
The first person using the NMR ready will power up the system taking it off standby Then the solvent being used must be selected The instrument will not be correctly calibrated until a solvent is chosen
After solvent selection the system will prompt for a color-coded (blue yellow or red) shim standard to be inserted into the magnet Once the reference is inserted into the spectrometer the appropriate configuration files are automatically loaded and the NMReady performs internal system tests (eg lock receiver gain auto-shim) A notification message will confirm that the solvent change was successful If running a series of samples in the same solvent the solvent does not need to be re-selected between each sample
To acquire a spectrum simply insert the sample into the magnet bore and press lsquoGOrsquo This is One-touch-NMR
Fischer Esterification-51
EXPERIMENT 5 Fischer Esterification
Once the lsquoGOrsquo button has been activated the spectrometer will begin to acquire the data This includes a quick lock and automatic receiver gain and before the NMR pulse protocol begins The first scan will be presented (post Fourier transform) on the screen and the spectrum will be updated with SN improvements every additional four scans Once the spectrum has appeared you are ready for analysis saving or exporting your spectrum
Visual Appearance
Full Screen The two-headed arrow in the lower right-hand corner of the data display area can be used to toggle to full screen mode if it is necessary to increase the viewing area for data processing
Ppm Hz Toggle A spectrum can be viewed with the chemical shift displayed in ppm (parts per million) or in Hz
Grid Toggle A grid can be turned onoff by pushing the Grid button in the upper right hand corner of the screen
Adjust The lsquoAdjustrsquo menu enables 1) baseline adjustment 2) spectrum phasing and 3) spectrum referencing These adjustments are beneficial in improving the accuracy of the integrations
View Menu
Zoom Width To zoom into a specific chemical shift range along the x-axis of a spectrum push lsquoZoom Widthrsquo then touch the screen on either side of the area you want to zoom to
Zoom Height To adjust the height of the displayed peak(s) first press the lsquoZoom Heightrsquo button (vertical zoom) and then touch the screen above the peak that you want to extend How far above the peak that you touch will determine the extent of the vertical zoom
Fischer Esterification-52
EXPERIMENT 5 Fischer Esterification
Show All The show all button restores the original size of the spectrum
Cursor Touching the lsquoCursorrsquo toggle button places a cursor on the screen adjustable by touch The cursor can be used to quickly ascertain the position of a resonance or by switching the Hz mode used to quickly determine coupling constants
Integrate Touching the integrate button shows the automatically generated integrals of the peaks in the current spectrum The integrals give lsquoarea under the curversquo information and can be used to determine relative concentrations of protons in the sample at analysis
Peaks Touching the peaks button places a list of all detected peaks on the screen The peak list can be used for comparative purposes or to measure coupling constants
Process The process functions enable dynamic changes to be applied to the spectrum during processing Depending on the complexity of the spectrum and the quality of the data the spectrum can be smoothed (apodization) or enhanced (zero-filling)
Apodize LB Line broadening increases the smoothness of the lines so for a well resolved spectrum increasing this number can improve the look of the spectrum However this smoothness also results in line broadening and can therefore reduce the resolution
Zero Fill Increasing the zero filling enhances the digital resolution of the spectrum Enhanced digital resolution will make feature-to-feature measurements more accurate Increased zero filling is recommended for accurate coupling constant determination
Fischer Esterification-53
EXPERIMENT 5 Fischer Esterification
Saving and Exporting Data
After data processing is complete the data can be saved (as either a jdx or a png) directly to the NMReady exported to a network folder or printed to a network laser printer
Print Push the print button to send the spectral image (including integrations peaks and coupling constants) to the laser printer in the room The image will print in a frame and will be accompanied by experimental parameters
JDX Export Push the JDX to export the current spectrum directly to a USB drive that you insert into the NMReady DO NOT PRESS SAVE and DO NOT PRESS Screenshot as these will save your spectrum on the spectrometer which we donrsquot want You can however export your file to our network folder which is hooked up on the computer next to the NMR The Dell computer is equipped with the latest Mestrelab software to analyze the spectrum further if you so desire It is however not necessary to export your spectrum here once you get your printout and are satisfied
Fischer Esterification-54
EXPERIMENT 5 Fischer Esterification
APPENDIX IV Operation of Refractometer
1 Turn on unit from switch on back of instrument 2 Turn on water pump next to instrument 3 Let instrument warm up for at least 10 minutes 4 When word ldquoinitiaterdquo appears on bottom right corner of screen
press initiate and wait until word ldquoHELLOrdquo appears 5 Now place distilled water on prism using plastic pipette and
close cover wait for 2 minutes select then press Calibrate if all OK the refractive index of water should appear on the screen 13329
6 Machine is now ready for routine operation 7 Dab off water with a soft tissue then place two drops of sample
in the sample well use plastic pipette press read switch to get a reading
8 Immediately clean off your sample wipe off gently with dry lens tissue Then use methanol Finally do a water wash and dry off with lens tissue
9 Press temperature switch and record value 10 Make sure to do a temperature correction for the temperature
you are comparing to 11 Turning off machine turn off water pump first then
refractometer 12 Any other questions read manual by instrument
Fischer Esterification-55
MIT OpenCourseWare httpsocwmitedu
5310 Laboratory Chemistry Fall 2017
For information about citing these materials or our Terms of Use visit httpsocwmiteduterms
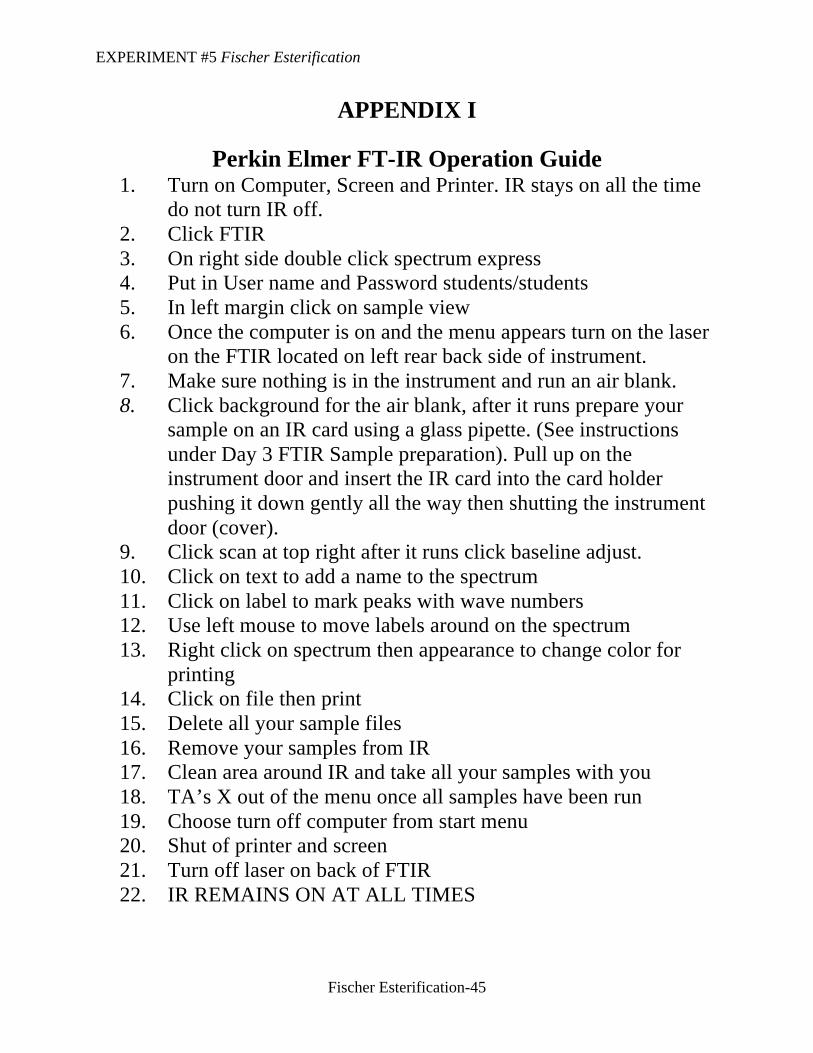
EXPERIMENT 5 Fischer Esterification
Sample Preparation
bull Use a clean and dry 5 mm NMR tube that is free of cracks and chips
bull Choose an NMR solvent by testing the solubility of the compound in the non-deuterated solvent Unless otherwise noted use deuterated chloroform
bull Dissolve 50 uL of the compound in 900 uL of the chosen deuterated4 solvent
bull If the solution is clear add the solution to the NMR tube using a 9rdquo glass Pasteur pipette Insert the pipette filled with your sample into the NMR tube as far as it will go then release sample until it reaches the opening (tip) of the pipette At that mark withdraw the glass pipette and you have the correct amount of sample in the NMR tube
bull If the solution is cloudy filter using a small piece if a Kim Wipe inserted into a glass Pasteur pipette
bull Cap and label the NMR tube
Sample Warmer
The sample warmer is used to keep the NMR samples and solvent reference tubes at the same temperature as the instrumentrsquos magnet
While the instrument is warming up turn on the sample warmer (switch on the back) and place the solvent reference tubes in it
Any student samples that will be tested should also be placed in the warmer for at least 5 minutes before running in the machine
Performance can be degraded if un-heated samples andor references are used
4 Deuterated solvent is used for two purposes 1) Serve as internal reference (lock) for the spectrometer to correct for magnetic field drift 2) Prevent large solvent 1H signals
Fischer Esterification-50
EXPERIMENT 5 Fischer Esterification
Placing a sample in the NMReady
The NMReady uses standard 5mm NMR tubes There is no air no sample spinners and no additional sample requirements so the tube glides directly into the magnet bore until it is located in the coil and then the operator will fee resistance When you guide the sample in hold the tube straight up and insert it gently When pulling it out pull it out carefully straight up until it is completely out of the magnet bore
It is strongly recommended that you warm your sample in the warmer NdFeB magnets can be affected by temperature so to prevent line broadening due to temperature gradients it is recommended that the sample equilibrate to the same temperature as the magnet for several minutes prior to introduction into the magnet coil before acquiring NMR data on the sample
To begin an experiment simply take out the reference sample insert your sample and press lsquoGOrsquo button and the NMR will obtain your spectrum If needed you can change some of the acquisition parameters easily using the scan calculator if the defaults are not suitable for your needs
Solvent Selector
The first person using the NMR ready will power up the system taking it off standby Then the solvent being used must be selected The instrument will not be correctly calibrated until a solvent is chosen
After solvent selection the system will prompt for a color-coded (blue yellow or red) shim standard to be inserted into the magnet Once the reference is inserted into the spectrometer the appropriate configuration files are automatically loaded and the NMReady performs internal system tests (eg lock receiver gain auto-shim) A notification message will confirm that the solvent change was successful If running a series of samples in the same solvent the solvent does not need to be re-selected between each sample
To acquire a spectrum simply insert the sample into the magnet bore and press lsquoGOrsquo This is One-touch-NMR
Fischer Esterification-51
EXPERIMENT 5 Fischer Esterification
Once the lsquoGOrsquo button has been activated the spectrometer will begin to acquire the data This includes a quick lock and automatic receiver gain and before the NMR pulse protocol begins The first scan will be presented (post Fourier transform) on the screen and the spectrum will be updated with SN improvements every additional four scans Once the spectrum has appeared you are ready for analysis saving or exporting your spectrum
Visual Appearance
Full Screen The two-headed arrow in the lower right-hand corner of the data display area can be used to toggle to full screen mode if it is necessary to increase the viewing area for data processing
Ppm Hz Toggle A spectrum can be viewed with the chemical shift displayed in ppm (parts per million) or in Hz
Grid Toggle A grid can be turned onoff by pushing the Grid button in the upper right hand corner of the screen
Adjust The lsquoAdjustrsquo menu enables 1) baseline adjustment 2) spectrum phasing and 3) spectrum referencing These adjustments are beneficial in improving the accuracy of the integrations
View Menu
Zoom Width To zoom into a specific chemical shift range along the x-axis of a spectrum push lsquoZoom Widthrsquo then touch the screen on either side of the area you want to zoom to
Zoom Height To adjust the height of the displayed peak(s) first press the lsquoZoom Heightrsquo button (vertical zoom) and then touch the screen above the peak that you want to extend How far above the peak that you touch will determine the extent of the vertical zoom
Fischer Esterification-52
EXPERIMENT 5 Fischer Esterification
Show All The show all button restores the original size of the spectrum
Cursor Touching the lsquoCursorrsquo toggle button places a cursor on the screen adjustable by touch The cursor can be used to quickly ascertain the position of a resonance or by switching the Hz mode used to quickly determine coupling constants
Integrate Touching the integrate button shows the automatically generated integrals of the peaks in the current spectrum The integrals give lsquoarea under the curversquo information and can be used to determine relative concentrations of protons in the sample at analysis
Peaks Touching the peaks button places a list of all detected peaks on the screen The peak list can be used for comparative purposes or to measure coupling constants
Process The process functions enable dynamic changes to be applied to the spectrum during processing Depending on the complexity of the spectrum and the quality of the data the spectrum can be smoothed (apodization) or enhanced (zero-filling)
Apodize LB Line broadening increases the smoothness of the lines so for a well resolved spectrum increasing this number can improve the look of the spectrum However this smoothness also results in line broadening and can therefore reduce the resolution
Zero Fill Increasing the zero filling enhances the digital resolution of the spectrum Enhanced digital resolution will make feature-to-feature measurements more accurate Increased zero filling is recommended for accurate coupling constant determination
Fischer Esterification-53
EXPERIMENT 5 Fischer Esterification
Saving and Exporting Data
After data processing is complete the data can be saved (as either a jdx or a png) directly to the NMReady exported to a network folder or printed to a network laser printer
Print Push the print button to send the spectral image (including integrations peaks and coupling constants) to the laser printer in the room The image will print in a frame and will be accompanied by experimental parameters
JDX Export Push the JDX to export the current spectrum directly to a USB drive that you insert into the NMReady DO NOT PRESS SAVE and DO NOT PRESS Screenshot as these will save your spectrum on the spectrometer which we donrsquot want You can however export your file to our network folder which is hooked up on the computer next to the NMR The Dell computer is equipped with the latest Mestrelab software to analyze the spectrum further if you so desire It is however not necessary to export your spectrum here once you get your printout and are satisfied
Fischer Esterification-54
EXPERIMENT 5 Fischer Esterification
APPENDIX IV Operation of Refractometer
1 Turn on unit from switch on back of instrument 2 Turn on water pump next to instrument 3 Let instrument warm up for at least 10 minutes 4 When word ldquoinitiaterdquo appears on bottom right corner of screen
press initiate and wait until word ldquoHELLOrdquo appears 5 Now place distilled water on prism using plastic pipette and
close cover wait for 2 minutes select then press Calibrate if all OK the refractive index of water should appear on the screen 13329
6 Machine is now ready for routine operation 7 Dab off water with a soft tissue then place two drops of sample
in the sample well use plastic pipette press read switch to get a reading
8 Immediately clean off your sample wipe off gently with dry lens tissue Then use methanol Finally do a water wash and dry off with lens tissue
9 Press temperature switch and record value 10 Make sure to do a temperature correction for the temperature
you are comparing to 11 Turning off machine turn off water pump first then
refractometer 12 Any other questions read manual by instrument
Fischer Esterification-55
MIT OpenCourseWare httpsocwmitedu
5310 Laboratory Chemistry Fall 2017
For information about citing these materials or our Terms of Use visit httpsocwmiteduterms
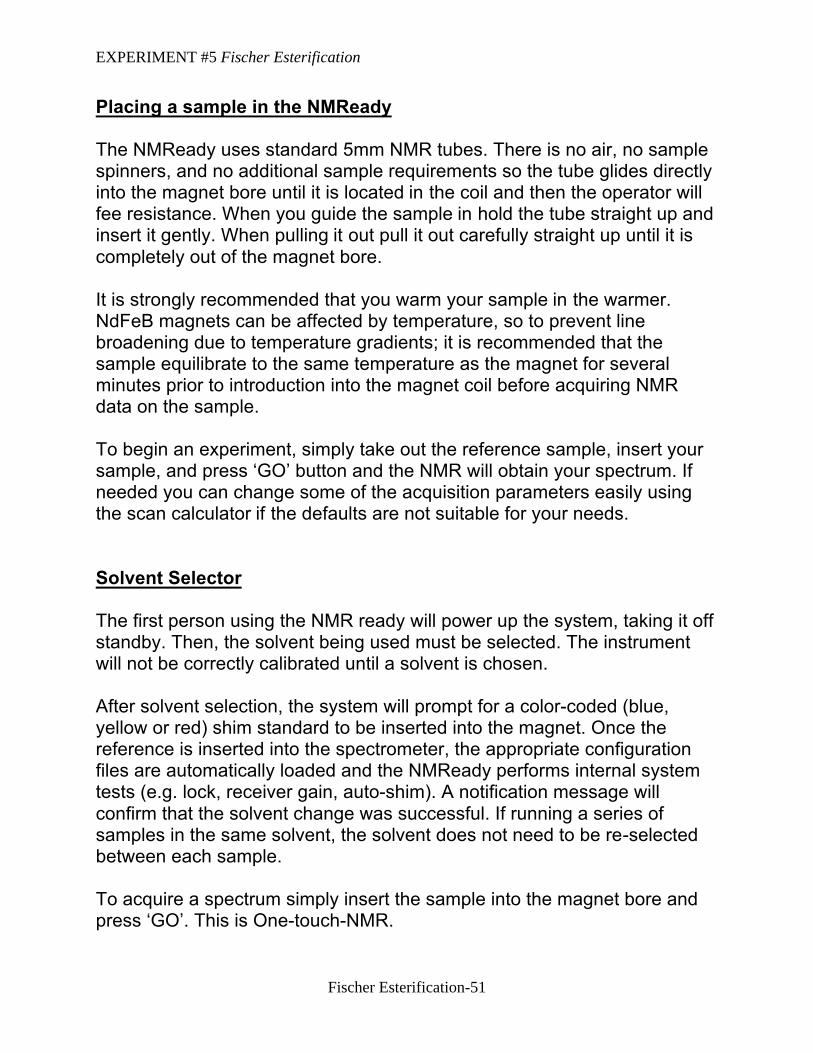
EXPERIMENT 5 Fischer Esterification
Placing a sample in the NMReady
The NMReady uses standard 5mm NMR tubes There is no air no sample spinners and no additional sample requirements so the tube glides directly into the magnet bore until it is located in the coil and then the operator will fee resistance When you guide the sample in hold the tube straight up and insert it gently When pulling it out pull it out carefully straight up until it is completely out of the magnet bore
It is strongly recommended that you warm your sample in the warmer NdFeB magnets can be affected by temperature so to prevent line broadening due to temperature gradients it is recommended that the sample equilibrate to the same temperature as the magnet for several minutes prior to introduction into the magnet coil before acquiring NMR data on the sample
To begin an experiment simply take out the reference sample insert your sample and press lsquoGOrsquo button and the NMR will obtain your spectrum If needed you can change some of the acquisition parameters easily using the scan calculator if the defaults are not suitable for your needs
Solvent Selector
The first person using the NMR ready will power up the system taking it off standby Then the solvent being used must be selected The instrument will not be correctly calibrated until a solvent is chosen
After solvent selection the system will prompt for a color-coded (blue yellow or red) shim standard to be inserted into the magnet Once the reference is inserted into the spectrometer the appropriate configuration files are automatically loaded and the NMReady performs internal system tests (eg lock receiver gain auto-shim) A notification message will confirm that the solvent change was successful If running a series of samples in the same solvent the solvent does not need to be re-selected between each sample
To acquire a spectrum simply insert the sample into the magnet bore and press lsquoGOrsquo This is One-touch-NMR
Fischer Esterification-51
EXPERIMENT 5 Fischer Esterification
Once the lsquoGOrsquo button has been activated the spectrometer will begin to acquire the data This includes a quick lock and automatic receiver gain and before the NMR pulse protocol begins The first scan will be presented (post Fourier transform) on the screen and the spectrum will be updated with SN improvements every additional four scans Once the spectrum has appeared you are ready for analysis saving or exporting your spectrum
Visual Appearance
Full Screen The two-headed arrow in the lower right-hand corner of the data display area can be used to toggle to full screen mode if it is necessary to increase the viewing area for data processing
Ppm Hz Toggle A spectrum can be viewed with the chemical shift displayed in ppm (parts per million) or in Hz
Grid Toggle A grid can be turned onoff by pushing the Grid button in the upper right hand corner of the screen
Adjust The lsquoAdjustrsquo menu enables 1) baseline adjustment 2) spectrum phasing and 3) spectrum referencing These adjustments are beneficial in improving the accuracy of the integrations
View Menu
Zoom Width To zoom into a specific chemical shift range along the x-axis of a spectrum push lsquoZoom Widthrsquo then touch the screen on either side of the area you want to zoom to
Zoom Height To adjust the height of the displayed peak(s) first press the lsquoZoom Heightrsquo button (vertical zoom) and then touch the screen above the peak that you want to extend How far above the peak that you touch will determine the extent of the vertical zoom
Fischer Esterification-52
EXPERIMENT 5 Fischer Esterification
Show All The show all button restores the original size of the spectrum
Cursor Touching the lsquoCursorrsquo toggle button places a cursor on the screen adjustable by touch The cursor can be used to quickly ascertain the position of a resonance or by switching the Hz mode used to quickly determine coupling constants
Integrate Touching the integrate button shows the automatically generated integrals of the peaks in the current spectrum The integrals give lsquoarea under the curversquo information and can be used to determine relative concentrations of protons in the sample at analysis
Peaks Touching the peaks button places a list of all detected peaks on the screen The peak list can be used for comparative purposes or to measure coupling constants
Process The process functions enable dynamic changes to be applied to the spectrum during processing Depending on the complexity of the spectrum and the quality of the data the spectrum can be smoothed (apodization) or enhanced (zero-filling)
Apodize LB Line broadening increases the smoothness of the lines so for a well resolved spectrum increasing this number can improve the look of the spectrum However this smoothness also results in line broadening and can therefore reduce the resolution
Zero Fill Increasing the zero filling enhances the digital resolution of the spectrum Enhanced digital resolution will make feature-to-feature measurements more accurate Increased zero filling is recommended for accurate coupling constant determination
Fischer Esterification-53
EXPERIMENT 5 Fischer Esterification
Saving and Exporting Data
After data processing is complete the data can be saved (as either a jdx or a png) directly to the NMReady exported to a network folder or printed to a network laser printer
Print Push the print button to send the spectral image (including integrations peaks and coupling constants) to the laser printer in the room The image will print in a frame and will be accompanied by experimental parameters
JDX Export Push the JDX to export the current spectrum directly to a USB drive that you insert into the NMReady DO NOT PRESS SAVE and DO NOT PRESS Screenshot as these will save your spectrum on the spectrometer which we donrsquot want You can however export your file to our network folder which is hooked up on the computer next to the NMR The Dell computer is equipped with the latest Mestrelab software to analyze the spectrum further if you so desire It is however not necessary to export your spectrum here once you get your printout and are satisfied
Fischer Esterification-54
EXPERIMENT 5 Fischer Esterification
APPENDIX IV Operation of Refractometer
1 Turn on unit from switch on back of instrument 2 Turn on water pump next to instrument 3 Let instrument warm up for at least 10 minutes 4 When word ldquoinitiaterdquo appears on bottom right corner of screen
press initiate and wait until word ldquoHELLOrdquo appears 5 Now place distilled water on prism using plastic pipette and
close cover wait for 2 minutes select then press Calibrate if all OK the refractive index of water should appear on the screen 13329
6 Machine is now ready for routine operation 7 Dab off water with a soft tissue then place two drops of sample
in the sample well use plastic pipette press read switch to get a reading
8 Immediately clean off your sample wipe off gently with dry lens tissue Then use methanol Finally do a water wash and dry off with lens tissue
9 Press temperature switch and record value 10 Make sure to do a temperature correction for the temperature
you are comparing to 11 Turning off machine turn off water pump first then
refractometer 12 Any other questions read manual by instrument
Fischer Esterification-55
MIT OpenCourseWare httpsocwmitedu
5310 Laboratory Chemistry Fall 2017
For information about citing these materials or our Terms of Use visit httpsocwmiteduterms
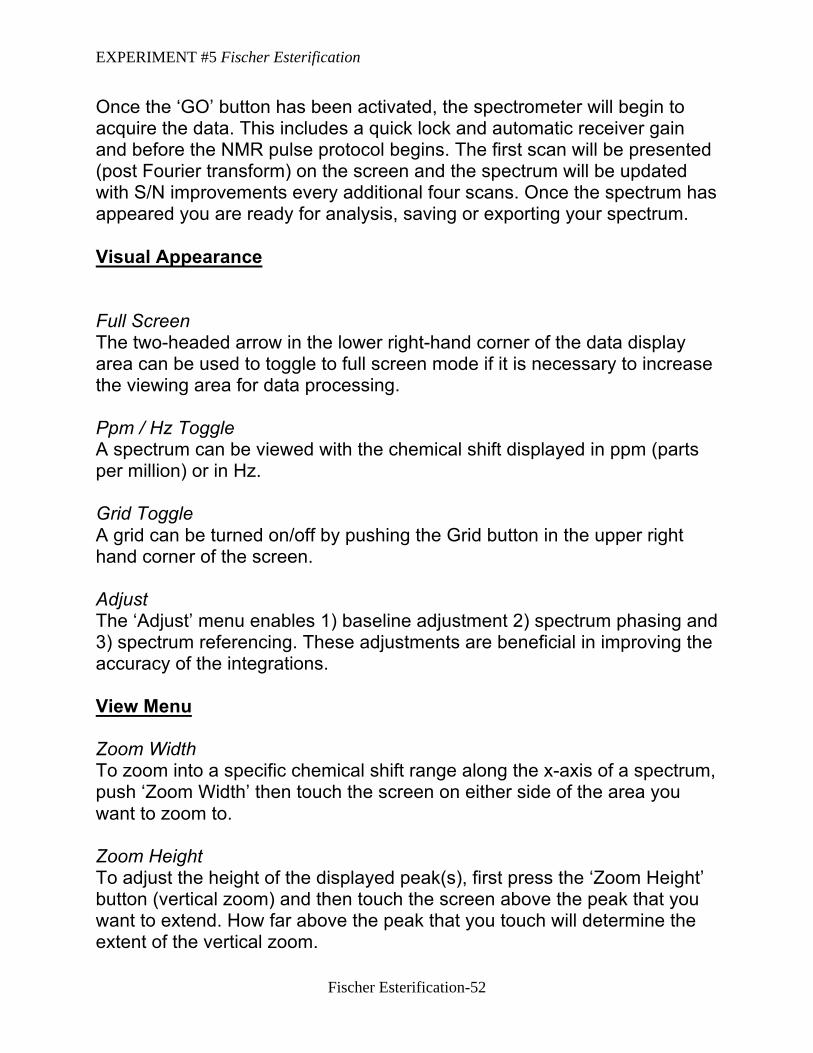
EXPERIMENT 5 Fischer Esterification
APPENDIX IV Operation of Refractometer
1 Turn on unit from switch on back of instrument 2 Turn on water pump next to instrument 3 Let instrument warm up for at least 10 minutes 4 When word ldquoinitiaterdquo appears on bottom right corner of screen
press initiate and wait until word ldquoHELLOrdquo appears 5 Now place distilled water on prism using plastic pipette and
close cover wait for 2 minutes select then press Calibrate if all OK the refractive index of water should appear on the screen 13329
6 Machine is now ready for routine operation 7 Dab off water with a soft tissue then place two drops of sample
in the sample well use plastic pipette press read switch to get a reading
8 Immediately clean off your sample wipe off gently with dry lens tissue Then use methanol Finally do a water wash and dry off with lens tissue
9 Press temperature switch and record value 10 Make sure to do a temperature correction for the temperature
you are comparing to 11 Turning off machine turn off water pump first then
refractometer 12 Any other questions read manual by instrument
Fischer Esterification-55
MIT OpenCourseWare httpsocwmitedu
5310 Laboratory Chemistry Fall 2017
For information about citing these materials or our Terms of Use visit httpsocwmiteduterms

MIT OpenCourseWare httpsocwmitedu
5310 Laboratory Chemistry Fall 2017
For information about citing these materials or our Terms of Use visit httpsocwmiteduterms