Embed Size (px)
Citation preview

Massachusetts Healthcare Personnel Influenza Vaccination in Health Care Facilities
Joyce Cohen, MPH
Epidemiologist
Katherine T. Fillo, Ph.D, RN-BC
Director of Clinical Quality Improvement
Hillary A. Johnson, MHS
Epidemiologist
Eileen McHale, RN, BSN
Healthcare Associated Infection Coordinator
Public Health Council September 12, 2018
Background
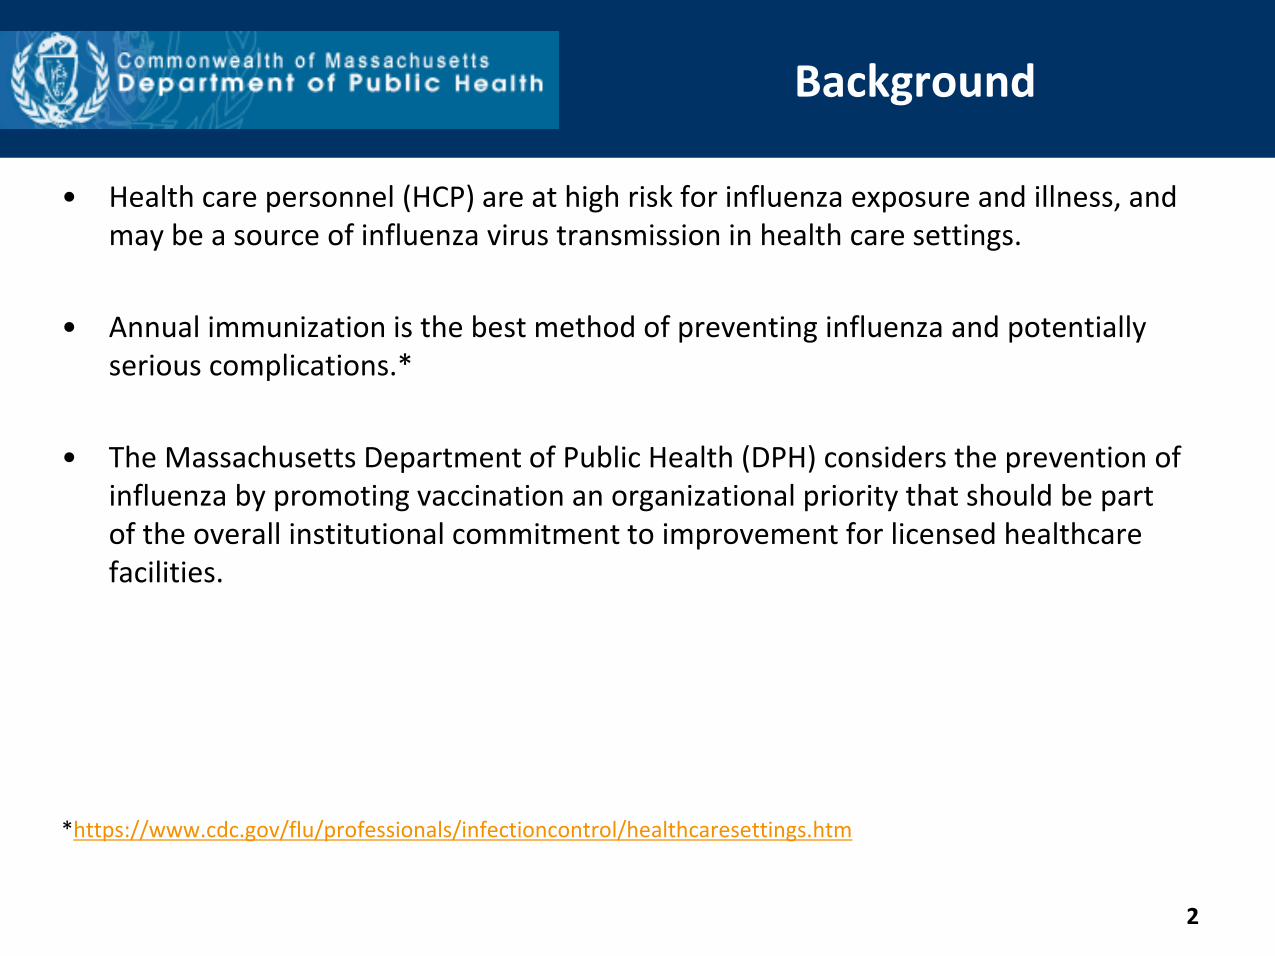
• Health care personnel (HCP) are at high risk for influenza exposure and illness, and may be a source of influenza virus transmission in health care settings.
• Annual immunization is the best method of preventing influenza and potentially serious complications.*
• The Massachusetts Department of Public Health (DPH) considers the prevention of influenza by promoting vaccination an organizational priority that should be part of the overall institutional commitment to improvement for licensed healthcare facilities.
*https://www.cdc.gov/flu/professionals/infectioncontrol/healthcaresettings.htm
2
Background
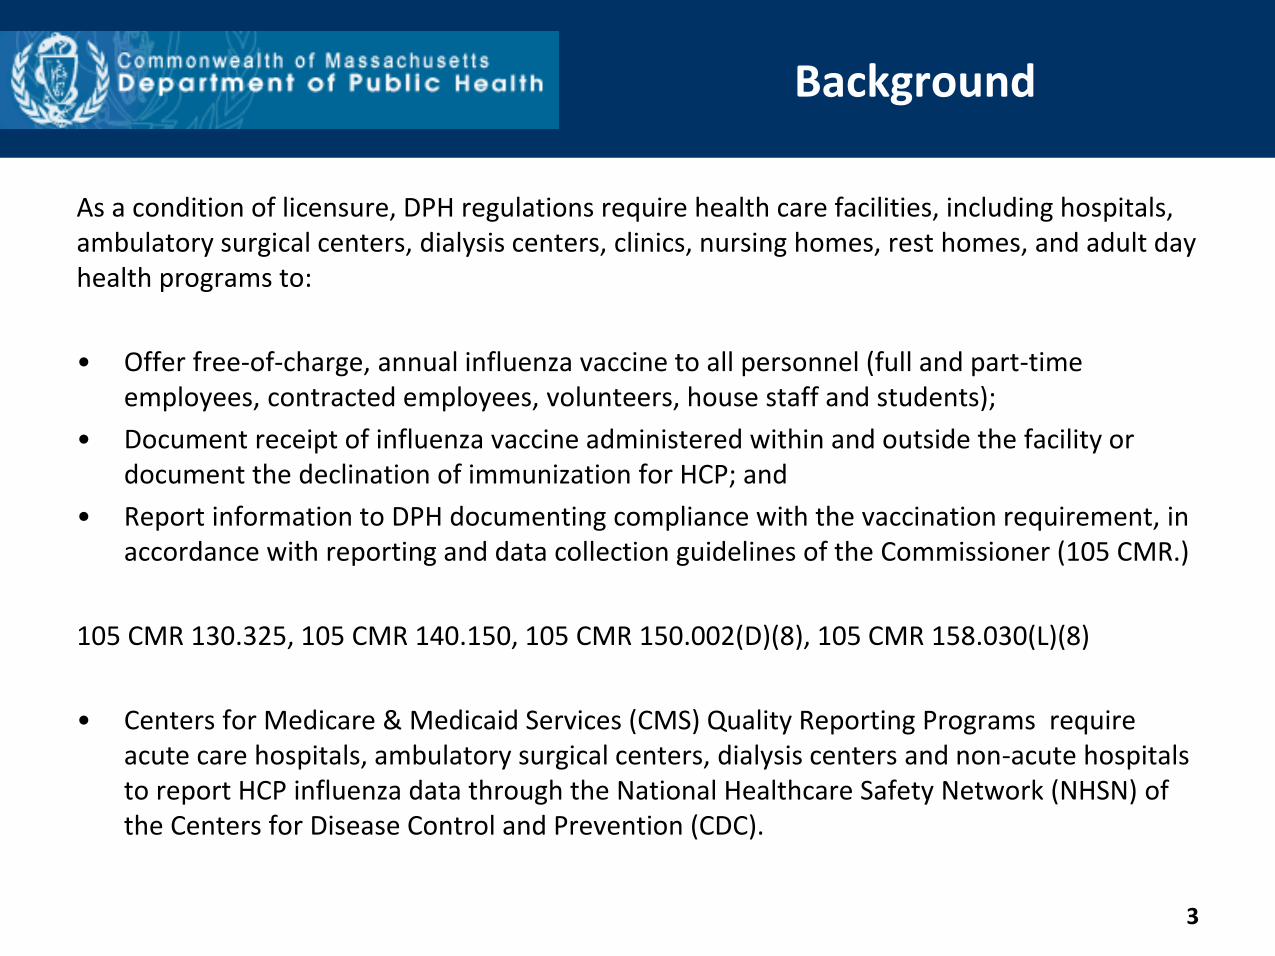
As a condition of licensure, DPH regulations require health care facilities, including hospitals, ambulatory surgical centers, dialysis centers, clinics, nursing homes, rest homes, and adult day health programs to:
• Offer free-of-charge, annual influenza vaccine to all personnel (full and part-time employees, contracted employees, volunteers, house staff and students);
• Document receipt of influenza vaccine administered within and outside the facility or document the declination of immunization for HCP; and
• Report information to DPH documenting compliance with the vaccination requirement, in accordance with reporting and data collection guidelines of the Commissioner (105 CMR.)
105 CMR 130.325, 105 CMR 140.150, 105 CMR 150.002(D)(8), 105 CMR 158.030(L)(8)
• Centers for Medicare & Medicaid Services (CMS) Quality Reporting Programs require acute care hospitals, ambulatory surgical centers, dialysis centers and non-acute hospitals to report HCP influenza data through the National Healthcare Safety Network (NHSN) of the Centers for Disease Control and Prevention (CDC).
3
Performance Goal
To protect the lives and welfare of patients, employees, and communities, as well as to improve quality and reduce healthcare costs, DPH has established an overall minimum influenza vaccination rate of 90% or greater for eligible HCP at all licensed healthcare facilities.
This performance goal is intended to advance patient and HCP health and safety by ensuring optimal HCP influenza vaccination coverage, and is in alignment with the National Healthy People 2020 target of 90% influenza coverage of HCP.
https://www.healthypeople.gov/node/4668/data_details
4

Methodology
Health Care Facilities report HCP influenza vaccination rates to DPH in two ways:
• Consistent with the Centers for Medicare & Medicaid Services (CMS) Quality Reporting Programs, DPH requires acute care hospitals, ambulatory surgical centers, dialysis centers and non-acute hospitals to report HCP influenza data through the National Healthcare Safety Network (NHSN) of the Centers for Disease Control and Prevention (CDC).
• Clinics, nursing homes, rest homes, and adult day health programs are required to report health care personnel influenza data directly to the DPH Healthcare Associated Infection (HAI) Prevention Program.
5
NHSN Reporting Requirements Acute Care Hospitals, Ambulatory Surgical Centers,
Dialysis Centers and Non-acute Hospitals
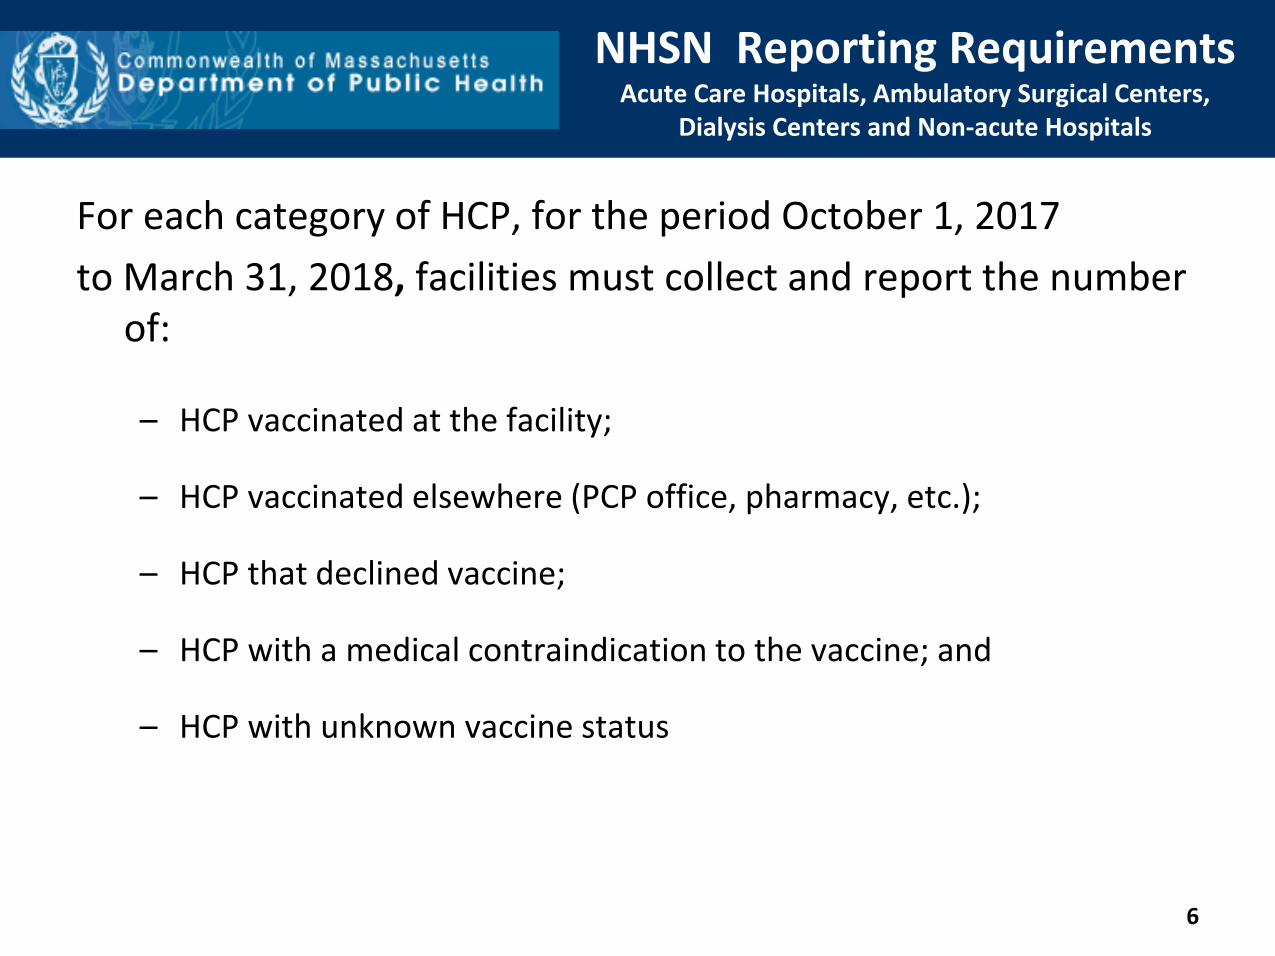
For each category of HCP, for the period October 1, 2017
to March 31, 2018, facilities must collect and report the number of:
– HCP vaccinated at the facility;
– HCP vaccinated elsewhere (PCP office, pharmacy, etc.);
– HCP that declined vaccine;
– HCP with a medical contraindication to the vaccine; and
– HCP with unknown vaccine status
6
NHSN Measures Acute Care Hospitals, Ambulatory Surgical Centers,
Dialysis Centers and Non-acute Hospitals
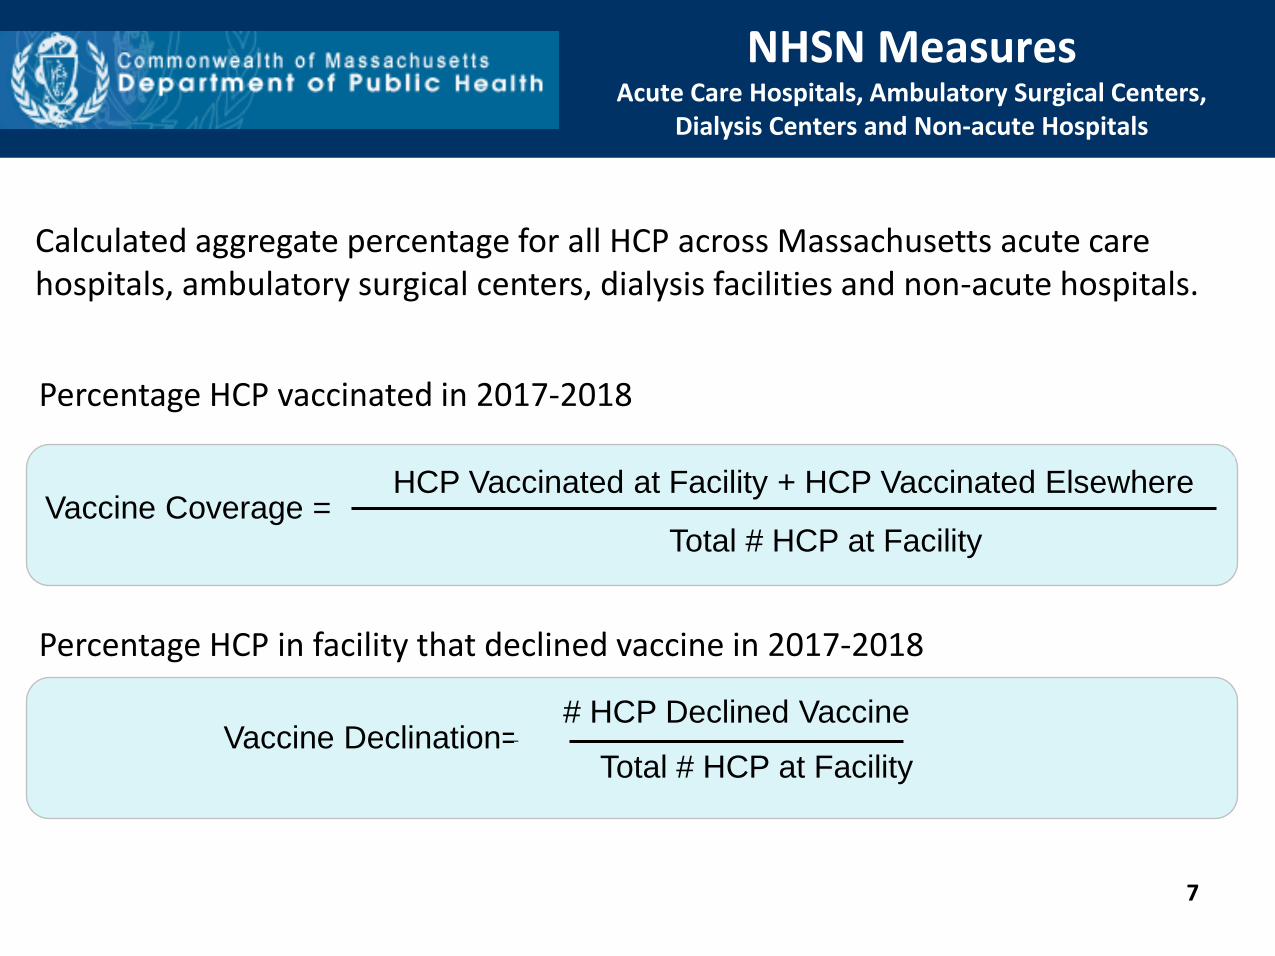
Vaccine Coverage = HCP Vaccinated at Facility + HCP Vaccinated Elsewhere
Total # HCP at Facility
Vaccine Declination= # HCP Declined Vaccine
Total # HCP at Facility
Percentage HCP vaccinated in 2017-2018
Percentage HCP in facility that declined vaccine in 2017-2018
Calculated aggregate percentage for all HCP across Massachusetts acute care hospitals, ambulatory surgical centers, dialysis facilities and non-acute hospitals.
7
NHSN Measures Acute Care Hospitals, Ambulatory Surgical Centers,
Dialysis Centers and Non-acute Hospitals
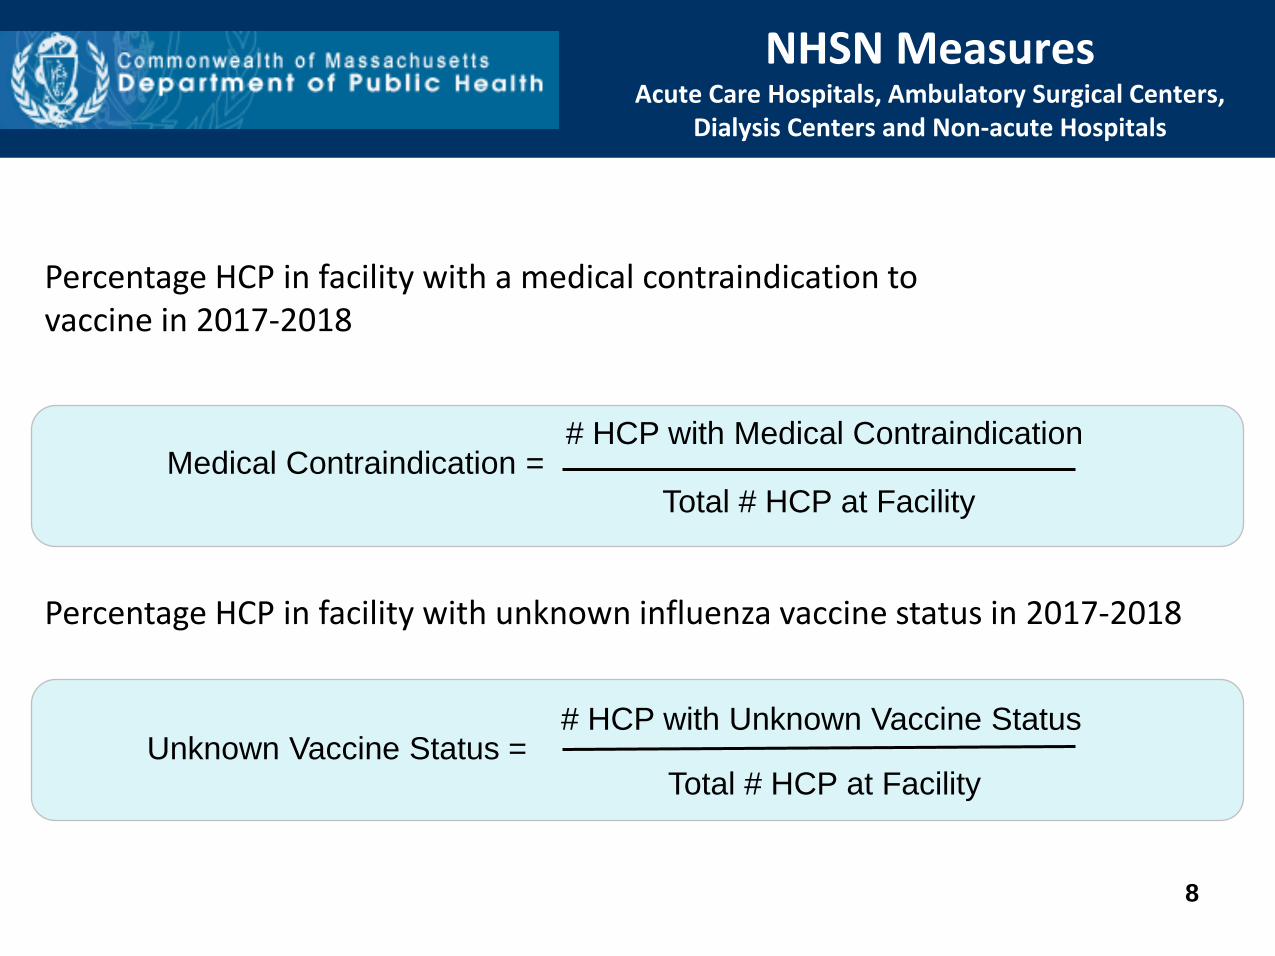
Percentage HCP in facility with a medical contraindication to vaccine in 2017-2018
Percentage HCP in facility with unknown influenza vaccine status in 2017-2018
Unknown Vaccine Status = # HCP with Unknown Vaccine Status
Total # HCP at Facility
Medical Contraindication = # HCP with Medical Contraindication
Total # HCP at Facility
8
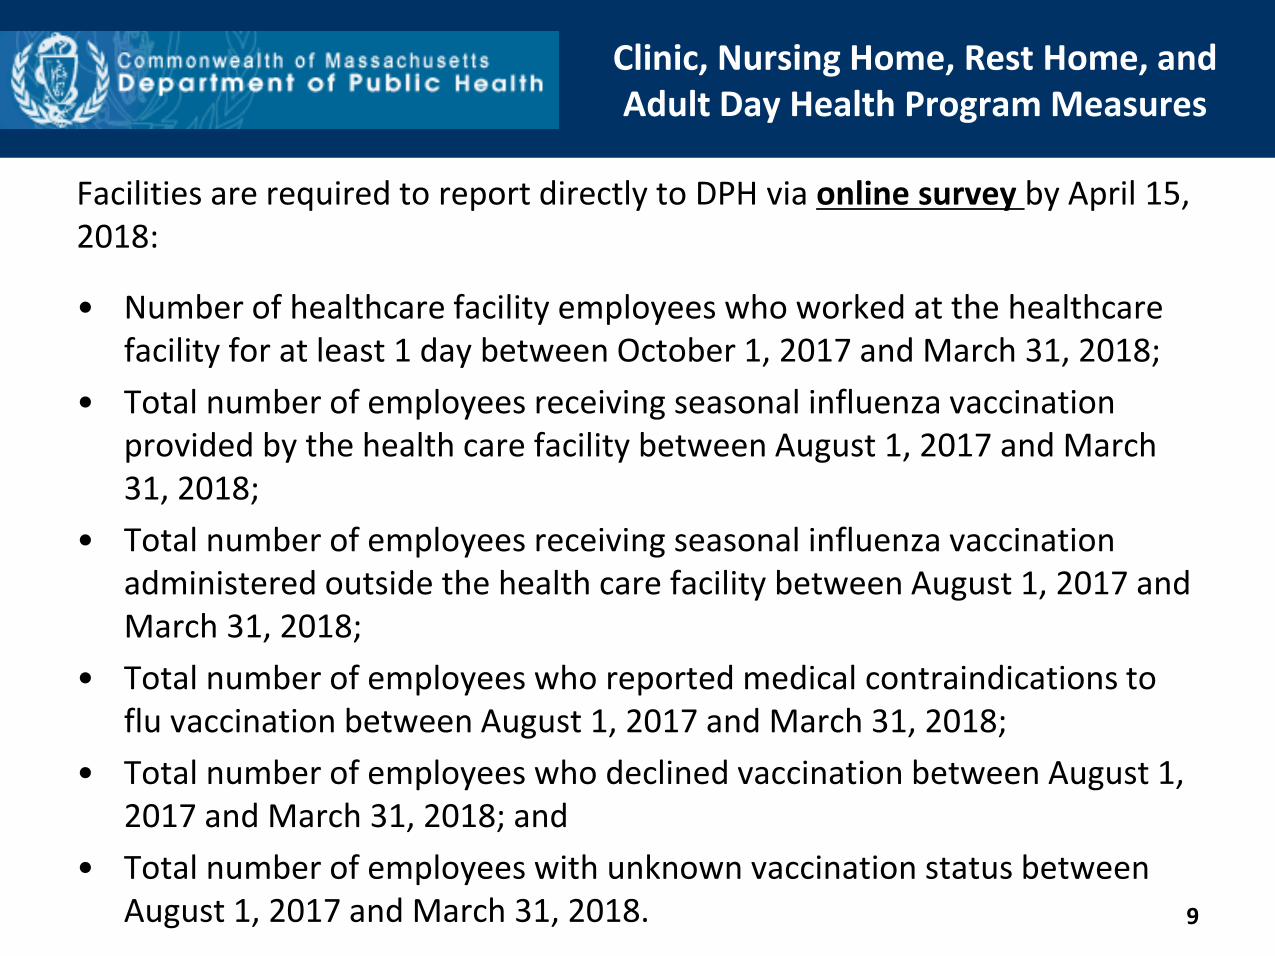
Clinic, Nursing Home, Rest Home, and Adult Day Health Program Measures
Facilities are required to report directly to DPH via online survey by April 15, 2018:
• Number of healthcare facility employees who worked at the healthcare facility for at least 1 day between October 1, 2017 and March 31, 2018;
• Total number of employees receiving seasonal influenza vaccination provided by the health care facility between August 1, 2017 and March 31, 2018;
• Total number of employees receiving seasonal influenza vaccination administered outside the health care facility between August 1, 2017 and March 31, 2018;
• Total number of employees who reported medical contraindications to flu vaccination between August 1, 2017 and March 31, 2018;
• Total number of employees who declined vaccination between August 1, 2017 and March 31, 2018; and
• Total number of employees with unknown vaccination status between August 1, 2017 and March 31, 2018.
9
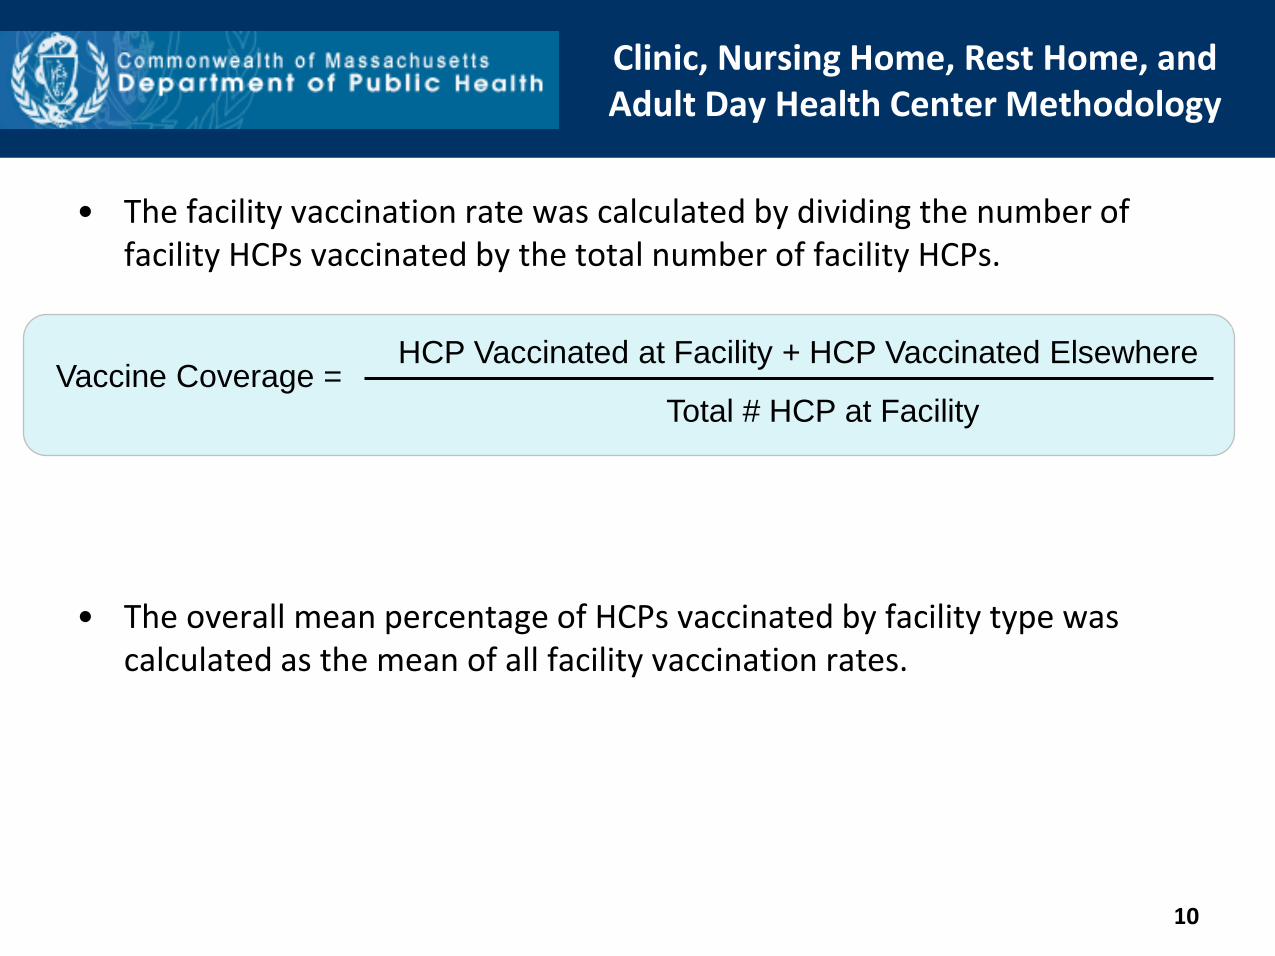
Clinic, Nursing Home, Rest Home, and Adult Day Health Center Methodology
• The facility vaccination rate was calculated by dividing the number of facility HCPs vaccinated by the total number of facility HCPs.
• The overall mean percentage of HCPs vaccinated by facility type was calculated as the mean of all facility vaccination rates.
10
Vaccine Coverage = HCP Vaccinated at Facility + HCP Vaccinated Elsewhere
Total # HCP at Facility
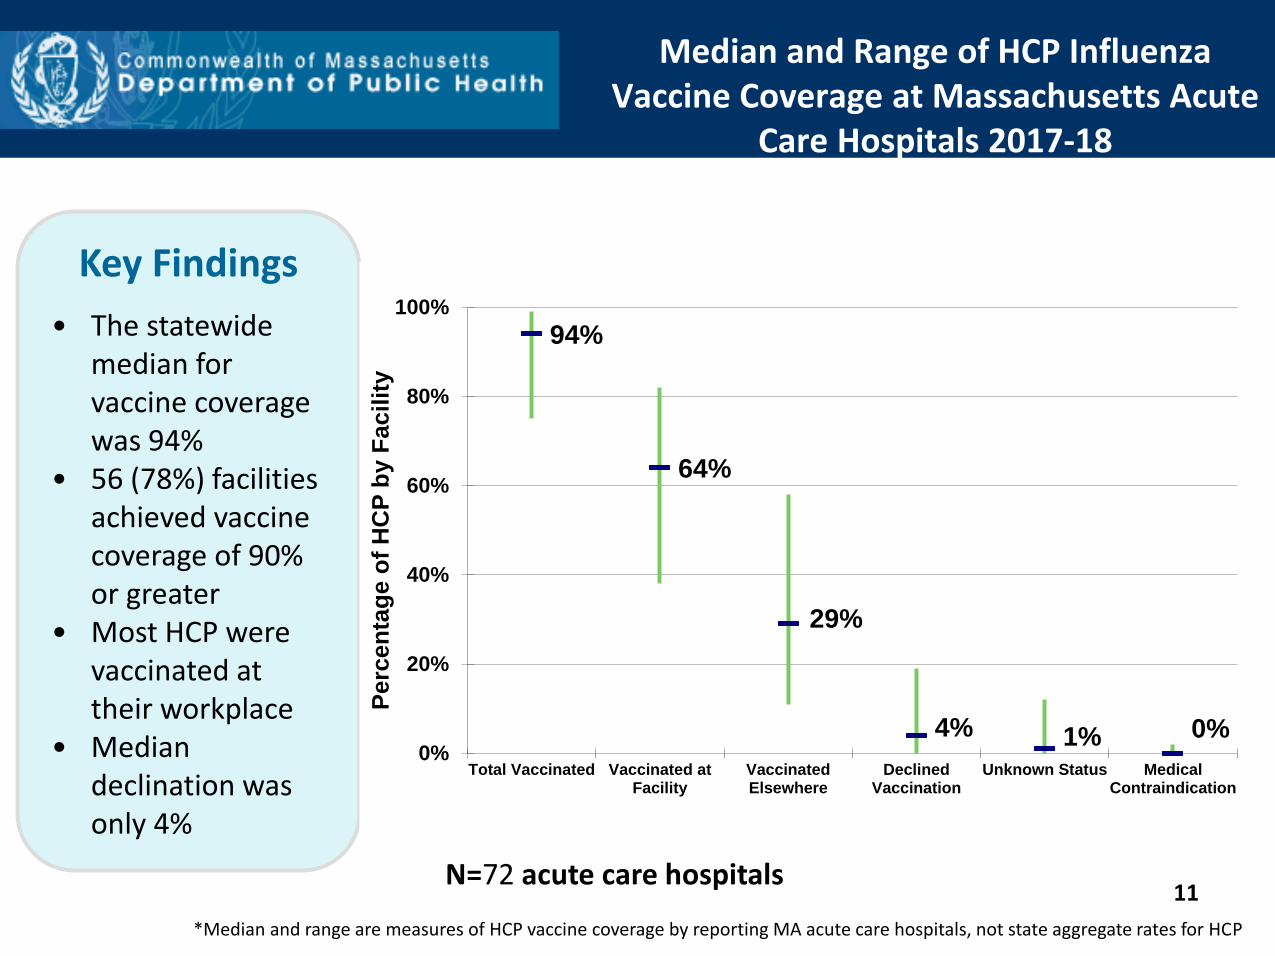
Median and Range of HCP Influenza Vaccine Coverage at Massachusetts Acute
Care Hospitals 2017-18
*Median and range are measures of HCP vaccine coverage by reporting MA acute care hospitals, not state aggregate rates for HCP
Key Findings
• The statewide median for vaccine coverage was 94%
• 56 (78%) facilities achieved vaccine coverage of 90% or greater
• Most HCP were vaccinated at their workplace
• Median declination was only 4%
11
N=72 acute care hospitals
94%
64%
29%
4% 1% 0% 0%
20%
40%
60%
80%
100%
Total Vaccinated Vaccinated atFacility
VaccinatedElsewhere
DeclinedVaccination
Unknown Status MedicalContraindication
Perc
en
tag
e o
f H
CP
by F
acilit
y
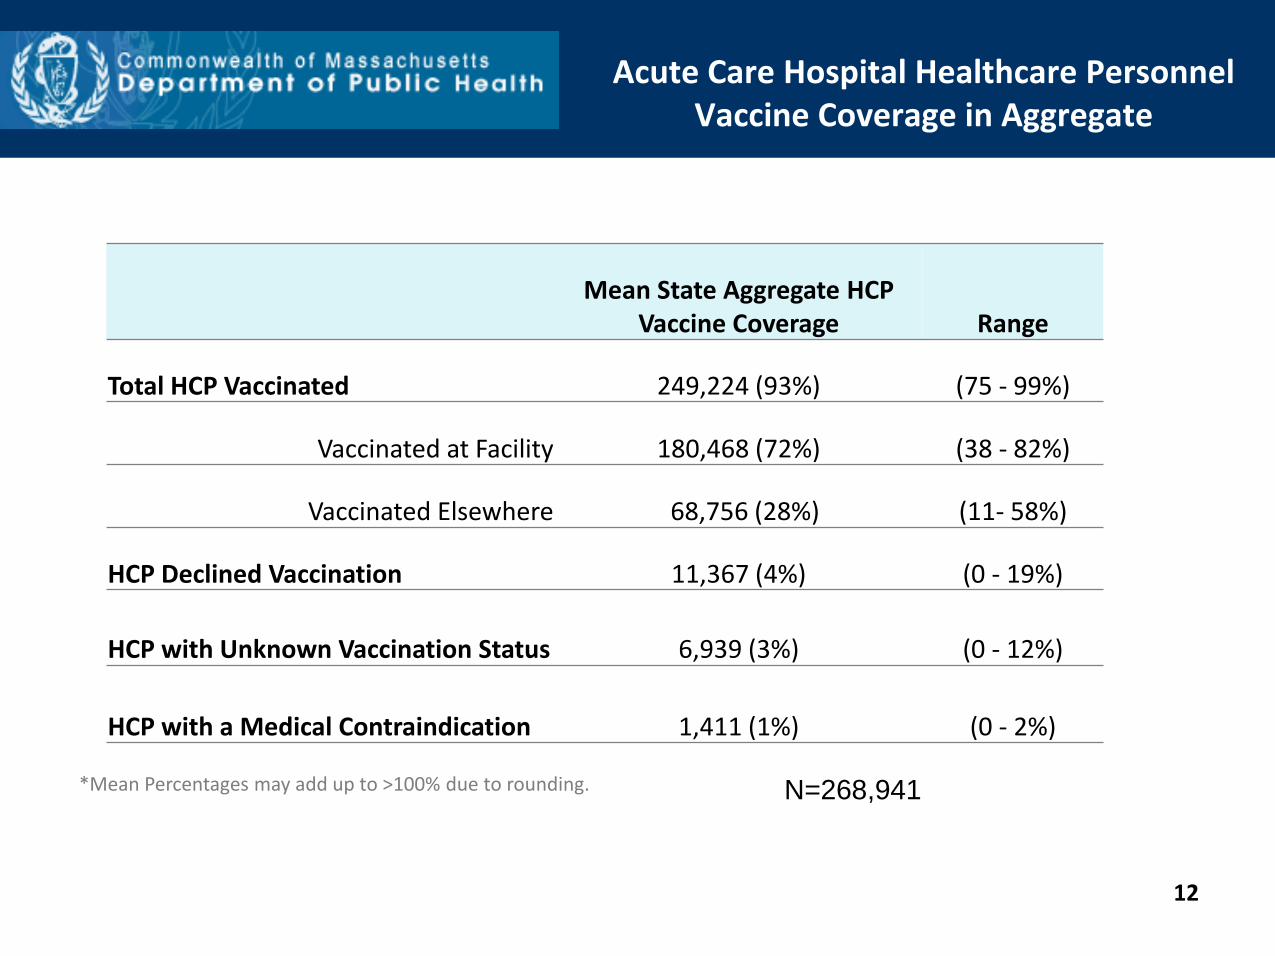
Acute Care Hospital Healthcare Personnel Vaccine Coverage in Aggregate
Mean State Aggregate HCP Vaccine Coverage Range
Total HCP Vaccinated 249,224 (93%) (75 - 99%)
Vaccinated at Facility 180,468 (72%) (38 - 82%)
Vaccinated Elsewhere 68,756 (28%) (11- 58%)
HCP Declined Vaccination 11,367 (4%) (0 - 19%)
HCP with Unknown Vaccination Status 6,939 (3%) (0 - 12%)
HCP with a Medical Contraindication 1,411 (1%) (0 - 2%)
N=268,941
12
*Mean Percentages may add up to >100% due to rounding.
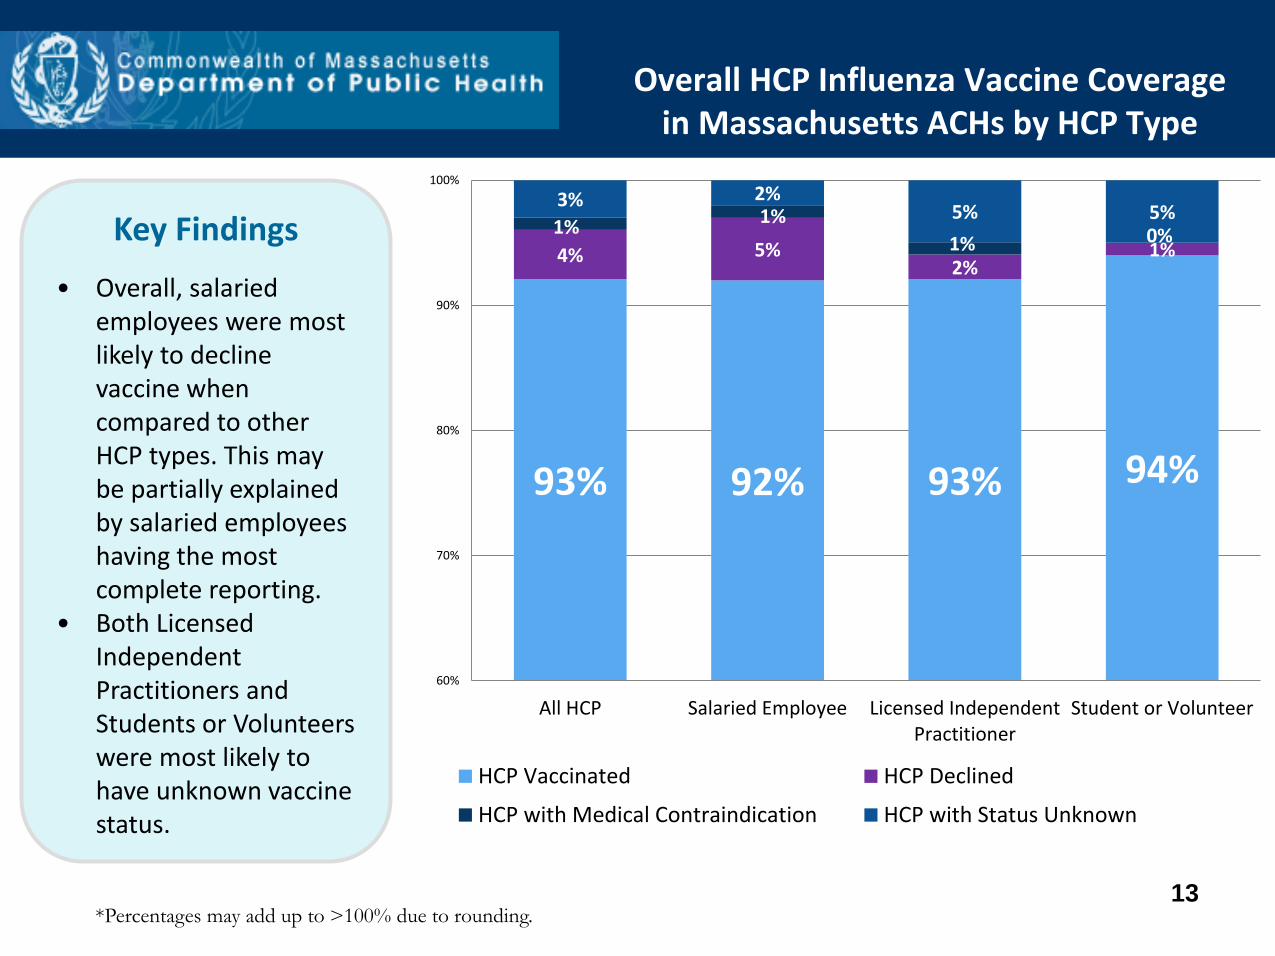
Overall HCP Influenza Vaccine Coverage in Massachusetts ACHs by HCP Type
Key Findings
• Overall, salaried employees were most likely to decline vaccine when compared to other HCP types. This may be partially explained by salaried employees having the most complete reporting.
• Both Licensed Independent Practitioners and Students or Volunteers were most likely to have unknown vaccine status.
13
93% 92% 93% 94%
4% 5% 2%
1% 1%
1%
1% 0%
3% 2% 5% 5%
60%
70%
80%
90%
100%
All HCP Salaried Employee Licensed IndependentPractitioner
Student or Volunteer
HCP Vaccinated HCP Declined
HCP with Medical Contraindication HCP with Status Unknown
*Percentages may add up to >100% due to rounding.

Trends Over Time Acute Care Hospitals
Median HCP vaccine coverage remained constant in 2017-18 and met the Healthy People 2020 benchmark of 90%. The median declination rate remained 4% in 2017-18.
Pe
rce
nta
ge o
f H
CP
by
Faci
lity
53%
68% 72%
80% 85% 86%
92% 92% 94% 94%
13%
21% 20%
9% 9% 5% 4% 4% 4% 4% 4% 3% 2% 1% 1%
0%
20%
40%
60%
80%
100%
Median Percent Vaccinated Median Percent Declined Median Percent Unknown
14
15
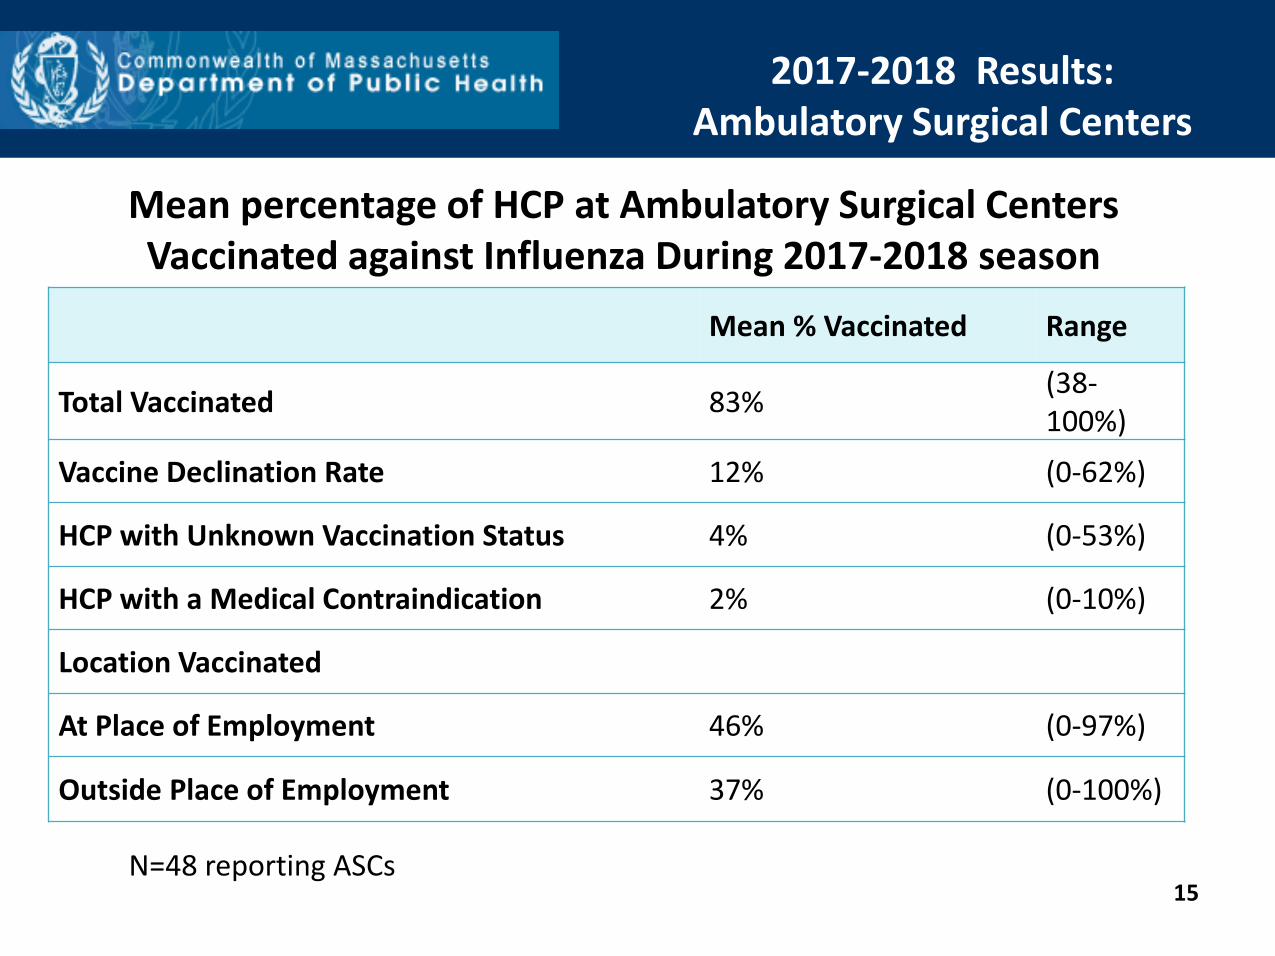
Mean % Vaccinated Range
Total Vaccinated 83% (38-100%)
Vaccine Declination Rate 12% (0-62%)
HCP with Unknown Vaccination Status 4% (0-53%)
HCP with a Medical Contraindication 2% (0-10%)
Location Vaccinated
At Place of Employment 46% (0-97%)
Outside Place of Employment 37% (0-100%)
2017-2018 Results: Ambulatory Surgical Centers
Mean percentage of HCP at Ambulatory Surgical Centers Vaccinated against Influenza During 2017-2018 season
N=48 reporting ASCs
16
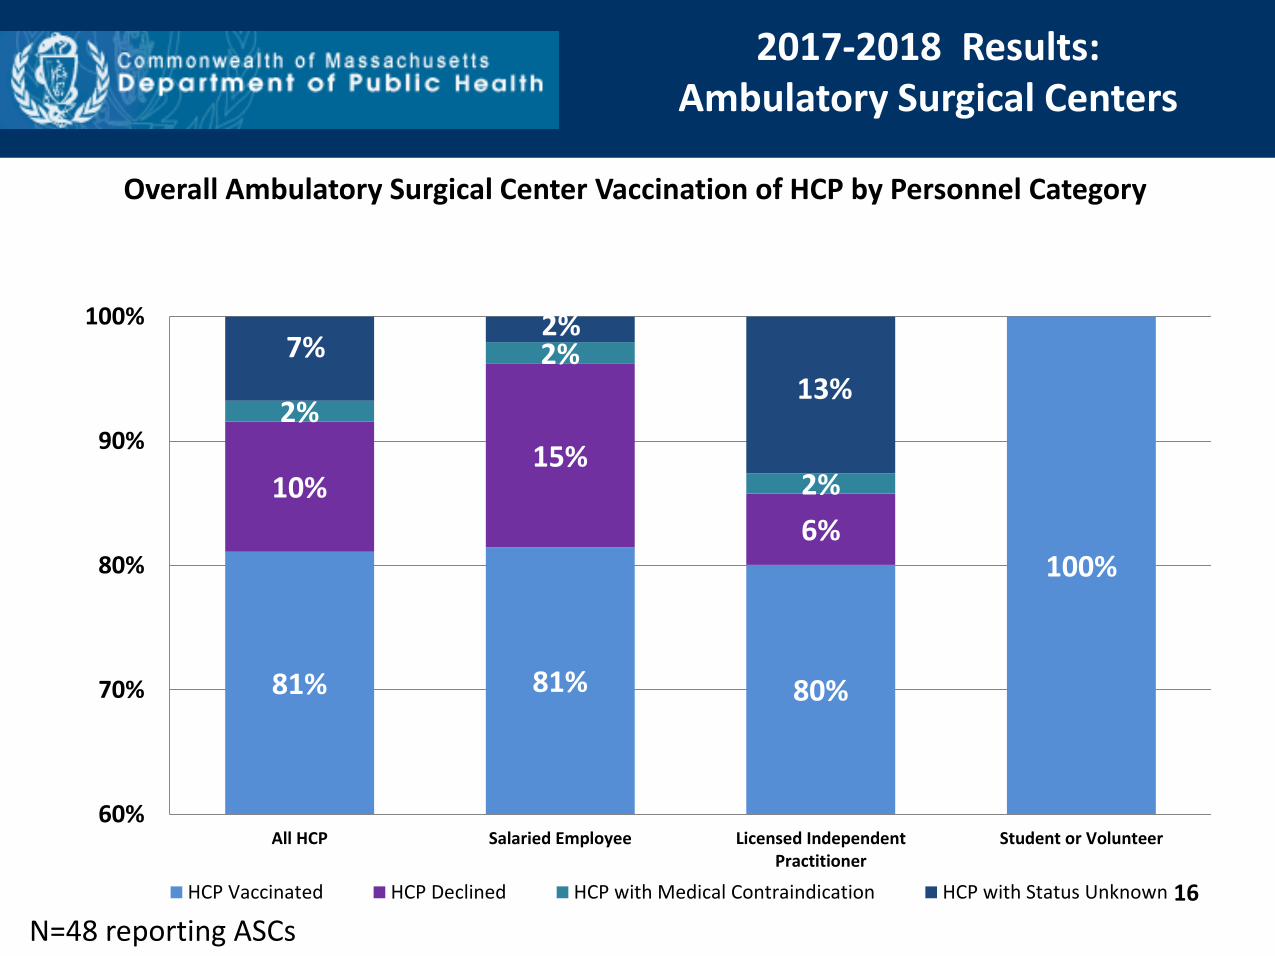
Overall Ambulatory Surgical Center Vaccination of HCP by Personnel Category
2017-2018 Results: Ambulatory Surgical Centers
81% 81% 80%
100%
10% 15%
6%
2%
2%
2%
7% 2%
13%
60%
70%
80%
90%
100%
All HCP Salaried Employee Licensed IndependentPractitioner
Student or Volunteer
HCP Vaccinated HCP Declined HCP with Medical Contraindication HCP with Status Unknown
N=48 reporting ASCs
17
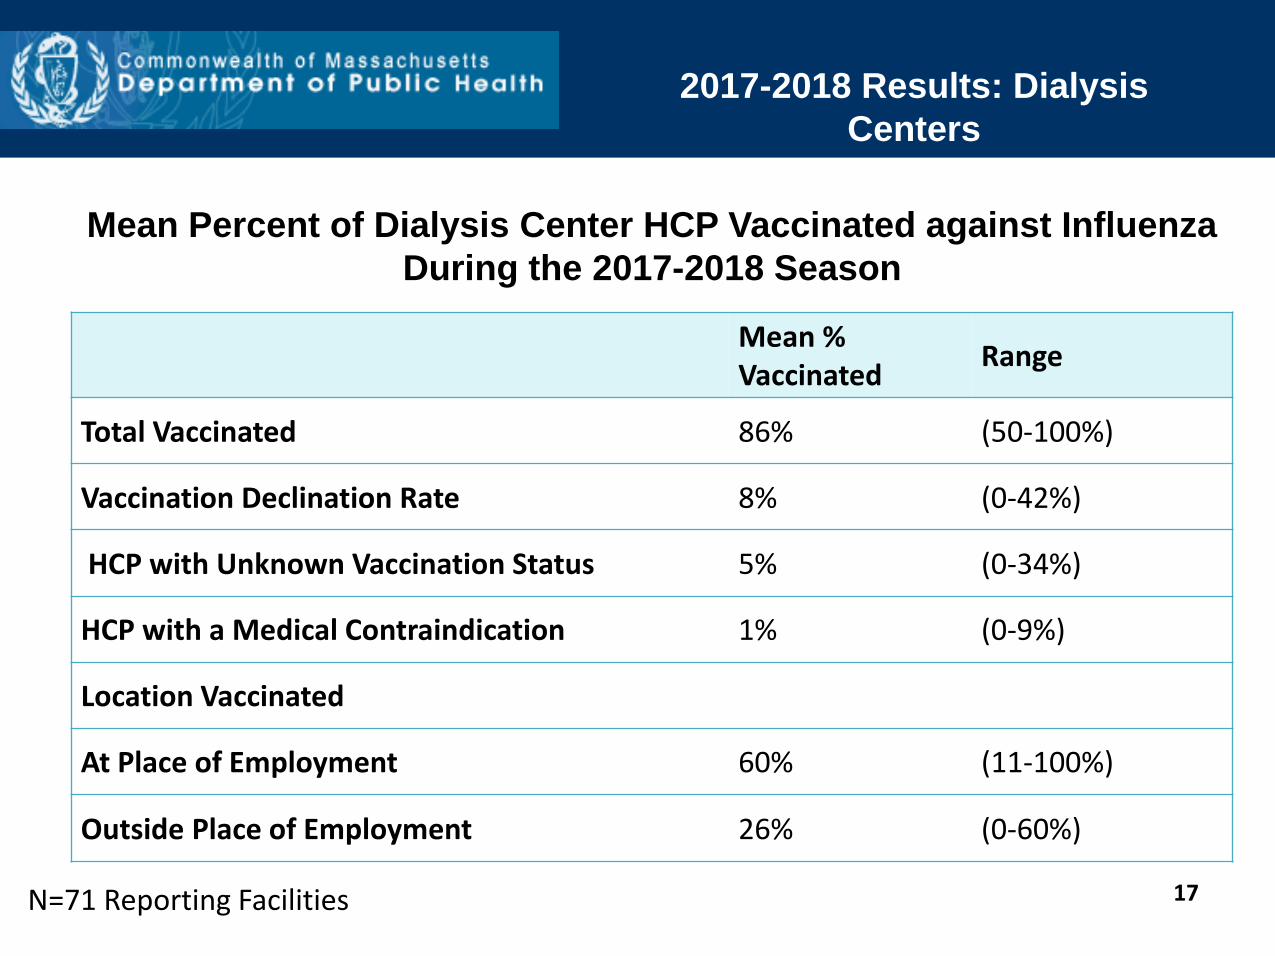
2017-2018 Results: Dialysis
Centers
Mean % Vaccinated
Range
Total Vaccinated 86% (50-100%)
Vaccination Declination Rate 8% (0-42%)
HCP with Unknown Vaccination Status 5% (0-34%)
HCP with a Medical Contraindication 1% (0-9%)
Location Vaccinated
At Place of Employment 60% (11-100%)
Outside Place of Employment 26% (0-60%)
Mean Percent of Dialysis Center HCP Vaccinated against Influenza
During the 2017-2018 Season
N=71 Reporting Facilities
18
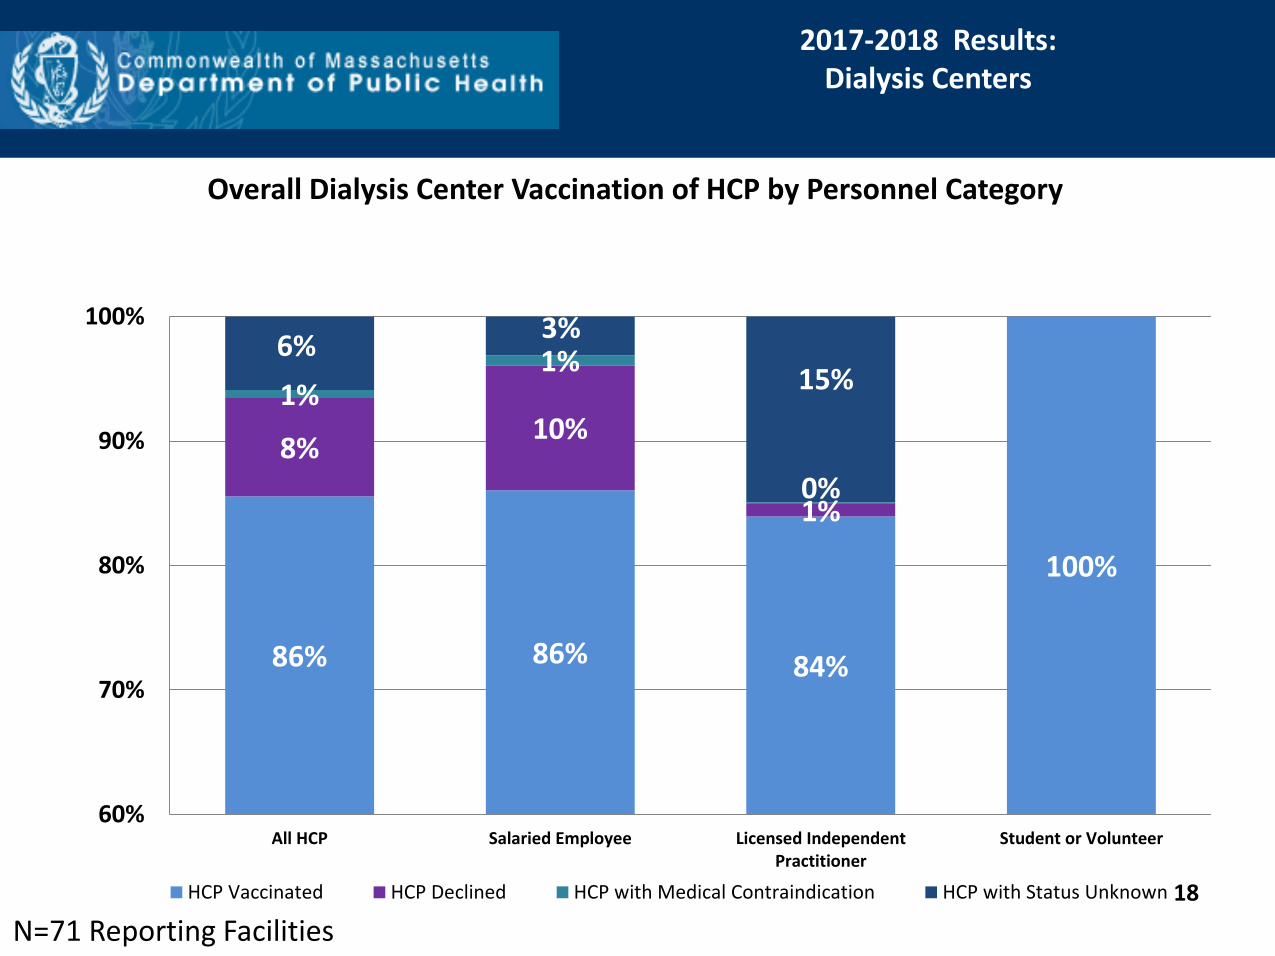
Overall Dialysis Center Vaccination of HCP by Personnel Category
2017-2018 Results: Dialysis Centers
86% 86% 84%
100%
8% 10%
1%
1% 1%
0%
6% 3%
15%
60%
70%
80%
90%
100%
All HCP Salaried Employee Licensed IndependentPractitioner
Student or Volunteer
HCP Vaccinated HCP Declined HCP with Medical Contraindication HCP with Status Unknown
N=71 Reporting Facilities
19
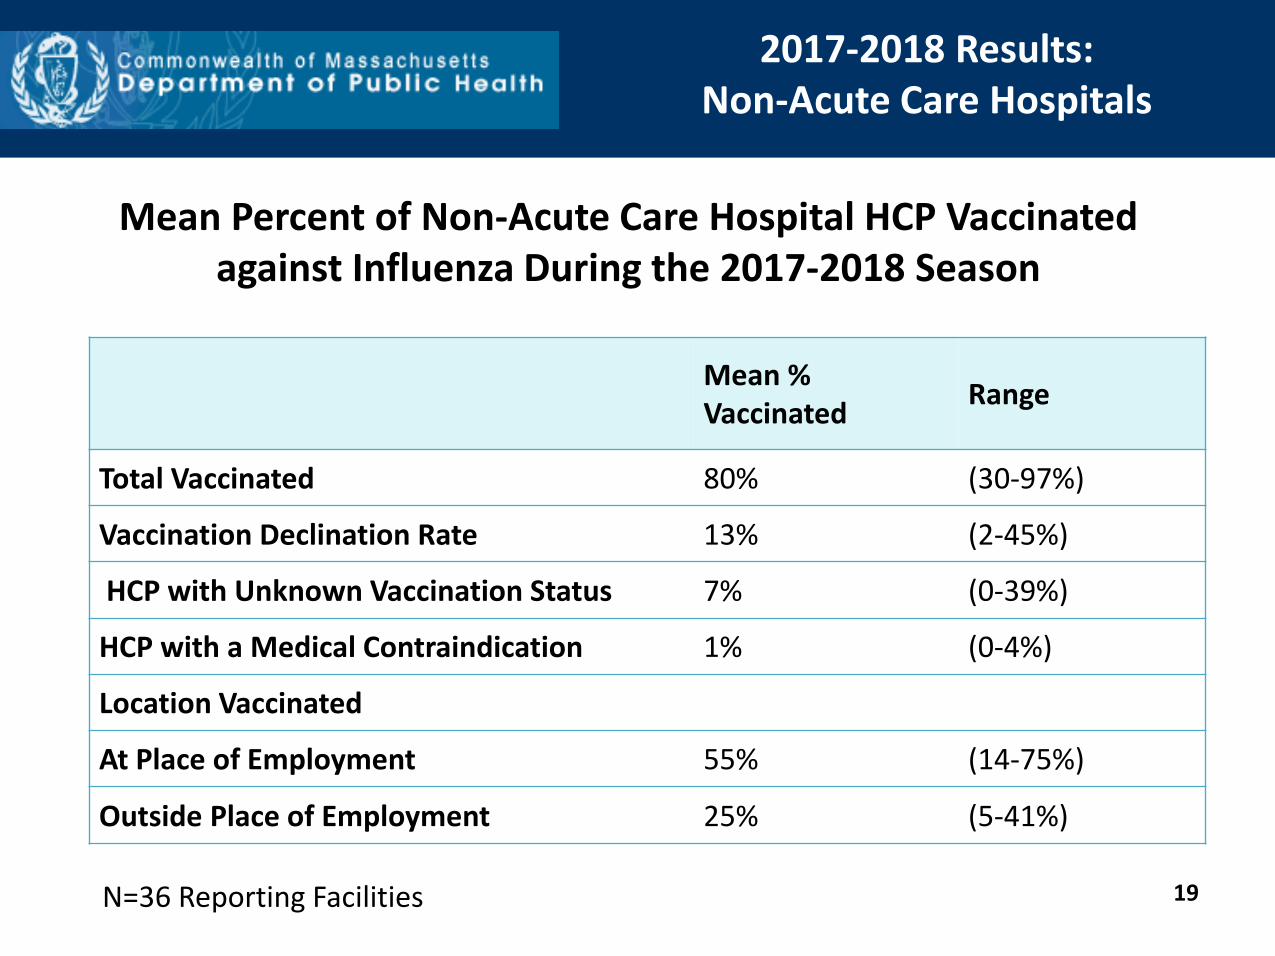
Mean % Vaccinated
Range
Total Vaccinated 80% (30-97%)
Vaccination Declination Rate 13% (2-45%)
HCP with Unknown Vaccination Status 7% (0-39%)
HCP with a Medical Contraindication 1% (0-4%)
Location Vaccinated
At Place of Employment 55% (14-75%)
Outside Place of Employment 25% (5-41%)
Mean Percent of Non-Acute Care Hospital HCP Vaccinated against Influenza During the 2017-2018 Season
2017-2018 Results: Non-Acute Care Hospitals
N=36 Reporting Facilities
20
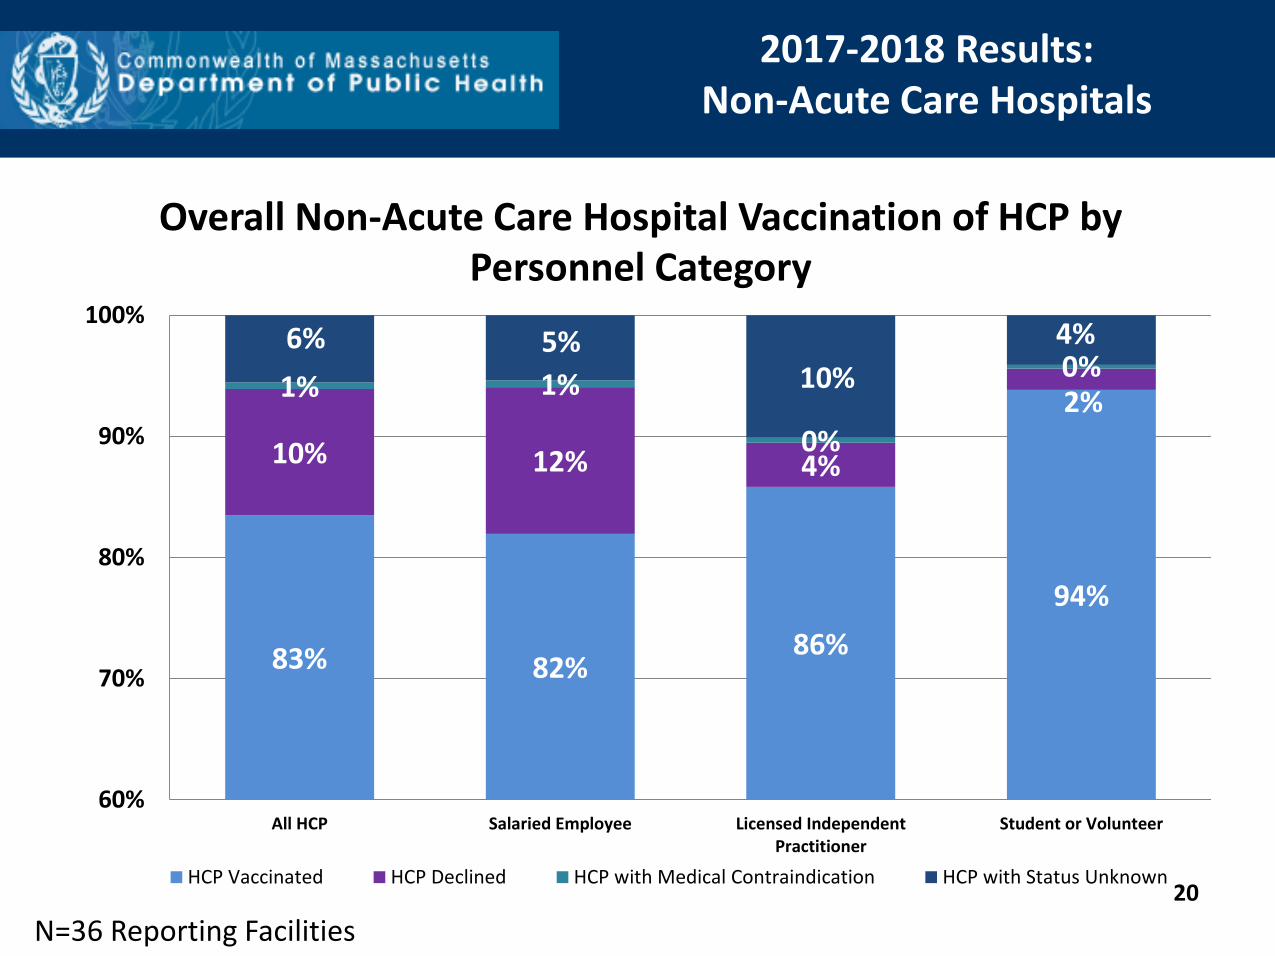
2017-2018 Results: Non-Acute Care Hospitals
N=36 Reporting Facilities
Overall Non-Acute Care Hospital Vaccination of HCP by Personnel Category
83% 82% 86%
94%
10% 12% 4%
2% 1% 1%
0%
0% 6% 5%
10%
4%
60%
70%
80%
90%
100%
All HCP Salaried Employee Licensed IndependentPractitioner
Student or Volunteer
HCP Vaccinated HCP Declined HCP with Medical Contraindication HCP with Status Unknown
21
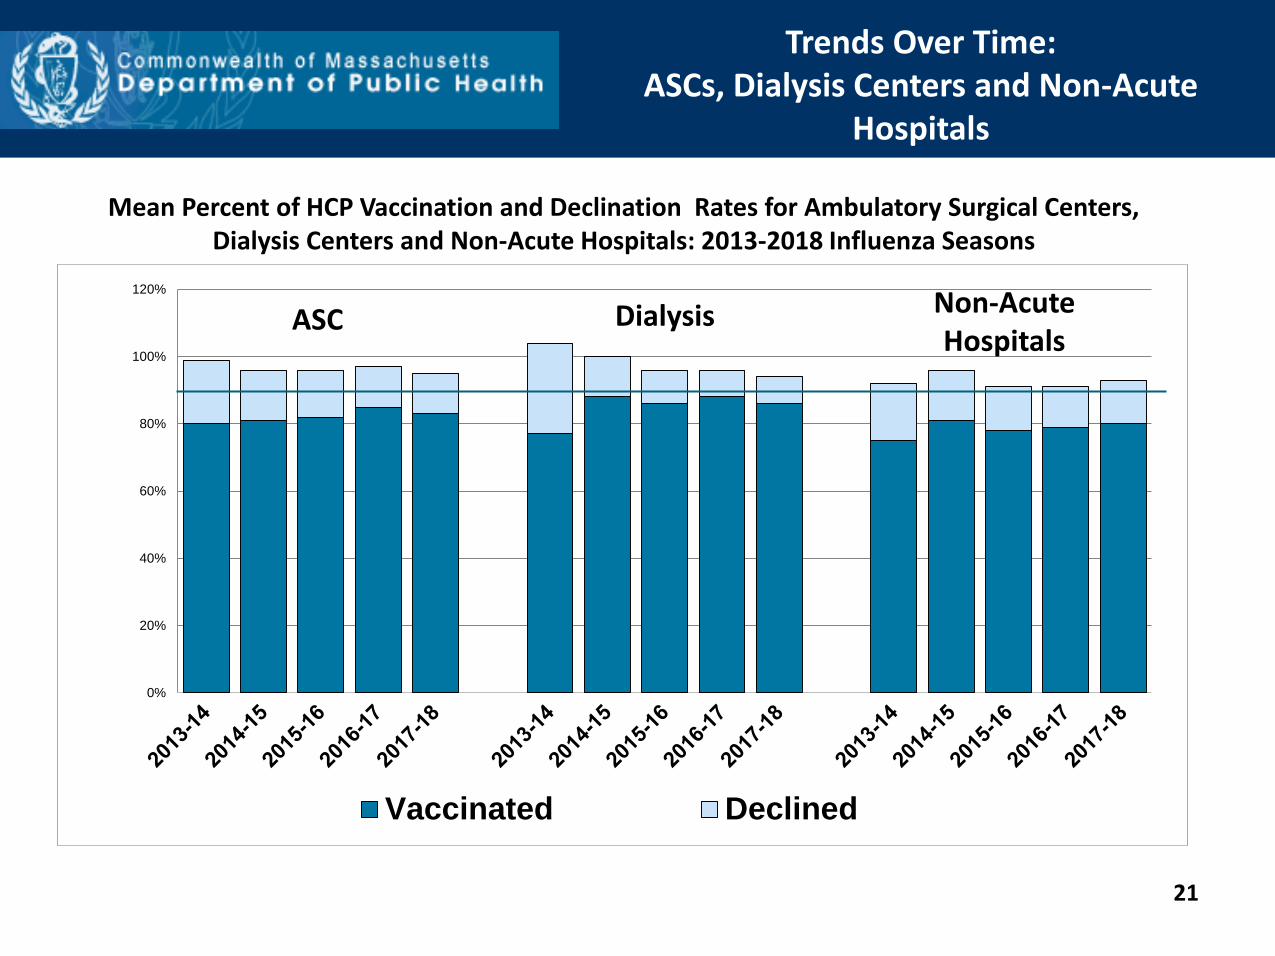
Mean Percent of HCP Vaccination and Declination Rates for Ambulatory Surgical Centers, Dialysis Centers and Non-Acute Hospitals: 2013-2018 Influenza Seasons
Trends Over Time: ASCs, Dialysis Centers and Non-Acute
Hospitals
0%
20%
40%
60%
80%
100%
120%
Vaccinated Declined
ASC Dialysis Non-Acute Hospitals
22
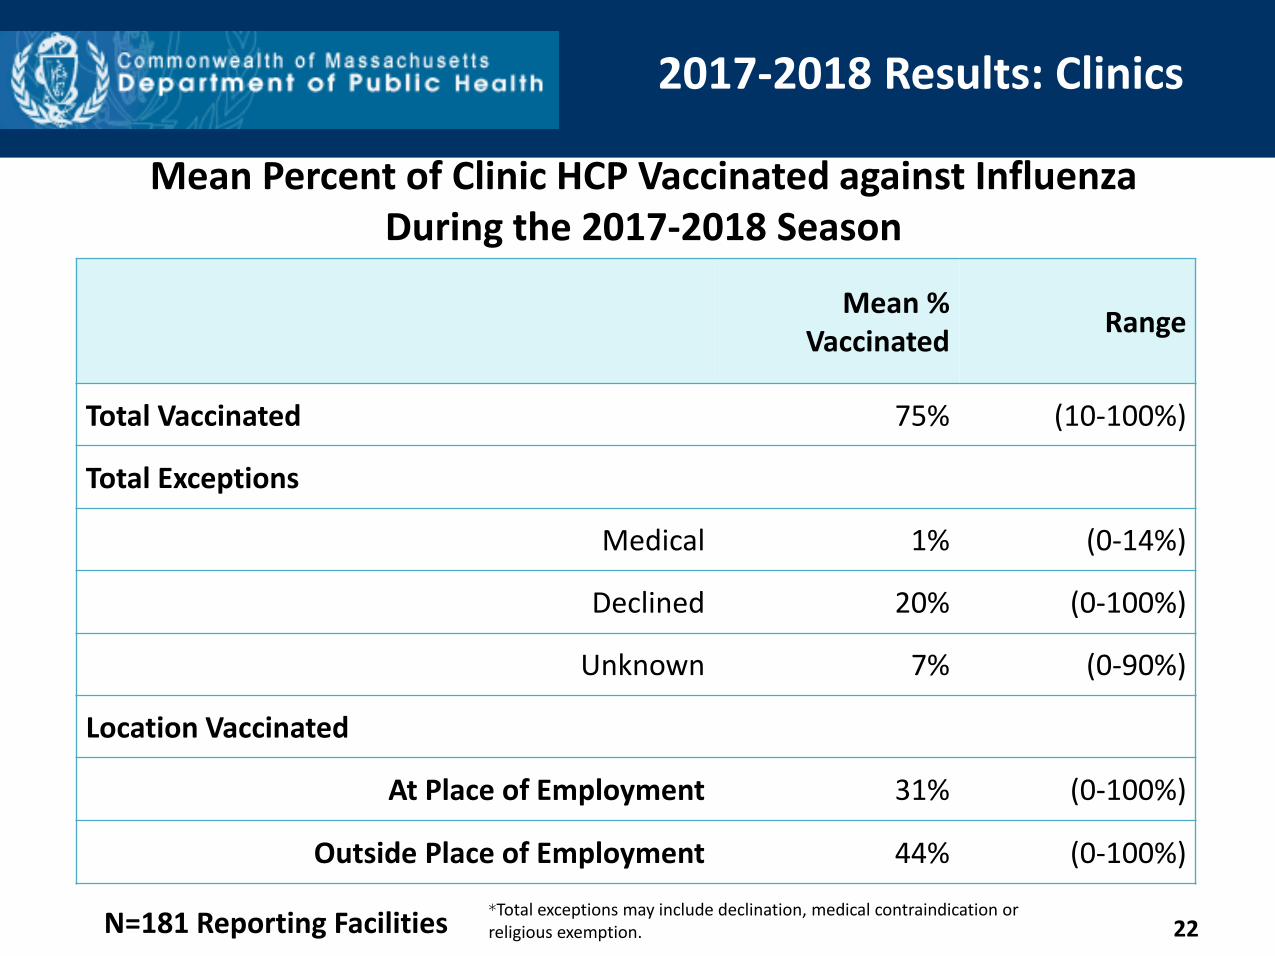
2017-2018 Results: Clinics
Mean %
Vaccinated Range
Total Vaccinated 75% (10-100%)
Total Exceptions
Medical 1% (0-14%)
Declined 20% (0-100%)
Unknown 7% (0-90%)
Location Vaccinated
At Place of Employment 31% (0-100%)
Outside Place of Employment 44% (0-100%)
Mean Percent of Clinic HCP Vaccinated against Influenza During the 2017-2018 Season
N=181 Reporting Facilities *Total exceptions may include declination, medical contraindication or religious exemption.
23
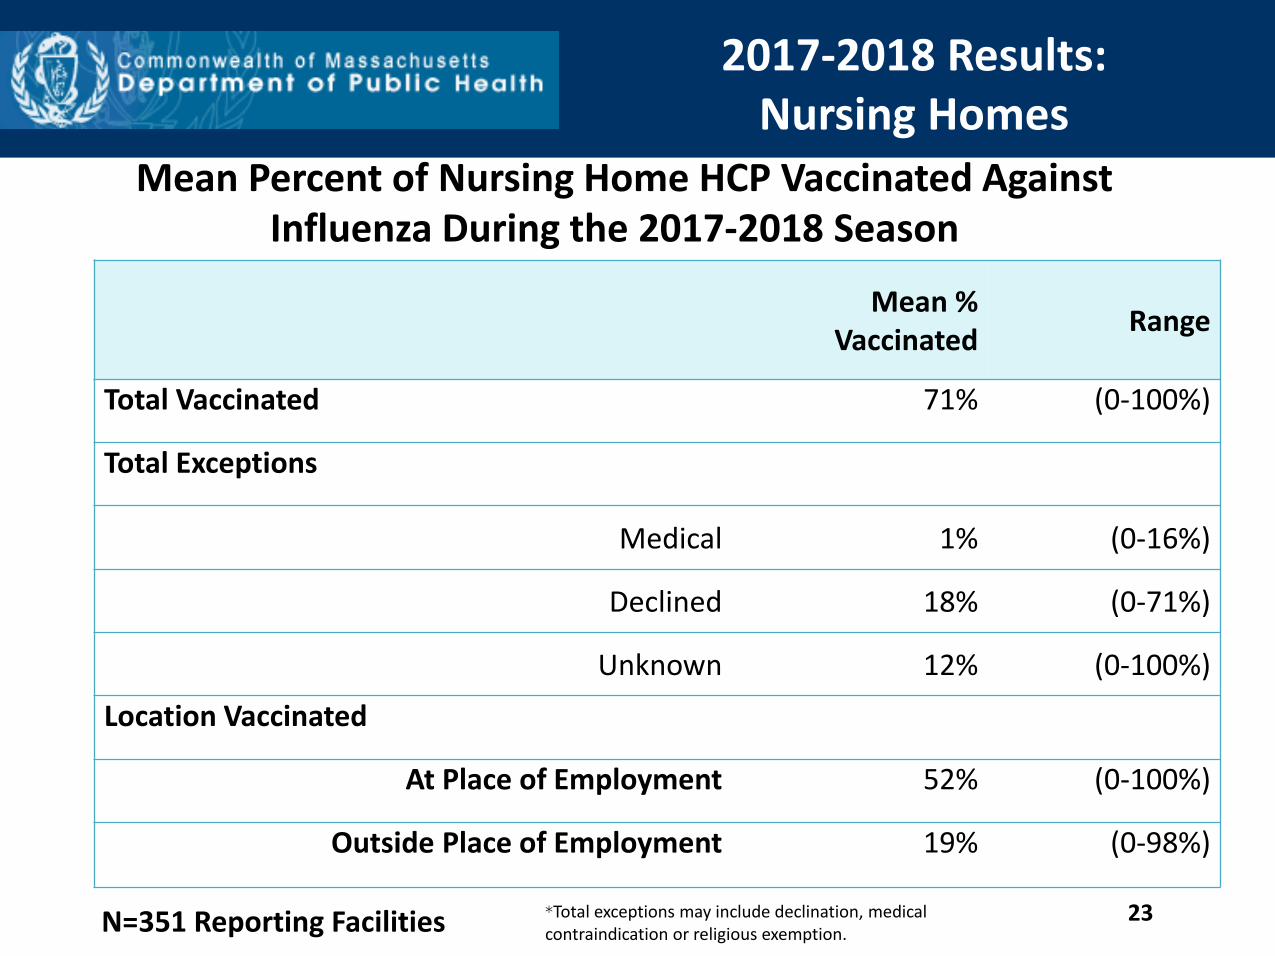
2017-2018 Results: Nursing Homes
Mean % Vaccinated
Range
Total Vaccinated 71% (0-100%)
Total Exceptions
Medical 1% (0-16%)
Declined 18% (0-71%)
Unknown 12% (0-100%)
Location Vaccinated
At Place of Employment 52% (0-100%)
Outside Place of Employment 19% (0-98%)
Mean Percent of Nursing Home HCP Vaccinated Against Influenza During the 2017-2018 Season
N=351 Reporting Facilities *Total exceptions may include declination, medical contraindication or religious exemption.
24
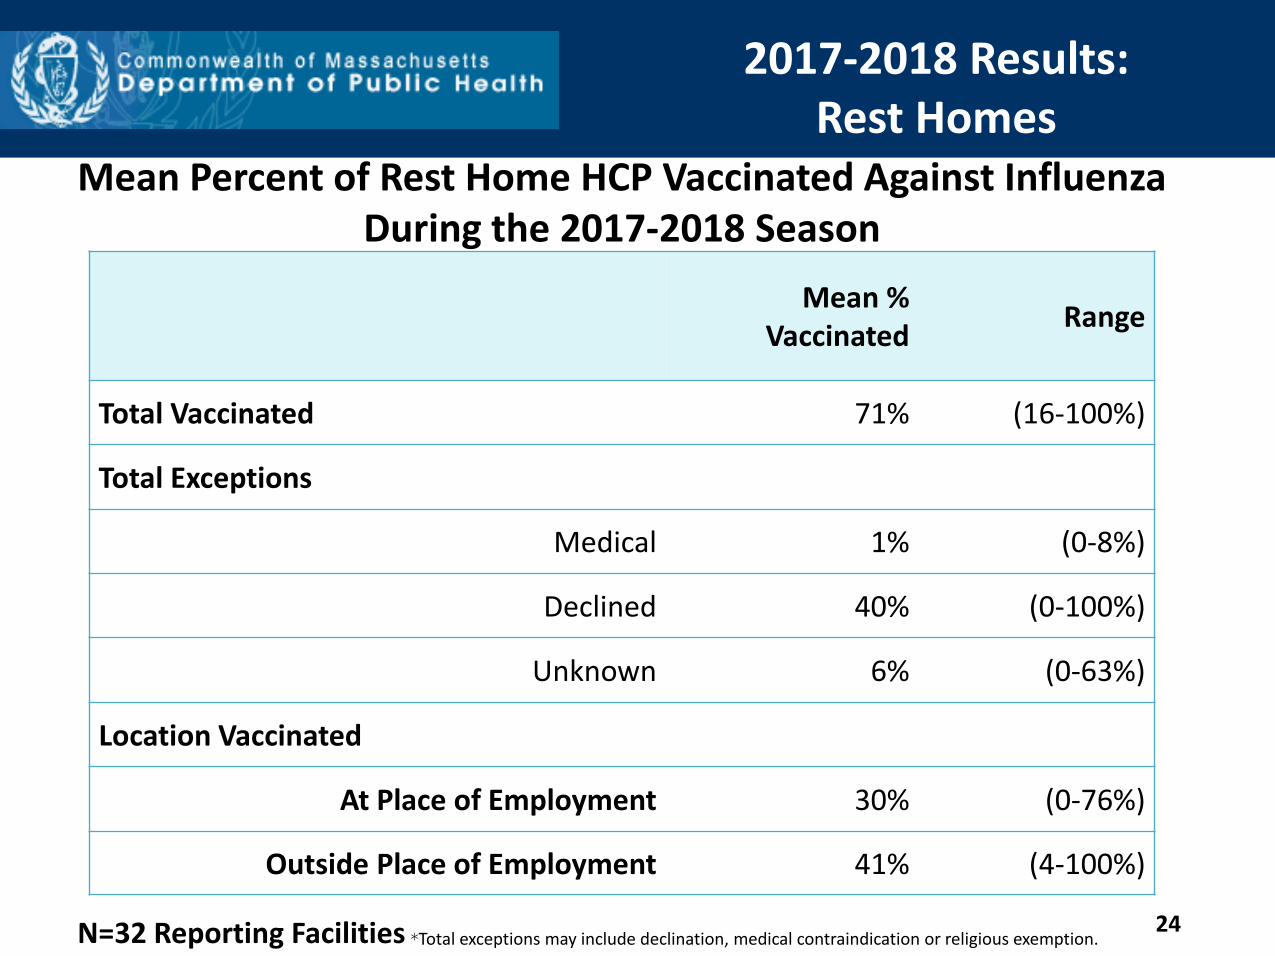
Mean %
Vaccinated Range
Total Vaccinated 71% (16-100%)
Total Exceptions
Medical 1% (0-8%)
Declined 40% (0-100%)
Unknown 6% (0-63%)
Location Vaccinated
At Place of Employment 30% (0-76%)
Outside Place of Employment 41% (4-100%)
Mean Percent of Rest Home HCP Vaccinated Against Influenza During the 2017-2018 Season
2017-2018 Results: Rest Homes
N=32 Reporting Facilities *Total exceptions may include declination, medical contraindication or religious exemption.

Slide 25
2017-2018 Results: Adult Day Health Programs
Mean %
Vaccinated Range
Total Vaccinated 63% (0-100%)
Total Exceptions
Medical 3% (0-25%)
Declined 36% (0-100%)
Unknown 4% (0-50%)
Location Vaccinated
At Place of Employment 34% (0-100%)
Outside Place of Employment 29% (0-100%)
Mean Percent of Adult Day Health HCP Vaccinated against Influenza During the 2017-2018 Season
N=144 Reporting Programs
26
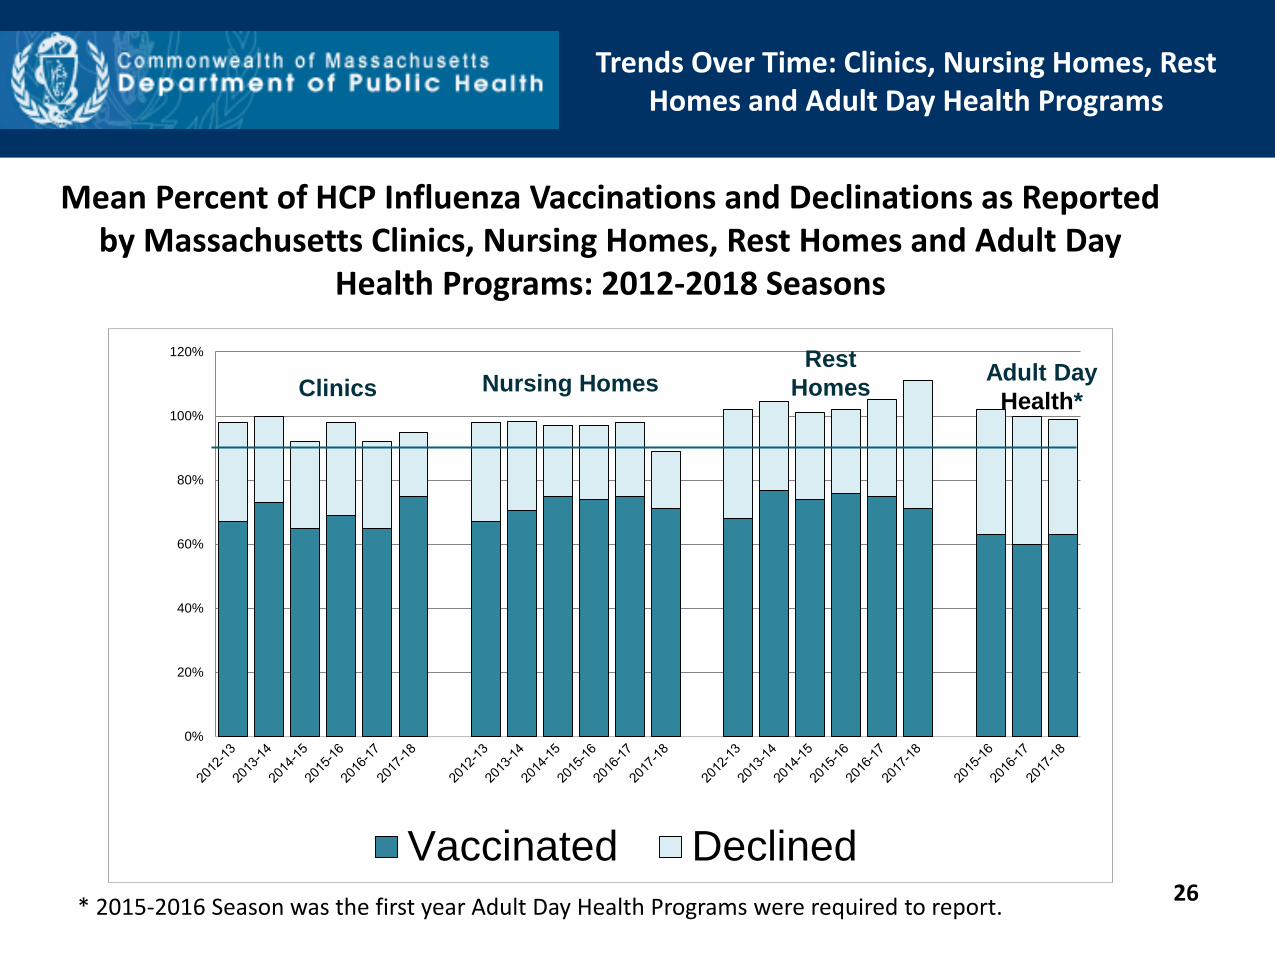
Mean Percent of HCP Influenza Vaccinations and Declinations as Reported by Massachusetts Clinics, Nursing Homes, Rest Homes and Adult Day
Health Programs: 2012-2018 Seasons
Trends Over Time: Clinics, Nursing Homes, Rest Homes and Adult Day Health Programs
* 2015-2016 Season was the first year Adult Day Health Programs were required to report.
0%
20%
40%
60%
80%
100%
120%
Vaccinated Declined
Rest
Homes Nursing Homes Clinics Adult Day
Health*
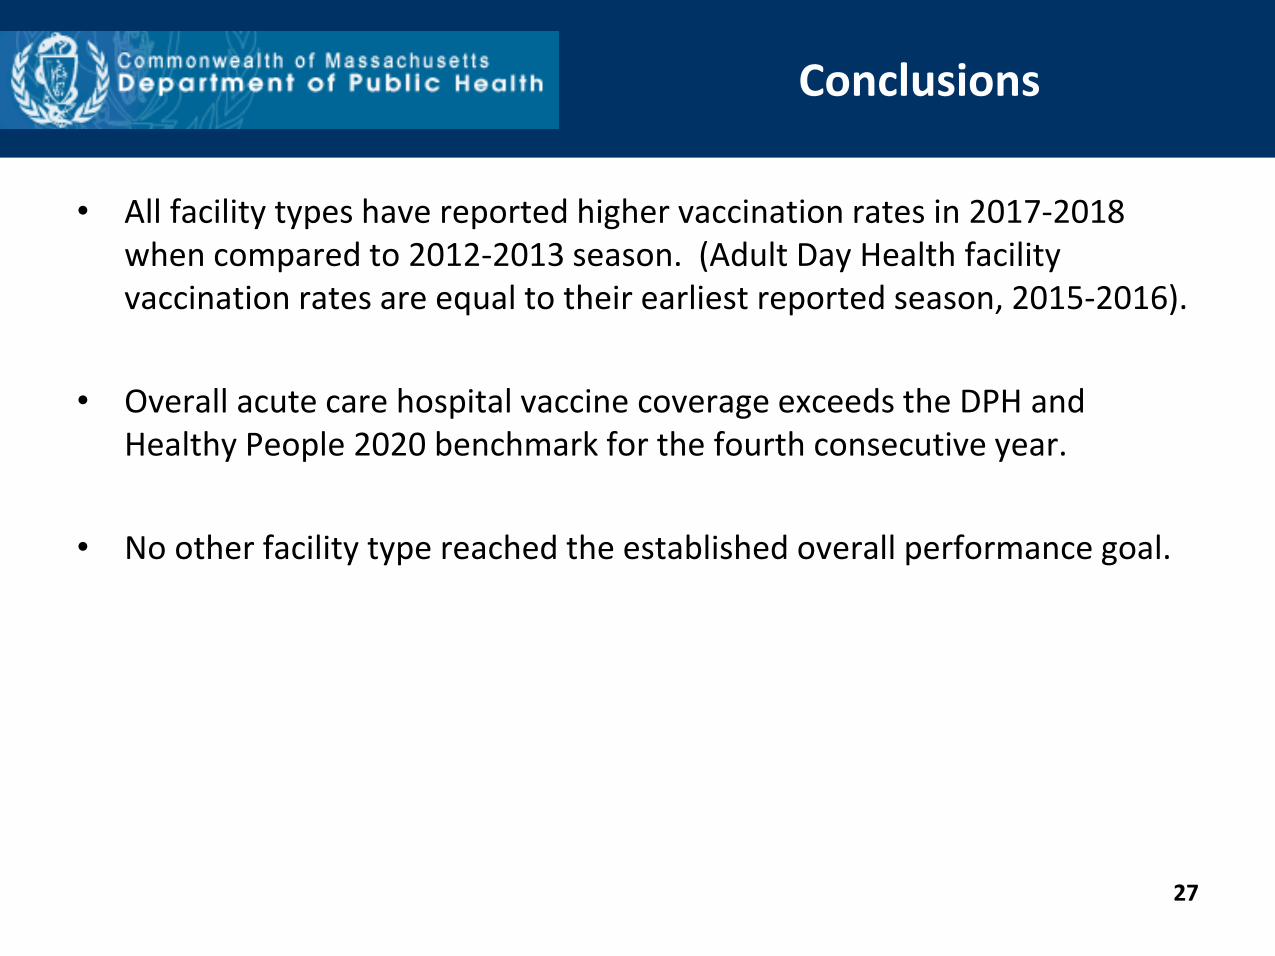
Conclusions
• All facility types have reported higher vaccination rates in 2017-2018 when compared to 2012-2013 season. (Adult Day Health facility vaccination rates are equal to their earliest reported season, 2015-2016).
• Overall acute care hospital vaccine coverage exceeds the DPH and Healthy People 2020 benchmark for the fourth consecutive year.
• No other facility type reached the established overall performance goal.
27
Enhanced DPH Public Health
Actions NEW
• DPH is hosting an October 2018 webinar to improve healthcare personnel influenza coverage. Program content will include: Influenza disease burden, key facts about the current season; surveillance and reporting; and strategies for increasing HCP coverage.
NEW
• DPH Quality improvement initiative targeting facilities from the lowest quartile of HCP influenza vaccination coverage during the 2017-18 season.
• Direct outreach to assess previous vaccination strategies and perceived barriers to implementation.
• Provide facility specific evidence-based recommendations to improve vaccination coverage.
• January 2019: Conduct outreach to monitor progress and provide additional support to promote success.
• Post-season interview to review performance and to assess strategies utilized during the 2018-2019 influenza season.
• Share aggregate findings with facilities and public health partners.
28
Ongoing DPH Public Health
Actions
• Reinforcement of the reporting requirement and statewide performance goal during trainings, and on-site visits in adult day health programs, rest homes and nursing homes.
• Monitoring trends and reporting annual compliance with the HCP influenza vaccination requirements.
• Promotion of continuous quality improvement, by recommending licensed facilities share vaccination rates with all staff, including administrators, boards of directors, practice managers, ombudsperson and patient/family councils.
• Encouraging facilities to evaluate their current influenza vaccination program and policies and develop an action plan to maximize influenza vaccination coverage of HCP to achieve the Healthy People 2020 and DPH target of 90% vaccination.
• Collaboration with public health partners to intensify efforts to improve immunization rates among HCP, especially among low outliers.
Slide 29

Next Steps
• DPH will share this update with all licensed facilities with recommendations to distribute broadly within each facility and to use the reported data to drive improvement.
• This update and facility specific results will be available on the MDPH website:
https://www.mass.gov/service-details/flu-vaccination-reports-healthcare-personnel
• Please direct any questions to: Katherine T. Fillo, Ph.D, RN-BC Director of Clinical Quality Improvement Bureau of Health Care Safety and Quality [email protected]
30