Embed Size (px)
Citation preview
1
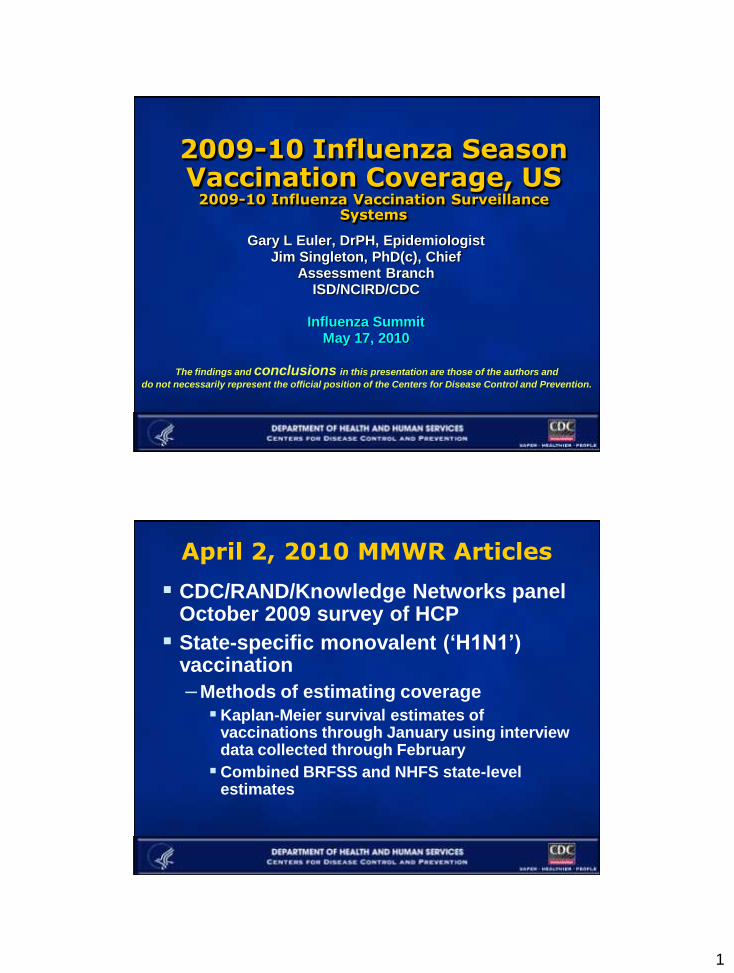
2009-10 Influenza Season Vaccination Coverage, US
2009-10 Influenza Vaccination Surveillance Systems
Gary L Euler, DrPH, EpidemiologistJim Singleton, PhD(c), Chief
Assessment BranchISD/NCIRD/CDC
Influenza SummitMay 17, 2010
The findings and conclusions in this presentation are those of the authors and
do not necessarily represent the official position of the Centers for Disease Control and Prevention.
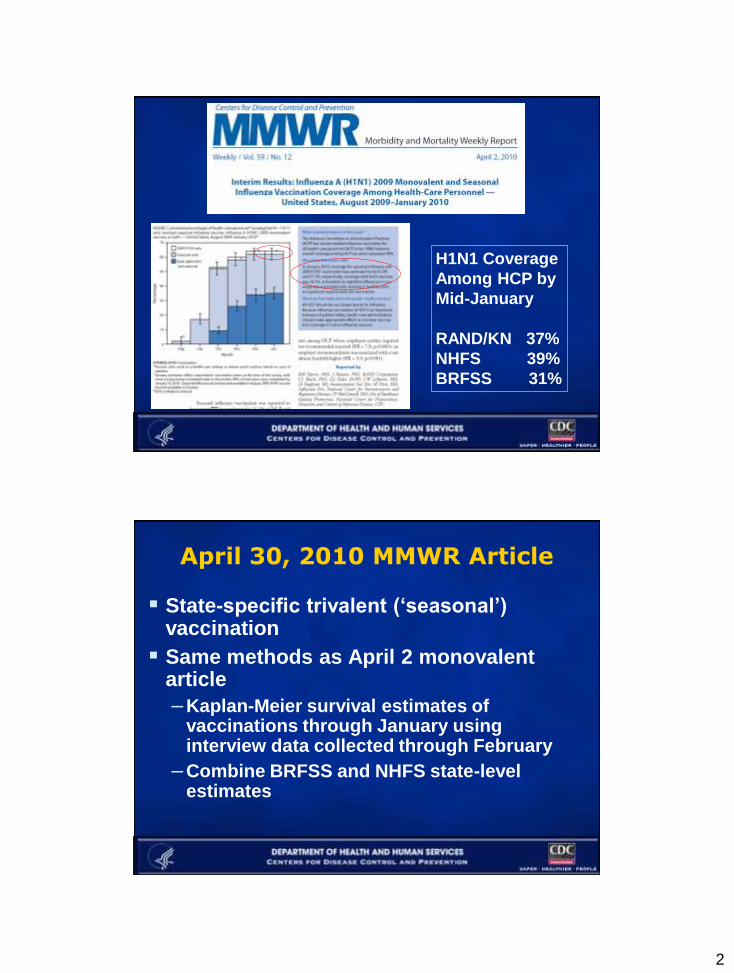
April 2, 2010 MMWR Articles
CDC/RAND/Knowledge Networks panel October 2009 survey of HCP
State-specific monovalent („H1N1‟) vaccination
– Methods of estimating coverage
Kaplan-Meier survival estimates of vaccinations through January using interview data collected through February
Combined BRFSS and NHFS state-level estimates
2
H1N1 Coverage
Among HCP by
Mid-January
RAND/KN 37%
NHFS 39%
BRFSS 31%
April 30, 2010 MMWR Article
State-specific trivalent („seasonal‟) vaccination
Same methods as April 2 monovalentarticle
– Kaplan-Meier survival estimates of vaccinations through January using interview data collected through February
– Combine BRFSS and NHFS state-level estimates
3
6/2/2010 5
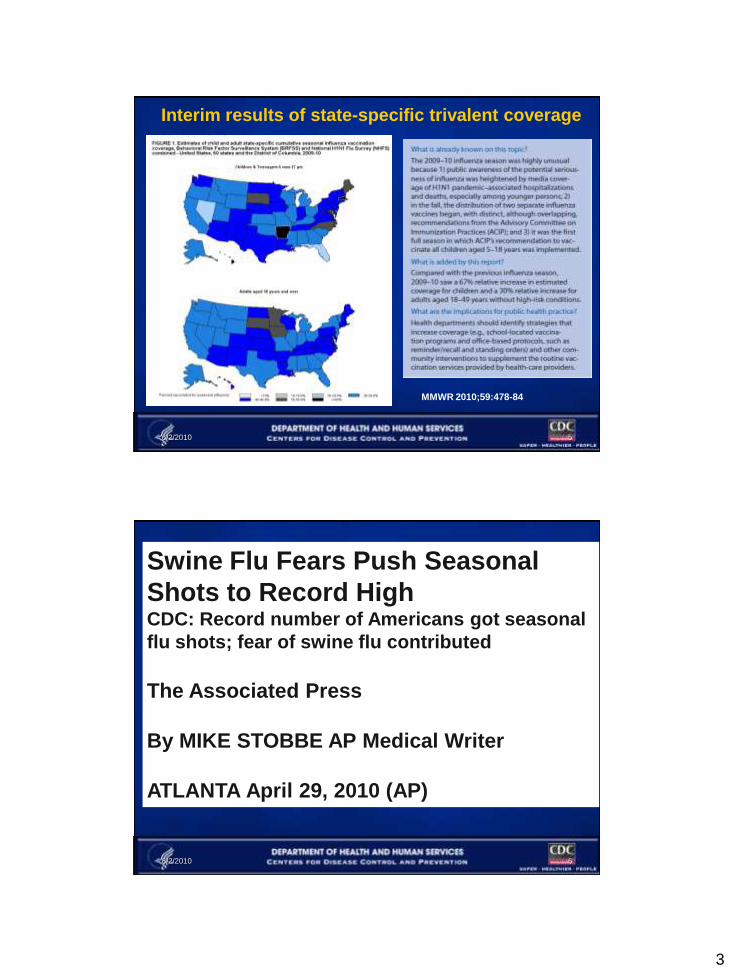
MMWR 2010;59:478-84
Interim results of state-specific trivalent coverage
6/2/2010 6
Swine Flu Fears Push Seasonal
Shots to Record HighCDC: Record number of Americans got seasonal
flu shots; fear of swine flu contributed
The Associated Press
By MIKE STOBBE AP Medical Writer
ATLANTA April 29, 2010 (AP)
4
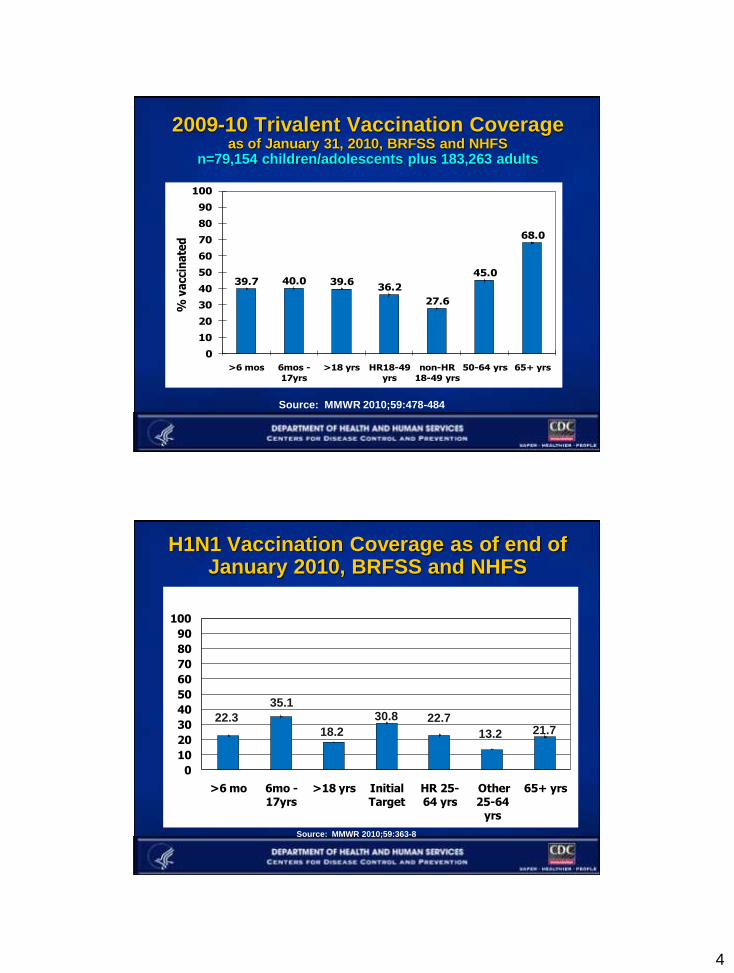
2009-10 Trivalent Vaccination Coverage as of January 31, 2010, BRFSS and NHFS
n=79,154 children/adolescents plus 183,263 adults
39.7 40.0 39.636.2
27.6
45.0
68.0
0
10
20
30
40
50
60
70
80
90
100
>6 mos 6mos -
17yrs
>18 yrs HR18-49
yrs
non-HR
18-49 yrs
50-64 yrs 65+ yrs
% v
acc
ina
ted
Source: MMWR 2010;59:478-484
H1N1 Vaccination Coverage as of end of January 2010, BRFSS and NHFS
0
10
20
30
40
50
60
70
80
90
100
>6 mo 6mo -17yrs
>18 yrs Initial Target
HR 25-64 yrs
Other 25-64
yrs
65+ yrs
Chart Title
Source: MMWR 2010;59:363-8
22.3
18.2
35.130.8 22.7
13.2 21.7
5
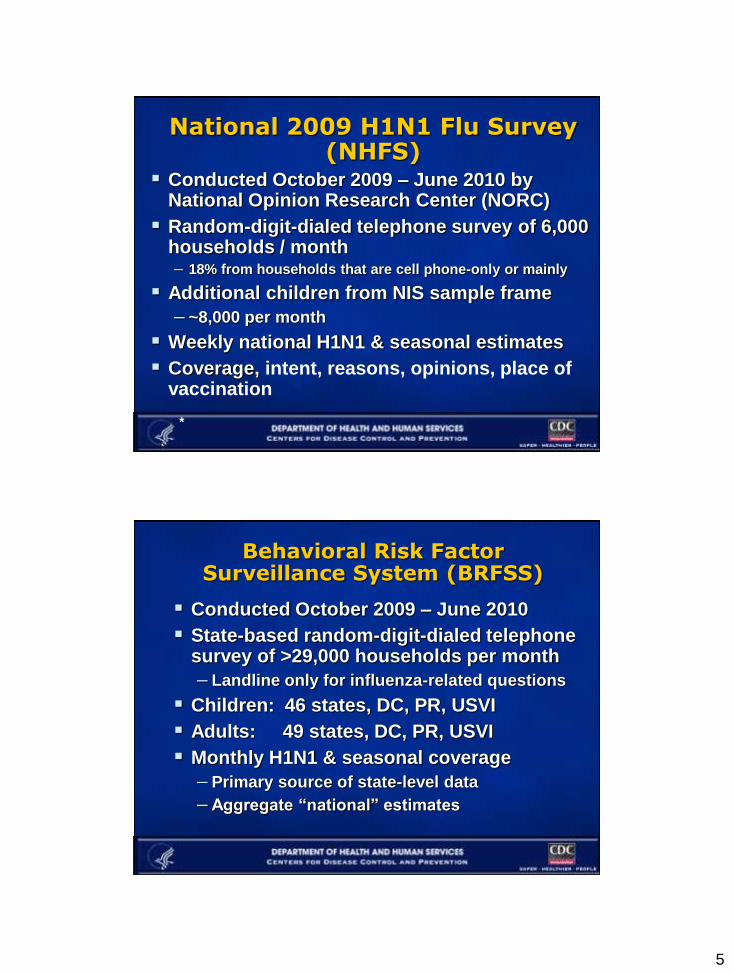
National 2009 H1N1 Flu Survey (NHFS)
Conducted October 2009 – June 2010 by National Opinion Research Center (NORC)
Random-digit-dialed telephone survey of 6,000 households / month– 18% from households that are cell phone-only or mainly
Additional children from NIS sample frame
– ~8,000 per month
Weekly national H1N1 & seasonal estimates
Coverage, intent, reasons, opinions, place of vaccination
*
Behavioral Risk Factor Surveillance System (BRFSS)
Conducted October 2009 – June 2010
State-based random-digit-dialed telephone survey of >29,000 households per month
– Landline only for influenza-related questions
Children: 46 states, DC, PR, USVI
Adults: 49 states, DC, PR, USVI
Monthly H1N1 & seasonal coverage
– Primary source of state-level data
– Aggregate “national” estimates
6
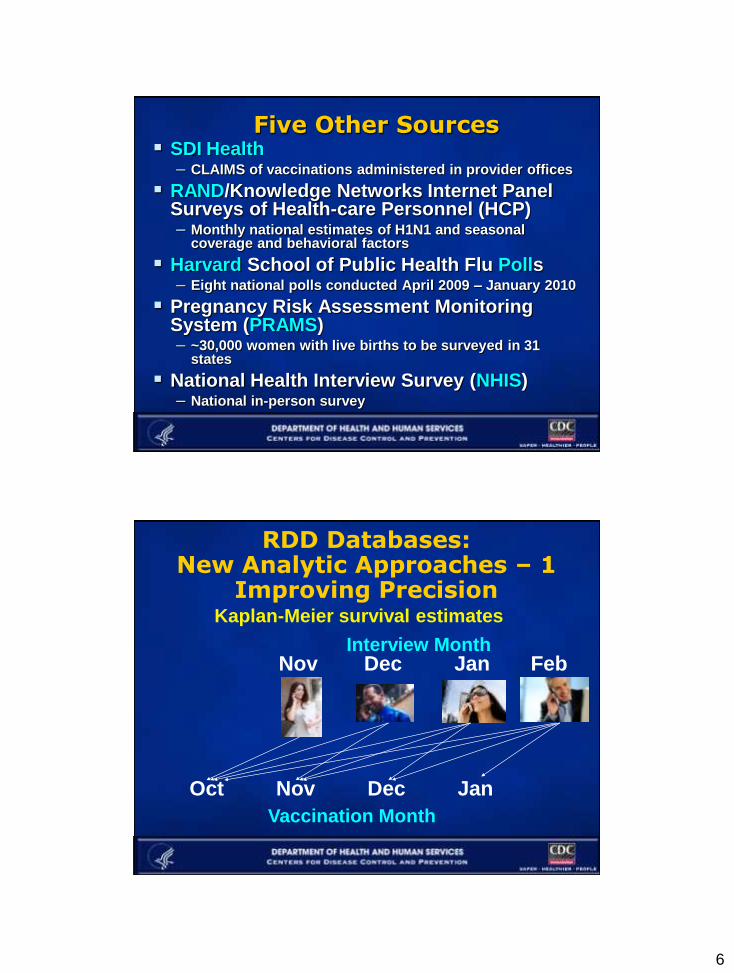
Five Other Sources SDI Health
– CLAIMS of vaccinations administered in provider offices
RAND/Knowledge Networks Internet Panel Surveys of Health-care Personnel (HCP)– Monthly national estimates of H1N1 and seasonal
coverage and behavioral factors
Harvard School of Public Health Flu Polls– Eight national polls conducted April 2009 – January 2010
Pregnancy Risk Assessment Monitoring System (PRAMS)– ~30,000 women with live births to be surveyed in 31
states
National Health Interview Survey (NHIS)– National in-person survey
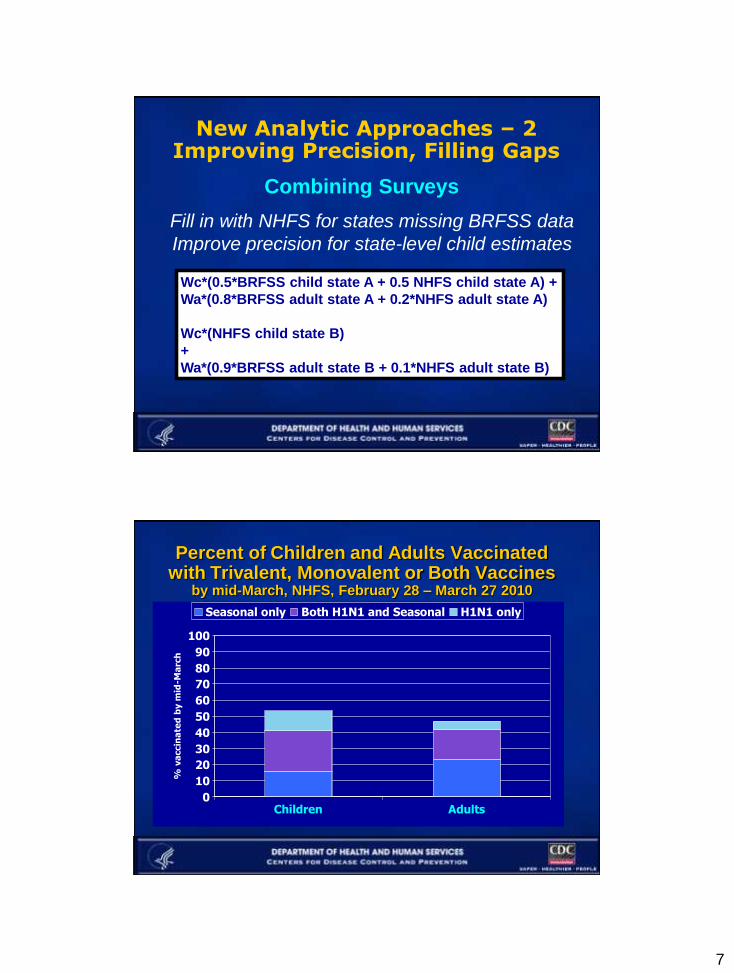
RDD Databases: New Analytic Approaches – 1
Improving PrecisionKaplan-Meier survival estimates
Interview MonthNov Dec Jan Feb
Vaccination Month
Oct Nov Dec Jan
7
New Analytic Approaches – 2 Improving Precision, Filling Gaps
Wc*(0.5*BRFSS child state A + 0.5 NHFS child state A) +
Wa*(0.8*BRFSS adult state A + 0.2*NHFS adult state A)
Wc*(NHFS child state B)
+
Wa*(0.9*BRFSS adult state B + 0.1*NHFS adult state B)
Combining Surveys
Fill in with NHFS for states missing BRFSS data
Improve precision for state-level child estimates
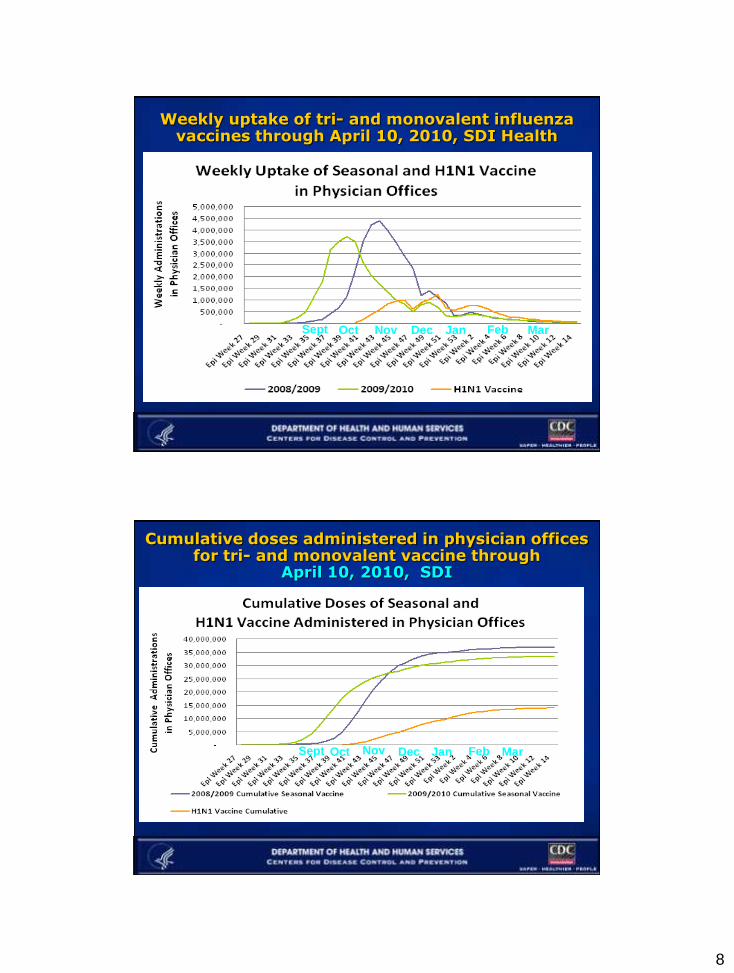
Percent of Children and Adults Vaccinated with Trivalent, Monovalent or Both Vaccines
by mid-March, NHFS, February 28 – March 27 2010
0
10
20
30
40
50
60
70
80
90
100
% v
accin
ate
d b
y m
id-M
arc
h
Children Adults
Seasonal only Both H1N1 and Seasonal H1N1 only
8
Weekly uptake of tri- and monovalent influenza vaccines through April 10, 2010, SDI Health
Oct FebJanDecNov MarSept
Cumulative doses administered in physician offices for tri- and monovalent vaccine through
April 10, 2010, SDI
Oct FebJanDecNov MarSept
9
Projected 2009-10 Influenza Vaccination Cumulative Uptake of Either Vaccine (tri- or monovalent) through April 17
Compared to Previous Season, SDI
*This uptake line shows all flu vaccinations (H1N1 or seasonal) billed in physician offices
NOTE: Combining tri- and monovalent vaccinations, influenza vaccination uptake in 2009-10 is 27% higher than for the 2008-09 season.
All 2009-10 flu vaccinations*
2008-09 season
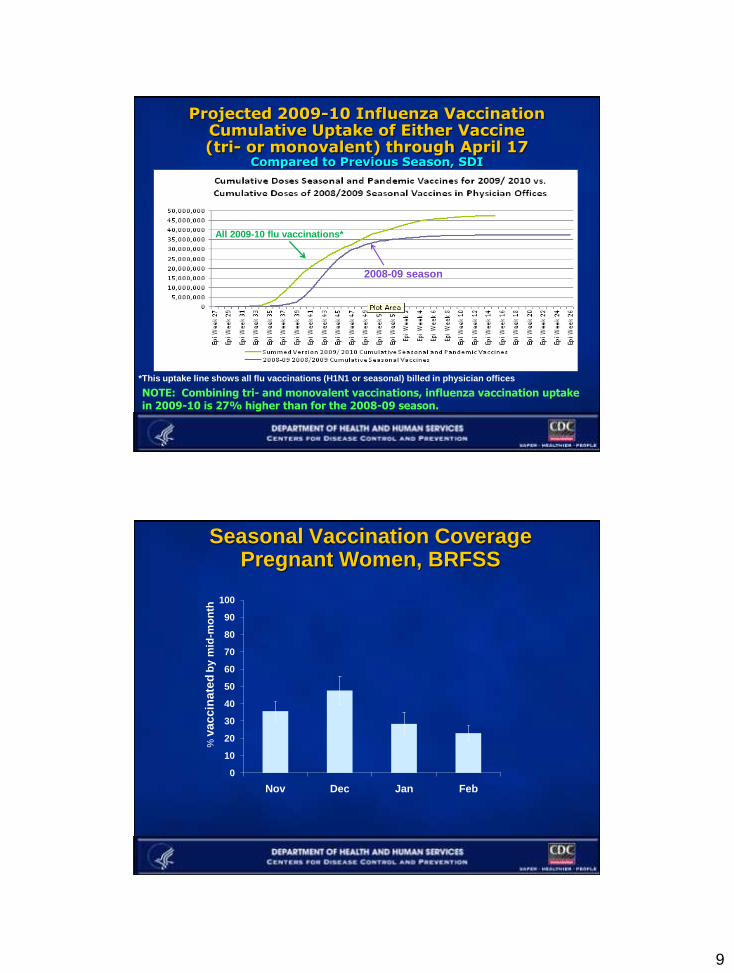
Seasonal Vaccination Coverage Pregnant Women, BRFSS
0
10
20
30
40
50
60
70
80
90
100
Nov Dec Jan Feb
% v
ac
cin
ate
db
y m
id-m
on
th
10
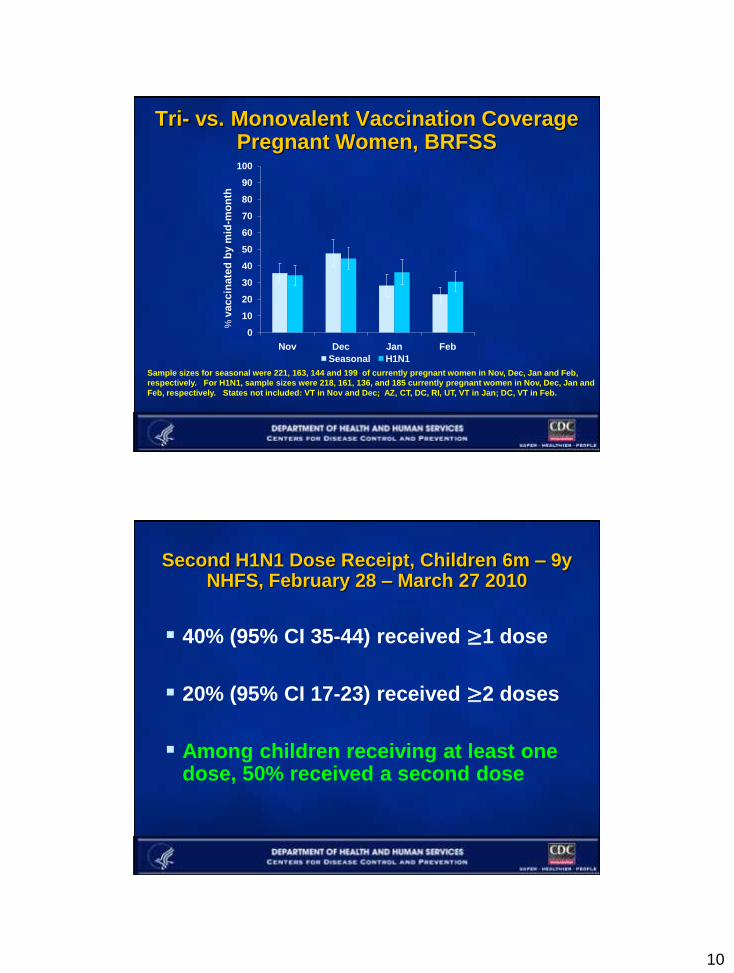
Tri- vs. Monovalent Vaccination Coverage Pregnant Women, BRFSS
Sample sizes for seasonal were 221, 163, 144 and 199 of currently pregnant women in Nov, Dec, Jan and Feb,
respectively. For H1N1, sample sizes were 218, 161, 136, and 185 currently pregnant women in Nov, Dec, Jan and
Feb, respectively. States not included: VT in Nov and Dec; AZ, CT, DC, RI, UT, VT in Jan; DC, VT in Feb.
0
10
20
30
40
50
60
70
80
90
100
Nov Dec Jan Feb
Seasonal H1N1
% v
accin
ate
db
y m
id-m
on
th
Second H1N1 Dose Receipt, Children 6m – 9yNHFS, February 28 – March 27 2010
40% (95% CI 35-44) received ≥1 dose
20% (95% CI 17-23) received ≥2 doses
Among children receiving at least one dose, 50% received a second dose
11
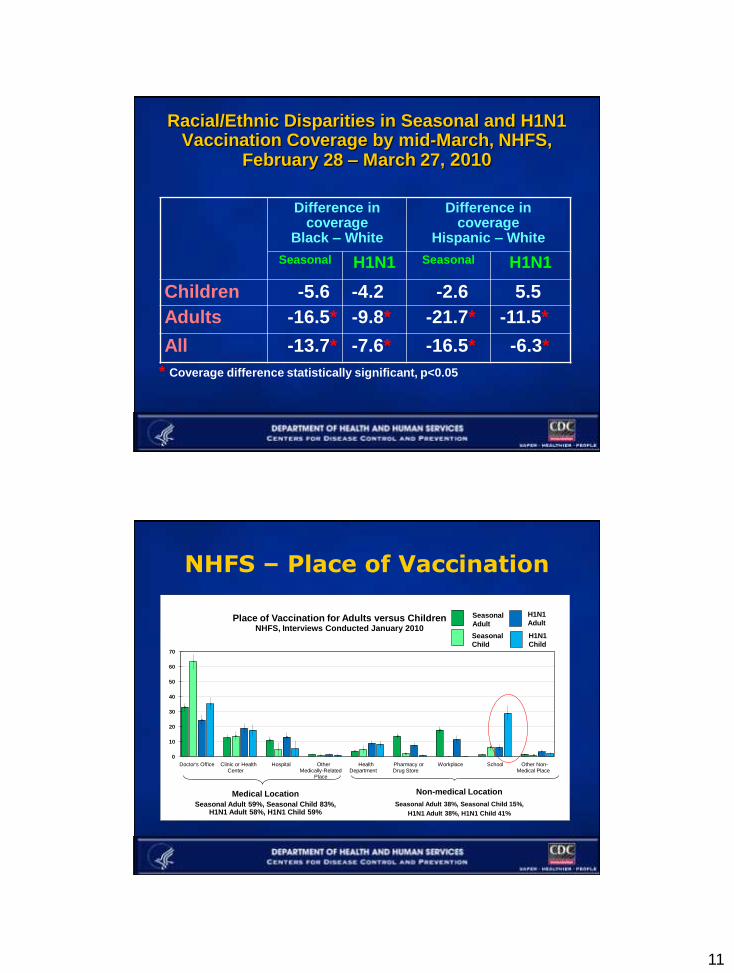
Racial/Ethnic Disparities in Seasonal and H1N1 Vaccination Coverage by mid-March, NHFS,
February 28 – March 27, 2010
* Coverage difference statistically significant, p<0.05
Difference in coverage
Black – White
Difference in coverage
Hispanic – White
Seasonal H1N1 Seasonal H1N1
Children -5.6 -4.2 -2.6 5.5
Adults -16.5* -9.8* -21.7* -11.5*
All -13.7* -7.6* -16.5* -6.3*
NHFS – Place of Vaccination
0
10
20
30
40
50
60
70
Doctor's Office Clinic or Health Center
Hospital Other Medically-Related
Place
Health Department
Pharmacy or Drug Store
Workplace School Other Non-Medical Place
Place of Vaccination for Adults versus ChildrenNHFS, Interviews Conducted January 2010
Seasonal
Adult
Seasonal
Child
H1N1
Adult
H1N1
Child
Medical Location
Seasonal Adult 59%, Seasonal Child 83%,H1N1 Adult 58%, H1N1 Child 59%
Non-medical Location
Seasonal Adult 38%, Seasonal Child 15%,
H1N1 Adult 38%, H1N1 Child 41%
12
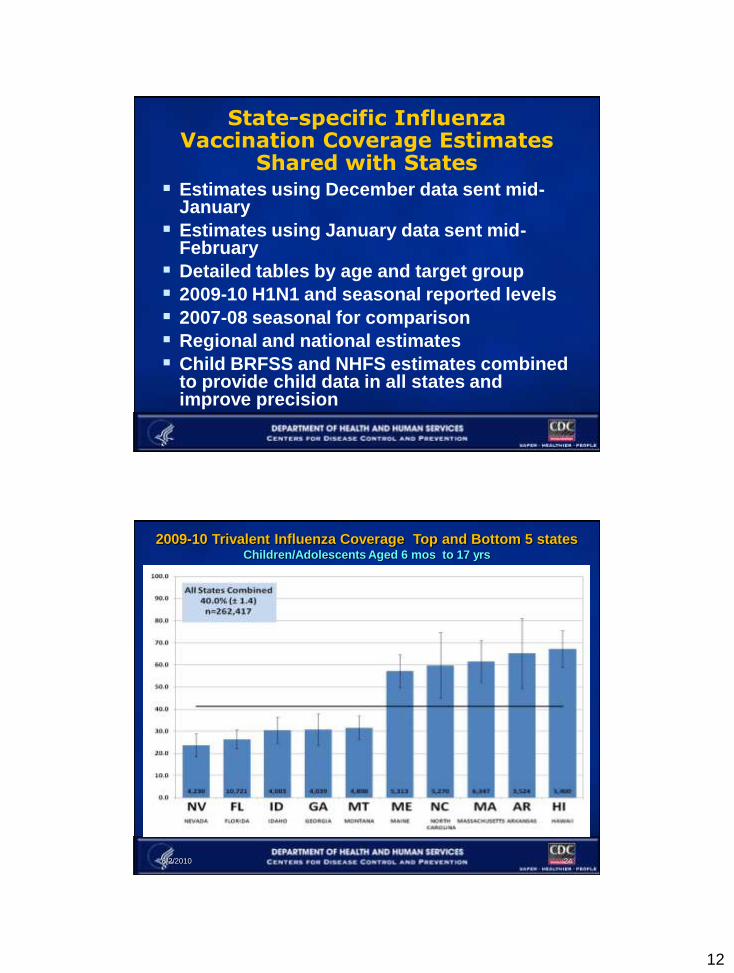
State-specific Influenza Vaccination Coverage Estimates
Shared with States
Estimates using December data sent mid-January
Estimates using January data sent mid-February
Detailed tables by age and target group
2009-10 H1N1 and seasonal reported levels
2007-08 seasonal for comparison
Regional and national estimates
Child BRFSS and NHFS estimates combined to provide child data in all states and improve precision
2009-10 Trivalent Influenza Coverage Top and Bottom 5 statesChildren/Adolescents Aged 6 mos to 17 yrs
6/2/2010 24
13
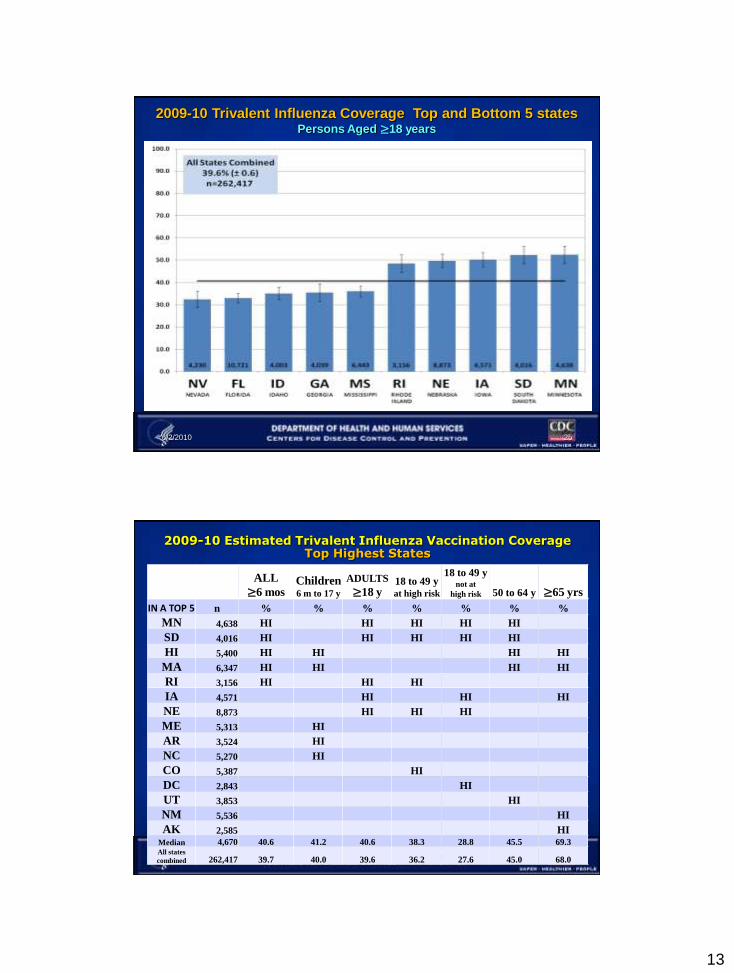
2009-10 Trivalent Influenza Coverage Top and Bottom 5 states Persons Aged ≥18 years
6/2/2010 25
2009-10 Estimated Trivalent Influenza Vaccination CoverageTop Highest States
ALL
≥6 mosChildren6 m to 17 y
ADULTS
≥18 y18 to 49 y at high risk
18 to 49 y not at
high risk 50 to 64 y ≥65 yrs
IN A TOP 5 n % % % % % % %
MN 4,638 HI HI HI HI HI
SD 4,016 HI HI HI HI HI
HI 5,400 HI HI HI HI
MA 6,347 HI HI HI HI
RI 3,156 HI HI HI
IA 4,571 HI HI HI
NE 8,873 HI HI HI
ME 5,313 HI
AR 3,524 HI
NC 5,270 HI
CO 5,387 HI
DC 2,843 HI
UT 3,853 HI
NM 5,536 HI
AK 2,585 HIMedian 4,670 40.6 41.2 40.6 38.3 28.8 45.5 69.3All states
combined 262,417 39.7 40.0 39.6 36.2 27.6 45.0 68.0
14
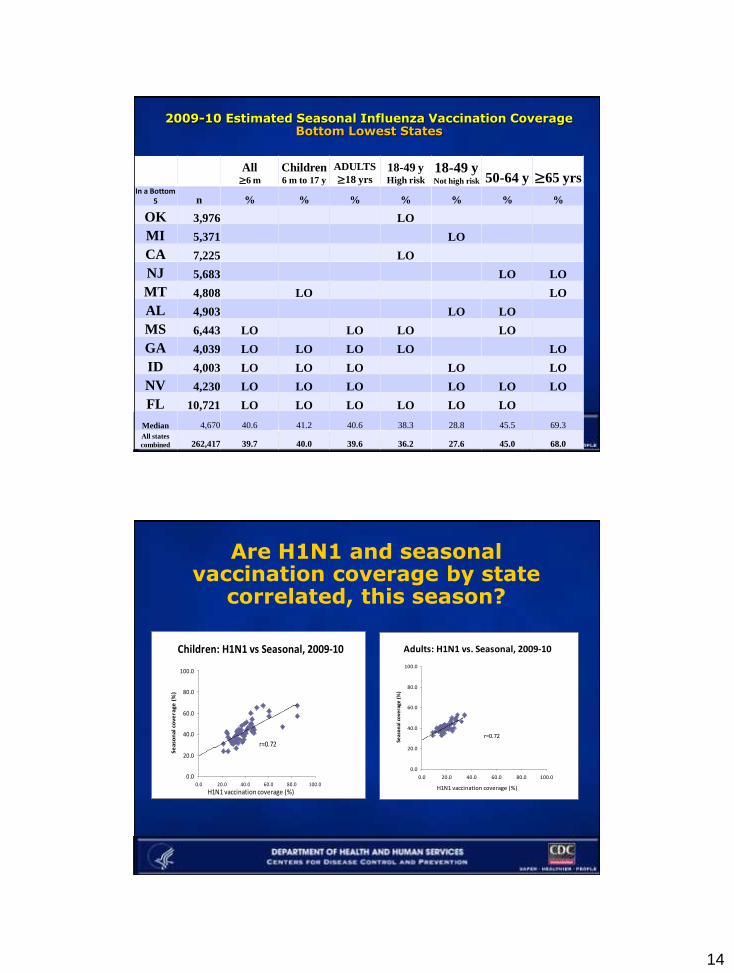
2009-10 Estimated Seasonal Influenza Vaccination CoverageBottom Lowest States
All ≥6 m
Children 6 m to 17 y
ADULTS
≥18 yrs18-49 yHigh risk
18-49 y Not high risk 50-64 y ≥65 yrs
In a Bottom 5 n % % % % % % %
OK 3,976 LO
MI 5,371 LO
CA 7,225 LO
NJ 5,683 LO LO
MT 4,808 LO LO
AL 4,903 LO LO
MS 6,443 LO LO LO LO
GA 4,039 LO LO LO LO LO
ID 4,003 LO LO LO LO LO
NV 4,230 LO LO LO LO LO LO
FL 10,721 LO LO LO LO LO LO
Median 4,670 40.6 41.2 40.6 38.3 28.8 45.5 69.3
All states
combined 262,417 39.7 40.0 39.6 36.2 27.6 45.0 68.0
Are H1N1 and seasonal vaccination coverage by state
correlated, this season?
Adults: H1N1 vs. Seasonal, 2009-10
0.0
20.0
40.0
60.0
80.0
100.0
0.0 20.0 40.0 60.0 80.0 100.0
Seas
on
al c
ove
rage
(%
)
H1N1 vaccination coverage (%)
r=0.72
Children: H1N1 vs Seasonal, 2009-10
0.0
20.0
40.0
60.0
80.0
100.0
0.0 20.0 40.0 60.0 80.0 100.0
Se
aso
na
l co
ve
rag
e (
%)
H1N1 vaccination coverage (%)
r=0.72
15
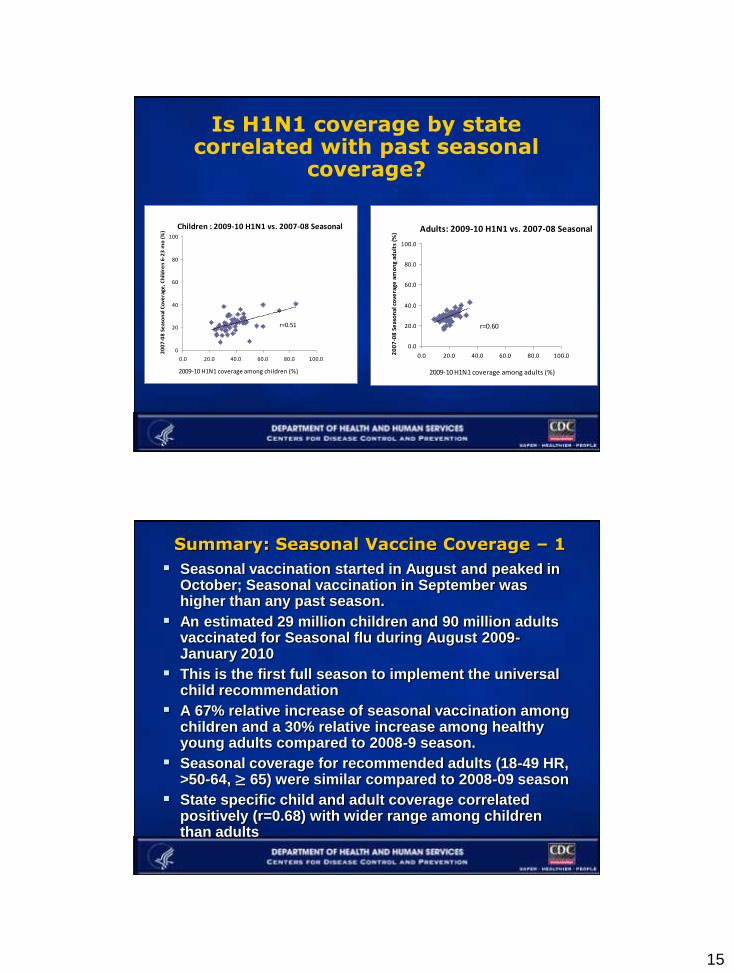
Is H1N1 coverage by state correlated with past seasonal
coverage?
Children : 2009-10 H1N1 vs. 2007-08 Seasonal
0
20
40
60
80
100
0.0 20.0 40.0 60.0 80.0 100.0
20
07
-08
Se
aso
nal
Co
vera
ge, C
hild
ren
6-2
3 m
o (
%)
2009-10 H1N1 coverage among children (%)
r=0.51
Adults: 2009-10 H1N1 vs. 2007-08 Seasonal
0.0
20.0
40.0
60.0
80.0
100.0
0.0 20.0 40.0 60.0 80.0 100.020
07
-08
Se
aso
nal
co
vera
ge a
mo
ng
adu
lts
(%)
r=0.60
2009-10 H1N1 coverage among adults (%)
Summary: Seasonal Vaccine Coverage – 1
Seasonal vaccination started in August and peaked in October; Seasonal vaccination in September was higher than any past season.
An estimated 29 million children and 90 million adults vaccinated for Seasonal flu during August 2009-January 2010
This is the first full season to implement the universal child recommendation
A 67% relative increase of seasonal vaccination among children and a 30% relative increase among healthy young adults compared to 2008-9 season.
Seasonal coverage for recommended adults (18-49 HR, >50-64, ≥ 65) were similar compared to 2008-09 season
State specific child and adult coverage correlated positively (r=0.68) with wider range among children than adults
16
31
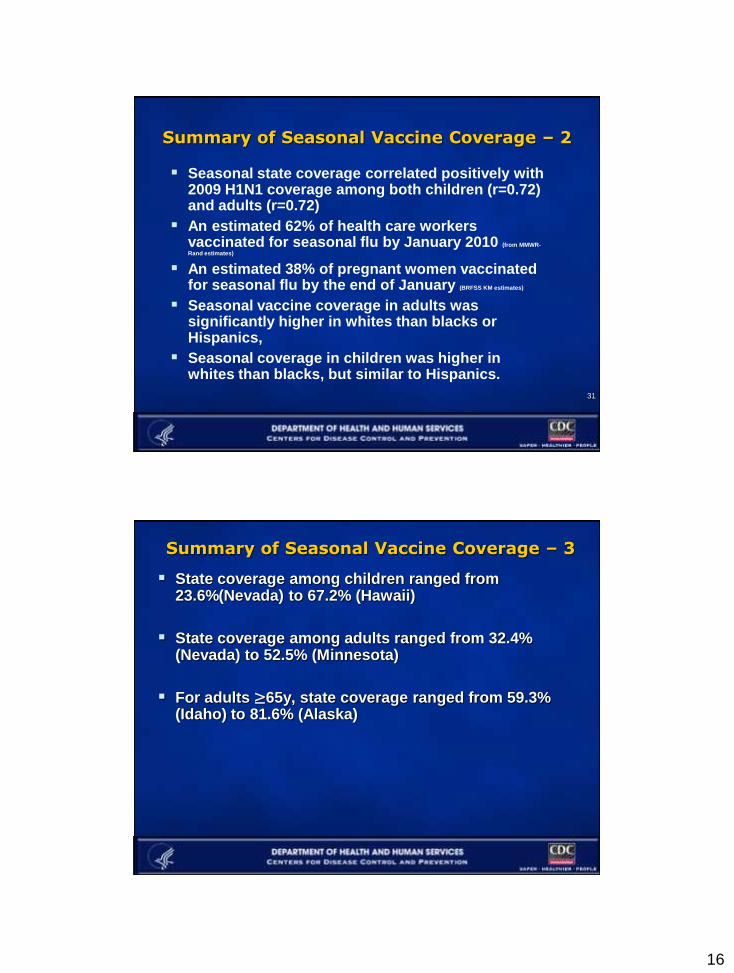
Seasonal state coverage correlated positively with 2009 H1N1 coverage among both children (r=0.72) and adults (r=0.72)
An estimated 62% of health care workers vaccinated for seasonal flu by January 2010 (from MMWR-
Rand estimates)
An estimated 38% of pregnant women vaccinated for seasonal flu by the end of January (BRFSS KM estimates)
Seasonal vaccine coverage in adults was significantly higher in whites than blacks or Hispanics,
Seasonal coverage in children was higher in whites than blacks, but similar to Hispanics.
Summary of Seasonal Vaccine Coverage – 2
Summary of Seasonal Vaccine Coverage – 3
State coverage among children ranged from 23.6%(Nevada) to 67.2% (Hawaii)
State coverage among adults ranged from 32.4% (Nevada) to 52.5% (Minnesota)
For adults ≥65y, state coverage ranged from 59.3% (Idaho) to 81.6% (Alaska)

17
Caveats – 1
Vaccination status and target group status
based on self or parental report
Respondents may have confused H1N1
and seasonal vaccinations
Non-response bias may remain after
weighting adjustments
NHFS estimates > BRFSS estimates
Survey estimates of coverage consistent
with vaccination patterns observed with
SDI data
Caveats – 2
Survey respondents reported 119 million doses of seasonal vaccines administered to non institutionalized persons, however, of the 114-115 million distributed no more than about 105* were available to the surveyed population indicating a over-reporting bias of 10-15%.– Recommendation: Private sector doses wasted/unused need to be
measured to allow for validation of self-reported coverage levels
______
*115 minus 6 m wasted/unused; 2 m administered to LTCF; 2 m administered to members of the military
18
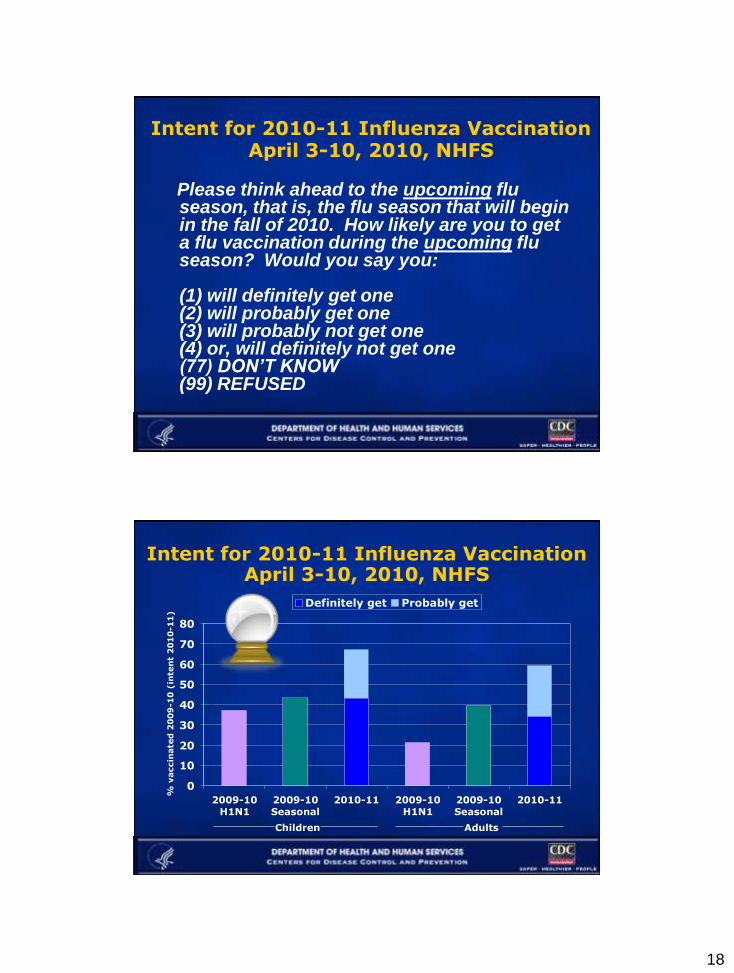
Intent for 2010-11 Influenza Vaccination April 3-10, 2010, NHFS
Please think ahead to the upcoming flu season, that is, the flu season that will begin in the fall of 2010. How likely are you to get a flu vaccination during the upcoming flu season? Would you say you:
(1) will definitely get one (2) will probably get one (3) will probably not get one(4) or, will definitely not get one(77) DON’T KNOW (99) REFUSED
Intent for 2010-11 Influenza Vaccination April 3-10, 2010, NHFS
0
10
20
30
40
50
60
70
80
2009-10
H1N1
2009-10
Seasonal
2010-11 2009-10
H1N1
2009-10
Seasonal
2010-11
% v
accin
ate
d 2
00
9-1
0 (
inte
nt
20
10
-11
)
Definitely get Probably get
Children Adults
19
6/2/2010
37
Post-season Evaluation Using Survey Data
Developing 2009-2010 season research agenda
Provide information to improve planning and implementation of next flu season and future pandemics
Implementation – what worked and what didn‟t– Collect data from states on their program activities
– Relate activities to vaccination coverage Number and type of providers enrolled as H1N1 vaccinators
Proportion of vaccine given through public venues
School-located vaccination
– Case studies based on states with high and low coverage
Provide BRFSS data analysis assistance to states– Team of 8+ full time staff
Plans for 2010-2011 Season Influenza Vaccination Surveillance
BRFSS adult data monthly
Children from NIS sample frame– Sample size ~8,000 per month
– National weekly estimates
– State-level estimates after accumulate several months of data
“Snapshot” surveys, n~1,400– National and in 10 selected metro areas
– Mid-season and March snapshots
– Vaccination, opinions, behaviors
Special population surveys, mid-season & March– Health care personnel
– Pregnant women
PRAMS, SDI, College Health Database
20
Conclusions CDC established a comprehensive vaccine coverage
monitoring system for 2009 H1N1
Results from this system helped CDC and possibly states
manage the campaign
Further analysis of data aimed at providing useful
information for future seasons
Lessons learned from assessment this season already
applied to plans for 2010-11
States should consider use of BRFSS to collect additional
influenza vaccination data
– Children (got vaccinated, place of vaccination)
– Adult health-care personnel
Improved measurements of unused doses are needed to
allow for assessment of the validity of coverage surveys
Acknowledgements2009-10 Coverage Team
CDC/NCIRD – Barbara Bardenheier, Carla Black, Daoling Bi, Leah
Bryan, Helen Ding, Gary Euler, Carolyn Furlow, Amparo Gonzalez-
Feliciano, Charles LeBaron, Pengjun Lu, Elizabeth Luman, Liz Monsell,
Rachel Patzer, Tammy Santibanez, Rosana Setse, Jim Singleton, Phil
Smith, Larry Wilkinson, Carla Winston, Karen Wooten, David Yankey,
Surasak Youngpairoj, Fan Zhang, John Zhang, Zhen Zhao
CDC/BRFSS -- Lena Balluz, Machell Town
CDC/NCBDDD – C. J. Alverson
CDC/NCCDPHP – Lawrence Barker
CDC/NCHS – Marcie Cynamon, Kathleen O’Connor
NORC – Ken Copeland, Nick Davis, MargretheMontgomery, Kirk Wolter
SDI Health -- Laurel Edelman, Joel Greenspan
21
6/2/2010 41
6/2/2010 42
22
6/2/2010 43
6/2/2010 44
23
6/2/2010 45
6/2/2010 46
24
6/2/2010 47
6/2/2010 48
25
6/2/2010 49
6/2/2010 50
26
6/2/2010 51
6/2/2010 52
27
6/2/2010 53
6/2/2010 54
28
6/2/2010 55
6/2/2010 56
29
6/2/2010 57
6/2/2010 58
30
6/2/2010 59
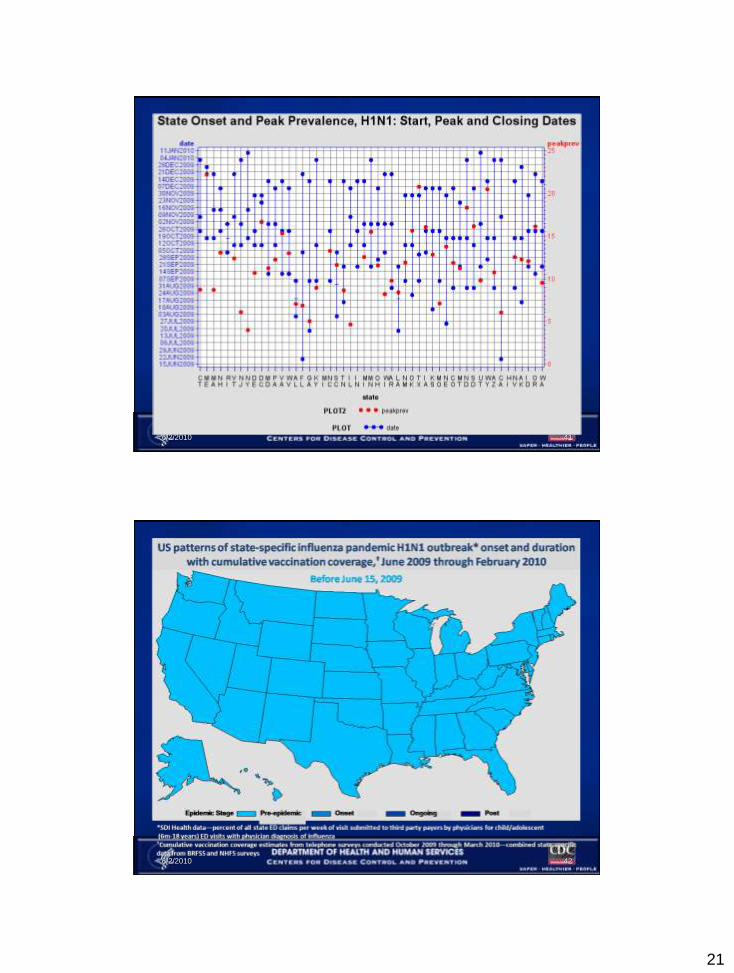
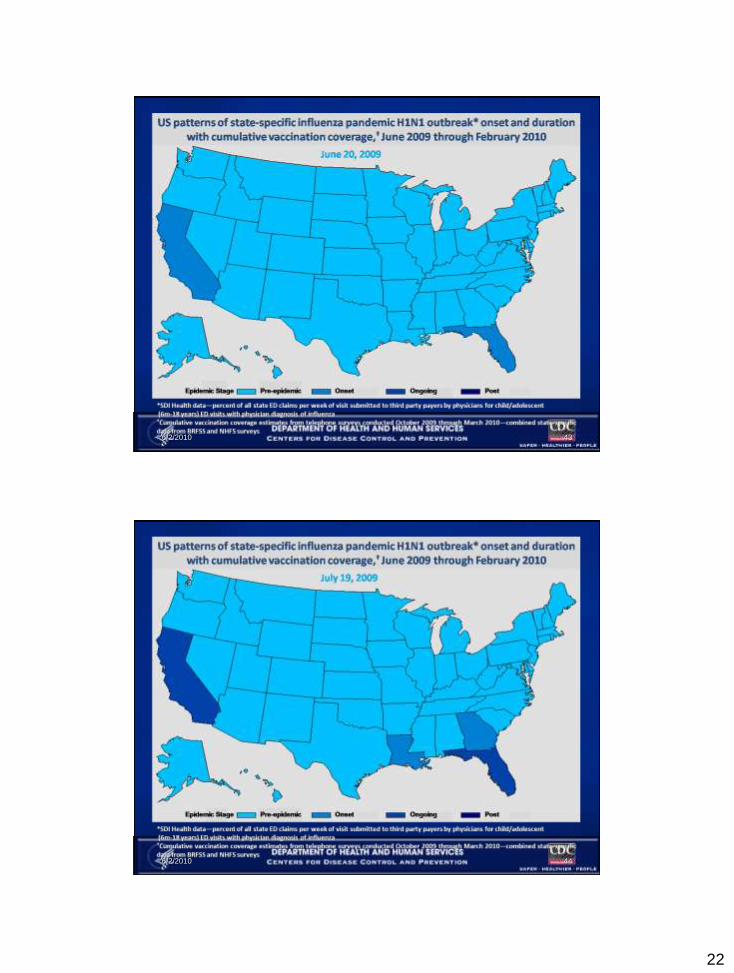
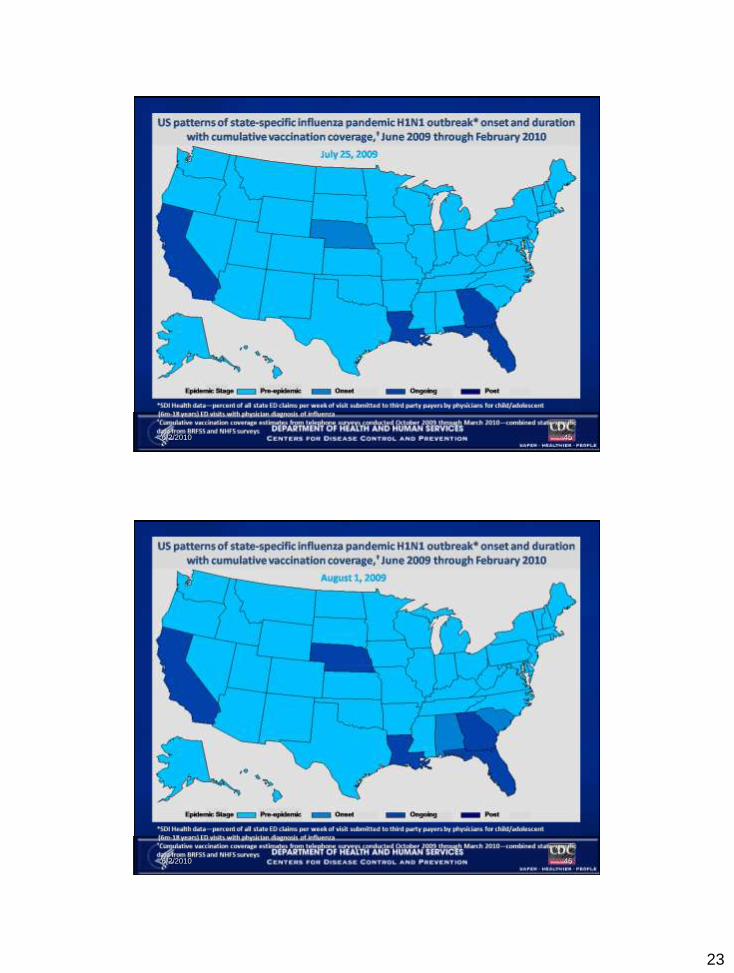
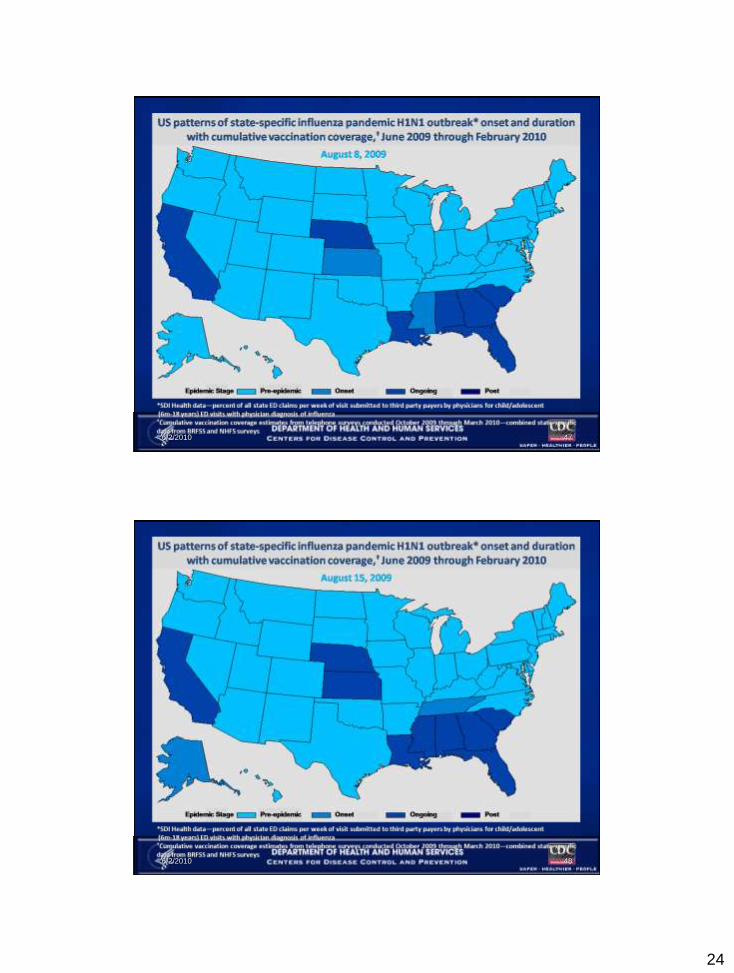
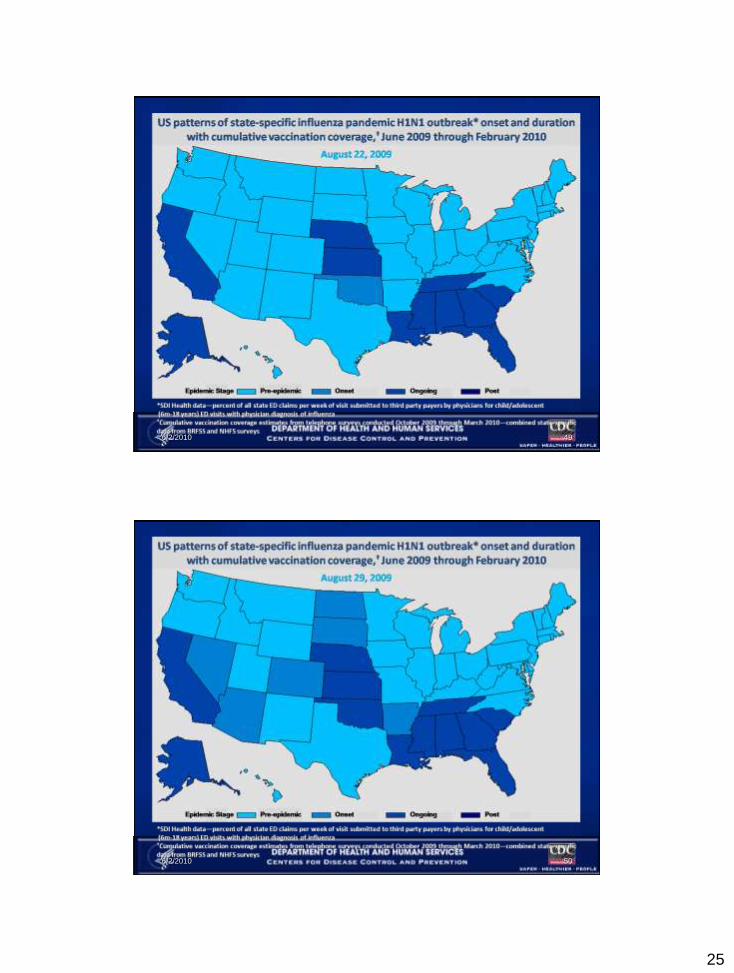
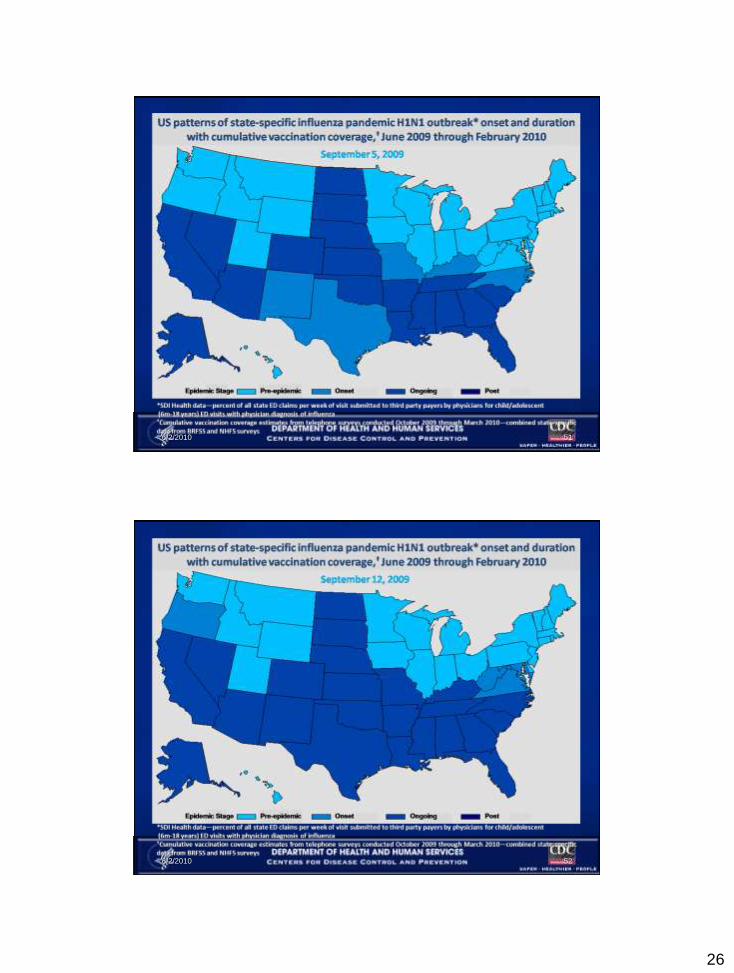
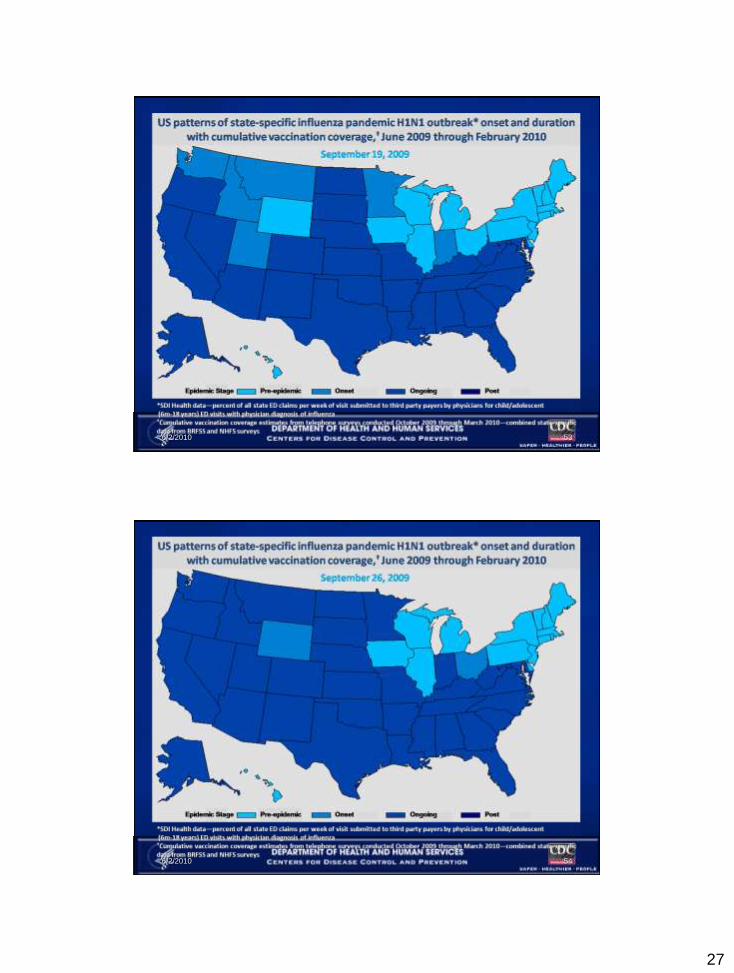
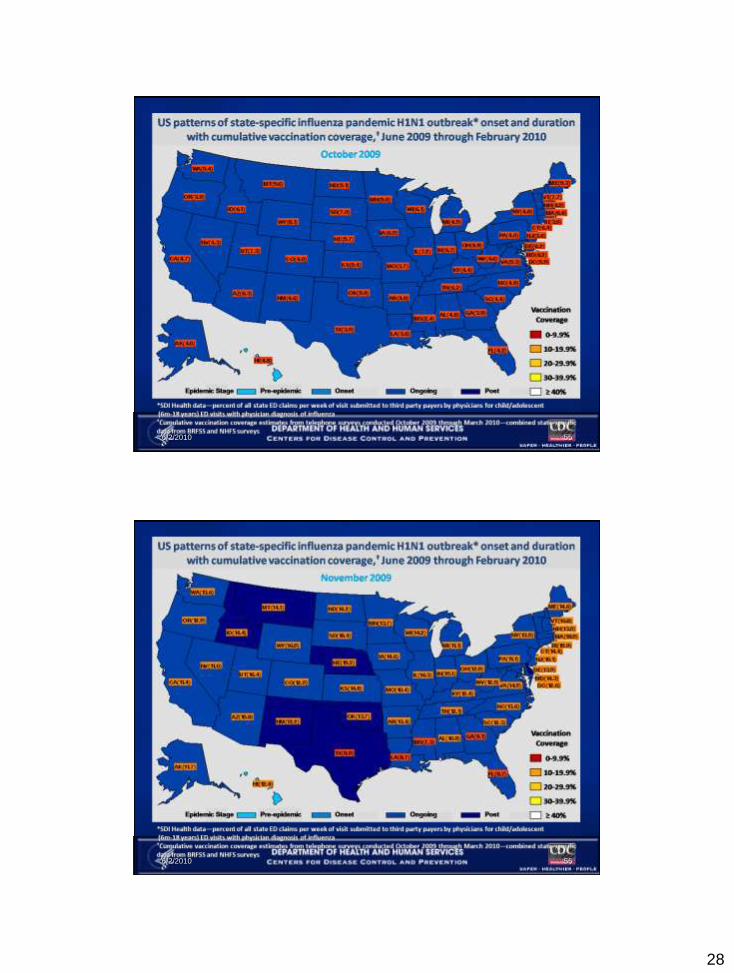
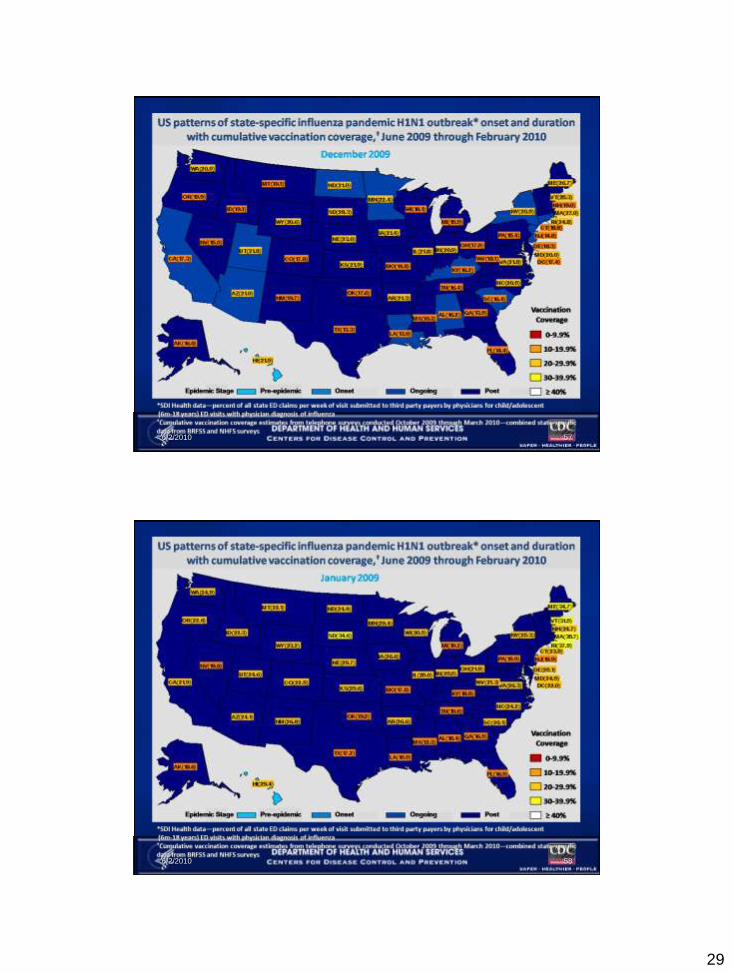
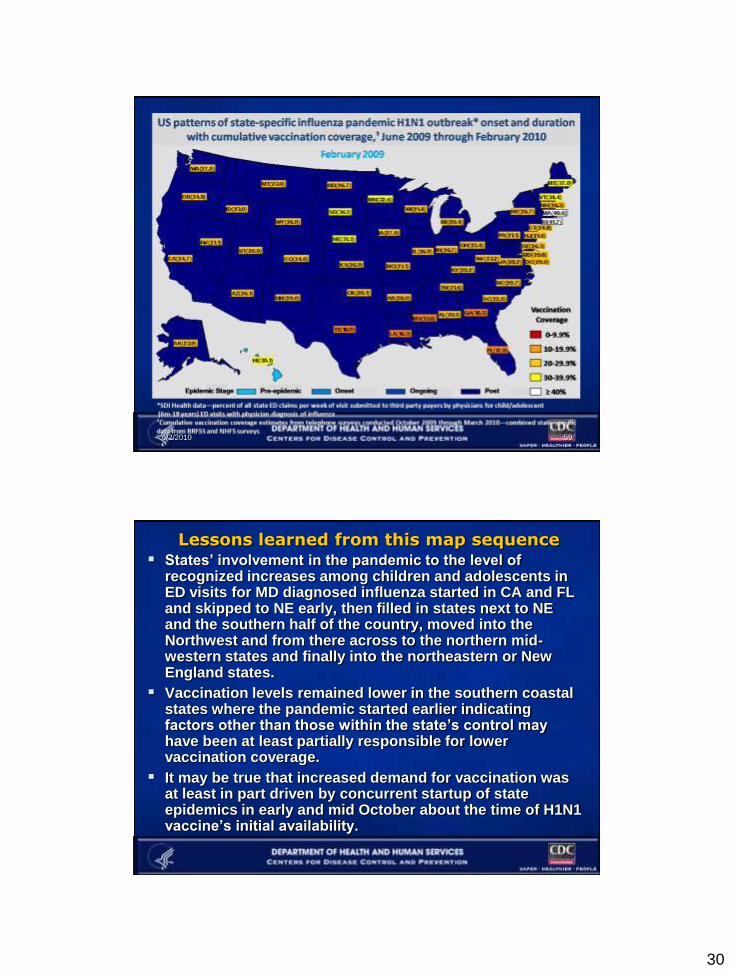
Lessons learned from this map sequence States‟ involvement in the pandemic to the level of
recognized increases among children and adolescents in ED visits for MD diagnosed influenza started in CA and FL and skipped to NE early, then filled in states next to NE and the southern half of the country, moved into the Northwest and from there across to the northern mid-western states and finally into the northeastern or New England states.
Vaccination levels remained lower in the southern coastal states where the pandemic started earlier indicating factors other than those within the state‟s control may have been at least partially responsible for lower vaccination coverage.
It may be true that increased demand for vaccination was at least in part driven by concurrent startup of state epidemics in early and mid October about the time of H1N1 vaccine‟s initial availability.