Embed Size (px)
Citation preview

COMMUNICATION
Mass Spectrometry Contamination from Tinuvin 770, a Common Additive inLaboratory Plastics
Kevin L. Schauer,1 Carolyn J. Broccardo,1 Kimberly M. Webb,2 Paul A. Covey,2
and Jessica E. Prenni1,3
1Colorado State University Proteomics and Metabolomics Facility, Fort Collins, Colorado, USA; 2U.S. Department ofAgriculture-Agricultural Research Service, Sugarbeet Research Unit, Fort Collins, Colorado, USA; and 3Department ofBiochemistry and Molecular Biology, Colorado State University, Fort Collins, Colorado, USA
The superior sensitivity of current mass spectrometers makes them prone to contamination issues, which canhave deleterious effects on sample analysis. Here, bis(2,2,6,6-tetramethyl-4-piperidyl) sebacate (marketedunder the name Tinuvin 770) is identified as a major contaminant in applications using liquid chromatographycoupled with mass spectrometry (LC-MS). Tinuvin 770 is often added to laboratory and medical plastics as aUV stabilizer. One particular lot of microcentrifuge tubes was found to have an excess of this compound thatwould leach into samples and drastically interfere with LC-MS data acquisition. Further analysis found thatTinuvin 770 readily leached into polar and nonpolar solvents from the contaminated tube lot. Efforts toremove Tinuvin 770 from contaminated samples were unsuccessful. A prescreening method using MALDI-TOF MS is presented to prevent system contamination and sample loss.
KEY WORDS: bis(2,2,6,6-tetramethyl-4-piperidyl) sebacate, liquid chromatography, proteomics, microcentrifugetubes, LC-MS
INTRODUCTION
Liquid chromatography coupled with mass spectrometry(LC-MS) is a valuable analytical tool routinely used for theanalysis of biological molecules (e.g., proteins, peptides,and metabolites), as well as in other fields. The high sensi-tivity of current MS technologies allows for superior levelsof detection, even within a complex matrix. For example,instruments used in proteomic studies are routinely capableof detecting low femtomole levels of a peptide.1 However,the high sensitivity of these instruments also makes themprone to contamination. As an example, in proteomicsexperiments, keratin is often introduced during sample-handling steps. As many mass spectrometers use data-dependent acquisition techniques, such contamination canlead to considerable data loss, as MS time is dominated bythe analysis of keratin peptides instead of the peptides ofinterest.2,3 Nonproteinaceous materials can also have dele-terious effects on data collection in LC-MS experiments.4
For example, high salt concentrations can inhibit ioniza-tion, and certain plasticizers have also been shown to neg-atively affect data acquisition through ion suppression.4
Here, bis(2,2,6,6-tetramethyl-4-piperidyl) sebacate,commonly known as Tinuvin 770, was detected as a majorcontaminant in a LC-MS/MS proteomics experiment.This compound is a UV stabilizer,5 commonly used in theproduction of plastics, such as polypropylene and polysty-rene.6 Previous studies have shown that Tinuvin 770 canleach from polypropylene tubes and interfere with com-mon laboratory procedures, as well as have toxic effects onlaboratory animals.6–9 However, this compound has not,until now, been shown as a potential contaminate inLC-MS or LC-MS/MS applications.
MATERIALS AND METHODSLC-MS
Protein extracts from Beta vulgaris leaves were subjected totryptic digestion, as described previously.10 In brief, 30 �gprotein was precipitated in acetone and resuspended in 8 Murea with 0.2% ProteaseMAX surfactant (Promega, Mad-ison, WI, USA) by bath sonication. Proteins were thenreduced using DTT and alkylated by iodoacetamide. Tryp-sin digestion was performed at 37°C for 3 h and wasstopped by the addition of trifluoroacetic acid to a finalconcentration of 0.5%. Digested peptides were dried in avacuum evaporator and purified using a reverse phase C18TopTip (Glygen, Columbia, MD, USA). Purified peptides
ADDRESS CORRESPONDENCE TO: Jessica E. Prenni, Colorado State Uni-versity, 2021 Campus Delivery, Fort Collins, CO 80523, USA(Phone: 970-491-0961; E-mail: [email protected]).doi: 10.7171/jbt.13-2402-004
xxxxxxxxxxxx
Journal of Biomolecular Techniques 24:57–61 © 2013 ABRF

were reconstituted in 30 �l 0.1% formic acid with 3%acetonitrile (ACN) in preparation for LC-MS analysis.
Peptides were separated temporally on a reverse phasenanospray column (1200 Nano HPLC and Zorbax C18, 5�m, 75 �m inner diameter�150-mm column; AgilentTechnologies, Santa Clara, CA, USA), using a 90-minlinear gradient from 25% to 55% buffer B (90% ACN,0.1% formic acid) at a flow rate of 300 nl/min. Elutedpeptides were injected directly into a linear ion trap massspectrometer (LTQ; Thermo Fisher Scientific, Waltham,MA, USA), where spectra were collected over a mass windowof 200–2000 mass-to-charge ratio (m/z). A dynamic exclu-sion limit of two MS/MS spectra for a given m/z in a 30-speriod (followed by a 90-s exclusion of that ion) was used.
MALDI-TOF/TOF MS
One microliter of the contaminated sample was co-spottedwith 1 �l of 10 mg/ml �-cyano-4-hydroxy-cinnamic acid(CHCA) matrix (Bruker Daltonics, Bremen, Germany) in50% ACN and 0.1% trifluoroacetic acid onto a MTP 384ground steel MALDI target plate (Bruker Daltonics). Thismixture was allowed to dry at room temperature and thenanalyzed using an Ultraflex II MALDI TOF/TOF (BrukerDaltonics). Acquisition was performed in positive ion re-flector mode with a 25-kV acceleration voltage. Externalcalibration was performed using the Bruker peptide cali-bration standard II that had been spiked with 0.1 �g/�lestrone and progesterone (Sigma-Aldrich, St. Louis, MO,USA) to extend the range of the calibration. In addition,the CHCA matrix was analyzed under identical conditionsto determine which of the observed peaks in the samplespectra were a result of matrix background.
Abundant, nonmatrix peaks observed in the MS spec-trum were then subjected to MS/MS analysis using thesame instrumentation in LIFT mode. Each parent masswas searched against the MassBank mass spectral database(http://www.massbank.jp/?lang�en), and the correspond-ing experimental MS/MS spectra were manually compared
with the database spectra. The authentic, standard Tinuvin770 (Sigma-Aldrich; solution in methanol) was also ana-lyzed using the procedure described above.
Tube-Contamination Analysis
Microcentrifuge tubes were obtained from five differentvendors: Daigger (Vernon Hill, IL, USA), ExtraGene (Tai-chung City, Taiwan), Quasar Instruments (ColoradoSprings, CO, USA), Light Labs (Dallas, TX, USA), andLife Science Products (Frederick, CO, USA). The lot num-bers and manufacturers of the tubes are shown in Table 1.A minimum of five tubes from each lot was tested, eachusing a different solvent, including 100% methanol, 0.1%formic acid, 50 mM ammonium bicarbonate (Sigma-Aldrich), 100% acetone and 100% chloroform (FisherScientific, Fair Lawn, NJ, USA). For each test, a volume of100 �l solvent was added to the tube, vortexed briefly, andincubated at room temperature for 20 min. The test samplewas then spotted onto the MALDI target, along with theCHCA matrix, as described above. Mass spectra were ac-quired using the same instrumentation and settings de-scribed previously with the following exceptions: only MSdata were collected, and the firing location was automatedto eliminate sampling bias as a result of inhomogeneousmatrix crystallization. Laser power was held constant forthe analysis of all test samples. Automation was configuredsuch that a total of 800 shots was collected in eight differentpositions within each test sample spot.
RESULTSSample contamination was first realized while analyzing acomplex peptide mixture using LC-MS/MS as describedabove. Approximately 20 min into the gradient, a largepeak was observed that was abnormal for the sample type(Fig. 1A and B). The MS spectra revealed an intense doublycharged ion with a m/z of 241, along with two muchless-intense ions, at 342 and 482 m/z (Fig. 1C). Thepresence of this contaminant had a dramatic, deleterious
T A B L E 1
Summary of the Tubes Tested for the Presence of Tinuvin 770
Retailer Catalog number Manufacturer Lot number Tinuvin 770 present?
Daigger EF8978A ExtraGene 3124522321 YesExtraGene TUBE-170-C ExtraGene 56171204260 NoQuasar Instruments 5024-TUBE-170-C ExtraGene 312452121 NoQuasar Instruments 5024-TUBE-170-C ExtraGene 104571010 NoQuasar Instruments 5024-TUBE-170-C ExtraGene 900117188 NoQuasar Instruments 5024-TUBE-170-C ExtraGene 530494070 NoLight Labs A-7011 Scientific Specialties Service 12113 NoLife Science Products M-1700C Sorenson BioScience V22909 No
Scientific Specialties Service (Hannover, MD, USA); Sorenson BioScience (Salt Lake City, UT, USA).
SCHAUER ET AL. / LC-MS CONTAMINATION BY TINUVIN 770
58 JOURNAL OF BIOMOLECULAR TECHNIQUES, VOLUME 24, ISSUE 2, JULY 2013
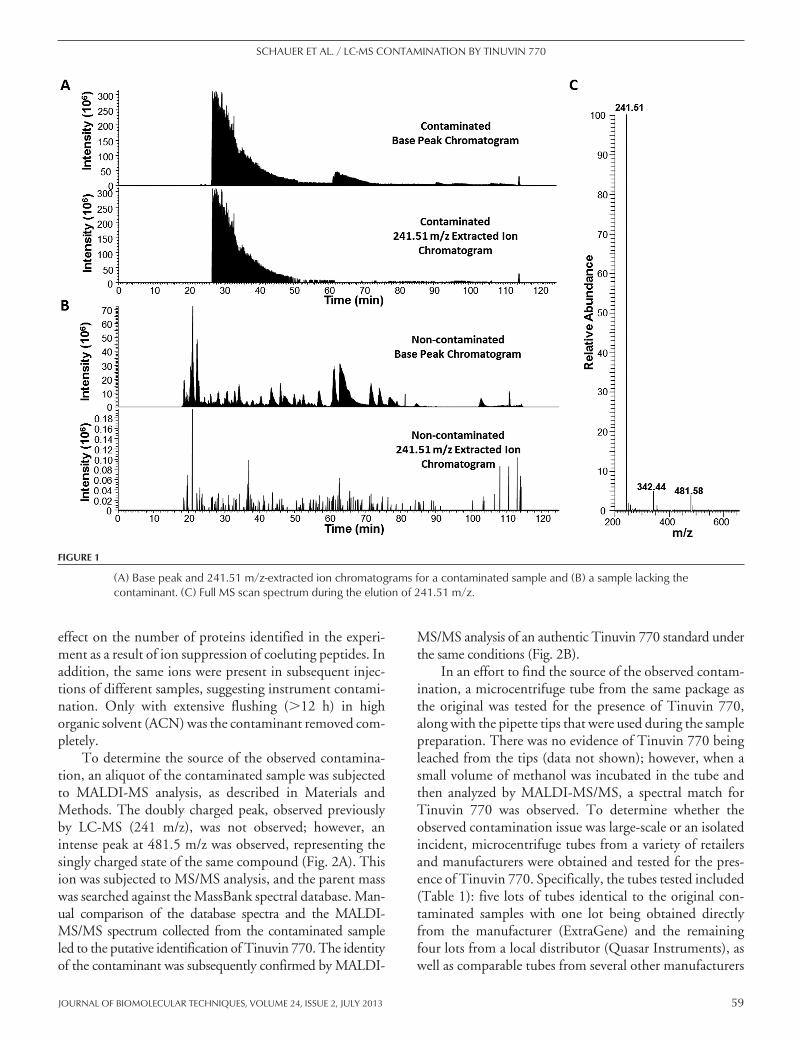
effect on the number of proteins identified in the experi-ment as a result of ion suppression of coeluting peptides. Inaddition, the same ions were present in subsequent injec-tions of different samples, suggesting instrument contami-nation. Only with extensive flushing (�12 h) in highorganic solvent (ACN) was the contaminant removed com-pletely.
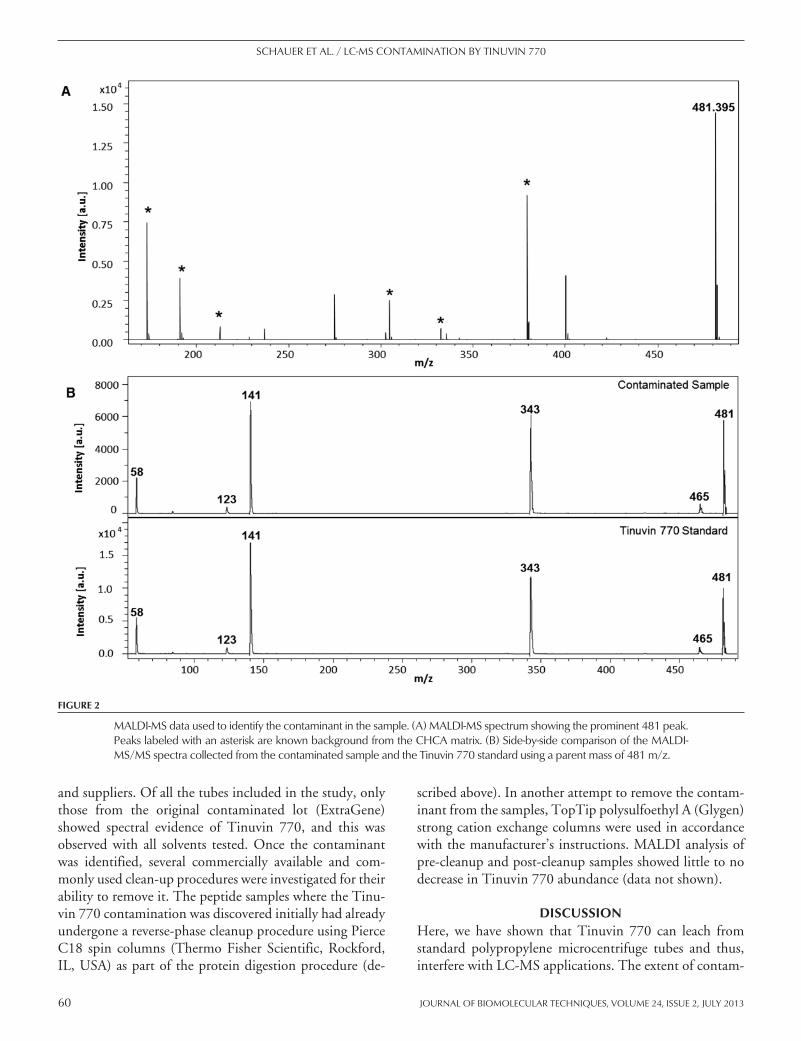
To determine the source of the observed contamina-tion, an aliquot of the contaminated sample was subjectedto MALDI-MS analysis, as described in Materials andMethods. The doubly charged peak, observed previouslyby LC-MS (241 m/z), was not observed; however, anintense peak at 481.5 m/z was observed, representing thesingly charged state of the same compound (Fig. 2A). Thision was subjected to MS/MS analysis, and the parent masswas searched against the MassBank spectral database. Man-ual comparison of the database spectra and the MALDI-MS/MS spectrum collected from the contaminated sampleled to the putative identification of Tinuvin 770. The identityof the contaminant was subsequently confirmed by MALDI-
MS/MS analysis of an authentic Tinuvin 770 standard underthe same conditions (Fig. 2B).
In an effort to find the source of the observed contam-ination, a microcentrifuge tube from the same package asthe original was tested for the presence of Tinuvin 770,along with the pipette tips that were used during the samplepreparation. There was no evidence of Tinuvin 770 beingleached from the tips (data not shown); however, when asmall volume of methanol was incubated in the tube andthen analyzed by MALDI-MS/MS, a spectral match forTinuvin 770 was observed. To determine whether theobserved contamination issue was large-scale or an isolatedincident, microcentrifuge tubes from a variety of retailersand manufacturers were obtained and tested for the pres-ence of Tinuvin 770. Specifically, the tubes tested included(Table 1): five lots of tubes identical to the original con-taminated samples with one lot being obtained directlyfrom the manufacturer (ExtraGene) and the remainingfour lots from a local distributor (Quasar Instruments), aswell as comparable tubes from several other manufacturers
FIGURE 1
(A) Base peak and 241.51 m/z-extracted ion chromatograms for a contaminated sample and (B) a sample lacking thecontaminant. (C) Full MS scan spectrum during the elution of 241.51 m/z.
SCHAUER ET AL. / LC-MS CONTAMINATION BY TINUVIN 770
JOURNAL OF BIOMOLECULAR TECHNIQUES, VOLUME 24, ISSUE 2, JULY 2013 59
and suppliers. Of all the tubes included in the study, onlythose from the original contaminated lot (ExtraGene)showed spectral evidence of Tinuvin 770, and this wasobserved with all solvents tested. Once the contaminantwas identified, several commercially available and com-monly used clean-up procedures were investigated for theirability to remove it. The peptide samples where the Tinu-vin 770 contamination was discovered initially had alreadyundergone a reverse-phase cleanup procedure using PierceC18 spin columns (Thermo Fisher Scientific, Rockford,IL, USA) as part of the protein digestion procedure (de-
scribed above). In another attempt to remove the contam-inant from the samples, TopTip polysulfoethyl A (Glygen)strong cation exchange columns were used in accordancewith the manufacturer’s instructions. MALDI analysis ofpre-cleanup and post-cleanup samples showed little to nodecrease in Tinuvin 770 abundance (data not shown).
DISCUSSIONHere, we have shown that Tinuvin 770 can leach fromstandard polypropylene microcentrifuge tubes and thus,interfere with LC-MS applications. The extent of contam-
FIGURE 2
MALDI-MS data used to identify the contaminant in the sample. (A) MALDI-MS spectrum showing the prominent 481 peak.Peaks labeled with an asterisk are known background from the CHCA matrix. (B) Side-by-side comparison of the MALDI-MS/MS spectra collected from the contaminated sample and the Tinuvin 770 standard using a parent mass of 481 m/z.
SCHAUER ET AL. / LC-MS CONTAMINATION BY TINUVIN 770
60 JOURNAL OF BIOMOLECULAR TECHNIQUES, VOLUME 24, ISSUE 2, JULY 2013

ination is illustrated in an example proteomics experiment,although ion suppression at this level would be detrimentalto any LC-MS application. Whereas contamination wasonly detected in one lot of tubes from one manufacturer, itis likely that the contamination could occur in future lots,from other manufactures, or from plasticware that was nottested in this study. As a result of the inability to removeTinuvin 770 by standard cleanup protocols, samples thathave been placed in a contaminated tube are rendereduseless because of the significant levels of ion suppression.In addition, LC-MS instruments that become contami-nated with this compound require extensive cleaning,which can lead to extensive down-time. Thus, the impactsof even a small number of contaminated tubes could befar-reaching and costly. Further work is required to developan effective Tinuvin 770 removal procedure that is com-patible with LC-MS workflows. Until then, prescreeningby MALDI-TOF, as described above, prior to LC-MSanalysis can be used to avoid system contamination anddata loss.
REFERENCES1. McLean JA, Russell DH. Sub-femtomole peptide detection in
ion mobility-time-of-flight mass spectrometry measurements.
J Proteome Res 2003;2:427–430.2. Mann M, Hendrickson RC, Pandey A.Analysis of proteins and
proteomes by mass spectrometry. Ann Rev Biochem 2001;70:437–473.
3. Xu B, Zhang Y, Zhao Z, et al. Usage of electrostatic eliminatorreduces human keratin contamination significantly in gel-basedproteomics analysis. J Proteomics 2011;74:1022–1029.
4. Keller BO, Sui J, Young AB, Whittal RM. Interferences andcontaminants encountered in modern mass spectrometry. AnalChim Acta 2008;627:71–81.
5. Wiles DM, Jensen JP, Carlsson DJ. Polymer stabilization byhindered amines. Pure Appl Chem 1983;55:1651–1659.
6. Papke RL, Craig AG, Heinemann SF. Inhibition of nicotinicacetylcholine receptors by bis (2,2,6,6-tetramethyl-4-piperidi-nyl) sebacate (Tinuvin 770), an additive to medical plastics. qjJPharmacol Exp Ther 1997;268:718–726.
7. Sotonyi P, Keller E, Jaray J, et al. A light stabilizer Tinuvin770-induced toxic injury of adult rat cardiac myocytes. ForensicSci Int 2001;119:322–327.
8. Sotonyi P, Merkely B, Hubay M, et al. Comparative study oncardiotoxic effect of Tinuvin 770: a light stabilizer of medicalplastics in rat model. Toxicol Sci 2004;77:368–374.
9. Glossmann H, Hering S, Savchenko A, et al. A light stabilizer(Tinuvin 770) that elutes from polypropylene plastic tubes is apotent L-type Ca(2�)-channel blocker. Proc Natl Acad Sci USA1993;90:9523–9527.
10. Freund DM, Prenni JE, Curthoys NP. Response of the mito-chondrial proteome of rat renal proximal convoluted tubules tochronic metabolic acidosis. Am J Physiol Renal Physiol 2013;304:F145–F155.
SCHAUER ET AL. / LC-MS CONTAMINATION BY TINUVIN 770
JOURNAL OF BIOMOLECULAR TECHNIQUES, VOLUME 24, ISSUE 2, JULY 2013 61