Embed Size (px)
DESCRIPTION
Real estate market watch for the Charlotte NC region.
Citation preview

2
3
5
7
9
11
13
15
18
20
22
Anson County
Cabarrus County
Gaston County
Iredell County
Lincoln County
Counties (Click any county name to jump to that page)
Marketwatch ReportQ3-2011
All Counties Overview
A FREE RESEARCH TOOL FROM THECHARLOTTE REGIONAL REALTOR® ASSOCIATIONAND CAROLINA MULTIPLE LISTING SERVICE, INC.
Alexander County
Current as of November 1, 2011. All data from Carolina Multiple Listing Services, Inc.Report provided by the Charlotte Regional REALTOR® Association. Powered by 10K Research and Marketing.
Mecklenburg County
Montgomery County
Stanly County
Union County
0B

Q3-2011 1-Yr Chg Q3-2011 1-Yr Chg Q3-2011 1-Yr Chg Q3-2011 1-Yr Chg
Alexander $125,000 + 23.5% 85.1% - 2.1% 180 + 31.9% 15 - 11.8%
Anson $30,000 - 48.4% 78.2% - 4.8% 198 + 53.2% 25 + 38.9%
Cabarrus $160,500 + 3.5% 90.5% + 0.0% 151 - 12.3% 472 + 14.6%
Gaston $110,000 + 0.9% 88.0% - 0.3% 167 + 10.7% 413 + 4.0%
Iredell $180,000 + 3.7% 88.4% - 1.7% 168 + 8.3% 416 + 10.9%
Lincoln $152,500 - 6.7% 88.7% + 1.0% 159 - 4.8% 159 + 18.7%
Mecklenburg $160,000 - 4.8% 90.1% + 0.3% 149 + 2.5% 2,838 + 15.2%
Montgomery $66,000 + 10.0% 80.6% + 1.6% 268 + 5.8% 25 + 8.7%
Stanly $105,000 - 16.0% 86.8% + 0.8% 163 + 16.1% 61 - 16.4%
Union $193,050 - 10.2% 90.6% + 0.9% 154 + 0.1% 574 + 8.9%
All data from Carolina Multiple Listing Services, Inc. Report provided by the Charlotte Regional REALTOR® Association. Powered by 10K Research and Marketing. | 2
Marketwatch ReportQ3-2011
All Counties Overview
Median Sales Price Pct. of Orig. Price Rec'd. Days on Market Closed Sales
1B

Pct. of Orig. Price Rec'd. 85.1% - 2.1%
Homes for Sale 91 - 15.0%
Closed Sales 15 - 11.8%
Months Supply 16.1 - 1.2%
Days on Market 180 + 31 9%
- 10.3%
Marketwatch ReportQ3-2011
Key Metrics Q3-2011 1-Yr Chg Market Activity
Alexander County
Median Sales Price $125,000 + 23.5%
Average Sales Price $136,063
101
21
107
17
91
15
Homes for Sale Closed Sales
Q3-2009 Q3-2010 Q3-2011
+ 5.9% - 15.0% - 19.0% - 11.8%
All data from Carolina Multiple Listing Services, Inc. Report provided by the Charlotte Regional REALTOR® Association. Powered by 10K Research and Marketing. | 3
Days on Market 180 + 31.9%
Historical Median Sales Price for Alexander County
Homes for Sale Closed Sales
Q1-2006 Q1-2007 Q1-2008 Q1-2009 Q1-2010 Q1-2011
$175,000
$150,000
$125,000
$100,000
$75,000
Q3-2011 1-Yr Chg Q3-2011 1-Yr Chg Q3-2011 1-Yr Chg Q3-2011 1-Yr Chg
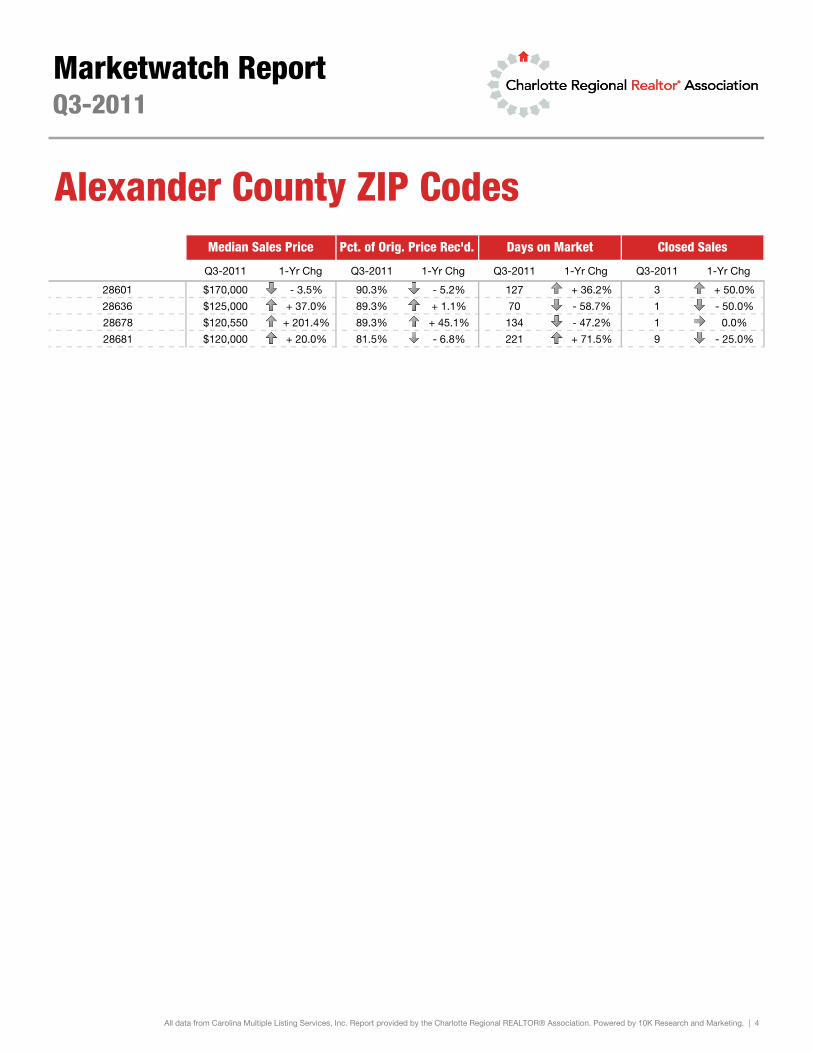
28601 $170,000 - 3.5% 90.3% - 5.2% 127 + 36.2% 3 + 50.0%
28636 $125,000 + 37.0% 89.3% + 1.1% 70 - 58.7% 1 - 50.0%
28678 $120,550 + 201.4% 89.3% + 45.1% 134 - 47.2% 1 0.0%
28681 $120,000 + 20.0% 81.5% - 6.8% 221 + 71.5% 9 - 25.0%
Marketwatch Report
Closed SalesMedian Sales Price Pct. of Orig. Price Rec'd. Days on Market
Q3-2011
Alexander County ZIP Codes
All data from Carolina Multiple Listing Services, Inc. Report provided by the Charlotte Regional REALTOR® Association. Powered by 10K Research and Marketing. | 4
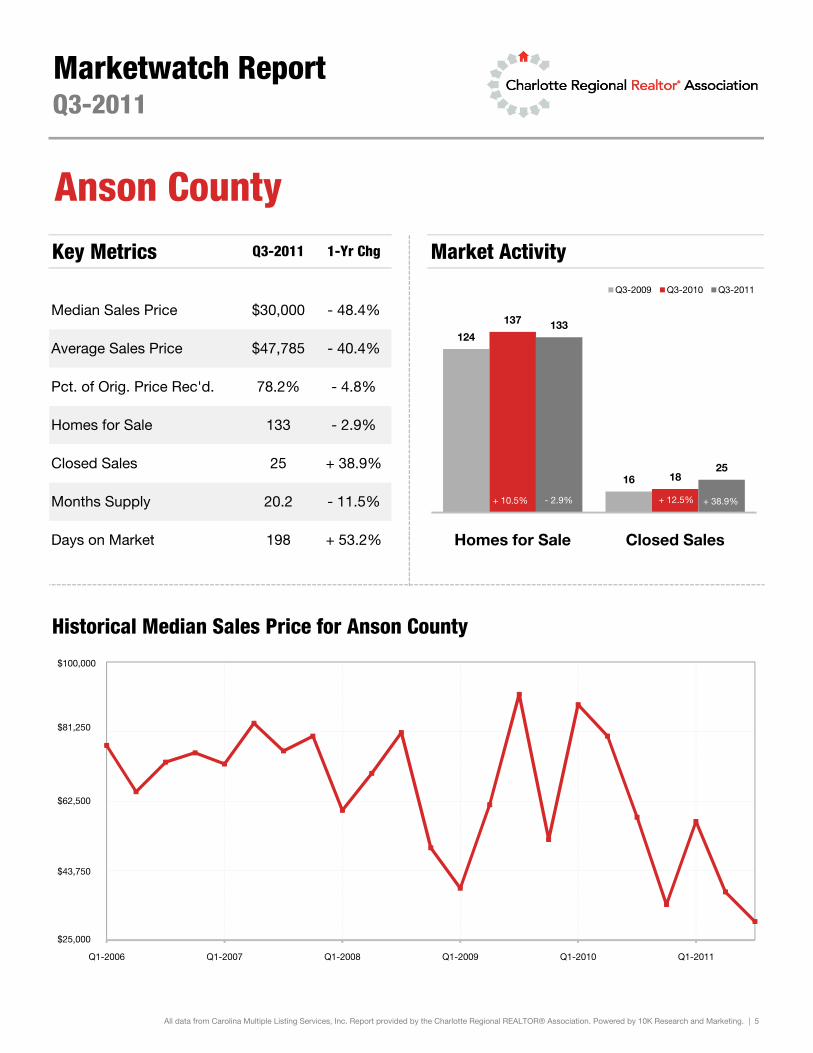
Pct. of Orig. Price Rec'd. 78.2% - 4.8%
Homes for Sale 133 - 2.9%
Closed Sales 25 + 38.9%
Months Supply 20.2 - 11.5%
Days on Market 198 + 53 2%
- 40.4%
Marketwatch ReportQ3-2011
Key Metrics Q3-2011 1-Yr Chg Market Activity
Anson County
Median Sales Price $30,000 - 48.4%
Average Sales Price $47,785124
16
137
18
133
25
Homes for Sale Closed Sales
Q3-2009 Q3-2010 Q3-2011
+ 10.5% - 2.9% + 12.5% + 38.9%
All data from Carolina Multiple Listing Services, Inc. Report provided by the Charlotte Regional REALTOR® Association. Powered by 10K Research and Marketing. | 5
Days on Market 198 + 53.2%
Historical Median Sales Price for Anson County
Homes for Sale Closed Sales
Q1-2006 Q1-2007 Q1-2008 Q1-2009 Q1-2010 Q1-2011
$100,000
$81,250
$62,500
$43,750
$25,000
Q3-2011 1-Yr Chg Q3-2011 1-Yr Chg Q3-2011 1-Yr Chg Q3-2011 1-Yr Chg
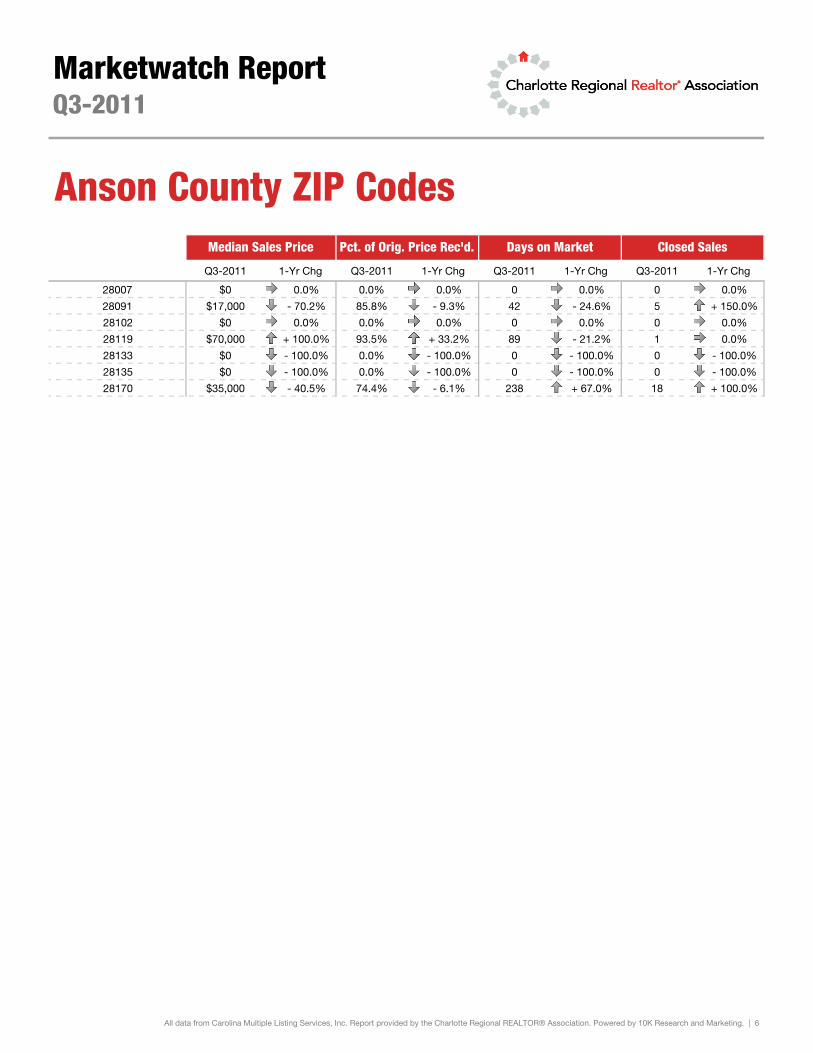
28007 $0 0.0% 0.0% 0.0% 0 0.0% 0 0.0%
28091 $17,000 - 70.2% 85.8% - 9.3% 42 - 24.6% 5 + 150.0%
28102 $0 0.0% 0.0% 0.0% 0 0.0% 0 0.0%
28119 $70,000 + 100.0% 93.5% + 33.2% 89 - 21.2% 1 0.0%
28133 $0 - 100.0% 0.0% - 100.0% 0 - 100.0% 0 - 100.0%
28135 $0 - 100.0% 0.0% - 100.0% 0 - 100.0% 0 - 100.0%
28170 $35,000 - 40.5% 74.4% - 6.1% 238 + 67.0% 18 + 100.0%
Marketwatch Report
Closed SalesMedian Sales Price Pct. of Orig. Price Rec'd. Days on Market
Q3-2011
Anson County ZIP Codes
All data from Carolina Multiple Listing Services, Inc. Report provided by the Charlotte Regional REALTOR® Association. Powered by 10K Research and Marketing. | 6
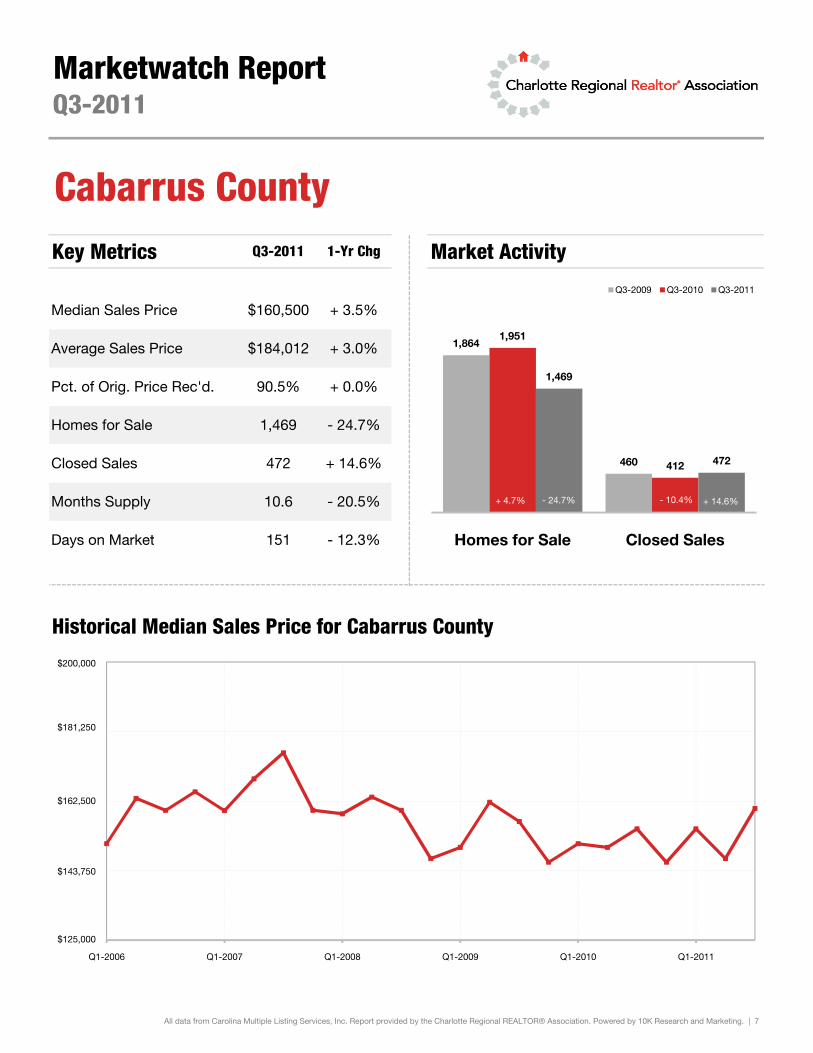
Pct. of Orig. Price Rec'd. 90.5% + 0.0%
Homes for Sale 1,469 - 24.7%
Closed Sales 472 + 14.6%
Months Supply 10.6 - 20.5%
Days on Market 151 - 12 3%
+ 3.0%
Marketwatch ReportQ3-2011
Key Metrics Q3-2011 1-Yr Chg Market Activity
Cabarrus County
Median Sales Price $160,500 + 3.5%
Average Sales Price $184,012 1,864
460
1,951
412
1,469
472
Homes for Sale Closed Sales
Q3-2009 Q3-2010 Q3-2011
+ 4.7% - 24.7% - 10.4% + 14.6%
All data from Carolina Multiple Listing Services, Inc. Report provided by the Charlotte Regional REALTOR® Association. Powered by 10K Research and Marketing. | 7
Days on Market 151 - 12.3%
Historical Median Sales Price for Cabarrus County
Homes for Sale Closed Sales
Q1-2006 Q1-2007 Q1-2008 Q1-2009 Q1-2010 Q1-2011
$200,000
$181,250
$162,500
$143,750
$125,000

Q3-2011 1-Yr Chg Q3-2011 1-Yr Chg Q3-2011 1-Yr Chg Q3-2011 1-Yr Chg
28025 $115,000 - 9.8% 88.9% - 1.3% 145 - 5.6% 95 - 7.8%
28026 $0 0.0% 0.0% 0.0% 0 0.0% 0 0.0%
28027 $196,000 + 8.3% 90.8% - 0.8% 152 - 25.1% 168 + 7.7%
28036 $246,031 + 52.5% 95.5% + 5.0% 186 - 6.5% 20 + 100.0%
28071 $152,500 0.0% 77.6% 0.0% 221 0.0% 2 0.0%
28075 $215,000 - 14.7% 92.4% - 1.4% 148 - 22.1% 53 + 43.2%
28081 $104,950 - 1.7% 88.8% + 2.7% 153 + 18.0% 33 + 26.9%
28082 $0 0.0% 0.0% 0.0% 0 0.0% 0 0.0%
28083 $76,000 - 8.1% 88.0% + 1.5% 148 + 20.0% 38 + 22.6%
28107 $167,500 - 12.8% 95.0% + 18.2% 162 - 29.2% 17 + 88.9%
28124 $225,000 + 104.5% 81.8% - 7.4% 123 + 10.9% 7 + 133.3%
28138 $0 0.0% 0.0% 0.0% 0 0.0% 0 0.0%
28215 $77,305 - 27.8% 91.8% - 3.2% 165 + 2.8% 6 - 14.3%
Marketwatch Report
Closed SalesMedian Sales Price Pct. of Orig. Price Rec'd. Days on Market
Q3-2011
Cabarrus County ZIP Codes
All data from Carolina Multiple Listing Services, Inc. Report provided by the Charlotte Regional REALTOR® Association. Powered by 10K Research and Marketing. | 8

Pct. of Orig. Price Rec'd. 88.0% - 0.3%
Homes for Sale 1,493 - 19.0%
Closed Sales 413 + 4.0%
Months Supply 11.7 - 7.5%
Days on Market 167 + 10 7%
- 5.5%
Marketwatch ReportQ3-2011
Key Metrics Q3-2011 1-Yr Chg Market Activity
Gaston County
Median Sales Price $110,000 + 0.9%
Average Sales Price $129,258
1,807
440
1,843
397
1,493
413
Homes for Sale Closed Sales
Q3-2009 Q3-2010 Q3-2011
+ 2.0% - 19.0% - 9.8% + 4.0%
All data from Carolina Multiple Listing Services, Inc. Report provided by the Charlotte Regional REALTOR® Association. Powered by 10K Research and Marketing. | 9
Days on Market 167 + 10.7%
Historical Median Sales Price for Gaston County
Homes for Sale Closed Sales
Q1-2006 Q1-2007 Q1-2008 Q1-2009 Q1-2010 Q1-2011
$150,000
$131,250
$112,500
$93,750
$75,000

Q3-2011 1-Yr Chg Q3-2011 1-Yr Chg Q3-2011 1-Yr Chg Q3-2011 1-Yr Chg
28006 $0 0.0% 0.0% 0.0% 0 0.0% 0 0.0%
28012 $185,000 + 8.0% 89.2% - 1.1% 151 - 17.6% 65 + 30.0%
28016 $45,600 - 34.2% 81.9% - 4.5% 164 - 1.8% 26 + 44.4%
28021 $26,450 - 63.9% 82.5% - 2.6% 234 + 69.9% 8 - 42.9%
28032 $94,900 - 57.5% 91.2% + 0.5% 170 + 54.1% 7 + 40.0%
28033 $114,000 + 52.0% 84.4% + 6.1% 148 + 4.9% 6 + 50.0%
28034 $138,099 + 64.5% 90.4% - 1.8% 139 + 27.4% 20 - 16.7%
28052 $73,500 + 22.7% 85.7% + 1.5% 172 + 16.0% 60 + 11.1%
28053 $0 0.0% 0.0% 0.0% 0 0.0% 0 0.0%
28054 $110,500 + 38.3% 89.3% + 4.5% 169 + 29.4% 63 - 13.7%
28055 $0 0.0% 0.0% 0.0% 0 0.0% 0 0.0%
28056 $131,450 - 14.4% 87.8% - 4.9% 189 + 18.2% 64 - 9.9%
28077 $54,000 0.0% 94.5% 0.0% 70 0.0% 1 0.0%
28092 $123,350 + 8.4% 98.8% + 28.4% 76 - 75.0% 2 - 50.0%
28098 $115,200 + 1.9% 92.7% + 0.2% 120 - 47.3% 12 + 140.0%
28101 $219,600 0.0% 98.1% 0.0% 161 0.0% 1 0.0%
Marketwatch Report
Closed SalesMedian Sales Price Pct. of Orig. Price Rec'd. Days on Market
Q3-2011
Gaston County ZIP Codes
28101 $219,600 0.0% 98.1% 0.0% 161 0.0% 1 0.0%
28120 $140,445 - 9.4% 89.8% + 0.8% 179 + 14.5% 54 - 11.5%
28164 $99,850 + 17.6% 83.9% - 7.0% 161 + 79.2% 18 + 50.0%
All data from Carolina Multiple Listing Services, Inc. Report provided by the Charlotte Regional REALTOR® Association. Powered by 10K Research and Marketing. | 10

Pct. of Orig. Price Rec'd. 88.4% - 1.7%
Homes for Sale 1,577 - 24.0%
Closed Sales 416 + 10.9%
Months Supply 12.5 - 21.7%
Days on Market 168 + 8 3%
- 4.2%
Marketwatch ReportQ3-2011
Key Metrics Q3-2011 1-Yr Chg Market Activity
Iredell County
Median Sales Price $180,000 + 3.7%
Average Sales Price $242,418
2,252
408
2,075
375
1,577
416
Homes for Sale Closed Sales
Q3-2009 Q3-2010 Q3-2011
- 7.9% - 24.0% - 8.1% + 10.9%
All data from Carolina Multiple Listing Services, Inc. Report provided by the Charlotte Regional REALTOR® Association. Powered by 10K Research and Marketing. | 11
Days on Market 168 + 8.3%
Historical Median Sales Price for Iredell County
Homes for Sale Closed Sales
Q1-2006 Q1-2007 Q1-2008 Q1-2009 Q1-2010 Q1-2011
$200,000
$181,250
$162,500
$143,750
$125,000

Q3-2011 1-Yr Chg Q3-2011 1-Yr Chg Q3-2011 1-Yr Chg Q3-2011 1-Yr Chg
27013 $67,800 - 67.2% 87.8% + 2.3% 189 - 20.4% 2 0.0%
27020 $0 0.0% 0.0% 0.0% 0 0.0% 0 0.0%
28010 $0 0.0% 0.0% 0.0% 0 0.0% 0 0.0%
28115 $179,615 + 23.9% 91.1% + 1.9% 148 + 3.1% 99 + 11.2%
28117 $317,500 - 9.9% 90.0% - 0.8% 175 + 5.6% 140 + 11.1%
28123 $0 0.0% 0.0% 0.0% 0 0.0% 0 0.0%
28125 $0 - 100.0% 0.0% - 100.0% 0 - 100.0% 0 - 100.0%
28166 $161,500 - 41.7% 87.5% - 7.3% 154 + 10.3% 28 + 16.7%
28625 $123,500 - 1.2% 86.9% - 4.9% 195 + 18.6% 69 + 21.1%
28634 $81,175 + 65.7% 87.9% + 6.3% 113 - 42.4% 2 - 75.0%
28636 $0 0.0% 0.0% 0.0% 0 0.0% 0 0.0%
28660 $85,000 + 47.8% 68.0% - 29.2% 526 + 436.7% 1 0.0%
28677 $78,900 - 11.2% 82.8% - 3.4% 161 + 13.7% 71 + 18.3%
28687 $0 0.0% 0.0% 0.0% 0 0.0% 0 0.0%
28688 $0 0.0% 0.0% 0.0% 0 0.0% 0 0.0%
28689 $0 - 100.0% 0.0% - 100.0% 0 - 100.0% 0 - 100.0%
Marketwatch Report
Closed SalesMedian Sales Price Pct. of Orig. Price Rec'd. Days on Market
Q3-2011
Iredell County ZIP Codes
28689 $0 100.0% 0.0% 100.0% 0 100.0% 0 100.0%
28699 $0 0.0% 0.0% 0.0% 0 0.0% 0 0.0%
All data from Carolina Multiple Listing Services, Inc. Report provided by the Charlotte Regional REALTOR® Association. Powered by 10K Research and Marketing. | 12

Pct. of Orig. Price Rec'd. 88.7% + 1.0%
Homes for Sale 699 - 13.0%
Closed Sales 159 + 18.7%
Months Supply 13.3 - 15.4%
Days on Market 159 - 4 8%
- 3.4%
Marketwatch ReportQ3-2011
Key Metrics Q3-2011 1-Yr Chg Market Activity
Lincoln County
Median Sales Price $152,500 - 6.7%
Average Sales Price $199,424
819
182
803
134
699
159
Homes for Sale Closed Sales
Q3-2009 Q3-2010 Q3-2011
- 2.0% - 13.0% - 26.4% + 18.7%
All data from Carolina Multiple Listing Services, Inc. Report provided by the Charlotte Regional REALTOR® Association. Powered by 10K Research and Marketing. | 13
Days on Market 159 - 4.8%
Historical Median Sales Price for Lincoln County
Homes for Sale Closed Sales
Q1-2006 Q1-2007 Q1-2008 Q1-2009 Q1-2010 Q1-2011
$200,000
$175,000
$150,000
$125,000
$100,000
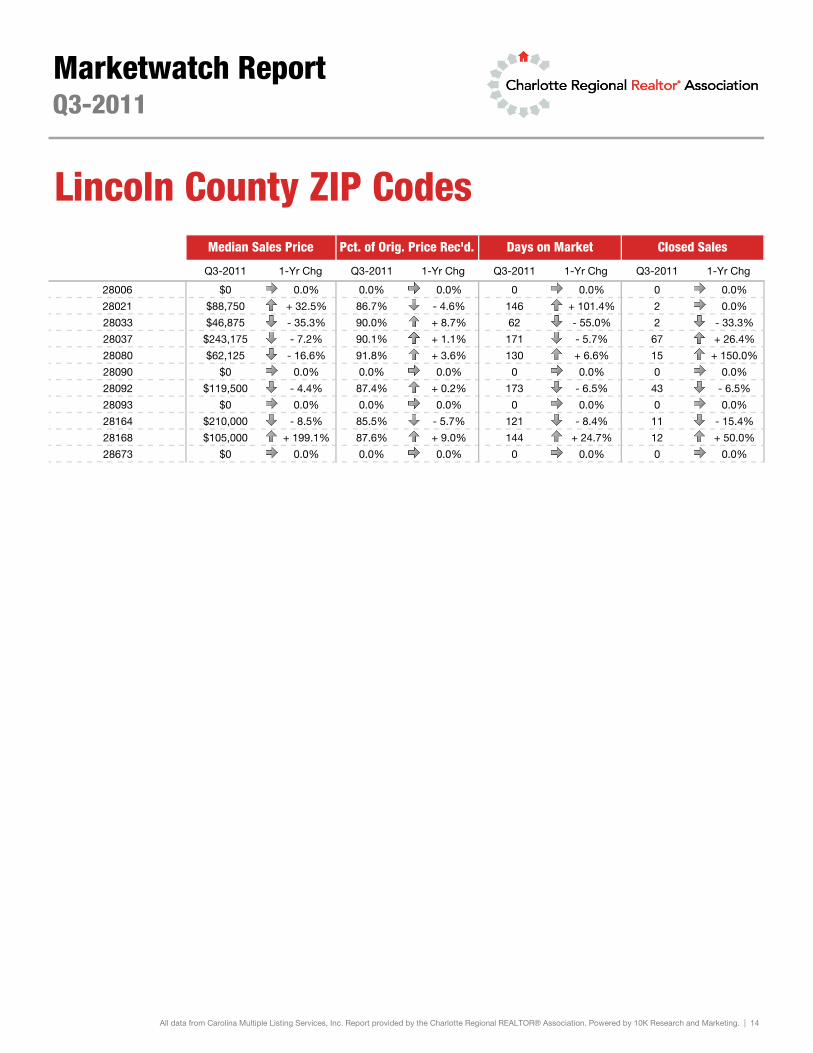
Q3-2011 1-Yr Chg Q3-2011 1-Yr Chg Q3-2011 1-Yr Chg Q3-2011 1-Yr Chg
28006 $0 0.0% 0.0% 0.0% 0 0.0% 0 0.0%
28021 $88,750 + 32.5% 86.7% - 4.6% 146 + 101.4% 2 0.0%
28033 $46,875 - 35.3% 90.0% + 8.7% 62 - 55.0% 2 - 33.3%
28037 $243,175 - 7.2% 90.1% + 1.1% 171 - 5.7% 67 + 26.4%
28080 $62,125 - 16.6% 91.8% + 3.6% 130 + 6.6% 15 + 150.0%
28090 $0 0.0% 0.0% 0.0% 0 0.0% 0 0.0%
28092 $119,500 - 4.4% 87.4% + 0.2% 173 - 6.5% 43 - 6.5%
28093 $0 0.0% 0.0% 0.0% 0 0.0% 0 0.0%
28164 $210,000 - 8.5% 85.5% - 5.7% 121 - 8.4% 11 - 15.4%
28168 $105,000 + 199.1% 87.6% + 9.0% 144 + 24.7% 12 + 50.0%
28673 $0 0.0% 0.0% 0.0% 0 0.0% 0 0.0%
Marketwatch Report
Closed SalesMedian Sales Price Pct. of Orig. Price Rec'd. Days on Market
Q3-2011
Lincoln County ZIP Codes
All data from Carolina Multiple Listing Services, Inc. Report provided by the Charlotte Regional REALTOR® Association. Powered by 10K Research and Marketing. | 14

Pct. of Orig. Price Rec'd. 90.1% + 0.3%
Homes for Sale 8,131 - 28.3%
Closed Sales 2,838 + 15.2%
Months Supply 9.4 - 25.8%
Days on Market 149 + 2 5%
- 8.2%
Marketwatch ReportQ3-2011
Key Metrics Q3-2011 1-Yr Chg Market Activity
Mecklenburg County
Median Sales Price $160,000 - 4.8%
Average Sales Price $217,311
11,553
3,086
11,341
2,463
8,131
2,838
Homes for Sale Closed Sales
Q3-2009 Q3-2010 Q3-2011
- 1.8% - 28.3% - 20.2% + 15.2%
All data from Carolina Multiple Listing Services, Inc. Report provided by the Charlotte Regional REALTOR® Association. Powered by 10K Research and Marketing. | 15
Days on Market 149 + 2.5%
Historical Median Sales Price for Mecklenburg County
Homes for Sale Closed Sales
Q1-2006 Q1-2007 Q1-2008 Q1-2009 Q1-2010 Q1-2011
$200,000
$187,500
$175,000
$162,500
$150,000
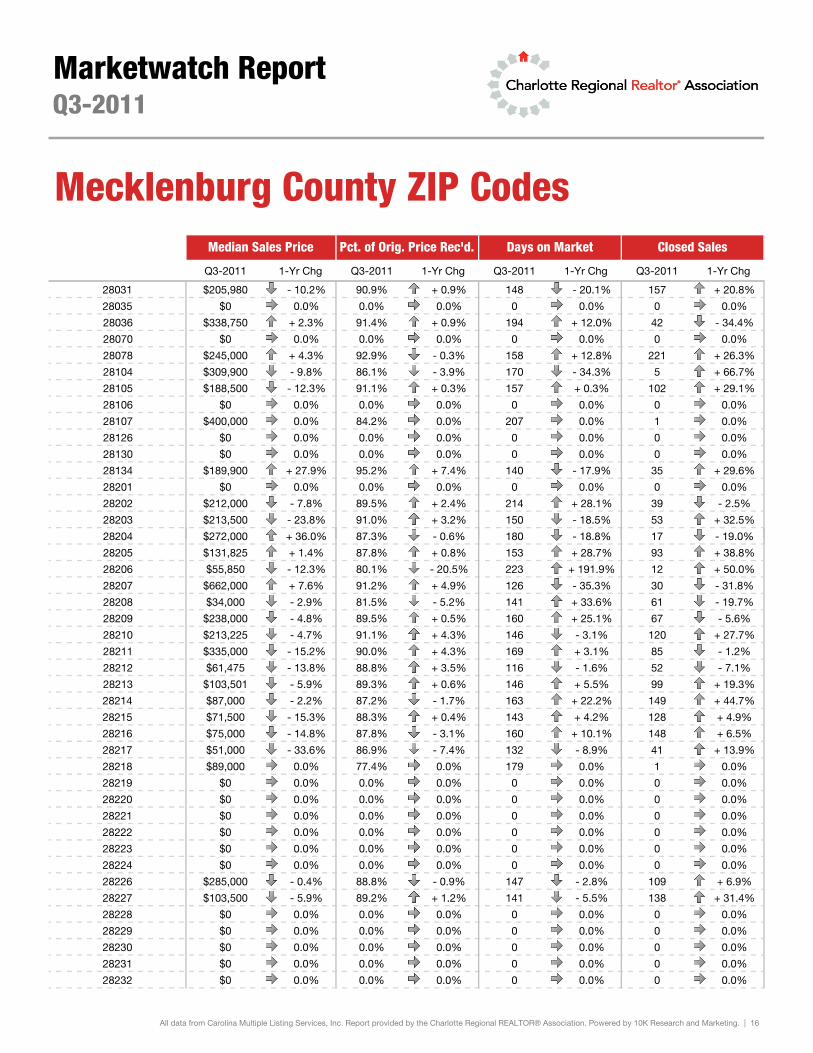
Q3-2011 1-Yr Chg Q3-2011 1-Yr Chg Q3-2011 1-Yr Chg Q3-2011 1-Yr Chg
28031 $205,980 - 10.2% 90.9% + 0.9% 148 - 20.1% 157 + 20.8%
28035 $0 0.0% 0.0% 0.0% 0 0.0% 0 0.0%
28036 $338,750 + 2.3% 91.4% + 0.9% 194 + 12.0% 42 - 34.4%
28070 $0 0.0% 0.0% 0.0% 0 0.0% 0 0.0%
28078 $245,000 + 4.3% 92.9% - 0.3% 158 + 12.8% 221 + 26.3%
28104 $309,900 - 9.8% 86.1% - 3.9% 170 - 34.3% 5 + 66.7%
28105 $188,500 - 12.3% 91.1% + 0.3% 157 + 0.3% 102 + 29.1%
28106 $0 0.0% 0.0% 0.0% 0 0.0% 0 0.0%
28107 $400,000 0.0% 84.2% 0.0% 207 0.0% 1 0.0%
28126 $0 0.0% 0.0% 0.0% 0 0.0% 0 0.0%
28130 $0 0.0% 0.0% 0.0% 0 0.0% 0 0.0%
28134 $189,900 + 27.9% 95.2% + 7.4% 140 - 17.9% 35 + 29.6%
28201 $0 0.0% 0.0% 0.0% 0 0.0% 0 0.0%
28202 $212,000 - 7.8% 89.5% + 2.4% 214 + 28.1% 39 - 2.5%
28203 $213,500 - 23.8% 91.0% + 3.2% 150 - 18.5% 53 + 32.5%
28204 $272,000 + 36.0% 87.3% - 0.6% 180 - 18.8% 17 - 19.0%
Marketwatch Report
Closed SalesMedian Sales Price Pct. of Orig. Price Rec'd. Days on Market
Q3-2011
Mecklenburg County ZIP Codes
28204 $272,000 + 36.0% 87.3% 0.6% 180 18.8% 17 19.0%
28205 $131,825 + 1.4% 87.8% + 0.8% 153 + 28.7% 93 + 38.8%
28206 $55,850 - 12.3% 80.1% - 20.5% 223 + 191.9% 12 + 50.0%
28207 $662,000 + 7.6% 91.2% + 4.9% 126 - 35.3% 30 - 31.8%
28208 $34,000 - 2.9% 81.5% - 5.2% 141 + 33.6% 61 - 19.7%
28209 $238,000 - 4.8% 89.5% + 0.5% 160 + 25.1% 67 - 5.6%
28210 $213,225 - 4.7% 91.1% + 4.3% 146 - 3.1% 120 + 27.7%
28211 $335,000 - 15.2% 90.0% + 4.3% 169 + 3.1% 85 - 1.2%
28212 $61,475 - 13.8% 88.8% + 3.5% 116 - 1.6% 52 - 7.1%
28213 $103,501 - 5.9% 89.3% + 0.6% 146 + 5.5% 99 + 19.3%
28214 $87,000 - 2.2% 87.2% - 1.7% 163 + 22.2% 149 + 44.7%
28215 $71,500 - 15.3% 88.3% + 0.4% 143 + 4.2% 128 + 4.9%
28216 $75,000 - 14.8% 87.8% - 3.1% 160 + 10.1% 148 + 6.5%
28217 $51,000 - 33.6% 86.9% - 7.4% 132 - 8.9% 41 + 13.9%
28218 $89,000 0.0% 77.4% 0.0% 179 0.0% 1 0.0%
28219 $0 0.0% 0.0% 0.0% 0 0.0% 0 0.0%
28220 $0 0.0% 0.0% 0.0% 0 0.0% 0 0.0%
28221 $0 0.0% 0.0% 0.0% 0 0.0% 0 0.0%
28222 $0 0.0% 0.0% 0.0% 0 0.0% 0 0.0%
28223 $0 0.0% 0.0% 0.0% 0 0.0% 0 0.0%
28224 $0 0.0% 0.0% 0.0% 0 0.0% 0 0.0%
28226 $285,000 - 0.4% 88.8% - 0.9% 147 - 2.8% 109 + 6.9%
28227 $103,500 - 5.9% 89.2% + 1.2% 141 - 5.5% 138 + 31.4%
28228 $0 0.0% 0.0% 0.0% 0 0.0% 0 0.0%
28229 $0 0.0% 0.0% 0.0% 0 0.0% 0 0.0%
28230 $0 0.0% 0.0% 0.0% 0 0.0% 0 0.0%
28231 $0 0.0% 0.0% 0.0% 0 0.0% 0 0.0%
28232 $0 0.0% 0.0% 0.0% 0 0.0% 0 0.0%
All data from Carolina Multiple Listing Services, Inc. Report provided by the Charlotte Regional REALTOR® Association. Powered by 10K Research and Marketing. | 16
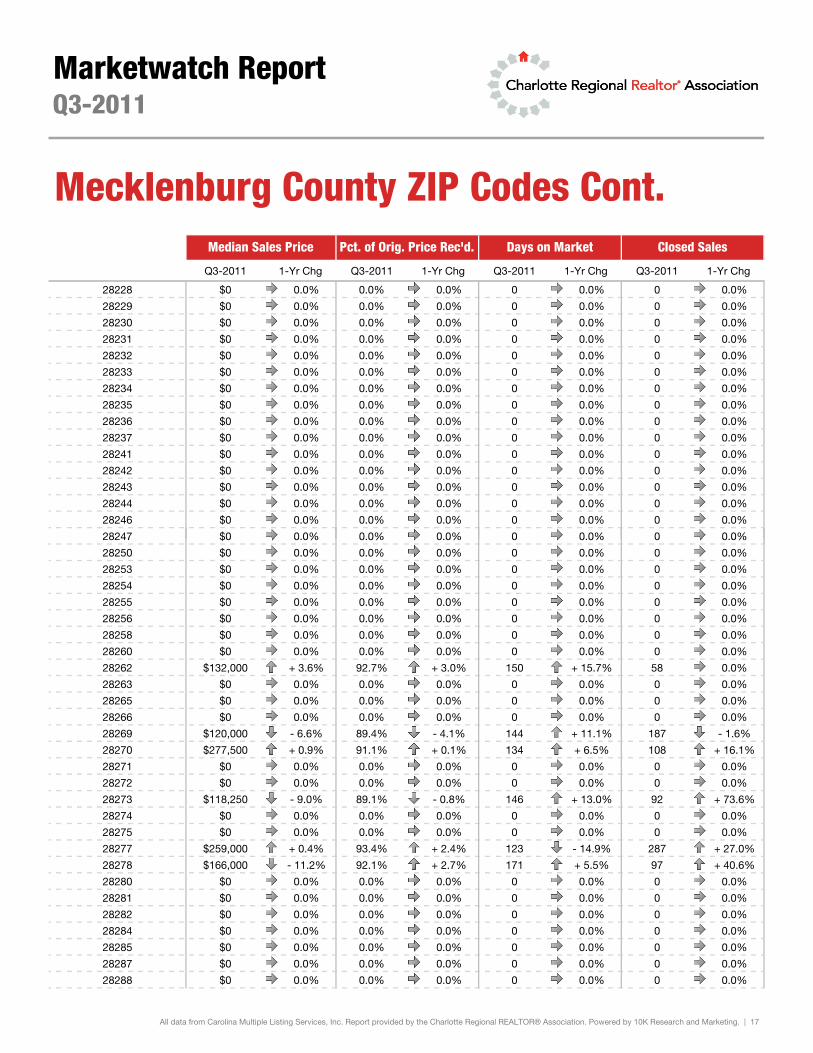
Q3-2011 1-Yr Chg Q3-2011 1-Yr Chg Q3-2011 1-Yr Chg Q3-2011 1-Yr Chg
28228 $0 0.0% 0.0% 0.0% 0 0.0% 0 0.0%
28229 $0 0.0% 0.0% 0.0% 0 0.0% 0 0.0%
28230 $0 0.0% 0.0% 0.0% 0 0.0% 0 0.0%
28231 $0 0.0% 0.0% 0.0% 0 0.0% 0 0.0%
28232 $0 0.0% 0.0% 0.0% 0 0.0% 0 0.0%
28233 $0 0.0% 0.0% 0.0% 0 0.0% 0 0.0%
28234 $0 0.0% 0.0% 0.0% 0 0.0% 0 0.0%
28235 $0 0.0% 0.0% 0.0% 0 0.0% 0 0.0%
28236 $0 0.0% 0.0% 0.0% 0 0.0% 0 0.0%
28237 $0 0.0% 0.0% 0.0% 0 0.0% 0 0.0%
28241 $0 0.0% 0.0% 0.0% 0 0.0% 0 0.0%
28242 $0 0.0% 0.0% 0.0% 0 0.0% 0 0.0%
28243 $0 0.0% 0.0% 0.0% 0 0.0% 0 0.0%
28244 $0 0.0% 0.0% 0.0% 0 0.0% 0 0.0%
28246 $0 0.0% 0.0% 0.0% 0 0.0% 0 0.0%
28247 $0 0.0% 0.0% 0.0% 0 0.0% 0 0.0%
Marketwatch ReportQ3-2011
Median Sales Price Pct. of Orig. Price Rec'd. Days on Market Closed Sales
Mecklenburg County ZIP Codes Cont.
28247 $0 0.0% 0.0% 0.0% 0 0.0% 0 0.0%
28250 $0 0.0% 0.0% 0.0% 0 0.0% 0 0.0%
28253 $0 0.0% 0.0% 0.0% 0 0.0% 0 0.0%
28254 $0 0.0% 0.0% 0.0% 0 0.0% 0 0.0%
28255 $0 0.0% 0.0% 0.0% 0 0.0% 0 0.0%
28256 $0 0.0% 0.0% 0.0% 0 0.0% 0 0.0%
28258 $0 0.0% 0.0% 0.0% 0 0.0% 0 0.0%
28260 $0 0.0% 0.0% 0.0% 0 0.0% 0 0.0%
28262 $132,000 + 3.6% 92.7% + 3.0% 150 + 15.7% 58 0.0%
28263 $0 0.0% 0.0% 0.0% 0 0.0% 0 0.0%
28265 $0 0.0% 0.0% 0.0% 0 0.0% 0 0.0%
28266 $0 0.0% 0.0% 0.0% 0 0.0% 0 0.0%
28269 $120,000 - 6.6% 89.4% - 4.1% 144 + 11.1% 187 - 1.6%
28270 $277,500 + 0.9% 91.1% + 0.1% 134 + 6.5% 108 + 16.1%
28271 $0 0.0% 0.0% 0.0% 0 0.0% 0 0.0%
28272 $0 0.0% 0.0% 0.0% 0 0.0% 0 0.0%
28273 $118,250 - 9.0% 89.1% - 0.8% 146 + 13.0% 92 + 73.6%
28274 $0 0.0% 0.0% 0.0% 0 0.0% 0 0.0%
28275 $0 0.0% 0.0% 0.0% 0 0.0% 0 0.0%
28277 $259,000 + 0.4% 93.4% + 2.4% 123 - 14.9% 287 + 27.0%
28278 $166,000 - 11.2% 92.1% + 2.7% 171 + 5.5% 97 + 40.6%
28280 $0 0.0% 0.0% 0.0% 0 0.0% 0 0.0%
28281 $0 0.0% 0.0% 0.0% 0 0.0% 0 0.0%
28282 $0 0.0% 0.0% 0.0% 0 0.0% 0 0.0%
28284 $0 0.0% 0.0% 0.0% 0 0.0% 0 0.0%
28285 $0 0.0% 0.0% 0.0% 0 0.0% 0 0.0%
28287 $0 0.0% 0.0% 0.0% 0 0.0% 0 0.0%
28288 $0 0.0% 0.0% 0.0% 0 0.0% 0 0.0%
All data from Carolina Multiple Listing Services, Inc. Report provided by the Charlotte Regional REALTOR® Association. Powered by 10K Research and Marketing. | 17

Pct. of Orig. Price Rec'd. 80.6% + 1.6%
Homes for Sale 312 + 65.1%
Closed Sales 25 + 8.7%
Months Supply 58.2 + 64.1%
Days on Market 268 + 5 8%
- 21.7%
Marketwatch ReportQ3-2011
Key Metrics Q3-2011 1-Yr Chg Market Activity
Montgomery County
Median Sales Price $66,000 + 10.0%
Average Sales Price $153,320
152
23
189
23
312
25
Homes for Sale Closed Sales
Q3-2009 Q3-2010 Q3-2011
+ 24.3% + 65.1% 0.0% + 8.7%
All data from Carolina Multiple Listing Services, Inc. Report provided by the Charlotte Regional REALTOR® Association. Powered by 10K Research and Marketing. | 18
Days on Market 268 + 5.8%
Historical Median Sales Price for Montgomery County
Homes for Sale Closed Sales
Q1-2006 Q1-2007 Q1-2008 Q1-2009 Q1-2010 Q1-2011
$225,000
$175,000
$125,000
$75,000
$25,000

Q3-2011 1-Yr Chg Q3-2011 1-Yr Chg Q3-2011 1-Yr Chg Q3-2011 1-Yr Chg
27209 $0 0.0% 0.0% 0.0% 0 0.0% 0 0.0%
27229 $107,000 0.0% 89.5% 0.0% 21 0.0% 1 0.0%
27247 $0 0.0% 0.0% 0.0% 0 0.0% 0 0.0%
27281 $0 0.0% 0.0% 0.0% 0 0.0% 0 0.0%
27306 $232,500 + 121.4% 88.0% + 10.6% 153 - 23.8% 8 + 100.0%
27341 $0 0.0% 0.0% 0.0% 0 0.0% 0 0.0%
27356 $0 0.0% 0.0% 0.0% 0 0.0% 0 0.0%
27371 $86,500 + 50.4% 80.4% + 8.7% 33 - 71.1% 2 - 33.3%
28127 $51,000 - 15.1% 75.4% - 6.1% 405 + 38.3% 14 - 12.5%
Marketwatch Report
Closed SalesMedian Sales Price Pct. of Orig. Price Rec'd. Days on Market
Q3-2011
Montgomery County ZIP Codes
All data from Carolina Multiple Listing Services, Inc. Report provided by the Charlotte Regional REALTOR® Association. Powered by 10K Research and Marketing. | 19
Pct. of Orig. Price Rec'd. 86.8% + 0.8%
Homes for Sale 449 + 6.4%
Closed Sales 61 - 16.4%
Months Supply 23.8 + 37.5%
Days on Market 163 + 16 1%
- 11.5%
Marketwatch ReportQ3-2011
Key Metrics Q3-2011 1-Yr Chg Market Activity
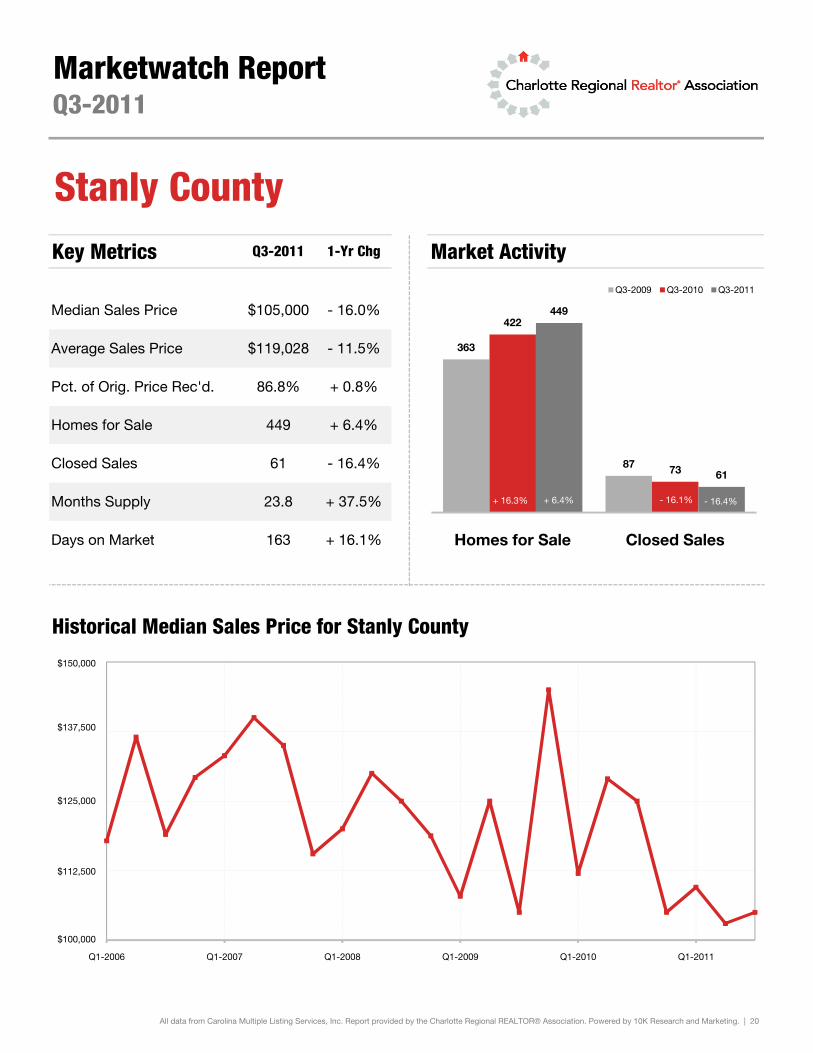
Stanly County
Median Sales Price $105,000 - 16.0%
Average Sales Price $119,028 363
87
422
73
449
61
Homes for Sale Closed Sales
Q3-2009 Q3-2010 Q3-2011
+ 16.3% + 6.4% - 16.1% - 16.4%
All data from Carolina Multiple Listing Services, Inc. Report provided by the Charlotte Regional REALTOR® Association. Powered by 10K Research and Marketing. | 20
Days on Market 163 + 16.1%
Historical Median Sales Price for Stanly County
Homes for Sale Closed Sales
Q1-2006 Q1-2007 Q1-2008 Q1-2009 Q1-2010 Q1-2011
$150,000
$137,500
$125,000
$112,500
$100,000

Q3-2011 1-Yr Chg Q3-2011 1-Yr Chg Q3-2011 1-Yr Chg Q3-2011 1-Yr Chg
28001 $92,213 + 3.7% 86.0% + 0.3% 179 + 8.4% 25 - 24.2%
28002 $0 0.0% 0.0% 0.0% 0 0.0% 0 0.0%
28009 $0 - 100.0% 0.0% - 100.0% 0 - 100.0% 0 - 100.0%
28071 $0 0.0% 0.0% 0.0% 0 0.0% 0 0.0%
28097 $135,750 - 28.6% 83.9% - 10.5% 179 + 63.9% 7 - 22.2%
28107 $0 0.0% 0.0% 0.0% 0 0.0% 0 0.0%
28109 $120,000 0.0% 87.9% 0.0% 109 0.0% 1 0.0%
28124 $116,000 + 44.6% 97.5% + 93.9% 90 - 50.5% 1 - 50.0%
28127 $104,500 - 40.1% 87.5% - 9.4% 256 + 76.8% 3 0.0%
28128 $81,750 - 3.8% 83.5% - 6.5% 164 + 38.0% 10 - 9.1%
28129 $105,000 - 29.0% 99.4% + 10.3% 134 + 22.1% 3 - 66.7%
28137 $117,000 + 98.3% 92.1% - 7.9% 69 - 15.2% 6 + 500.0%
28163 $109,911 - 15.5% 84.0% + 22.1% 161 + 23.8% 5 + 25.0%
Marketwatch Report
Closed SalesMedian Sales Price Pct. of Orig. Price Rec'd. Days on Market
Q3-2011
Stanly County ZIP Codes
All data from Carolina Multiple Listing Services, Inc. Report provided by the Charlotte Regional REALTOR® Association. Powered by 10K Research and Marketing. | 21
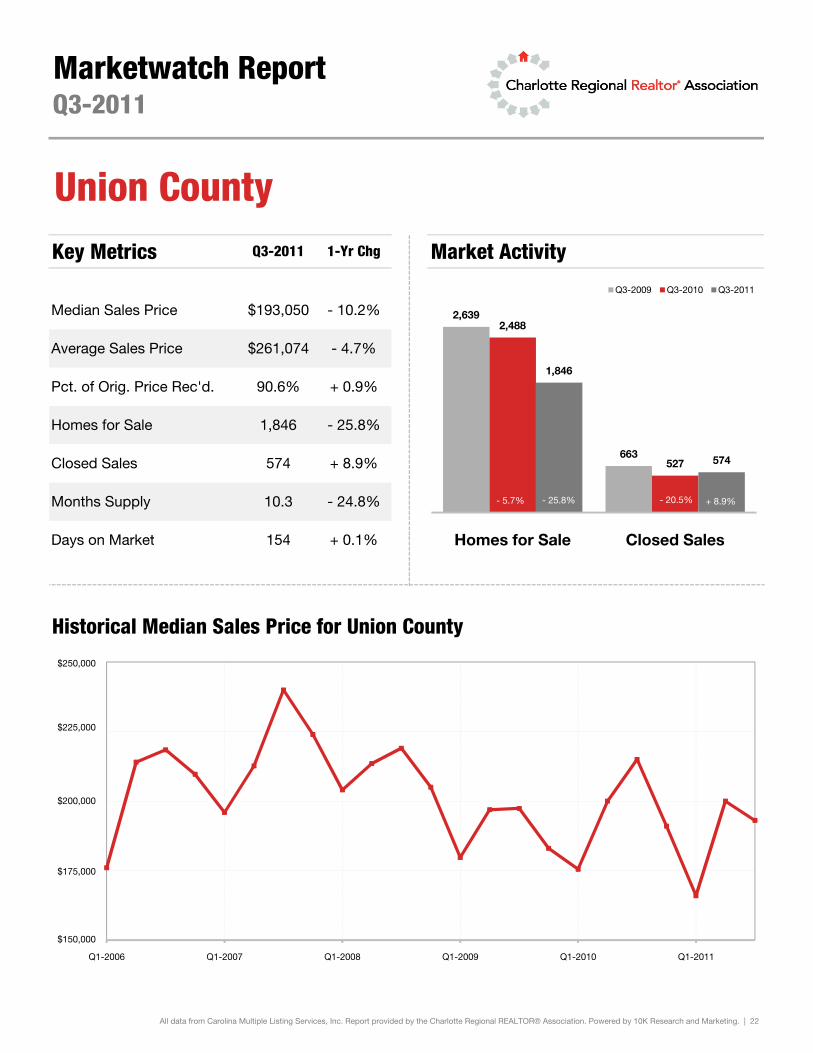
Pct. of Orig. Price Rec'd. 90.6% + 0.9%
Homes for Sale 1,846 - 25.8%
Closed Sales 574 + 8.9%
Months Supply 10.3 - 24.8%
Days on Market 154 + 0 1%
- 4.7%
Marketwatch ReportQ3-2011
Key Metrics Q3-2011 1-Yr Chg Market Activity
Union County
Median Sales Price $193,050 - 10.2%
Average Sales Price $261,074
2,639
663
2,488
527
1,846
574
Homes for Sale Closed Sales
Q3-2009 Q3-2010 Q3-2011
- 5.7% - 25.8% - 20.5% + 8.9%
All data from Carolina Multiple Listing Services, Inc. Report provided by the Charlotte Regional REALTOR® Association. Powered by 10K Research and Marketing. | 22
Days on Market 154 + 0.1%
Historical Median Sales Price for Union County
Homes for Sale Closed Sales
Q1-2006 Q1-2007 Q1-2008 Q1-2009 Q1-2010 Q1-2011
$250,000
$225,000
$200,000
$175,000
$150,000

Q3-2011 1-Yr Chg Q3-2011 1-Yr Chg Q3-2011 1-Yr Chg Q3-2011 1-Yr Chg
28079 $152,750 + 0.5% 92.8% + 0.6% 139 + 13.4% 98 + 15.3%
28103 $111,000 - 3.5% 81.9% - 0.8% 165 + 3.3% 15 + 36.4%
28104 $309,000 - 4.9% 91.3% + 2.4% 160 - 6.5% 109 + 3.8%
28105 $0 - 100.0% 0.0% - 100.0% 0 - 100.0% 0 - 100.0%
28108 $112,000 0.0% 77.2% 0.0% 123 0.0% 1 0.0%
28110 $129,000 - 7.9% 90.0% + 0.9% 155 - 1.7% 98 + 19.5%
28111 $0 0.0% 0.0% 0.0% 0 0.0% 0 0.0%
28112 $90,000 - 16.7% 84.2% - 2.9% 162 + 6.2% 38 + 11.8%
28133 $0 0.0% 0.0% 0.0% 0 0.0% 0 0.0%
28173 $334,751 + 4.0% 92.2% + 2.0% 148 - 3.6% 198 + 0.5%
28174 $73,625 - 33.3% 82.5% - 7.3% 225 + 32.2% 16 + 100.0%
Marketwatch Report
Closed SalesMedian Sales Price Pct. of Orig. Price Rec'd. Days on Market
Q3-2011
Union County ZIP Codes
All data from Carolina Multiple Listing Services, Inc. Report provided by the Charlotte Regional REALTOR® Association. Powered by 10K Research and Marketing. | 23