Embed Size (px)
Citation preview

1
Introduction
1-2
Why study Financial Markets
and Institutions?
Markets and institutions are primary
channels to allocate capital in our society
Proper capital allocation leads to growth in:
Societal Wealth
Income
Economic opportunity
1-3
Financial Markets
Financial markets are one type of
structure through which funds flow
Financial markets can be distinguished
along two dimensions:
primary versus secondary markets
money versus capital markets
1-4
Primary versus Secondary
Markets
Primary markets
markets in which users of funds (e.g.,
corporations and governments) raise funds by
issuing financial instruments (e.g., stocks and
bonds)
Secondary markets
markets where financial instruments are traded
among investors (e.g., NYSE and Nasdaq)

2
1-5
Primary versus Secondary
Markets
1-6
Primary versus Secondary
Markets
Do secondary markets add value to
society or are they simply a legalized
form of gambling?
How does the existence of secondary markets
affect primary markets?
1-7
Money versus Capital Markets
Money markets
markets that trade debt securities with maturities of one
year or less (e.g., CDs and U.S. Treasury bills)
little or no risk of capital loss, but low return
Capital markets
markets that trade debt (bonds) and equity (stock)
instruments with maturities of more than one year
substantial risk of capital loss, but higher promised return
1-8
Foreign Exchange (FX) Markets
FX markets
trading one currency for another (e.g., dollar for yen)
Spot FX
the immediate exchange of currencies at current
exchange rates
Forward FX
the exchange of currencies in the future on a specific date
and at a pre-specified exchange rate
3
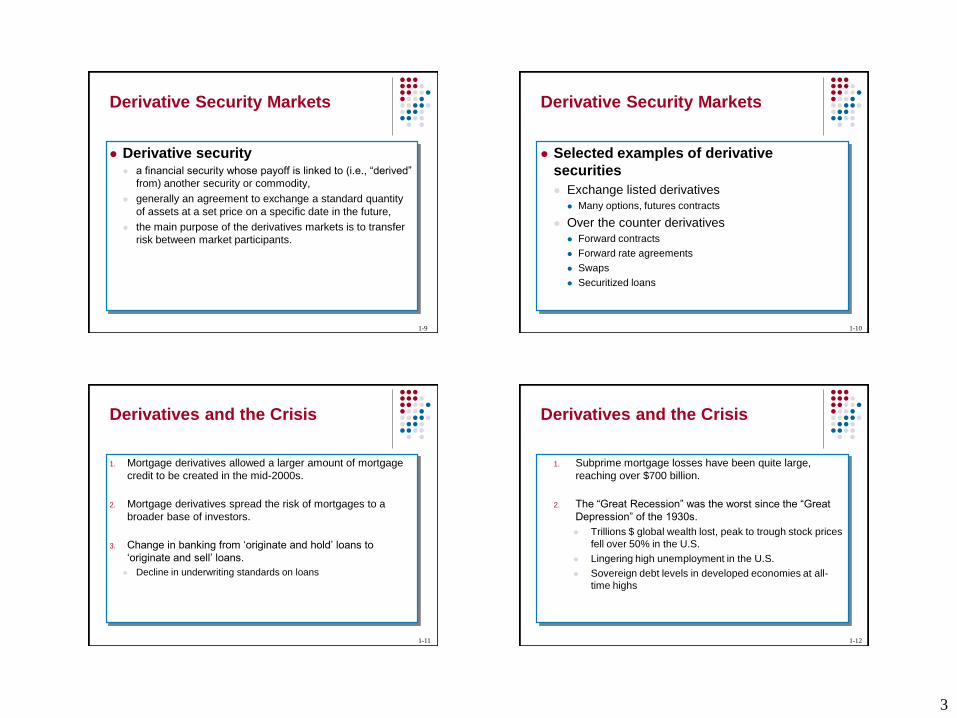
1-9
Derivative Security Markets
Derivative security a financial security whose payoff is linked to (i.e., “derived”
from) another security or commodity,
generally an agreement to exchange a standard quantity
of assets at a set price on a specific date in the future,
the main purpose of the derivatives markets is to transfer
risk between market participants.
1-10
Derivative Security Markets
Selected examples of derivative
securities
Exchange listed derivatives
Many options, futures contracts
Over the counter derivatives
Forward contracts
Forward rate agreements
Swaps
Securitized loans
1-11
Derivatives and the Crisis
1. Mortgage derivatives allowed a larger amount of mortgage
credit to be created in the mid-2000s.
2. Mortgage derivatives spread the risk of mortgages to a
broader base of investors.
3. Change in banking from ‘originate and hold’ loans to
‘originate and sell’ loans.
Decline in underwriting standards on loans
1-12
Derivatives and the Crisis
1. Subprime mortgage losses have been quite large,
reaching over $700 billion.
2. The “Great Recession” was the worst since the “Great
Depression” of the 1930s.
Trillions $ global wealth lost, peak to trough stock prices
fell over 50% in the U.S.
Lingering high unemployment in the U.S.
Sovereign debt levels in developed economies at all-
time highs

4
1-13
Financial Institutions (FIs)
Financial Institutions
institutions through which suppliers channel money to
users of funds
Financial Institutions are distinguished by:
whether they accept insured deposits,
depository versus non-depository financial institutions
whether they receive contractual payments from
customers.
1-14
Asset Size and Number of Selected
U.S. Financial Institutions 2010
INSTITUTION TOTAL ASSETS
(BILL $)
NUMBER OF
FEDERALLY INSURED
INSTITUTIONS
Commercial Banks $12,130 6,622
Savings Associations $ 1,253 1,138
Credit Unions $ 885 7,554
Insurance Companies $ 6,459
Private Pension Funds $ 5,661
Finance Companies $ 1,613
Mutual Funds $ 7,376
Money Market Mutual Funds $ 2,746
Data from September 2010, data sources include Federal Reserve Board, Flow of Funds Accounts, Levels Tables,
FDIC Stats at a Glance and the NCUA website. The mutual funds category excludes money market funds.
1-15
Users of Funds
(corporations)
Suppliers of
Funds
(households)
Financial Claims
(equity and debt
instruments)
Cash
Flow of Funds in a World without FIs
Non-Intermediated (Direct)
Flows of Funds
Direct Financing
1-16
Users of Funds FIs
(brokers)
FIs
(asset
transformers)
Suppliers of Funds
Financial Claims
(equity and debt securities)
Financial Claims
(deposits and insurance policies)
Cash Cash
Flow of Funds in a World with FIs
Intermediated Flows of Funds
Intermediated Financing

5
1-17
Depository versus Non-Depository FIs
Depository institutions:
commercial banks, savings associations, savings banks,
credit unions
Non-depository institutions
Contractual:
insurance companies, pension funds,
Non-contractual:
securities firms and investment banks, mutual funds.
1-18
FIs Benefit Suppliers of Funds
Reduce monitoring costs
Increase liquidity and lower price risk
Reduce transaction costs
Provide maturity intermediation
Provide denomination intermediation
1-19
FIs Benefit the Overall Economy
Conduit through which Federal Reserve
conducts monetary policy
Provides efficient credit allocation
Provide for intergenerational wealth
transfers
Provide payment services
1-20
Risks Faced by Financial
Institutions
Credit
Foreign exchange
Country or
sovereign
Interest rate
Market
Off-balance-sheet
Liquidity
Technology
Operational
Insolvency

6
1-21
Regulation of Financial
Institutions
FIs are heavily regulated to protect society at
large from market failures
Regulations impose a burden on FIs and before
the financial crisis, recent U.S. regulatory
changes were deregulatory in nature
Regulators attempt to maximize social welfare
while minimizing the burden imposed by
regulation
1-22
Globalization of Financial Markets
and Institutions
The pool of savings from foreign investors is
increasing and investors look to diversify globally now
more than ever before,
Information on foreign markets and investments is
becoming readily accessible and deregulation across
the globe is allowing even greater access,
International mutual funds allow diversified foreign
investment with low transactions costs,
Global capital flows are larger than ever.
1-23
FIs and the Crisis
Timeline of events
Home prices decline in late 2006 and early 2007
Delinquencies on subprime mortgages increase
Huge losses on mortgage-backed securities (MBS) announced by institutions
Bear Stearns fails and is bought out by J.P. Morgan Chase for $2 a share (deal had government backing).
1-24
FIs and the Crisis
Timeline of events
September 2008, the government seizes government-
sponsored mortgage agencies Fannie Mae and Freddie
Mac
The two had $9 billion in losses in the second half 2007
Now run by Federal Housing Finance Agency (FHFA)
September 2008, Lehman Brothers files for
bankruptcy; Dow drops 500 points

7
1-25
FIs and the Crisis
1-26
FIs and the Crisis
1-27
Government Rescue Plan
1-28
Government Rescue Plan
8
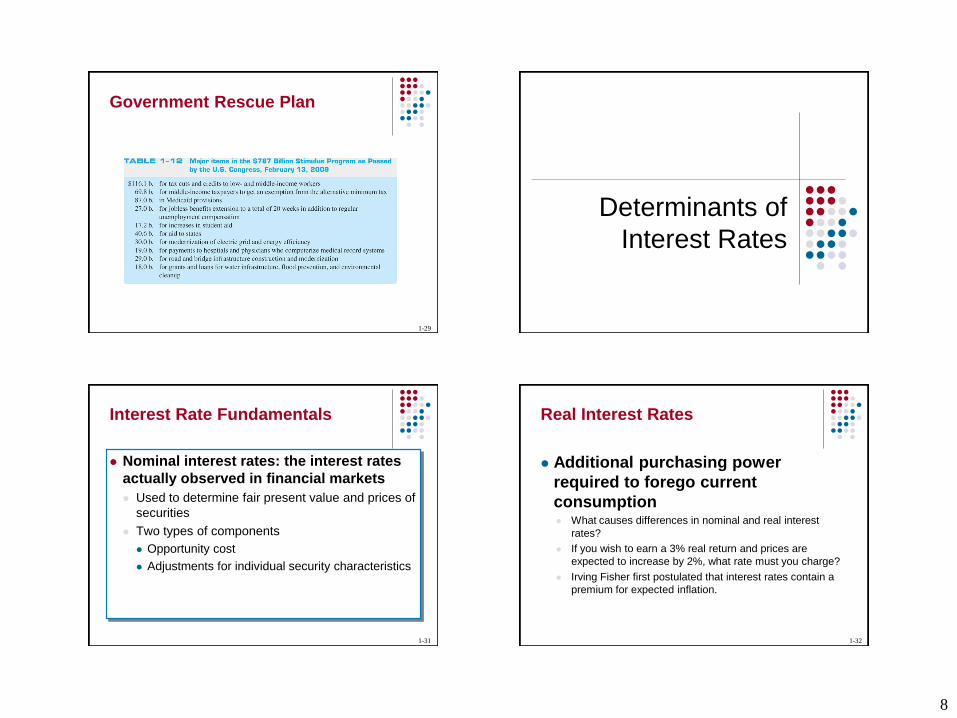
1-29
Government Rescue Plan
Determinants of
Interest Rates
1-31
Interest Rate Fundamentals
Nominal interest rates: the interest rates
actually observed in financial markets
Used to determine fair present value and prices of
securities
Two types of components
Opportunity cost
Adjustments for individual security characteristics
1-32
Real Interest Rates
Additional purchasing power
required to forego current
consumption What causes differences in nominal and real interest
rates?
If you wish to earn a 3% real return and prices are
expected to increase by 2%, what rate must you charge?
Irving Fisher first postulated that interest rates contain a
premium for expected inflation.

9
1-33
Loanable Funds Theory
Loanable funds theory explains interest rates
and interest rate movements
Views level of interest rates in financial markets
as a result of the supply and demand for
loanable funds
Domestic and foreign households, businesses,
and governments all supply and demand
loanable funds
1-34
Supply and Demand of Loanable
Funds
Interest
Rate
Quantity of Loanable Funds
Supplied and Demanded
Demand Supply
1-35
Determinants of Household
Savings
1. Interest rates and tax policy
2. Income and wealth: the greater the wealth or
income, the greater the amount saved,
3. Attitudes about saving versus borrowing,
4. Credit availability, the greater the amount of
easily obtainable consumer credit the lower the
need to save,
5. Job security and belief in soundness of
entitlements,
1-36
Determinants of Foreign Funds Invested in the U.S.
1. Relative interest rates and returns on global
investments
2. Expected exchange rate changes
3. Safe haven status of U.S. investments
4. Foreign central bank investments in the U.S.
10
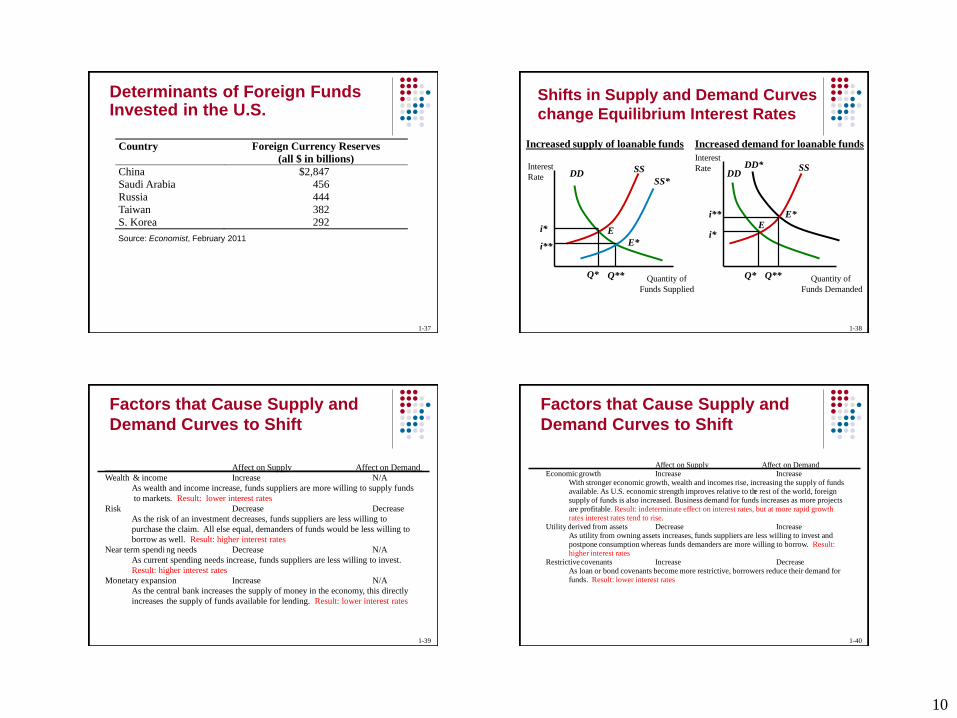
1-37
Determinants of Foreign Funds Invested in the U.S.
Source: Economist, February 2011
Country Foreign Currency Reserves
(all $ in billions)
China $2,847
Saudi Arabia 456
Russia 444
Taiwan 382
S. Korea 292
1-38
Shifts in Supply and Demand Curves
change Equilibrium Interest Rates
Increased supply of loanable funds
Quantity of
Funds Supplied
Interest
Rate DD SS
SS*
E
E*
Q*
i*
Q**
i**
Increased demand for loanable funds
Quantity of
Funds Demanded
DD DD* SS
E E*
i*
i**
Q* Q**
Interest
Rate
1-39
Factors that Cause Supply and
Demand Curves to Shift
Affect on Supply Affect on Demand
Wealth & income Increase N/A As wealth and income increase, funds suppliers are more willing to supply funds to markets. Result: lower interest rates
Risk D ecrease Decrease As the risk of an investment decreases, funds suppliers are less willing to purchase the claim. All else equal, demanders of funds would be less willing to borrow as well. Result: higher interest rates
Near term spendi ng needs Decrease N/A As current spending needs increase, funds suppliers are less willing to invest. Result: higher interest rates
Monetary expansion I ncrease N/A
As the central bank increases the supply of money in the economy, this directly increases the supply of funds available for lending. Result: lower interest rates
1-40
Factors that Cause Supply and
Demand Curves to Shift
Affect on Supply Affect on Demand Economic growth Increase Increase
With stronger economic growth, wealth and incomes rise, increasing the supply of funds available. As U.S. economic strength improves relative to th e rest of the world, foreign supply of funds is also increased. Business demand for funds increases as more projects are profitable. Result: indeterminate effect on interest rates, but at more rapid growth rates interest rates tend to rise.
Utility derive d from assets Decrease Increase As utility from owning assets increases, funds suppliers are less willing to invest and postpone consumption whereas funds demanders are more willing to borrow. Result: higher interest rates
Restrictive covenants Increase Decreas e As loan or bond covenants become more restrictive, borrowers reduce their demand for funds. Result: lower interest rates

11
1-41
Factors that Cause Supply and
Demand Curves to Shift
Affect on Supply Affect on Demand Tax Increase Decrease Increase
Taxes on interest and capital gains reduce the returns to savers and the incentive to save. The tax deductibility of interest paid on debt increases borrowing demand. Result: Higher interest rates
Currency Appreciation Increase N/A Foreign suppliers of funds would earn a higher rate of return if the currency appreciates and a lower rate of return measured in their own currency if the dollar depreciates. Foreign central banks often buy U.S. Treasury securities as part of their attempts to prevent their currency from appreciating against the dollar. Result: Lower interest rates
Expected inflation Decrease Increase An increase in expected infl ation implies that suppliers will be repaid with dollars that will have less purchasing power than originally anticipated. Suppliers lose purchasing power and borrowers gain more than originally anticipated. This implies that supply will be reduced and d emand increased. Result: Higher interest rates
1-42
Determinants of Interest Rates
for Individual Securities
ij* = f(IP, RIR, DRPj, LRPj, SCPj, MPj)
Inflation (IP)
IP = [(CPIt+1) – (CPIt)]/(CPIt) x (100/1)
Real Interest Rate (RIR) and the Fisher
effect
RIR = i – Expected (IP)
1-43
Determinants of Interest Rates
for Individual Securities (cont’d)
Default Risk Premium (DRP)
DRPj = ijt – iTt
ijt = interest rate on security j at time t
iTt = interest rate on similar maturity U.S. Treasury
security at time t
Liquidity Risk (LRP)
Special Provisions (SCP)
Term to Maturity (MP)
1-44
Term Structure of Interest Rates:
the Yield Curve
Yield to
Maturity
Time to Maturity
(a)
(b)
(c)
(a) Upward sloping
(b) Inverted or downward
sloping
(c) Flat

12
1-45
Unbiased Expectations Theory
Long-term interest rates are geometric averages
of current and expected future short-term
interest rates
1RN = actual N-period rate today
N = term to maturity, N = 1, 2, …, 4, …
1R1 = actual current one-year rate today
E(ir1) = expected one-year rates for years, i = 1 to N
1))](1))...((1)(1[( /1
112111 N
NNrErERR
1-46
Liquidity Premium Theory
Long-term interest rates are geometric averages
of current and expected future short-term
interest rates plus liquidity risk premiums that
increase with maturity
Lt = liquidity premium for period t
L2 < L3 < …<LN
1)])(1)...()(1)(1[( /1
1212111 N
NNNLrELrERR
1-47
Market Segmentation Theory
Individual investors and FIs have specific
maturity preferences
Interest rates are determined by distinct supply
and demand conditions within many maturity
segments
Investors and borrowers deviate from their
preferred maturity segment only when
adequately compensated to do so
1-48
Implied Forward Rates
A forward rate (f) is an expected rate on a short-
term security that is to be originated at some
point in the future
The one-year forward rate for any year N in the
future is:
1])1/()1[( 1
1111
N
N
N
NNRRf

13
1-49
Time Value of Money and Interest
Rates
The time value of money is based on the
notion that a dollar received today is
worth more than a dollar received at some
future date
Simple interest: interest earned on an
investment is not reinvested
Compound interest: interest earned on an
investment is reinvested
1-50
Present Value of a Lump Sum
Discount future payments using current interest
rates to find the present value (PV)
PV = FVt[1/(1 + r)]t = FVt(PVIFr,t)
PV = present value of cash flow
FVt = future value of cash flow (lump sum) received in t
periods
r = interest rate per period
t = number of years in investment horizon
PVIFr,t = present value interest factor of a lump sum
1-51
Future Value of a Lump Sum
The future value (FV) of a lump sum
received at the beginning of an
investment horizon
FVt = PV (1 + r)t = PV(FVIFr,t)
FVIFr,t = future value interest factor of a lump sum
1-52
Relation between Interest Rates
and Present and Future Values
Present
Value
(PV)
Interest Rate
Future
Value
(FV)
Interest Rate

14
1-53
Present Value of an Annuity
The present value of a finite series of equal
cash flows received on the last day of equal
intervals throughout the investment horizon
PMT = periodic annuity payment
PVIFAr,t = present value interest factor of an annuity
i
iPMTrPMTPV
tt
j
j )1(1)]1/(1[
1
1-54
Future Value of an Annuity
The future value of a finite series of equal cash
flows received on the last day of equal intervals
throughout the investment horizon
FVIFAr,t = future value interest factor of an annuity
i
iPMTrPMTFV
tt
j
jt
1)1()1(
1
0
1-55
Effective Annual Return
Effective or equivalent annual return
(EAR) is the return earned or paid over a
12-month period taking compounding
into account
EAR = (1 + rper period)c – 1 c = the number of compounding periods per year
1-56
Financial Calculators
Setting up a financial calculator Number of digits shown after decimal point
Number of compounding periods per year
Key inputs/outputs (solve for one of five) N = number of compounding periods
I/Y = annual interest rate
PV = present value (i.e., current price)
PMT = a constant payment every period
FV = future value (i.e., future price)