Embed Size (px)
Citation preview

University of Arkansas, FayettevilleScholarWorks@UARK
Research Reports and Research Bulletins Arkansas Agricultural Experiment Station
1-1-1998
Marketing Practices of Arkansas Beef CattleProducersMichael P. PoppUniversity of Arkansas, Fayetteville
Lucas D. ParschUniversity of Arkansas, Fayetteville
Follow this and additional works at: https://scholarworks.uark.edu/aaesrb
Part of the Agribusiness Commons, Agricultural Economics Commons, and the Animal StudiesCommons
This Bulletin is brought to you for free and open access by the Arkansas Agricultural Experiment Station at ScholarWorks@UARK. It has beenaccepted for inclusion in Research Reports and Research Bulletins by an authorized administrator of ScholarWorks@UARK. For more information,please contact [email protected], [email protected].
Recommended CitationPopp, Michael P. and Parsch, Lucas D., "Marketing Practices of Arkansas Beef Cattle Producers" (1998). Research Reports and ResearchBulletins. 39.https://scholarworks.uark.edu/aaesrb/39

ARKANSAS AGRICULTURAL EXPERIMENT STATIONDivision of Agriculture University of Arkansas
January 1998 Research Bulletin 957
Marketing Practicesof Arkansas
Beef Cattle Producers
Michael P. Poppand Lucas D. Parsch

ARKANSAS EXPERIMENT STATION RESEARCH BULLETIN 957
2
Marketing Practicesof Arkansas Beef Cattle Producers
Michael P. Popp Lucas D. ParschAsst. Professor Assoc. Professor
Dept. of Agricultural Economics Dept. of Agricultural Economicsand Agribusiness and Agribusiness
University of Arkansas1 University of Arkansas
1Now at the University of Manitoba, Department of Agricultural Economics and Farm Management,Faculty of Agricultural and Food Sciences, Winnipeg, Manitoba, Canada.
Arkansas Agricultural Experiment StationFayetteville, Arkansas 72701

MARKETING PRACTICES OF ARKANSAS BEEF CATTLE PRODUCERS
3
ABSTRACT
This report contains information from a 1996 survey on marketing prac-tices of Arkansas beef cattle producers. While several studies have been com-pleted on the profitability of retained ownership of beef cattle, few data areavailable on what marketing techniques and decision criteria cow-calf andstocker operations use to market their cattle. This report shows that there aresome differences in opinions on marketing issues such as pooled cattle salesand retained ownership across cow-calf and stocker operations. Further, theseoperations use different sources of information to make marketing decisions.The results of this study can be particularly helpful in providing the needed datafor studying the potential economic impact of feeding weaned calves to heavierweights in Arkansas as a value-added marketing alternative to selling calves atweaning.
Key words: retained ownership, pooled cattle sales, direct marketing, opinionsurvey.
Editing and cover design: Nancy G. Wyatt
Agricultural Experiment Station, University of Arkansas Division of Agriculture, Fayetteville. MiloJ. Shult, Vice President for Agriculture and Director: Charles J. Scifres, Associate Vice Presidentfor Agriculture. SB1.2M198.
The Arkansas Agricultural Experiment Station follows a nondiscriminatory policy in programs andemployment.ISSN:0097-3491 CODEN:AKABA7

ARKANSAS EXPERIMENT STATION RESEARCH BULLETIN 957
4
CONTENTS
INTRODUCTION .................................................................................................... 5
SAMPLING PROCEDURE AND SURVEY DESIGN ........................................... 6
OPERATOR OPINIONS ON FEEDING WEANED CALVESTO HEAVIER WEIGHTS................................................................................. 7Opinions on Problems of On-farm Feeding of Weaned Calves ......................... 8Opinions on Problems of Having Weaned Calves Custom Fed ...................... 10Opinions on Benefits of On-farm and Custom Feeding of Weaned Calves .... 13Ranking of Opinions on Problems and Benefits of Feeding Weaned Calves .. 13
TOOLS USED FOR FORECASTING ................................................................... 15
DECISION CRITERIA FOR SELL VS. HOLD AND FEED DECISION ............ 17
USE OF MARKETING METHODS ..................................................................... 19Marketing Methods Used ................................................................................ 19Volume of Trade Reported for Each Marketing Method ................................. 21
FREQUENCY OF CONSULTING PRICES INFORMATION ............................. 25
OPERATOR OPINIONS ON POOLING CATTLE FOR SALE ........................... 28Opinions on Benefits of Pooling Cattle for Sale ............................................. 28Opinions on Concerns About Pooling Cattle for Sale ..................................... 30Ranking of Opinions on Benefits of and Concerns about Pooling Cattle Sales32
SUMMARY AND CONCLUDING COMMENTS ............................................... 33
LITERATURE CITED ........................................................................................... 35
APPENDIX A: SURVEY INSTRUMENT ............................................................ 36

MARKETING PRACTICES OF ARKANSAS BEEF CATTLE PRODUCERS
5
MARKETING PRACTICESOF ARKANSAS BEEF CATTLE PRODUCERS
Michael P. Popp and Lucas D. Parsch
INTRODUCTION
survey was conducted in 1996 in order to obtain information regardinglivestock production and marketing practices of Arkansas cattle pro-ducers. This report highlights current marketing practices. Three types
of operations were surveyed: 1) cow/calf operations that sell calves at weaning;2) cow/calf operations that feed weaned calves to a heavier weight; and 3)stocker or backgrounding operations that prepare weaned calves for feedlotplacement. These enterprises operate at different processing stages of the beefcattle marketing channel and exhibit different degrees of specialization in pro-duction. Operations that have a single business focus, either cow/calf orstockering, are more specialized than cow/calf operations that also feed weanedcalves. Because of more diversified production methods, the latter operationtype may have more marketing options with additional freedom over the timingof sales. For example, weaned calves can be sold immediately or fed to heavierweights. The questionnaire was designed to address what similarities or differ-ences exist across these different operations.
In particular, information regarding producers� attitudes about benefits andproblems associated with retained ownership, pooling of cattle sales and value-added feeding alternatives was collected. The survey also assessed what infor-mation producers use to make marketing decisions and which marketing meth-ods they used.
There are a number of studies that compare returns to selling calves atweaning versus returns obtained from continuing to feed weaned calves to
A
1This paper is part of a set of reports funded by the University of Arkansas Agricultural ExperimentStation, Research Initiation Program. The authors are thankful for the help of Michel Pardue, DianaDanforth and other support staff for helping with the data entry and questionnaire design.

ARKANSAS EXPERIMENT STATION RESEARCH BULLETIN 957
6
heavier weights either on farm or on a custom basis (Watt et al., 1987; Johnsonet al., 1989; Gage, 1993 and 1994; Feuz and Wagner, 1996). Results usuallysupport the feeding of calves to heavier weights as a profitable alternative toselling calves at weaning. These studies often make various assumptions aboutthe timing of sales and what marketing techniques were used. To providefurther insight on these latter issues, this study was conducted to show theextent of retained ownership programs such as stockering or custom feeding inArkansas in 1996 and the marketing techniques and decision criteria that wereused.
This information is valuable because 1) it updates statistics on livestockmarketing practices in Arkansas; 2) it can be used to show how producers�attitudes on marketing issues differ at various stages in the beef cattle marketingchannel; 3) it shows that producers at different levels in the marketing channelseek alternative types of information and; 4) it provides the background forfurther study.
SAMPLING PROCEDURE AND SURVEY DESIGN
A mail survey (Salant and Dillman, 1994) was chosen in order to allowrespondents to consult records and to respond to a lengthy and difficult set ofquestions. The questionnaire (see Appendix A) was mailed to mid- and large-sized beef cattle operations in Arkansas because these operations would belarge enough and sufficiently specialized to answer questions of interest. Inaddition, these operations handle a majority of the cattle in Arkansas (see Table1). Table 1 describes the size distribution of beef cattle operations in Arkansas
Table 1. Number of beef cattle operations by size group, 1996.Numberof Farms
1,4412,6006,7763,8872,1201,060
17226
2018,102
% of All BeefCattle Farms
8.014.437.421.511.75.91.00.1
0.1100.0
Est. No. ofCattle2
7,20537,700
233,772289,582316,940370,470128,91432,487
n/a3
1,417,070
% of Est. TotalNo. of Cattle
0.52.7
16.520.422.426.19.12.3
n/a3
100.0
Size Group1
1 - 910 - 1920 - 4950 - 99
100 - 199200 - 499500 - 999
1000 - 14991500 - 9999Total Farms
Notes: Percentages may not add due to rounding. (Source: James Ewing of Arkansas Agricultural StatisticsService who coordinated the mail survey and sampling procedure. Arkansas Agricultural Statistics Service,1996)
1 Cattle includes cows, heifers that have calved and animals over 500 lb.2 The estimated number of cattle per size group is the product of the number of farms and the mid-point oraverage number of cattle per farm per size group. For example, the estimated number of cattle in the ‘1-9’head size group is 1,441 farms * [(1+9)/2] average head of cattle / farm with 1 - 9 head = 7,205 head ofcattle.
3 Not included as the average or mid-point because this category might be misleading.

MARKETING PRACTICES OF ARKANSAS BEEF CATTLE PRODUCERS
7
for 1996. The subsample of mid- to large-sized beef producers with more than50 and less than 1,000 cattle contained 7,239 producers or approximately 40%of the total number of beef cattle operations in Arkansas. Further, this subsampleof producers represents nearly 80% of beef cattle in Arkansas. The first mailingwas sent out 6 May 1996 with 2,500 addresses across the entire state ofArkansas picked at random by Arkansas Agricultural Statistics Service. On 20May, two weeks after the initial mailing, a follow-up survey was sent out. In all,1,094 surveys were returned with 1,057 usable observations, which amounts toa 42.3% mail return rate.
The survey was organized to ask specific questions of producers by theirtype of operation. The three types of operations were classified into the follow-ing categories:
1) Cow/calf - operations that sell calves at weaning except for replacementheifers. The sample contained 851 (80.5%) observations in this category;
2) Feeder - operations that are involved in either purchasing weanedcalves and feeding to heavier weights or custom feeding them to getweaned calves ready for feedlot placement. These operations maygraze animals (stockering) and/or feed them in a drylot environment(backgrounding). The sample contained 34 (3.2%) observations in thiscategory;
3) Mixed - operations that have a cow/calf and a feeding component intheir business. The sample involved 172 (16.3%) observations in thiscategory.
The results of the survey are presented to summarize responses and todifferentiate among the above three types of operations. One section deals withresults to questions specific to �Cow/calf� operations that sell weaned calves and�Mixed� cow/calf operations that also feed their calves. In this section, the focusof the questions was on attitudes concerning retained ownership and feeding toheavier feeder cattle weights. The remainder of the report analyzes responsesfrom all three types of operations. The emphasis was on tools used for forecast-ing prices, on opinions regarding pooled cattle sales, how sell vs. hold and feeddecisions are made, what marketing methods are employed, how frequentlyprices are compared on cattle characteristics and which sources of informationwere most important.
OPERATOR OPINIONS ON FEEDING WEANED CALVESTO HEAVIER WEIGHTS
Regardless of their experience with feeding weaned calves, opinions re-garding problems and benefits of on-farm feeding and custom feeding of weanedcalves were ascertained from �Cow/calf� and �Mixed� operations (see AppendixA, Question 8). �Feeder� operations were not asked to answer these questionsbecause a large majority of the problems and benefits did not apply to them.

ARKANSAS EXPERIMENT STATION RESEARCH BULLETIN 957
8
The questions were formatted so that a respondent could register one of fivelevels of agreement with each statement (strongly agree, agree, neutral, dis-agree or strongly disagree).
The first set of questions was designed to determine whether 1) price risk;2) lack of facilities; 3) cost of financing; or 4) lack of profitability were perceivedto be problems affecting the on-farm feeding of calves.
A subsequent set of questions was posed to establish whether 5) availabilityof custom feeders (location); 6) lack of trust; 7) difficulty in establishing trust; or8) knowledge of custom feeding as an option were perceived to be problemsrelated to the custom feeding of calves. Because the large majority (90%) of therespondents had never been involved with custom feeding (Popp and Parsch,1997), responses to these questions should be interpreted primarily as opinionsgrounded in minimal experience.
A final set of questions attempted to evaluate how the use of animalperformance data was perceived to be beneficial for both on-farm and customfeeding of weaned calves. Responses to these questions are summarized inTables 2 through 4. Each table presents the percentage breakdown of answersfor �Cow/calf� and �Mixed� operations on each statement.
Opinions on Problems of On-farm Feeding of Weaned CalvesTable 2 shows the breakdown of responses to problems �Cow/calf� and
�Mixed� operations may experience with on-farm feeding of weaned calves. Forexample, answers to the statement �The problem with feeding calves on myfarm is that, prices of feeder cattle change too much (too risky)� are reported inthe first row of the table. Numbers of respondents are included in the second-to-last column. Finally, the null hypothesis, that there is no difference in thedistribution of answers across operation type, is tested with the χ2-statistic andassociated probability1. High χ2- values and probabilities below 0.05, shown inthe last column, indicate that the distribution of answers is different acrossoperation type with 95% confidence. For the above example, the χ2- value andprobability mean that �Cow/calf� and �Mixed� operations had different percep-tions on whether feeder cattle price risk is problematic for feeding weanedcalves. This is illustrated in Fig. 1 graphically. The distribution of answers for�Cow/calf� operations is more heavily skewed in favor of the statement thatfeeder cattle price risk is a problem with on-farm feeding of weaned calves. Inother words, �Cow/calf� operations that do not feed weaned calves viewed thegrazing or feeding of weaned calves as more risky than �Mixed� operations.
Nearly 60% of the �Cow/calf� operations indicated that facilities to feedweaned calves were a problem on their farm while only 20% didn�t think that
1All statistical tests were run using Windows version 6.12 of SAS. To test for statistically significantdifferences in the distribution of answers across operation type, χ2 tests were used (Huntsberger andBillingsley, 1987).

MARKETING PRACTICES OF ARKANSAS BEEF CATTLE PRODUCERS
9
Tab
le 2
. Res
pons
es o
f ‘C
ow/c
alf’
and
‘Mix
ed’ o
pera
tions
to q
uest
ions
reg
ardi
ng p
robl
ems
with
on
farm
feed
ing
of w
eane
d ca
lves
.T
he p
robl
em w
ith f
eedi
ngO
pera
tion
Str
ongl
yS
tron
gly
No.
of
χ2 -st
atis
ticca
lves
on
my
farm
is t
hat,
Typ
eA
gree
Agr
eeN
eutr
alD
isag
ree
Dis
agre
eR
espo
nden
ts(P
roba
bilit
y)--
----
----
----
----
----
----
---%
----
----
----
----
----
----
----
--P
rices
of
feed
er c
attle
Cow
/cal
f24
.336
.031
.18.
10.
574
290
.196
chan
ge t
oo m
uch
(too
ris
ky)
Mix
ed6.
623
.537
.428
.34.
216
6(0
.001
)A
ll21
.033
.732
.311
.81.
290
81
I do
n’t
have
the
fac
ilitie
sC
ow/c
alf
19.4
39.0
20.8
16.5
4.4
754
150.
942
to fe
ed w
eane
d ca
lves
Mix
ed3.
113
.615
.450
.617
.316
2(0
.001
)A
ll16
.534
.519
.922
.56.
791
61
Bor
row
ing
mon
ey t
o fin
ance
Cow
/cal
f38
.835
.320
.74.
81.
072
976
.925
the
feed
ing
is t
oo c
ostly
Mix
ed13
.832
.729
.620
.13.
815
9(0
.001
)A
ll34
.334
.821
.97.
61.
588
81
Fee
ding
is n
ot p
rofit
able
Cow
/cal
f24
.430
.031
.212
.32.
175
712
9.46
8M
ixed
5.5
16.4
25.5
41.8
10.9
165
(0.0
01)
All
21.0
27.6
30.2
17.6
3.7
9221
1R
espo
nse
rate
s va
ried
from
86.
8% to
90.
1% w
hich
tran
slat
e to
135
to 1
01 m
issi
ng o
bser
vatio
ns, r
espe
ctiv
ely.

ARKANSAS EXPERIMENT STATION RESEARCH BULLETIN 957
10
facilities were a problem. While the question doesn�t really apply to �Mixed�operations, as they feed weaned calves with their facilities, one-sixth of theseoperations still had problems with facilities.
Both types of operations expressed concerns with the cost of financing thefeeding of weaned calves. Results showed that �Mixed� operations that hadexperience with feeding weaned calves perceived financing as less of a problemthan operations that did not feed calves. It may be that �Mixed� operations havebetter ties to financial institutions given their experience and thus receive lowerinterest rates, which would lead to a lessened perception of financing as aproblem.
Finally, the lack of profitability was perceived as a problem by more thanhalf of the �Cow/calf� operations but only by approximately one-fifth of the�Mixed� operations. This problem was also rephrased as a benefit in a latersection (see Table 4). Results were consistent across both statements. Theseresults indicate that there may be a need to educate �Cow/calf� operationsregarding the profitability of feeding weaned calves to heavier weights.
Opinions on Problems of Having Weaned Calves Custom FedTable 3 summarizes the responses of �Cow/calf� and �Mixed� operations on
problems associated with having their weaned calves custom fed. The first rowin the table summarizes the location problem. Since there were very few opera-tions that custom fed weaned calves for cow/calf operations, it may be thattransportation cost or location of custom feeders was perceived as a problem1.
Cow/calf Mixed
Prices of feeder cattle change too much (too risky)Strongly Agree Agree Neutral D isagree Strongly Disagree
0
10
20
30
40
Fig. 1. Opinion regarding feeder cattle price risk, cow/calf vs. mixed operations.
1Popp and Parsch (1997) showed that only 1.6% of the cattle fed by �Feeder� and �Mixed� enterprisesis done on a custom basis for �Cow/calf� operations.

MARKETING PRACTICES OF ARKANSAS BEEF CATTLE PRODUCERS
11
Tab
le 3
. Res
pons
es o
f ‘C
ow/c
alf’
and
‘Mix
ed’ o
pera
tions
to q
uest
ions
reg
ardi
ng p
robl
ems
with
hav
ing
wea
ned
calv
es c
usto
m fe
d.T
he p
robl
em w
ith h
avin
g ca
lves
Ope
ratio
nS
tron
gly
Str
ongl
yN
o. o
fχ2 -
stat
istic
fed
with
a c
usto
m f
eede
r is
tha
t,T
ype
Agr
eeA
gree
Neu
tral
Dis
agre
eD
isag
ree
Res
pond
ents
(Pro
babi
lity)
----
----
----
----
----
----
----
-%--
----
----
----
----
----
----
----
No
cust
om f
eede
rs a
re n
earb
yC
ow/c
alf
31.9
42.2
21.7
3.2
1.1
728
29.8
86M
ixed
21.9
51.9
13.8
11.3
1.3
160
(0.0
01)
All
30.1
43.9
20.3
4.6
1.1
8881
I do
n’t
trus
t cu
stom
fee
ders
Cow
/cal
f10
.517
.661
.88.
51.
769
819
.583
Mix
ed5.
820
.551
.918
.03.
915
6(0
.001
)A
ll9.
618
.260
.010
.22.
185
41
It is
too
har
d to
est
ablis
h tr
ust
Cow
/cal
f10
.518
.461
.67.
91.
769
725
.468
with
cus
tom
fee
ders
Mix
ed5.
725
.547
.818
.52.
615
7(0
.001
)A
ll9.
619
.759
.09.
81.
985
41
I ha
ve n
ot c
onsi
dere
d th
is o
ptio
nC
ow/c
alf
23.5
34.2
31.3
9.9
1.0
766
49.0
09M
ixed
15.3
22.9
33.1
21.0
7.6
157
(0.0
01)
All
22.1
32.3
31.6
11.8
2.2
9231
1R
espo
nse
rate
s va
ried
from
83.
5% to
90.
2% w
hich
tran
slat
e to
169
to 1
00 m
issi
ng o
bser
vatio
ns, r
espe
ctiv
ely.

ARKANSAS EXPERIMENT STATION RESEARCH BULLETIN 957
12
Tab
le 4
. Res
pons
es o
f ‘C
ow/c
alf’
and
‘Mix
ed’ o
pera
tions
to q
uest
ions
reg
ardi
ng b
enef
itsof
on-
farm
and
cus
tom
feed
ing
of w
eane
d ca
lves
.T
he b
enef
it of
fee
ding
cal
ves
Ope
ratio
nS
tron
gly
Str
ongl
yN
o. o
fχ2 -
stat
istic
(ow
n or
cus
tom
) is
tha
t,T
ype
Agr
eeA
gree
Neu
tral
Dis
agre
eD
isag
ree
Res
pond
ents
(Pro
babi
lity)
----
----
----
----
----
----
----
-%--
----
----
----
----
----
----
----
I kn
ow h
ow w
ell a
nim
als
perf
orm
Cow
/cal
f13
.341
.939
.54.
60.
772
137
.651
Mix
ed17
.263
.817
.21.
80.
016
3(0
.001
)A
ll14
.045
.935
.44.
10.
688
41
I ca
n ad
just
my
bree
ding
pro
gram
Cow
/cal
f12
.343
.139
.44.
40.
772
019
.840
bette
r, b
ecau
se I
kno
w h
ow w
ell
Mix
ed15
.557
.826
.10.
60.
016
1(0
.001
)an
imal
s pe
rfor
mA
ll12
.945
.737
.03.
80.
688
11
On
aver
age
it is
mor
e pr
ofita
ble
Cow
/cal
f8.
919
.851
.415
.94.
073
198
.879
than
sel
ling
wea
ned
calv
esM
ixed
20.9
47.9
29.5
1.2
0.6
163
(0.0
01)
All
11.1
24.9
47.4
13.2
3.4
8941
1R
espo
nse
rate
s va
ried
from
86.
1% to
87.
4% w
hich
tran
slat
e to
142
to 1
29 m
issi
ng o
bser
vatio
ns, r
espe
ctiv
ely.

MARKETING PRACTICES OF ARKANSAS BEEF CATTLE PRODUCERS
13
�Cow/calf� operations expressed stronger concern about custom feeding thanoperations that feed calves. This seems rational because operations that feedcalves themselves would be less dependent on transportation costs to customfeeders than operations that do not have this option.
There were two statements on the level and establishment of trust withcustom feeders. The first was stronger in the sense that the respondents wereasked directly whether they trusted custom feeders. The second question askedabout the difficulty of establishing trust with a custom feeder. The results werenearly identical for the two statements. In general, both types of operationsagreed that trust or the difficulty in establishing trust was of concern. �Cow/calf�operations were more neutral on this question than �Mixed� operations.
The final statement attempted to ascertain the level of knowledge about theavailability of custom feeding. Nearly 60% of �Cow/calf� operations had notconsidered having their calves custom fed. This compares to only 38.2% of�Mixed� operations. On the basis of these results, it appears that custom feedersare not actively pursuing �Cow/calf� operations as customers in this area ofbusiness. It may be that larger quantities of cattle are required for customfeeders to pursue a client. This topic is also discussed below.
Opinions on Benefits of On-farm and Custom Feeding of WeanedCalves
Table 4 summarizes the benefits of on-farm feeding and custom feeding ofweaned calves. There were two statements that related to the benefits of knowl-edge and use of animal performance data. The first statement asked whetherknowledge of animal performance data was a benefit. The second statementwent further and asked whether this knowledge of animal performance helpedwith breeding decisions and was therefore regarded as a benefit of feedingweaned calves. Responses to both statements were similar and indicated that�Mixed� operations viewed access to animal performance data as a more impor-tant benefit than did �Cow/calf� operations.
Ranking of Opinions on Problems and Benefits of Feeding WeanedCalves
The previous sections on problems and benefits of feeding weaned calvescan be summarized by ranking the importance of the different issues. Rankingswere assigned on the basis of the combined percentage of respondents thateither �strongly agreed� or �agreed� with a statement. The statement with thehighest percentage was given the highest ranking, indicating that most respon-dents in the grouping agreed with the statement identifying the problem orbenefit.
Table 5 shows the percentages of respondents and rankings by operationtype as well as overall percentages and rankings. The rankings were very similaracross operation types. The cost of financing was perceived as the number-one

ARKANSAS EXPERIMENT STATION RESEARCH BULLETIN 957
14
on-farm problem not only by the operations that fed cattle (�Mixed�) but also byoperations that did not (�Cow/calf�).
An example of typical interest costs demonstrates how important financingcharges can be. For example, assuming a 40% equity position in the cattle,total interest charges could range from $5.16 to $18.07/head using annualinterest rates of 4% to 14%, respectively (see Table 6, row ( F )). These aresignificant changes in cost given the expected average returns to feeding calvesshown in Row ( G ) of Table 6.
Price risk was identified as the number-two issue (Table 5), indicating thatimproved price risk management is a strong priority for producers. The avail-ability of feeding facilities ranked third in importance by �Cow/calf� operations.The lack of profitability was of least concern to �Cow/calf� producers, mostlikely due to the fact that they were not feeding calves. The combination of highinterest cost and a perception of high price risk appears to be the reason for areluctance to invest in feeding facilities by �Cow/calf� operations.
Problems with custom feeding (Table 5) were mostly associated with a lackof availability of custom feeders and knowledge of this option. Another interest-ing result was that the difficulty in establishing trust with custom feeders wasranked as more of a problem than trusting custom feeders outright. Again, thismay be related to the lack of availability of this feeding option in Arkansas.
Finally, the major advantage or benefit to feeding calves was knowinganimal performance. The primary reason for �Cow/calf� operations to rank thisbenefit highly may have been that they can adjust their breeding program
Table 5. Rankings of problems and benefits of feeding weaned calvesby ‘Cow/calf’ vs. ‘Mixed’ vs. ‘Cow/calf & Mixed’.
Cow/calf Mixed Cow/calf & Mixed% of % of % of
Statement responses1 Rank responses1 Rank responses1 Rank
Problems with on-farm feeding:Price risk 60.3 2 30.1 2 54.7 2Availability of feeding facilities 58.4 3 16.7 4 51.0 3Financing charges 74.1 1 46.5 1 69.1 1Lack of profitability 54.4 4 21.9 3 48.6 4
Problems with custom feeding:Location 74.1 1 73.8 1 74.0 1Trust 28.1 4 26.3 4 27.8 4Establish trust 28.9 3 31.2 3 29.3 3Knowledge of custom feeding 57.7 2 38.2 2 54.4 2
Benefits of own or custom feeding:Know animal performance data 55.2 2 81.0 1 59.9 1Adjust breeding because of data 55.4 1 73.3 2 58.6 2Profitability 28.7 3 68.8 3 36.0 3
1The combined percentage of respondents that strongly agreed or agreed with the statement outlined in theleft most column.

MARKETING PRACTICES OF ARKANSAS BEEF CATTLE PRODUCERS
15
better. For �Mixed� operations, which also purchase weaned calves for feeding,knowing animal performance data affected not only their breeding decisionsbut also their purchasing decisions. That may be the reason why they did notrank the answers to this question in the same manner as the �Cow/calf� respon-dents. Profitability was again ranked lowest.
Overall these rankings suggest that feeding weaned calves or having weanedcalves custom fed is not very common in Arkansas. The primary reason for thisappears to be an aversion to price risk and/or a lack of low-cost financing. Theprimary motivation for feeding weaned calves was not profitability but insteadaccess to information regarding animal performance.
TOOLS USED FOR FORECASTING
Respondents in all three categories of operations (�Cow/calf�, �Mixed� and�Feeder�) were asked about the source of information or tools they used forforecasting or predicting sale prices at the end of a feeding period (Appendix A,Question 16). The responses to this query are summarized in Table 7 and showrankings according to the highest percentage of respondents who reported thatthey had used a specified tool or information source. A χ2 - statistic wascalculated to see if the distribution of reported usage of the different informa-tion sources was different across the three operation types. Associated probabil-ity values below 0.05 again indicate that the distribution of information usagewas statistically significantly different across operation type.
Auction barn prices were ranked number one by �Cow/calf� and �Mixed�operations and number two by �Feeder� operations. In all cases, over three-quarters of the respondents used auction barn data to forecast prices. In addi-tion, reported use of auction prices was not significantly different across type ofoperation. However, reported use of other tools and sources of information inTable 7 differed by operation type at the 0.05 significance level.
Table 6. Typical interest cost on feeder cattle and feed using different interest rates.( A ) Value of #450 steer calf @ $65.00/cwt: $292.50( B ) Cost of gain -- 300 lb @ $40.00/cwt: $120.00( C ) Amount financed -- 60% of (A) + 50% of (B): $243.00( D ) Number of days financed -- 300 lb @ 1.5 ADG 200( E ) Sale Value of #750 steer calf @ $60.00/cwt: $450.00
Annual Interest Rate: 4% 6% 8% 10% 12% 14%
Interest cost in $/head:Interest on 60% of calf 3.85 5.77 7.69 9.62 11.54 13.46Interest on 50% of feed 1.32 1.97 2.63 3.29 3.95 4.60
Total Interest cost ( F ) 5.16 7.74 10.32 12.90 15.48 18.07Returns per head ( G ) 32.34 29.76 27.18 24.60 22.02 19.43
Notes: Returns per head ( G ) are calculated as ( E ) - ( A ) - ( B ) - ( F ). This information is provided simplyas an example of returns for 1996. Cost of gain includes vet & drug charges, feed, death loss and marketingcosts and excludes returns to land, labor and capital. (Pardue et al., 1997).

ARKANSAS EXPERIMENT STATION RESEARCH BULLETIN 957
16
Tab
le 7
. Pro
port
ion
of o
pera
tors
rep
ortin
g on
the
type
s of
info
rmat
ion
used
to fo
reca
st o
r pr
edic
t sal
e pr
ices
at th
e en
d of
a fe
edin
g pe
riod
by o
pera
tion
type
.T
ype
of I
nfor
mat
ion
Cow
/cal
fM
ixed
Fee
der
All
or T
ool U
sed
%1
Ran
k2%
Ran
k%
Ran
k%
R
ank
χ2 -s
tatis
ticP
roba
bilit
yA
uctio
n ba
rn p
rices
81.6
185
.21
75.0
282
.01
2.33
40.
311
Live
stoc
k re
port
s67
.62
79.3
278
.11
69.9
210
.099
0.00
6M
arke
t tr
ends
37.4
358
.03
68.8
341
.93
34.1
160.
001
Fee
der
cattl
e fu
ture
s30
.84
56.8
475
.02
36.6
461
.646
0.00
1C
ontr
acte
d P
rice
6.4
514
.25
34.4
48.
65
38.8
320.
001
Oth
er6.
06
9.5
615
.65
6.9
66.
569
0.03
7N
otes
: Res
pons
e ra
tes
varie
d fr
om 9
2.5%
to 9
8.3%
acr
oss
oper
atio
n ty
pe.
Non
-res
pons
e to
this
que
stio
n w
as d
efin
ed a
s no
che
ck m
arks
to th
e en
tire
ques
tion.
1%
is th
e pe
rcen
tage
of r
espo
nden
ts w
ho in
dica
ted
that
they
use
this
info
rmat
ion
or to
ol fo
r m
akin
g pr
ice
fore
cast
s.2R
ank
is a
ssig
ned
on th
e ba
sis
of th
e hi
ghes
t per
cent
age
of u
se o
f the
info
rmat
ion
or to
ol.

MARKETING PRACTICES OF ARKANSAS BEEF CATTLE PRODUCERS
17
�Feeder� operations used livestock reports as their number-one source forinformation followed closely by auction barn prices, feeder cattle futures pricesand market trends. Contractual arrangements and other information sourceswere used the least by all respondents. Information from market trends, feedercattle futures markets and contractual arrangements were used the least by�Cow/calf� operations by a considerable margin. This suggests that �Cow/calf�operations largely used livestock reports and auction barn prices as sources ofinformation.
Written comments were solicited in the �Other� category, shown as the lastitem in the list of sources consulted. Respondents included other producers andprofessionals in the livestock industry in this category.
DECISION CRITERIA FOR SELL VS. HOLD AND FEED DECISION
Respondents were asked how frequently they used different decision crite-ria when deciding whether to sell or to continue feeding (Appendix A, Question17). The following four choices were available:
1) Marginal Analysis - comparison of calculated feed costs with sale pricesof animals. This choice entails the calculation of expected profits bylooking at the difference in added revenue versus added feed cost;
2) High/Low Price - sell when prices are high and hold when prices arelow;
3) Age/Weight - sell regardless of price when the cattle are a certain ageor weight;
4) Pasture Condition - feeding restricted to pasture availability;Table 8 summarizes the breakdown of responses on the frequency of use of
the above decision criteria by the different types of operations.The first section of Table 8 shows the frequency of use of the marginal cost
vs. marginal revenue decision rule. �Feeder� operations tended to use this methodthe most, and �Cow/calf� operations reported that they used this method theleast. The reason for this difference might simply be that �Cow/calf� operationstended to hold and feed cattle intended for sale for shorter periods of time than�Mixed� and �Feeder� operations. For this reason, marginal analysis may not beas important to them. �Feeder� operations may also be more flexible withrespect to the timing of purchase and sale decisions as they don�t face breeding,culling and weaning decisions.
The frequency of using the decision rule of selling when prices are high andfeeding or holding cattle when prices are low is shown in the second section ofTable 8. All types of operations appeared to use this decision rule in a similarmanner as the distribution of answers was not statistically significantly differentacross operation types. 90% of all operations reported using this method atleast sometimes.

ARKANSAS EXPERIMENT STATION RESEARCH BULLETIN 957
18
The decision rule according to which operators would sell their calves at acertain age and weight showed a significantly different distribution of answersacross operation types. �Feeder� and �Mixed� operations were the least likely touse the age-weight criterion often. �Mixed� operations showed the most aver-sion to this method of deciding on when to sell vs. keep feeding. It may be that�Mixed� operations are feeding weaned calves in order to gain flexibility in theirmarketing approach�a rigid decision rule, such as selling at a certain weight orage would be the direct opposite.
Finally, the sale decision based on pasture condition was not differentacross operation type. Approximately one-fifth of the operations used it rarely,suggesting that these operations make greater use of the other decision rules,that pasture availability is calculated conservatively at the beginning of thefeeding period or that supplemental feed is used to prevent feed shortage.
Table 9 summarizes the above discussion on the decision criteria used bythe different operation types. �Feeder� operations were most likely to calculateprofits on lots of cattle they processed at the margin as they had the highestaverage response of 2.43 in the first row. �Mixed� operations were least likely tofeed calves according to age and weight but concentrated instead on moreflexible criteria. �Cow/calf� operations differed the least across decision rulesthey used, as shown in the narrow range of average ratings. This may be due to
Table 8. Frequency of use of four alternative decision criteriato sell vs. hold and feed calves by operation type.
Decision Operation No. of χ2-statisticCriteria Type Always Sometimes Rarely respondents (Probability)
-----------------%-----------------Marginal Cow/calf 27.1 40.7 32.3 669 18.522Analysis Feeder 50.0 42.9 7.1 28 (0.001)
Mixed 37.2 41.9 21.0 148All 29.6 41.0 29.5 8451
High/Low Cow/calf 24.9 65.0 10.1 722 2.288Price Feeder 17.9 71.4 10.7 28 (0.683)
Mixed 28.0 64.7 7.3 150All 25.2 65.1 9.7 9001
Age/ Cow/calf 26.3 54.8 18.9 741 24.918Weight Feeder 29.0 41.9 29.0 31 (0.001)
Mixed 15.9 48.4 35.7 157All 24.7 53.3 22.1 9291
Pasture Cow/calf 22.6 61.9 15.5 704 1.369Condition Feeder 19.2 61.5 19.2 26 (0.850)
Mixed 20.8 60.4 18.8 154All 22.2 61.7 16.2 8841
1 Response rates varied from 79.9% to 87.9% which translate to 212 to 128 missing observations, respectively.

MARKETING PRACTICES OF ARKANSAS BEEF CATTLE PRODUCERS
19
breeding, culling and weaning constraints that these operations face more sothan operations that also feed calves or operations that are solely in the busi-ness of feeding calves.
USE OF MARKETING METHODS
Respondents were asked to identify the marketing methods they used tobuy or sell cattle in 1995 by choosing one or more items from a list of eightmarketing alternatives (Appendix A, Question 18). In addition to indicatingwhether or not they had used each method, respondents also noted howfrequently they had used it and the number of cattle they had sold/purchasedvia each marketing alternative. The list of marketing alternatives appears below.
1) Cash - I sold/bought at a sale barn or auction market;2) Direct - stocker - I sold directly to a stocker or backgrounder;3) Direct - feedlot - I sold directly to a feedlot;4) Video - I sold/bought through video auction;5) Futures - I used cattle futures and options;6) Contract - I sold/bought cattle on contract;7) Pooled - I sold cattle together with another producer(s);8) Other - I sold/bought using other methods.
Marketing Methods UsedTable 10 presents rankings of the eight marketing alternatives by operation
type based on the proportion of respondents who used the technique in 1995.The reported χ2-statistic and associated probability indicate whether use of amarketing alternative was significantly different across operation type. A highχ2-value and a probability below 0.05 indicate that answers were differentacross operation type with 95% confidence.
Cash sales were the most common marketing method. Over 90% of all ofthe respondents used sale barns or auction markets to sell or buy cattle in 1995.Because this information records only the proportion of operators who usedeach method, this does not mean that over 90% of cattle traded moved throughauction markets.
Table 9. Decision criteria used for sell vs. hold and feed decision by operation type.Type of Information Cow/calf Mixed Feeder All Operationsor Tool Used Avg.1 Rank2 Avg. Rank Avg. Rank Avg. Rank
Marginal Analysis 1.95 3 2.16 2 2.43 1 2.00 4High/Low Price 2.15 1 2.21 1 2.07 2 2.16 1Age/Weight 2.07 2 1.80 4 2.00 3 2.03 3Pasture Condition 2.07 2 2.02 3 2.00 3 2.06 21 Avg. is the average response of respondents. 1 = Rarely, 2 = Sometimes, 3 = Always.2 Rank is assigned on the basis of the highest average response for the decision criteria category.

ARKANSAS EXPERIMENT STATION RESEARCH BULLETIN 957
20
Tab
le 1
0. P
ropo
rtio
n of
ope
rato
rs r
epor
ting
use
of e
ight
alte
rnai
tve
mar
ketin
g m
etho
ds b
y op
erat
ion
type
.T
ype
of M
arke
ting
Cow
/cal
fM
ixed
Fee
der
All
Met
hod
Use
d%
1R
ank2
%R
ank
% R
ank
%
Ran
k χ
2 -sta
tistic
Pro
babi
lity
Cas
h93
.81
93.9
187
.91
93.7
11.
914
0.38
4D
irect
- s
tock
er8.
02
8.5
315
.24
8.3
22.
114
0.34
7D
irect
- f
eedl
ot0.
66
7.3
427
.32
2.6
410
6.95
10.
001
Vid
eo0.
66
3.0
712
.15
1.4
734
.520
0.00
1F
utur
es1.
25
4.2
59.
16
2.0
515
.237
0.00
1C
ontr
act
0.6
64.
25
15.2
41.
76
48.1
710.
001
Poo
led
2.5
43.
66
0.0
72.
64
1.64
70.
439
Oth
er3
4.7
39.
72
18.2
36.
03
15.2
500.
001
Ave
rage
14.0
-16
.8-
23.1
-14
.8-
--
Not
es: R
espo
nse
rate
s va
ried
from
95.
2% to
97.
1% a
cros
s op
erat
ion
type
. N
on-r
espo
nse
to th
is q
uest
ion
was
def
ined
as
no c
heck
mar
ks to
the
entir
e qu
estio
n.1%
is t
he p
erce
ntag
e of
res
pond
ents
tha
t re
port
ed u
sing
thi
s m
arke
ting
met
hod.
N
ote
that
a p
rodu
cer
can
sell
or b
uy u
sing
mor
e th
an o
ne m
arke
ting
met
hod.
T
hepe
rcen
tage
s pr
esen
ted
for
each
ope
ratio
n ty
pe a
cros
s al
l mar
ketin
g m
etho
ds th
eref
ore
do n
ot a
dd to
100
%.
2R
ank
is a
ssig
ned
on th
e ba
sis
of th
e hi
ghes
t per
cent
age
of u
se o
f the
mar
ketin
g m
etho
d.3O
ther
incl
udes
ret
aine
d ow
ners
hip
until
sla
ught
er,
dire
ct s
ale
of p
ureb
red
cattl
e, s
ale
of r
epla
cem
ent
heife
rs v
ia p
rivat
e tr
eaty
, or
der
buye
r pu
rcha
ses
with
unk
now
nde
stin
atio
n, c
alf s
ales
to r
odeo
s an
d m
isce
llane
ous
othe
r m
arke
ting
met
hods
.

MARKETING PRACTICES OF ARKANSAS BEEF CATTLE PRODUCERS
21
The second-most-common marketing method was direct sales to stockeroperations, feedlots or other producers. As expected, a very common marketingmethod for �Feeder� operations was direct sales to feedlots.
Selling cattle together with other producers, i.e., pooling, was most com-mon among �Cow/calf� operations and was not used at all by �Feeder� opera-tions. Volume considerations that make pooling attractive are likely not a con-cern for �Feeder� operations. Video sales were used least frequently by �Cow/calf� and �Mixed� operations but were more common among �Feeder� opera-tions. Futures and options hedging and other contractual arrangements werenot very common for any operation type.
In the final row of Table 10, average use of all the different marketingmethods was the highest for �Feeder� operations and the lowest for �Cow/calf�operations. This suggests that operations that feed weaned calves may paymore attention to an array of potential marketing methods.
Volume of Trade Reported for Each Marketing MethodTable 11 summarizes statistics on the volume of cattle traded for each of
the different marketing alternatives. The second column reports the total vol-ume per category, and the third column provides the percentage breakdownamong all marketing alternatives. The fifth column indicates the number ofnon-zero responses in each category�i.e. the number of respondents that actu-ally traded cattle in each category. Columns six through nine report severalstatistics on the number of cattle traded per respondent. Unfortunately, it wasnot possible to calculate statistics on �cattle traded per transaction� due to a lowresponse rate to the relevant question (last column of Question 18 in AppendixA).
The bottom row in Table 11 shows the total volume of trade across allmarketing methods. This total was calculated as a separate statistic for eachrespondent and summarizes cattle trade for all the respondents across all cat-egories. Futures and options trade was not included in this total. In addition,adjustments noted in the footnote to the table were made to avoid doublecounting.
Cash sales were the dominant marketing category with slightly over 80% ofthe total volume of cattle traded. As a separate group, direct sales to stockers,feedlots and other producers, as well as contractual sales that may be part ofthe above direct sales, were of secondary importance. Finally, video sales andpooled sales arrangements were least common. Futures and options were notcommonly used.
A factor that may explain some of the differences in the volume of trade forthe different categories is the reported average, minimum and maximum vol-ume of trade per respondent numbers. Review of the last four columns in Table11 suggests that certain types of marketing methods were associated with highernumbers of cattle traded. The implication may be that some of these marketing

ARKANSAS EXPERIMENT STATION RESEARCH BULLETIN 957
22
Tab
le 1
1. V
olum
e of
cat
tle tr
aded
in 1
995
usin
g ei
ght a
ltern
ativ
e m
arke
ting
met
hods
.T
ype
of M
arke
ting
Tot
al N
o. o
fP
erce
ntag
e of
No.
of
Cat
tle T
rade
d pe
r R
espo
nden
tM
etho
d U
sed
Cat
tle T
rade
dT
otal
Tra
deR
ank1
resp
onde
nts2
Avg
.S
td.
Dev
.M
in.
Max
.
Cas
h69
,007
81.3
180
985
136.
51
2,50
0D
irect
--
stoc
ker
4,86
25.
73
6575
74.5
337
5D
irect
--
feed
lot
5,34
06.
32
1731
460
9.0
152,
500
Vid
eo1,
069
1.3
78
134
238.
12
700
Fut
ures
31,
636
1.9
63
545
826.
866
1,50
0C
ontr
act
4,07
54.
84
1234
069
3.9
152,
500
Poo
led
825
1.0
817
4951
.53
200
Oth
er4
3,07
13.
65
4077
99.9
150
0T
otal
584
,904
100.
0-
843
101
221.
81
5,00
01R
ank
is a
ssig
ned
on th
e ba
sis
of th
e hi
ghes
t vol
ume
of c
attle
trad
e re
port
ed.
2T
he n
umbe
r of
res
pond
ents
that
rep
orte
d gr
eate
r th
an z
ero
trad
e in
a c
ateg
ory.
3T
he n
umbe
rs o
n th
is e
ntry
sho
uld
be r
egar
ded
as c
attle
hed
ged
usin
g fu
ture
s an
d op
tions
rat
her
than
trad
ed.
In a
dditi
on th
is, c
ateg
ory
is n
ot in
clud
ed in
the
tota
l fig
ures
in th
e bo
ttom
row
.4O
f the
40
resp
onse
s in
this
cat
egor
y, 1
2 re
spon
dent
s in
dica
ted
that
they
ret
aine
d ow
ners
hip
on th
e ca
ttle
until
sla
ught
er, 1
0 so
ld p
ureb
red
cattl
e, s
even
sol
d re
plac
emen
the
ifers
via
priv
ate
trea
ty,
thre
e ha
d an
ord
er b
uyer
buy
cat
tle w
ith u
nkno
wn
dest
inat
ion,
and
one
sol
d ca
lves
for
rod
eos.
T
he r
emai
nder
did
not
indi
cate
a m
arke
ting
met
hod.
5T
he t
otal
fig
ure
does
not
incl
ude
repo
rted
num
bers
in t
he f
utur
es a
nd o
ptio
ns c
ateg
ory
as t
hese
are
hed
ging
tra
nsac
tions
tha
t do
not
invo
lve
phys
ical
del
iver
y in
mos
tca
ses.
In
addi
tion,
som
e of
the
cate
gorie
s ar
e no
t mut
ually
exc
lusi
ve.
Res
pons
es o
f res
pond
ents
that
sho
wed
the
sam
e tr
ade
volu
me
in c
ontr
actu
al s
ales
as
in e
ither
of
the
dire
ct s
ales
cat
egor
ies
or v
ideo
sal
es w
ere
trea
ted
as o
ne r
espo
nse
whe
n to
talin
g ca
ttle
trad
e pe
r re
spon
dent
. T
his
was
don
e to
avo
id d
oubl
e co
untin
g.

MARKETING PRACTICES OF ARKANSAS BEEF CATTLE PRODUCERS
23
methods are not available to smaller producers. The reported minimum num-bers suggest that some smaller producers were using some or all of the market-ing methods with the exception of futures and options trading and direct salesto feedlots. Futures and options hedging transactions, as well as direct market-ing to feedlots through contractual arrangements or otherwise, showed thelargest average trade volume figures per respondent.
Differences in the 1995 average trade volume per respondent across opera-tion types are shown in Table 12. To test whether average trade volume perrespondent was different across operation type, t-statistics were calculated1. A t-statistic (>2.0) with an associated probability less than 0.05 indicates that theaverage trade volume per respondent was different across operation type with95% confidence. Since these tests can be applied to only two operation types ata time, the table is broken into comparisons of differences between �Cow/calf�vs. �Mixed�, �Feeder� vs. �Mixed� and �Cow/calf� vs. �Feeder� operations in thebottom half of the table. Statistically significant differences are highlighted withasterisks in the table. Corresponding average trade volumes and sample sizesfor each operation are reported in the top portion of the table.
While there were a number of statistically significant results, the number ofobservations for the marketing alternatives other than �Cash� and �Other� weretoo small for testing differences. In the �Cash� marketing category, �Cow/calf�operations had the lowest number of cattle traded per respondent followed by�Mixed� operations. Finally, the �Feeder� operations reported the largest averagevolume per respondent in the �Cash� category.
Direct marketings to stockers had nearly the same volume for �Cow/calf�and �Mixed� operations and showed an average trade volume per respondentclose to that required for a semi-truck trailer load of cattle. �Feeder� operationsagain had the largest average volume per respondent in this category.
The results in the �Other� category show that �Feeder� operations tended tohave the largest average volume of trade per respondent in this category. Saleof purebred cattle and replacement heifers noted in the footnote to Table 11may explain why average trade volume for �Cow/calf� operations was higherthan that for �Mixed� operations, although the difference in average trade wasonly marginally significant. Retained ownership of cattle and purchases of orderbuyers likely explain the difference between �Feeder� vs. �Mixed� and �Feeder�vs. �Cow/calf� results.
Overall, the statistics in Table 12 support the conclusions of Tables 10 and11 in the sense that �Feeder� operations tend to be more involved in marketingalternatives to cash markets. An interesting result was the lack of pooling ar-
1These tests were performed using the UNIVARIATE procedure in SAS. Based on the results of an F-test on equal or unequal variances across the samples, differences in means across samples were testedwith the appropriate t-statistic (Huntsberger and Billingsley, 1987).

ARKANSAS EXPERIMENT STATION RESEARCH BULLETIN 957
24
Tab
le 1
2. D
iffer
ence
s in
ave
rage
trad
e vo
lum
e pe
r re
spon
dent
by
oper
atio
n ty
pe.
Dire
ct-
Dire
ct-
Des
crip
tion
Ope
ratio
n T
ype
Cas
hS
tock
erF
eedl
otV
ideo
Fut
ures
Con
trac
tP
oole
dO
ther
Ave
rage
Num
ber
of C
attle
Cow
/cal
f69
6347
11n/
a1
7736
71T
rade
d pe
r R
espo
nden
tF
eede
r32
220
059
725
9n/
a94
2n/
a26
2M
ixed
117
8225
513
0n/
a21
789
42
Num
ber
of R
espo
nden
tsC
ow/c
alf
644
485
3n/
a5
1325
that
Tra
ded
Cat
tleF
eede
r27
46
31
3n/
a3
Mix
ed13
813
62
24
412
Dire
ct-
Dire
ct-
Des
crip
tion
Ope
ratio
n T
ype
Cas
hS
tock
erF
eedl
otV
ideo
Fut
ures
Con
trac
tP
oole
dO
ther
Cow
/cal
f vs
.T
-sta
tistic
-2.7
06**
*2-1
.199
-1.3
76-1
.700
n/a
-1.4
47-1
.228
1.35
3M
ixed
Pro
babi
lity
0.00
80.
240
0.22
70.
337
n/a
0.19
10.
301
0.18
6
Fee
der
vs.
T-s
tatis
tic2.
269*
*2.
502*
0.83
20.
444
n/a
0.92
1n/
a3.
492*
Mix
edP
roba
bilit
y0.
031
0.07
80.
435
0.68
7n/
a0.
452
n/a
0.07
1
Cow
/cal
f vs
.T
-sta
tistic
-2.8
61**
*-3
.660
***
-1.4
37-1
.121
n/a
-1.1
06n/
a-3
.106
***
Fee
der
Pro
babi
lity
0.00
80.
001
0.21
00.
379
n/a
0.38
4n/
a0.
005
1T
here
wer
e no
t eno
ugh
resp
onse
s to
rep
ort a
vera
ges
or to
per
form
a t-
test
.2**
*, *
*, a
nd *
indi
cate
0.0
1, 0
.05,
and
0.1
0 si
gnifi
canc
e le
vels
, res
pect
ivel
y.

MARKETING PRACTICES OF ARKANSAS BEEF CATTLE PRODUCERS
25
rangements among stocker operations. Apparently their average trade volumeper respondent was large enough to eliminate consideration of pooling as analternative marketing method.
FREQUENCY OF CONSULTING PRICES INFORMATION
Respondents were asked to indicate whether or not they consulted priceson specified cattle characteristics to help in making marketing decisions. Thosewho consulted prices were also asked to note how frequently they did so(Appendix A, Question 19). The three specified cattle attributes�weight, type,and breed�are defined as follows:
1) Weight - comparing prices across different weight categories, such asprices for #4-500 calves, #6-700 calves, finished cattle, carcass prices,cut out prices, retail prices;
2) Type - comparing prices across different types of cattle, such as steers,heifers, bulls, replacements and cull cows;
3) Breed - Comparing prices across different cattle breeds, such Hereford,Angus, etc.
In addition, producers were also queried about what sources of informationthey used and if they used a source of information, how often they consultedeach of the following categories of information:
1) Own Sales - examining own sales records;2) Auction Sales - analyzing sales prices at different auctions and markets;3) Other - looking at information in trade magazines, other market news
reports, TV, radio and other sources.The results were differentiated by operations that fed weaned calves (�Mixed
& Feeder�) and those that did not (�Cow/calf�), i.e., responses from �Mixed� and�Feeder� operations were grouped into one category and responses of �Cow/calf� operations made up the other category. This was done on the basis of theresults obtained earlier regarding the benefits of knowing animal performanceand adjusting breeding programs on the basis of that information (Table 4).�Cow/calf� operations were more interested in the breeding information than the�Mixed� operations. A similar breakdown on information sources and cattleattributes is expected here.
The importance of different cattle attributes was ranked by assigning anumber to the frequency choices of each individual, i.e., No = 0, Yes = 1,Yearly = 2, At Saletime = 3, Monthly = 4, Weekly = 5, Daily = 6. Using thismethod, a high value implies frequent comparison of prices. Averaging re-sponses across observations can then lead to an �ordinal� measure of impor-tance for each of the cattle attributes, where a high value represents frequentuse of information and a low value represents infrequent use of information.

ARKANSAS EXPERIMENT STATION RESEARCH BULLETIN 957
26
However, the average values in themselves convey no meaning�i.e. an averageof 3.5 does not indicate a frequency between �Monthly� and �At Saletime�.
In order to test the null hypothesis that there is no difference in the distribu-tion of answers between �Cow/calf� and �Mixed & Feeder� operations, χ2-statis-tics were calculated and reported together with probabilities. High χ2-valuesand probabilities below 0.05 indicate that statistically significant differencesexist across operation type with 95% confidence.
Table 13 shows that all operations have the same ranking for the differentcattle price attributes and that �Mixed & Feeder� operations tended to examinethe price information more frequently than �Cow/calf� operations. The mostimportant attribute used for price comparison was the type of cattle. Comparingprices across weight categories was a close second. There was also a largerdifference between the �Type� and �Weight� category rankings for the �Cow/calf�operations than for the �Mixed & Feeder� operations. This supports the earliercontention that �Cow/calf� operations are less concerned with looking at pricedifferentials associated with feeding cattle to heavier weights than operationsthat feed calves.
The results concerning the frequency of price comparisons across breedswere opposite to expectations. �Cow/calf� operations paid the least attention toprice differences across breeds but had considered animal performance data toadjust breeding programs to be a more significant benefit to feeding calves than�Mixed� operations (Table 4). Either prices do not appropriately reflect thequality attributes of different breeds or �Cow/calf� operations are more inter-ested in non-price attributes in breeds. The authors hypothesize the latter to bea more accurate description of Arkansas cow/calf operators.
For the �Auction Sales� and �Other� information sources, the frequency ofuse was higher for the �Mixed & Feeder� operations than the frequency ratingsfor the �Cow/calf� operations. The opposite was true for the �Own Sales� cat-egory. One of the differences between the sources of information may be thevalidity and ease of access associated with external versus internal information.�Own Sales� records are an internal source of information that is easily accessedand known to be valid. As an alternative, external sources of information suchas prices at various auction markets, information in trade magazines and othermarket news reports may not be as easy to obtain or reliable for �Cow/calf�operators and are, therefore, consulted less often.
Finally, �Mixed & Feeder� operations used the �Other� category the mostoften with an average rating between weekly and monthly. Some producerscommented on the use of other information. Quoted most frequently as �Other�sources of information were electronic news media such as satellite uplinkservices provided by the �Date Transmission Network, DTN� and �FarmBureau�information pages on computer terminals located throughout the state.

MARKETING PRACTICES OF ARKANSAS BEEF CATTLE PRODUCERS
27
Tab
le 1
3. R
anki
ng o
f pric
e at
trib
utes
and
info
rmat
ion
sour
ces
by o
pera
tion
type
.F
requ
ency
(%
of
resp
onde
nts
in e
ach
cate
gory
)A
ttrib
ute
orO
pera
tion
No
Yes
Yea
rlyA
t S
alet
ime
Mon
thly
Wee
kly
Dai
lyN
o. o
fχ2 -
stat
istic
Sou
rce
Typ
e(
0 )
( 1
)(
2 )
( 3
)(
4 )
( 5
)(
6 )
Avg
.1R
ank2
resp
onde
nts
(Pro
babi
lity)
Typ
eC
ow/c
alf
11.6
6.4
3.6
21.3
15.5
36.1
5.7
3.5
167
332
.232
Mix
ed &
Fee
der
9.5
2.8
1.7
10.1
11.7
53.6
10.6
4.2
117
9(0
.001
)A
ll11
.25.
63.
218
.914
.739
.86.
73.
71
8523
Wei
ght
Cow
/cal
f21
.65.
02.
019
.513
.833
.25.
03.
22
662
45.0
34M
ixed
& F
eede
r11
.71.
70.
011
.110
.654
.410
.64.
12
180
(0.0
01)
All
19.5
4.3
1.5
17.7
13.1
37.8
6.2
3.4
284
23
Bre
edC
ow/c
alf
40.0
5.3
8.7
11.8
13.2
17.9
3.0
2.2
364
218
.753
Mix
ed &
Fee
der
34.8
3.1
7.3
9.2
9.8
32.9
3.1
2.7
316
4(0
.005
)A
ll39
.04.
88.
411
.312
.521
.03.
02.
33
8063
Auc
tion
Sal
esC
ow/c
alf
10.0
8.8
1.7
25.7
14.0
35.2
4.7
3.5
175
241
.713
Mix
ed &
Fee
der
6.4
3.2
0.0
14.4
11.2
56.4
8.5
4.2
218
8(0
.001
)A
ll9.
37.
71.
423
.413
.439
.55.
43.
61
9403
Oth
erC
ow/c
alf
22.4
5.7
1.8
10.1
23.0
26.2
10.9
3.3
267
355
.721
Mix
ed &
Fee
der
7.5
1.2
0.0
5.8
22.0
38.2
25.4
4.5
117
3(0
.001
)A
ll19
.44.
71.
49.
222
.828
.613
.83.
52
8463
Ow
n S
ales
Cow
/cal
f29
.23.
87.
825
.313
.615
.84.
52.
63
664
18.9
59M
ixed
& F
eede
r33
.31.
114
.118
.67.
318
.66.
82.
53
177
(0.0
04)
All
30.1
3.2
9.2
23.9
12.3
16.4
5.0
2.5
384
13
1A
vg.
is t
he w
eigh
ted
aver
age
resp
onse
of
resp
onde
nts.
It
is c
alcu
late
d as
the
sum
of
the
prod
uct
of t
he p
erce
ntag
es a
nd t
heir
wei
ghts
, i.e
. N
o =
0,
Yes
= 1
, et
c.,
for
each
cat
egor
y. A
hig
h av
erag
e re
spon
se im
plie
s fr
eque
nt c
ompa
rison
of p
rices
for
cattl
e at
trib
utes
or
freq
uent
use
of a
cer
tain
sou
rce
of in
form
atio
n, w
hile
a lo
w a
vera
gere
spon
se im
plie
s th
e op
posi
te o
r in
freq
uent
com
paris
on o
r us
e.2R
ank
is a
ssig
ned
on th
e ba
sis
of th
e hi
ghes
t ave
rage
res
pons
e fo
r th
e ca
tego
ry.
3R
espo
nse
rate
s va
ried
from
76.
3% to
88.
9%, w
hich
tran
slat
e to
251
to 1
17 m
issi
ng o
bser
vatio
ns, r
espe
ctiv
ely.

ARKANSAS EXPERIMENT STATION RESEARCH BULLETIN 957
28
OPERATOR OPINIONS ON POOLING CATTLE FOR SALE
Respondents were asked to provide their opinions on pooling cattle for sale(Appendix A, Question 20). For purposes of comparison, two groups of respon-dents were defined��Cow/calf� operations and �Mixed� and �Feeder� operationsthat fed weaned calves. Pooling cattle for sale was defined as �combining yourcattle to be sold with cattle of other producers rather than just selling your cattleas an individual producer�.
Regardless of their experience with pooling cattle, respondents were askedto indicate their opinion regarding two groups of statements about poolingcattle. The first group of statements targeted the following positive aspects: 1)the availability of price premiums; 2) transportation cost savings; and 3) theease of pooling with video auctions. The second group of statements empha-sized the following potentially negative aspects: 4) average pricing; 5) lack ofknowledge of pooling as an option; and 6) the lack of flexibility in the timing ofa sale. The questions were formatted so that a respondent could either stronglyagree, agree, be neutral, disagree or strongly disagree with the statement.
For all operations, 2.6% and 1.4% of respondents had reported someexperience with pooled sales and video auctions, respectively (Table 10). For1995, the combined volume of trade for both categories was 1,894 head tradedor 2.2% of the total volume of trade (Table 11). The results to this query onpooling cattle, therefore, need to be interpreted as opinions grounded in mini-mal experience.
The responses were tested for statistically significant differences across op-eration type using a χ2-test on the distribution of answers provided. High χ2-values and probabilities below 0.05 indicate that �Cow/calf� operators havedifferent opinions on the various statements than �Mixed & Feeder� operationswith 95% confidence.
Opinions on Benefits of Pooling Cattle for SaleTable 14 summarizes the level of agreement of producers to the statements
provided in the first column of the table. Columns three through seven showthe breakdown of responses by operation type. The remaining columns list thenumber of responses for each operation type and the χ2-values and probabili-ties.
Responses to the statement, �Larger, more uniform lots of cattle sell at ahigher price� are recorded in the first row (Table 14). Both types of operationsfelt strongly that price premiums are available for larger, more uniform lots ofcattle. Over 95% of the �Mixed & Feeder� operations strongly agreed or agreedwith this statement. While answers to this statement reflect opinions, the strengthof the responses in favor of price premiums suggests that they are, in fact,available.
Responses to the statement, �Pooling saves on transportation cost� appearto indicate that both types of operations agreed that there would be transporta-
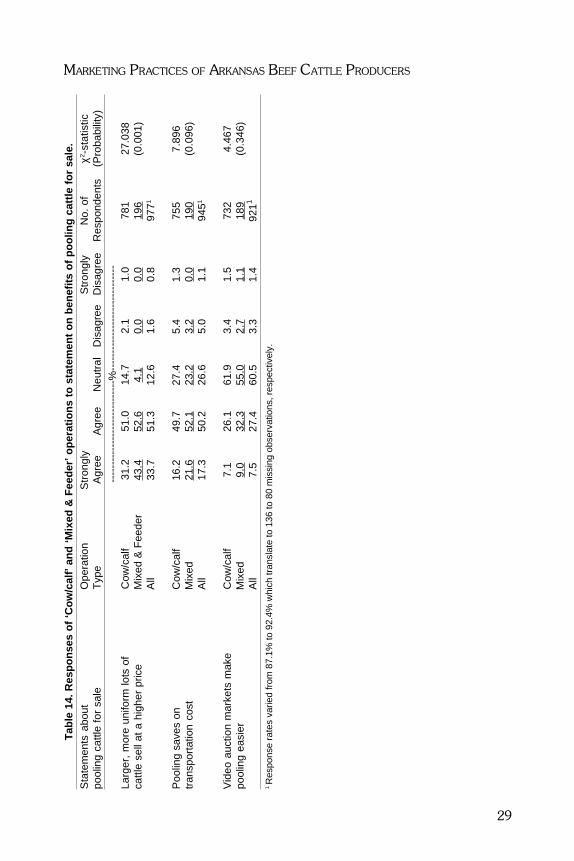
MARKETING PRACTICES OF ARKANSAS BEEF CATTLE PRODUCERS
29
Tab
le 1
4. R
espo
nses
of ‘
Cow
/cal
f’ an
d ‘M
ixed
& F
eede
r’ op
erat
ions
to s
tate
men
t on
bene
fits
of p
oolin
g ca
ttle
for
sale
.S
tate
men
ts a
bout
Ope
ratio
nS
tron
gly
Str
ongl
yN
o. o
fχ2 -
stat
istic
pool
ing
cattl
e fo
r sa
leT
ype
Agr
eeA
gree
Neu
tral
Dis
agre
eD
isag
ree
Res
pond
ents
(Pro
babi
lity)
----
----
----
----
----
----
----
-%--
----
----
----
----
----
----
----
Larg
er,
mor
e un
iform
lots
of
Cow
/cal
f31
.251
.014
.72.
11.
078
127
.038
cattl
e se
ll at
a h
ighe
r pr
ice
Mix
ed &
Fee
der
43.4
52.6
4.1
0.0
0.0
196
(0.0
01)
All
33.7
51.3
12.6
1.6
0.8
9771
Poo
ling
save
s on
Cow
/cal
f16
.249
.727
.45.
41.
375
57.
896
tran
spor
tatio
n co
stM
ixed
21.6
52.1
23.2
3.2
0.0
190
(0.0
96)
All
17.3
50.2
26.6
5.0
1.1
9451
Vid
eo a
uctio
n m
arke
ts m
ake
Cow
/cal
f7.
126
.161
.93.
41.
573
24.
467
pool
ing
easi
erM
ixed
9.0
32.3
55.0
2.7
1.1
189
(0.3
46)
All
7.5
27.4
60.5
3.3
1.4
9211
1R
espo
nse
rate
s va
ried
from
87.
1% to
92.
4% w
hich
tran
slat
e to
136
to 8
0 m
issi
ng o
bser
vatio
ns, r
espe
ctiv
ely.

ARKANSAS EXPERIMENT STATION RESEARCH BULLETIN 957
30
tion cost savings from pooling cattle. Current Arkansas cattle budgets showestimated marketing and hauling costs at $4.00/head. (Pardue et al., 1997).Therefore, any cost savings due to volume considerations may be relativelyminor. A more interesting question would be whether investment in cattlehauling equipment could be reduced as a result of pooling, especially for smallerproducers.
Both types of operations were mostly neutral on the statement about videoauctions. Presumably, using video auction markets is not very established inArkansas.
Opinions on Concerns About Pooling Cattle for SaleTable 15 reports producers� opinions on the perceived drawbacks of pool-
ing. Analysis of the results is structured in a form similar to the above section onbenefits of pooling.
Answers to the statement, �I don�t like to sell my cattle at the average penprice� are reported in the first row of Table 15. This statement attempts tocapture the common complaint by cattle ranchers that cattle sold at an averageprice cannot provide a price signal on the quality of the individual animal.There was consensus among operations that this was of concern to producers.
One reason to disagree with this statement, other than having below-aver-age-quality cattle for sale, may rest with inconsistent cattle quality. A personwould not have a problem with selling at an average price, if the averagequality of all animals in a pen of cattle was a good reflection of the quality ofeach individual animal. Since more respondents agreed than disagreed withthis statement, this may also be interpreted as producers perceiving a problemwith cattle quality consistency. In other words, since producers agreed that theydid not like selling at average prices, they also indicated that variability in cattlequality was a problem.
Pricing at the average may contribute to the problem of cattle qualitybecause pricing at the average does not allow for below-average quality cattleto be discounted. In addition, it does not allow for premiums for above-averagecattle. Without this premium and discount price structure, individuals do not getthe desired price signal on quality attributes of their cattle. This may be evenmore significant with pooled sales as cattle are mixed across operations.
It appears that �Cow/calf� operations have given even less consideration topooling cattle than �Mixed & Feeder� operations. This may show that �Cow/calf�respondents were more independent than operations that feed weaned calves.In addition, results reported previously in Table 10 suggest that �Mixed� opera-tions had done more pooling (3.6%) than �Cow/calf� operations (2.5%).
Responses to the statement �I don�t like it (pooling) because I can�t sellwhen I want to� indicated that most operations were neutral or agreed. �Cow/calf� operations considered the restrictions on the flexibility of sale times asmore of a problem than �Mixed & Feeder� operations.

MARKETING PRACTICES OF ARKANSAS BEEF CATTLE PRODUCERS
31
Tab
le 1
5. R
espo
nses
of ‘
Cow
/cal
f’ an
d ‘M
ixed
& F
eede
r’ op
erat
ions
to s
tate
men
ts o
n pe
rcei
ved
draw
back
s of
poo
ling
cattl
e fo
r sa
le.
Sta
tem
ents
abo
utO
pera
tion
Str
ongl
yS
tron
gly
No.
of
χ2 -st
atis
ticpo
olin
g ca
ttle
for
sale
Typ
eA
gree
Agr
eeN
eutr
alD
isag
ree
Dis
agre
eR
espo
nden
ts(P
roba
bilit
y)--
----
----
----
----
----
----
---%
----
----
----
----
----
----
----
--I
don'
t lik
e to
sel
l my
cattl
eC
ow/c
alf
9.7
30.1
48.2
10.4
1.5
740
7.77
2at
the
aver
age
pen
pric
eM
ixed
8.4
26.3
45.8
17.4
2.1
190
(0.1
00)
All
9.5
29.4
47.7
11.8
1.6
9301
I ha
ve n
ot t
houg
ht a
bout
Cow
/cal
f11
.835
.432
.917
.62.
476
320
.686
pool
ing
cattl
eM
ixed
7.3
26.0
27.0
22.4
7.3
192
(0.0
01)
All
10.9
33.5
33.7
18.5
3.4
9551
I do
n't
like
it be
caus
e I
can'
tC
ow/c
alf
11.8
33.2
43.1
10.3
1.7
757
12.2
34se
ll w
hen
I wan
t to
Mix
ed6.
327
.649
.013
.04.
219
2(0
.016
)A
ll10
.632
.044
.310
.92.
294
91
1R
espo
nse
rate
s va
ried
from
88.
0% to
90.
4% w
hich
tran
slat
e to
127
to 1
02 m
issi
ng o
bser
vatio
ns, r
espe
ctiv
ely.

ARKANSAS EXPERIMENT STATION RESEARCH BULLETIN 957
32
Ranking of Opinions on Benefits of and Concerns about Pooling CattleSales
This section ranks the perceived benefits and concerns about pooling cattlesales on the basis of the combined percentage of respondents that either stronglyagreed or agreed to a statement. The statement with the highest percentagewould be considered the most important. Table 16 shows the proportions ofrespondents and rankings as they differ across operation type.
Clearly, the most important benefit to pooling was the availability of pricepremiums. Respondents ranked it as the number one perceived benefit by aconsiderable margin. A secondary benefit was transportation cost savings. Therather weak ranking of video auctions as a tool to pool cattle sales showed thatrespondents were either unclear about the statement or did not identify videoauction markets as a tool for pooling cattle. The rankings on perceived draw-backs about pooling were much less decisive. For �Cow/calf� operations, themost important drawback was a lack of knowledge about pooling followed by aperceived lack of flexibility regarding the timing of sales. Selling at averageprices was of least concern. By contrast, �Mixed & Feeder� operations rankedselling at average prices as the most important concern. These operations aremost concerned about overall quality and consistency in quality as explained inthe previous section on selling at average prices. The rankings in this columndiffered only marginally, however.
Table 16. Ranking of benefits and concerns about pooling cattle salesby operation type.
Cow/calf Mixed & Feeder All% of % of % of
Statement responses1 Rank responses1 Rank responses1 Rank
Benefits of Pooling:Price premiums 82.2 1 96.0 1 85.0 1Transportation cost savings 65.9 2 73.7 2 67.5 2Video Auctions 33.2 3 41.3 3 34.9 3
Concerns about Pooling:Selling at average price 39.8 3 34.7 1 38.9 3Knowledge about pooling 47.2 1 33.3 3 44.4 1Flexibility in the timing of sales 45.0 2 33.9 2 42.6 2
1 The combined percentage of respondents that strongly agreed or agreed with the statement outlined in theleft-most column.

MARKETING PRACTICES OF ARKANSAS BEEF CATTLE PRODUCERS
33
SUMMARY AND CONCLUDING COMMENTS
This report summarized information regarding marketing practices of cattle pro-ducers in Arkansas. The sample of respondents included 851 �Cow/calf� opera-tions that sell calves at weaning, 172 �Mixed� operations that are cow/calfoperations that also feed weaned calves and 34 �Feeder� operations that aresolely in the business of feeding weaned calves. The sample was representativeof 14.6% of cattle producers in Arkansas that have more than 50 but less than1,000 cows and replacement heifers. A brief summary of the key findings oneach of the production issues follows in point form:
Operator opinions on feeding weaned calves to heavier weights:� Both �Cow/calf� and �Mixed� operations ranked finance charges as the main
problem with feeding weaned calves on their farm. Price risk was thesecond-most-important concern. These problems may be related. A rela-tively clear implication of this is that farm lending institutions and producersalike need to evaluate and improve their risk-management practices inorder to lower the price risk (perceived or real) associated with financingfeeder cattle.
� Custom feeding weaned calves is not a common practice in Arkansas. Itmay be an opportunity for some producers if economies of size frompotentially reduced financing charges and from price premiums for larger,more-uniform lots of cattle can exceed transactions costs associated withbuilding trustworthy relationships between custom feeders and beef cattleproducers. It is interesting to note that only 1.6% of the respondents hadhad cattle custom fed in Arkansas. Another 8.4% of respondents had cattlecustom fed in adjoining states, mostly through retained-ownership pro-grams.
� Knowledge of animal performance data assists cattle producers in twodifferent ways: 1) it helps �Cow/calf� producers make breeding decisions;and 2) it aids �Mixed� operations when making purchasing decisions.
� Profits from feeding weaned calves were more of a consideration for pro-ducers that fed calves than for producers that did not. The implication isthat more producers need to be educated about this value-added produc-tion alternative.
Source of information and tools used for price forecasts:� The top two sources for price information are livestock auction prices and
livestock reports. Operations that fed weaned calves used these sourcesand �Other� information more than �Cow/calf� operations. Among these�Other� sources or tools, contractual arrangements were quoted least often.Feeder cattle futures and options prices were the second-most-importantmethod used by �Feeder� operations.

ARKANSAS EXPERIMENT STATION RESEARCH BULLETIN 957
34
Decision criteria used for sell vs. hold and feed decisions:� �Feeder� operations were most likely to calculate profits for each lot of cattle
they processed. �Mixed� operations were least likely to feed calves accord-ing to rigid age and weight criteria but concentrated instead on moreflexible criteria. A �Cow/calf� operation�s selling decisions may be moreaffected by non-price issues such as breeding, culling and weaning con-straints that impact these operations more than �Mixed� or �Feeder� opera-tions.
Use of different marketing methods:� Auction barns were the most common marketing method used by all three
types of operations. Slightly over 80% of all cattle traded moved throughsale barns. The second-most-common method, in terms of cattle traded,was direct sales to stocker or backgrounder operations, feedlots and con-tractual sales. Video auction sales and selling cattle together with otherproducers was least common. �Cow/calf� and �Mixed� operations pooledcattle the most, as benefits from larger lot sizes are likely a more importantfactor for smaller operations. By contrast, �Feeder� operations did not usethis marketing method at all.
� Minimum cattle transaction numbers per respondent were smaller thanexpected for many of the marketing options. This indicates that smallerproducers were able to pursue marketing alternatives other than selling atthe sale barn. Among the largest minimum numbers per respondent weredirect sales to feedlots and contractual sales with a minimum of 15 head/respondent. These latter categories may not be readily available to smallproducers.
� Differences in average trade volume per respondent across operation typefor the eight marketing alternatives showed that �Feeder� operation had thelargest average cattle trade per respondent, followed by �Mixed� and �Cow/calf� operations in the �Cash� marketing category.
Frequency of consulting price information by cattle characteristics and source:� �Cow/calf� operations compared prices across weight categories less often
than operations that feed weaned calves. This was likely a function of theirlack of interest in feeding calves.
� Operations that feed weaned calves focus more on external sources ofprice information than �Cow/calf� operations. In general, �Cow/calf� opera-tions compared prices less often than operations that feed weaned calves.
Opinions regarding pooled sales:� Clearly the most important benefit to pooling was the availability of price
premiums for larger, more uniform lots of cattle. Respondents ranked it astheir number one benefit by a considerable margin. A secondary benefitwas transportation cost savings.

MARKETING PRACTICES OF ARKANSAS BEEF CATTLE PRODUCERS
35
� �Cow/calf� operations appeared less familiar with this marketing optionthan �Mixed & Feeder� operations. A secondary concern was the perceivedlack of flexibility regarding the timing of sales. Selling at average prices wasof least concern. By contrast, �Mixed & Feeder� operations ranked selling ataverage prices as the most important concern.
Overall, the data suggested that the producers were more in agreement aboutthe rankings of benefits than those of concerns about pooling cattle.
In summary, it appears that �Cow/calf� operations pay least attention tomarketing and that there may be some profitable opportunities to value-addedmarketing alternatives in-state, if risk-management and financing concerns areaddressed. The major benefits to a more marketing-oriented �Cow/calf� pro-ducer may lie in focusing on pooling cattle to take advantage of price premiumsthat appear to be available for larger, more-uniform lots of cattle. The data alsorevealed that access to and explanation about external sources of informationmay be a key to informing producers about these marketing opportunities.
LITERATURE CITED
Arkansas Agricultural Statistics Service. 1996. Selected unpublished statistics collectedby Arkansas Agricultural Statistics Service.
Feuz, D.M., and J.J. Wagner. 1996. Retained ownership: Understanding performancerisk and evaluating marketing alternatives. Journal of the American Society of FarmManagers and Rural Appraisers 60:65-71.
Gage, K. 1993. Arkansas steer feedout and carcass project (1992-93). Sponsored by theUniversity of Arkansas Cooperative Extension Service, Livestock Market News.
Gage, K. 1994. Arkansas steer feedout and carcass project (1993-94). Sponsored by theUniversity of Arkansas Cooperative Extension Service, Livestock Market News.
Huntsberger, D.V., and P.P. Billingsley. 1987. Elements of statistical inference. SixthEdition. Allyn and Bacon, Inc., Boston, Massachusetts.
Johnson, L.A., K.W. Ferguson and E.L. Rawls. 1989. Risk-return comparisons ofTennessee Feeder Cattle Backgrounding Systems. Journal of the American Societyof Farm Managers and Rural Appraisers. 53:41-46.
Pardue, M.D., M.P. Popp and C.R. Garner. 1997. Feeder cattle production budgets forArkansas, 1996: Estimated costs and returns at specified situations. University ofArkansas Cooperative Extension Service Technical Bulletin, forthcoming.
Popp, M.P., and L.D. Parsch. 1997. Production practices of Arkansas beef cattleproducers. University of Arkansas Agricultural Experiment Station Research Bulletin956.
Salant, P., and D.A. Dillman. 1994. How to conduct your own survey. John Wiley &Sons, Inc., New York, New York.
Watt, D.L., R.D. Little and T.A. Petry. 1987. Retained ownership is an option for cow-calf operations. Journal of the American Society of Farm Managers and RuralAppraisers. 51:80-87.

ARKANSAS EXPERIMENT STATION RESEARCH BULLETIN 957
36
APPENDIX A: SURVEY INSTRUMENT

MARKETING PRACTICES OF ARKANSAS BEEF CATTLE PRODUCERS
37

ARKANSAS EXPERIMENT STATION RESEARCH BULLETIN 957
38

MARKETING PRACTICES OF ARKANSAS BEEF CATTLE PRODUCERS
39

ARKANSAS EXPERIMENT STATION RESEARCH BULLETIN 957
40

MARKETING PRACTICES OF ARKANSAS BEEF CATTLE PRODUCERS
41