Embed Size (px)
Citation preview

© Copyright The Business Tools Store, 2011 www.businesstoolsstore.com
12/1/2011
Marketing Budget Excel
Template User Guide
Marketing budget Excel
The Marketing Budget Excel template, incorporating variance analysis and
reporting allows you to develop a monthly marketing budget for any
number of marketing expenditure line items. It incorporates features such
as expenditure categories with subtotals, and an unlimited number of
expenditure items within each category. Current year expenditure and
projected + or — % change can be used to calculate next year’s budget. Up
to 20 seasonal expenditure patterns that can be applied to each individual
expenditure line. The annual marketing budget can be presented and
printed in tabular and graphic chart formats.

12/1/2011
© Copyright The Business Tools Store, 2011 www.businesstoolsstore.com 1
MARKETING BUDGET EXCEL TEMPLATE
USER GUIDE
Marketing budget Excel
INTRODUCTION The Marketing Budget Excel template, incorporating variance analysis and reporting allows
you to develop a monthly marketing budget for any number of expenditure line items. It
incorporates features such as expenditure categories with subtotals, and an unlimited
number of expenditure items within each category. Current year expenditure and projected +
or — % change can be used to calculate next year’s budget. Up to 20 seasonal expenditure
patterns that can be applied to each individual expenditure line. The annual marketing
budget can be presented and printed in tabular and graphic chart formats.

12/1/2011
© Copyright The Business Tools Store, 2011 www.businesstoolsstore.com 2
USER INSTRUCTIONS
BUDGET SET-UP AND DEVELOPMENT
The EXCEL model has a simple Menu system which at cells A1 to D26 of the Budget Data
worksheet (figure 1). There are two menus; one for budget setup/data entry and a printing
menu. It may be useful to print out, for reference, the various input forms. Prior to entering
data the user should select which currency s/he wishes to use in formatting reports. This can
be done by clicking on the chosen currency symbol in the dialog box to the immediate left of
the Set Up/Data Entry menu (cell A11 of the Budget Data worksheet). Note this refers only
to the currency symbol used in reports and is NOT a currency conversion routine.
Figure 1
Set Up
Enter the Budget Title and Start Month/Year (Title option in Set Up/ Data Entry Menu
Figure 1). These are used to format reports
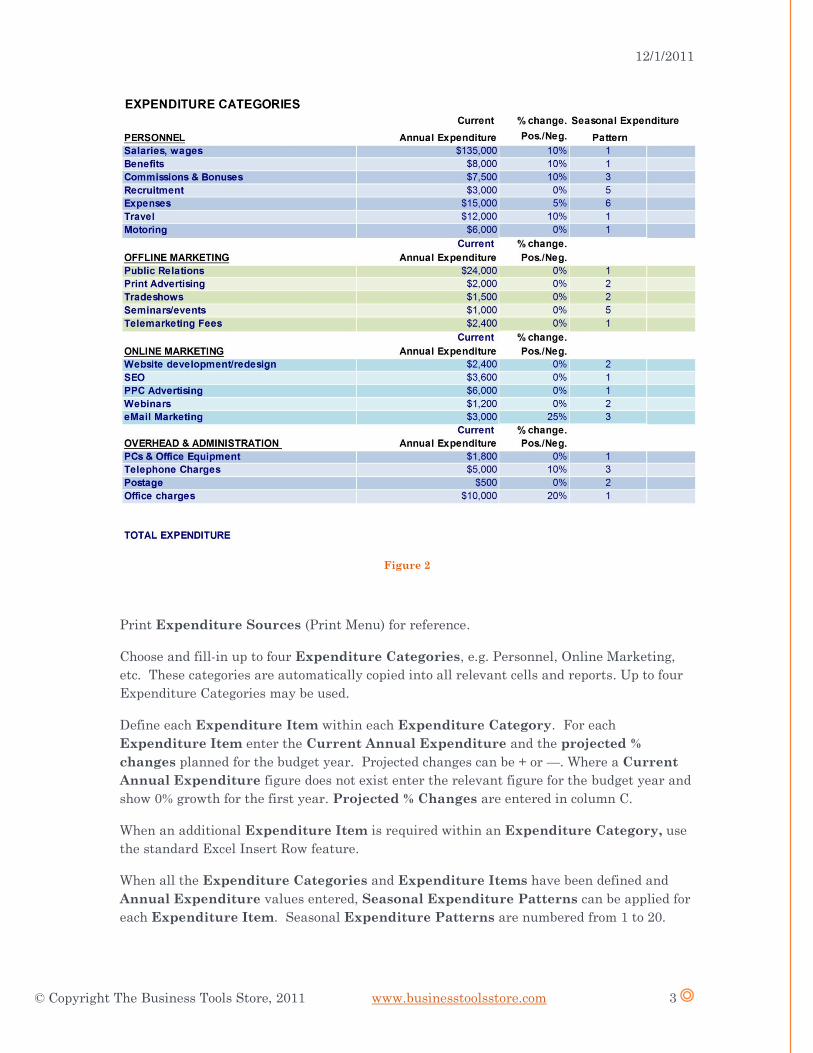
Next, enter Budget Expenditure Items as per figure 2 below.
12/1/2011
© Copyright The Business Tools Store, 2011 www.businesstoolsstore.com 3
Figure 2
Print Expenditure Sources (Print Menu) for reference.
Choose and fill-in up to four Expenditure Categories, e.g. Personnel, Online Marketing,
etc. These categories are automatically copied into all relevant cells and reports. Up to four
Expenditure Categories may be used.
Define each Expenditure Item within each Expenditure Category. For each
Expenditure Item enter the Current Annual Expenditure and the projected %
changes planned for the budget year. Projected changes can be + or —. Where a Current
Annual Expenditure figure does not exist enter the relevant figure for the budget year and
show 0% growth for the first year. Projected % Changes are entered in column C.
When an additional Expenditure Item is required within an Expenditure Category, use
the standard Excel Insert Row feature.
When all the Expenditure Categories and Expenditure Items have been defined and
Annual Expenditure values entered, Seasonal Expenditure Patterns can be applied for
each Expenditure Item. Seasonal Expenditure Patterns are numbered from 1 to 20.

12/1/2011
© Copyright The Business Tools Store, 2011 www.businesstoolsstore.com 4
Pattern 1 is the default pattern and spreads the annual expenditure evenly over the 12
months. Seasonal Patterns are entered in column D.
Seasonal Expenditure Patterns (figure 3) can be entered or edited by selecting the
appropriate menu option from the Set Up/Data Entry Menu. The 12 monthly figures are
entered as a percentage of the annual expenditure, with the sum of the 12 monthly adding to
100%. If the total does not add to 100% this is highlighted to the immediate right of the
figure entered for month 12. The Seasonal Expenditure Pattern table can be printed for
reference by selecting the appropriate option from the Print Menu. Any Seasonal
Expenditure Pattern can be created by editing one of the 20 entries in the table; for
example, if one was budgeting to attend a tradeshow in August and this represented all of
the planned tradeshow expenditure for the year, the appropriate Seasonal Expenditure
Pattern would be to enter 100% for August and 0% for each of the other months.
Figure 3
Once the data has been entered the Monthly Budget by Expenditure Category and
Expenditure Items is calculated as shown in Figure 4 below and a graphic representation is
produced as shown in Figure 5 below.
Figure 4

12/1/2011
© Copyright The Business Tools Store, 2011 www.businesstoolsstore.com 5
Figure 5
Note
The balance of the guide only applies to the Marketing Budget & Variance Template that
incorporates Variance analysis and reporting. This template is available from The Business
Tools Store.
EXPENDITURE ENTRY AND BUDGET VARIANCE CALCULATION
Once the budget has been approved actual expenditure can be entered on a monthly basis
and variance analysis produced.
Select Enter Expenditure from the Set Up/Data Entry menu.
The Actual Expenditure table as depicted in figure 6 below is displayed.
Figure 6

12/1/2011
© Copyright The Business Tools Store, 2011 www.businesstoolsstore.com 6
Enter the actual Expenditure amount for the relevant Expenditure Item for the
appropriate month.
The figures entered are compared to the corresponding budget figure and the Variance is
calculated.
To view the Variance table select Go to Budget Variance from the Set Up/Data Entry
menu. The Variance table is as depicted in figure 7 below.
Figure 7
Positive variances are shown in green and negative variances are shown in red. To view the
Year-to-Date variance select the appropriate month (1 to 12) from the YTD Month as
highlighted item 1 in figure 6. The monthly variances are displayed up to and including the
selected month. The Total YTD Variance is shown in the right most column of the table as
depicted in item 2 above.
OUTPUT
The following outs can be selected and printed from the Print menu:
Marketing Budget (figure 8)
Monthly Expenditure (figure 9)
Variance Report (figure 10)
Category Budget Chart (figure 11)
Monthly Variance Chart (figure 12)
1 2

12/1/2011
© Copyright The Business Tools Store, 2011 www.businesstoolsstore.com 7
Figure 8
Figure 9
Figure 10

12/1/2011
© Copyright The Business Tools Store, 2011 www.businesstoolsstore.com 8
Figure 11
Figure 12
END