Embed Size (px)
Citation preview

Transportion 19: 177-196, 1992@ 1992 Kluwer Academic Publishers. Printed in the Netherlands.
Market segmentation analysis of potential inter-city railtravelers
ERIC I. PASl & JOEL C. HUBER21 Department of Civil and Environmental Engineering, and 2 Fuqua School of Business,
Duke University, Durham, N.C. 27706, USA
Key words: market segmentation, intercity rail demand, travel forecasting, stated preference
Abstract. This paper reports on one aspect of a study conducted to support the analysis ofthe perfonnance of a proposed intercity rail passenger service in the Piedmont region of NorthCarolina. In particular, this paper describes a market segmentation study of potential rail trav-elers on the basis of the responses of 333 participants in a computer-based, mall-intercept,market research survey.
The paper overviews the design and implementation of the computer-based survey of poten-tial rail travelers and discusses the approach used in the identification and interpretation of themarket segments. The five identified traveler groups are characterized and the implications ofthe market segmentation results are discussed. These five segments are: (1) functional traveler,(2) day tripper, (3) train lover, (4) leisure-hedonic traveler, and (5) family traveler.
The five groups identified in the market segmentation analysis provide a rich descriptionof the potential rail market in the study corridor. The composition and characteristics of thesegroups indicate that the intercity rail travel market may have a complex structure that wouldbe masked by the traditional business/non-business dichotomy. The characterization of theintercity rail travel market by the five identified segments provides rail service managers withvery useful information for service planning and marketing.
Introduction and background
The 'Carolinian ' passenger train service operated in the Charlotte-Greensboro-
Raleigh corridor of the Piedmont region of North Carolina during the periodOctober 1984 to September 1985. This service, which was operated by Amtrakand sponsored jointly by Amtrak and the State of North Carolina, providedthrough service to the Northeastern United States, as well as local servicewithin North Carolina.
Following the termination of the 'Carolinian' service in the fall of 1985,officials of the State of North Carolina sought to restore rail passenger servicethrough the Piedmont of North Carolina. The research described in this paperis drawn from a study designed to support the analysis of the operation of inter-city rail passenger service in the Piedmont region of North Carolina. At thetime the study was designed, the Public Transportation Division (PTD) ofthe North Carolina Department of Transportation (NC DOT) was considering

78
the possibility of operating a local train service in the Charlotte-Raleigh-Rocky Mount corridor. As a result, the study focussed on the ridership inthis corridor, which is hereafter referred to as the study corridor.
The overall goal of the study was to examine the demand for intercity railpassenger service in the study corridor. Specifically, the major objectives ofthis study were as follows. First, to develop a demand forecasting tool thatcould be used to estimate the ridership and revenue for alternative rail servicesthat might be provided in the study corridor. Second, to characterize themarket for intercity passenger rail service in the corridor of interest. This paperfocusses on the latter of these objectives, while Pas et. al. (1991) provide adetailed account of the complete study.
An important concept in marketing research is that a consumer marketcan be divided into identifiable groups sharing similar tastes, preferencesand/or behaviours with respect to a particular product or service. Thesesegments are based on similarity among the members of a given group anddifferences between the members of different groups. This approach to under-standing the market, termed market segmentation, has been used extensivelyin market research over a long period of time (see, for example, Engelet. al. 1972; Dickson & Ginter 1987; Hauser & Simmie 1981; Yankelovich1964). Market segmentation has also been used in a variety of transportationstudies in the past 15 years, one of the first applications being a public transitstudy by Lovelock (1975).
The basic idea of market segmentation analysis is that there are groups ofconsumers that are similar to one another, yet different from other consumers.Further, if one can identify such groups (or market segments) one will havea better understanding of the structure of the market for some product orservice and therefore be able to do a better job of designing, operating, andmarketing the product or service.
As part of the effort to understand the market for intercity passenger railservice in the study corridor, the study team conducted a market segmenta-tion analysis of potential travelers on the planned rail service. The purposeof this paper is to describe this aspect of the overall study, including theapproach used and the results obtained, as well as an examination of theimplications of the results.
The remainder of this paper is organized as follows. In the second section,we present the design of the study from which the results reported in this paperare drawn, and we describe the methodology used in deriving and inter-preting the market segments. In the third section we present, interpret, anddiscuss the results of the market segmentation analysis. The final sectionsummarizes the paper and presents our conclusions.

.79
Study design and methodology
A computer-based survey of potential rail travelers was conducted at shoppingmalls in the four largest cities in the study corridor in order to develop anunderstanding of the needs and preferences of potential riders in this corridor.This computer-based survey had two specific objectives: first, to obtainestimates of the sensitivity of potential travelers to changes in rail traveltime, travel cost, service frequency, food service, and seating type. Thisinformation was needed for the incremental demand forecasting model thatwas to be developed. The second objective of the survey was to provideinsight into the characteristics of potential rail travelers in the study corridor.In particular, we sought information that would be helpful in the marketingand operation of the rail service. The survey procedures we employed in thisstudy are described in some detail below, but readers interested in more detailare referred to the report on the overall study (Pas et. al. 1991).
There are two aspects of the study methodology that warrant elaborationhere; namely, the determination of consumer preferences, and the identifica-tion and interpretation of the intercity rail traveler market segments. These twoaspects are discussed separately below.
Determination of consumer preferences
The computer-based market research survey of potential train riders in thestudy corridor was conducted between August and October, 1989 in shoppingmalls in the four largest cities along the study corridor (Charlotte, Greensboro,Durham & Raleigh). Potential respondents were approached at a mall and weredisqualified from participating in the survey if they were either under 18years of age or if they indicated that they would never ride on the proposedtrain service (thus, we refer to the respondents as "potential" rail travelers).Therefore, the sample disproportionately includes those who are potentialrail travelers and who shop in the selected malls. While it is possible toproject our data to the population in general, the main purpose of the consumerpreference study was to get detailed reactions to the rail service from likelyriders and thereby help fashion a service that would appeal to thesepotential riders.
After being screened, the respondent was led to a room in which theinterview was completed on a personal computer. This interview collected avariety of information from respondents, including their attitude toward andexperience with riding an intercity train, the characteristics (origin, destina-tion, purpose, frequency, etc.) of the train trip the respondent would most likelytake, and the sociodemographic characteristics of the respondent and his/herhousehold. In addition, a major component of the survey was designed to obtain

180
information about each respondent's preferences for a variety of transporta-tion service attributes.
The rail service and related transportation system attributes included inthe study were determined through discussions with the staff of the PTD ofthe NC DOT. These discussion identified two sets of attributes. First, thosevariables that were of primary concern to the PTD of the NC DOT in termsof rail service design. As these variables were to be included in the demandforecasting model, we required estimates of the sensitivity of ridership (andrevenue) to changes in these variables. These sensitivities were determinedusing conjoint (or trade-off) analysis, as described below.
A second, much larger, set of characteristics of the transportation environ-ment was also identified. These characteristics were of great interest from apolicy and management standpoint, but were too numerous to be included inthe demand forecasting model. Therefore, we only attempted to gauge therelative importance of each of these secondary attributes for rail ridership.
The five primary rail service attributes that were included in this studyare listed in Table 1. This set includes three rail service attributes that arecommonly accepted as being important to rail travelers; namely, rail traveltime, cost, and number of departures per day. The other two attributes in thisset, food service and seating type, are generally not considered to be primaryfactors affecting mode choice, but they might be relatively important in thecontext of the type of service examined in this study. Further, these charac-teristics were actively being examined by the staff of the PTD of the NCDOT. In particular, at the time the survey was being planned, the NC DOTwas considering the purchase or lease of rail cars and they wished to knowhow much difference the type of seating and food service would make torail ridership and revenue. Thus, the food service and seating attributes wereconsidered primary attributes in this study for policy reasons.
Table I. The primary rail service attributes included in the study.
LevelsAttribute
Rail travel timeRail fareNumber of daily departuresFood service
Seating
Base time, base time :t 10%Base cost, base cost :t 15%1, 2, 3 trains per dayNone, vending machine, snack barCommuter seats, airline seats
The sensitivity of potential rail travelers to changes in the five attributeslisted in Table 1 was examined using the approach known as conjoint (or trade-off) analysis. The trade-off information is provided by respondents in thecontext of hypothetical choices, therefore this approach falls into the class

181
of data acquisition and analysis generally referred to in the recent trans-portation literature as stated preference techniques. The latter are distinguishedfrom revealed preference techniques in which the respondent is assumed,through actual choices made, to reveal his/her preferences for various attributes.That is, in revealed preference studies one infers the trade-offs being madeamong the attributes by observing the actual choices that consumers have made.A brief introduction to conjoint analysis is given below primarily to intro-duce the unfamiliar reader to the terminology used in connection with this
technique.Conjoint analysis is a way to estimate an individual's preferences for
potential or actual products in the market. Conjoint analysis has been in usein the marketing research community since it was introduced over 20 yearsago (Green & Rao 1971). Conjoint analysis, sometimes called "trade-offanalysis", asks respondents to choose between descriptions of products, orprofiles, that differ on one or more attributes. In making their choice,respondents have to trade off between the various attributes.
For example, a respondent might be asked to choose between a train servicethat took 3 hours and cost $25 versus one taking 2 1/2 hours but costing$35. In effect, the respondent must decide if the 30-minute reduction in traveltime is worth the extra $10 in fare. From a number of such questions (inwhich the levels of the relevant attributes are varied systematically) it ispossible to develop a model that allows the analyst to predict what eachrespondent's preference would be for a profile that is made up of any com-bination of the attributes tested (Green & Srinivasan 1978).
The above example descriptions (profiles) of a possible train service includetwo attributes; namely, rail travel time and cost. Further, each attribute inthis example is set at one of two discrete levels (fare is set at $25 or $35,and travel time is set at 2 1/2 or 3 hours). In our study, respondents werepresented with service descriptions comprising either two or three of the fiveattributes listed in Table 1. In each profile, each service attribute was sys-tematically set to one of the levels shown for that attribute in Table 1.
Conjoint analysis has been used quite extensively in travel demand analysisand modeling because of its unique ability to estimate market potential for abroad range of possible services. In particular, conjoint analysis has beenused to estimate potential travelers' reaction to new transportation services andtheir preferences for the attributes of such services as high speed rail (see,for example, Hensher et. al. 1989). Analysis of user's reactions to a newservice poses a particular problem in that the standard revealed preferenceapproach may not be applicable. In this situation, stated preference tech-niques are often used; conjoint analysis is the most commonly used statedpreference method in transport research. A recent special issue of the Journalof Transport Economics and Policy (Bates 1988) contains a series of papers

182
devoted to the topic of "Stated Preference Methods in Transport Research".We used conjoint analysis in this study to develop a preference mapping
across the five primary rail service attributes listed in Table 1. From thesurvey data we were able to estimate each respondent's preferences for anycombination of these attributes. That is, the survey data allowed us to develop,for each individual, a (linear) utility function in which the parameters reflectthe relative importance of each attribute to that individual.
The results from this portion of the survey allow the estimation of a modelfor the stated probability (pJ that an individual chooses to ride a train witha given set of service characteristics. This model has the general form:
Pi = 11(1 + EXP -(80 + at VJ) (I)
where
v i is the utility of a particular train service to respondent i,ao and al are parameters estimated by least squares regression, andEXP is the exponential operator.
The utility to respondent i of a given train service is given by:
(2)
where
v ijk is the "part-worth" utility to respondent i of a train service with
level k on attribute j, and
x. = 1 if the train service has level k on attribute jJk 0, otherwise
The part-worth utilities (V ijk' in Equation 2) and parameters ao and at (inEquation I) are estimated by the computer program employed in this research(see below). The part-worth utilities were obtained for the levels of the fiveattributes that were presented to each respondent (see Table I). These part-worth utilities were used as inputs in the procedure to identify the marketsegments, as explained subsequently.
Our use of conjoint analysis is somewhat different from the typical formof conjoint described in Green & Srinivasan (1978) in two respects. First,we used a commercially available, personal computer form of conjoint calledACA (Adaptive Conjoint Analysis, Sawtooth Software, 1986). This packageuses a procedure that combines direct measures of attribute importancewith the more typical pairwise judgements on profiles. The attribute impor-tance judgements assess the relative importance of, say, a 30 minute increase
183
in travel time compared with a $10 decrease in fare. ACA then combinesthese judgements with paired preference judgements (described below) todevelop a preference model (Equation 1) for each respondent. Various aspectsof ACA's methodology are discussed in detail in Green, Krieger & Agarwal(1991). Using two forms of questioning enables the procedure to achievegreater reliability for the estimated parameters in the preference model withfewer questions.
A second way in which our application of conjoint differs from most appli-cations of the technique is in the use of customized attribute levels for railfare and travel time, the two attributes of the rail service that would dependgreatly on the origin and destination of the trip. Typically, attribute levels testedduring a conjoint study are generic in that they are the same for all respon-dents. In our case, the attribute levels of rail travel time and fare wereindividualized depending on which of the 11 cities the respondent identifiedas the origin and destination for his/her most likely train trip.
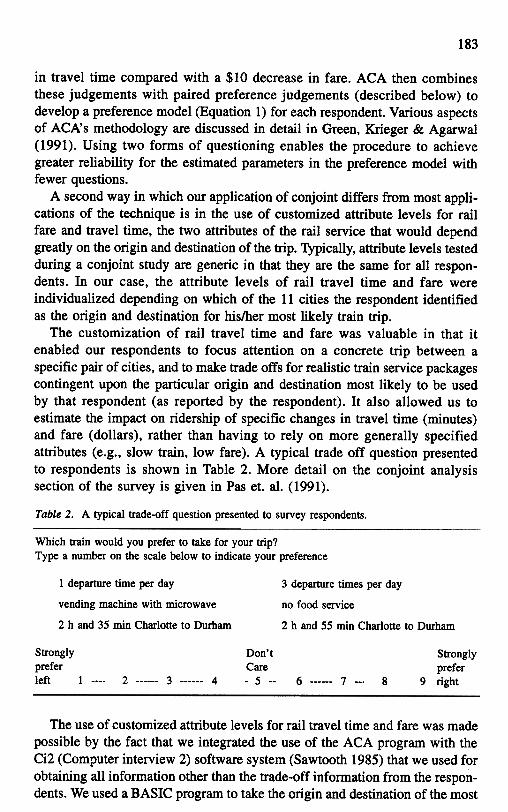
The customization of rail travel time and fare was valuable in that itenabled our respondents to focus attention on a concrete trip between aspecific pair of cities, and to make trade offs for realistic train service packagescontingent upon the particular origin and destination most likely to be usedby that respondent (as reported by the respondent). It also allowed us toestimate the impact on ridership of specific changes in travel time (minutes)and fare (dollars), rather than having to rely on more generally specifiedattributes (e.g., slow train, low fare). A typical trade off question presentedto respondents is shown in Table 2. More detail on the conjoint analysissection of the survey is given in Pas et. al. (1991).
Table 2. A typical trade-off question presented to survey respondents.
Which train would you prefer to take for your trip?Type a number on the scale below to indicate your preference
1 departure time per day
vending machine with microwave
2 h and 35 min Charlotte to Durham
3 departure times per day
no food service
2 h and 55 min Charlotte to Durham
Stronglypreferleft
Strongly
prefer9 right
Don't
Care-5 --2 3 41 6 7 --- 8
The use of customized attribute levels for rail travel time and fare was madepossible by the fact that we integrated the use of the ACA program with theCi2 (Computer interview 2) software system (Sawtooth 1985) that we used forobtaining all information other than the trade-off information from the respon-dents. We used a BASIC program to take the origin and destination of the most

184
likely trip selected by each respondent and to calculate the base travel timeand fare for this trip. The BASIC program wrote these attributes to a filethat could be used by the ACA software in developing the rail profiles to bepresented to each respondent. Our integrated use of the two software packagesis depicted in Fig. I. This diagram also provides a general description of theflow of each interview.
As noted above, we determined the relative importance of a set of 14 railtravel and related transportation environment characteristics in addition to thoselisted in Table 1. This secondary set of characteristics is listed in Table 3. Someof the attributes included in this set are not under the control of the operatorof the train service (for example, highway congestion), yet all these charac-teristics (as well as some that were not included in the survey) potentially affectridership on the rail service in the study corridor. The relative impact of eachof these secondary factors with respect to rail ridership was estimated byasking each participant to respond to a set of questions asking how that factor(e.g. the availability of alcohol on board the train) would affect the respon-dent's likelihood of using the train (see Table 4 for an example questionfrom this portion of the survey).
In addition to the preferences of potential train travelers, the survey obtainedinformation concerning the socio-demographic characteristics of the respon -
dents and their households. These characteristics included each respondent'sage, marital status, employment status and occupation. In addition, the fol-lowing household characteristics were obtained in the survey: number of
Table 3. The secondary rail service and related attributes.
.Train reservations available through Ticketron at an additional cost of $2.00 per ticket
.Free telephone reservations
.Convenient connection with trains heading north to Richmond, Washington, D.C.and New York
.The availability of fold-down work surfaces and telephones
.The availability of beer and wine in special areas on the train
.A major increase in road congestion
.A major rehabilitation of the station in downtown { insert here origin city of the most likely
trip}.Moving the train station from downtown { insert here origin city of the most likely trip} to
a suburban location.A 50 cent per gallon increase in gasoline prices.Major construction delays on the roads between { origin city of the most likely trip} and
{ destination city}.A 50% increase in bus fares.A "First Class" area of the train costing 50% more with special seats and better views of
the countryside.A train where smoking is not permitted.Separate smoking and non-smoking areas on the train

185
Table 4. Example secondary attribute importance question.
How much would free telephone reservations change the Likelihood you would take the train?
I Strongly increase likelihood to take train2 Somewhat increase3 Slightly increase4 No change in likelihood5 Slightly decrease6 Somewhat decrease7 Strongly decrease the likelihood to take train
people, number of children, household income, and number of cars. Eachrespondent's experience with, and attitudes toward intercity train travel wasalso obtained in the survey (see Fig. 1).
INTERVIEW SOFTWARE PACKAGE ICi21
Determines respondent's Individual household characteristics.
Fig. 1. Linkage between the computer interview (Ci2) and conjoint (ACA) software packages.
Identification and interpretation of the market segments
There are essentially two different approaches to market segmentation. Inthe first approach, one hypothesizes that certain consumer groups have

186
different needs and preferences and that they therefore have different behav-ioral responses. In this approach, the groups are specified a priori and theanalyst examines the needs, preferences, or behaviors of the members of thevarious groups to identify any differences among the groups. This approachis termed a priori market segmentation.
In this study we examined a number of possible a priori segmentationschemes including the traditional business/non-business traveler segments. Thelatter investigation revealed few systematic differences between business andnon-business travelers in this case, despite the fact that it is generally believedthat there are considerable differences between business and non-businesstravelers, especially in relation to their preferences for transportation serviceattributes. The results reported below show that the intercity travel marketin the study corridor has a much more complex structure than would beindicated by a simple business/non-business dichotomy.
In the second approach to market segmentation, the consumer groups arenot specified a priori, rather they are identified by grouping those individ-uals having similar needs, preferences, and/or behaviors. Once these groupsare identified, the analyst examines these groups to identify whether thedifferences are interpretable and meaningful. This step involves the exami-nation of the characteristics of the groups using both the variables employedin identifying the groups as well as other relevant attributes.
The general set of techniques that may be used to group entities is knownas cluster analysis (Everitt 1980) since it identifies groups (or clusters) ofobservations that are similar with respect to the variables of interest. Forexample, if one were interested in identifying groups of consumers havingsimilar daily urban travel patterns, one might try to group them on the basisof the number of daily trips they make, as well as the average trip length.
The market segments, regardless of the approach employed in identifyingthem, are used in a number of ways. For example, they are often very helpfulin the development of marketing and service plans. It is also common in thedevelopment of choice models to allow the parameters (or a sub-set thereof)to vary across the market segments, with the idea that individuals in thedifferent segments place differential importance on the attributes of the productor service to which the choice model applies.
The purpose of the market segmentation analysis in this study was toidentify groups of travelers having similar needs and preferences for theattributes of the planned rail service, so as to assist in the development ofservice and marketing plans. In this context, one would expect, for example,some travelers to have a strong preference for a fast and frequent rail service,while others might be more concerned about the type of seating and foodservice on board the train. Such information is invaluable in developing
service and marketing plans.

187
The market segments described in the following section were identifiedby performing a cluster analysis on the part-worth utilities (see Equations 1and 2) for the attributes in Table 1 and the importance weights for the attributesin Table 3. The groups identified by the cluster analysis were interpreted byexamining personal and trip characteristics of the members of each group aswell as identifying the rail service features that are important or unimportantto the 9 members of the group. The characterization of each group wasaccomplished by comparing the members of each group to the sample as awhole, and identifying those characteristics that distinguish the members ofeach group from the rest of the sample.
The following section reports on and discusses the results of the market
segmentation study.
Results and interpretation
Cluster analysis
The objective of the cluster analysis was to identify groups of potential railtravelers in the study corridor having similar needs, preferences, dislikes,etc. for rail and related intercity travel services. To accomplish this objec-tive, we grouped the respondents on the basis of their sensitivities to the 5primary rail service attributes shown in Table 1 (measured by the part-worthutilities), and the importance of each of the 14 other rail service and relatedattributes included in the survey. That is, the groups were identified basedon each respondent's "score" on the 19 variables in these two sets.
Prior to performing the cluster analysis, we standardized the variables ineach of the 2 sets, within each observation, to a zero mean and unit standarddeviation. This standardization procedure is described by Equation (3), andwas performed for each of the two sets of variables.
s.. = (r.. -r. ) / a.IJ IJ I I (3)
where
Sij is the standardized score for individual on variable jr ij is the score of individual i on variable jri is the mean score of individual i on the variables in the set,
andO'i is the standard deviation of individual i's scores on the variables in
the set.
Following the standardization shown in Equation (3), each of the 19 variables

188
was scaled across the 333 respondents to obtain a zero meaD and unit standarddeviation for each variable.
The 19 variables, normalized within and across respondents as describedabove, were used as input to the FASTCLUS procedure in the SAS package(SAS, 1985). FASTCLUS is a non-hierarchical, agglomerative cluster analysisalgorithm that is patterned after Hartigan's (1975) leader algorithm andMacQuenn's (1967) k-means algorithm.
Clustering techniques define the members of each cluster, based on theuse-specified input data, for a given number of clusters. That is, once one spec-ified the dimensionality of the solution, the cluster analysis defines the groupmemberships. Often, however, the analyst does not have a preconceivednotion of how many clusters will be appropriate in a given case. In this sit-uation, one can examine the solution for different numbers of groups and selectthe appropriate solution(s) to be examined in more detail.
In selecting the appropriate number of clusters, one tries to balance twoconflicting considerations. On the one hand, if a given number of entities isgrouped into a small number of clusters, the groups will tend to be hetero-geneous and difficult to interpet. On the other hand, if there are too manyclusters, two issues arise -one or more clusters may be too small to bemeaningful, and the benefit of the clustering diminishes (in the extreme weare back where we started, as each entity is a cluster of one member).
On the basis of an initial investigation of various groupings, we decidedto examine the five cluster solution in detail. The primary criterion for selectingthe number of groups was the interpretability of the various solutions, whileconsideration was also given to group size. Table 6 shows the distributionof the 333 observations across the five clusters. We should stress here thatbecause of the sampling technique employed in conducting the survey ofpotential travelers, we do not believe that one can infer too much about therelative sizes of these groups in the population at large, although Groups Aand B are likely to be larger than Groups D and E (see group descriptionsand sizes in Table 6).
Characterization of the identified market segments
In order to characterize each of the five groups identified by the clusteranalysis, we examined differences between the members of the groups alongsix dimensions. These dimensions, listed in Table 5, range from the personaland household characteristics of the travelers in the group to the attributesof alternative travel modes that would encourage train use by the membersof the group.
Each group is characterized by those variables comprising each of the six

189
dimensions that distinguish the respondents in that group from the respondentsin the other groups. Table 6 shows the variables on which the members ofthat group appeared to be different from the rest of the sample. In some casesthe differences would be found to be statistically significant, while in othercases they would not. Table 6 groups the distinguishing variables under eachof the dimensions identified in Table 5. The important consideration is thatthe characteristics of each group shown in Table 6 are those on which thegroup's members tend to be different from the rest of the sample. For example,in examining the personal characteristics of Group A as reported in Table 6,the reader should interpret this as indicating that the members of the grouplabelled here as the "functional traveler" tend to have a higher income andtend to have a higher proportion of people employed full-time, in compar-ison with the rest of the sample.
Table 5. Dimensions used in characterizing the identified groups.
Personal & household characteristicsCharacteristics of the most likely train trip by the respondentImportant positive features (travelers need/care about these attributes)Important negative factors (travelers do not want these characteristics)Attributes that are not important (i.e. attributes where poor service would be tolerated)Factors that would encourage train use (problems with other modes that would encouragetrain ridership)
Most of the characteristics of the travelers in each group, as well as theirneeds, likes and dislikes, are consistent with prior expectations or they areeasily understood as reasonable. There are however, some unexpected, yetmeaningful results to be found in Table 6. The insights gained from theseresults are highlighted in the discussion of each group below.
Discussion and interpretation of the cluster analysis results
T'fle rail service is more likely to be successful if it can capture riders froma number of market segments, and therefore the characteristics of the dif-ferent segments need to be borne in mind in developing service and marketingplans. This can best be done by tailoring promotional strategies to the needsand preferences of each segment. The major characteristics of each of thefive identified groups are summarized below.
Group A: the functional travelerAs the name indicates, the members of this group would travel by train ifthe service met their functional needs. That is. they would use the train for

190
Table 6. Descriptions of the five identified market segments.
Group A: the functional traveler (94)1
Personal/household characteristics:employed full-time, higher incomeless positive about the train service idea
Trip characteristics:Travels alone, not riding the train for fun
Needs/cares about:fast and frequent train service
Does not want:fIrst class area on the train
Will accept:poor food service
Would use train to avoid:congestion/other highway hassles
Group B: the day tripper (87)
Personal/household characteristics:male, younger, and single
Trip characteristics:travels with one other personshorter trips, returns same day
Needs/cares about:frequent service
Will accept/does not care about:road congestion
Would use train to avoid:higher bus fares
Group C: the train lover (70)
Personal/household characteristic:higher income, larger householdvery positive about train service ideahas traveled by train previously
Trip characteristics:riding the train is the purpose
Needs/cares about:low fare, food service
Does not want:separate smoking/non-smoking areas

191
Table 6 (continued)
Will accept/does not care about:slow trains, poor seats
Would use train to avoid:
higher gas prices
Group D: the leisure (or hedonic} traveler (51}
Personal/household characteristics:lower income, 2-person householdzero or one car
Trip characteristics:long trips, away more nightsnot for business
Needs/cares about:reservations, nice seatsalcohol served on board
Does not want:
smoking prohibited
Will accept/does not care about:infrequent service, slow trainshighway hassles
Group E: the family traveler (31)
Personal/household characteristics:female, larger householdfewer cars
Trip characteristics:
longer stay awaytravel with others (especially under 12)not to visit friends/relatives
Needs/cares about:fast trainsreservations, food servicefold-down work table, phone
Does not want:alcohol served on board
Will accept/does not care about:higher fares
the numbers in parentheses indicate the group sizes.

192
business, for sightseeing/vacation, or to visit friends or family, if fast andfrequent train service were provided. In particular, this group would tend touse the train to avoid highway hassles.
Group B: the day tripperThis group of travelers, in contrast with the functional travelers, is not moti -
vated to use the train by a desire to avoid highway congestion. This group doesappear to be sensitive to train service frequency, probably because of thedesire to make shorter trips (both in terms of distance traveled and in termsof returning home the same day). The members of this group also appearsensitive to increased bus fares.
Group c: the train loverThis group comprises those persons who would ride the train for the fun ofit. That is, the primary or secondary purpose of their most likely trip tendsto be "ride [the] train". These travelers tend to care about the fare, in spiteof the fact that they tend to have higher incomes than the sample as a whole.This is not surprising when one recognizes that since the train is being riddenpurely for pleasure, these folks don't want to spend too much money on theride. The train lover puts greater emphasis than other respondents on theavailability of food and the type of food service on board the train, probably
as a way to mingle with others and savor the trip.
Group D: the leisure (or hedonic) travelerThis group tends to be those not traveling for business purposes. They wantto have comfortable seats and various amenities that would provide themwith an enjoyable trip. They don't want smoking prohibited on board, andin addition to nice seats they want alcohol served on board. Further, theavailability of a reservation system is particularly important to them. They alsoare less likely than the other respondents to use the train in reaction to highway
hassles.
Group E: the family travelerThe respondents in this group tend be females who saw their most likelytrain trip as being with one or more children under the age of twelve. Asone might expect from someone traveling with children, the travelers in thisgroup tend to not want alcohol served on board the train. The members ofthis group also have some desires that, on the surface, are surprising. Forexample, the members of this group tend to be concerned about train traveltime to a greater extent than most other respondents. However, anyone whohas traveled with young children knows how restless they can soon become,

193
so it is understandable that travelers in this group care a great deal abouttrain travel time.
Another unanticipated finding is that the members of the family travelergroup tended to care more than the rest of the respondents about the avail-ability of fold-down work surfaces and telephones on board. Our priorexpectation was that these on-board amenities would be most important tobusiness travelers. This finding can however also be easily understood -thefold-down work surfaces would be very useful for playing games with childrenand the telephone would be important for keeping in touch with other familymembers (including those people expected to meet the traveling party upontheir leaving the train).
The main ridership segments suggested by our survey data are the "func-tional traveler" and the "day tripper"; although (as noted earlier) the natureof the sampling plan we employed does not allow us to be confident aboutthe relative sizes of the ridership segments we identified. In addition, theother three segments are important as well, in that they could provide the addi-tional patronage needed to support the system, especially at times when thetrain might not otherwise be well utilized.
Special services and pricing mechanisms could be used to attract certainridership segments. For example, special pricing for families (as the airlineshave done so well) will encourage the family traveler, while the leisuretraveler can be attracted by tie-ins to sporting and recreational activities. The"train lover" however, can be counted on to ride rather regularly. Further,this type of traveler does not expect a high level of performance from thetrain service.
Summary and conclusions
This paper describes one aspect of a study conducted to develop an under-standing of the demand for intercity rail service in the Charlotte-Raleigh-RockyMount corridor of the Piedmont region of North Carolina.
This study appears to be the first use of a computer-based market researchsurvey in a travel-related study in the USA. A particularly interesting featureof our application of this approach is the integration of the Ci2 and ACApackages that allowed us to present each respondent with customized descrip-tion of the rail service scenarios for which they were asked to provide trade-offinformation.
The results reported in this paper demonstrate once again the usefulnessof market segmentation analysis in understanding the market for passengertransporation service. In particular, the study reported here shows that the

194
characteristics of the potential riders of an intercity rail passenger servicecan be much better understood by identifying travelers having similar personaland household characteristics, as well as similar needs, desires and attitudestoward the attributes of the train and competing intercity transportationservices.
In particular, the study reported here shows that the commonly-used apriori classification of intercity rail trips into business and non-business tripsmay be an overly simplified representation of the structure of the market forintercity passenger rail. While this conclusion may be particularly true inthe case of the type of service investigated here (relatively short distancetravel on a relatively low speed, low frequency service), it might also havemore general validity. In any case, the results of this study demonstrate thatthe intercity travel demand market may be a more complex one than previ-
ously recognized.A good example of the benefit of market segmentation as used in this
study relates to the question of the importance of travel time to the potentialrail travelers who responded to the survey. When we used the common apriori segmentation of travelers into business and non-business travelers, wecould find little difference between these two groups in terms of their sensi-tivity to changes in rail travel time. Of course, our prior hypothesis was thatbusiness travelers would be found to be considerably more sensitive to changesin rail travel time than non-business travelers, as many previous studies havecome to this rather intuitive conclusion. However, our study shows that somepeople traveling for non-business purposes might also be particularly sensitiveto travel time, at least in the context of the type of service examined in this
study.The market segmentation analysis results provide considerable help in
marketing the proposed train service. In particular, this analysis leads to theimportant conclusion that there are a number of potential ridership segments,not just the business and non-business segments of the market that are usuallyconsidered. Each of the five ridership segments suggested by our survey datahas different preferences and needs, and the success of a train service suchas that examined in this study depends of the extent to which the servicecaters to the needs of these diverse groups.~
Acknowledgements
The results reported here are based on a study funded by the UniversityTransportation Centers Program of the U.S. Department of Transportation(through a grant to the Region IV University Transportation Center at theUniversity of North Carolina) and by the Public Transportation Division of the

195
N.C. Department of Transportation (NC DOT). The support from these sourcesis gratefully acknowledged.
The authors would like to express their sincere thanks to David A. King,Patrick B. Simmons and Robert Grabarek of the Public Transportation Divisionof the NC DOT for their considerable assistance with the study on whichthis paper is based.
The authors would also like to acknowledge the contributions of the researchassistants who participated in the study; namely, Chris Kenyon and ChristopherV. Forinash.
References
Bates J (ed) (1988) Stated preference methods in transport research. Journal of TransportEconomics, Special Issue.
Dickson PR & Ginter JL (1987) Market segmentation product differentiation and marketingstrategy. Journal of Marketing 51 (April): 1-10.
Engel JF, Fiorillo HF & Cayley MA (1972) Market Segmentation: Concepts and Applications.New York : Molt, Rinehart and Winston.
Everitt B (1980) Cluster Analysis, 2nd edition. London: Meinemann Educational Books Ltd.Green PE, Krieger AM & Agarwal MK (1991) Adaptive conjoint analysis: some caveats and
suggestions. Journal of Marketing Research 28: 215-221.Green PE & Rao VR (1971) Conjoint measurement for quantifying judgemental data. Journal
of Marketing Research 8: 355-363.Green PE & Srinivasan V (1978) Conjoint analysis in consumer behavior: issues and outlook.
Journal of Consumer Research 5: 103-123.Green PE & Srinivasan V (1990) Conjoint analysis in marketing: new developments with impli-
cations for research and practice. Journal of Marketing 54 (October): 3-19.Martigan JA (1975) Clustering Algorithm. New York: John Wiley and Sons.Mauser J & Simmie P (1981) Profit maximizing perceptual positions: an integrated theory for
the selection of product features and price. Management Science 27 (January): 33-56.Mensher DA, Barnard PO & Truong TP (1988) The role of stated preference methods in studies
of travel choice. Journal of Transport Economics and Policy 22(1): 45-58.Mensher DA, Brotchie J & Gunn M (1989) A methodology for investigating the passenger
demand for high-speed rail. Proceedings, I4th Australasian Transport Research Forum(pp. 459-476).
Louviere JJ (1988) Conjoint analysis modelling of stated preferences. Journal of TransportEconomics and Policy 22(1): 93-119.
Lovelock CM (1975) A market segmentation approach to transit planning, modeling andmanagement. Proceedings, Transportation Research Forum.
MacQuenn JB ( 1967) Some methods for classification and analysis of multivariate observa-tion. Proceedings of the Fifth Berkeley Symposium on Mathematical Statistics and Probability1: 281-297.
Pas El (1984) The effect of selected socio-demographic characteristics on daily travel-activitybehavior. Environment and Planning A 16: 571-581.
Pas El, Muber JC & Forinash CV (1991) Intercity Rail Passenger Travel Demand Project.Final Report to the Public Transportation Division, North Carolina Department of Trans-
portation, April.Sawtooth Software (1985) Ci2 Users Manual. Ketchum, Idaho: Sawtooth Software, Inc.

196
Sawtooth Software (1986) ACA System for Adaptive Conjoint Analysis. Ketchum, Idaho: SawtoothSoftware, Inc.
Yankelovich D (1964) New criteria for market segmentation. Harvard Business Review(March -April): 83-90.


![A VARIATIONAL MODEL FOR OBJECT SEGMENTATION USING …math.ipm.ac.ir/.../computervision2004/.../shapes.pdf · [11]. Level set methods are suitable for evolving inter-faces since they](https://img.dokumen.tips/doc/110x75/5f652747676b4a30c74dedc2/a-variational-model-for-object-segmentation-using-mathipmacircomputervision2004.jpg)


