Embed Size (px)
Citation preview

Market Opportunity Report: JAPAN
A custom report compiled by Euromonitor International for
British Columbia Ministry of Agriculture
March 2014

Market Opportunity Report: JAPAN
Selected source material © Euromonitor International Ltd 2014. Applicable terms and conditions of use and the disclaimer at the front of this document apply. Page ii
+1 312-922-1115 www.euromonitor.com This document includes source material that is the exclusive property of Euromonitor International Ltd and its licensors. All such source material is © Euromonitor International Ltd 2014 and provided without any warranties or representations about accuracy or completeness. Any reliance on such material is made at users’ own risk. Publication or making available of all or part of the material contained in this document (or any data or other material derived from it) may require Euromonitor’s prior written consent. Please refer to the applicable terms and conditions with Euromonitor.

Market Opportunity Report: JAPAN
Selected source material © Euromonitor International Ltd 2014. Applicable terms and conditions of use and the disclaimer at the front of this document apply. Page iii
List of Contents and Tables
Contents
INTRODUCTION ..................................................................................................................................... 4
KEY TAKEAWAYS FOR B.C. EXPORTERS ........................................................................................ 5
Japan: An attractive export market for British Columbia ..................................................................................... 5
OPPORTUNITIES FOR B.C. EXPORTERS ........................................................................................... 6
Top Exports from British Columbia .............................................................................................................................. 6
Agrifood ............................................................................................................................................................... 6
Seafood ............................................................................................................................................................... 7
MARKET OPPORTUNITY ...................................................................................................................... 9
Overview ........................................................................................................................................................................... 9
Agrifood .......................................................................................................................................................................... 11
Fresh Food .......................................................................................................................................................... 11
Frozen Food ........................................................................................................................................................ 13
Packaged Food .................................................................................................................................................... 14
Seafood ........................................................................................................................................................................... 16
Fresh Seafood ...................................................................................................................................................... 16
Frozen Seafood .................................................................................................................................................... 18
Canned/Preserved/Processed Seafood ................................................................................................................ 20
Wine ............................................................................................................................................................................. 22
BARRIERS TO MARKET ENTRY ........................................................................................................23
OVERVIEW OF JAPAN’S ECONOMY ................................................................................................24
Performance ................................................................................................................................................................... 24
Structure and Major Industries ................................................................................................................................... 24
Foreign Trade ................................................................................................................................................................ 25
CONSUMERS IN JAPAN .....................................................................................................................26
Demographics................................................................................................................................................................. 26
Consumer Habits ........................................................................................................................................................... 28
General Purchase Habits .................................................................................................................................... 28
Eating and Drinking Habits ................................................................................................................................. 29
Health & Wellness Habits.................................................................................................................................... 30
RETAIL LANDSCAPE ..........................................................................................................................31
REFERENCES ......................................................................................................................................32

Market Opportunity Report: JAPAN
Selected source material © Euromonitor International Ltd 2014. Applicable terms and conditions of use and the disclaimer at the front of this document apply. Page 4
INTRODUCTION Introduction
The following report is part of a series of Market Opportunity reports created by Euromonitor International that explore export opportunities for agrifood and seafood producers in British Columbia (B.C.). The report was commissioned by the B.C. Ministry of Agriculture and funded by Agriculture and Agri-Food Canada and the B.C. Ministry of Agriculture through Growing
Forward 2, a federal-provincial-territorial-initiative. Opinions expressed in this document are those of the authors and not necessarily those of Agriculture and Agri-Food Canada and the B.C. Ministry of Agriculture. The Government of Canada, the B.C. Ministry of Agriculture, nor their directors, agents, employees, or contractors will not be liable for any claims, damages, or losses of any kind whatsoever arising out of the use of, or reliance upon, this information. Purpose
The purpose of this report is to:
• Identify key macro trends influencing food purchase and consumption in Japan
• Analyse the Japanese food market to identify the largest and fastest-growing food categories
• Provide insight into Japan’s participation in the global food market, including factors influencing its trade environment
• Highlight commodities offering B.C. exporters the greatest opportunity in the Japanese market
Scope
The geographic focus of this report is Japan. The report is divided into six main sections: Opportunities for B.C. Exporters, Market Opportunity, Barriers to Trade, Overview of Japan’s Economy, Consumers in Japan, and Retail Landscape. The report begins by looking at the current state of B.C. exports to Japan in order to understand how this aligns with the dynamics of Japan’s food market and to identify the areas of immediate opportunity. This is followed by the market analysis section, which serves as the support behind the highlighted opportunities. The report provides specific market analysis of two categories: agrifood and seafood. The report does not include analysis of non-alcoholic beverages, but does include a special section on wine. The market analysis includes total market size and growth, largest and fastest-growing subcategories, analysis of imports, and identification of where the largest opportunities reside. This is followed by a discussion on the barriers to market entry, which provide context for the logistics behind a market entry strategy. The final three sections of the report serve to provide context for the principle macro factors influencing Japan’s food market, including economic performance, structure of the economy, participation in foreign trade, demographic shifts, consumer trends, and retailing landscape.

Market Opportunity Report: JAPAN
Selected source material © Euromonitor International Ltd 2014. Applicable terms and conditions of use and the disclaimer at the front of this document apply. Page 5
KEY TAKEAWAYS FOR B.C. EXPORTERS
Japan: An attractive export market for British Columbia
• Japan boasts a large economy that relies heavily on imports
As the third largest economy in the world, Japan is a very attractive export market for B.C. exporters, especially for agrifood and seafood due to the country’s high dependence on imports of these products. This dependence is not expected to diminish, suggesting great opportunities for B.C. food exports in the future.
• An ageing and declining population limits growth of food consumption
Total growth of food consumption is quite low in Japan due to its, not only ageing, but also declining population. This suggests that food producers will be fighting over a shrinking pie, which highlights the importance of understanding shifts in consumer preferences and eating habits.
• Westernization of eating habits bodes well for Canadian exporters
Not only does Japan import a large volume of food, but the categories registering some of the highest growth are those found within traditional Western cuisine, such as meat and bread, due to a migration among Japan’s youth away from traditional foods like rice and fish. This puts B.C. exporters in an advantageous position compared to regional Asian trade partners, since it aligns with products in which many food producers already specialize.
• No significant trade barriers, besides stringent phytosanitary rules
Globally, Japan ranks very high in terms of ease of doing business as a result of its strong and transparent institutions. This suggests that B.C. exporters face low risk in doing business with Japanese counterparts. However, concern with food safety has led to strict phytosanitary and labelling rules (very strict in terms of disclosing of process and ingredients), which should be studied before entering the market.
• Pork, bread/pastry, and tuna offer greatest immediate opportunity
Among the products British Columbia currently exports to Japan, pork, bread/pastry and tuna offer the greatest immediate opportunity, due to current consumer preferences and dynamics in the Japanese market. Within imported pork, Canada’s most direct competitors are the USA and China, while in tuna, most of Japan’s suppliers are neighbouring Asian countries, such as Indonesia, Thailand, and South Korea.

Market Opportunity Report: JAPAN
Selected source material © Euromonitor International Ltd 2014. Applicable terms and conditions of use and the disclaimer at the front of this document apply. Page 6
OPPORTUNITIES FOR B.C. EXPORTERS
TOP EXPORTS FROM BRITISH COLUMBIA
Agrifood Japan represents the second largest export market for B.C. Agrifood
• B.C. exported C$58.5 million in agrifood products to Japan in 2012, representing 3.6 per cent of total agrifood exports and B.C.’s second largest export market for agrifood in 2012, behind only the USA.
• The top agrifood exports from B.C. to Japan in 2012 were frozen blueberries (C$10.7 million), pork products (C$9.2 million) and rape/colza seeds (C$3.4 million).
Chart 1 Top B.C. Agrifood Exports to Japan: 2012
Source: CATSNET Analytics, December 2013 and Global Trade Atlas, December 2013
Pork products and bread/pastry offer B.C. the greatest opportunity in Japan
• Among British Columbia’s top exports to Japan, pork products and bread/pastry offer the greatest long-term growth, due to their importance within Japanese eating habits and their growing penetration in the market. Both products are benefiting from the increasing Westernization of eating habits in Japan, which is causing traditional items like fish and rice to be replaced by meat
10.7
9.2
3.4
3.2
3.2
2.9
2.6
2.4
2.1
1.6
0.0 2.0 4.0 6.0 8.0 10.0 12.0
Frozen Blueberries
Pork products
Rape or Colza Seeds
Bread, Pastry and Cakes
Mushrooms
Brewing/Distillations Starches & Sugars
Wheat and Meslin
Malt Extract
Chocolate and Cocoa Products
Barley
C$ million

Market Opportunity Report: JAPAN
Selected source material © Euromonitor International Ltd 2014. Applicable terms and conditions of use and the disclaimer at the front of this document apply. Page 7
and bread. Additionally, younger consumers are increasingly eating breakfast on the go, promoting increased consumption of pastries.
Table 1 Opportunity Assessment of Select B.C. Agrifood Exports to Japan
Top B.C. Exports Explanation Frozen Blueberries Frozen fruit is a small, yet growing category in Japan,
as consumers seek out convenience and healthier diets
Pork products Westernization of eating habits is leading to higher consumption of meat, and pork is a Top 5 imported commodity in fresh agrifoods
Rape or Colza Seeds A growing domestic rapeseed oil industry due to the product’s health benefits and well-suited properties for cooking bodes well for continued Canadian imports of rape and colza seeds
Bread, Pastry and Cakes Bread continues to replace rice, while pastries grow due to higher away from home eating, especially breakfast
Mushrooms Fresh vegetable consumption is declining, but Japan has strong imports of preserved mushrooms (over C$26 million in 2012)
Chocolate and Cocoa Products
Growing demand for high-end products, but overall decline in consumption and strong competition from domestic companies
Seafood
Japan’s large appetite for seafood causes B.C. to register higher exports in this category
• B.C. exported C$96.2 million in seafood products to Japan in 2012, representing 11.1 per cent of total seafood exports and B.C.’s third largest export market for seafood in 2012, behind the USA and China.
• The top seafood exports from B.C. to Japan were shrimp and prawns (C$25.0 million), herring (C$17.9 million) and sablefish (C$11.0 million). The majority of seafood exports was in frozen form (C$62.2 million), followed by fresh (C$20.0 million) and cured (C$13.4 million).

Market Opportunity Report: JAPAN
Selected source material © Euromonitor International Ltd 2014. Applicable terms and conditions of use and the disclaimer at the front of this document apply. Page 8
Chart 2 Top B.C. Seafood Exports to Japan: 2012
Source: CATSNET Analytics, December 2013 and Global Trade Atlas, December 2013
Tuna offers greatest opportunity
• While shrimp/prawns and herring registered higher export figures between B.C. and Japan, tuna appears to offer the greatest long-term opportunity for B.C. exporters, due to the large demand for this fish species amongst Japanese consumers. Several varieties of tuna are among the top fish species imported into Japan, in both fresh and frozen formats. While the demand is highest for big eye, yellow fin, bluefin, and Southern bluefin for preparing sushi and sashimi, there is also growing demand for albacore tuna.
Table 2 Opportunity Assessment of Select B.C. Seafood Exports to Japan
Top B.C. Exports Explanation Shrimp/prawns Overall consumption of seafood remains high, but
shrimp is not within the largest consumption or imported categories
Herring Herring remains one of the most important imports of preserved seafood in Japan and maintains a loyal base of consumers
Tuna Despite declining fish consumption, tuna of all types remains one of the most popular varieties and leads in imports of fresh and frozen seafood
25.0
17.9
13.0
11.0
9.9
5.7
4.3
4.1
2.2
0.9
0.0 5.0 10.0 15.0 20.0 25.0 30.0
Shrimp/prawns
Herring
Other Seafood
Sablefish
Urchin
Atlantic Salmon
Tuna
Chinook
Sockeye
Chum
C$ million

Market Opportunity Report: JAPAN
Selected source material © Euromonitor International Ltd 2014. Applicable terms and conditions of use and the disclaimer at the front of this document apply. Page 9
• An ageing and declining population leads to low growth across most food categories.
• Increasing demand for convenient solutions promotes consumption of packaged food.
• Imports remain important due to limitations of local production and recent concerns over food safety, especially in fresh foods.
• Increasing Westernization of eating habits drives growth of non-traditional foods.
• Reliance on imports and increasing demand for non-traditional products bode well for B.C. exporters.
MARKET OPPORTUNITY
Key Points
OVERVIEW An ageing and declining population leads to low growth across most food categories
• Japan’s population is not only declining, it is also ageing. This suggests that there are not only fewer people in the country, but that a growing percentage of the population is older and therefore requires a lower caloric intake. As a result, total consumption of agrifoods has remained stable, presenting low growth and declines across most food categories.
Increasing demand for convenient solutions promotes consumption of packaged food
• Japanese consumers continue to search for ways of making their lives more efficient, including seeking out more convenient solutions for their eating and drinking needs. This trend continues to drive an increasing number of consumers to packaged food, which is more convenient and easier to prepare compared to its fresh food alternatives. This is especially true of frozen food, which is expected to grow by six per cent by 2017.
Imports remain important due to limitations of local production and recent concerns over food safety, especially in fresh foods
• Imports have always held a significant role in Japan’s food supply due to limited arable land for agriculture, but this increased after the 2011 Tohoku earthquake. Increased concerns arose over radiation leaks from the Fukushima power plant and the negative impact this might have on the safety and quality of locally-produced and sourced items. In response, consumers increasingly looked outside of Japan to source fresh agrifood and seafood, increasing the importance of imports in both categories.
Increasing Westernization of eating habits drives growth of non-traditional foods
• Eating habits continue to shift in Japan, increasingly mimicking those found in North America and Western Europe. This has resulted in growing consumption of red meat and baked goods at the expense of fish and seafood and rice. In addition, the market has witnessed increased demand

Market Opportunity Report: JAPAN
Selected source material © Euromonitor International Ltd 2014. Applicable terms and conditions of use and the disclaimer at the front of this document apply. Page 10
for non-traditional products like pasta, bread, chilled meats, and prepared salads. In fact, frozen and chilled meats represent one of the largest opportunities for growth in Japan’s food market.
Reliance on imports and increasing demand for non-traditional products bode well for B.C. exporters
• Despite low growth in total food consumption, Japan offers several attractive opportunities for B.C. exporters, due to the country’s dependence on imported food and growing demand for more Western food items, like meat and bread.
• Product categories offering the most opportunity include meat (all formats), nuts, frozen foods, prepared ready meals, yoghurt, cheese, and tuna.

Market Opportunity Report: JAPAN
Selected source material © Euromonitor International Ltd 2014. Applicable terms and conditions of use and the disclaimer at the front of this document apply. Page 11
• Japan is among the world’s largest net importers of agrifood, registering C$21.5 billion in imports in 2012.
• Fresh food consumption declined by -0.1 per cent in volume terms in 2012. Japan’s declining population, as well as older demographic structure, has been the key trend underpinning much of this decline.
• Fruits and vegetables are two of the most popular fresh foods in Japan, accounting for almost 17 million tonnes of fresh food consumption in 2012. Like most other fresh foods, however, sales of both are expected to decline by 2017.
• The only two fresh food categories expected to see growth in consumption by 2017 are meat and nuts. Nut consumption is rising due to growing health consciousness, while meat sales are benefiting from the Westernization of Japanese diets.
• Despite some consumer concern about their quality and safety, imports are a significant source of Japan’s supply of fresh food due to the country’s limited available land for agricultural activities. Soybeans, bananas, and meat are among the top imported items.
• Products offering the most opportunity to B.C. exporters are pork and poultry products, root vegetables, potatoes, and apples.
AGRIFOOD
Fresh Food Key Points
Increasing availability of convenience foods coupled with an ageing and declining population negatively affects fresh food sales
Chart 3 Total Volume Consumption of Fresh Food: 2007-2017
Source: Euromonitor International
27,504 27,199 26,418
0
5,000
10,000
15,000
20,000
25,000
30,000
2007 2012 2017
To
nn
es
('0
00
)

Market Opportunity Report: JAPAN
Selected source material © Euromonitor International Ltd 2014. Applicable terms and conditions of use and the disclaimer at the front of this document apply. Page 12
Vegetables and fruit lead fresh food consumption in Japan, but nuts and meat are the only fresh foods with positive forecast growth
Table 3 Top Fresh Food Categories in Japan: 2012
Largest Categories Fastest Growing Categories 1. Vegetables 1. Nuts 2. Fruits 2. Meat 3. Meat 3. Fruit 4. Eggs 4. Eggs 5. Starchy Roots 5. Vegetables Source: Euromonitor International
Imported fresh foods are now a year-round requirement in Japan, with soybeans and bananas leading the way
Chart 4 Top 10 Subcategories by Import Volumes of Fresh Food: 2012
Source: United Nations Comtrade
2,727
1,087
419
260
212
174
151
137
130
102
0 500 1,000 1,500 2,000 2,500 3,000
Soybeans
Bananas
Onions, shallots, garlic, leeks
Swine cuts fresh
Meat of bovine fresh
Pineapples
Grapefruit
Carrots, turnips, beetroots
Oranges
Manioc, arrowroot, salep
Tonnes ('000)

Market Opportunity Report: JAPAN
Selected source material © Euromonitor International Ltd 2014. Applicable terms and conditions of use and the disclaimer at the front of this document apply. Page 13
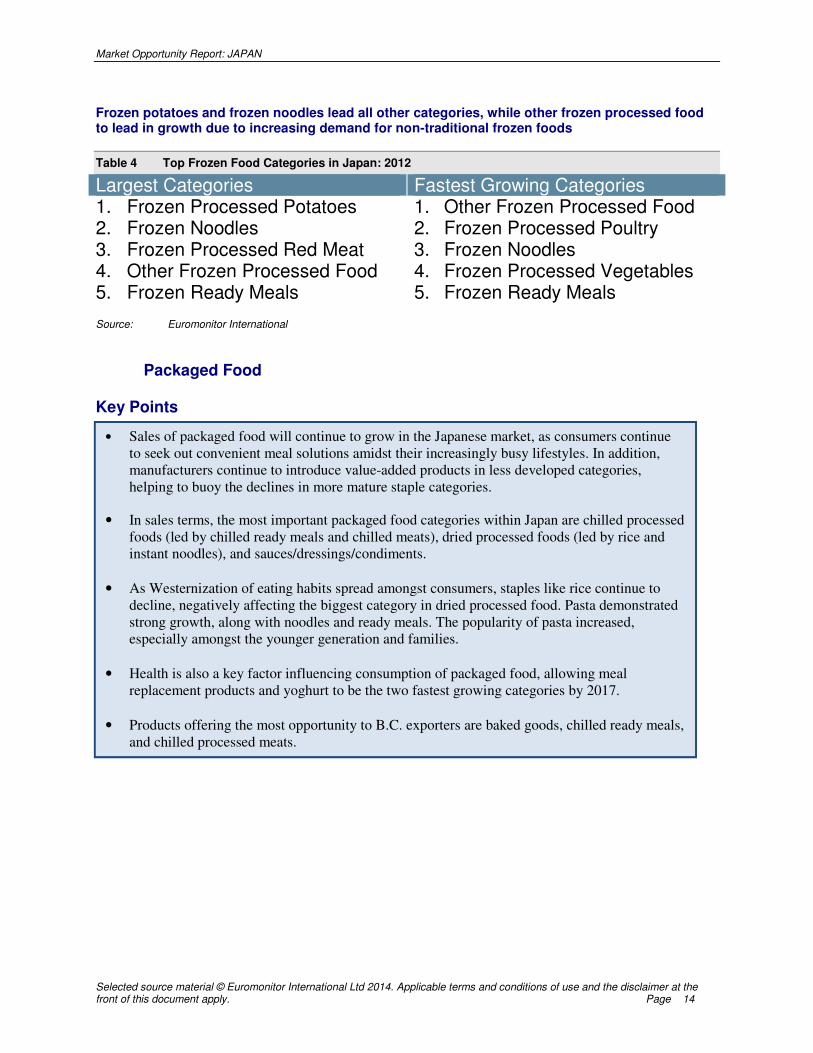
• Frozen processed food is growing in Japan, fueled by the economic recovery and the increasing demand for convenient foods, particularly among families who have school-aged children.
• Frozen potatoes and frozen noodles are the largest categories. Frozen noodles are increasingly popular since they are easy to prepare and can be stored for a long period of time, while frozen potatoes see strong demand from foodservice operators looking to make French fries.
• Other frozen processed food will be the fastest growing category over the next five years due to the expanding portfolio of frozen foods being offered by manufacturers. As consumers become more familiar with frozen foods in general, they are searching out non-traditional frozen foods, driving growth of the category.
• Products offering the most opportunity to B.C. exporters are frozen ready meals, frozen vegetables, and frozen meat.
Frozen Food
Key Points
Time-strapped Japanese consumers develop preference for frozen over fresh out of convenience
Chart 5 Total Volume Sales of Frozen Food1: 2007-2017
Source: Euromonitor International
1Total Sales is the aggregate of products sold through both the retail and foodservice channels. Does not include products that are used for other purposes.
1,848 1,8431,963
0
500
1,000
1,500
2,000
2,500
2007 2012 2017
To
nn
es
('0
00
)
Market Opportunity Report: JAPAN
Selected source material © Euromonitor International Ltd 2014. Applicable terms and conditions of use and the disclaimer at the front of this document apply. Page 14
• Sales of packaged food will continue to grow in the Japanese market, as consumers continue to seek out convenient meal solutions amidst their increasingly busy lifestyles. In addition, manufacturers continue to introduce value-added products in less developed categories, helping to buoy the declines in more mature staple categories.
• In sales terms, the most important packaged food categories within Japan are chilled processed foods (led by chilled ready meals and chilled meats), dried processed foods (led by rice and instant noodles), and sauces/dressings/condiments.
• As Westernization of eating habits spread amongst consumers, staples like rice continue to decline, negatively affecting the biggest category in dried processed food. Pasta demonstrated strong growth, along with noodles and ready meals. The popularity of pasta increased, especially amongst the younger generation and families.
• Health is also a key factor influencing consumption of packaged food, allowing meal replacement products and yoghurt to be the two fastest growing categories by 2017.
• Products offering the most opportunity to B.C. exporters are baked goods, chilled ready meals, and chilled processed meats.
Frozen potatoes and frozen noodles lead all other categories, while other frozen processed food to lead in growth due to increasing demand for non-traditional frozen foods
Table 4 Top Frozen Food Categories in Japan: 2012
Largest Categories Fastest Growing Categories 1. Frozen Processed Potatoes 1. Other Frozen Processed Food 2. Frozen Noodles 2. Frozen Processed Poultry 3. Frozen Processed Red Meat 3. Frozen Noodles 4. Other Frozen Processed Food 4. Frozen Processed Vegetables 5. Frozen Ready Meals 5. Frozen Ready Meals Source: Euromonitor International
Packaged Food Key Points

Market Opportunity Report: JAPAN
Selected source material © Euromonitor International Ltd 2014. Applicable terms and conditions of use and the disclaimer at the front of this document apply. Page 15
Convenience, health and food safety concerns fuel historic growth in packaged foods
Chart 6 Retail Sales of Packaged Food (C$ Million): 2007-2017
Source: Euromonitor International
Chilled processed foods enjoy high consumption behind the popularity of chilled processed meats, while health concerns drive sales of meal replacements and yogurt
Table 5 Top Packaged Food Categories in Japan: 2012
Largest Categories Fastest Growing Categories 1. Chilled Processed Foods 1. Meal Replacement 2. Dried Processed Foods 2. Yogurt and Sour Milk Drinks 3. Sauces, Dressings, and
Condiments 3. Ready-To-Eat Cereals
4. Ready Meals 4. Unprocessed Cheese 5. Noodles 5. Pasta Source: Euromonitor International
159,028.0 162,118.4 166,284.1
0
20,000
40,000
60,000
80,000
100,000
120,000
140,000
160,000
180,000
2007 2012 2017
C$
mil
lio
n

Market Opportunity Report: JAPAN
Selected source material © Euromonitor International Ltd 2014. Applicable terms and conditions of use and the disclaimer at the front of this document apply. Page 16
• Japan imports more seafood than any other country due to declining fish stocks in the country’s territorial waters and a traditional preference for this food in local diets.
• Consumption of fresh seafood continues to fall due to several factors, including consumer concern over contaminated fish in the wake of Fukushima and changing consumption habits amongst Japan’s younger population. This decline is expected to continue, with consumption falling to 3.7 million tonnes by 2017, down from 4.2 million tonnes in 2012.
• Whilst ageing and population decline have led to a general reduction in fish volume sales, the
younger generations are contributing by venturing away from traditional eating habits. These consumers are eating much more meat, fueled by the popularity of grilled meat restaurants, called yakiniku, and fast food chains.
• Fish is the most popular type of fresh seafood consumed in Japan due to its ease-of-preparation and its relative affordability compared to molluscs and crustaceans.
• Japan imports a notable amount of fresh seafood, with tuna and crab representing the two
largest varieties. These products are coming predominantly from Russia, China, and Norway.
SEAFOOD
Fresh Seafood
Key Points
The Fukishima catastophe leads to domestic and international fear of contaminated Japanese fish and seafood, causing domestic market to experience strong decline
Chart 7 Total Volume Consumption of Fresh Seafood: 2007-2017
Source: Euromonitor International
5,052
4,237
3,733
0
1,000
2,000
3,000
4,000
5,000
6,000
2007 2012 2017
To
nn
es
('0
00
)

Market Opportunity Report: JAPAN
Selected source material © Euromonitor International Ltd 2014. Applicable terms and conditions of use and the disclaimer at the front of this document apply. Page 17
High price and difficulty in preparation keep consumption of crustaceans and molluscs much lower than fish
Chart 8 Volume Consumption by Fresh Seafood Category: 2012-2017
Source: Euromonitor International
Japan is increasingly dependant on imported seafood in order to satisfy enormous consumer demand and diminishing local supply, led by imports of crab and tuna
Chart 9 Top Categories of Fresh Seafood by Import Volumes: 2012
Source: United Nations Comtrade
2,512
748
472
2,823
886
529
- 500 1,000 1,500 2,000 2,500 3,000
Fish
Molluscs and Cephalopods
Crustaceans
Tonnes ('000)
2012 2017
20.1
13.3
12.2
3.4
1.5
1.1
0.7
0.5
0.3
0.2
0 5 10 15 20 25
Crabs, crabmeat
Tuna (bigeye)
Tuna (yellowfin)
Tuna (bluefin)
Tuna (southern bluefin)
Lobsters
Scallops
Trout
Rock lobster and other sea crawfish
Flatfish
Tonnes ('000)

Market Opportunity Report: JAPAN
Selected source material © Euromonitor International Ltd 2014. Applicable terms and conditions of use and the disclaimer at the front of this document apply. Page 18
• Consumption of frozen seafood will continue to decline in Japan, falling to 46 thousand tonnes by 2017, down from 50 thousand tonnes in 2012. Like fresh seafood, these products continue to suffer from consumer concern over the safety of locally-sourced seafood and an increasing shift towards other proteins, especially red meat.
• Tuna, Pacific salmon, and mackerel were the largest varieties of imported frozen seafood, with the bulk of these products coming from Chile, Russia, and the USA.
Frozen Seafood Key Points
Waning fish consumption and a consumer preference for fresh leads to a decline in sales of frozen fish and seafood varieties
Chart 10 Total Volume Sales of Frozen Seafood2: 2007-2017
Source: Euromonitor International
2Total Sales is the aggregate of products sold through both the retail and foodservice channels. Does not include fish that is used for other purposes.
56
50
46
0
10
20
30
40
50
60
2007 2012 2017
To
nn
es
('0
00
)

Market Opportunity Report: JAPAN
Selected source material © Euromonitor International Ltd 2014. Applicable terms and conditions of use and the disclaimer at the front of this document apply. Page 19
Pacific salmon, tuna, and mackerel are the most important frozen seafood imports
Chart 11 Top Categories of Frozen Seafood by Import Volumes: 2012
Source: United Nations Comtrade
Partnership deals with Chile leads to preferred supplier status
Chart 12 Top Suppliers of Frozen Seafood by Import Volumes (per cent share): 2012
Source: United Nations Comtrade
217
116
79
52
48
47
43
41
36
33
0 50 100 150 200 250
Other frozen fish
Pacific Salmon
Tuna (bigeye)
Mackerel
Tuna (yellowfin)
Octopus
Crabs
Trout
Cuttle fish
Jack and horse mackerel
Tonnes ('000)
Chile, 16.5
USA, 15.7
Russia, 12.9
Norway, 8.5China, 8.1
Others, 38.3

Market Opportunity Report: JAPAN
Selected source material © Euromonitor International Ltd 2014. Applicable terms and conditions of use and the disclaimer at the front of this document apply. Page 20
• Retail sales of canned/preserved/processed seafood fell to C$33 billion in 2012 from C$37.5 billion in 2007, suffering from the overall decline in seafood consumption. Of this segment, chilled processed seafood represents over 90 per cent of sales, with canned/preserved seafood accounting for the remaining 10 per cent.
• While canned seafood experienced a bit of a resurgence in the aftermath of the Tohoku earthquake as an effective form of emergency food, in general, the entire format is in decline as consumers prefer alternatives, such as fresh or frozen. By 2017, sales are expected to fall to C$29 billion.
• Asian partners account for almost all imports of preserved seafood, with China and Thailand leading the way.
Canned/Preserved/Processed Seafood
Key Points
Salted, dried or canned seafood enjoys a resurgence after the Tohoku earthquake, but it is only temporary
Chart 13 Retail Sales of Canned/Preserved/Processed Seafood (C$ Million): 2007-2017
Source: Euromonitor International
37,493.4
32,867.7
29,391.2
0
5,000
10,000
15,000
20,000
25,000
30,000
35,000
40,000
2007 2012 2017
C$
mil
lio
n

Market Opportunity Report: JAPAN
Selected source material © Euromonitor International Ltd 2014. Applicable terms and conditions of use and the disclaimer at the front of this document apply. Page 21
Tuna, skipjack, and bonito lead in preserved seafood imports
Chart 14 Top Categories of Preserved Seafood by Import Volumes: 2012
Source: United Nations Comtrade
Almost all imports come from regional suppliers
Chart 15 Top Suppliers of Preserved Seafood by Import Volumes (per cent share): 2012
Source: United Nations Comtrade
109.1
55.9
15.3
12.1
11.8
4.4
2.9
1.5
0.5
0.0
0 20 40 60 80 100 120
Other preserved fish
Tuna, skipjack, bonito
Crab
Salmon
Mackerel
Sardine, brisling, sprat
Herrings
Anchovies
Other crustaceans
Lobster
Tonnes ('000)
China, 53.3
Thailand, 24.7
Indonesia, 7.1
Philippines, 4.9
South Korea,
4.1
Others, 5.9

Market Opportunity Report: JAPAN
Selected source material © Euromonitor International Ltd 2014. Applicable terms and conditions of use and the disclaimer at the front of this document apply. Page 22
• Wine grows by two per cent in total volume terms to reach 913 million litres in 2012.
• Sparkling wine registers the highest total volume growth in 2012.
• While the “cocooning” (or staying at home) consumer trend permeated Japanese society, consumption at bars and restaurants grew significantly for still light grape wine and sparkling wine in 2012.
WINE
Key Points
Fashionable light white wines and sparkling wines drive category growth
Chart 16 Total Wine Consumption: 2007-2017
Source: Euromonitor International
925 913 910
0
200
400
600
800
1,000
2007 2012 2017
Lite
rs m
illi
on

Market Opportunity Report: JAPAN
Selected source material © Euromonitor International Ltd 2014. Applicable terms and conditions of use and the disclaimer at the front of this document apply. Page 23
• Japan ranked 20th globally in Ease of Doing Business, owing to its strong institutions and attractive business environment.
• The largest obstacles to foreign business partners are high taxes, a shrinking labor force, and lack of English language fluency.
• Japan applies stringent tariffs and phytosanitary rules to imports of fresh foods, carried out
through three types of regulations overseen by three separate government bodies.
• Commodities are required to display the product’s name and country of origin. Processed foods are required to have additional information, such as ingredients, contents and manufacturers on the label. Despite notable sales growth, organic products are still underdeveloped, partly due to stringent regulation of imports, including the requirement of a Japanese Agricultural Standards (JAS) organic seal.
BARRIERS TO MARKET ENTRY
Key Points
Japan is an attractive place to conduct business, but has slipped in global rankings
Chart 17 Ease of Doing Business Ranking: 2007 vs. 20123
Source: Doing Business, World Bank Note: This chart does not include all of the metrics that factor into the total ease of doing business, but rather highlights
ones that are more applicable to foreign exporters.
3 Note: (1) Regulations in Doing Business 2012 are measured from June 2010 until May 2011. The data for all sets of indicators in Doing
Business 2012 are from June 2010 until June 2011 (except for paying taxes data which refers to January–December 2010). (2) Rankings are based on data sets across 183 countries. (3) Doing Business presents quantitative indicators on business regulations and the protection of property rights that can be compared across 183 economies. A high ranking means the regulatory environment is conducive to the operation of business.
20
109
59
23
17
19
34
1
12
18
39
13
12
19
5
1
0 20 40 60 80 100 120
Ease of Doing Business Ranking
Starting a Business
Registering Property
Getting Credit
Protecting Investors
Trading Across Borders
Enforcing Contracts
Resolving Insolvency
2007 2012

Market Opportunity Report: JAPAN
Selected source material © Euromonitor International Ltd 2014. Applicable terms and conditions of use and the disclaimer at the front of this document apply. Page 24
• Japan’s short-lived economic recovery was brought to a brutal halt in 2011, following the Tohoku earthquake and tsunami. Not surprisingly, the economy contracted, led by sharp declines in private consumption.
• Since then, a slow recovery has occurred, with real GDP growing by 1.7 per cent in 2013. Domestic demand – especially public consumption – will be the primary engine of growth in the near and medium term. So far, business investment has been largely missing from the recovery.
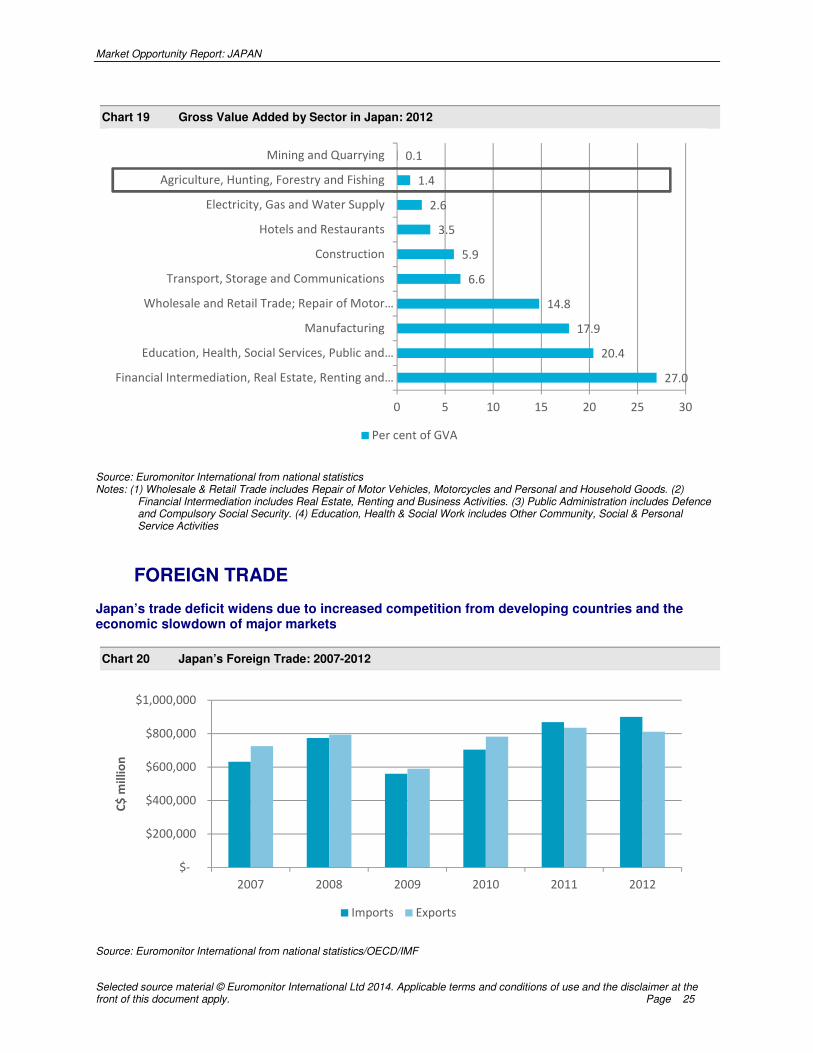
• Japan’s trade deficit grows as its manufacturing sector (its economy’s largest sector) faces stiff competition from lower-cost rivals, such as China and South Korea.
• Agriculture accounts for less than four per cent of the work force and is contracting every year, making locally grown food extremely expensive.
OVERVIEW OF JAPAN’S ECONOMY
Key Points
PERFORMANCE
Recent GDP growth shows promise for a struggling Japanese economy. However, high debt levels and a shrinking population cast a pall over any hope for significant, long-term progress
Chart 18 Real GDP Growth and Per Capita GDP: 2007-2017
Source: Euromonitor International
STRUCTURE AND MAJOR INDUSTRIES Once considered the country’s engine of growth, Japan’s manufacturing sector slows down while its service industry expands
44,000
45,000
46,000
47,000
48,000
49,000
50,000
51,000
52,000
53,000
-8
-6
-4
-2
0
2
4
6
2007 2008 2009 2010 2011 2012 2013 2014 2015 2016 2017
GD
P p
er
Ca
pit
a C
$
Re
al
GD
P P
er
cen
t G
row
th
GDP per Capita Real GDP Growth
Market Opportunity Report: JAPAN
Selected source material © Euromonitor International Ltd 2014. Applicable terms and conditions of use and the disclaimer at the front of this document apply. Page 25
Chart 19 Gross Value Added by Sector in Japan: 2012
Source: Euromonitor International from national statistics Notes: (1) Wholesale & Retail Trade includes Repair of Motor Vehicles, Motorcycles and Personal and Household Goods. (2)
Financial Intermediation includes Real Estate, Renting and Business Activities. (3) Public Administration includes Defence and Compulsory Social Security. (4) Education, Health & Social Work includes Other Community, Social & Personal Service Activities
FOREIGN TRADE Japan’s trade deficit widens due to increased competition from developing countries and the economic slowdown of major markets
Chart 20 Japan’s Foreign Trade: 2007-2012
Source: Euromonitor International from national statistics/OECD/IMF
27.0
20.4
17.9
14.8
6.6
5.9
3.5
2.6
1.4
0.1
0 5 10 15 20 25 30
Financial Intermediation, Real Estate, Renting and…
Education, Health, Social Services, Public and…
Manufacturing
Wholesale and Retail Trade; Repair of Motor…
Transport, Storage and Communications
Construction
Hotels and Restaurants
Electricity, Gas and Water Supply
Agriculture, Hunting, Forestry and Fishing
Mining and Quarrying
Per cent of GVA
$-
$200,000
$400,000
$600,000
$800,000
$1,000,000
2007 2008 2009 2010 2011 2012
C$
mil
lio
n
Imports Exports

Market Opportunity Report: JAPAN
Selected source material © Euromonitor International Ltd 2014. Applicable terms and conditions of use and the disclaimer at the front of this document apply. Page 26
• A declining population and ageing workforce will dampen economic growth in Japan. • In 2012, disposable income per capita amounted to ¥2,434 thousand (C$30,983). Disposable
income per capita should rise by 1.5 per cent in real terms in 2013. However, an average inflation rate of one per cent will likely tamper additional spending.
• In 2012, the age group 40-44 led Japan’s income chart with an average annual gross income of ¥4.4 million (C$57,624). This demographic includes professionals who are well established in their careers. As most of them have a family, their consumption is often geared towards household-related products and services, such as household durables, cars, education and recreation for the family.
• Price drives most purchasing decisions, but Japanese consumers are beginning to allow themselves modest extravagances.
• Concerns over spending result in eating more meals at home and visiting more affordable restaurants, such as ramen restaurants, yakitori restaurants and other mid-priced foodservice establishments.
CONSUMERS IN JAPAN
Key Points
DEMOGRAPHICS A rapidly ageing senior population, a high dropout rate of mothers from the workforce and shrinking birth rates may negatively affect future economic growth
• Japan’s population began to fall in 2008 and by 2012 stood at 127.6 million. The median age is 45.6 years – substantially higher than the Asian-Pacific regional average. The ageing of Japanese society is expected to negatively affect economic performance because there will be fewer economically active members in the workforce and a complementary decline in household savings, as seniors dip into their savings accounts. The government estimates that 40 per cent of the population will be of retirement age by 2060. The marriage rate has fallen by a third from its peak in 1972 and the fertility rate currently stands at just 1.4 births per female, down from 1.9 in 1977.
• In regard to gender, there is not a significant difference in age segmentation between males and females. However, when it comes to their income-generating status in the economy, many Japanese women leave the full-time workforce after they have children, causing 58.2 per cent of the full-time workforce to be male. According to the Japan Times newspaper, “Japan's long working hours make it hard for many women to have a full-time career and a family at the same time. Though slowly improving, male participation in housework and child-rearing is still limited.”

Market Opportunity Report: JAPAN
Selected source material © Euromonitor International Ltd 2014. Applicable terms and conditions of use and the disclaimer at the front of this document apply. Page 27
Chart 21 Age Pyramid in 2012
Source: Euromonitor International from national statistics/UN
Income inequality grows as Japan’s middle class shrinks and earnings from seniors drop
• Japan’s income inequality has worsened over time. In 2011, the richest 10.0 per cent of households still accounted for 25.4 per cent, compared to only 2.2 per cent for the poorest 10.0 per cent of households. In addition, Japan’s middle class shrank slightly from 31.4 per cent of total households in 2006 to 30.8 per cent in 2011. One reason behind the increasing inequality is that as the country ages, the income of its elderly falls relative to that of wage earners. Another is that the profitability of large companies has been sustained but no similar trend exists among small companies, which are generally the main source of new jobs. Third, the number of “irregular workers” has soared over the past decade and now makes up around one-third of the work force. They earn less than half the pay of regular workers for the same jobs.
0 500 1,000 1,500 2,000 2,500
0
5
10
15
20
25
30
35
40
45
50
55
60
65
70
75
Population (000)
Ag
e
Baby
Boomers
48-66
years old

Market Opportunity Report: JAPAN
Selected source material © Euromonitor International Ltd 2014. Applicable terms and conditions of use and the disclaimer at the front of this document apply. Page 28
Chart 22 Age Composition of Social Classes ABCDE: 20114
Source: Euromonitor International from national statistics
CONSUMER HABITS
General Purchase Habits While price and sustainability/durability remain top considerations, Japanese consumers change outlook due to 2011 earthquake
• Several recent shopping trends have emerged in Japan, most notably a more price-conscious attitude, driven by the poor economic performance of recent years. Consumers are devoting more time and energy to searching for good values, instead of carelessly purchasing the easiest and most convenient products.
• Other Japanese consumers are responding to tougher economic times by indulging in affordable “luxury” in greater numbers. Popular purchases include cashmere sweaters at fast-fashion retailer Uniqlo and gourmet coffee and ice-cream at 7-Eleven convenience stores. These offerings by two of Japan's biggest retailers are part of a strategy to entice thrifty shoppers to spend on little luxuries.
4 Social Class A presents data referring to the number of individuals with a gross income over 200per cent of an average gross income of all
individuals aged 15+. Social Class B presents data referring to the number of individuals with a gross income between 150per cent and 200per cent of an average gross income of all individuals aged 15+. Social Class C presents data referring to the number of individuals with a gross income between 100per cent and 150per cent of an average gross income of all individuals aged 15+. Social Class D presents data referring to the number of individuals with a gross income between 50.0per cent and 100per cent of an average gross income of all individuals aged 15+. Social Class E presents data referring to the number of individuals with a gross income less than 50.0per cent of an average gross income of all individuals aged 15+.
0%
10%
20%
30%
40%
50%
60%
70%
80%
90%
100%
15-19 20-24 25-29 30-34 35-39 40-44 45-49 50-54 55-59 60-64 65+
A B C D E

Market Opportunity Report: JAPAN
Selected source material © Euromonitor International Ltd 2014. Applicable terms and conditions of use and the disclaimer at the front of this document apply. Page 29
• Finally, there is no doubt that the earthquake and post-Fukushima nuclear scare has had a notable impact on purchasing habits in Japan. According to Tetsuya Honda, CEO of marketing at PR group Blue Current, consumers now look for products and services that they believe will limit their anxiety about the future and also reduce the perception that their consumption is wasteful. Japanese consumers were already attracted to environmentally friendly consumer trends, but Honda said that, post-quake, consumers are shifting from a simple ‘eco’ trend to consumption that promotes a broader feeling of sustainability.
Eating and Drinking Habits The economic slowdown has led to a revival in eating at home, and Western habits slowly affect the composition of these meals
• Japanese households are relatively regimented in terms of eating habits and breakfast, lunch and dinner are all considered to be essential daily meals. Breakfast traditionally consists of rice, a soy-based soup called miso and side dishes such as grilled fish, seaweed or omelettes. Western influence has been strongly felt across all home-based meals in Japan, with cereal, bagels and the obligatory morning coffee all becoming Japanese breakfast staples. The convenience and portability of Western breakfast has changed the early morning eating habits of many young working Japanese. Lunch is now more often prepared at home and taken to school or work.
• Dining at home became more popular during the days following the economic downturn and, despite the recovering economy, many Japanese still prefer to eat meals prepared at home. Uchishoku, a trend to cook at home, has gone hand-in-hand with the increased awareness among consumers of the attractiveness of eating locally-sourced foods.
Slow economy and demographic shift drive growth of budget dining
• Budget dining establishments are popular amongst nearly all consumers, most recently facilitated by the new culture of austerity brought about by the recent Fukushima disaster. Since then, many Japanese have imposed upon themselves measures to cut unnecessary spending on luxuries, including dining out at more expensive restaurants. In turn, ramen restaurants, yakitori restaurants and other mid-priced foodservice establishments have all become increasingly popular. In response, full-service restaurants have slowly begun to lower their prices.
• Among the low-cost options experiencing the most success are convenience stores offering fast food options. 7-Eleven Japan continues to be at the forefront of this trend, leading all fast food value sales in 2012. Taking advantage of the largest geographic coverage across Japan, the company benefited the most from the increasing popularity of convenience stores fast food. Convenience stores increasingly started to serve freshly-brewed coffee in their outlets during 2012, in order to appeal to a wider consumer base of older consumers and women.
Quick Facts on Dining Out in Japan
• Most popular formats
• Full-service
restaurants
• Cafes/bars
• Fast food
• Top foodservice chains 1. 7-Eleven
2. McDonald’s
3. Family Mart
4. Lawson
5. Sukiya

Market Opportunity Report: JAPAN
Selected source material © Euromonitor International Ltd 2014. Applicable terms and conditions of use and the disclaimer at the front of this document apply. Page 30
Health & Wellness Habits Considered one of the healthiest cultures in the world, it is no surprise the Japanese are increasingly interested in organics and soy-based products but price is always a concern
• Japan boasts one of the longest life expectancies in the world and is considered a very health-conscious nation by any measure. With an ageing population, increased health awareness has become even more important to most.
• In line with the rising awareness of issues surrounding food safety and health, demand for organic food and beverages has increased in Japan in recent years. In particular, there has been increased consumer demand for organic bread and other organic packaged food.
• Even more impressive has been the strong growth in Better-For-You (BFY) products, those products defined as having a lower content of less healthy substances, such as sugar, fat, salt, and carbohydrates. After the metabolic syndrome checking system started in April 2008, the concern about diabetes and metabolic syndrome grew amongst the Japanese people, making them more aware of intake of calories, fat and sugar and driving demand for BFY products.

Market Opportunity Report: JAPAN
Selected source material © Euromonitor International Ltd 2014. Applicable terms and conditions of use and the disclaimer at the front of this document apply. Page 31
• Food/drink specialists are the largest grocery retail channel in Japan. Consumers have traditionally preferred the convenience and expertise of these neighbourhood stores, but are increasingly migrating to more modern formats like convenience stores.
• Convenience stores are the fastest growing grocery retail channel in Japan. Consumers enjoy the low prices and proximity of these stores for everyday food purchases.
• A main strategy for retailers has become developing diverse private label portfolios, due to increased importance of price and affordability in purchasing decisions.
RETAIL LANDSCAPE
Key Points
Consumer price sensitivity leads to intense competition among retailers, discounting and private label launches
• With pessimistic attitudes toward the economy, consumers have attempted to save money on spending by incorporating selective shopping into their normal shopping habits. Along these lines, consumers are more commonly purchasing economy-priced products and looking for discounts when fulfilling their daily needs. Retailers have responded to this trend by launching private label products with affordable pricing.
• In 2012, internet retailing value sales grew by 11 per cent in current terms. With wider access to internet and attractive portable devices, consumers are increasingly shopping online. As more women remain longer in the workforce, dual working parents increased in number and consumer lifestyles became busier. As both parents are at work during the daytime, internet retailing became one of the most convenient channels offering 24-hour operation, seven days a week.
Table 6 Ranking of Largest Retail Distribution Channels in Japan by Outlets: 2012
1. Food/Drink Specialists 2. Convenience Stores 3. Independent Food Stores 4. Supermarkets Source: Trade associations, trade press, company research, trade interviews, Euromonitor International estimates

Market Opportunity Report: JAPAN
Selected source material © Euromonitor International Ltd 2014. Applicable terms and conditions of use and the disclaimer at the front of this document apply. Page 32
REFERENCES
For data sources and more information on topics discussed in this report, please visit the links listed below.
Description Source
Export Tools for British Columbians
http://www.britishcolumbia.ca/Export/Index.aspx
Exporting Your Products from British Columbia
http://www.britishcolumbia.ca/Export/Exporting-Your-Products.aspx
Contact our Trade and Investment Representative Office in Japan
https://www.britishcolumbia.ca/Global/Trade-and-Investment-Representatives/Japan.aspx
Agriculture and Agri-Food Canada - Agri-Food Trade Policy
http://www.agr.gc.ca/itpd-dpci/index-eng.htm
Foreign Affairs, Trade and Development Canada
http://www.international.gc.ca/trade-agreements-accords-commerciaux/index.aspx
Imported Foods Inspection Services of Japan
http://www.mhlw.go.jp/english/topics/importedfoods/index.html
Japan Customs – Tariff Schedule
http://www.customs.go.jp/english/tariff/
5


![The 21 Japan International Seafood Technology Expoexhibitiontech.com/seafood/e_brochure.pdf · 2019-04-17 · New Venue 2019.8.21[Wed] 8.23[Fri] Tokyo Big Sight South Co-Event Sushi](https://img.dokumen.tips/doc/110x75/5f05e86e7e708231d4155209/the-21-japan-international-seafood-technology-2019-04-17-new-venue-2019821wed.jpg)