Embed Size (px)
Citation preview

Mark Keppel Elementary SchoolSchool Accountability Report Card, 2007–2008Glendale Unified School District
An annual report to the
community about teaching,
learning, test results,
resources, and measures of
progress in our school.
»
Mark Keppel Elementary School School Accountability Report Card, 2007–2008Glendale Unified School District
»Contents
ONLINE USERS: CLICK ON A TITLE TO JUMP TO THAT SECTION
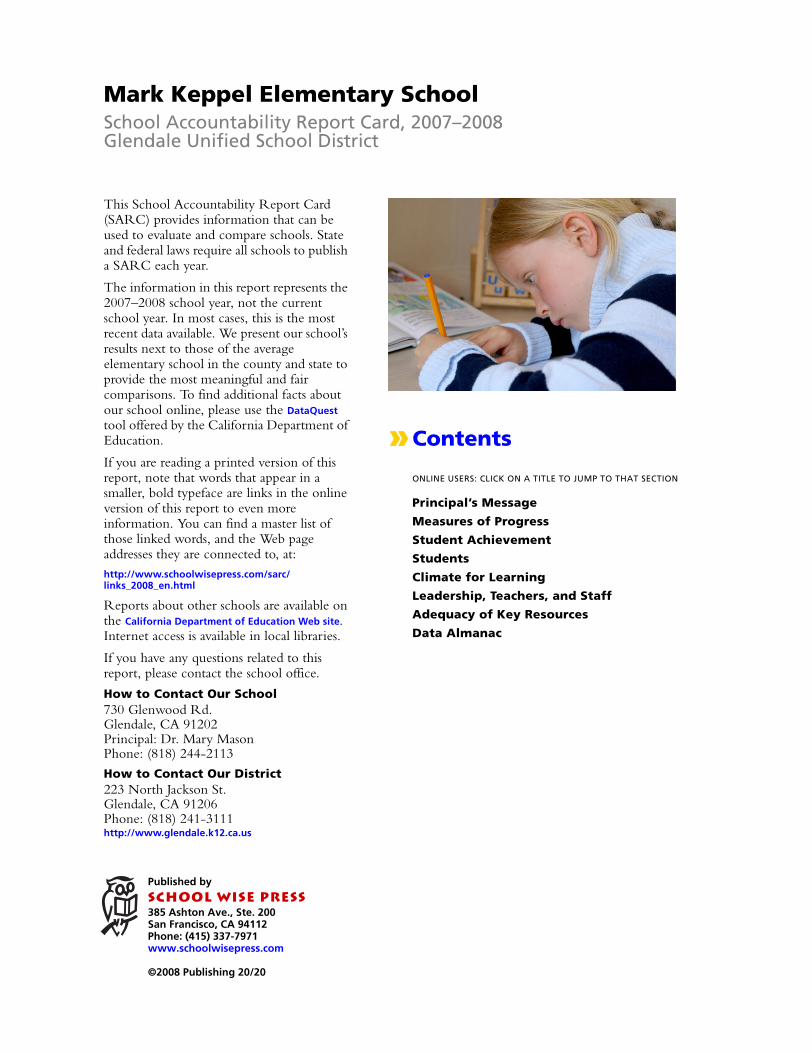
This School Accountability Report Card (SARC) provides information that can be used to evaluate and compare schools. State and federal laws require all schools to publish a SARC each year.
The information in this report represents the 2007–2008 school year, not the current school year. In most cases, this is the most recent data available. We present our school’s results next to those of the average elementary school in the county and state to provide the most meaningful and fair comparisons. To find additional facts about our school online, please use the DataQuest tool offered by the California Department of Education.
If you are reading a printed version of this report, note that words that appear in a smaller, bold typeface are links in the online version of this report to even more information. You can find a master list of those linked words, and the Web page addresses they are connected to, at:http://www.schoolwisepress.com/sarc/links_2008_en.html
Reports about other schools are available on the California Department of Education Web site. Internet access is available in local libraries.
If you have any questions related to this report, please contact the school office.
How to Contact Our School730 Glenwood Rd.Glendale, CA 91202Principal: Dr. Mary MasonPhone: (818) 244-2113
How to Contact Our District223 North Jackson St.Glendale, CA 91206Phone: (818) 241-3111http://www.glendale.k12.ca.us
Published by
SCHOOL WISE PRESS385 Ashton Ave., Ste. 200San Francisco, CA 94112Phone: (415) 337-7971www.schoolwisepress.com
©2008 Publishing 20/20
Principal’s Message
Measures of Progress
Student Achievement
Students
Climate for Learning
Leadership, Teachers, and Staff
Adequacy of Key Resources
Data Almanac

»
Mark Keppel Elementary SchoolSchool Accountability Report Card, 2007–2008Glendale Unified School District
Glendale Unified School District
Grade range and calendar
K–6TRADITIONAL
Academic Performance Index
827County Average: 767State Average: 776
Student enrollment
909County Average: 615State Average: 523
Teachers
41County Average: 31State Average: 26
Students per teacher
22County Average: 20State Average: 20
Students per computer
6County Average: 4State Average: 4
Principal�s Message
I am proud of our school and dedicated teaching and support staff. From the moment you enter our front doors and are greeted by our helpful front office staff, we are here to serve you. We have high expectations for student learning, and they rise to meet our challenge! We are committed to excellence as evidenced by how we have seen our test scores rise this year. Keppel has a wonderful school environment, and we are fortunate to have a fantastic group of parents that support us daily. As your principal, I want you to know that Mark Keppel Elementary School is a very special place. The students who attend Mark Keppel Elementary School receive a strong academic program provided by dedicated, professional teachers who care about their students, not only academically, but also personally.
Mark Keppel Elementary School offers outstanding technological, instrumental, choral, arts, and library programs. I encourage parents to become active participants in the PTA and the foundation Make Keppel Special (MKS), to volunteer in the classroom, and to join the School Site Council (SSC).
The Foreign Language Academies of Glendale (FLAG) program at Keppel is a 50/50 model Korean dual immersion program designed to develop biliteracy skills in all participating students beginning in Kindergarten and extending through fifth grade. Interested parents from across Glendale Unified School District should contact the school prior to enrolling their Kindergarten students.
This is OUR school, and we need to make it the best school possible for the students who attend here. The state of California recognized the wonderful learning environment here at Mark Keppel Elementary School by naming us a California Distinguished School in May 2002 and a Title I Achieving School in 2005.
My door is always open to all students, parents, and teachers. I am here to serve the Mark Keppel Elementary School community for the Glendale Unified School District. I do this with an open mind and a sincere devotion to the education of our students. Please come and visit to see for yourself what a wonderful learning environment we have at Mark Keppel!
Dr. Mary Mason, PRINCIPAL
Mark Keppel Elementary School School Accountability Report Card for 2007–2008 Page 2
SafetyAll exterior gates are locked after morning drop off. Mark Keppel is a secured campus during the school day. Visitors must check in at the front office by signing in our visitor’s book and getting a visitor’s badge. We have front security doors just inside our main office from which everyone is buzzed in.
Our safety plan is revised each year with staff, parents, and local law enforcement representatives. Monthly faculty meetings cover safety issues and an OSHA meeting is conducted each year. A schoolwide discipline assembly is held during the first two weeks of school to remind students of all our safety rules, and teachers review evacuation procedures with their classes each year. Posters are up in each classroom that outline the evacuation path as well as procedures for all emergency situations. These procedures are reviewed and revised yearly. We also conduct a PTA meeting outlining the safety procedures at our school to parents. Our schoolwide monthly drills are planned and calendared each year. We coordinate our drills with Toll Middle School and Hoover High School, which are our neighbor schools.
BuildingsCleanliness and safety are main priorities at Keppel! Our main building was completely modernized through a three-year Measure K project from 2002–2006. All classrooms and rest rooms were gutted and refurbished. We have all new plumbing, tile, air conditioning and heating units, and flooring, as well as lowered ceilings and tackable wall surfaces in all of our classrooms. Our PTA and School Foundation have invested thousands of dollars in school murals to beautify our campus. They have also planted trees and flowers all around the school grounds. In 2006, a school “unity garden” was created along Virginia Avenue, and each grade level has their own raised bed for special planting projects. We continually receive compliments from visitors on how beautiful our campus looks. We are very proud of our school!
Parent InvolvementAt Keppel, we have a fabulous team of parent volunteers that are a huge part of what makes our school so special. We have two primary groups that support our school: our PTA and our Make Keppel Special (MKS) committee. Our PTA president is Adrine Novshadyan. You can email her at [email protected]. Our PTA holds monthly meetings on topics of interest. MKS is our school foundation, which primarily raises money for our extra art classes at Keppel. The MKS chairperson is Marianna Clarizio. Her email address is [email protected].
Parents who are interested in volunteering can contact Adrine Novshadyan, Marianne Clarizio, or our school principal. Our teachers welcome parent volunteers in classrooms to help with special projects, accompany students on fieldtrips, assist with classroom groups, and more. We encourage parents to talk directly to their child’s teacher if they wish to volunteer.
Glendale Unified School District
Mark Keppel Elementary School School Accountability Report Card for 2007–2008 Page 3
Academic Performance IndexThe Academic Performance Index (API) is California’s way of comparing schools based on student test scores. The index was created in 1999 to help parents and educators recognize schools that show progress and identify schools that need help. A school’s API determines whether it receives recognition or sanctions. It is also used to compare schools in a statewide ranking system. The California Department of Education (CDE) calculates a school’s API using student test results from the California Standards Tests, the California Achievement Test, and, for high schools, the California High School Exit Exam (CAHSEE). APIs range from 200 to 1000. The CDE expects all schools to eventually obtain APIs of at least 800. Additional information on the API can be found on the CDE Web site.
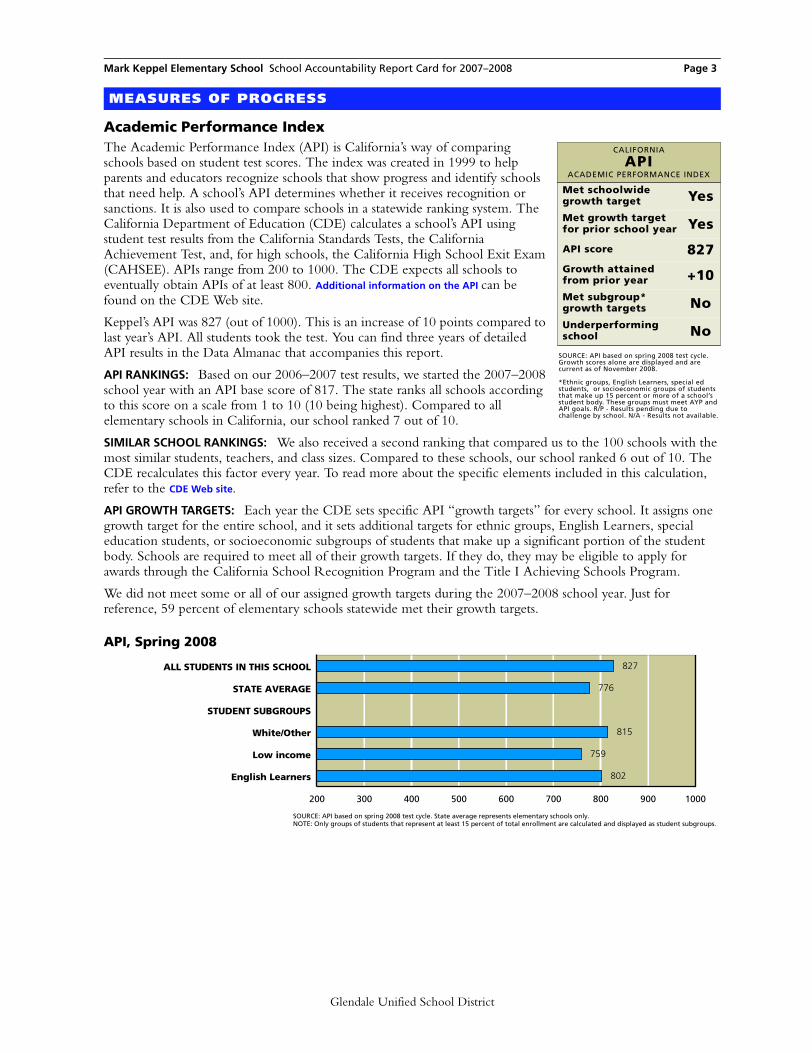
Keppel’s API was 827 (out of 1000). This is an increase of 10 points compared to last year’s API. All students took the test. You can find three years of detailed API results in the Data Almanac that accompanies this report.
API RANKINGS: Based on our 2006–2007 test results, we started the 2007–2008 school year with an API base score of 817. The state ranks all schools according to this score on a scale from 1 to 10 (10 being highest). Compared to all elementary schools in California, our school ranked 7 out of 10.
SIMILAR SCHOOL RANKINGS: We also received a second ranking that compared us to the 100 schools with the most similar students, teachers, and class sizes. Compared to these schools, our school ranked 6 out of 10. The CDE recalculates this factor every year. To read more about the specific elements included in this calculation, refer to the CDE Web site.
API GROWTH TARGETS: Each year the CDE sets specific API “growth targets” for every school. It assigns one growth target for the entire school, and it sets additional targets for ethnic groups, English Learners, special education students, or socioeconomic subgroups of students that make up a significant portion of the student body. Schools are required to meet all of their growth targets. If they do, they may be eligible to apply for awards through the California School Recognition Program and the Title I Achieving Schools Program.
We did not meet some or all of our assigned growth targets during the 2007–2008 school year. Just for reference, 59 percent of elementary schools statewide met their growth targets.
MEASURES OF PROGRESS
CALIFORNIA
APIACADEMIC PERFORMANCE INDEX
Met schoolwide growth target YesMet growth target for prior school year Yes
API score 827Growth attained from prior year +10Met subgroup* growth targets NoUnderperforming school No
SOURCE: API based on spring 2008 test cycle. Growth scores alone are displayed and are current as of November 2008.
*Ethnic groups, English Learners, special ed students, or socioeconomic groups of students that make up 15 percent or more of a school’s student body. These groups must meet AYP and API goals. R/P - Results pending due to challenge by school. N/A - Results not available.
200 300 400 500 600 700 800 900 1000
English Learners
Low income
White/Other
STUDENT SUBGROUPS
STATE AVERAGE
ALL STUDENTS IN THIS SCHOOL
API, Spring 2008
827
776
815
759
802
SOURCE: API based on spring 2008 test cycle. State average represents elementary schools only.NOTE: Only groups of students that represent at least 15 percent of total enrollment are calculated and displayed as student subgroups.
Glendale Unified School District

Mark Keppel Elementary School School Accountability Report Card for 2007–2008 Page 4
Adequate Yearly ProgressIn addition to California’s accountability system, which measures student achievement using the API, schools must also meet requirements set by the federal education law known as No Child Left Behind (NCLB). This law requires all schools to meet a different goal: Adequate Yearly Progress (AYP).
We met all 17 criteria for yearly progress. As a result, we succeeded at making AYP.
To meet AYP, elementary schools must meet three criteria. First, a certain percentage of students must score at or above Proficient levels on the California Standards Tests (CST): 35.2 percent on the English/language arts test and 37 percent on the math test. All ethnic and socioeconomic subgroups of students also must meet these goals. Second, the schools must achieve an API of at least 620 or increase the API by one point from the prior year. Third, 95 percent of the student body must take the required standardized tests.
If even one subgroup of students fails to meet just one of the criteria, the school fails to meet AYP. While all schools must report their progress toward meeting AYP, only schools that receive federal funding to help economically disadvantaged students are actually penalized if they fail to meet AYP goals. Schools that do not make AYP for two or more years in a row in the same subject enter Program Improvement (PI). They must offer students transfers to other schools in the district and, in their second year in PI, tutoring services as well.
The table at left shows our success or failure in meeting AYP goals in the 2007–2008 school year. The green dots represent goals we met; red dots indicate goals we missed. Just one red dot means that we failed to meet Adequate Yearly Progress.
Note: Dashes indicate that too few students were in the category to draw meaningful conclusions. Federal law requires valid test scores from at least 50 students for statistical significance.
FEDERAL
AYPADEQUATE YEARLY PROGRESS
Met AYP YesMet schoolwide participation rate YesMet schoolwide test score goals YesMet subgroup* participation rate YesMet subgroup* test score goals YesMet schoolwide API for AYP YesProgram Improvement school in 2008
No
SOURCE: AYP is based on the Accountability Progress Report of November 2008. A school can be in Program Improvement based on students’ test results in the 2007–2008 school year or earlier.
*Ethnic groups, English Learners, special ed students, or socioeconomic groups of students that make up 15 percent or more of a school’s student body. These groups must meet AYP and API goals. R/P - Results pending due to challenge by school. N/A - Results not available.
Adequate Yearly Progress, Detail by Subgroup
● MET GOAL ● DID NOT MEET GOAL � NOT ENOUGH STUDENTS
English/Language Arts Math
DID 95%OF STUDENTS
TAKE THE CST?
DID 35.2%OF STUDENTS
SCOREPROFICIENT OR ADVANCED ON
THE CST?
DID 95%OF STUDENTS
TAKE THE CST?
DID 37%OF STUDENTS
SCOREPROFICIENT OR ADVANCED ON
THE CST?
SCHOOLWIDE RESULTS ● ● ● ●
SUBGROUPS OF STUDENTS
Low income ● ● ● ●
Students learning English ● ● ● ●
STUDENTS BY ETHNICITY
White/Other ● ● ● ●SOURCE: AYP release of November 2008, CDE.
Glendale Unified School District

Mark Keppel Elementary School School Accountability Report Card for 2007–2008 Page 5
Here you’ll find a three-year summary of our students’ scores on the California Standards Tests (CST) in selected subjects. We compare our students’ test scores to the results for students in the average elementary school in California. On the following pages we provide more detail for each test, including the scores for different subgroups of students. In addition, we provide links to the California Content Standards on which these tests are based. If you’d like more information about the CST, please contact our principal or our teaching staff. To find grade-level-specific scores, you can refer to the Standardized Testing and Reporting (STAR) Web site. Other tests in the STAR program can be found on the California Department of Education (CDE) Web site.
STUDENT ACHIEVEMENT
BAR GRAPHS BELOW SHOW THESE PROFICIENCY GROUPS (LEFT TO RIGHT):FAR BELOW BASIC BELOW BASIC BASIC PROFICIENT ADVANCED
California Standards Tests
TESTED SUBJECT2007–2008
LOW SCORES HIGH SCORES
2006–2007 LOW SCORES HIGH SCORES
2005–2006 LOW SCORES HIGH SCORES
ENGLISH/LANGUAGE ARTS
Our schoolPercent Proficient or higher
57% 56% 56%
Average elementary schoolPercent Proficient or higher
47% 45% 44%
MATH
Our schoolPercent Proficient or higher
64% 63% 67%
Average elementary schoolPercent Proficient or higher
56% 53% 52%
SCIENCE
Our schoolPercent Proficient or higher
56% 42% 51%
Average elementary schoolPercent Proficient or higher
47% 37% 32%
SOURCE: The scores for the CST are from the spring 2008 test cycle. State average represents elementary schools only. Whenever a school reports fewer than 11 scores for a particular subgroup at any grade level, the CDE suppresses the scores when it releases the data to the public. Missing data makes it impossible for us to compile complete schoolwide results. Therefore, the results published in this report may vary from other published CDE test scores.
Glendale Unified School District
Mark Keppel Elementary School School Accountability Report Card for 2007–2008 Page 6
Frequently Asked Questions About Standardized TestsWHERE CAN I FIND GRADE-LEVEL REPORTS? Due to space constraints and concern for statistical reliability, we have omitted grade-level detail from these test results. Instead we present results at the schoolwide level. You can view the results of far more students than any one grade level would contain, which also improves their statistical reliability. Grade-level results are online on the STAR Web site. More information about student test scores is available in the Data Almanac that accompanies this report.
WHAT DO THE FIVE PROFICIENCY BANDS MEAN? Test experts assign students to one of these five proficiency levels, based on the number of questions they answer correctly. Our immediate goal is to help students move up one level. Our eventual goal is to enable all students to reach either of the top two bands, Advanced or Proficient. Those who score in the middle band, Basic, have come close to attaining the required knowledge and skills. Those who score in either of the bottom two bands, Below Basic or Far Below Basic, need more help to reach the Proficient level.
WHY ARE THE CALIFORNIA STANDARDS TESTS (CST) AND THE CALIFORNIA ACHIEVEMENT TEST (CAT/6) SCORED DIFFERENTLY? When students take the CST, they can score at any of the proficiency levels: Advanced, Proficient, Basic, Below Basic, or Far Below Basic. In theory all students in California could score at the top. The CAT/6 is a nationally normed test, which means that students are scored against each other nationally. This scoring method is similar to grading “on the curve.” CAT/6 scores are expressed as a ranking on a scale from 1 to 99.
HOW HARD ARE THE CALIFORNIA STANDARDS TESTS? Experts consider California’s standards to be among the most clear and rigorous in the country. Just 47 percent of elementary school students scored Proficient or Advanced on the English/language arts test; 56 percent scored Proficient or Advanced in math. You can review the California Content Standards on the CDE Web site.
ARE ALL STUDENTS’ SCORES INCLUDED? No. Only students in grades two through eleven are required to take the CST. When fewer than 11 students in one grade or subgroup take a test, state officials remove their scores from the report. They omit them to protect students’ privacy, as called for by federal law.
CAN I REVIEW SAMPLE TEST QUESTIONS? Sample test questions for the CST are on the CDE’s Web site. These are actual questions used in previous years.
WHERE CAN I FIND ADDITIONAL INFORMATION? The CDE has a wealth of resources on its Web site. The STAR Web site publishes detailed reports for schools and districts, and assistance packets for parents and teachers. This site includes explanations of technical terms, scoring methods, and the subjects covered by the tests for each grade. You’ll also find a guide to navigating the STAR Web site as well as help for understanding how to compare test scores.
Glendale Unified School District

Mark Keppel Elementary School School Accountability Report Card for 2007–2008 Page 7
The graph to the right shows how our students’ scores have changed over the years. We present each year’s results in a vertical bar, with students’ scores arrayed across five proficiency bands. When viewing schoolwide results over time, remember that progress can take many forms. It can be more students scoring in the top proficiency bands (blue); it can also be fewer students scoring in the lower two proficiency bands (brown and red).
You can read the California standards for English/
language arts on the CDE’s Web site.
BAR GRAPHS BELOW SHOW THESE PROFICIENCY GROUPS (LEFT TO RIGHT):FAR BELOW BASIC BELOW BASIC BASIC PROFICIENT ADVANCED
English/Language Arts (Reading and Writing)
GROUP LOW SCORES HIGH SCORES PROFICIENT OR
ADVANCED
STUDENTS TESTED
COMMENTS
SCHOOLWIDE AVERAGE 57% 99% SCHOOLWIDE AVERAGE: About ten percent more students at our school scored Proficient or Advanced than at the average elementary school in California.
AVERAGE ELEMENTARY SCHOOL IN THE COUNTY
44% 98%
AVERAGE ELEMENTARY SCHOOL IN CALIFORNIA
47% 97%
BAR GRAPHS BELOW SHOW TWO PROFICIENCY GROUPS (LEFT TO RIGHT):
FAR BELOW BASIC, BELOW BASIC, AND BASIC PROFICIENT AND ADVANCED
Subgroup Test Scores
GROUP LOW SCORES HIGH SCORES PROFICIENT OR
ADVANCED
STUDENTS TESTED
COMMENTS
Boys 49% 350 GENDER: About 15 percent more girls than boys at our school scored Proficient or Advanced.
Girls 64% 317
English proficient 69% 463 ENGLISH PROFICIENCY: English Learners scored lower on the CST than students who are proficient in English. Because we give this test in English, English Learners tend to be at a disadvantage. English Learners 28% 204
Low income 42% 271 INCOME: About 24 percent fewer students from lower-income families scored Proficient or Advanced than our other students.
Not low income 66% 396
Learning disabled 18% 43 LEARNING DISABILITIES: Students classified as learning disabled scored lower than students without learning disabilities. The CST is not designed to test the progress of students with moderate to severe learning differences. Not learning disabled 59% 624
Asian American 75% 92 ETHNICITY: Test scores are likely to vary among students of different ethnic origins. The degree of variance will differ from school to school. Measures of the achievement gap are beyond the scope of this report.Filipino 92% 43
Hispanic/Latino 46% 86
White/Other 53% 428
SOURCE: The scores for the CST are from the spring 2008 test cycle. County and state averages represent elementary schools only. Whenever a school reports fewer than 11 scores for a particular subgroup at any grade level, the CDE suppresses the scores when it releases the data to the public. Missing data makes it impossible for us to compile complete schoolwide results. Therefore, the results published in this report may vary from other published CDE test scores.N/A: Not applicable. Either no students took the test, or to safeguard student privacy the CDE withheld all results because very few students took the test in any grade.N/S: Not statistically significant. While we have some data to report, we are suppressing it because the number of valid test scores is not large enough to be meaningful.
100
80
60
40
20
0
20
40
60
80
100
2006 2007 2008
Three-Year Trend:English/Language Arts
Perc
enta
ge
of
stu
den
ts
SOURCE: CDE STAR research file: 2006, 2007, and 2008.
Percentage of studentswho took the test:
2006: 99%
2007: 99%
2008: 99%
Glendale Unified School District

Mark Keppel Elementary School School Accountability Report Card for 2007–2008 Page 8
The graph to the right shows how our students’ scores have changed over the years. We present each year’s results in a vertical bar, with students’ scores arrayed across five proficiency bands. When viewing schoolwide results over time, remember that progress can take many forms. It can be more students scoring in the top proficiency bands (blue); it can also be fewer students scoring in the lower two proficiency bands (brown and red).
You can read the math standards on the CDE’s Web site.
BAR GRAPHS BELOW SHOW THESE PROFICIENCY GROUPS (LEFT TO RIGHT):FAR BELOW BASIC BELOW BASIC BASIC PROFICIENT ADVANCED
Math
GROUP LOW SCORES HIGH SCORES PROFICIENT OR
ADVANCED
STUDENTS TESTED
COMMENTS
SCHOOLWIDE AVERAGE 64% 99% SCHOOLWIDE AVERAGE: About eight percent more students at our school scored Proficient or Advanced than at the average elementary school in California.
AVERAGE ELEMENTARY SCHOOL IN THE COUNTY
55% 94%
AVERAGE ELEMENTARY SCHOOL IN CALIFORNIA
56% 94%
BAR GRAPHS BELOW SHOW TWO PROFICIENCY GROUPS (LEFT TO RIGHT):
FAR BELOW BASIC, BELOW BASIC, AND BASIC PROFICIENT AND ADVANCED
Subgroup Test Scores
GROUP LOW SCORES HIGH SCORES PROFICIENT OR
ADVANCED
STUDENTS TESTED
COMMENTS
Boys 62% 350 GENDER: About four percent more girls than boys at our school scored Proficient or Advanced.
Girls 66% 317
English proficient 72% 463 ENGLISH PROFICIENCY: English Learners scored lower on the CST than students who are proficient in English. Because we give this test in English, English Learners tend to be at a disadvantage. English Learners 45% 204
Low income 51% 271 INCOME: About 22 percent fewer students from lower-income families scored Proficient or Advanced than our other students.
Not low income 73% 396
Learning disabled 45% 43 LEARNING DISABILITIES: Students classified as learning disabled scored lower than students without learning disabilities. The CST is not designed to test the progress of students with moderate to severe learning differences. Not learning disabled 66% 624
Asian American 85% 92 ETHNICITY: Test scores are likely to vary among students of different ethnic origins. The degree of variance will differ from school to school. Measures of the achievement gap are beyond the scope of this report.Filipino 77% 43
Hispanic/Latino 49% 86
White/Other 62% 428
SOURCE: The scores for the CST are from the spring 2008 test cycle. County and state averages represent elementary schools only. Whenever a school reports fewer than 11 scores for a particular subgroup at any grade level, the CDE suppresses the scores when it releases the data to the public. Missing data makes it impossible for us to compile complete schoolwide results. Therefore, the results published in this report may vary from other published CDE test scores.N/A: Not applicable. Either no students took the test, or to safeguard student privacy the CDE withheld all results because very few students took the test in any grade.N/S: Not statistically significant. While we have some data to report, we are suppressing it because the number of valid test scores is not large enough to be meaningful.
100
80
60
40
20
0
20
40
60
80
100
2006 2007 2008
Three-Year Trend: Math
Perc
enta
ge
of
stu
den
ts
SOURCE: CDE STAR research file: 2006, 2007, and 2008.
Percentage of studentswho took the test:
2006: 99%
2007: 99%
2008: 99%
Glendale Unified School District
Mark Keppel Elementary School School Accountability Report Card for 2007–2008 Page 9
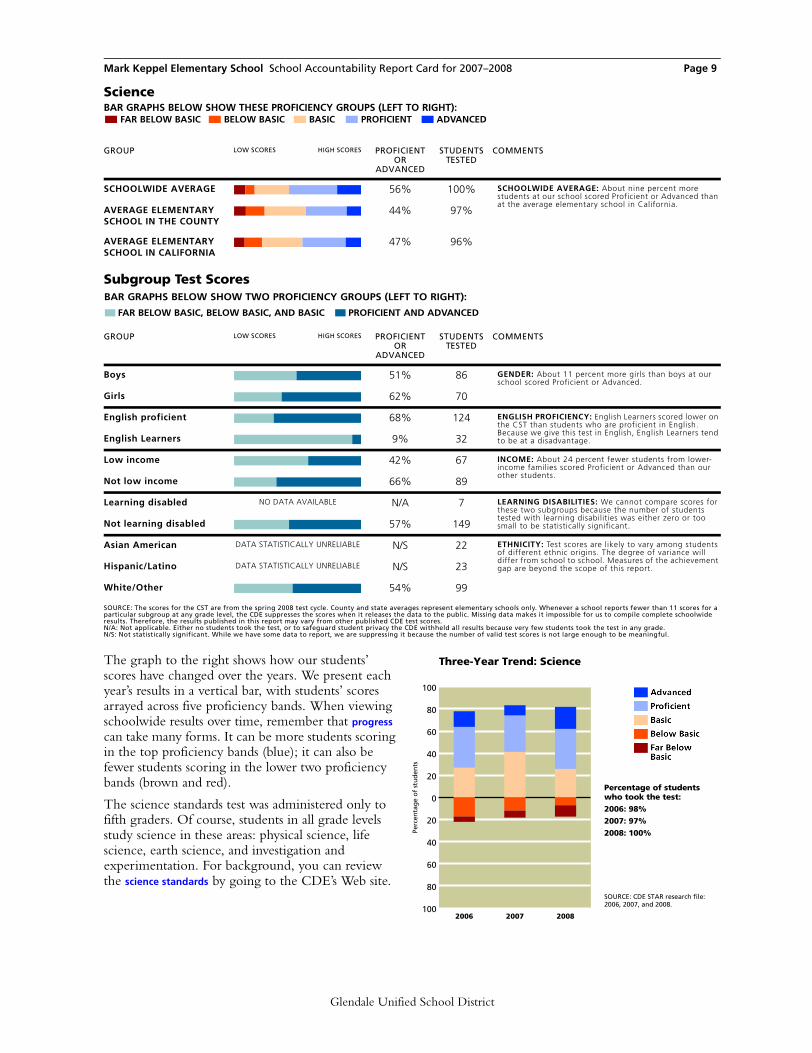
The graph to the right shows how our students’ scores have changed over the years. We present each year’s results in a vertical bar, with students’ scores arrayed across five proficiency bands. When viewing schoolwide results over time, remember that progress can take many forms. It can be more students scoring in the top proficiency bands (blue); it can also be fewer students scoring in the lower two proficiency bands (brown and red).
The science standards test was administered only to fifth graders. Of course, students in all grade levels study science in these areas: physical science, life science, earth science, and investigation and experimentation. For background, you can review the science standards by going to the CDE’s Web site.
BAR GRAPHS BELOW SHOW THESE PROFICIENCY GROUPS (LEFT TO RIGHT):FAR BELOW BASIC BELOW BASIC BASIC PROFICIENT ADVANCED
Science
GROUP LOW SCORES HIGH SCORES PROFICIENT OR
ADVANCED
STUDENTS TESTED
COMMENTS
SCHOOLWIDE AVERAGE 56% 100% SCHOOLWIDE AVERAGE: About nine percent more students at our school scored Proficient or Advanced than at the average elementary school in California.
AVERAGE ELEMENTARY SCHOOL IN THE COUNTY
44% 97%
AVERAGE ELEMENTARY SCHOOL IN CALIFORNIA
47% 96%
BAR GRAPHS BELOW SHOW TWO PROFICIENCY GROUPS (LEFT TO RIGHT):
FAR BELOW BASIC, BELOW BASIC, AND BASIC PROFICIENT AND ADVANCED
Subgroup Test Scores
GROUP LOW SCORES HIGH SCORES PROFICIENT OR
ADVANCED
STUDENTS TESTED
COMMENTS
Boys 51% 86 GENDER: About 11 percent more girls than boys at our school scored Proficient or Advanced.
Girls 62% 70
English proficient 68% 124 ENGLISH PROFICIENCY: English Learners scored lower on the CST than students who are proficient in English. Because we give this test in English, English Learners tend to be at a disadvantage. English Learners 9% 32
Low income 42% 67 INCOME: About 24 percent fewer students from lower-income families scored Proficient or Advanced than our other students.
Not low income 66% 89
Learning disabled NO DATA AVAILABLE N/A 7 LEARNING DISABILITIES: We cannot compare scores for these two subgroups because the number of students tested with learning disabilities was either zero or too small to be statistically significant. Not learning disabled 57% 149
Asian American DATA STATISTICALLY UNRELIABLE N/S 22 ETHNICITY: Test scores are likely to vary among students of different ethnic origins. The degree of variance will differ from school to school. Measures of the achievement gap are beyond the scope of this report.Hispanic/Latino DATA STATISTICALLY UNRELIABLE N/S 23
White/Other 54% 99
SOURCE: The scores for the CST are from the spring 2008 test cycle. County and state averages represent elementary schools only. Whenever a school reports fewer than 11 scores for a particular subgroup at any grade level, the CDE suppresses the scores when it releases the data to the public. Missing data makes it impossible for us to compile complete schoolwide results. Therefore, the results published in this report may vary from other published CDE test scores.N/A: Not applicable. Either no students took the test, or to safeguard student privacy the CDE withheld all results because very few students took the test in any grade.N/S: Not statistically significant. While we have some data to report, we are suppressing it because the number of valid test scores is not large enough to be meaningful.
100
80
60
40
20
0
20
40
60
80
100
2006 2007 2008
Three-Year Trend: Science
Perc
enta
ge
of
stu
den
ts
SOURCE: CDE STAR research file: 2006, 2007, and 2008.
Percentage of studentswho took the test:
2006: 98%
2007: 97%
2008: 100%
Glendale Unified School District
Mark Keppel Elementary School School Accountability Report Card for 2007–2008 Page 10
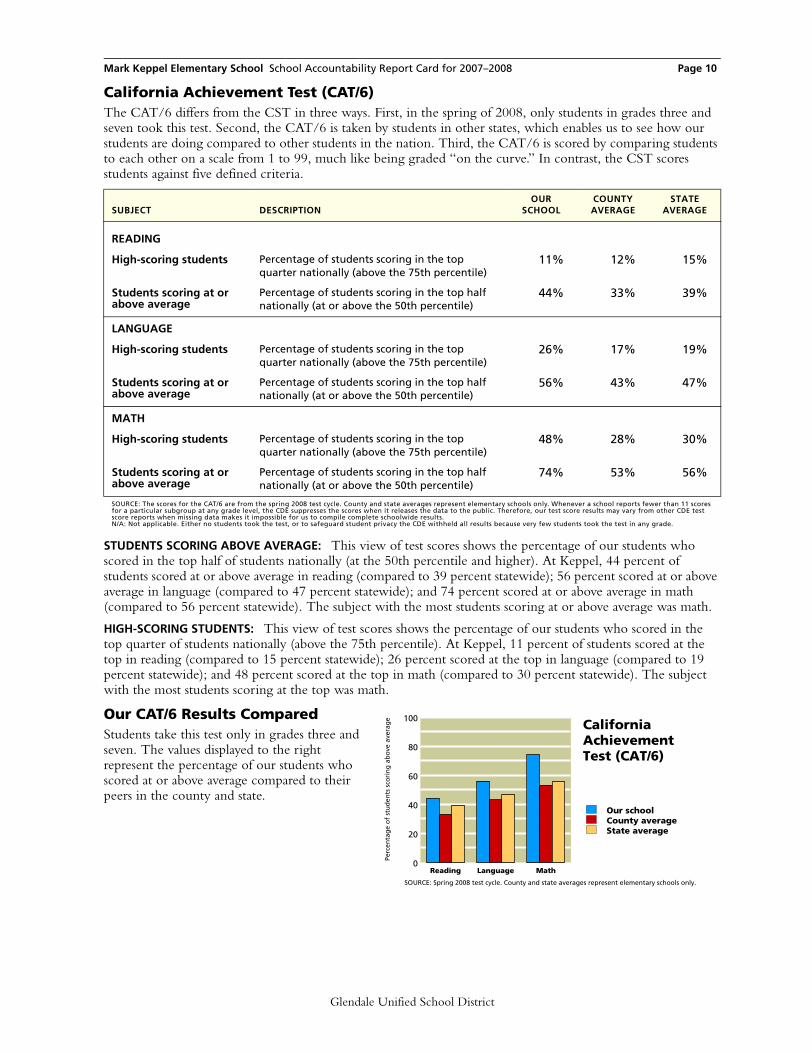
California Achievement Test (CAT/6)The CAT/6 differs from the CST in three ways. First, in the spring of 2008, only students in grades three and seven took this test. Second, the CAT/6 is taken by students in other states, which enables us to see how our students are doing compared to other students in the nation. Third, the CAT/6 is scored by comparing students to each other on a scale from 1 to 99, much like being graded “on the curve.” In contrast, the CST scores students against five defined criteria.
STUDENTS SCORING ABOVE AVERAGE: This view of test scores shows the percentage of our students who scored in the top half of students nationally (at the 50th percentile and higher). At Keppel, 44 percent of students scored at or above average in reading (compared to 39 percent statewide); 56 percent scored at or above average in language (compared to 47 percent statewide); and 74 percent scored at or above average in math (compared to 56 percent statewide). The subject with the most students scoring at or above average was math.
HIGH-SCORING STUDENTS: This view of test scores shows the percentage of our students who scored in the top quarter of students nationally (above the 75th percentile). At Keppel, 11 percent of students scored at the top in reading (compared to 15 percent statewide); 26 percent scored at the top in language (compared to 19 percent statewide); and 48 percent scored at the top in math (compared to 30 percent statewide). The subject with the most students scoring at the top was math.
Our CAT/6 Results ComparedStudents take this test only in grades three and seven. The values displayed to the right represent the percentage of our students who scored at or above average compared to their peers in the county and state.
SUBJECT DESCRIPTIONOUR
SCHOOLCOUNTYAVERAGE
STATEAVERAGE
READING
High-scoring students Percentage of students scoring in the top quarter nationally (above the 75th percentile)
11% 12% 15%
Students scoring at or above average
Percentage of students scoring in the top half nationally (at or above the 50th percentile)
44% 33% 39%
LANGUAGE
High-scoring students Percentage of students scoring in the top quarter nationally (above the 75th percentile)
26% 17% 19%
Students scoring at or above average
Percentage of students scoring in the top half nationally (at or above the 50th percentile)
56% 43% 47%
MATH
High-scoring students Percentage of students scoring in the top quarter nationally (above the 75th percentile)
48% 28% 30%
Students scoring at or above average
Percentage of students scoring in the top half nationally (at or above the 50th percentile)
74% 53% 56%
SOURCE: The scores for the CAT/6 are from the spring 2008 test cycle. County and state averages represent elementary schools only. Whenever a school reports fewer than 11 scores for a particular subgroup at any grade level, the CDE suppresses the scores when it releases the data to the public. Therefore, our test score results may vary from other CDE test score reports when missing data makes it impossible for us to compile complete schoolwide results.N/A: Not applicable. Either no students took the test, or to safeguard student privacy the CDE withheld all results because very few students took the test in any grade.
0
20
40
60
80
100
Reading Language Math
Our schoolCounty averageState average
CaliforniaAchievementTest (CAT/6)
Perc
enta
ge
of
stu
den
ts s
cori
ng
ab
ove
ave
rag
e
SOURCE: Spring 2008 test cycle. County and state averages represent elementary schools only.
Glendale Unified School District

Mark Keppel Elementary School School Accountability Report Card for 2007–2008 Page 11
Students’ English Language SkillsAt Keppel, 66 percent of students were considered to be proficient in English, compared to 68 percent of elementary school students in California overall.
Languages Spoken atHome by English LearnersPlease note that this table describes the home languages of just the 307 students classified as English Learners. At Keppel, the language these students most often speak at home is Armenian. In California it’s common to find English Learners in classes with students who speak English well. When you visit our classrooms, ask our teachers how they work with language differences among their students.
EthnicityMost students at Keppel identify themselves as White/European American/Other. In fact, there are about three times as many White/European American/Other students as Asian/Pacific Islander students, the second-largest ethnic group at Keppel. The state of California allows citizens to choose more than one ethnic identity, or to select “multiethnic” or “decline to state.” As a consequence, the sum of all responses rarely equals 100 percent.
Family Income and EducationThe free or reduced-price meal subsidy goes to students whose families earned less than $38,203 a year (based on a family of four) in the 2007–2008 school year. At Keppel, 37 percent of the students qualified for this program, compared to 55 percent of students in California.
The parents of 66 percent of the students at Keppel have attended college, and 49 percent have a college degree. This information can provide some clues to the level of literacy children bring to school. One precaution is that the students themselves provide this data when they take the battery of standardized tests each spring, so it may not be completely accurate. About 63 percent of our students provided this information.
STUDENTS
LANGUAGE SKILLSOUR
SCHOOLCOUNTYAVERAGE
STATEAVERAGE
English-proficient students 66% 63% 68%
English Learners 34% 37% 32%
SOURCE: Language Census for school year 2007–2008. County and state averages represent elementary schools only.
LANGUAGEOUR
SCHOOLCOUNTYAVERAGE
STATEAVERAGE
Spanish 11% 89% 85%
Vietnamese 2% 1% 3%
Cantonese 0% 2% 1%
Hmong 0% 0% 1%
Filipino/Tagalog 3% 1% 1%
Korean 17% 2% 1%
Khmer/Cambodian 0% 0% 0%
All other 67% 5% 8%
SOURCE: Language Census for school year 2007–2008. County and state averages represent elementary schools only.
ETHNICITYOUR
SCHOOLCOUNTYAVERAGE
STATEAVERAGE
African American 1% 9% 7%
Asian American/Pacific Islander
21% 10% 11%
Hispanic/Latino 12% 64% 50%
White/European American/Other
66% 17% 32%
SOURCE: CBEDS census of October 2007. County and state averages represent elementary schools only.
FAMILY FACTORSOUR
SCHOOLCOUNTYAVERAGE
STATEAVERAGE
Low-income indicator 37% 63% 55%
Parents with some college 66% 47% 54%
Parents with college degree 49% 27% 30%
SOURCE: The free and reduced-price lunch information is gathered by most districts in October. This data is from the 2007–2008 school year. Parents’ education level is collected in the spring at the start of testing. Rarely do all students answer these questions. County and state averages represent elementary schools only.
Glendale Unified School District

Mark Keppel Elementary School School Accountability Report Card for 2007–2008 Page 12
Average Class SizesBecause funding for class-size reduction was focused on the early grade levels, our school’s class sizes, like those of most elementary schools, differ across grade levels.
The average class size at Keppel varies across grade levels from a low of 18 students to a high of 38. Our average class size schoolwide is 24 students. The average class size for elementary schools in the state is 22 students.
DisciplineAt times we find it necessary to suspend students who break school rules. We report only suspensions in which students are sent home for a day or longer. We do not report in-school suspensions, in which students are removed from one or more classes during a single school day. Expulsion is the most serious consequence we can impose. Expelled students are removed from the school permanently and denied the opportunity to continue learning here.
During the 2007–2008 school year, we had 42 suspension incidents. We had no incidents of expulsion. To make it easy to compare our suspensions and expulsions to those of other schools, we represent these events as a ratio (incidents per 100 students) in this report. Please note that multiple incidents may involve the same student.
ComputersWe have 141 computers available for student use, which means that, on average, there is one computer for every six students. There are 37 classrooms connected to the Internet.
CLIMATE FOR LEARNING
AVERAGE CLASS SIZE BY GRADEOUR
SCHOOLCOUNTYAVERAGE
STATEAVERAGE
Kindergarten 18% 20% 20%
First grade 20% 20% 19%
Second grade 20% 20% 19%
Third grade 20% 20% 20%
Fourth grade 34% 28% 28%
Fifth grade 35% 28% 29%
Sixth grade 38% 30% 29%
SOURCE: CBEDS census, October 2007. County and state averages represent elementary schools only.
KEY FACTOROUR
SCHOOLDISTRICTAVERAGE
STATEAVERAGE
Suspensions per 100 students
2007–2008 5 4 6
2006–2007 5 6 6
2005–2006 2 4 5
Expulsions per 100 students
2007–2008 0 0 0
2006–2007 0 0 0
2005–2006 0 0 0
SOURCE: Data is from the California Department of Education, SARC research file. Data represents the number of incidents reported, not the number of students involved. District and state averages represent elementary schools only.
RESOURCESOUR
SCHOOLCOUNTYAVERAGE
STATEAVERAGE
Students per computer 6% 4% 4%
Internet-connected classrooms 37% 32% 29%
SOURCE: CBEDS census of October 2007. County and state averages represent elementary schools only.
Glendale Unified School District

Mark Keppel Elementary School School Accountability Report Card for 2007–2008 Page 13
About five percent of our teachers have fewer than three years of teaching experience, which is below the average for new teachers in other elementary schools in California. Our teachers have, on average, 16 years of experience. About 44 percent of our teachers hold only a bachelor’s degree from a four-year college or university. About 56 percent have completed a master’s degree or higher.
About 98 percent of the faculty at Keppel hold a full credential. This number is close to the average for all elementary schools in the state. None of the faculty at Keppel holds a trainee credential, which is reserved for those teachers who are in the process of completing their teacher training. In comparison, two percent of elementary school teachers throughout the state hold trainee credentials. About two percent of our faculty hold an emergency permit. Very few elementary school teachers hold this authorization statewide (just two percent). About 93 percent of the faculty at Keppel hold the elementary (multiple-subject) credential. This number is above the average for elementary schools in California, which is 91 percent. You can find three years of data about teachers’ credentials in the Data Almanac that accompanies this report.
LEADERSHIP, TEACHERS, AND STAFF
Teacher Experience and Education
KEY FACTOR DESCRIPTIONOUR
SCHOOLCOUNTYAVERAGE
STATEAVERAGE
Teaching experience Average years of teaching experience 16% 13% 13%
Newer teachers Percentage of teachers with one or two years of teaching experience
5% 9% 11%
Teachers holding an MA degree or higher
Percentage of teachers with a master’s degree or higher from a graduate school
56% 39% 34%
Teachers holding a BA degree alone
Percentage of teachers whose highest degree is a bachelor’s degree from a four-year college
44% 61% 66%
SOURCE: Professional Assignment Information Form (PAIF), October 2007, completed by teachers during the CBEDS census. County and state averages represent elementary schools only.
Credentials Held by Our Teachers
KEY FACTOR DESCRIPTIONOUR
SCHOOLCOUNTYAVERAGE
STATEAVERAGE
Fully credentialed teachers
Percentage of staff holding a full, clear authorization to teach at the elementary or secondary level
98% 97% 97%
Trainee credential holders
Percentage of staff holding an internship credential
0% 2% 2%
Emergency permit holders
Percentage of staff holding an emergency permit
2% 3% 2%
Teachers with waivers Lowest level of accreditation, used by districts when they have no other option
0% 0% 0%
SOURCE: PAIF, October 2007. This is completed by teachers during the CBEDS census. County and state averages represent elementary schools only. A teacher may have earned more than one credential. For this reason, it is likely that the sum of all credentials will exceed 100 percent.
Glendale Unified School District

Mark Keppel Elementary School School Accountability Report Card for 2007–2008 Page 14
“HIGHLY QUALIFIED” TEACHERS: The federal law known as No Child Left Behind (NCLB) requires districts to report the number of teachers considered to be “highly qualified.” These “highly qualified” teachers must have a full credential, a bachelor’s degree, and, if they are teaching a core subject (such as reading, math, science, or social studies), they must also demonstrate expertise in that field. The table above shows the percentage of core courses taught by teachers who are considered to be less than “highly qualified.” There are exceptions, known as the High Objective Uniform State Standard of Evaluation (HOUSSE) rules, that allow some veteran teachers to meet the “highly qualified” test who wouldn’t otherwise do so.
CREDENTIAL STATUS OF TEACHERS: Teachers who lack full credentials are working under the terms of an emergency permit, an internship credential, or a waiver. They should be working toward their credential, and they are allowed to teach in the meantime only if the school board approves. About two percent of our teachers were working without full credentials, compared to three percent of teachers in elementary schools statewide.
Districtwide Distribution of Teachers Who Are Not “Highly Qualified”Here, we report the percentage of core courses in our district whose teachers are considered to be less than “highly qualified” by NCLB’s standards. We show how these teachers are distributed among schools according to the percentage of low-income students enrolled.
The CDE has divided schools in the state into four groups (quartiles), based on the percentage of families who qualify and apply for free or reduced-price lunches. The one-fourth of schools with the most students receiving subsidized lunches are assigned to the first group. The one-fourth of schools with the fewest students receiving subsidized lunches are assigned to the fourth group. We compare the courses and teachers assigned to each of these groups of schools to see how they differ in “highly qualified” teacher assignments.
The average percentage of courses in our district not taught by a “highly qualified” teacher is six percent, compared to eight percent statewide. For schools with the highest percentage of low-income students, this factor is zero percent, compared to five percent statewide. For schools with the lowest percentage of low-income students, this factor is four percent, compared to 11 percent statewide.
Indicators of Teachers Who May Be Underprepared
KEY FACTOR DESCRIPTIONOUR
SCHOOLCOUNTYAVERAGE
STATEAVERAGE
Core courses taught by a teacher not meeting NCLB standards
Percentage of core courses not taught by a “highly qualified” teacher according to federal standards in NCLB
3% N/A 0%
Teachers lacking a full credential
Percentage of teachers without a full, clear credential
2% 3% 3%
SOURCE: Professional Assignment Information Form (PAIF) of October 2007. Data on NCLB standards is from the California Department of Education, SARC research file.
DISTRICT FACTOR DESCRIPTION
CORE COURSES
NOT TAUGHT BY
HQT IN DISTRICT
CORE COURSES
NOT TAUGHT BY
HQT IN STATE
Districtwide Percentage of core courses not taught by “highly qualified” teachers (HQT)
6% 8%
Schools with the most low-income students
First quartile of schools whose core courses are not taught by “highly qualified” teachers
0% 5%
Schools with the fewest low-income students
Fourth quartile of schools whose core courses are not taught by “highly qualified” teachers
4% 11%
SOURCE: Data is from the California Department of Education, SARC research file.
Glendale Unified School District

Mark Keppel Elementary School School Accountability Report Card for 2007–2008 Page 15
Specialized Resource StaffOur school may employ social workers, speech and hearing specialists, school psychologists, nurses, and technology specialists. These specialists often work part time at our school and some may work at more than one school in our district. Their schedules will change as our students’ needs change. For these reasons, the staffing counts you see here may differ from the staffing provided today in this school. For more details on statewide ratios of counselors, psychologists, or other pupil
services staff to students, see the California Department of Education (CDE) Web site. Library facts and frequently asked questions are also available there.
STAFF POSITIONSTAFF (FTE)
Counselors 0.0
Librarians 0.0
Psychologists 0.0
Social workers 0.0
Nurses 0.0
Speech/language/hearing specialists
0.0
Resource specialists 0.0
SOURCE: CBEDS census, October 2007.
TECHNICAL NOTE ON DATA RECENCY: All data is the most current available as of November 2008. The CDE may releaseadditional or revised data for the 2007–2008 school year after the publication date of this report. We rely on the followingsources of information from the California Department of Education: California Basic Education Data System (CBEDS) (Octo-ber 2007 census); Language Census (March 2008); California Achievement Test and California Standards Tests (spring 2008 testcycle); Academic Performance Index (October 2008 growth score release); Adequate Yearly Progress (November 2008). DISCLAIMER: School Wise Press, the publisher of this accountability report, makes every effort to ensure the accuracy of thisinformation but offers no guarantee, express or implied. While we do our utmost to ensure the information is complete, wemust note that we are not responsible for any errors or omissions in the data. Nor are we responsible for any damages caused bythe use of the information this report contains. Before you make decisions based on this information, we strongly recommendthat you visit the school and ask the principal to provide the most up-to-date facts available.
rev20081211_19-64568-6013726e/16377
Glendale Unified School District


Mark Keppel Elementary School School Accountability Report Card for 2007–2008
»
Page 17
Adequacy of Key Resources
Here you’ll find key facts about our teachers, textbooks, and facilities during the school year in progress, 2008–2009. Please note that these facts are based on evaluations our staff conducted in accordance with the Williams legislation.
This section also contains information about 2006–2007 staff development days, and, for high schools, percentages of seniors who met our district’s graduation requirements.
Glendale Unified School District
Mark Keppel Elementary School School Accountability Report Card for 2007–2008
Glendale Unified School District
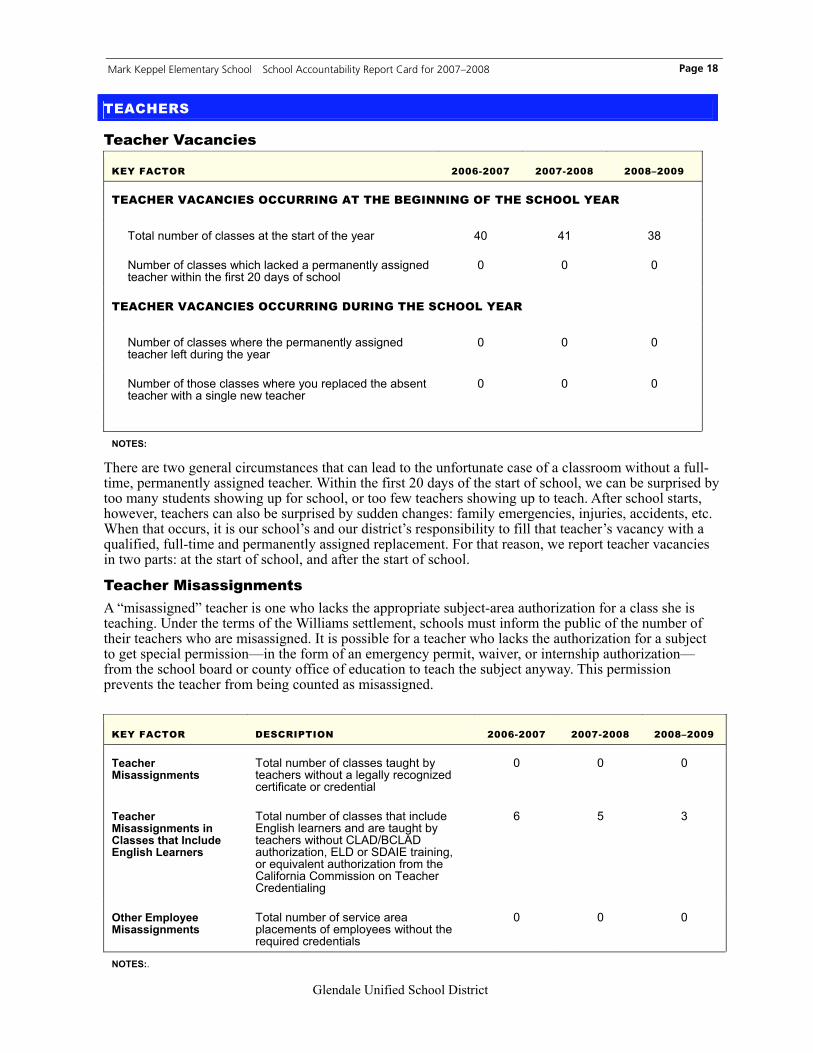
Teacher Vacancies
KEY FACTOR 2006-2007 2007-2008 2008�2009
TEACHER VACANCIES OCCURRING AT THE BEGINNING OF THE SCHOOL YEAR
Total number of classes at the start of the year 40 41 38
Number of classes which lacked a permanently assigned teacher within the first 20 days of school
0 0 0
TEACHER VACANCIES OCCURRING DURING THE SCHOOL YEAR
Number of classes where the permanently assigned teacher left during the year
0 0 0
Number of those classes where you replaced the absent teacher with a single new teacher
0 0 0
NOTES:
There are two general circumstances that can lead to the unfortunate case of a classroom without a full-time, permanently assigned teacher. Within the first 20 days of the start of school, we can be surprised by too many students showing up for school, or too few teachers showing up to teach. After school starts, however, teachers can also be surprised by sudden changes: family emergencies, injuries, accidents, etc. When that occurs, it is our school�s and our district�s responsibility to fill that teacher�s vacancy with a qualified, full-time and permanently assigned replacement. For that reason, we report teacher vacancies in two parts: at the start of school, and after the start of school.
Teacher Misassignments A �misassigned� teacher is one who lacks the appropriate subject-area authorization for a class she is teaching. Under the terms of the Williams settlement, schools must inform the public of the number of their teachers who are misassigned. It is possible for a teacher who lacks the authorization for a subject to get special permission�in the form of an emergency permit, waiver, or internship authorization�from the school board or county office of education to teach the subject anyway. This permission prevents the teacher from being counted as misassigned.
KEY FACTOR DESCRIPTION 2006-2007 2007-2008 2008�2009
Teacher Misassignments
Total number of classes taught by teachers without a legally recognized certificate or credential
0 0 0
Teacher Misassignments in Classes that Include English Learners
Total number of classes that include English learners and are taught by teachers without CLAD/BCLAD authorization, ELD or SDAIE training, or equivalent authorization from the California Commission on Teacher Credentialing
6 5 3
Other Employee Misassignments
Total number of service area placements of employees without the required credentials
0 0 0
NOTES:.
TEACHERS
Page 18

Mark Keppel Elementary School School Accountability Report Card for 2007–2008
Glendale Unified School District
Staff Development
Teachers take some time each year to improve their teaching skills and to extend their knowledge of the subjects they teach. Here you�ll see the amount of time each year we set aside for their continuing education and professional development.
YEAR PROFESSIONAL
DEVELOPMENT DAYS
2007�2008 3.00
2006�2007 3.00
2005�2006 3.00
Page 19

Mark Keppel Elementary School School Accountability Report Card for 2007–2008
Glendale Unified School District
TEXTBOOKS
The main fact about textbooks that the Williams legislation calls for described whether schools have enough books in core classes for all students. The law also asks districts to reveal whether those books are presenting what the California content standards calls for. This information is far more meaningful when viewed along with the more detailed description of textbooks contained in our School Accountability Report Card (SARC). There you�ll find the names of the textbooks used in our core classes, their dates of publication, the names of the firms that published them, and more.
ARE THERE TEXTBOOKS OR INSTRUCTIONAL MATERIALS IN
USE? ARE THERE ENOUGH BOOKS
FOR EACH STUDENT?
TAUGHT AT OUR
SCHOOL? SUBJECT STANDARDS ALIGNED?
OFFICIALLY ADOPTED?
FOR USE IN CLASS?
PERCENTAGE OF STUDENTS
HAVING BOOKS TO TAKE HOME?
English 100%
Math 100%
Science 100%
Social Science 100%
Foreign Languages
Health
Visual/Performing Arts
This information was collected on . NOTES:
Page 20

Mark Keppel Elementary School School Accountability Report Card for 2007–2008
Glendale Unified School District
Textbooks in Use Here are some of the textbooks we use for our core courses.
SUBJECT AND TITLE PUBLISHER YEAR
PUBLISHED
ENGLISH/LANGUAGE ARTS
Reading: California Houghton Miflin 2003
The Language of Literature McDougal Littell 2002
MATH
Everyday Mathematics MacMillan McGraw-Hill 2001
SCIENCE
California Science MacMillan McGraw-Hill 2008
Calfornia Earth Science PrenticeHall 2008
SOCIAL SCIENCE
Reflections: California Series Harcourt 2007
California Vistas McMillan McGraw-Hill 2007
World History: Ancient Civilizations McDougal Littell 2006
Page 21
Mark Keppel Elementary School School Accountability Report Card for 2007–2008
Glendale Unified School District
FACILITIES
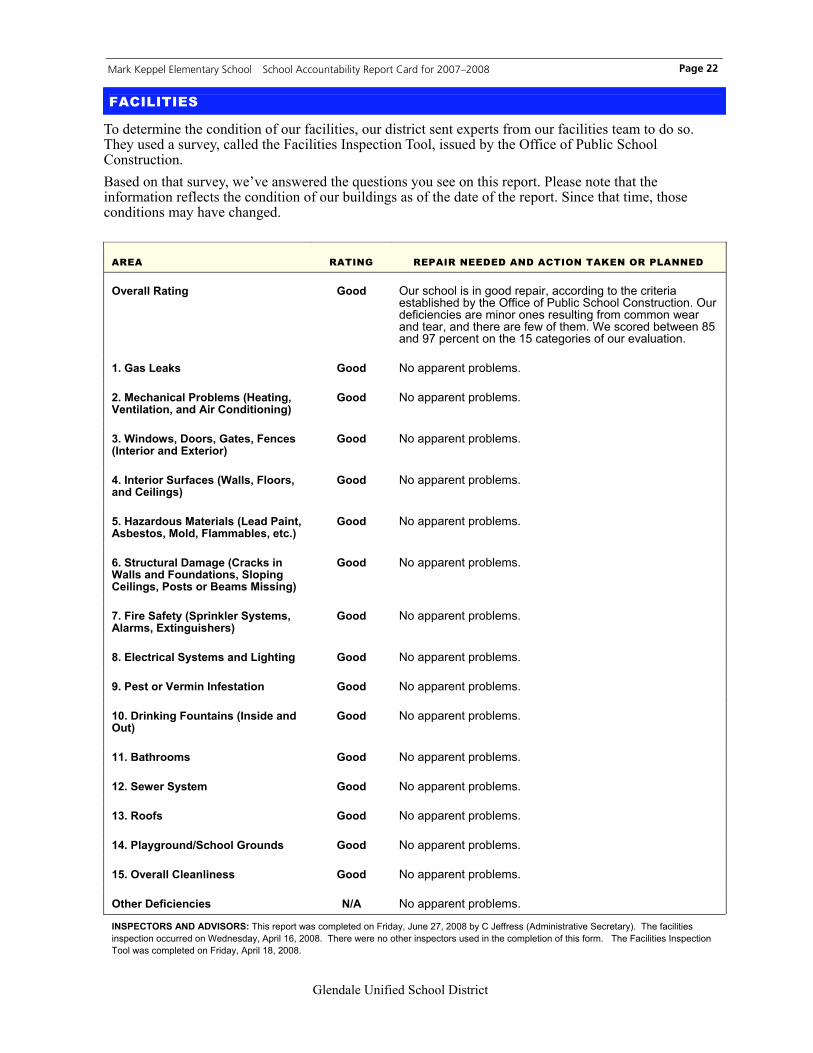
To determine the condition of our facilities, our district sent experts from our facilities team to do so. They used a survey, called the Facilities Inspection Tool, issued by the Office of Public School Construction. Based on that survey, we�ve answered the questions you see on this report. Please note that the information reflects the condition of our buildings as of the date of the report. Since that time, those conditions may have changed.
AREA RATING REPAIR NEEDED AND ACTION TAKEN OR PLANNED
Overall Rating Good Our school is in good repair, according to the criteria established by the Office of Public School Construction. Our deficiencies are minor ones resulting from common wear and tear, and there are few of them. We scored between 85 and 97 percent on the 15 categories of our evaluation.
1. Gas Leaks Good No apparent problems.
2. Mechanical Problems (Heating, Ventilation, and Air Conditioning)
Good No apparent problems.
3. Windows, Doors, Gates, Fences (Interior and Exterior)
Good No apparent problems.
4. Interior Surfaces (Walls, Floors, and Ceilings)
Good No apparent problems.
5. Hazardous Materials (Lead Paint, Asbestos, Mold, Flammables, etc.)
Good No apparent problems.
6. Structural Damage (Cracks in Walls and Foundations, Sloping Ceilings, Posts or Beams Missing)
Good No apparent problems.
7. Fire Safety (Sprinkler Systems, Alarms, Extinguishers)
Good No apparent problems.
8. Electrical Systems and Lighting Good No apparent problems.
9. Pest or Vermin Infestation Good No apparent problems.
10. Drinking Fountains (Inside and Out)
Good No apparent problems.
11. Bathrooms Good No apparent problems.
12. Sewer System Good No apparent problems.
13. Roofs Good No apparent problems.
14. Playground/School Grounds Good No apparent problems.
15. Overall Cleanliness Good No apparent problems.
Other Deficiencies N/A No apparent problems.
INSPECTORS AND ADVISORS: This report was completed on Friday, June 27, 2008 by C Jeffress (Administrative Secretary). The facilities inspection occurred on Wednesday, April 16, 2008. There were no other inspectors used in the completion of this form. The Facilities Inspection Tool was completed on Friday, April 18, 2008.
Page 22

Mark Keppel Elementary School School Accountability Report Card for 2007–2008
Glendale Unified School District
SCHOOL FINANCES, 2006�2007
We are required to report financial data from the 2006�2007 school year by the California Dept. of Education. More recent financial data is available on request from the district office.
Spending per Student To make comparisons possible across schools and districts of varying sizes, we first report our overall spending per student. We base our calculations on our average daily attendance (ADA), which was 846 students. We�ve broken down expenditures by the type of funds used to pay for them. Unrestricted funds can be used for any lawful purpose. Restricted funds, however, must be spent for specific purposes set out by legal requirements or the donor. Examples include funding for instructional materials, economic impact aid, and teacher and principal training funds. Adjacent to the figures for the district and state averages, we show the percentage by which the school�s spending varies from the district and state averages. For example, we calculate the school�s variance from the district average using this formula:
(SCHOOL AMOUNT � DISTRICT AVERAGE)
DISTRICT AVERAGE
TYPE OF FUNDS OUR
SCHOOL DISTRICT AVERAGE
SCHOOL VARIANCE
STATE AVERAGE
SCHOOL VARIANCE
Unrestricted funds ($/student) $4,212.00 $4,201.00 0% $5,300 -21%
Restricted funds ($/student) $310.00 $764.00 59% $2,817 -89%
Total ($/student) $4,522.00 $4,965.00 9% $8,117 -44%
Compensation per Teacher To make comparisons possible across schools and districts of varying sizes, we report our compensation per full-time equivalent (FTE) teacher. A teacher who works full-time counts as 1.0 FTE teachers. A teacher who works only half-time counts as 0.5 FTE. We had 38 FTE teachers working in our school.
CATEGORY OUR
SCHOOL DISTRICT AVERAGE
SCHOOL VARIANCE
STATE AVERAGE
SCHOOL VARIANCE
Salary $65,958.00 $64,195.00 0% $62,157 6%
Benefits $18,580.00 $19,258.00 4% $17,426 7%
Total $84,538.00 $83,453.00 1% $79,583 6%
Page 23


Mark Keppel Elementary School School Accountability Report Card for 2007–2008
»
Page 25
Data Almanac
This Data Almanac provides more-detailed information than the School Accountability Report Card or data that covers a period of more than one year. It presents the facts and statistics in tables without narrative text.
Glendale Unified School District

Mark Keppel Elementary School School Accountability Report Card for 2007–2008 Page 26
STUDENTS AND TEACHERS
Student Enrollment by Ethnicity and Other Characteristics
The ethnicity of our students, estimates of their family income and education level, their English fluency, and their learning-related disabilities.
Student Enrollment by Grade Level
Number of students enrolled in each grade level at our school.
GROUP ENROLLMENT
Number of students 909
African American 1%
American Indian or Alaska Native 0%
Asian 15%
Filipino 6%
Hispanic or Latino 12%
Pacific Islander 0%
White (not Hispanic) 63%
Multiple or no response 3%
Socioeconomically disadvantaged 40%
English Learners 31%
Students with disabilities 7%
SOURCE: All but the last three lines are from the annual census, CBEDS, October 2007. Data about students who are socioeconomically disadvantaged, English Learners, or learning disabled come from the School Accountability Report Card unit of the California Department of Education.
GRADE LEVEL STUDENTS
Kindergarten 134
Grade 1 114
Grade 2 135
Grade 3 135
Grade 4 122
Grade 5 151
Grade 6 118
Grade 7 0
Grade 8 0
Grade 9 0
Grade 10 0
Grade 11 0
Grade 12 0
SOURCE: CBEDS, October 2007.
Glendale Unified School District

Mark Keppel Elementary School School Accountability Report Card for 2007–2008 Page 27
Average Class Size by Grade Level
Average Class Size by Grade Level, DetailThe number of classrooms that fall into each range of class sizes.
GRADE LEVEL 2005–2006 2006–2007 2007–2008
Kindergarten 20 20 18
Grade 1 20 20 20
Grade 2 20 20 20
Grade 3 20 20 20
Grade 4 34 35 34
Grade 5 31 36 35
Grade 6 33 35 38
Grade 7 N/A N/A N/A
Grade 8 N/A N/A N/A
Combined K–3 20 20 20
Combined 3–4 N/A N/A N/A
Combined 4–8 N/A N/A 29
Other N/A N/A N/A
SOURCE: CBEDS, October 2007.
2005–2006 2006–2007 2007–2008
GRADE LEVEL 1–20 21–32 33+ 1–20 21–32 33+ 1–20 21–32 33+
Kindergarten 5 0 0 5 0 0 7 0 0
Grade 1 4 1 0 5 0 0 5 0 0
Grade 2 6 0 0 5 0 0 6 0 0
Grade 3 6 1 0 6 0 0 6 0 0
Grade 4 0 0 4 0 0 4 0 0 3
Grade 5 0 3 2 0 0 4 0 1 3
Grade 6 0 2 3 0 0 4 0 0 3
Combined K–3 1 0 0 2 0 0 2 0 0
Combined 3–4 0 0 0 0 0 0 0 0 0
Combined 4–8 0 0 0 0 0 0 0 1 0
Other 0 0 0 0 0 0 0 0 0
SOURCE: CBEDS, October 2007.
Glendale Unified School District

Mark Keppel Elementary School School Accountability Report Card for 2007–2008 Page 28
Teacher CredentialsThe number of teachers assigned to the school with a full credential and without a full credential,
for both our school and the district.
Physical FitnessStudents in grades five, seven, and nine take the California Fitness Test each year. This test measures students’ aerobic capacity, body composition, muscular strength, endurance, and flexibility using six different tests. The table below shows the percentage of students at our school who scored within the “healthy fitness zone” on all six tests. Our 2007–2008 results are compared to other students’ results in the county and state. More information about physical fitness testing and standards is available on the CDE Web site.
SCHOOL DISTRICT
TEACHERS 2005–2006 2006–2007 2007–2008 2007–2008
With Full Credential 44 40 40 1,215
Without Full Credential 0 0 1 29
SOURCE: CBEDS, October 2007, Professional Assignment Information Form (PAIF) section.
CATEGORYOUR
SCHOOLCOUNTYAVERAGE
STATEAVERAGE
Boys in Fitness Zone 47% 23% 26%
Girls in Fitness Zone 69% 30% 32%
Fifth graders in Fitness Zone
57% 26% 29%
Seventh graders in Fitness Zone
N/A 28% 30%
Ninth graders in Fitness Zone
N/A 36% 27%
All students in Fitness Zone
57% 27% 29%
SOURCE: Physical fitness test data is produced annually as schools test their students on the six Fitnessgram Standards. Data is reported by Educational Data Systems. County and state averages represent elementary schools only.
Glendale Unified School District

Mark Keppel Elementary School School Accountability Report Card for 2007–2008 Page 29
California Standards Tests (CST)The California Standards Tests (CST) show how well students are learning what the state content standards require. The CST include English/language arts and mathematics in grades two through five and science in grade five.
CST Results for All Students: Three-Year ComparisonThe percentage of students achieving at the Proficient or Advanced level
(meeting or exceeding the state standards) for the most current three-year period.
CST Results by Student Group: Most Recent YearThe percentage of students, by group, achieving at the Proficient or Advanced level
(meeting or exceeding the state standards) for the most recent testing period.
STUDENT PERFORMANCE
SCHOOLPERCENT PROFICIENT OR
ADVANCED
DISTRICTPERCENT PROFICIENT OR
ADVANCED
STATEPERCENT PROFICIENT OR
ADVANCED
SUBJECT 2006 2007 2008 2006 2007 2008 2006 2007 2008
English/language arts
56% 56% 57% 56% 58% 59% 42% 43% 46%
Mathematics 67% 63% 64% 57% 57% 58% 40% 40% 43%
Science 51% 42% 56% 50% 52% 62% 35% 38% 46%
SOURCE: California Standards Tests (CST) results, spring 2008 test cycle, as interpreted and published by the CDE unit responsible for School Accountability Report Cards.
PERCENTAGE OF STUDENTS SCORING PROFICIENT OR ADVANCED
STUDENT GROUP
ENGLISH/LANGUAGE
ARTS2007–2008
MATHEMATICS2007–2008
SCIENCE2007–2008
African American 57% 57% N/A
American Indian or Alaska Native N/A N/A N/A
Asian 75% 85% 59%
Filipino 72% 74% N/A
Hispanic or Latino 47% 48% 57%
Pacific Islander N/A N/A N/A
White (not Hispanic) 53% 62% 54%
Boys 49% 62% 51%
Girls 64% 66% 62%
Economically disadvantaged 42% 51% 42%
English Learners 28% 45% 9%
Students with disabilities 23% 33% N/A
Students receiving migrant education services
N/A N/A N/A
SOURCE: California Standards Tests (CST) results, spring 2008 test cycle, as interpreted and published by the CDE unit responsible for School Accountability Report Cards.
Glendale Unified School District

Mark Keppel Elementary School School Accountability Report Card for 2007–2008 Page 30
California Academic Performance Index (API)The Academic Performance Index (API) is an annual measure of the academic performance and progress of schools in California. API scores range from 200 to 1000, with a statewide target of 800. Detailed information about the API can be found on the CDE Web site at http://www.cde.ca.gov/ta/ac/ap/.
API Ranks: Three-Year ComparisonThe state assigns statewide and similar-schools API ranks for all schools. The API ranks range from 1 to 10. A statewide rank of 1 means that the school has an API in the lowest 10 percent of all elementary schools in the state, while a statewide rank of 10 means that the school has an API in the highest 10 percent of all elementary schools in the state. The similar-schools API rank reflects how a school compares to 100 statistically matched schools with similar teachers and students.
API Changes by Student Group: Three-Year ComparisonAPI changes for all students and student groups: the actual API changes in points added or lost for the past three years, and the most recent API. Note: “N/A” means that the student group is not numerically significant.
ACCOUNTABILITY
API RANK 2005–2006 2006–2007 2007–2008
Statewide rank 8 8 7
Similar-schools rank 7 8 6
SOURCE: The API Base Report from August 2008.
ACTUAL API CHANGE API SCORE
STUDENT GROUP 2005–2006 2006–2007 2007–2008 2007–2008
All students at the school +20 -13 +10 827
African American N/A N/A N/A N/A
American Indian or Alaska Native N/A N/A N/A N/A
Asian N/A N/A N/A N/A
Filipino N/A N/A N/A N/A
Hispanic or Latino +24 N/A N/A N/A
Pacific Islander N/A N/A N/A N/A
White (non Hispanic) +9 -17 +8 815
Economically disadvantaged +16 -7 -2 759
English Learners +8 -12 +9 802
Students with disabilities N/A N/A N/A N/A
SOURCE: The API Growth Report as released in the Accountability Progress Report in October 2008.
Glendale Unified School District

Mark Keppel Elementary School School Accountability Report Card for 2007–2008 Page 31
Federal Adequate Yearly Progress (AYP) and Intervention ProgramsThe federal law known as No Child Left Behind requires that all schools and districts meet all three of the following criteria in order to attain Adequate Yearly Progress (AYP): (a) a 95-percent participation rate on the state’s tests; (b) a CDE-mandated percentage of students scoring Proficient or higher on the state’s English/language arts and mathematics tests; and (c) an API of at least 590 or growth of at least one point.
AYP for the DistrictWhether the district met the federal requirement for AYP overall,
and whether the school and the district met each of the AYP criteria.
Intervention Program: District Program Improvement (PI)Districts receiving federal Title I funding enter Program Improvement (PI) if they do not
make AYP for two consecutive years in the same content area (English/language arts or mathematics) and for each grade span or on the same indicator (API or graduation rate). After entering PI,
districts advance to the next level of intervention with each additional year that they do not make AYP.
AYP CRITERIA DISTRICT
Overall No
Graduation rate Yes
Participation rate in English/language arts Yes
Participation rate in mathematics Yes
Percent Proficient in English/language arts No
Percent Proficient in mathematics No
Met Academic Performance Index (API) Yes
SOURCE: The AYP Report as released in the Accountability Progress Report in November 2008.
INDICATOR DISTRICT
PI stage Not in PI
The year the district entered PI N/A
Number of schools currently in PI 0
Percentage of schools currently in PI 0%
SOURCE: The Program Improvement Report as released in the Accountability Progress Report in October 2008.
Glendale Unified School District
Mark Keppel Elementary School School Accountability Report Card for 2007–2008 Page 32
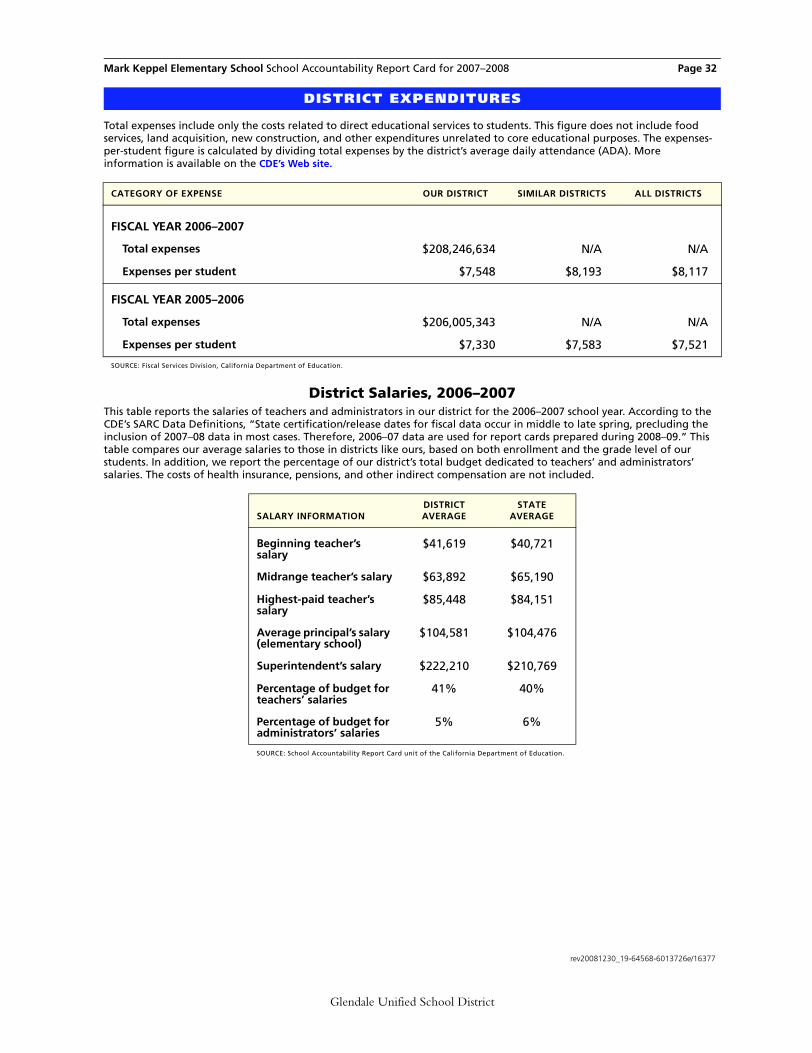
Total expenses include only the costs related to direct educational services to students. This figure does not include food services, land acquisition, new construction, and other expenditures unrelated to core educational purposes. The expenses-per-student figure is calculated by dividing total expenses by the district’s average daily attendance (ADA). More information is available on the CDE’s Web site.
District Salaries, 2006–2007This table reports the salaries of teachers and administrators in our district for the 2006–2007 school year. According to the CDE’s SARC Data Definitions, “State certification/release dates for fiscal data occur in middle to late spring, precluding the inclusion of 2007–08 data in most cases. Therefore, 2006–07 data are used for report cards prepared during 2008–09.” This table compares our average salaries to those in districts like ours, based on both enrollment and the grade level of our students. In addition, we report the percentage of our district’s total budget dedicated to teachers’ and administrators’ salaries. The costs of health insurance, pensions, and other indirect compensation are not included.
DISTRICT EXPENDITURES
CATEGORY OF EXPENSE OUR DISTRICT SIMILAR DISTRICTS ALL DISTRICTS
FISCAL YEAR 2006–2007
Total expenses $208,246,634 N/A N/A
Expenses per student $7,548 $8,193 $8,117
FISCAL YEAR 2005–2006
Total expenses $206,005,343 N/A N/A
Expenses per student $7,330 $7,583 $7,521
SOURCE: Fiscal Services Division, California Department of Education.
SALARY INFORMATIONDISTRICTAVERAGE
STATEAVERAGE
Beginning teacher’s salary
$41,619 $40,721
Midrange teacher’s salary $63,892 $65,190
Highest-paid teacher’s salary
$85,448 $84,151
Average principal’s salary (elementary school)
$104,581 $104,476
Superintendent’s salary $222,210 $210,769
Percentage of budget for teachers’ salaries
41% 40%
Percentage of budget for administrators’ salaries
5% 6%
SOURCE: School Accountability Report Card unit of the California Department of Education.
rev20081230_19-64568-6013726e/16377
Glendale Unified School District