Embed Size (px)
Citation preview

MARITIME INCIDENT ANALYSIS USING GIS
Abstract: In an archipelagic country like the Philippines, the importance of maritime transportation cannot be overemphasized. As a major infrastructure, our maritime transportation is faced with many problems but the most visible and solvable one is safety of life at sea. To obtain information on the state of safety of our Philippine waters, a ten-year record of maritime incidents was analyzed through construction of a database and development of a Geographic Information System (GIS). The source database contains information on the dates, name of vessel, shipping company, place of incident, number of casualties, missing, and rescued, among others. The 10-year record of maritime incidents show that capsizing is the most common occurrence followed by sinking and grounding. Other notable incidents include fire and engine trouble which can be attributed mainly due to crew error. In terms of types of incidents per vessel class, the motorized bancas mostly capsized while fishing vessels sunk and passenger or cargo vessels ran aground. Records show that most capsizing incidents happened during typhoon occurrences. Some of the conditions that contribute to the risk at sea include inadequate safety support systems including lighthouses and rescue boats, lack of proper training of crew, old ships with inadequate navigation and survival equipment. Also, the passage of frequent typhoons and the prevailing southwest and northwest monsoons result in large waves that cause some of the accidents. Some routes are inadequately served resulting in overloading. Most ferries are also second hand and are mostly old. Key Words: marine transportation, maritime incidents, GIS
1. INTRODUCTION
1.1 Geographic Information Systems and their Applications A GIS is a special-purpose digital database in which a common spatial coordinate system is the primary means of reference ( Foote and Lynch, 1995). A comprehensive GIS requires a means of:
1. Data input, from maps, aerial photos, satellites, surveys, and other sources
2. Data storage, retrieval, and query
3. Data transformation, analysis, and modeling, including spatial statistics
4. Data reporting, such as maps, reports, and plans GIS are now used extensively in government, business, and research for a wide range of applications including environmental resource analysis, landuse planning, locational analysis, tax appraisal, utility and infrastructure planning, real estate analysis, marketing and demographic analysis, habitat studies, and archaeological analysis. GIS have served an important role as an integrating technology. Rather than being completely new, GIS have evolved by linking a number of discrete technologies into a whole that is greater than the sum of its parts. GIS have emerged as very powerful technologies because
Ricardo G. SIGUA Associate Professor College of Engineering University of the Philippines-Diliman Quezon City, MetroManila, Philippines Fax: +63 2 928 8305 E-mail: [email protected]
Glenn D. AGUILAR Associate Professor College of Fisheries and Ocean Sciences University of the Philippines-Visayas Miagao, Iloilo, Visayas Fax: +63 33 3158137 E-mail: [email protected]
Journal of the Eastern Asia Society for Transportation Studies, Vol.5, October, 2003

they allow analysts to integrate their data and methods in ways that support traditional forms of geographical analysis, such as map overlay analysis as well as new types of analysis and modeling that are beyond the capability of manual methods. With GIS it is possible to map, model, query, and analyze large quantities of data all held together within a single database. The importance of GIS as an integrating technology is also evident in its pedigree. The development of GIS has relied on innovations made in many different disciplines: Geography, Cartography, Photogrammetry, Remote Sensing, Surveying, Geodesy, Civil Engineering, Statistics, Computer Science, Operations Research, Artificial Intelligence, Demography, and many other branches of the social sciences, natural sciences, and engineering have all contributed. Based on the experience of the authors in developing the GIS for maritime incidents, some criteria that have to be considered to assess the effectiveness of any GIS applications are the following:
• Ease of usage - setting up databases quickly, yet cost-effectively;
• Ease of maintaining the system (even when analyst in charge leaves);
• Ability to produce immediate results - ensuring that the system selected has the right functions to get the desired results;
• Addressing users need of efficient problem solving techniques; and
• Bullet-proof (bug-free) operations.
1.2 Significance of the Study
Except for periods of war, the world record for the number of casualties due to accidents at sea was recorded in the Philippines in 1987 with the Dona Paz incident. This incident officially reported 1840 casualties although independent reports stated the casualty to be as high as 4,300. (Table 1)
Table 1. Shipwrecks with the world’s highest casualties (Lloyd's, 1986; World Book, 1993; MARINA, 1996).
Year Ship Dead Disaster 1865 Sultana 1653 Exploded on Mississippi River 1912 Titanic 1500 Struck Iceberg in N. Atlantic 1917 Mont Blanc 1635 Exploded in Halifax Harbor, Nova Scotia 1987 Dona Paz 1840 Collided with oil tanker in Mindoro Strait,
Philippines Since 1988, several other ferry disasters have occurred in the Philippines as shown in Table 2.
Table 2. Recent Ferry Disasters Date Incident
24 October 1988 The MV Doña Marilyn, a sister ship of the Doña Paz, sinks off Leyte, leaving 254 dead
02 December 1994
The MV Cebu City collides with Singaporean-registered freighter Kota Suria on the mouth of Manila Bay. Authorities said 73 people died and 41 others were never found
Journal of the Eastern Asia Society for Transportation Studies, Vol.5, October, 2003

13 December 1995 Fire sweeps through the ferry Kimelody Cristy south of Manila, leaving 16 dead and 16 missing
18 February 1996 Overloaded ferry Gretchen 1 sinks in the Central Philippines, killing more than 50 people aboard.
20 September 1998 Princess of the Orient sinks off the mouth of Manila Bay. Some 100 people died or missing
01 August 1999 Rosario 2 catches fire in the Central Philippines, killing 51 people 23 December 1999 Asia-South Korea sinks off southern Cebu, killing 44 Christmas
holiday-makers 25 February 2000
.Our Lady of Mediatrix catches fire off the port of Ozamis City from bombs rigged to three buses on board. Forty-five people are killed in the blast blamed on Moro separatist guerrillas
12 April 2000
Overloaded ferry Anahada with up to 200 people on board sinks in Sulu waters, leaving at least 56 people dead and more than 100 missing
11 April 2002 MV Maria Carmela Catches fire off Lucena resulting in 23 deaths The safety condition of Philippine marine transport is of great concern to the country. Some of the conditions that contribute to the risk at sea include inadequate safety support systems including lighthouses and rescue boats, lack of proper training of crew, old ships with inadequate navigation and survival equipment. Also, the passage of frequent typhoons and the prevailing southwest and northwest monsoons result in large waves that cause some of the accidents. Some routes are inadequately served resulting in overloading. Most ferries are also second hand and are mostly old. This paper is a part of a larger study which was conceived to meet the following objectives: 1) acquire data, information and knowledge on Philippine marine transportation systems; 2) describe, assess and analyze the components of Philippine marine transportation systems; 3) develop methods and systems for deriving useful information for planning, decision making, simulation, prediction and analysis; and 4) start the construction of a database of marine accidents. This is a step in trying to rationalize and develop a comprehensive description of Philippine marine transportation systems for purposes of strategic planning, investment prioritization, management considerations and operational guidelines. It may also contribute to formulation of policies, rules and regulations for marine transportation that will make it a significant contributor to national development. Standard method for systems development is used. First, collecting secondary data from a variety of sources was conducted and then a modeling approach for determining system components was employed. Systems are implemented in the form of databases, GIS and web pages. Sources of data were the different government agencies involved in marine transportation including the Maritime Industry Authority (MARINA), Philippine Coast Guard (PCG), Philippine Ports Authority (PPA) and other sources. The modeling system used was based on the standard UML (Universal Modeling Language) using ‘Objecteering’ software for describing the different components of the system. 2. MODELING OF PHILIPPINE MARINE TRANSPORTATION 2.1 Components of Marine Transportation System Models describe the components of the system and their interaction with the users, data sources as well as interfaces which define how the system looks like. The model is a representation of a system best used for visualization, analysis and development of solutions to pressing problems.
Journal of the Eastern Asia Society for Transportation Studies, Vol.5, October, 2003

The top-level model that shows the overall picture is shown in Figure 1. The rectangles represent the different components, lines connecting them show their relationships and the circles represent interfaces or how the components can be presented. The interfaces include geographic information systems (GIS), web pages and databases. Two major components of the GIS were developed, one on shipping, ports and trade flow and another on maritime incidents. Samples of the different views for the first component are shown in the appendix.
A model describing the Philippine Marine Transportation System; for the purpose ofanalyzing the different components and relationships between components; guidein the development of information systems or databases useful to problem solving,decision making, planning and sustainable development.
Shipping Safety
Manning Environment
Shipbuilding and Repair Information Systems
Ports Fishing Vessels
GIS
webpage
databases
ResearchDevelopment GovernmentAgency EconomicImportance
(A nalysis) - S tatic v iew of MarTrans1
Objecteering/UML Modeler: B ase “MarineTransportation”- P roject “MarTrans1” -(Class diagram - P ACK AGE (Analys is) - S tatic view
File Tools ? V iew Edit Graph Windows
Brow ses the model
Browses the m odel starting from the current project’s root package
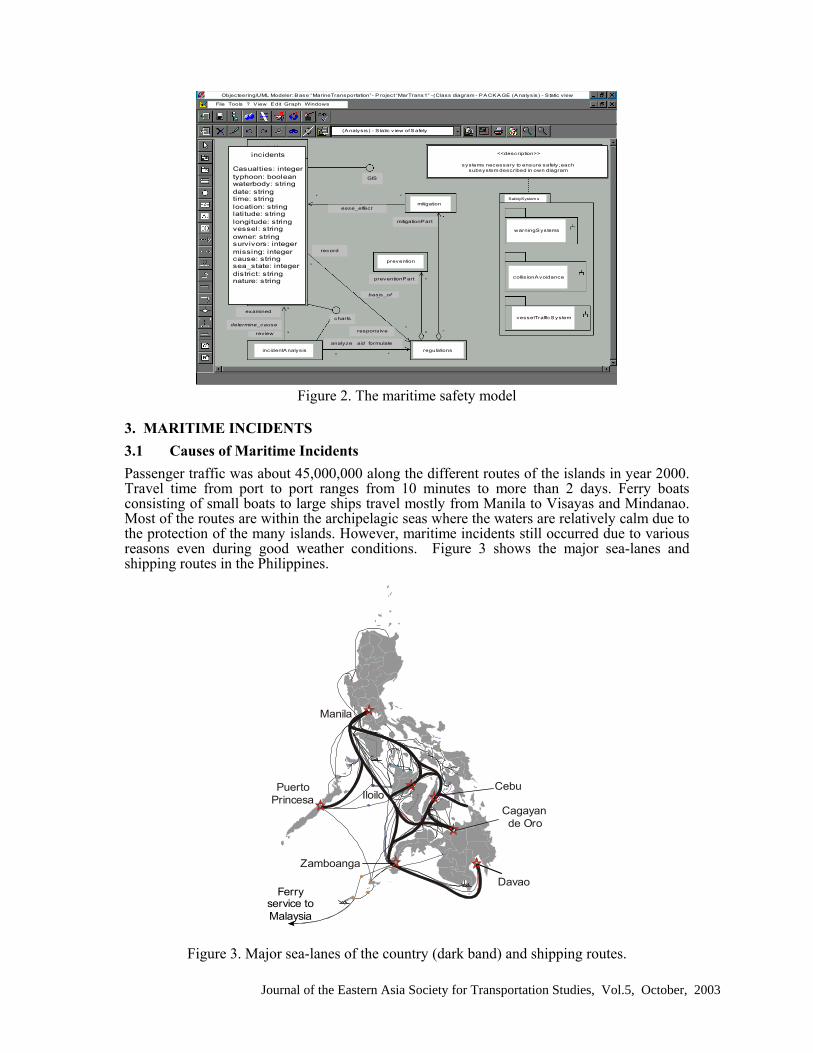
Figure 1. Model of the top-level elements of Philippine Marine Transportation Aside from design and implementation of programs, databases or information systems, the models produced serve as guide for the analysis of functions, structures for strategic planning, decision making and management imperatives towards more efficient operations and better, relevant services from and between the different components of Philippine marine transportation. 2.2 Maritime Safety Model A model describing the maritime safety conditions of the Philippines is shown in Figure 16. One major object described in the model is incidents which describes maritime incidents as reported officially and unofficially. This incident record has a GIS interface and interacts with the objects incident_analysis and mitigation. In the implementation of this component of the research, focus was on developing a GIS for the presentation of the incidents data. Other necessary objects is the safety_systems including warningSystem, collisionAvoidance and vesselTrafficSystem. These are not yet implemented but are required for safety analysis and monitoring. (Figure 2)
Journal of the Eastern Asia Society for Transportation Studies, Vol.5, October, 2003
Casualties: integertyphoon: booleanwaterbody: stringdate: stringtime: stringlocation: stringlatitude: stringlongitude: stringvessel: stringowner: stringsurvivors: integermissing: integercause: stringsea_state: integerdistrict: stringnature: string
incidents <<description>>
systems necessary to ensure safety; eachsubsystem described in own diagram
SafetySystem s
warningSystems
collisionAvoidance
vesselTrafficSystem
regulationsincidentAnalysis
prevention
mitigation
record
ease_effect
basis_of
GIS
mitigationPart
preventionPart
responsive
analyze aid formulate
examined
determine_cause
review
charts
(Analysis) - S tatic v iew of Safety
File Tools ? V iew Edit Graph Windows
Objecteering/UML Modeler: Base “MarineTransportation”- P roject “MarTrans1” -(Class diagram - PACKAGE (A nalysis) - S tatic v iew
Figure 2. The maritime safety model
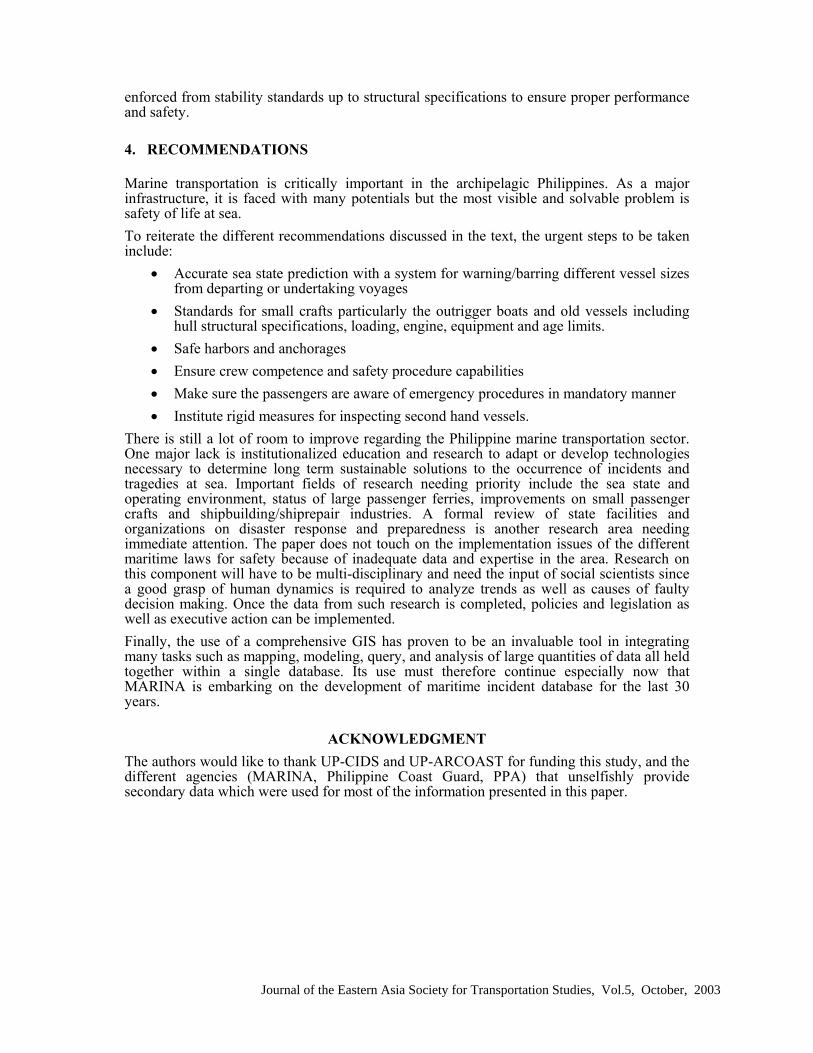
3. MARITIME INCIDENTS 3.1 Causes of Maritime Incidents Passenger traffic was about 45,000,000 along the different routes of the islands in year 2000. Travel time from port to port ranges from 10 minutes to more than 2 days. Ferry boats consisting of small boats to large ships travel mostly from Manila to Visayas and Mindanao. Most of the routes are within the archipelagic seas where the waters are relatively calm due to the protection of the many islands. However, maritime incidents still occurred due to various reasons even during good weather conditions. Figure 3 shows the major sea-lanes and shipping routes in the Philippines.
NCR
Sual
San Fernando
Coron
Manila
IloiloCebu
Cagayande Oro
Zamboanga
Davao
PuertoPrincesa
Ferryservice toMalaysia
Figure 3. Major sea-lanes of the country (dark band) and shipping routes.
Journal of the Eastern Asia Society for Transportation Studies, Vol.5, October, 2003

A 10 year record of maritime incidents shows that capsizing (521 incidents) is the most common occurrence followed by sinking and grounding. Other notable causes are fire and engine trouble which can be attributed mainly due to crew error. (Figure 4)
Figure 4. Incident types occurring for a 10 year period (1991-2000)
In terms of types of incidents per vessel class, the motorized bancas mostly capsize while fishing vessels sink and passenger or cargo vessels ran aground. (Figure 5)
Figure 5. Incidents per vessel type Records from 1991 to 2000 show that most capsizing incidents happened during typhoon occurrences. (Figure 6) Particularly destructive was typhoon Norming in September of 1998 when 82 crafts capsized in the areas of Western Visayas. This is indicative of the nature of bancas to capsize when the outriggers fail and the stability of the boat is compromised. Also,
Tota l
0
100
200
300
400
500
600
Nature o f Incident
Num
ber
Tota l 521 438 374 210 122 119 108 59 18 3
C apsized S inking A groundE ngine Troub le
C aught F ire
M issing C ollision Others** Rammed F lood ing
0
50
100
150
200
250
300
350
400
450
500
Nature of Incident
Num
ber
M Vessels 181 82 69 47 41 18 9 4 4 21
F Vessels 55 125 11 36 12 84 4 26 0 3
M Bancas/Others 143 240 45 131 58 435 5 89 1 39
Aground SankCaught
Fire
Drifted/Engine
TroubleCollision Capsized Rammed Missing Flooding Others
Journal of the Eastern Asia Society for Transportation Studies, Vol.5, October, 2003

because of the construction of the boat where the hull bottom is constructed from a log, the hull is highly buoyant and does not sink even after capsizing and this may be one of the reasons why the statistics is skewed towards capsizing. This also indicates that the motorized banca does not have adequate facilities for shelter or protection during strong typhoons. While the size of most crafts allow beaching during typhoons, for those of sizes that cannot be manhandled, a safe harbor or protected anchorage is a necessity. These small crafts are quite numerous with around 465,000 counted during the last census in 1985(BAS, 1986). During fishing seasons, it is normal to see beaches full of outrigger boats in most coastal communities. Larger boats typically stay at anchorages near fishing grounds for the duration of the season. For fishing operations, the absence of such protection results in the transfer of fishing activities to the leeward side or protected side of any island where they operated. For example, ring netters and purse seiners operate in the northern part of islands when the southwest monsoon occurs and operate in the southern parts when the northwest monsoon blows. From the viewpoint of fisheries management, this may be advantageous as it allows some replenishment of stocks to occur. However, during typhoons, safe harbors with adequate sea wall protection, berths or protected anchorages can prevent damages such as that in 1998 when 82 crafts capsized in Panay Island including Caticlan (near Boracay) when the very strong typhoon Norming lashed the islands. Natural safe harbors exist and are in fact used by the crafts during typhoons but these are mainly undeveloped without any infrastructure or port facilities. Ideally, fishing communities with a significant fishing fleet should have one safe and well protected harbor. Protective structures include a sea wall capable of keeping out destructive waves and strong winds, anchorage of sufficient depth, berths for tying boats to and slipways for hauling or launching boats. Currently, such facilities are present only in river mouths or enclosed bays or developed and well established ports. In other areas, boats basically have to fend for their own and seek protection wherever possible. While several attempts have been started to establish municipal ports, the results are wholly inadequate with most efforts content with a single jetty or pier mainly for the purpose of landing caught fish. Most fishing grounds are near the coast but an increasing population and finite resources has resulted in overexploitation and depletion of traditional fishing area. This has resulted in fishing further from shore requiring bigger and more capable boats to meet the demand for fish. It is therefore necessary to plan ahead and determine the necessity of fully protected harbors for fishing fleets at selected fishing areas.
Figure 6. Typhoon record and number of boats capsizing.
0
10
20
30
40
50
60
70
80
90
Jan-951995
May-95 Sep-95 Jan-961996
May-96 Sep-96 Jan-971997
M ay-97 Sep-97 Jan-981998
May-98 Sep-98 Jan-991999
M ay-99 Sep-99
Num
ber o
f Mot
oriz
ed B
anca
s Sun
k or
Cap
size
d
Typhoon Pepang Typhoon Rosing Typhoon Gading Typhoon Loleng
Typhoon Norming
Typhoon Etang and Gening
Typhoon Helming
Typhoon Sendang
Journal of the Eastern Asia Society for Transportation Studies, Vol.5, October, 2003

The distribution of incidents as well as the casualties for the year can also be viewed using the GIS. (Figure 7)
IncidentsAgroundCapsizedCapsized & S unkCaught FireCollis ionDriftedEngine TroubleFlooding AgroundUsing 21 degMissingP iracyRammedSteering CasualtySubmergedSunk
01234611202270
Casualties
Figure 7. Incident distribution and casualties
For the 10 year period, an average of 197 incidents per year occurred with averages of 118 casualties and 152 persons missing. (Figure 8). The statistics on missing persons remain on the list as long as the body or death is not confirmed. Aside from this official casualty record, there are some instances when undocumented passengers or crew are not included as they are not listed in the passenger’s manifest.
Figure 8. Ten-year casualty record
3.2 Banca safety The double outrigger nature of the Philippine small crafts makes vessel seaworthiness dependent on the strength of outrigger beams. This is mainly due to the absence of standards for construction and the strict enforcement of construction rules. While a majority of crafts have more than adequate strength in the beams, for crafts bigger than 10 meters, the large
0
50
100
150
200
250
300
350
400
Ye ar
No. M
issi
ng/C
asua
lties
0
50
100
150
200
250
300
350
400
450
500N
o. o
f Inc
iden
ts
Cas ualties 49 33 37 3 13 106 1 21 82 5 0 158 23 3 16 5Mis sing 37 1 371 114 1 17 147 97 38 2 0 173 6 9 4 4Inc id ents 45 6 155 196 1 73 163 1 81 1 19 5 8 208 26 3 5 1
1 990 199 1 199 2 1 993 199 4 1995 1 996 19 97 1998 19 99 20 00
Journal of the Eastern Asia Society for Transportation Studies, Vol.5, October, 2003

bending moment introduced by high waves expose the wooden or bamboo beams to very high stresses. These stresses weaken the material and present the danger of capsizing when the structures fail because outrigger craft stability is highly dependent on the outriggers. It is normal for boat builders to scale up their designs to accommodate larger fishing gears and bigger engines using the same design as smaller ones. However, such scaling up results in larger forces. It is therefore necessary to institute standards that define material type, strength characteristics and minimum dimensions. For small crafts, bamboo have sufficient strength particularly if doubled or reinforced with wooden beams. However, for larger boats where the beams are made of wood, the structure must be of sufficiently high quality, durability and dimensions. This must be specified in an administrative issuance for strict compliance. Additional reinforcements such as stainless rods or altogether replacing the booms with steel may be justifiable. In terms of the main hull, construction is usually of a semi-dugout nature where the bottom component is a carved log upon which side frames are attached and plywood nailed to the frames to form the sides. Standards for frame size, plywood thickness as well as material quality have to be determined and enforced to ensure reliable operation at varying sea conditions. Such standards must also be based on experiments such as those reported in (Aguilar 1987, Aguilar and Shigehiro 2001, Shigehiro and Aguilar, 2001). Power must also be sufficient for the small craft to reach safety in case of large waves. While most engines have more than sufficient power for the craft, a majority are second hand truck diesel engines converted for use in the marine environment. During calm seas and safe conditions, the profit gained in using second hand engines cannot be disputed but reliability and performance in larger waves makes imperative some sort of standard in terms of engine make, service age, maintenance record and minimum horsepower. It may also be necessary to implement engine reliability inspections focusing on the maintenance record because the absence of such leaves the safety of the passenger to the shipowner’s discretion or crew competence. Life saving paraphernalia for larger vessels are standard but for smaller craft the presence of such are not strictly followed. Most small craft remain afloat even when capsized due to the highly buoyant nature of the semi-dugout bancas. The real danger lies in the overloaded or weighted down small to medium crafts where the dugout component of the hull cannot provide sufficient buoyancy and sinks when water enters the interior.
3.3 Navigational hazards One major characteristic of Philippine seas is the presence of payaos or anchored rafts serving as platforms for fish aggregating devices. These are found all over the archipelago and is employed by the fishing industry to ensure good catch. It is very popular and has even been adopted by other countries all over the world. It is usually anchored at depths from 200 m to as deep as 3500 m and sometimes straddling the sea lanes. There is currently no policy on the deployment of payaos and incidents have been reported of propellers getting snagged in the ropes and aggregating devices attached to the rafts. As such, it is a navigational hazard particularly for smaller sized vessels traveling at night and without radar. Some rafts are made of steel with cables forming the upper part of the mooring system, a construction quite sturdy and of potential danger in terms of collision and damage to vessels en route. Lighthouses are crucial to navigation particularly at night. This is recognized with several projects implementing the upgrading and installation of lighthouses all over the country. This component has been adequately addressed as it is the most obvious requirement for safety at sea. Several foreign funded projects have resulted in the rehabilitation of old lighthouses and the installation of new ones. Particular attention has given to the more traveled routes such as the Manila to Cebu route where most of the waypoints and critical landmarks have lighthouses installed.
Journal of the Eastern Asia Society for Transportation Studies, Vol.5, October, 2003

3.4 Crew, vessel conditions and safety on board The Philippines is the largest contributor to the crew of the world’s merchant fleet. The facility to communicate in English, good training and aptitude on board are cited as some of the major factors in favoring Filipino sailors. This premium or preference for Filipino crew has also affected the domestic shipping industry where the wages are considerable lower than the international rates. The brightest and best products of Philippine maritime schools readily find work abroad, leaving the domestic fleet with relatively less choices in hiring the better quality graduates. While the licensing requirements of MARINA are well established, the discrepancy in wages can only contribute to less capable manning resources for the domestic fleet. This can only be remedied if local shipping offer rates competitive to foreign fleets, a concept that may not really be practical given current economic conditions. One way to mitigate this condition is constant training requirements and strict implementation of STCW 95 (Standards for Training Certification and Watchkeeping) now required by the International Maritime Organization (IMO) requirements for the world’s fleets. This would ensure proper training for all crew whether domestic or foreign. The Philippine Merchant Marine Rules and Regulations (PMMRR) of 1997 adequately cover the requirements for ship safety and is quite complete in the manning regulations. However, the fact that some crew-related incidents still occur draws attention to some of the finer points of implementation. One item however, that has not changed remarkably, is safety preparedness of passengers on board. While it is mandatory for airplane passengers to listen to safety precautions including the donning of life vests and exits, such briefings are not regularly done on board passenger ships. While the crew may be trained for accidents at sea, well briefed passengers can only facilitate and increase overall preparedness for any incident that may occur. Fire is especially hazardous in larger passenger ships and exit location briefings, life vest donning procedures and lifeboat assignment briefings as well as fire drills should be regularly conducted to ensure appropriate passenger and crew response. Smaller operations however, including shorter routes between non-major ports are serviced by older ships including wooden and the larger motorized outrigger boats (57% of merchant ships are wooden (Marina, 1999)). Several incidents and disasters including the major capsizing incidents involved crafts of this category. During the last 5 years remarkable growth was seen in the routes serviced by fast ferry craft particularly in the Visayas. These fast ferries have cut travel time by almost half in most of the routes, presenting quite an impressive improvement in passenger movement between the shorter passenger routes. However, the potential for disaster of fast craft is quite obvious with the shorter response time in cases of collision. For fast craft operations, navigation hazards along the routes must be well documented. The crew must exercise extra care during the course of the voyage at all times. Safety is affected in terms of the availability of naval architects who can do the needed calculations for stability. Without a significant shipbuilding industry, naval architecture as a field of study has very few graduates per year (an average of 12 to 15 for the past 10 years from NAMEI). This has implications in the available technical expertise needed to do the proper calculations for craft stability and safety. Also, for smaller craft, the absence of any implementation of classification society rules and regulations has an impact on the final design which are left mainly to the boatbuilder. Particularly for small to medium passenger and cargo craft as well as fishing boats from the medium to small categories (150 to 20.1 and 20 to 3 gross tons), construction usually comes first before the lines drawing hence the hydrostatic calculations which are needed for stability calculations are done after the fact. Most construction of these types is done by boatbuilders whose skill is based on experience which are handed down through generations. The more crucial crafts are those that are second hand and modified for another purpose and those that are newly built from a copied design. This is where design experience is absent on the side of the boatbuilder and accurate calculations are needed to ensure stable and safe platforms. Of particular importance are the larger type crafts with substantial modifications such as converting a former fishing boat to a passenger vessel. Strict standards must be
Journal of the Eastern Asia Society for Transportation Studies, Vol.5, October, 2003
enforced from stability standards up to structural specifications to ensure proper performance and safety.
4. RECOMMENDATIONS Marine transportation is critically important in the archipelagic Philippines. As a major infrastructure, it is faced with many potentials but the most visible and solvable problem is safety of life at sea. To reiterate the different recommendations discussed in the text, the urgent steps to be taken include:
• Accurate sea state prediction with a system for warning/barring different vessel sizes from departing or undertaking voyages
• Standards for small crafts particularly the outrigger boats and old vessels including hull structural specifications, loading, engine, equipment and age limits.
• Safe harbors and anchorages • Ensure crew competence and safety procedure capabilities • Make sure the passengers are aware of emergency procedures in mandatory manner • Institute rigid measures for inspecting second hand vessels.
There is still a lot of room to improve regarding the Philippine marine transportation sector. One major lack is institutionalized education and research to adapt or develop technologies necessary to determine long term sustainable solutions to the occurrence of incidents and tragedies at sea. Important fields of research needing priority include the sea state and operating environment, status of large passenger ferries, improvements on small passenger crafts and shipbuilding/shiprepair industries. A formal review of state facilities and organizations on disaster response and preparedness is another research area needing immediate attention. The paper does not touch on the implementation issues of the different maritime laws for safety because of inadequate data and expertise in the area. Research on this component will have to be multi-disciplinary and need the input of social scientists since a good grasp of human dynamics is required to analyze trends as well as causes of faulty decision making. Once the data from such research is completed, policies and legislation as well as executive action can be implemented. Finally, the use of a comprehensive GIS has proven to be an invaluable tool in integrating many tasks such as mapping, modeling, query, and analysis of large quantities of data all held together within a single database. Its use must therefore continue especially now that MARINA is embarking on the development of maritime incident database for the last 30 years.
ACKNOWLEDGMENT The authors would like to thank UP-CIDS and UP-ARCOAST for funding this study, and the different agencies (MARINA, Philippine Coast Guard, PPA) that unselfishly provide secondary data which were used for most of the information presented in this paper.
Journal of the Eastern Asia Society for Transportation Studies, Vol.5, October, 2003

REFERENCES
a) Books The World Book Encyclopedia, Vol. 17, World Book, Inc., 1993 Sigua, R. and Aguilar, G.D. 1999. Marine Transportation and Safety. Archipelagic Studies:
Charting New Waters: pp. 71-86. Quezon City: University of the Philippines Press. b) Journal Papers Aguilar, GD. 1997. Comparative survey of hull forms of indigenous fishing crafts. UPV
Journal of Natural Science. Vol. 2 No 1:20-58. Aguilar, GD. 2000. Some marine transport concerns. Public Policy Journal. 4:1, pp. 93-119.
Diliman: UP-CIDS. c) Papers presented to conferences Aguilar, GD. 1999. Current Status of Research and Education and their Technological
Components of the Philippine Marine Industries. Proceedings of the Roundtable on Marine Transportation, CIDS, UP Diliman.
Aguilar, GD R. Shigehiro, Y. Yamakoshi and K. Kuruda. 2001. Safety related characteristics of Philippine indigenous outrigger crafts. 70th Anniversary Symposium of the Japan Society for Fisheries Science. Oct 1-5, Yokohama, Japan
Shigehiro, R. GD. Aguilar and T Kuroda. 2001. Evaluation method of seakeeping performance for training ships from the viewpoint of passenger comfort. 70th Anniversary Symposium of the Japan Society for Fisheries Science. Oct 1-5, Yokohama, Japan.
d) Other documents BAS. 1986. Fisheries Statistics of the Philippines. Department of Agriculture, Quezon City. Foote, KE and Lynch, M., 1995. Geographic Information Systems as an Integrating Technology: Context, Concepts, and Definitions. Department of Geography, University of Texas at Austin. MARINA (Maritime Industry Authority), 1998. Accomplishment Report 1998. MARINA, 1999. The domestic shipping industry of the Philippines: A situation report.
Domestic Shipping Office, Manila: Maritime Industry Authority. MARINA, 1998. The maritime manpower industry in the Philippines: A situation report.
Manila: Maritime Industry Authority. MARINA, 1999. The maritime manpower industry in the Philippines: A situation report.
Manila: Maritime Industry Authority. MARINA, 1999. The foreign shipping industry of the Philippines: A situation report. Manila:
Maritime Industry Authority. Objecteering/UML Software User’s Guide PCG (Philippine Coast Guard), 1990-2000. Detailed Maritime Incident Reports. PPA (Philippine Ports Authority), 1999. Ports Statistics of the Philippines. Manila: Philippine
Ports Authority.
Journal of the Eastern Asia Society for Transportation Studies, Vol.5, October, 2003

APPENDIX: First Component of the Philippine Marine Transportation GIS The following can be viewed: Shipping:
1. Cargo and container traffic 1996-2000 2. Passenger traffic 1996-2000 3. Port System 4. Ship Calls and Tonnage Trends 1996-2000 5. Ship Waiting and Service Times 1996-2000 6. Trade Flow Between Regions 1996-2000 The major screen and a layer showing the base ports as well as data on the ports (lower
left) is shown in Figure A.1.
Cargo and Container Traffic 1996-2000No. of Ships and Tonnage 1998Passenger Traffic 1996-2000Port SystemShip Calls and Tonnage Trends 1996-2000Ship Waiting and Service Times 1996-2000Trade Flow Between Regions 1996-2000
Point 0 San FernandoPoint 0 North HarborPoint 0 BatangasPoint 0 LegazpiPoint 0 Puerto P rincesaPoint 0 IloiloPoint 0 PulupandanPoint 0 CebuPoint 0 Dumaguete
Port System
ArcV iew GIS
Figure A.1. Summary of views (upper left), base ports (right), table for base ports (lower left)
For Cargo and container traffic 1996-2000, the following views are available: 1. Foreign cargo throughput 2. Domestic cargo throughput 3. Total foreign and domestic throughput 4. Foreign container traffic 5. Domestic container traffic 6. Total container traffic
Journal of the Eastern Asia Society for Transportation Studies, Vol.5, October, 2003

ArcView GIS 3.2a
Cargo and Container Traffic 1996-2000
Foreign Cargo
Domestic Cargo
Total
Foreign Container
Domestic Container
Total Container
1996
1997
1998
1999
2000
1996
1997
1998
1999
2000
1996
1997
1998
1999
2000
1996
1997
1999
1998
2000
DomTotalFor Total
File Edit View Theme Graphics Window Help
DomTEU
ForTEU
Figure A.2. Cargo and container traffic view with the domestic cargo throughput layer shown
Passenger Traffic: 1. Total disembarked and embarked passengers 2. Total disembarked passengers 3. Total embarked passengers. Ship calls and tonnage: 1. Average foreign GRT 2. Average domestic GRT 3. 5 year mean of domestic and foreign GRT (pie chart comparing the two) 4. Number of foreign ship calls 5. Number of domestic ship calls 6. Total domestic and foreign ship calls
Journal of the Eastern Asia Society for Transportation Studies, Vol.5, October, 2003

ArcView GIS 3.2aFile Edit View Theme Graphics Window Help
Passenger Traffic 1996-2000 Ship Call and Tonnage Trends 1996-2000
1996199719981999
2000
1996199719981999
2000
Em barked
Baseports
Disem bark
Total
aws adm in
199619971998
1999
2000
1996199719981999
2000
1996199719981999
2000
Ave. For
Ave. Dom
5-Yr. Mean
Foreign
Domestic1996199719981999
2000
Total Dom
Em bDis
Figure A.3 Views showing the passenger traffic and ship calls and tonnage for 1996-2000.
For extra information, the service and ship waiting time averages for the different ports
are shown. This is to give an idea of how much improvement is needed to make service faster at each of the ports.
ArcView GIS 3.2a
File Edit View Theme Graphics Window Help
Ship Waiting and Service Times 1996-2000
Ave. For Ship Serv ice time
Ave. Dom Ship Serv ice time
Ave. For. Ship Waiting Time
Ave. Dom Ship Waiting Time
Aws admin.shp
Figure A.4. Foreign ship waiting time at the different ports.
Journal of the Eastern Asia Society for Transportation Studies, Vol.5, October, 2003

The layers of information contained in this view consist of the following: 1. Average foreign ship service time 2. Average domestic ship service time 3. Average foreign ship waiting time 4. Average domestic ship waiting time
The last view consists of trade flow between regions. There are 14 layers representing
the 14 regions. For each layer, the representation is a pie chart with two components, outgoing and incoming goods.
This representation would be very helpful if made more detailed to include the kinds of goods transported and data on incoming and outgoing per commodity is available. Henceforth, business strategy as well as infrastructure development can have a very rational basis. These include the development of ports at different sites, construction of special cargo vessels to handle high value commodities, support services such as processing and handling, storage, land transportation services, manpower development and other such economic related developments.
ArcView GIS 3.2a
File Edit View Theme Graphics Window Help
Trade Flow Between Regions 1996-2000
IncomingOutgoing
IncomingOutgoing
IncomingOutgoing
IncomingOutgoing
IncomingOutgoing
IncomingOutgoing
IncomingOutgoing
IncomingOutgoing
IncomingOutgoing
Region 5 Com m odity
Region 6 Com m odity
Region 7 Com m odity
Region 8 Com m odity
Region 9 Com m odity
Region 10 Com m odity
Region 11 Com m odity
Region 12 Com m odity
Caraga Com m odity
ARMM Com m odity
Figure A.5. Layer showing the movement of goods to and from ARMM.
Journal of the Eastern Asia Society for Transportation Studies, Vol.5, October, 2003