Embed Size (px)
Citation preview

lable at ScienceDirect
Marine and Petroleum Geology 26 (2009) 1766–1784
Contents lists avai
Marine and Petroleum Geology
journal homepage: www.elsevier .com/locate /marpetgeo
The LUSI mud volcano triggering controversy: Was it caused by drilling?
Nurrochmat Sawolo, Edi Sutriono, Bambang P. Istadi*, Agung B. DarmoyoEnergi Mega Persada, Wisma Mulia 22nd Floor, JI. Jend. Gatot Subroto 42, 12710, Jakarta Indonesia
a r t i c l e i n f o
Article history:Received 25 April 2008Received in revised form6 April 2009Accepted 7 April 2009Available online 18 April 2009
Keywords:Mud volcanoLUSIUnderground blowoutEarthquakeEast JavaWatukosek
* Corresponding author. Tel.: þ62 8 1188 3266.E-mail address: [email protected] (
0264-8172/$ – see front matter � 2009 Elsevier Ltd.doi:10.1016/j.marpetgeo.2009.04.002
a b s t r a c t
Following the Yogyakarta earthquake on May 27th, 2006, the subsequent eruption of a mud volcano hasbeen closely observed and analyzed by the geological community. The mud volcano, known as LUSI,began erupting near the Banjarpanji-1 exploration well in Sidoarjo, East Java, Indonesia. LUSI offersa unique opportunity to study the genesis and development of a mud volcano.For the first time, this paper presents all raw and interpreted drilling data, so any interested party canperform their own assessment. Our study suggests that LUSI mud volcano was a naturally occurring mudvolcano in an area prone for its mud volcanism. Pressure analysis done on the Banjarpanji well showsthat the pressure exerted at the well is lower than the fracture pressure at the last casing shoe, andsuggests that the well was intact and did not suffer an underground blowout. This is further supported byevidence and observation made during drilling (such as circulation was done on an open BOP) andsubsequent relief wells (Sonan and temperature log runs).This study offers a different alternative to earlier hypothesis that events at the Banjarpanji well were thetrigger for the LUSI mud volcano. More work is needed by the scientific community to study thesequence of events in order to explain and clarify the real trigger of LUSI.
� 2009 Elsevier Ltd. All rights reserved.
1. Introduction
On May 29th, 2006 at around 05:00 h an intermittent eruptionof hot water and steam was observed some 200 m from the Ban-jarpanji-1 well. The location map of Banjarpanji is shown in Fig. 1.The eruptive bursts of hot water and steam were dramatic witha distinct geyser-like cycle of active and passive periods. Thismarked the birth of a new mud volcano known as LUSI in East Java,Indonesia, shown in Fig. 2 (Cyranoski, 2007; Satyana, 2007).
The cause of LUSI is controversial. The essence of the contro-versy is whether the mudflow i) Originates from the wellbore, thusan underground blowout (Davies et al., 2007, 2008; Tingay et al.,2008) or ii) Originates from an eruption of overpressured shalethrough reactivated faults as conduits (Mazzini et al., 2007a,b), oriii) Originates from geothermal activity, where superheatedhydrothermal fluids at high temperature and pressure werereleased through a fault zone or fracture network as the conduit(Sudarman and Hendrasto, 2007).
Only the first hypothesis, the underground blowout hypothesis,will be discussed in this paper. Hypothesis based on fault reac-tivation and geothermal activities is beyond the scope of this paperand will not be discussed. This paper lays out the drilling
B.P. Istadi).
All rights reserved.
engineering data and analysis on the Banjarpanji well. It analyzesthe bottom hole pressure and rock strength data to test if thepressure induced by the kick was sufficient to fracture the shoe andcaused an underground blowout. It also examines the evidencesurrounding the well and during the re-entry program after themud eruption. The analysis results suggest that the well remainedintact and did not suffer any underground blowout.
This paper also presents relevant data from 8750 ft to 9297 ft(2667 m–2834 m) while drilling to look for the top of the Kujungformation. This includes the daily drilling report, daily geologicalreport and daily mud loggers report. Real time data plot for thecritical period between the times when the BOP was closed to thetime that the mud eruption was reported is also attached for criticalanalysis by interested parties.
2. Regional geology of East Java
The Eocene and Early Oligocene Sequence of East Java back arcbasin is associated with rifting where clastic deposition andcarbonate buildup of the Ngimbang Formation took place. The LateOligocene and Miocene sequence is separated from the underlyingsequence by an unconformity which served as the foundation ofENE-WSW oriented carbonate trends. This platform development,which is known as the Kujung limestone, occurred in the lateOligocene while the Prupuh and Tuban reefal development took

Fig. 1. Banjarpanji-1 location and its offset wells. Banjarpanji-1 is located 30 km south of Surabaya, in the island of Java, Indonesia. Banjarpanji offset wells, both onshore andoffshore, provided good drilling information and lessons learned to help design the well. These include the setting of casing shoe in the carbonate formation to anticipate a pressureregression in Kujung carbonate and the use of oil base mud to mitigate the overlying highly reactive shale.
Fig. 2. Initial LUSI eruptions at five different locations aligned along Watukosek fault lines. River bends and escarpment aligned with the Watukosek Fault System. (photo inset)taken on 29th May 2006, 9 am four hours after mud eruption was reported showing the geyser-like mud eruption approximately 200 m away from the Banjarpanji 1 well location.

Fig. 3. Mud volcanoes in Eastern Java. Map of Eastern half of Java showing locations of mud volcanoes. In particular, there are at least five mud volcanoes near the Watukosek faulton the north eastern part of the island.
N. Sawolo et al. / Marine and Petroleum Geology 26 (2009) 1766–17841768
place in the Early to Middle Miocene. Such reefs have been thetarget for several exploratory wells including the offset Porong-1well. The Plio-Pleistocene sequence overlies an unconformity. Insome places this unconformity removed the entire Middle and LateMiocene section such as in Porong and the KE-11-C area. Subse-quent Pliocene and Pleistocene sedimentation consisted of aneastward-prograding mudstone-dominated volcaniclastic wedgeof Kalibeng and Pucangan Formation, with thickness of 8000 to10,000 feet (2438–3048 m). The volcaniclastic materials derivedfrom the Java volcanic arc south of the Sidoarjo area. The mudstone
Fig. 4. Mud Volcanoes along Watukosek faults. LUSI and five other known mud volcanoesWatukosek fault confirms that weak zones adjacent to the fault are conducive and prone t
of the Kalibeng Formation is overpressured in most parts of thebasin where rapid pressure transition occurs.
Several tectonic models have been proposed to explain thecomplexity of East Java Basin, and the understanding of the tectonicand basin development of the area is still subject to ongoing debate.A continental fragment model is favored, a continental fragmentwhere possibly detached from the Gondwana super-continentwhich collided with the eastern margin of the Sunda Microplateand uplifted a melange complex in Central Java. This tectonic modelwas proposed by Hamilton, 1979, and has been followed by every
are located along the Watukosek fault zone. The concentration of mud volcanoes nearo mud volcanism.

Fig. 5. Seismic section (Top) and Stratigraphy of Banjarpanji-1 (bottom). Banjarpanji-1 logged section shows presence of low density intervals within the shale unit whichcorrespond with the low velocity interval between 40000 and 60000 , correlatable with ‘‘bluish gray clay’’ of Upper Kalibeng Formation Pleistocene in age. Correlation based on:i) foram fossil index plankton Globoratlia truncatulinoides and nanno fossil index Gephyrocapsa spp. assemblages similarities. The sediments were deposited in Middle to outershelf environment.

N. Sawolo et al. / Marine and Petroleum Geology 26 (2009) 1766–17841770
worker since e.g. Daly et al. (1987), Hall (2001), Longley (1997),Sribudiyani et al. (2003). The model was finally proven by Smythet al., 2005, 2007. The grain of the continental basement influencedbasin trends. The dominant basement grain is E–W, in eastern partof East Java Basin, and at the collision zone NE–SW direction,
Table 1Drilling Operations.
Key event
Performed Leak Off Test at 13-3/800 casing shoe. LOT at 3580 ft (1091 m) was 16.4 ppg(19.29 MPa/km)
Drill 12-1/400 (31.1 cm) hole section to 8750 ft (2667 m)Prognosis of the top of carbonate was at 8500 ft (2591 m) Drill to 8750 ft (2667 m) with
encountering any carbonate section. Log the well to better determine the carbonate tLog well.Result of VSP log suggested that the expected depth of carbonate section can be as deepAt 10 bbls and 0.5 ppg (1590 l and 0.59 MPa/km) pre-determined kick tolerance, the de
that it was safe to drill was 9400 ft (2865 m). Decided to continue drilling to top ofcarbonate or 9400 ft (2865 m) maximum depth.
Continue to drill 12-1/400 (31.1 cm) hole to 9297 ft (2834 m)Yogyakarta earthquakeWell recorded a 20 bbls (3180 l) mud loss 7 minutes after main earthquakeWell recorded a total loss of circulation and 130 bbls (21670 l) mud loss less than 2 h a
aftershocks (Fig.12). The proximity of the times suggest that the earthquake had an imPumped 60 bbls (9540 l) of Loss Control Material to stop losses. Losses cured. Well stati
without any further loss or kick, and is deemed to be safe to start pulling out of hole.Decided this will be the casing point.
Pulling out of holeAfter sufficient new mud is made and well static, start pulling out of hole. Pulling rate
w5 min per stand, pumping mud every 4–7 stands, no apparent drag. Unlikely to swWell kicked, shut in and kill wellWell kicked, H2S content 500 ppm. Shut BOP (Blow out preventer) to stop further influx
(3.10 MPa) and ISICP 350 psi (2.41 MPa) volume of influx w360 bbls. (57240 l). ISIDPare reading from Real Time Chart.
Kill well by using volumetric method, applied twice and well dead. Maximum SICP 1054Attempted but not able to burn influx. Circulated out the kick and found influx to be8.9 ppg. (10.47 MPa/km) density
Open BOP but found drill string stuckDrill string stuck, but still able to circulate, BHA appeared to be differentially stuck. Stre
suggests it was stuck at 4182 ft (1275 m)Fish stuck drill string while circulating at high rate, unsuccessful. Ability to circulate sto
14:30; the well appeared to have caved in. Jar stop functioning. Wait for fishing toolthrough trip tank.
Released trapped pressure. Pumped 40 bbls (6380 l) soaking fluid to try to dehydrate mwith no return. Shut in to let soaking fluid to work.
Rig up free point indicator (FPI) to cut the drill string. Bleed off trapped pressure in theWhile rigging up tool, 35 ppm H2S gas detected at the rig floor. Evacuate personnel a
Mud eruption startedVillagers reported a hot water flow in their field w200 m from the well.Hot water and steam blew intermittently to around 25 ft (8 m) height geyser like with
between bursts.Checking for any connection or channel between the well and the mud eruptionPumped first batch of mud 185 bbls of 14.7 ppg (29415 l of 17.29 MPa/km) down hole w
700 psi (4.83 MPa)Second batch of mud 200 bbls of 16 ppg (31800 l of 18.82 MPa/km) with Loss Circulatin
pressure of 900 psi (6.21 MPa)Initially suspected that injection reduced the eruption intensity. But high pressure indic
any channel between the well and the eruption. This absence of channel and connectwas interpreted as safe to continue fishing job.
Continue to fish stuck drill stringAs an added safety measure while fishing, a barrier of cement will be laid below the fish
the open hole below.Perform injection test, with 2.5 bpm rate at 370 psi (398 l/m at 2.55 MPa) This third inj
showed a high pressure injection above the LOT pressure meaning the absence of anyPump two batches of cement to isolate the fish from the open hole below. Injection test
cement plugs showed 1000 psi suggesting that the cement plugs were in place.Ran free point indicator and found that the stuck point has moved upward from 4182 ft
stretch measurement, to 3200 ft or 2600 ft (between 980 m and 790 m)Ran string shot and finally the drill string was backed off at 2989 ft (911 m). Pull out ofTemporarily abandon well and move out rigCondition at the rig was critical with mud starting to enter location, more eruptions and
at the rig site.To safe lives and properties, decided to Temporary Abandon the well and move the rig
assess situation and plan intervention programRig released
parallel to the direction of the collisional suture. Prasetyadi et al.,2006, continue this line of thought and propose a micro-continentas the core of southeast Java (‘‘East Java Micro Plate’’).
The complex geology and presence of overpressure sedimentsresults in the many mud volcanoes in the area (Fig. 3).
Date (2006) and Time
May 6th
May 6th–May 23rdout
op.May 23rd–May 25th
as 9600 ft (2926 m).epest
May 25th–May 27thMay 27th 05:55May 27th 06:02
fter two majorpact down hole in the well.
May 27th 12:50
c for 7 h May 27th 13:00–22:00
May 27th 22:00
ab.May 28th 07:30
. ISIDP 450 psi, ISICP and influx
May 28th 07:50
psi (7.27 MPa).saline water of
May 28th 11:00tch calculation May 28th 11:00–14:20
pped at aroundwhile circulating
May 28th 14:20–21:30
ud cake, pumping May 28th 21:30–23:00
drill pipe.nd abandon FPI.
May 29th 02:00–04:00
May 29th 05:00
5 min intervals
May 29th 10:00–23:30ith a pressure of
g Material with a
ated the absence ofion to the eruption
May 29th–June 2ndto isolate it from
ection test againchannels.
May 30th 04:00–05:00
after laying May 30th 05:00–June 1st 04:30
(1275 m), the original
hole with the drill string.June 2nd–4th
developing new cracks
out. This will give time to
June 4th 00:00

N. Sawolo et al. / Marine and Petroleum Geology 26 (2009) 1766–1784 1771
The overpressure is due to high sedimentation rates in a rapidsubsidence and burial basin (Willumsen and Schiller, 1994; Schilleret al., 1994) and maturation of the organic materials. The East Javageosyncline has thick Tertiary sediments of more than 6000 m(Koesoemadinata, 1980) with an estimated sedimentation rate of2480 m/ma in the vicinity of LUSI (Kadar, 1986). Mud volcanism isknown to be associated with highly under compacted over-pressured shales and there is a clear relationship between mudvolcanoes breaching the surface and tectonic movement alongfaults as evidenced in the mud volcanoes aligned along theWatukosek fault zone (Fig. 4).
3. Geology of LUSI mud volcano
LUSI mud volcano adds to the many mud volcanoes existing inthe area, such as the Porong collapse structure (NE of LUSI), KalangAnyar & Pulungan (Sedati, Sidoarjo), Gunung Anyar (UPN campus,Surabaya), Bleduk Kuwu & Keradenan (Purwodadi), Wringin Anom/Pengangson (Gresik), Semolowaru (Unitomo campus, Surabaya),Dawar Blandong (Mojokerto), Sangiran (Central Java), Socah(Bangkalan, Madura) and others.
All of these mud volcanoes occurred naturally; some of whichare still active and still erupting mud. The existence of mudvolcanoes in East Java have been mapped as early as 1936.(Duyfjes, 1936, 1938). In the eastern part of Java, in the EastKendeng zone, a number of these mud volcanoes exhibiteda pattern that follows the Watukosek fault. This major faultstarted from the Arjuno – Welirang volcano complex along theSSW/NNE direction. LUSI and other mud volcanoes that lie alongthis trend are shown on Fig. 4.
LUSI mud volcano is unique, as scientists can observe theevolving geological processes from its birth. The solid matter inLUSI’s mud is ‘‘bluish gray clay’’ from the Upper Kalibeng Forma-tion, which is Pleistocene in age, as confirmed from mud samples,cuttings and side-wall cores taken from the Banjarpanji-1 wellfrom a depth section of 4000–6100 feet (1219–1859 m). Specifically,i) Foraminifera index plankton Globorotalia truncatulinoides andnannofossil index Geohyrocapsa spp. assemblages similarity. Thesediments were deposited in a Middle to outer shelf environment(Kadar et al., 2007) as shown in Fig. 5; ii) Kerogen composition iscorrelatable with side-wall cores taken at a depth of 5600 feet(1707 m); iii) Thermal maturity profile shows positive vitrinitereflectance correlation with cuttings & side-wall cores taken atdepths from 5100 to 6300 feet (1554–1920 m). The presence ofoverpressured shale is evident from the logs and was identified asdrilling hazard in the well prognosis.
The source of fluid, however, is still debated. Mazzini et al.(2007a,b) used geochemical data to suggest that the overpressuredfluids are primarily sourced from clay diagenetic dehydrationwithin the Upper Kalibeng Formation. Davies et al. (2007) suggestthat the fluids are primarily sourced from the Kujung carbonateformation. Whereas Sudarman and Hendrasto (2007) suggesta deeper fluid source, where geothermal activity induced the muderuption by the release of superheated hydrothermal fluids at hightemperature and pressure through fault zone or fracture networkas the conduit.
In the early stages, the eruption consist of hot water, steamfollowed by erratic and intermittent explosions of mud. The mudconsists of clay and salt water in slurry state at temperaturesbetween 80� and 100 �C. The gas bubbles consist primarily ofmethane, N2, CO2 and small percentage of higher hydrocarbonsindicating the presence of thermogenic oil. The gas compositionindicates similarities with gas from the adjacent Wunut Field deephorizons.
4. Operational summary of Banjarpanji #1 well
The drilling operation of Banjarpanji was done by PT Tiga MusimMas Jaya, a reputable drilling company in Indonesia. The keyservices (the mud chemical services, the electric logging and thecementing services) were provided by M-I, Baker Atlas and Halli-burton, all in the top five of their respective fields. Other ancillaryservices are provided by PT Elnusa (mud logging), Weatherford(equipment rentals) and Sperry-Sun (for any directional drillingand correction purposes). Apart from mud pumps equipmentproblems, there were no major operational issues and the teamperformed their specific duties as good as, or better than, expected.
In the upper hole sections, the well lithology is not significantlydifferent from that prognosed. The only difference is in the wellpressure where the depth of the transition zone to the over pres-sure was found to be shallower than planned requiring the uppercasing shoes to be set accordingly. The end result is such thatsubsurface drilling problems in the upper hole section of theBanjarpanji well were almost non existent (Sutriono, 2007).
Once the 13-3/800 (34.0 cm) casing was set, the operation in the12-1/400 (31.1 cm) hole section did not go according to plan anddrilling parameters were adjusted accordingly. Lithology and dril-ling parameters are different from the deep offset Porong well. Thebottom most w3000 ft (910 m) of the well was a solid deposit oflaharic sandstone section instead of shale. The pressure and themud weight used to drill this section is lower, 14.7 ppg (17.29 MPa/km) compared to 15.5 ppg (18.23 MPa/km), at the same depth inoffset Porong well. The Leak Off Test, on the other hand was foundto be higher than prognosed (16.4 ppg vs. 16.0 ppg). The strongershoe and lower pore pressure are the key reasons why the 9-5/800
(24.4 cm) casing shoe was able be set deeper, thus a longer openhole section was able to be drilled with the same safety factor.
Drilling operations of the 12-1/400 (31.1 cm) hole section until themud eruption is summarized in Table 1.
5. Was LUSI caused by drilling?
LUSI gives the unique opportunity for the geoscientists to studythe birth of a mud volcano. At the same time the drilling commu-nity was also interested in the birth of LUSI, but from a differentperspective, namely what triggered LUSI. Was it caused by drillingor simply another mud volcano that occurred naturally?
5.1. Underground blowout hypothesis
Initially, the complete Banjarpanji-1 drilling data set was notpublicly available. Early technical papers (Davies et al., 2007, 2008;Rubiandini et al., 2008; Tingay et al., 2008) were published basedon limited data and concluded that an underground blowout wasthe cause of LUSI.
These papers proposed a classic underground blowout resultingfrom an unsafe act (swabbing while pulling out of hole) combinedwith an insufficient safety factor (kick tolerance) during the drillingof the well. Their conclusion was that the resulting shut in pressureafter the kick fractured the deepest casing shoe and caused anunderground blowout, which eventually reached the surface andcaused the LUSI mud volcano.
At the time, this underground blowout hypothesis was the onlyexplanation for the LUSI mud volcano. As a result the public under-stood that an underground blowout in the Banjarpanji well was theroot cause of the mud eruption. However, as more data from the fieldbecame available and analyzed, it became clear that the analysis andfield observations do not support the underground blowouthypothesis (Table 2 and Fig. 8A). The following chapters explain why
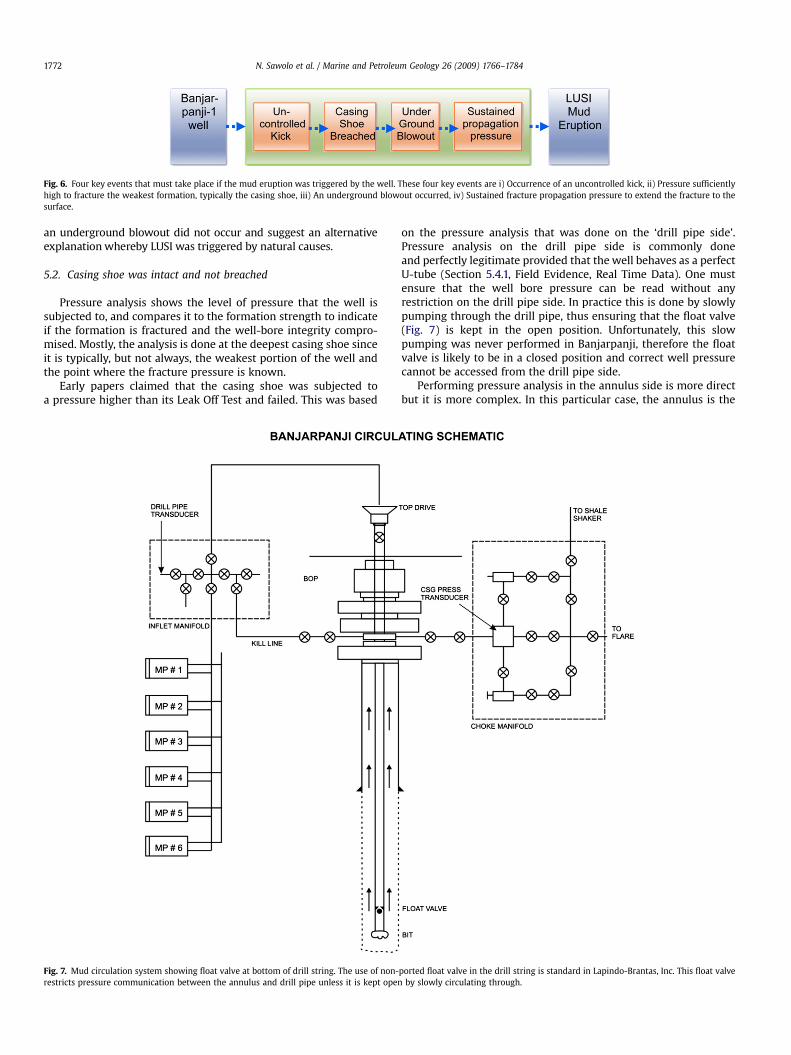
Fig. 6. Four key events that must take place if the mud eruption was triggered by the well. These four key events are i) Occurrence of an uncontrolled kick, ii) Pressure sufficientlyhigh to fracture the weakest formation, typically the casing shoe, iii) An underground blowout occurred, iv) Sustained fracture propagation pressure to extend the fracture to thesurface.
N. Sawolo et al. / Marine and Petroleum Geology 26 (2009) 1766–17841772
an underground blowout did not occur and suggest an alternativeexplanation whereby LUSI was triggered by natural causes.
5.2. Casing shoe was intact and not breached
Pressure analysis shows the level of pressure that the well issubjected to, and compares it to the formation strength to indicateif the formation is fractured and the well-bore integrity compro-mised. Mostly, the analysis is done at the deepest casing shoe sinceit is typically, but not always, the weakest portion of the well andthe point where the fracture pressure is known.
Early papers claimed that the casing shoe was subjected toa pressure higher than its Leak Off Test and failed. This was based
Fig. 7. Mud circulation system showing float valve at bottom of drill string. The use of non-restricts pressure communication between the annulus and drill pipe unless it is kept open
on the pressure analysis that was done on the ‘drill pipe side’.Pressure analysis on the drill pipe side is commonly doneand perfectly legitimate provided that the well behaves as a perfectU-tube (Section 5.4.1, Field Evidence, Real Time Data). One mustensure that the well bore pressure can be read without anyrestriction on the drill pipe side. In practice this is done by slowlypumping through the drill pipe, thus ensuring that the float valve(Fig. 7) is kept in the open position. Unfortunately, this slowpumping was never performed in Banjarpanji, therefore the floatvalve is likely to be in a closed position and correct well pressurecannot be accessed from the drill pipe side.
Performing pressure analysis in the annulus side is more directbut it is more complex. In this particular case, the annulus is the
ported float valve in the drill string is standard in Lapindo-Brantas, Inc. This float valveby slowly circulating through.

Fig. 8. Casing setting depth check (top). Actual casing setting depth is checked using a leading commercially available casing design software with a kick tolerance of 10 bbls and0.5 ppg gas influx and found to be safe including a planned 9-5/800 casing at 9300 ft TD. (Bottom) Pressure profile in wellbore and sensitivity analysis. The pressure data are plottedthat shows that the well is safe. Sensitivity analysis is done with a bottom hole pressure of 14.7 ppg, and a LOT of 15.8 ppg. Even at such extreme, the wellbore pressure at any depthis always below the minimum formation strength meaning that the wellbore is always intact.
N. Sawolo et al. / Marine and Petroleum Geology 26 (2009) 1766–1784 1773
preferred leg to perform any pressure analysis as the well was notcompletely packed off and the fluid density and Bottom holepressure of the well were measured. The annulus pressure is thebetter representation of the well-bore pressure.
The data to perform this analysis is:
i. Maximum casing pressure ¼ 1054 psi (7.27 MPa)
ii. Fluid in the upper part of the hole (influx fluid) ¼ 8.9 ppg(10.47 MPa/km)
iii. Fluid in the bottom part of the hole (mud) ¼ 14.7 ppg(17.29 MPa/km)
iv. Bottom hole pressure (BHP) ¼ 12.8 ppg (15.06 MPa/km)v. Leak off test (LOT) at the casing shoe (3580 ft or
1091m) ¼ 16.4 ppg (19.29 MPa/km)
N. Sawolo et al. / Marine and Petroleum Geology 26 (2009) 1766–17841774
Appendices C and D show how these data were obtained.The graphical pressure analysis at the casing shoe is described in
Appendix E, and the graph is shown in Fig. 8B.The resulting pressure that is acting at the shoe is 2710 psi
(18.68 MPa) whereas the formation strength at the casing shoe is
REAL TIME
DP AND CSG PRESSURE
0
120
240
360
480
600
720
840
960
1080
-200 200 600 1000 1400 1800
PRESSURE, psi
TIM
E, M
IN
S
DP Pressure, psi CSG Press, psi
Pressure anomaly
Well dead, Annulus and DPpress = 0 psi
Pressure anomaly?
Bleed off drill pipe priorto pumping soaking fluid
KIL
L W
EL
LF
IS
H S
TU
CK
D
RIL
L S
TR
IN
G
FLOW IN
0
120
240
360
480
600
720
840
960
1080
1200
0 400 800
FLOW
TIM
E, M
IN
FLOW IN, GPM
Kill well ki
Attempt t
Ability to
H2S gas at surface
1320
1440
1560
1320
1440
1560
1200
-200
0
200
400
600
800
1000
1200
-20 0 20 40 60 80
Time after BOP s
Pressu
res (p
si)
Drill Pipe and Ca
Shut BOP
Casing press
Drill Pip
PumpingPumping
Bleed off Casing pre
Well died
Max casing press = 1054 psi
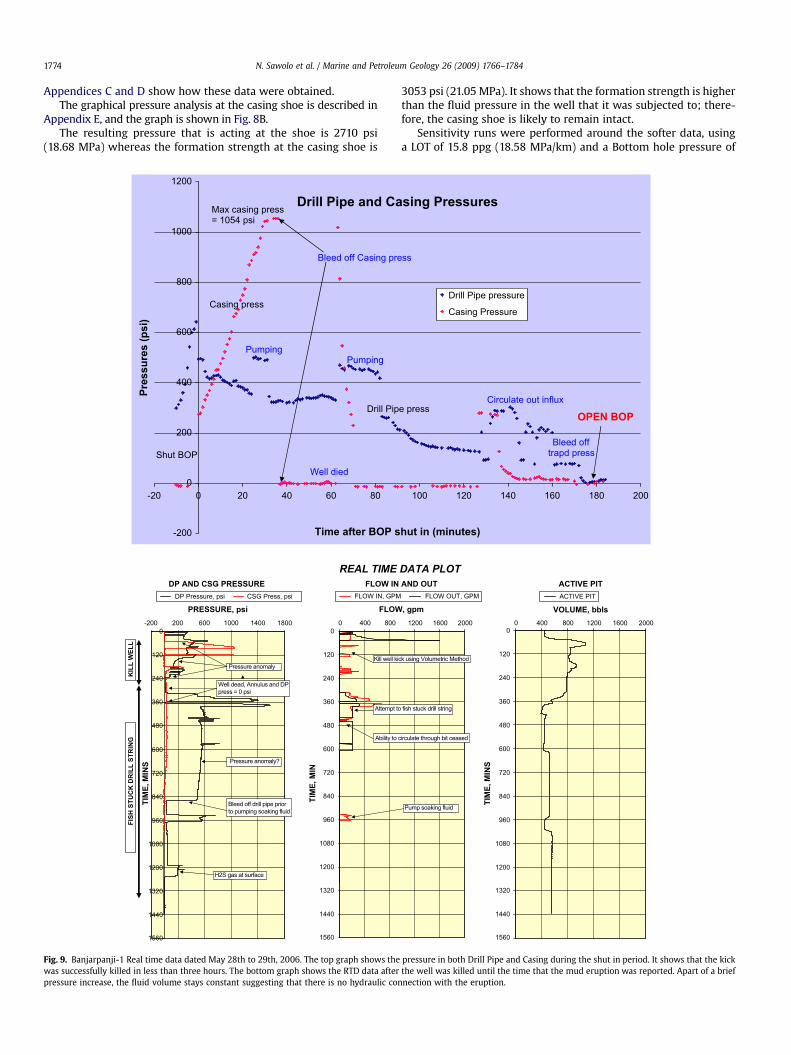
Fig. 9. Banjarpanji-1 Real time data dated May 28th to 29th, 2006. The top graph shows thewas successfully killed in less than three hours. The bottom graph shows the RTD data afterpressure increase, the fluid volume stays constant suggesting that there is no hydraulic con
3053 psi (21.05 MPa). It shows that the formation strength is higherthan the fluid pressure in the well that it was subjected to; there-fore, the casing shoe is likely to remain intact.
Sensitivity runs were performed around the softer data, usinga LOT of 15.8 ppg (18.58 MPa/km) and a Bottom hole pressure of
DATA PLOT
AND OUT
1200 1600 2000
, gpm
FLOW OUT, GPM
ck using Volumetric Method
o fish stuck drill string
circulate through bit ceased
Pump soaking fluid
ACTIVE PIT
0
120
240
360
480
600
720
840
960
1080
1200
0 400 800 1200 1600 2000
VOLUME, bbls
TIM
E, M
IN
S
ACTIVE PIT
1320
1440
1560
100 120 140 160 180 200
hut in (minutes)
Drill Pipe pressure
Casing Pressure
sing Pressures
e press
ss
Circulate out influx
Bleed off trapd press
OPEN BOP
pressure in both Drill Pipe and Casing during the shut in period. It shows that the kickthe well was killed until the time that the mud eruption was reported. Apart of a briefnection with the eruption.

Table 2Trip sheet data. Pulling out of hole trip sheet from the Real Time Data, showing the time, number of pipe stands pulled, its displacement and the amount of mud pumped.Pulling out was done slow, around five minutes per stand, and excessive fluid was pumped in the hole exceeding drill pipe steel displacement that negates the possibility ofswabbing.
Time Activity PVT Change Disp. Pumped Cum PVT
23:15 Start POH 55123:17 POH 1 Stands 551 023:58 POH 4 Stands 556 5 2.8 7.80:53 Pump out 4 stands 483 �73 2.8 107.2 �102.21:12 Pull 2 stands 486 3 1.4 �97.81:17 Pump 470 �16 15 �113.81:42 Pull 3 stands 473 3 2.1 �108.71:56 Pump 439 �34 28.6 �142.72:47 Pull 7 stands 444 6 4.9 �131.83:00 Pump 418 �26 32.9 �157.83:40 Pull 5 stands 447 29 3.5 �148.33:58 Pump 408 �39 33.8 �187.34:32 Pull 5 stands 411 3 3.5 �180.84:44 Pump 372 �39 33.8 �219.85:23 Pull 6 stands 378 6 4.2 �209.65:40 Pump 339 �39 33.9 �248.66:17 Pull 7 stands 344 5 4.9 �238.76:25 Pull 2 stands, well flowing 377 34 1.4 �203.36:56 Pump, Pull 1 stand 469 92 0.7 42.3 �110.67:03 Pump, Pull 1 stand 450 �19 0.7 25 �128.97:19 Call Co Man 453 3 34.2 �125.97:53 Shut In Well 819 366 124.5 240.18:14 Final PVT reading 1074 255 495.1
Bleed of Gas8:17 Pump Mud 1045 29 25.48:24 Bleed off Gas, Transfer mud 8518:59 Pump Mud 817 33 52.5
Bleed off Press, Well Dead 9299:13 Circulate 800 93
N. Sawolo et al. / Marine and Petroleum Geology 26 (2009) 1766–1784 1775
14.7 ppg (17.29 MPa/km) and found to be safe. These showed thatthe casing shoe remained intact and not compromised even if‘worst case’ inputs were used.
5.3. Four key events
For an underground blowout to occur and breach to the surface,four key events must take place (Fig. 6). If any of this sequence ofevents did not occur, an underground blowout that breach to thesurface is very unlikely to occur. These are:
i. Occurrence of an uncontrolled kick. In Banjarpanji, there wasno uncontrolled kick and the well was dead a day before themud started to erupt.
- The kick was controlled three hours after shut in at 11:00 h(Fig. 9). Both the casing and drill pipe pressures were bled offto zero pressure.
- The BOP was opened at 11:00 h (Drilling morning report ofMay 29th, 2006), the well was dead and operations wereunderway to fish the stuck drill string by circulating andjarring up. No such operation is possible during a kick.
ii. Kick pressure that fractures the weakest part of the well,typically the casing shoe. This did not happen, as:
- The pressure exerted by the kick was too low to fracture thecasing shoe. The maximum pressure at the casing shoe is
Table 3Laboratory analysis of mud properties taken randomly from different sites near the mud
Date 31 May 2006 31 May 2006 31 May 20
Time 23:45 23:45 23:50Weight 10.5 ppg 8.7 ppg 10.6 ppgpH 7 7 7Cl� 15.500 mg/l 14.500 mg/l 13.500 mgWater 100% 100% 100%Oil Nil Nil Nil
2710 psi (18.68 MPa), which is much less than the formationstrength of 3053 psi (21.05 MPa) (Appendix E).
- After the mud erupted, the high pressure obtained duringinjection tests (Section 5.4.2, Field Evidence, High InjectionTests) showed the wellbore was totally isolated from the muderuption, meaning that the casing shoe was not fractured andwas still intact.
iii. Sufficient pressure and drive to cause an undergroundblowout. Observations in the field did not support thisunderground blowout claims.
- Circulation in the well was recorded in the RTD until May 28th,2006 at 13:00 h (Fig. 9). In an underground blowout situation, nocirculation is possible since it will be sucked by the cross-flow
- With the BOP opened starting at 11:00 h May 28th, 2006, therewas no pressure in the well bore. With the well dead onecannot have an underground blowout situation.
- With the BOP opened, the path of least resistance is up throughthe well-head not through the formation. Nothing flowed fromthe well-head while a major eruption was blowing nearby.
iv. Sustained Propagation pressure to extend any fracture to thesurface. No sustained pressure existed in the well bore, since:
- With the well dead and BOP opened starting at 11:00 h May28th, 2006, there was no pressure in the wellbore able topropagate any fractures to the surface.
eruption. Data analyzed by on site MI Mud Engineer at BJP – 1, 1/06/2006 report.
06 31 May 2006 1 June 2006 1 June 2006
24:00 05:00 05:3010.0 ppg 10.7 ppg 11.0 ppg7 7 7
/l 14.700 mg/l 14.400 mg/l 14.600 mg/l100% 100% 100%Nil Nil Nil

Fig. 10. Banjarpanji Bottom Hole Pressure (BHP) estimation. The bottom hole pressure (BHP) is estimated based on a number of methods with differing reliabilities. The most likelyBHP is around 12.8 ppg and the maximum BHP of 14.7 ppg (for sensitivity analysis purpose).
Fig. 11. Leak Off Test (LOT) Banjarpanji well at 3580 ft. (1091 m) depth. The LOT result was 16.4 ppg (19.29 MPa/km) (Left). The shape of the curve is typical of LOT done using oilbased mud due to a higher compressibility factor compared to a water based mud system. The resulting LOT is compared to other nearby wells (Right). The formation pressure andthe LOT in the shallow section of Banjarpanji resembles Wunut wells, since it is within the same closure.
N. Sawolo et al. / Marine and Petroleum Geology 26 (2009) 1766–17841776

Fig. 12. A 20 bbls loss of mud after the main earthquake (top).The left portion showed the seismograph reading of the Yogyakarta earthquakew06:00 WIB 27 May 06 at Tretes BMGstation about 15 km away. The top right picture showed the 20 bbls loss from the mud logger’s real time data that happenned seven minutes after the main earthquake. The bottomright shows 130 bbls complete loss of circulation from the wellbore that happenned two hours after two aftershocks. These losses that happenned after the earthquake showeda compelling argument that a temporal connection exists between the earthquake and Banjarpanji well.
N. Sawolo et al. / Marine and Petroleum Geology 26 (2009) 1766–1784 1777
- Samples of mud collected at the eruption site were analyzedwithout any traces of synthetic oil based mud. Results of themud analysis are shown in Table 3. Had it been from the well,the drilling mud used will distinctly show its oil based mudsignature.
5.4. Field evidence
Facts and evidence were collected during final days of drillingand subsequent relief well project. This evidence do not support theunderground blowout claims. These include:
5.4.1. Real time dataThe most important piece of data to confirm the status of the
well is the Mud logger’s real time data (RTD) that include thepressure data, mud volume data, pumping data, gas data andthe drilling parameter information. Analysis of this data helps
explain the status of the well, whether it is breached or staysintact.
5.4.1.1. During the well control incident (while the BOP was shutin). With the drill bit off bottom when the kick was taken, thepreferred well control method was the Volumetric Method(Abel et al., 1994). This method involves lubricating a volume ofdrilling mud (not necessarily a heavy kill mud) and bleeding offa certain amount of gas. This method is not intended to kill thekick, but simply to lower the shut-in pressure sufficiently to allowsnubbing the pipe back down to bottom where the well can thenbe killed conventionally. But instead of the expected graduallowering of the shut-in pressure, the well died after two cycles oflubrication.
After circulating the influx out and ensuring that the fluid inboth drill pipe and annulus are full of 14.7 ppg. (17.29 MPa/km)mud, the drill pipe pressure remained at around 75 psi (0.52 MPa)while the annulus was 0 psi. The trapped pressure at the drill pipe

Fig. 13. Sonan (left) and Temperature (right) logs taken during re-entry operations, 2 months after eruption did not show any anomaly. The absence of anomalies suggests that thereis no flow close to the casing. If the flow originates from the well, erratic noise or distinct temperature changes would be registered in the log. This suggests that flow may notoriginate from the well.
N. Sawolo et al. / Marine and Petroleum Geology 26 (2009) 1766–17841778
was bled off and the BOP was opened. The well was confirmed deadat 11:00 h. This is shown in Fig. 9A that plots the pressure data, bothdrill pipe and annulus, during shut in from the RTD. The mostpertinent data for pressure analysis is the annulus shut in pressure.The annulus pressure continued to rise after shut in and reacheda plateau at 1054 psi (7.26 MPa). This pressure is used as the inputdata in the Pressure Analysis section.
The second is the anomalies at the drill pipe leg of the well.These are:
i. At the time of the shut in, drill pipe pressure was higherthan annulus pressure. The drill pipe pressure was around500 psi (3.45 MPa) and the annulus pressure was 280 psi(1.93 MPa).
ii. After the first bleed off period, the annulus pressure remainedat 0 psi whereas the drill pipe pressure stayed at a higherpressure.
The operation just before the BOP was shut in was pumpingmud down hole. Therefore, the drill string was full of 14.7 ppg(17.29 MPa/km) mud whereas the annulus fluid was of unknowncomposition at the time of killing. However, this is in direct contrastto the pressure readings at shut in where the drill pipe pressure washigher than the annulus. The plausible explanation on why thepressure of the drill pipe can be higher than the annulus is the floatvalve that isolates the drill pipe pressure reading from the openformation (Fig. 7). This suggests a ‘pressure trap’ phenomenon or, indrilling engineering, ‘the well does not behave as a perfect U-tube’.The consequence is that any accurate pressure analysis cannot be
done based on the drill pipe pressure, and must be performed onthe annulus side that is in direct contact to the open formation andthe shoe.
5.4.1.2. After the BOP was opened until the mud erupted(Fig. 9B). The second piece of information from RTD is shown onFig. 9B. It shows the operation on the well from the time that thewell had died and the fishing of the drill string until the muderuption. The critical information here are:
i. Pumping through the bit was still possible until w15:00 h onMay 29th, 2006, despite the fact that the drill-string wasstuck. The drill-string appeared to be differentially stuck butnot completely packed off at the time.
ii. The ‘pressure trap’ phenomenon in the drill pipeprevails, which showed that the Drill Pipe pressurearound 480–550 psi when there were no pumping (15:00through to 21:00 h). This pressure trap was finally bledoff just prior to spotting the soaking fluid to unseat thefish at 21:30 h.
iii. After the pressure was bled off, there was no sustainedpressure in the well.
5.4.1.3. The information from the mud logger’s RTD can be summa-rized as follows.
- The maximum pressure in the annulus during the wellcontrol was 1054 psi (7.27 MPa). This pressure reading is

N. Sawolo et al. / Marine and Petroleum Geology 26 (2009) 1766–1784 1779
valid since the well was still able to be circulated throughand not packed off.
- Float valve in the drill string appears to create a trappedpressure in the drill pipe. This trapped pressure made readingsin the drill pipe invalid unless it is removed beforehand bycirculating slowly that kept the float valve open.
5.4.2. High injection testsOn the first day of the eruption, the first operational priority was
to ascertain if there was any connection between the well and themud eruption and attempt to kill it. Three injection (pumping)connectivity tests were therefore carried out:
i. First injection test with 185 bbls (29,415 l) of 14.7 ppg(17.29 MPa/km) mud. The injection pressure was at 700 psi(4.83 MPa). (M-I Swaco report date May 29th, 2006).
ii. Second injection test with 200 bbls (31,800 l) of 16.0 ppg(18.82 MPa/km) mud loaded with LCM material. The initialinjection pressure was 1200 psi (8.27 MPa) with a final pressureof 900 psi (6.21 MPa)) (Drilling morning report May 30th, 2006).
Fig. 14. With BOP open, well cannot be in an underground blowout situation. If BOP is oformation and breaching to the surface. Yet nothing came out of the well (A). In the Undergrthe fish Fall to the bottom of the well (C); the very high flow rate, the flow behind casing wouabandoned depth.
These two tests were done with a high pumping rate as theintent was to kill the eruption if possible. The initial report after theinjection tests suggested that the eruption intensity decreased butfurther observation showed that this may not be the case; thecontinued erratic and intermittent nature of the eruption afterwardsuggests this was coincidental.
The high injection pressure, higher than the Leak Off Test,confirmed that there were no channel formed between the welland the mud eruption. It was then decided to continue to fish thestuck drill string, and as an added safety measure, cement plugswould be set in the open hole below the fish.
iii. Third injection test before cementing; the injection rate was2.5 bpm (397.5 l/m) at 370 psi (2.55 MPa). (Daily drillingreport May 30th, 2006)
These high injection pressures confirmed that the shoe wasnot fractured and there was no channel formed between thewell and the mud flow. If such a channel existed, the injectionpressures would have been lower than the leak off testpressures.
pened, the path of least resistance is through the wellbore instead of fracturing theound Blowout Hypothesis several scenario would happen: the hole would enlarged (B);ld be easily detected (D). None of the above happened. The fish was found in its original

N. Sawolo et al. / Marine and Petroleum Geology 26 (2009) 1766–17841780
5.4.3. Other field evidence against underground blowout claims
i. The drilling assembly stuck in the open-hole part of the welldid not fall deeper into the well. If an underground blowouthad occurred, the high mud flow rates would erode andenlarge the well-bore, causing the drilling assembly to fall tothe bottom of the well (Fig. 14). However, it was confirmedthat the fish was still at its original position during the re-entry project.
ii. LUSI has been spewing mud for more than 2 years atimpressive rates; initially around 50,000 m3/day of mud,increasing to around 156,000 m3/day, and currently around80,000 m3/day. Speculations that the fluid is coming from theKujung Formation are inconsistent with the known reservoirproperties and water chemistry of the Kujung Formation. Theproductivity of LUSI is in the order of at least 150 times that ofKujung reservoir (Nawangsidi, 2007).
iii. Temperature and Sonan logging was carried out during therelief well campaign to look for evidence of an undergroundblowout. These logs were run on 20th of July 2006 (over 50days after the first mud flow) to the top of fish (2984 feet or910 m) in the re-entered Banjarpanji-1 well. The Sonan logwas ‘very quiet’ which indicated the absence of fluid flowbehind casing (Fig. 13A. The temperature logs showed 60 �C,and did not record any abnormal shift or anomaly within theBanjarpanji-1 well (Fig. 13B). If LUSI originated and wasflowing near the well, the temperature would show a markedincrease given the high temperature of the erupting mud(95 �C). Both the Sonan and Temperature logs did not suggestany near well bore fluid flow.
5.5. Well reports
Key operational data and daily reports are attached in theAppendix G to enable interested readers to perform their ownassessment on the events in the rig during the critical period. Theseare actual operational data from a real life complex drilling oper-ation. Some of these operational data are incomplete and oftenconflicting with each other and can be interpreted differentlydepending on how much effort and drilling experience the indi-vidual reader possesses.
The critical data include:
- Daily drilling reports- Daily geological reports- Daily mud loggers reports- Real time data plot (Fig. 9)
6. Conclusion
LUSI is a new mud volcano in a region prone to mud volcanism.Along the vicinity of the Watukosek fault, where LUSI is situated,there are at least five other known mud volcanoes.
The Banjarpanji-1 well was planned and drilled according tostandard industry practice for high pressure exploration wells. Keylearnings from offset wells were incorporated into the design of thewell. The safety factor applied was consistent with accepted explora-tion well standards, and in fact was higher than offset wells targetingthe same Kujung carbonate formation, that have longer open holesections. Drilling operations were performed by a qualified drillingcontractor and supported by quality service companies. The result wasminimal down-hole drilling problems right until the time of theYogyakarta earthquake, where a serious loss of mud problem occurred.
Analysis and its sensitivity test presented in this paper shows thatthe weakest point in the well, the deepest casing shoe, remainedintact and was not breached. Evidence further suggests that:
- The kick was killed within three hours and the well was dead.The well no longer had any pressure to support an under-ground blowout process.
- The well was circulated on an opened BOP; this is not possiblein an underground blowout situation.
- With the BOP opened the path of least resistance is up throughthe well head and not through the formation. Nothing flowedfrom the well head while a major eruption was blowingnearby.
- High injection test pressures on the well confirmed that theshoe was intact and there were no channels formed betweenthe well and the eruption.
- The well remained full and did not sustain any drilling mudlosses throughout the eruption. Chemical analysis from theerupted mud did not contain any drilling mud particles. Itindicates that the mud eruption did not originate from thewell.
- The mud eruption rate was at least an order higher than thereservoir ability to flow into and up through the well bore. Atthis flow rate, the flow is more likely to pass through a faultplane instead of a well.
- Temperature and Sonan logs result showed the absence ofa near casing fluid flow that is characteristic of an undergroundblowout.
Operational data are now opened to the public and scientificcommunity and presented for the first time in this paper. Our dataleads to the conclusion that LUSI was not triggered by an under-ground blowout. The authors welcome future studies based on thisdata that will help improve our understanding on the origin of mudvolcanoes.
Acknowledgements
The authors express appreciation to the management of BPMI-GAS, Lapindo-Brantas Inc. and its partners for their support andpermission to publish the paper. Numerous constructive discus-sions and inputs from drilling engineers and geoscientists are alsoappreciated.
Appendix A: Banjarpanji-1 well design
The Banjarpanji-1 well was drilled as an exploration well withthe Miocene Kujung or Prupuh to Tuban carbonates as its primaryobjective. These carbonate reservoirs are proven and prolific oil andgas reservoirs and the target of most deep exploration wellsthroughout East Java. A seismic section through Banjarpanji-1 isshown in Fig. 5.
Banjarpanji-1 was recognized as a High Temperature and HighPressure (HTHP) well early in the planning phase, and this neces-sitated an increased focus on offset geological and operationalbenchmark data to ensure a safe and efficient design and operation.For Banjarpanji-1 well planning, the key offset wells were:
� Huffco Porong-1, 6 km away. Porong-1 provided the mostrelevant drilling information and geological data in the deepportion of the well. The well experienced fluid kicks in theoverpressure zones and losses while penetrating the deepercarbonate section.� Huffco Wunut-2, 1.5 km away. Wunut �2 supplemented
information on the shallow section, as it is the closest well to

N. Sawolo et al. / Marine and Petroleum Geology 26 (2009) 1766–1784 1781
Banjarpanji-1 and both wells are within the Wunut anticlinestructural closure. Lessons from this well were applied tocombat the highly reactive overpressured shale.� Mobil Oil BD-1 and BD-2, over 50 km away. The BD-1 and BD-2
are twin wells with two completely different results; one full ofdrilling problems and the other trouble free. The main designdifference is that in the second well, the 9-5/800 casing was setinside the carbonate section. These two wells provided muchinsight into how deep carbonate wells in East Java should beplanned and executed.� Kodeco KE-11E and KE-11G, 30 km away. The KE-11E well
successfully drilled the Kujung carbonate by setting the 9-5/800
casing at the top of the carbonate section. The KE-11G was drilledto over 15,500 ft (4730 m) but did not find the objective. Thesewells are good examples of how deep wells should be drilled.� Santos Jeruk-1 and Jeruk-2, 28 km away. Jeruk-1 encountered
kick and loss problems and provided good lessons for designand drilling of later wells. Jeruk-2 was drilled successfully byhaving its 9-5/800 casing set inside the top of the KujungFormation, and provides further benchmark data ona successful drilling strategy.
Operational insights from the offset wells were incorporatedinto the design, operational procedures and risk mitigation plansfor Banjarpanji-1. The two key learnings incorporated in the welldesign were:
� The importance of setting the 9-5/800 casing inside the top ofthe Kujung Formation, and� The use of synthetic oil based mud to drill the highly reactive
and overpressured shale sequence.
Appendix B: length of the open hole section
The length of the open hole in a well is typically dictated bythree constraints, which are:
1 Kick Tolerance limit (safety consideration)2 Geological constraints3 Other drilling constraints
Kick tolerance is the amount of volume and pressure of gasinflux at bottom-hole conditions that can be safely taken, shut-inand circulated out of the well without fracturing the weakest point,generally at the casing shoe. The volume (measured in bbls) of thekick refers to the amount of gas influx that is allowed to be takeninto the well-bore. The intensity (measured in ppg) of the kicktolerance refers to the increase in mud weight required to balancethe formation pressure. There are no industry standards for KickTolerance as it is very much case specific. Companies set their ownstandards based on their experience of drilling in the area (UnocalOperating Guideline, 1998). In Banjarpanji well, the operator and itspartners agreed to use a kick tolerance of around 10 bbl (1590 l) and0.5 ppg (0.59 MPa/km) gas kick, while nearby, a company withmore drilling experience drilling the Kujung formation, used kicktolerances as low as 0 bbls and 0 ppg (0 L and 0 MPa/km).
In Banjarpanji well, there was no constraint due to Kick Toler-ance since the LOT was high (16.4 ppg or 19.3 MPa/km) and theMud Weight was lower than expected (14.7 ppg or 17.3 MPa/km).Therefore, with the agreed pre-defined Kick Tolerance limit it wasdeemed safe to drill to around 9400 ft (2865 m) total depthprovided there were no increases in mud weight. In this particularcase, the need to increase mud weight with depth was unlikelysince the formation drilled were permeable sandstones.
The Geological constraint is the carbonate formation. As peragreed well plan and lessons learned from offset wells, the shoewas to be set 10–20 feet (3–6 m) into the tight hard pan on the topof the carbonate. The top of the carbonate section is generally foundto be tight with a thickness of around 50 ft (w15 m) where no fluidloss is expected. Below this cap, a pore pressure reversal is observedin offset wells where loss circulation is likely to be encountered.This setting of 9-5/800 casing inside the carbonate cap allows theover pressured zone overlying the Kujung Formation to be isolatedsuch that drilling could then continue into the lower pressuredcarbonate formation using a lower mud weight.
This carbonate section was not found at the prognosed depth at8500 ft (2591 m), but based on predictive electric log result, the topof Kujung formation and hence the setting depth of the 9-5/800
casing shoe could be as deep as 9600 ft (2926 m). Setting the casingat the very top of the Kujung Formation was an important part ofwell plan and accordingly frequent bottoms up circulations ofcuttings were carried out to check if the carbonate formation hadbeen penetrated.
There were no other drilling constraints in this well. The holewas in an excellent shape as evidenced by several trips (three bittrips and six short trips in the hole section) made without any dragor fill. The mud weight was sufficient to contain the formationpressure as there was no unduly high formation gas and connectiongas observed from the well. The Static Influx Test conducted at9010 ft (2746 m) confirmed that the mud weight used was abovethe formation pressure.
All systems were set to drill to the top of the Kujung carbonateor 9400 ft (2865 m) whichever was encountered first. However, theloss of circulation at 9297 feet (2834 m) signaled that the wellcondition had changed substantially and that a casing string mustbe set at this depth once the loss problem had been stabilized. Thesafety of this deeper than proposed casing setting depth was laterverified using commercially available casing-design software, andfound to be acceptable, as shown in Fig. 8.
The physical length of open hole itself is not an issue providedthat the above three criteria are met. As an example two recentoffset wells drilled by other operator nearby to the same objectivehave a longer open hole section (up to 6700 ft or 2042 m) comparedto 5717 ft (1743 m) of this well.
In summary, the operating procedure and well plan followed inthis well is fairly standard and in line with that followed by otheroperators in the area is proven by the number of offset wells. It istherefore believed that factors other than drilling mechanicscaused the mud eruption.
Appendix C: bottom hole pressure estimation
In Banjarpanji, direct methods from the well were used toestimate the bottom hole pressure. These methods have a highdegree of reliability since the factors involved are directly measuredor observed from the well. The result from these methods arecompared with values from calculated methods such as Electriclogs and Drilling Dc-exponent (Bourgoyne et al., 1984) to geta better estimate of the bottom hole pressure.
Engineer’s fill up
This method is based on a physical phenomenon that duringa loss circulation event, the fluid level in the well will fall to a levelthat represents the pressure of the well. When pumping is resumed,the amount of mud pumped in the well until the first sign of fluidreturn is a good estimate of the volume necessary to fill the ‘void’.Knowing the capacity of the drill pipe and the annulus, one canestimate the height of the fluid column in the pipe. The weight of the

N. Sawolo et al. / Marine and Petroleum Geology 26 (2009) 1766–17841782
remaining mud column is inferred as the formation pore pressure.This method of calculating the bottom hole pressure is widely usedby field engineers as a quick and reliable bottom hole pressuremeasurement.
Using this procedure, the volume pumped when the first sign offluid return was observed was 2342 pump strokes or 220 bbls(23980 l). The empty column height is therefore 1571 ft (489 m).Assuming a fill up efficiency of 75%, the estimated pore pressure is12.8 ppg (15.06 MPa/km). As a sensitivity test, with a fill up effi-ciency of 70% and 80%, the estimated pore pressure is 13.0 and12.7 ppg (15.30 and 14.94 MPa/km) respectively.
Static influx test
This method is used with good success by a number ofcompanies to estimate the upper limit of the formation pressure. Inthe new literature, this is referred to this as ‘‘micro-influx’’ method.
The mechanism of the method is by simulating a swabbingcondition. Drilling process is halted; the drill pipe is then pulled togenerate swabbing conditions that lower down-hole pressure. Alowering of pressure by 0.5–1.0 ppg (0.59–1.18 MPa/km) is expectedas a result of this induced swabbing. If the mud weight in the well-bore was in close balance with the formation pressure, then anunder-balance condition will develop that induce an influx ofhydrocarbon in the well-bore. The well is then circulated to observethe characteristics of the fluid at bottoms out. Unusually high gascontent would indicate a close balance between the pore pressureand the mud weight, and would provide a good estimate of theformation pressure.
In Banjarpanji-1, the shut-in test was conducted several timeswith the deepest at 9010 ft (2746 m), all with negative results (noinflux observed). Since the mud weight in the wellbore was14.7 ppg (17.29 MPa/km), it was inferred that the formation porepressure is of the order of 13.7 ppg (16.12 MPa/km) or lower.
Mud weight
The mud weight used to drill to total depth was 14.7 ppg(17.29 MPa/km). At total depth, the well suffered a loss, whichmeans the pore pressure of the well must be lower than and cannotbe any higher than the mud weight. If the pore pressure is higherthan the mud weight, the well would have suffered a kick instead ofa loss. Therefore 14.7 ppg (17.29 MPa/km) is the absolute upper endof the pore pressure.
Indirect methods
The bottom hole pressure estimation using these methods areshown in Fig. 10 (upper picture). These are the result from othersources, with the following ‘most likely’ pore pressure at thebottom of the hole:
a. Dc exponent (source Elnusa) ¼ 13.5–14.0 ppg (15.88–16.48MPa/km)
b. Resistivity log (source Singh and Dusseault) ¼ 12.5–13.5 ppg(14.71–15.88 MPa/km)
c. Sonic log (source Schlumberger) ¼ 12.8–13.0 ppg (15.06–15.30MPa/km).
Summary of bottom hole pressure estimation
The results of these pressure estimation methods, is shown inFig. 10 (bottom picture). These results suggest the following:
1. The best estimate of the bottom hole pressure is around12.8 ppg (15.06 MPa/km).
2. The bottom hole pressure is unlikely to be over 13.7 ppg(16.12 MPa/km), with the highest possible bottom hole pres-sure of 14.7 ppg (17.29 MPa/km)
In the Pressure Analysis section, the bottom hole pressure usedis 12.8 ppg (15.06 MPa/km). The sensitivity test is performed witha maximum bottom hole pressure of 14.7 ppg (17.29 MPa/km).
Appendix D: other pressure data
Shut in Casing Pressure
The maximum Casing Pressure of 1054 psi (7.27 MPa) is basedon the mud logger’s real time data (RTD) of May 28th, 2006. Thiscasing pressure is considered reliable, as it is stable around 36 minafter shut in, and remained constant until it was bled off as part ofthe well control procedure, as shown in Fig. 9 (upper picture).
The (lower) pressures recorded at the choke and obtainedminutes after the well was shut-in are not considered valid indi-cations of well bore pressure. For example, the Initial Shut InCasing Pressure (ISICP) reading of 350 psi (2.41 MPa) was notstable and tended to increase. This increasing trend is believed tobe due to the migration of influx fluid up the wellbore replacingthe drilling mud.
Fluid density of the influx
The well took a fluid influx of around 360 bbls. (57,240 l), whichrepresents approximately 30% of the hole volume. Accuratemeasure of the total influx is difficult to estimate because a numberof operation that was ongoing at the time.
This influx fluid migrated to the upper section of the wellbecause of its lighter density. When the annulus pressure reachedits stable period, it is likely that the whole volume of influx hasreached the surface and that the exchange of mud and influx is nowcompleted.
During the kill process, this influx was circulated out and thewell was bled off. The influx fluid was found to be saline water witha density of 8.9 ppg (10.47 MPa/km), as shown in the well’s IADCreport and the drilling morning report dated May 29th, 2006.
13-3/800 casing shoe Leak Off Test
A casing shoe leak off test (LOT) measures the strength of theformation at the casing shoe, which is the ability of the open-holewell-bore to resist fracturing. To calculate the LOT, the data neededis the casing shoe depth, the mud weight and the surface pressure.
Traditionally, a LOT involves injecting mud into the formationuntil it ‘leaks’. The pressure when the formation starts to leak iscalled the ‘Leak Off’ pressure. However, when compressible oil-based mud is used, this traditional method is less reliable asrepeatability is poor and choosing the leak-off pressure issubjective.
To have a better reliability, The LOT is done is by injecting mudinto the formation until the injection pressure stabilize, stop thepump, and measure the ‘closing pressure’. This ‘closing pressure’ isequal to the ‘opening pressure’ of the formation and thus the LeakOff Test pressure (Unocal Operating Guideline, 1998). This tech-nique has better repeatability and reduces any subjectivity inpicking the leak off point. This LOT technique, however, maypresent a safety issue in the hard rock country since the fracturecaused may be difficult to heal.

N. Sawolo et al. / Marine and Petroleum Geology 26 (2009) 1766–1784 1783
In Banjarpanji well, at the 13-3/800 casing shoe the ‘closing pres-sure’ was 400 psi (2.76 MPa) (Drilling morning report May 6, 2006).With the casing shoe depth of 3580 feet (1091 m) and the mud weightof 14.2 ppg (16.71 MPa/km), the LOT is 16.4 ppg (19.29 MPa/km)(Fig. 11, left picture). The quality of this data is high since it wasmeasured at the cementing pump and witnessed by the drillingsupervisor who had access to both pressure and volume readings.
This value is consistent with LOT results from nearby Wunut wells(NW, approximately 1.5 km away) and Tanggulangin wells (NE,approximately 3 km away). This was expected, as the shallow sectionof Banjarpanji-1 lies within the Wunut anticlinal structure. This valueis however, significantly higher than the shallow section of Porongwell (NE, approximately 6 km away). Leak Off Test results of thesefields including Banjarpanji well are shown in Fig. 11 (right picture).
Appendix E: pressure analysis – graphical method
The data to perform this pressure analysis is obtained fromAppendices C and D, as follows:
a. Maximum casing pressure ¼ 1054 psi (7.27 MPa)b. Fluid in the upper part of the hole (influx fluid) ¼ 8.9 ppg
(10.47 MPa/km)c. Fluid in the bottom part of the hole (mud) ¼ 14.7 ppg
(17.29 MPa/km)d. Bottom hole pressure (BHP) ¼ 12.8 ppg (15.06 MPa/km)e. Leak off test (LOT) at the casing shoe (3580 ft or 1091m) ¼ 16.4
ppg (19.29 MPa/km)
Fig. 8B graphically plots the various pressures and gradients by:
i. Plotting the maximum annulus surface pressure of 1054 psi(7.27 MPa) at the surface.
ii. Drawing a line down from the 1054 psi (7.27 MPa) surfacepressure, using the 8.9 ppg (10.47 MPa/km) influx fluidgradient.
iii. Plotting the BHP of 12.8 ppg (15.06 MPa/km) at 9297 feet(2834 m) (bottom of well).
iv. Drawing a line up from the BHP, using the 14.7 ppg(17.29 MPa/km) oil-based mud gradient.
v. These two lines intersect at around 6000 feet (1829 m). Thisdepth is consistent with the large amount of water influxtaken into the well.
vi. Graphically, the pressure at the casing shoe depth is found tobe 2710 psi (18.68 MPa).
Mathematically, the wellbore pressure at the casing shoe is asfollows:Pressure at casing shoe ¼ Maximum casing pressure
þhydrostatic pressure of fluid
P@3580 ¼ 1054þ ð0:052� 8:9� 3580Þ¼ 2710 psið18:68 MPaÞ
This is equivalent to a fluid hydrostatic pressure of 14.6 ppg(17.1 MPa/km), much lower than the LOT pressure (16.4 ppg or19.29 MPa/km). Therefore the shoe was still intact and unlikely tohave been compromised.
Appendix F: observation
Timing of Earthquake and Drilling Mud Losses
The Banjarpanji-1 well suffered two mud losses which coin-cided with the time of the main earthquake and its after-shocks.
At 9277 feet (2828 m), the first mud loss of 20 bbls (3180 l) wasrecorded at 06:02 h on May 27th, 2006, some seven minutes afterthe 6.3 Richter Scale magnitude Yogyakarta earthquake, (Fig. 12A).The tremors from the earthquake were felt at the rig site. The mudlosses healed, and drilling continued. Cutting samples circulatedfrom bottom at this depth showed the gas readings, lithology andbiota were unchanged, and the calcimetry was constant at 4.4%carbonate.
At 9297 ft (2834 m), the second mud loss was recorded at12:50 h on May 27th, 2006 (Fig. 12B), less than two hours after twomajor aftershocks that followed the main earthquake. The wellexperienced a total loss of circulation.
The timing of the earthquake and two mud loss events suggeststhat despite the 260 km distance to the earthquake epicenter, theearthquake had an impact down hole in the Banjarpanji-1 well.
Not a typical carbonate mud loss event
The second mud loss was a complete loss of return, with a totalloss of mud of approximately 130 bbls (20,670 l). In order to curethe loss, a pill of 60 bbls (9540 l) of loss circulation material (LCM)was pumped, and the losses cured. The bit was pulled four standsoff bottom (to 8737 feet or 2663 m) and the mud was circulatedwhile monitoring the condition of the well.
After the well suffered a complete loss of returns, the rig crewanticipated and was ready for a kick that typically follows sucha major loss of mud. However, a kick did not eventuate even aftereight hours of close observation. This was not a usual loss-and-kicksequence that typically occurs in carbonate formations such as thatrecorded at Porong-1
The other unusual characteristic of the major loss event was thatit was easily cured; simply by pumping 60 bbls (9540 l) of losscirculation material (LCM). If this major loss had occurred ina permeable formation such as a fractured carbonate, then curing itwould typically require much more time and involve multiple pillsand different types of treatments including cement plugs. Forexample, in the offset Porong-1 well, curing the loss of circulationrequired multiple pills of LCM and finally a bentonite squeeze wasused.
This suggests that the loss may not be to a carbonate formationbut due to other causes, such as to a suddenly reactivated faultsystem creating an isolated fracture through the Banjapanji-1wellbore. If the earthquakes created a fracture in this well, then it isvery likely that they created many other fractures and openedexisting fractures/faults in the area. Such re-activation of regionalfaults may have triggered the LUSI mud volcano.
Pulling out drill string and kick
The trip out was done slowly, on an average of 5 min per stand,and no over-pull was recorded. This lack of over-pull is consistentwith a good hole penetrating hard volcanoclastic sandstones andshale drilled with a synthetic oil base mud. Similarly, multiple tripsin and out of this hole section had not reported any drag or fill.Electric logs run at 8750 feet (2,667 m) had shown ‘gun barrel’ holeconditions. The trip details extracted from the real time data aresummarized in Table 2.
The pumping of mud to compensate for drill pipe displacement,the slow five minutes per stand pulling speed, the absence of anyover-pull and the excellent condition of the wellbore, make it veryunlikely that the pulling out of hole operation provoked an influx(swabbing).

N. Sawolo et al. / Marine and Petroleum Geology 26 (2009) 1766–17841784
Unconventional influx
During the pulling out of hole operation, a large water influxentered the wellbore. The combination of high influx rate and lateBOP shut in resulted in a high influx volume of around 360 bbls(57,240 l) that was taken into the wellbore. Accurate measure of thetotal influx is difficult to estimate because a number of operationswere ongoing simultaneously. Despite all this, this kick was easilykilled.
The real time data showed that the kick was killed and the welldied within three hours after the BOP was shut in (Fig. 9). Thisbehavior was in stark contrast to the Kujung Formation loss andkick incident in Porong-1, which took six days to kill. This againsuggests that the influx may not be from a carbonate formation butsimilar to one that caused the losses of drilling mud a day earlier.
Appendix G. Supplementary data
Drilling data during the critical times from May 25th to June 4th,2006 include 1. Daily drilling morning reports, 2. Daily geologicalreports and 3. Daily mud logger’s reports which can be found in theonline version, at doi:10.1016/j.marpetgeo.2009.04.002.
References
Abel, L.W., Bowden Sr., J.R., Campbell, P.J., 1994. Firefighting and Blowout Control.Wild Well Control, Inc. 52–56.
Bourgoyne Jr., A.T., Chenevert, M.E., Millheim, K.K., Young Jr., F.S., 1984. AppliedDrilling Engineering. In: SPE Textbook Series, vol. 2 252–285.
Cyranoski, D., 2007. Indonesian eruption: Muddy waters. Nature 445, 812–815.Daly, M.C., Hooper, B.G.D., Smith, D.G., 1987. Tertiary plate tectonics and basin
evolution in Indonesia. In: Proceeding 16th IPA Convention.Davies, R.J., Swarbrick, R.E., Evans, R.J., Huuse, M., 2007. Birth of a mud volcano: East
Java, 29 May 2006. GSA Today vol. 17, 4–9.Davies, R.J., Brumm, M., Manga, M., Rubiandini, R., Swarbrick, R., Tingay, M., 2008.
The East Java mud volcano (2006 to present): an earthquake or drilling trigger?Earth and Planetary Science Letters 272, 627–638.
Duyfjes, J., 1936. Zur Geologie und Stratigraphie des Kendeng-gebietes zwischenTrinil und Soerabaja (Java). De Ingenieur in Ned. Indie, Sect IV (8), 136–149.
Duyfjes, J.,1938. Toelichting bij Blad 116 (Sidoardjo), Geologische Kaart van Java Schaal1: 100.000. Dienst van den Mijnbouw in Nederlandsch-Indie, Bandung. 79 hal.
Hall, R., 2001. Cenozoic reconstructions of SE Asia and the SW Pacific: changing thepatterns of land and sea. In: Metcalfe, I., Smith, J.M.B., Morwood, M.,Davidson, I.D. (Eds.), Faunal and Floral Migrations and Evolution in SE Asia,Aı Australasia. Lisse: A.A. Balkema (Swets & Zeitlinger Publishers), pp. 35–56.
Hamilton, W., 1979. Tectonics of the Indonesian region. U.S. Geological SurveyProfessional Paper 1078, 345.
Kadar, D., 1986. Neogene Planktonic Foraminifera1 Biostratigraphy of the SouthCentral Java area, Indonesia. In: Spec. Publ., vol. 5. Geol. Res. Dev. Centre,Bandung. 1–82.
Kadar, A.P., Kadar, D., Aziz, F., 2007. Pleistocene stratigraphy of Banjarpanji#1 welland the surrounding area .In: Proceedings of the International GeologicalWorkshop on Sidoarjo Mud Volcano, Jakarta, IAGI-BPPT-LIPI, February 20–21,
2007, Indonesia Agency for the Assessment and Application of Technology,Jakarta.
Koesoemadinata, R.P., 1980. Geologi Minyak dan Gas Bumi. Penerbit ITB, Bandung.Longley, I.M., 1997. The tectonostratigraphic evolution of SE Asia. In: Fraser, A.J.,
Matthews, S.J., Murphy, R.W. (Eds.), Petroleum Geology of Southeast Asia.Geological Society Special Publication, No. 126.
Mazzini, A., Akhmanov, G.G., Svensen, H., Planke, S., 2007a. Pulsating mud volca-nism at LUSI. In: Proceedings of the International Geological Workshop onSidoarjo Mud Volcano, Jakarta, IAGI-BPPT-LIPI, February 20–21, 2007, IndonesiaAgency for the Assessment and Application of Technology, Jakarta.
Mazzini, A., Svensen, H., Akhmanov, G.G., Aloisi, G., Planke, S., Malthe-Sørenssen, A.,Istadi, B., 2007b. Triggering and dynamic evolution of LUSI mud volcano,Indonesia. Earth and Planetary Science Letters 261, 375–388.
Nawangsidi, D., 2007. In search of theory on flow mechanism of wild mud blow. In:Proceedings of the International Geological Workshop on Sidoarjo MudVolcano, Jakarta, IAGI-BPPT-LIPI, February 20–21, 2007, Indonesia Agency forthe Assessment and Application of Technology, Jakarta.
Prasetyadi, C., Suparka, E.R., Harsolumakso, A.H., Sapiie, B., 2006. The occurrenceof a newly found eocene tectonic Melange in Karangsambung area, CentralJava. In: Proceedings. IAGI 35th Annual Meeting and Exhibition, Pekanbaru,October 2006.
Rubiandini, R., Maarif, A.S., Wahid, S., Sukiadi, T.K., Wijoyo, S., Wibisono, Y.,Saleh, M., Sumanta, K., SuhartoPrastiyo, Rohi, P.A., Julianto, M.D., 2008. In:Haryono, M.Y. (Ed.), To Kill Lapindo’s well (Indonesian version). GMLL, Jakarta.
Satyana, A.H., 2007. Geological disaster on the falls of Jenggala and MajapahitEmpires: a hypothesis of historical mud volcanoes eruptions based on historicalchronicles of Kitab Pararaton, Serat Kanda, Babad Tanah Jawi; Folklore of TimunMas; Analogue to the Present LUSI Eruption; and Geological Analysis of theKendeng Depression – Brantas Delta, Joint Convention Bali 2007, the 36th IAGI,the 32nd HAGI, and the 29th IATMI, Annual Convention and Exhibition, Bali,13–16 November 2007.
Schiller, D.M., Seubert, B.W., Musliki, S., Abdullah, M., 1994. The Reservoir Potentialof globigerinid Sands in Indonesia. In: Proc. 23rd Annual Convention Proceed-ings of Indonesian Petroleum Association, vol. 1, p.189ff.
Smyth, H., Hall, R., Hamilton, J., Kinny, P., 2005. East Java: Cenozoic basins, volcanoesand Ancient basement. In: Proceedings 30th IPA Convention, pp. 251–266.
Smyth, H., Hamilton, P.J., Hall, R., Kinny, P., 2007. The deep crust beneath island arcs:inherited Zircons reveal a Gondwana continental fragment beneath East Java,Indonesia. Earth and Planetary Science Letters 258, 269–282.
Sribudiyani, Prasetya, I., Muchsin, N., Sapiie, B., Ryacudu, R., Asikin, S., Kunto, T.,Harsolumakso, A.H., Astono, P., Yulianto, I., 2003. The collision of the East JavaMicroplate and its implication for hydrocarbon occurrences. In: The East JavaBasin, 29th Annual Convention Proceedings of Indonesian PetroleumAssociation.
Sudarman, S., Hendrasto, F., 2007. Hot mud flow at Sidoarjo. In: Proceedings of theInternational Geological Workshop on Sidoarjo Mud Volcano, Jakarta, IAGI-BPPT-LIPI, February 20–21, 2007, Indonesia Agency for the Assessment andApplication of Technology, Jakarta.
Sutriono, E., 2007. Pemboran Sumur Eksplorasi Banjarpanji-1. In: Proceedings of theInternational Geological Workshop on Sidoarjo Mud Volcano, Jakarta, IAGI-BPPT-LIPI, February 20–21, 2007, Indonesia Agency for the Assessment andApplication of Technology, Jakarta.
Tingay, M., Heidbach, O., Davies, R., Swarbrick, R., August 2008. Triggering of theLusi mud eruption: earthquake versus drilling initiation. GEOLOGY 36 (8),639–642.
Unocal Drilling Department Operating Guideline and Procedure: Casing DesignParameter and Standard Leak Off Test (LOT) Procedure, 1998, revision 2.0.
Willumsen, P., Schiller, D.M., 1994. High quality volcaniclastic sandstone reser-voirs in East Java, Indonesia. In: IPA, 23rd Annual Convention, vol. I, pp.101–111.