Embed Size (px)
Citation preview

Gender Identity and Relative Income within Households
Marianne Bertrand, Emir Kamenica, Jessica Pan2015, QJE
Presantation: Ehsan Sabouri KenariSeptember 23, 2019
. .. .. .. .. .. .. .. .. .. .. .. .. .. .. .. .. .. .. .. .

Outline
1 Introduction
2 Marriage Rates and Relative Income
3 Women’s Labor Supply and Relative Income
4 Marital Stability and Relative Income
5 Home Production and Relative Income
. .. .. .. .. .. .. .. .. .. .. .. .. .. .. .. .. .. .. .. .

...
.
...
.
...
.
...
.
...
.
...
.
...
.
...
.
...
.
...
.
Introduction
Over the last half a century, women have experienced substantial labormarket gains.the gender gap in labor force participation and the gender gap in earn-ings have both declined.5 Despite these gains, substantial gender gapsremain, both in labor force participation and in earnings.Female labor force participation appears to have plateaued since theearly to mid-1990s (Blau and Kahn 2006)This halted progress has led researchers to consider less traditionalfactors that might influence the gender gap in labor market outcomes(Bertrand 2010)
Gender Identity and Relative Income September 23, 2019 1 / 18

...
.
...
.
...
.
...
.
...
.
...
.
...
.
...
.
...
.
...
.
Distribution of Relative IncomeData: Survey of Income and Program Participation (SIPP), linked toadministrative data on income from the Social Security Administration
McCrary (2008) test for the discontinuity of the distribution functionestimates that the distribution drops by 12.3 percent ( p < .01).
Gender Identity and Relative Income September 23, 2019 2 / 18
...
.
...
.
...
.
...
.
...
.
...
.
...
.
...
.
...
.
...
.
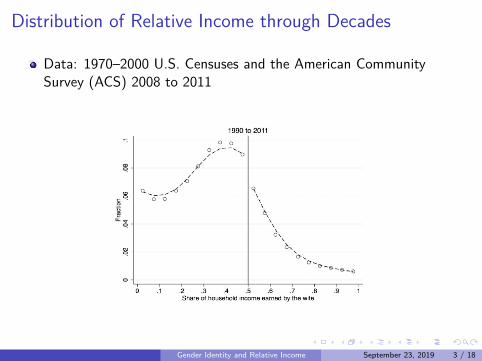
Distribution of Relative Income through Decades
Data: 1970–2000 U.S. Censuses and the American CommunitySurvey (ACS) 2008 to 2011
Gender Identity and Relative Income September 23, 2019 3 / 18

Outline
1 Introduction
2 Marriage Rates and Relative Income
3 Women’s Labor Supply and Relative Income
4 Marital Stability and Relative Income
5 Home Production and Relative Income
. .. .. .. .. .. .. .. .. .. .. .. .. .. .. .. .. .. .. .. .
...
.
...
.
...
.
...
.
...
.
...
.
...
.
...
.
...
.
...
.
Marriage Rates
Between 1970 and 2008, the fraction of young adults who are currentlymarried decreased by 30 to 50 percentage points. (Autor 2010)Over the same period, women’s income has greatly increased relativeto that of men.
Question is:how the share of individuals who are currently married varies with the
distributions of men’s and women’s (potential) income?
Gender Identity and Relative Income September 23, 2019 4 / 18

...
.
...
.
...
.
...
.
...
.
...
.
...
.
...
.
...
.
...
.
Data: 1980 to 2000 data from the U.S. Census and the 2008–2011American Community SurveyWe define marriage markets based on race, age group, education group,and the state of residence.For each marriage market m and year t ∈ {1980, 1990, 2000, 2010} Wedefine PrWomanEarnsMoremt .We consider several measures of income
Gender Identity and Relative Income September 23, 2019 5 / 18

...
.
...
.
...
.
...
.
...
.
...
.
...
.
...
.
...
.
...
.
Potential Relative Income and Marriage Market
Gender Identity and Relative Income September 23, 2019 6 / 18

Outline
1 Introduction
2 Marriage Rates and Relative Income
3 Women’s Labor Supply and Relative Income
4 Marital Stability and Relative Income
5 Home Production and Relative Income
. .. .. .. .. .. .. .. .. .. .. .. .. .. .. .. .. .. .. .. .

...
.
...
.
...
.
...
.
...
.
...
.
...
.
...
.
...
.
...
.
Women’s Labor Supply
Fortin (2005) shows that the representation of women as home-makersand men as breadwinners is associated with a low labor force partici-pation by women and a large gender gap in income. (cross country)Fortin (2009) shows that the evolution of gender role attitudes overtime correlates with the evolution of female labor force participation.
Question: Does gender identity distort labor market outcomes ?
Gender Identity and Relative Income September 23, 2019 7 / 18

...
.
...
.
...
.
...
.
...
.
...
.
...
.
...
.
...
.
...
.
Potential Relative Income and Wife’s Labor Force Participation
wifeLFPi =β0 + β1 × PrWifeEarnsMorei
+ wpi + β2 × lnHusbIncomei + β3 × Xi + εi
(1)
Xi represents non-income controls: year fixed effects, state fixed effects,the wife’s and the husband’s race, the wife and the husband’s age group,and the wife’s and the husband’s education level.
Gender Identity and Relative Income September 23, 2019 8 / 18

...
.
...
.
...
.
...
.
...
.
...
.
...
.
...
.
...
.
...
.
Potential Relative Income and Wife’s Labor Force Participation
Gender Identity and Relative Income September 23, 2019 9 / 18
...
.
...
.
...
.
...
.
...
.
...
.
...
.
...
.
...
.
...
.
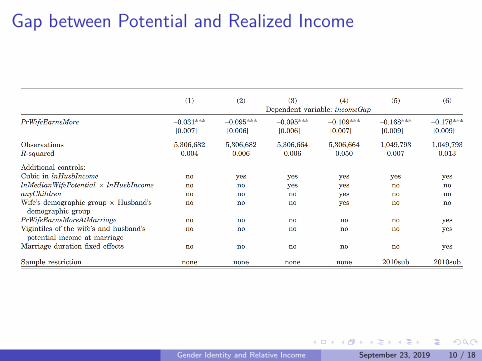
Gap between Potential and Realized Income
Gender Identity and Relative Income September 23, 2019 10 / 18

Outline
1 Introduction
2 Marriage Rates and Relative Income
3 Women’s Labor Supply and Relative Income
4 Marital Stability and Relative Income
5 Home Production and Relative Income
. .. .. .. .. .. .. .. .. .. .. .. .. .. .. .. .. .. .. .. .

...
.
...
.
...
.
...
.
...
.
...
.
...
.
...
.
...
.
...
.
Marital Stability and Relative Incom
Question: Does relative income affect marital stability?
Data: National Survey of Families and Households (NSFH)The NSFH has three questions on marital stability:
1 “Taking things all together, how would you de- scribe your marriage ? ”2 During the past year, “have you ever thought that your marriage might
be in trouble ?”3 “During the past year, have you and your husband/wife discussed the
idea of separating?”
Gender Identity and Relative Income September 23, 2019 11 / 18

...
.
...
.
...
.
...
.
...
.
...
.
...
.
...
.
...
.
...
.
Baseline specification
Baseline specification is:
Yi =β0 + β1 × wifeEarnsMorei
+ β2 × lnWifeIncomei + β3 × lnHusbIncomei
+ β4 × lnTotIncomei + β5Xi + ϵi
(2)
Xi represents non-income controls: region fixed effects, indicator variablesfor whether the wife is working, whether the husband is working, the wifeand the husband’s race and education groups, and a quadratic in the wife’sand the husband’s age.
Gender Identity and Relative Income September 23, 2019 12 / 18

...
.
...
.
...
.
...
.
...
.
...
.
...
.
...
.
...
.
...
.
Relative Income and Marital Satisfaction
Gender Identity and Relative Income September 23, 2019 13 / 18

...
.
...
.
...
.
...
.
...
.
...
.
...
.
...
.
...
.
...
.
Relative Income and DivorceFor each couple in Wave 1 (1987–88), we construct a binary variabledivorcedi which is equal to 1 if the couple is separated or divorced whenthey are reinterviewed in Wave 2 (1992–94).
Gender Identity and Relative Income September 23, 2019 14 / 18

Outline
1 Introduction
2 Marriage Rates and Relative Income
3 Women’s Labor Supply and Relative Income
4 Marital Stability and Relative Income
5 Home Production and Relative Income
. .. .. .. .. .. .. .. .. .. .. .. .. .. .. .. .. .. .. .. .

...
.
...
.
...
.
...
.
...
.
...
.
...
.
...
.
...
.
...
.
Home Production and Relative Income
Question: when the wife earns more than the husband, does couple changebehavior at home so as to alleviate the sense of gender role reversal?
Data: American Time Use Suvey and the Current Population Survey(2003-2011)Following Aguiar and Hurst (2007), we define chores as “core”non-market work, time spent “obtaining goods and services”, andtime spent in “other” home production.Measure of childcare includes primary child care, educational childcare, , and recreational child care.
Gender Identity and Relative Income September 23, 2019 15 / 18

...
.
...
.
...
.
...
.
...
.
...
.
...
.
...
.
...
.
...
.
Literature
Akerlof and Kranton (2000) report that women do not undertake lessthan half of the house-work even if they work or earn more than thehusbandBittman et al. (2003) report that the extent of the wife’s houseworkdecreases in relative income when she makes less than the husband,but this relationship reverses when relative income exceeds one half.Gupta (2007) and Gupta and Ash (2008) argue that the number ofhours the wife spends on chores is solely determined by her level ofincome, without any regard for her relative income in the household.
Gender Identity and Relative Income September 23, 2019 16 / 18
...
.
...
.
...
.
...
.
...
.
...
.
...
.
...
.
...
.
...
.
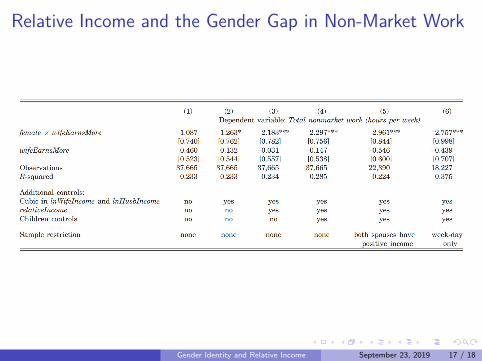
Relative Income and the Gender Gap in Non-Market Work
Gender Identity and Relative Income September 23, 2019 17 / 18

...
.
...
.
...
.
...
.
...
.
...
.
...
.
...
.
...
.
...
.
Conclusion
We show that the social norm “a man should earn more than his wife”influences the distribution of relative income within households, thepatterns of marriage and divorce, women’s labor supply, and the divisionof home production activities between husbands and wives.In future work, we would like to better understand the long-run deter-minants of gender identity.How are gender identity norms evolving in the face of market forcesthat are making those norms increasingly costly?
Gender Identity and Relative Income September 23, 2019 18 / 18

Thank You
. .. .. .. .. .. .. .. .. .. .. .. .. .. .. .. .. .. .. .. .