Embed Size (px)
Citation preview
Disclaimer: This publication constitutes information disclosed to the public and believed to be reliable but its accuracy and completeness are not guaranteed. All opinions,
suggestions, or projections are for informational purposes only and shall not be construed as an inducement for the sale or purchase of securities. Amendments to this publication may be made without prior notice. Investors are urged to exercise caution in making a decision to invest in any securities.
CO
MP
AN
Y R
ES
EA
RC
H |
Co
mp
an
y U
pd
ate
1
March 9, 2018 OUTPERFORM (from NEUTRAL)
Energy Absolute (EA TB)
Share Price: Bt49.5 Target Price: Bt77.0 (+55.6%)
Following Tesla’s footsteps Solid performance for RE business; expect FY18F/19F earnings to
grow by 24%/40% Estimate value of energy storage factory at Bt21.7/sh and Bt28.2
for overseas projects; upside risk from new green biodiesel plant and EV
Upgrade to OUTPERFORM, raised TP to Bt77 (from Bt45); first-mover in ES industry
Solid performance for RE business EA had average capacity factor (CF) of 19-31% in FY17 vs industry average of 18-20%. 126MW Had Kanghan wind farm (HKD) delivered 24.1% CF in 2Q-4Q17, in line with our estimate. Total power output in Jan-Feb 18 hit a new high of 143m kWh (+39% yoy) driven by higher CF of 27.8% at the wind farm while solar energy output slipped 5% yoy. Separately, we trimmed FY18/19F profit by 21%/15% following a delay in COD of 260MW Hanuman (HNM) to 4Q18 from 2Q18, and smaller profit contribution from biodiesel. Overall, we expect FY18F/19F profit to grow 24%/40% supported by full year operation at 126MW HKD and new 260MW HNM. The 1GW energy storage (ES) factory is expected to contribute profit of Bt375m in FY20F. ES to take EA to next s-curve in FY20F Investors may be concerned whether lithium technology will be sustained or disrupted by other technology given EA will be investing Bt2.0bn for infrastructure this year and Bt100bn in the next four years. Li-ion technology, which EA will be using, has 95% ES market share in the US. EA will use its Taiwanese-based Amita (50% owned by EA) to build 50GWh ES factory. Amita has track record of building 250MWh ES factory in Beijing and is now the turnkey contractor for 2GWh Phase 2. This plant will be one of the most advanced ES plants in China. Moreover, IEA estimates RE capacity in Southeast Asia would increase to 75GW by 2040 from 5GW in 2016. If 50% of these capacity installs ES to serve 24 hours, they would require 40GWh of ES capacity annually. EA would be able to capture this demand growth. We value the ES business at Bt49.9/sh, comprising (i) Bt21.7 for the 29GWh ES factory, and (ii) Bt28.2 for 500MWh overseas projects. We see upside from related businesses, i.e. EV and charging stations, and new green biodiesel plant which we have yet to include in our earnings model. More bullish on EA’s energy storage business We value the RE and biodiesel businesses at Bt27/sh. We are optimistic on ES business as EA would benefit from being the first-mover. However, we are cautious on near-term volatility in the stock as share prices have partly priced in the new ES business, which will not contribute earnings until FY20F.
Financial Summary (Btm)
Year to Dec 2016 2017 2018F 2019F 2020F
Sales (Btm) 10,392 11,580 14,069 17,286 22,438
Growth (%) 13 11 22 23 30
EBITDA (Btm) 5,529 6,395 8,264 10,077 10,757
Growth (%) 36 16 29 22 7
Recurring profit (Btm) 3,354 3,757 4,723 6,596 7,253
Growth (%) 21 17 24 40 10
Net profit (Btm) 3,251 3,817 4,723 6,596 7,253
FDEPS (Bt) 0.87 1.02 1.27 1.77 1.94
Growth (%) 21 17 24 40 10
PE (x) 57 48 39 28 25
DPS (Bt) 0.15 0.20 0.63 0.88 0.97
Yield (%) 0.3 0.4 1.3 1.8 2.0
BVPS (Bt) 3.1 4.0 4.6 5.5 6.4
P/BV (x) 16.2 12.5 10.8 9.0 7.7
Karun INTRACHAI
662 - 659 7000 ext 5010
Key Data
12-mth high/low (Bt) 71.25 / 24.3
Market capital (Btm/US$m) 184,635 / 5,886.8
3m avg. turnover (Btm/US$m) 1572.1 / 50.1
Free float (%) 23.6
Issued shares (m shares) 3,730
Major shareholders:
- UBS AG/HONG KONG 29.6
- AHUNAI SOMPHOTE 23.3
- BBL ASSET MGMT CO LT 4.5
Share Price Performance
YTD 1Mth 3Mth 12Mth
Absolute (%) 31.9 6.8 12.9 51.0
Relative to index (%) 22.4 2.5 5.7 37.1
Krungsri Securities vs Market
Positive Neutral Negative
Market Recommend 3 2 4
Krungsri Market % +/-
Target Price (Bt) 77.0 58.3 32.0
’18 Net Profit (Btm) 4,723 6,027 (21.6)
’19 Net Profit (Btm) 6,596 7,965 (17.2)
Krungsri's earnings revision
2018F 2019F
Earnings revision (%) (21) (15) Source: Bloomberg, Krungsri Securities
Company Update | EA
Krungsri Securities Research
2
March 9, 2018
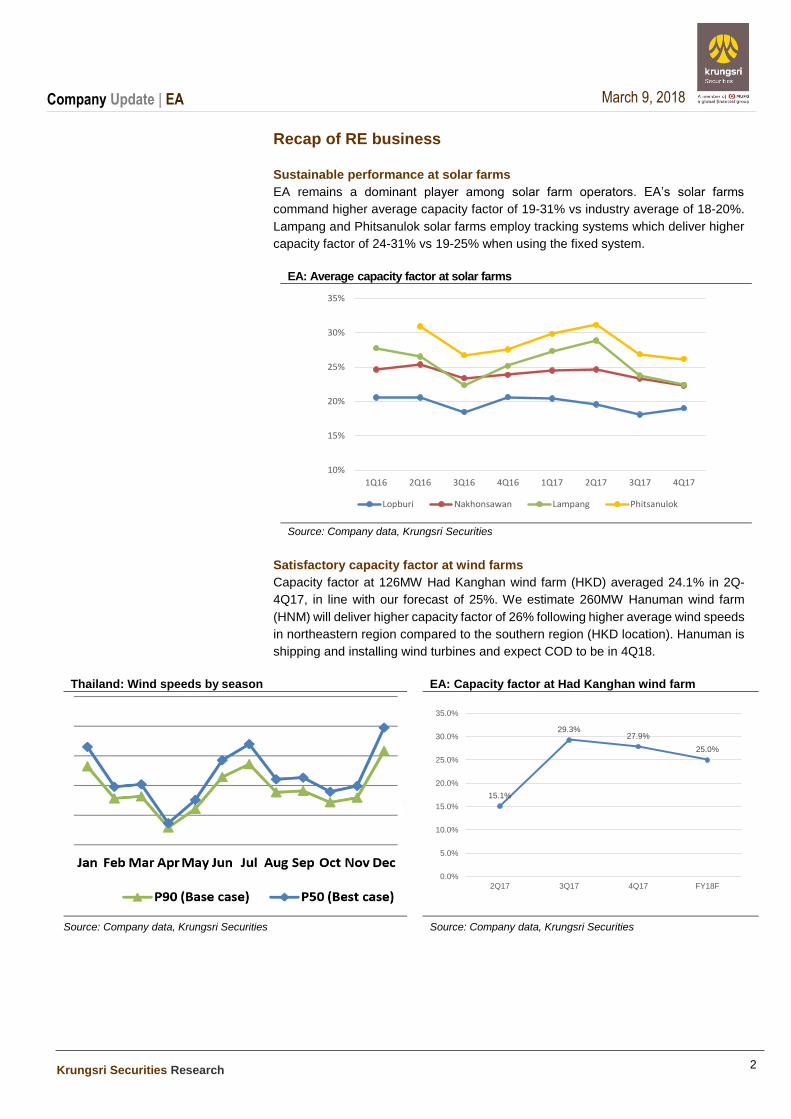
Recap of RE business Sustainable performance at solar farms
EA remains a dominant player among solar farm operators. EA’s solar farms
command higher average capacity factor of 19-31% vs industry average of 18-20%.
Lampang and Phitsanulok solar farms employ tracking systems which deliver higher
capacity factor of 24-31% vs 19-25% when using the fixed system.
EA: Average capacity factor at solar farms
Source: Company data, Krungsri Securities
Satisfactory capacity factor at wind farms Capacity factor at 126MW Had Kanghan wind farm (HKD) averaged 24.1% in 2Q-
4Q17, in line with our forecast of 25%. We estimate 260MW Hanuman wind farm
(HNM) will deliver higher capacity factor of 26% following higher average wind speeds
in northeastern region compared to the southern region (HKD location). Hanuman is
shipping and installing wind turbines and expect COD to be in 4Q18.
Thailand: Wind speeds by season EA: Capacity factor at Had Kanghan wind farm
Source: Company data, Krungsri Securities Source: Company data, Krungsri Securities
10%
15%
20%
25%
30%
35%
1Q16 2Q16 3Q16 4Q16 1Q17 2Q17 3Q17 4Q17
Lopburi Nakhonsawan Lampang Phitsanulok
15.1%
29.3%27.9%
25.0%
0.0%
5.0%
10.0%
15.0%
20.0%
25.0%
30.0%
35.0%
2Q17 3Q17 4Q17 FY18F
Company Update | EA
Krungsri Securities Research
3
March 9, 2018
ES business: Key questions from investors There is currently limited information and details on energy storage technology
because the technology is not commercially available yet. But there has been rapid
developments in recent years and it could play important roles in the utilities,
renewable power and EV markets.
We compiled several important ideas from Greentech Media's Energy Storage
Summit on 12 December, 2017, which was attended by 500 energy industry experts,
to address the key questions posed by investors.
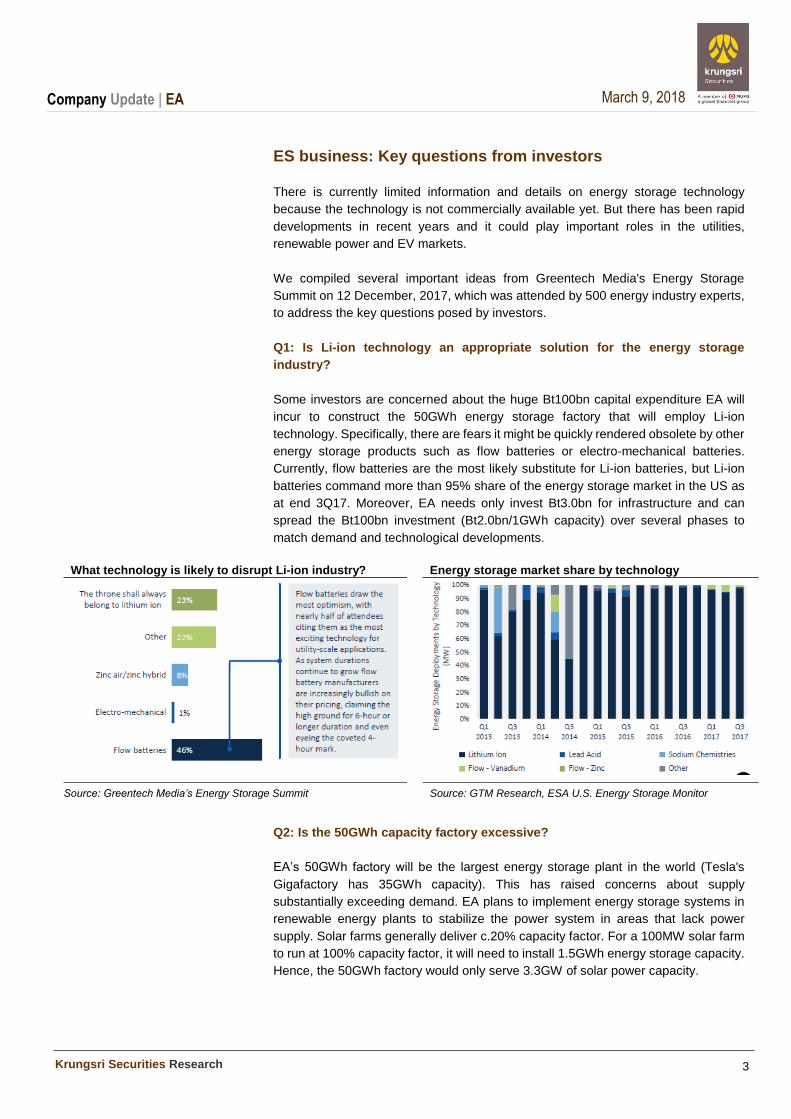
Q1: Is Li-ion technology an appropriate solution for the energy storage
industry?
Some investors are concerned about the huge Bt100bn capital expenditure EA will
incur to construct the 50GWh energy storage factory that will employ Li-ion
technology. Specifically, there are fears it might be quickly rendered obsolete by other
energy storage products such as flow batteries or electro-mechanical batteries.
Currently, flow batteries are the most likely substitute for Li-ion batteries, but Li-ion
batteries command more than 95% share of the energy storage market in the US as
at end 3Q17. Moreover, EA needs only invest Bt3.0bn for infrastructure and can
spread the Bt100bn investment (Bt2.0bn/1GWh capacity) over several phases to
match demand and technological developments.
What technology is likely to disrupt Li-ion industry? Energy storage market share by technology
Source: Greentech Media’s Energy Storage Summit Source: GTM Research, ESA U.S. Energy Storage Monitor
Q2: Is the 50GWh capacity factory excessive?
EA’s 50GWh factory will be the largest energy storage plant in the world (Tesla's
Gigafactory has 35GWh capacity). This has raised concerns about supply
substantially exceeding demand. EA plans to implement energy storage systems in
renewable energy plants to stabilize the power system in areas that lack power
supply. Solar farms generally deliver c.20% capacity factor. For a 100MW solar farm
to run at 100% capacity factor, it will need to install 1.5GWh energy storage capacity.
Hence, the 50GWh factory would only serve 3.3GW of solar power capacity.
Company Update | EA
Krungsri Securities Research
4
March 9, 2018
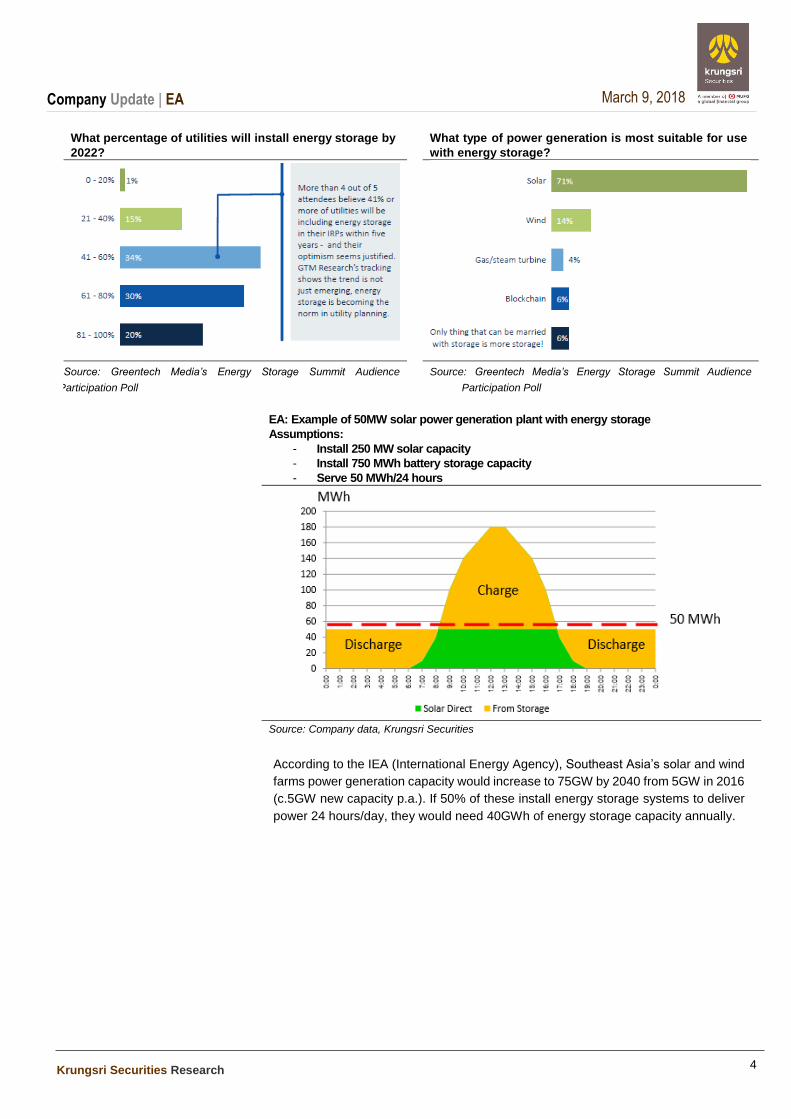
What percentage of utilities will install energy storage by
2022?
What type of power generation is most suitable for use
with energy storage?
Source: Greentech Media’s Energy Storage Summit Audience
Participation Poll
Source: Greentech Media’s Energy Storage Summit Audience
Participation Poll
EA: Example of 50MW solar power generation plant with energy storage
Assumptions:
- Install 250 MW solar capacity
- Install 750 MWh battery storage capacity
- Serve 50 MWh/24 hours
Source: Company data, Krungsri Securities
According to the IEA (International Energy Agency), Southeast Asia’s solar and wind
farms power generation capacity would increase to 75GW by 2040 from 5GW in 2016
(c.5GW new capacity p.a.). If 50% of these install energy storage systems to deliver
power 24 hours/day, they would need 40GWh of energy storage capacity annually.
Company Update | EA
Krungsri Securities Research
5
March 9, 2018
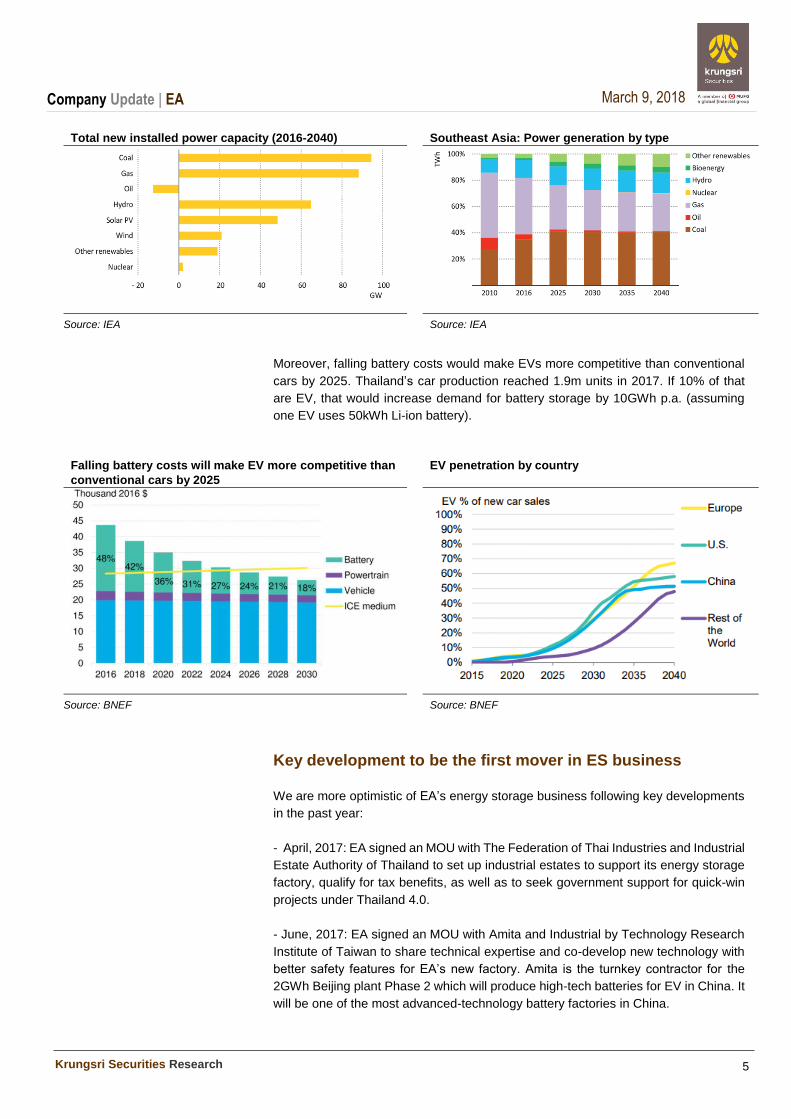
Total new installed power capacity (2016-2040) Southeast Asia: Power generation by type
Source: IEA Source: IEA
Moreover, falling battery costs would make EVs more competitive than conventional
cars by 2025. Thailand’s car production reached 1.9m units in 2017. If 10% of that
are EV, that would increase demand for battery storage by 10GWh p.a. (assuming
one EV uses 50kWh Li-ion battery).
Falling battery costs will make EV more competitive than
conventional cars by 2025
EV penetration by country
Source: BNEF Source: BNEF
Key development to be the first mover in ES business
We are more optimistic of EA’s energy storage business following key developments
in the past year:
- April, 2017: EA signed an MOU with The Federation of Thai Industries and Industrial
Estate Authority of Thailand to set up industrial estates to support its energy storage
factory, qualify for tax benefits, as well as to seek government support for quick-win
projects under Thailand 4.0.
- June, 2017: EA signed an MOU with Amita and Industrial by Technology Research
Institute of Taiwan to share technical expertise and co-develop new technology with
better safety features for EA’s new factory. Amita is the turnkey contractor for the
2GWh Beijing plant Phase 2 which will produce high-tech batteries for EV in China. It
will be one of the most advanced-technology battery factories in China.
Company Update | EA
Krungsri Securities Research
6
March 9, 2018
- September, 2017: EA in collaboration with PTT, The Federation of Thai Industries,
EGAT, MEA, and PEA, appointed Thailand Development Research Institute (TDRI)
to study the benefits of grid energy storage. The result of the study – expected to be
announced in 1H18 - could be a guideline for the government to consider including
energy storage systems in its conventional grid system and renewable energy.
- 21 February, 2018: EA plans to increase its stake in Amita from 50.7% currently to
not more than 70.0% through a voluntary tender offer at TWD80/sh vs TWD70.99/sh
on the disclosure date. Total investment budget would not be more than Bt844m and
will be funded by EA’s internal cash flow. EA will use Amita’s expertise and technology
to complement its energy storage business as well as drive growth in the next few
years.
- December, 2017: EA plans to set up 1,000 EV charging stations across the country
in 2018. This project will not contribute significant profits to EA but would complement
its energy storage operation because sufficient EV charging stations will encourage
the use of EV. Moreover, EA plans to introduce a prototype EV model at the Bangkok
International Motor Show to be held in late March this year.
- January 2018: EA will order all its coating machines from Toray, a global supplier
listed on Tokyo Stock Exchange with over 90% market share. This would minimize
delay risks for the 1GW factory, as this machine is integral to the Li-ion energy storage
system production process. EA has secured land for the factory and is currently
getting the status changed from green zone to purple zone under the EEC Act. Hence,
it should start construction of the factory in 2Q18 and COD should be in mid-2019.
Valuation of ES business
We value EA’s energy storage business at Bt49.9/sh, comprising two parts:
(i) 50GW energy storage factory
This factory would be EA’s key earnings growth driver from FY20F onwards. COD for
Phase 1 (1GWh) should be late-2019 and it could expand to 50GWh within three
years with several phases of 4GWh each. Our previous assumption of 15GWh
capacity and 15% gross margin was conservative given pending demand from RE
plants, grid power storage, and EV cars. This led us to fine-tune our assumptions of
energy storage valuation as follows:
Company Update | EA
Krungsri Securities Research
7
March 9, 2018
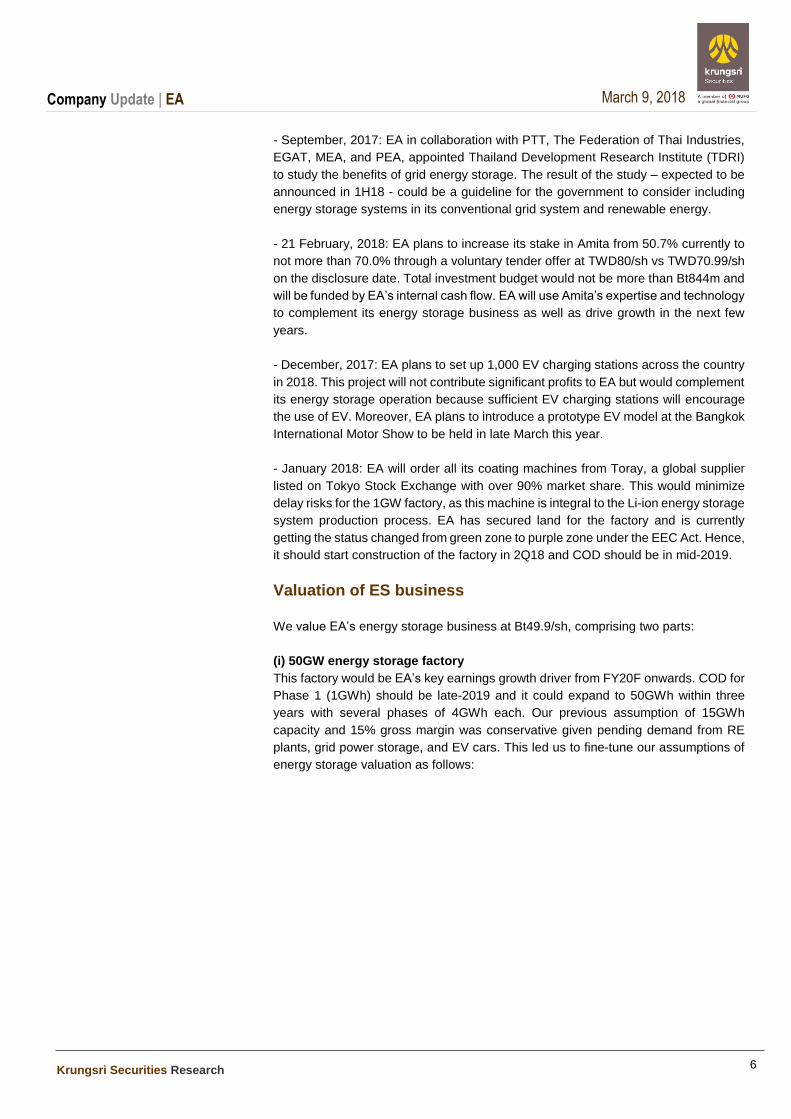
EA: Assumptions for 50GWh energy storage factory
FY20F FY21F FY22F FY23F FY24F
Energy storage price ($US/kWh) 150 150 150 150 150
Exchange rate (USD/THB) 32 32 32 32 32
Energy storage price (Bt/kWh) 4,800 4,800 4,800 4,800 4,800
Capacity (GWh) 1 9 21 29 29
Utilization (%) 100% 100% 100% 100% 100%
Total revenue (Bt mn) 4,800 43,200 100,800 139,200 139,200
Gross margin (%) 12.8% 17.6% 17.9% 17.7% 17.7%
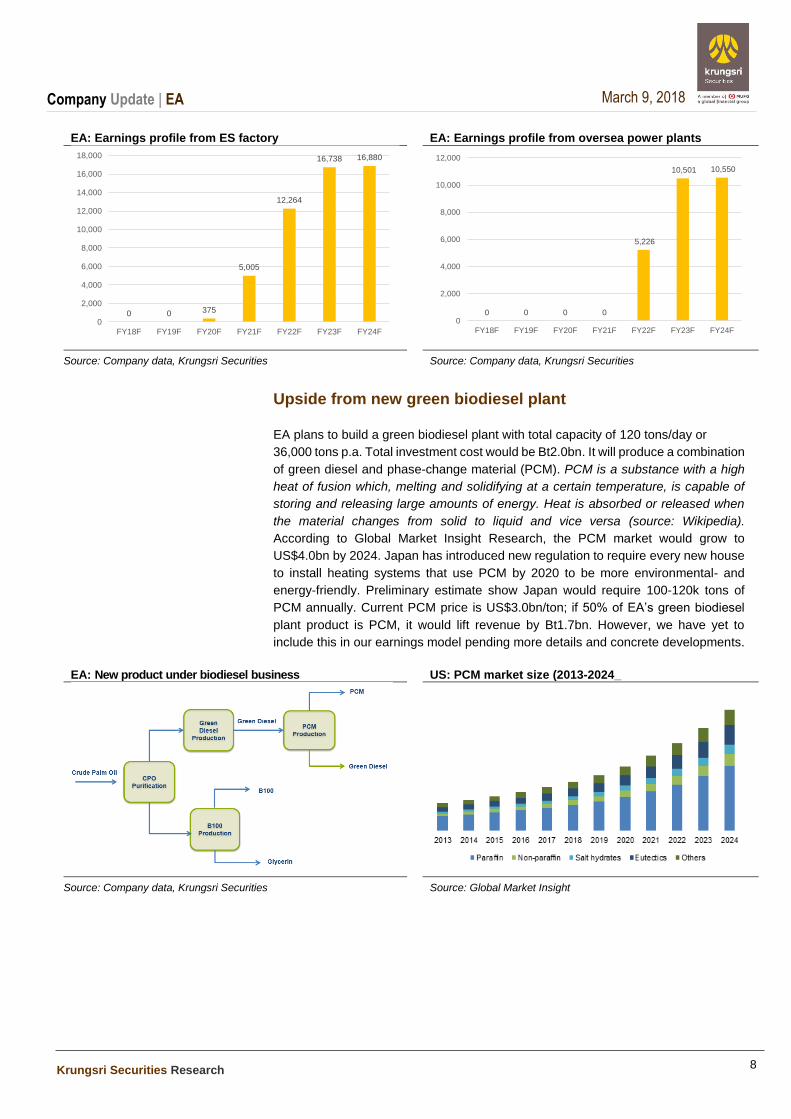
Net profit (Btm) 375 5,005 12,264 16,738 16,880
Net profit/GWh (Btm) 375 556 584 577 582
Investment cost for total infrastructure (Btm) 2,000
Investment cost/GWh (Btm) 2,000
D/E 1:1
WACC (%) 8%
EA's stake (%) 51%
Valuation/sh (Bt/sh) 21.7
Source: Company data, Krungsri Securities
(ii) 500MWh equity capacity in overseas solar power plants with energy storage
systems
EA plans to invest in overseas renewable energy projects through joint ventures with
local partners. The projects would be in areas which currently lack power supply, and
they would implement energy storage facilities to stabilize the power supply. EA is
currently negotiating with the governments of several countries. According to the EIA,
Southeast Asia’s solar and wind power generation capacity would increase to 70GW
by 2040. EA has the opportunity to secure more than 1GW of projects but we
conservatively assumed 500 MW. We expect concrete developments in pilot projects
with initial capacity of 2-5MWh soon. Our assumptions for 500 MWh overseas solar
power plant projects with energy storage are shown below;
EA: Overseas solar power plants with energy storage
Contracted capacity (MWh) 500
Capacity factor (%) 100%
Installed solar capacity (MW) 2,500
Cost/MW (Btm) 40
Installed ES capacity (MWh) 7,500
Cost/MWh ($US) 150
Battery cycle life (time) 4,500
D/E 3:1
EA's stake (%) 100%
Valuation/sh (Bt/sh) 28.2
Source: Company data, Krungsri Securities
Company Update | EA
Krungsri Securities Research
8
March 9, 2018
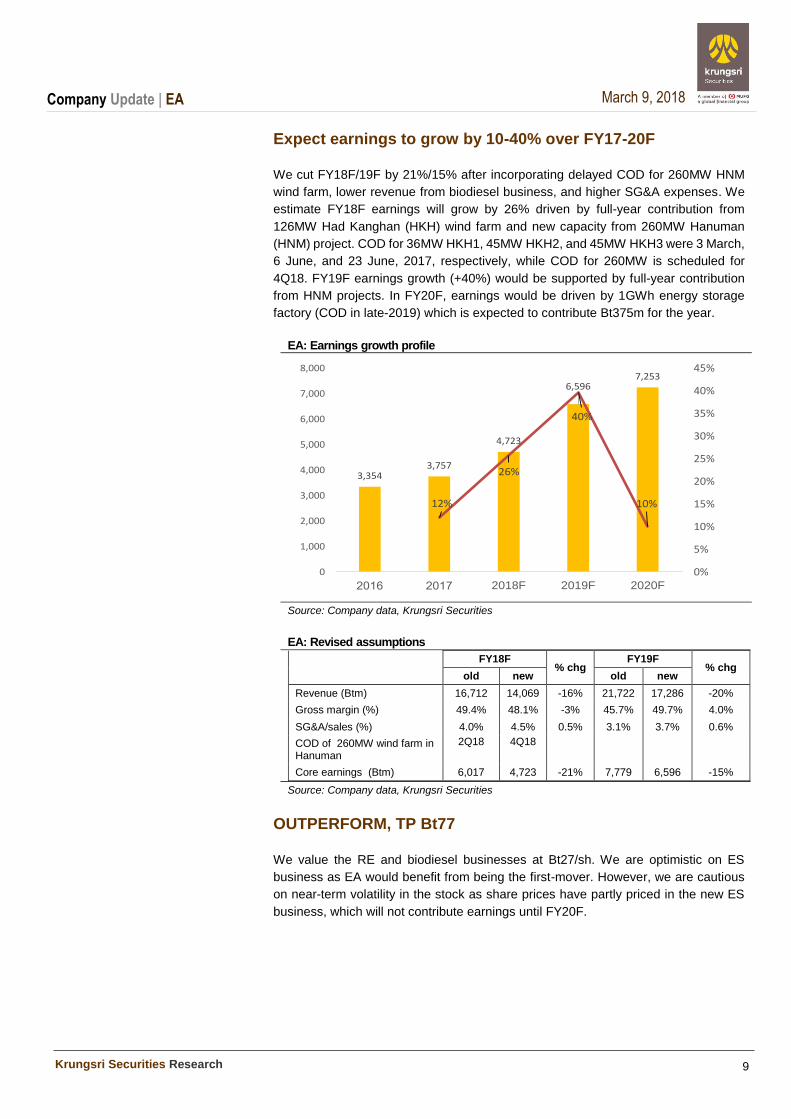
EA: Earnings profile from ES factory EA: Earnings profile from oversea power plants
Source: Company data, Krungsri Securities Source: Company data, Krungsri Securities
Upside from new green biodiesel plant EA plans to build a green biodiesel plant with total capacity of 120 tons/day or
36,000 tons p.a. Total investment cost would be Bt2.0bn. It will produce a combination
of green diesel and phase-change material (PCM). PCM is a substance with a high
heat of fusion which, melting and solidifying at a certain temperature, is capable of
storing and releasing large amounts of energy. Heat is absorbed or released when
the material changes from solid to liquid and vice versa (source: Wikipedia).
According to Global Market Insight Research, the PCM market would grow to
US$4.0bn by 2024. Japan has introduced new regulation to require every new house
to install heating systems that use PCM by 2020 to be more environmental- and
energy-friendly. Preliminary estimate show Japan would require 100-120k tons of
PCM annually. Current PCM price is US$3.0bn/ton; if 50% of EA’s green biodiesel
plant product is PCM, it would lift revenue by Bt1.7bn. However, we have yet to
include this in our earnings model pending more details and concrete developments.
EA: New product under biodiesel business US: PCM market size (2013-2024_
Source: Company data, Krungsri Securities Source: Global Market Insight
0 0 375
5,005
12,264
16,738 16,880
0
2,000
4,000
6,000
8,000
10,000
12,000
14,000
16,000
18,000
FY18F FY19F FY20F FY21F FY22F FY23F FY24F
0 0 0 0
5,226
10,501 10,550
0
2,000
4,000
6,000
8,000
10,000
12,000
FY18F FY19F FY20F FY21F FY22F FY23F FY24F
Company Update | EA
Krungsri Securities Research
9
March 9, 2018
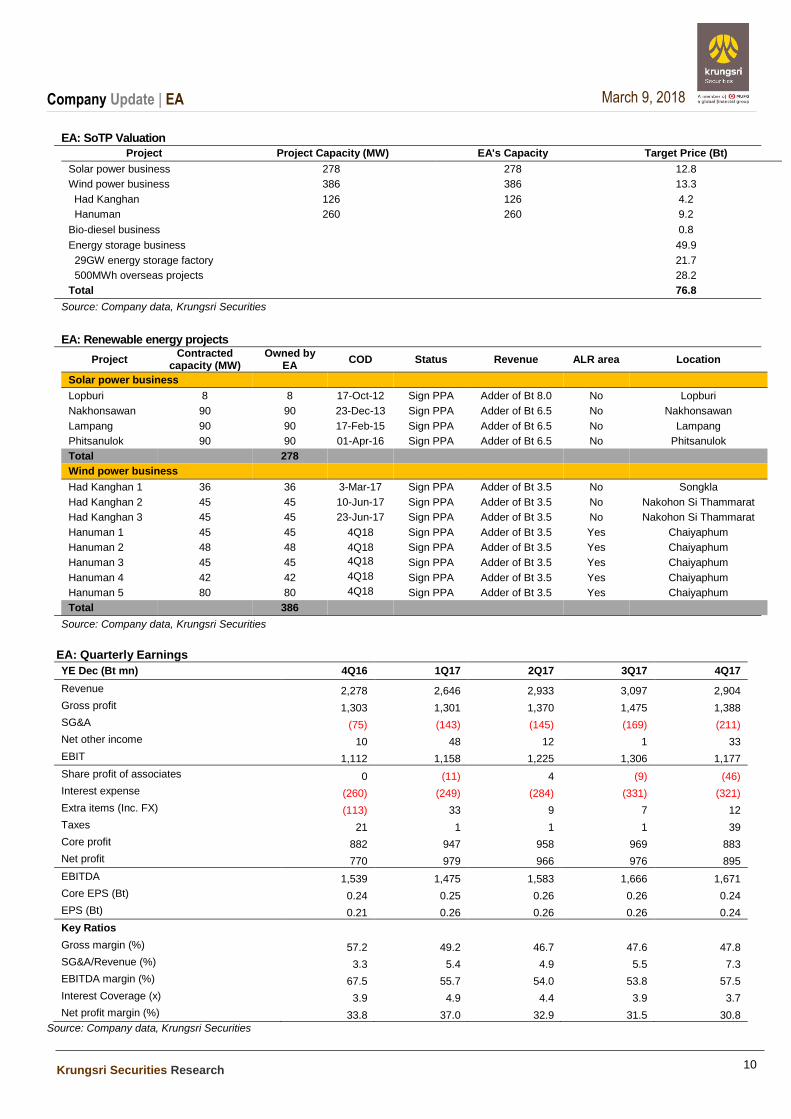
Expect earnings to grow by 10-40% over FY17-20F
We cut FY18F/19F by 21%/15% after incorporating delayed COD for 260MW HNM
wind farm, lower revenue from biodiesel business, and higher SG&A expenses. We
estimate FY18F earnings will grow by 26% driven by full-year contribution from
126MW Had Kanghan (HKH) wind farm and new capacity from 260MW Hanuman
(HNM) project. COD for 36MW HKH1, 45MW HKH2, and 45MW HKH3 were 3 March,
6 June, and 23 June, 2017, respectively, while COD for 260MW is scheduled for
4Q18. FY19F earnings growth (+40%) would be supported by full-year contribution
from HNM projects. In FY20F, earnings would be driven by 1GWh energy storage
factory (COD in late-2019) which is expected to contribute Bt375m for the year.
EA: Earnings growth profile
Source: Company data, Krungsri Securities
EA: Revised assumptions
FY18F % chg
FY19F % chg
old new old new
Revenue (Btm) 16,712 14,069 -16% 21,722 17,286 -20%
Gross margin (%) 49.4% 48.1% -3% 45.7% 49.7% 4.0%
SG&A/sales (%) 4.0% 4.5% 0.5% 3.1% 3.7% 0.6%
COD of 260MW wind farm in Hanuman
2Q18 4Q18
Core earnings (Btm) 6,017 4,723 -21% 7,779 6,596 -15%
Source: Company data, Krungsri Securities
OUTPERFORM, TP Bt77
We value the RE and biodiesel businesses at Bt27/sh. We are optimistic on ES
business as EA would benefit from being the first-mover. However, we are cautious
on near-term volatility in the stock as share prices have partly priced in the new ES
business, which will not contribute earnings until FY20F.
3,3543,757
4,723
6,5967,253
12%
26%
40%
10%
0%
5%
10%
15%
20%
25%
30%
35%
40%
45%
0
1,000
2,000
3,000
4,000
5,000
6,000
7,000
8,000
01 01 2018F 2019F 2020F
Company Update | EA
Krungsri Securities Research
10
March 9, 2018
EA: SoTP Valuation
Project Project Capacity (MW) EA's Capacity Target Price (Bt)
Solar power business 278 278 12.8
Wind power business 386 386 13.3
Had Kanghan 126 126 4.2
Hanuman 260 260 9.2
Bio-diesel business 0.8
Energy storage business 49.9
29GW energy storage factory 21.7
500MWh overseas projects 28.2
Total 76.8
Source: Company data, Krungsri Securities
EA: Renewable energy projects
Project Contracted
capacity (MW) Owned by
EA COD Status Revenue ALR area Location
Solar power business
Lopburi 8 8 17-Oct-12 Sign PPA Adder of Bt 8.0 No Lopburi
Nakhonsawan 90 90 23-Dec-13 Sign PPA Adder of Bt 6.5 No Nakhonsawan
Lampang 90 90 17-Feb-15 Sign PPA Adder of Bt 6.5 No Lampang
Phitsanulok 90 90 01-Apr-16 Sign PPA Adder of Bt 6.5 No Phitsanulok
Total 278
Wind power business
Had Kanghan 1 36 36 3-Mar-17 Sign PPA Adder of Bt 3.5 No Songkla
Had Kanghan 2 45 45 10-Jun-17 Sign PPA Adder of Bt 3.5 No Nakohon Si Thammarat
Had Kanghan 3 45 45 23-Jun-17 Sign PPA Adder of Bt 3.5 No Nakohon Si Thammarat
Hanuman 1 45 45 4Q18 Sign PPA Adder of Bt 3.5 Yes Chaiyaphum
Hanuman 2 48 48 4Q18 Sign PPA Adder of Bt 3.5 Yes Chaiyaphum
Hanuman 3 45 45 4Q18 Sign PPA Adder of Bt 3.5 Yes Chaiyaphum
Hanuman 4 42 42 4Q18 Sign PPA Adder of Bt 3.5 Yes Chaiyaphum
Hanuman 5 80 80 4Q18 Sign PPA Adder of Bt 3.5 Yes Chaiyaphum
Total 386
Source: Company data, Krungsri Securities
EA: Quarterly Earnings
YE Dec (Bt mn) 4Q16 1Q17 2Q17 3Q17 4Q17
Revenue 2,278 2,646 2,933 3,097 2,904
Gross profit 1,303 1,301 1,370 1,475 1,388
SG&A (75) (143) (145) (169) (211)
Net other income 10 48 12 1 33
EBIT 1,112 1,158 1,225 1,306 1,177
Share profit of associates 0 (11) 4 (9) (46)
Interest expense (260) (249) (284) (331) (321)
Extra items (Inc. FX) (113) 33 9 7 12
Taxes 21 1 1 1 39
Core profit 882 947 958 969 883
Net profit 770 979 966 976 895
EBITDA 1,539 1,475 1,583 1,666 1,671
Core EPS (Bt) 0.24 0.25 0.26 0.26 0.24
EPS (Bt) 0.21 0.26 0.26 0.26 0.24
Key Ratios
Gross margin (%) 57.2 49.2 46.7 47.6 47.8
SG&A/Revenue (%) 3.3 5.4 4.9 5.5 7.3
EBITDA margin (%) 67.5 55.7 54.0 53.8 57.5
Interest Coverage (x) 3.9 4.9 4.4 3.9 3.7
Net profit margin (%) 33.8 37.0 32.9 31.5 30.8
Source: Company data, Krungsri Securities
Company Update | EA
Krungsri Securities Research
11
March 9, 2018
P/E Band P/BV Band
Source: Bloomberg, Krungsri Securities Source: Bloomberg, Krungsri Securities
Peer Comparison
Market PE P/BV EPS Div Yield ROE Share Price
Cap (x) (x) G% (%) (%) Performance
BB Ticker Name US$ 18F 19F 18F 19F 18F 19F 18F 18F 1M 3M 6M YTD
Thailand
EA TB ENERGY ABSOLUTE PCL 5,888 39.1 28.0 10.8 9.0 23.7 39.6 1.3 29.7 (27.2) 1.0 25.3 (5.7)
DEMCO TB DEMCO PCL 114 10.9 9.8 1.0 1.0 N/A 11.9 3.7 10.2 (13.6) (20.0) (21.3) (18.7)
GUNKUL TB GUNKUL ENGINEERING PCL 875 18.5 13.9 2.5 2.2 122.2 33.0 1.9 13.3 (6.1) (5.6) (8.9) (6.6)
SPCG TB SPCG PCL 695 8.2 7.7 2.0 1.7 5.6 5.8 5.6 25.0 0.0 9.3 16.3 7.8
TPCH TB TPC POWER HOLDINGS PCL 157 10.8 7.2 1.9 1.6 119.4 50.5 1.8 18.7 (15.8) (16.9) (25.5) (14.6)
Average (simple) 17.5 13.3 3.6 3.1 67.7 28.2 2.9 19.4
Source: Bloomberg, Krungsri Securities
Company Update | EA
Krungsri Securities Research
12
March 9, 2018
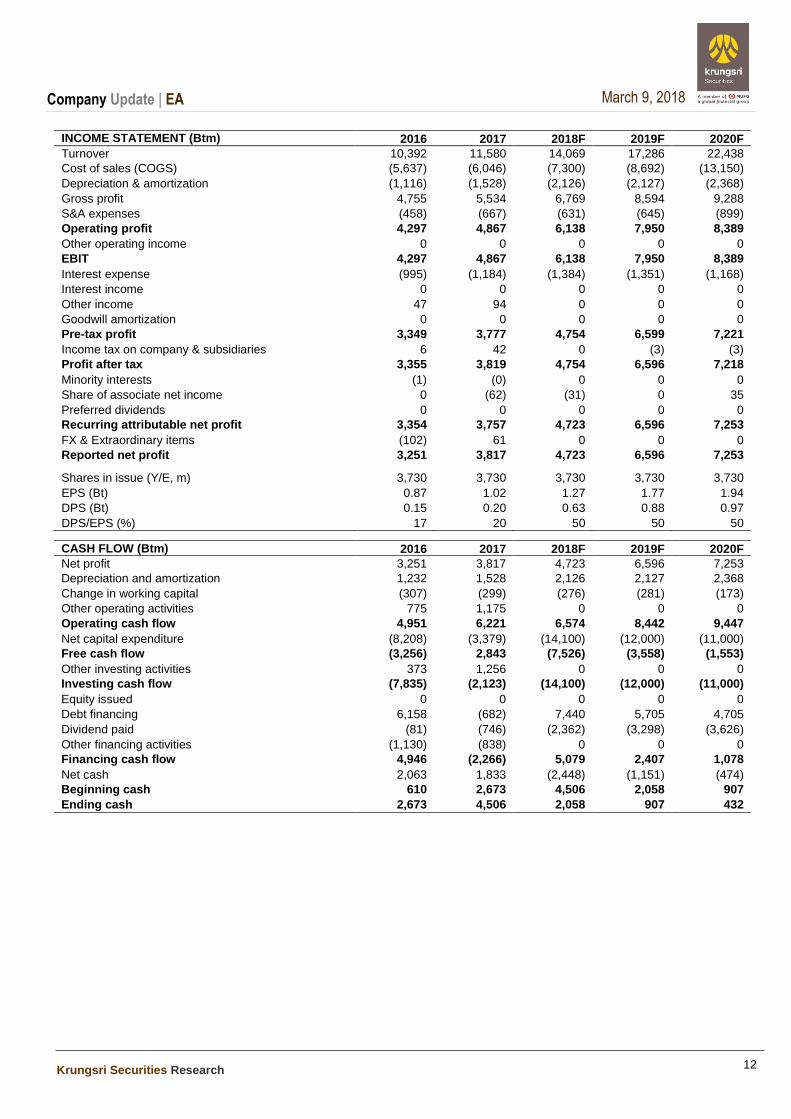
INCOME STATEMENT (Btm) 2016 2017 2018F 2019F 2020F
Turnover 10,392 11,580 14,069 17,286 22,438
Cost of sales (COGS) (5,637) (6,046) (7,300) (8,692) (13,150)
Depreciation & amortization (1,116) (1,528) (2,126) (2,127) (2,368)
Gross profit 4,755 5,534 6,769 8,594 9,288
S&A expenses (458) (667) (631) (645) (899)
Operating profit 4,297 4,867 6,138 7,950 8,389
Other operating income 0 0 0 0 0
EBIT 4,297 4,867 6,138 7,950 8,389
Interest expense (995) (1,184) (1,384) (1,351) (1,168)
Interest income 0 0 0 0 0
Other income 47 94 0 0 0
Goodwill amortization 0 0 0 0 0
Pre-tax profit 3,349 3,777 4,754 6,599 7,221
Income tax on company & subsidiaries 6 42 0 (3) (3)
Profit after tax 3,355 3,819 4,754 6,596 7,218
Minority interests (1) (0) 0 0 0
Share of associate net income 0 (62) (31) 0 35
Preferred dividends 0 0 0 0 0
Recurring attributable net profit 3,354 3,757 4,723 6,596 7,253
FX & Extraordinary items (102) 61 0 0 0
Reported net profit 3,251 3,817 4,723 6,596 7,253
Shares in issue (Y/E, m) 3,730 3,730 3,730 3,730 3,730
EPS (Bt) 0.87 1.02 1.27 1.77 1.94
DPS (Bt) 0.15 0.20 0.63 0.88 0.97
DPS/EPS (%) 17 20 50 50 50
CASH FLOW (Btm) 2016 2017 2018F 2019F 2020F
Net profit 3,251 3,817 4,723 6,596 7,253
Depreciation and amortization 1,232 1,528 2,126 2,127 2,368
Change in working capital (307) (299) (276) (281) (173)
Other operating activities 775 1,175 0 0 0
Operating cash flow 4,951 6,221 6,574 8,442 9,447
Net capital expenditure (8,208) (3,379) (14,100) (12,000) (11,000)
Free cash flow (3,256) 2,843 (7,526) (3,558) (1,553)
Other investing activities 373 1,256 0 0 0
Investing cash flow (7,835) (2,123) (14,100) (12,000) (11,000)
Equity issued 0 0 0 0 0
Debt financing 6,158 (682) 7,440 5,705 4,705
Dividend paid (81) (746) (2,362) (3,298) (3,626)
Other financing activities (1,130) (838) 0 0 0
Financing cash flow 4,946 (2,266) 5,079 2,407 1,078
Net cash 2,063 1,833 (2,448) (1,151) (474)
Beginning cash 610 2,673 4,506 2,058 907
Ending cash 2,673 4,506 2,058 907 432
Company Update | EA
Krungsri Securities Research
13
March 9, 2018
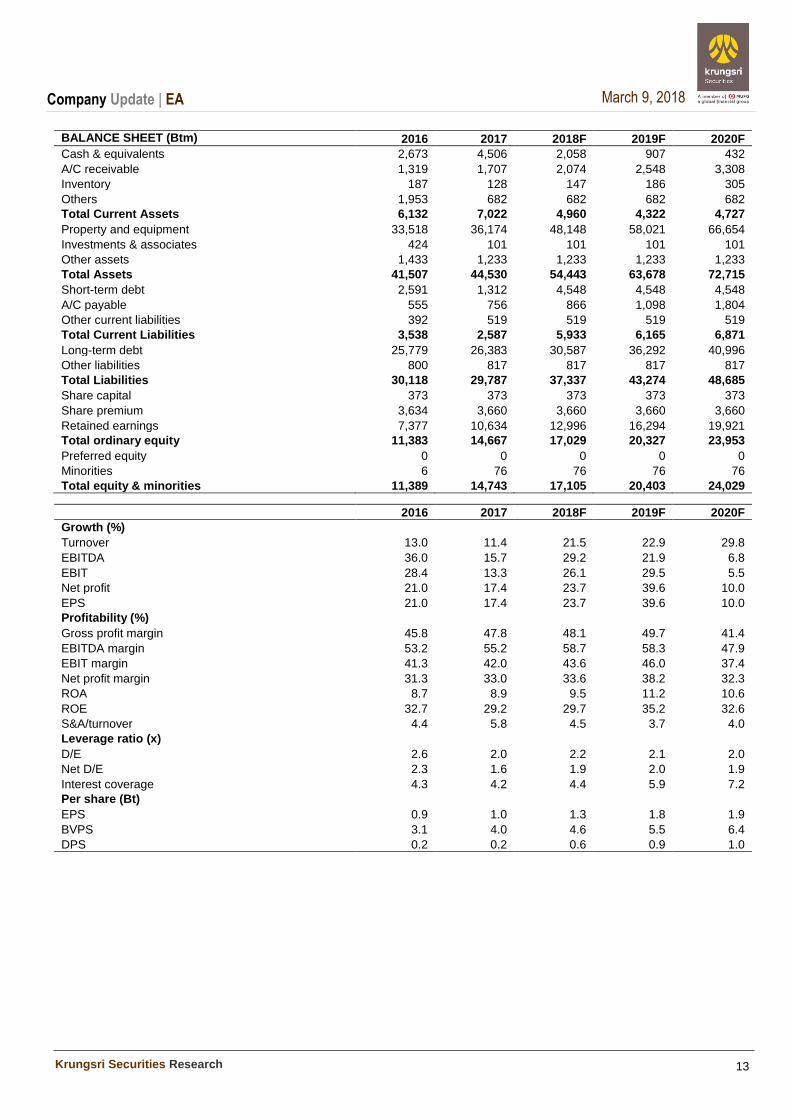
BALANCE SHEET (Btm)
2016 2017 2018F 2019F 2020F
Cash & equivalents 2,673 4,506 2,058 907 432
A/C receivable 1,319 1,707 2,074 2,548 3,308
Inventory 187 128 147 186 305
Others 1,953 682 682 682 682
Total Current Assets 6,132 7,022 4,960 4,322 4,727
Property and equipment 33,518 36,174 48,148 58,021 66,654
Investments & associates 424 101 101 101 101
Other assets 1,433 1,233 1,233 1,233 1,233
Total Assets 41,507 44,530 54,443 63,678 72,715
Short-term debt 2,591 1,312 4,548 4,548 4,548
A/C payable 555 756 866 1,098 1,804
Other current liabilities 392 519 519 519 519
Total Current Liabilities 3,538 2,587 5,933 6,165 6,871
Long-term debt 25,779 26,383 30,587 36,292 40,996
Other liabilities 800 817 817 817 817
Total Liabilities 30,118 29,787 37,337 43,274 48,685
Share capital 373 373 373 373 373
Share premium 3,634 3,660 3,660 3,660 3,660
Retained earnings 7,377 10,634 12,996 16,294 19,921
Total ordinary equity 11,383 14,667 17,029 20,327 23,953
Preferred equity 0 0 0 0 0
Minorities 6 76 76 76 76
Total equity & minorities 11,389 14,743 17,105 20,403 24,029
RATIOS (%)
2016 2017 2018F 2019F 2020F
Growth (%)
Turnover 13.0 11.4 21.5 22.9 29.8
EBITDA 36.0 15.7 29.2 21.9 6.8
EBIT 28.4 13.3 26.1 29.5 5.5
Net profit 21.0 17.4 23.7 39.6 10.0
EPS 21.0 17.4 23.7 39.6 10.0
Profitability (%)
Gross profit margin 45.8 47.8 48.1 49.7 41.4
EBITDA margin 53.2 55.2 58.7 58.3 47.9
EBIT margin 41.3 42.0 43.6 46.0 37.4
Net profit margin 31.3 33.0 33.6 38.2 32.3
ROA 8.7 8.9 9.5 11.2 10.6
ROE 32.7 29.2 29.7 35.2 32.6
S&A/turnover 4.4 5.8 4.5 3.7 4.0
Leverage ratio (x)
D/E 2.6 2.0 2.2 2.1 2.0
Net D/E 2.3 1.6 1.9 2.0 1.9
Interest coverage 4.3 4.2 4.4 5.9 7.2
Per share (Bt)
EPS 0.9 1.0 1.3 1.8 1.9
BVPS 3.1 4.0 4.6 5.5 6.4
DPS 0.2 0.2 0.6 0.9 1.0
CG Rating 2016 Companies with CG Rating
AMATA AOT BAFS BAY BCP BIGC BTS BWG CK CPF CPN CSL DELTA DEMCO
DRT DTAC DTC EASTW EGCO GFPT GPSC GRAMMY HANA HMPRO INTUCH IRPC IVL KBANK
KCE KKP KTB KTC LHBANK LPN MBK MCOT MINT MONO NKI NYT OTO PHOL
PPS PS PSL PTT PTTEP PTTGC QH QTC RATCH SAMART SAMTEL SAT SC SCB
SCC SCCC SE-ED SIM SITHAI SNC SPALI SSSC STEC SVI TCAP THCOM TISCO TKT
TMB TNDT TOP TSC TTCL TU UV VGI WACOAL WAVE 2S AAV ACAP ADVANC AGE AH AHC AKP ALUCON AMANAH ANAN AP APCO APCS
ARIP ASIA ASIMAR ASK ASP AUCT AYUD BANPU BBL BDMS BEM BFIT BLA BOL
BROOK CEN CENTEL CFRESH CGH CHG CHO CHOW CI CIMBT CKP CM CNS CNT
COL CPI DCC EA ECF EE ERW FORTH FPI GCAP GLOBAL GBX GC GL
GLOW GUNKUL HOTPOT HYDRO ICC ICHI IFEC INET IRC JSP K KSL KTIS L&E
LANNA LH LHK LIT LOXLEY LRH LST M MACO MALEE MBKET MC MEGA MFC
MOONG MSC MTI MTLS NCH NOBLE NSI NTV OCC OGC OISHI ORI PACE PAP
PCSGH PDI PE PG PJW PLANB PM PPP PR PRANDA PREM PRG PRINC PT
PTG PYLON Q-CON RICHY ROBINS RS RWI S SAMCO SABINA SALEE S&J SCG SEAFO
SIAM SINGER SIS SMK SMPC SMT SNP SPI SPPT SPRC SR SSF SST STA
SUSCO SUTHA SWC SYMC SYNEX SYTNEC TAE TAKUNI TASCO TBSC TCC TF TFI TGCI
AEC AEONTS AF AIRA AIT AJ AKR AMARIN AMATAV ARROW APURE AQUA AMC AS
BA BEAUTY BEC BH BIG BJC BJCHI BKD BR BROCK BRR BTNC CBG CGD
CHARAN CITY CMR COLOR COM7 CPL CSC CSP CSR CSS CTW DCON DIMET DNA
EARTH EASON ECL EFORL EPCO EPG ESSO FE FER FOCUS FSMART FSS FVC GEL
GIFT GLAND GOLD GSTEL GYT HPT HTC HTECH IFS IHL ILINK INSURE IRPC IT
ITD J JMART JMT JUBILE JWD KASET KBS KCAR KGI KKC KOOL KWC KYE
LALIN LPH MAJOR MAKRO MATCH MATI M-CHAI MDX MFEC MJD MK MODERN MPG NC
NCL NDR NEP NOK NUSA PATO PCA PDG PF PICO PIMO PL PLAT PLE
PMTA PPM PRIN PSTC QLT RCI RCL RICH RML RPC SANKO SAPPE SAWAD SCI
SCN SCP SEAOIL SENA SIRI SKR SLP SMG SMIT SORKON SPA SPC SPCG SPVI
SSC STANLY STPI SUC TACC TCCC TCMC TEAM TFD TFG TIC TIW TKN TLUXE
TMD TNP TOPP TPA TPAC TPCH TPIPL TPOLY TRITN TRT TTI TVI TWP U
UBIS UMI UPOIC UT UWC VIBHA VPO VTE WICE WIIK WIN XO
Disclaimer The disclosure of the survey result of the Thai Institute of Directors Association ("IOD") regarding corporate governance is made pursuant to the policy of the Office of the Securities and Exchange Commission. The survey of the IOD is based on the information of a company listed on the Stock Exchange of Thailand and the Market for Alternative Investment disclosed to the public and able to be accessed by a general public investor. The result, therefore, is from the perspective of a third party. It is not an assessment of operation and is not based on inside information. The survey result is as of the date appearing in the Corporate Governance Report of Thai Listed Companies. As a result, the survey result may be changed after that date or when there is any change to the relevant information. Nevertheless, Krungsri Securities Public Company Limited does not confirm, verify, or certify the accuracy and completeness of such survey result.
Anti-corruption Progress Indicator 2016
Companies that have declared their intention to join CAC
A AI AIE AIR AJ ALUCON AMATAV AOT APCO AQUA ARROW ASIA ASK AU
BCH BJC BJCHI BLAND BR BROCK BRR CEN CGH CHEWA CHG CHOTI CHOW CIG
COL COM7 CPALL CPF CPR CSC EKH EPCO FC FER FPI FSMART GEL GFPT
GGC GIFT GJS GLOBAL GOLD GPSC GREEN GSTEL GUNKUL HARN IFS ILINK INET IRC
J JMART JMT JUBILE JUTHA KASET KBS KCAR KTECH KWC KYE L&E LEE LIT
LVT MAKRO MATCH MATI MBAX MC MFEC MIDA MILL ML MTLS NBC NCL NEP
NINE NMG NNCL NTV NUSA NWR OGC PACE PAF PAP PATO PCSGH PIMO PK
PL PLANB POST PRINC PRO PSTC PYLON QTC ROH ROJNA RWI SANKO SAUCE SC
SCCC SCN SEAOIL SE-ED SENA SIRI SMART SPACK SPPT SPRC SR SRICHA SST STA
SUPER SUSCO SWC SYMC TAKUNI TBSP TFI THE TICON TIP TKN TLUXE TMILL TMT
TNP TPA TRUE TSE TTI TU TVD TVO TVT TWPC U UPA UREKA UWC
VGI VIBHA VIH VNT WAVE WHA WICE WIIK
Companies certified by CAC
ADVANC AKP AMANAH AP ASP AYUD BAFS BANPU BAY BBL BCP BKI BLA BROOK
BTS BWG CENTEL CFRESH CIMBT CM CNS CPI CPN CSL DCC DEMCO DIMET DRT
DTAC DTC EASTW ECL EGCO FE FNS FSS GBX GCAP GLOW HANA HMPRO HTC
ICC IFEC INTUCH IRPC IVL K KBANK KCE KGI KKP KSL KTB KTC LANNA
LHBANK LHK LPN MBK MBKET MCOT MFC MINT MONO MOONG MSC MTI NKI NSI
OCC OCEAN PB PDI PE PG PHOL PLAT PM PPP PPS PRANDA PREB PRG
PSH PSL PT PTG PTT PTTEP PTTGC Q-CON QH QLT RATCH RML ROBINS S & J
SABINA SAT SCB SCC SCG SGP SINGER SIS SITHAI SMIT SMPC SNC SNP SORKON
SPC SPI SSF SSI SSSC SVI SYNTEC TAE TCAP TCMC TFG TGCI THANI THCOM
THRE THREL TIPCO TISCO TKT TMB TMD TNITY TNL TOG TOP TPCORP TRU TSC
TSTH TTCL TVI UOBKH WACOAL
N/A
2S AAV ABICO ACAP ACC ADAM AEC AEONTS AF AFC AGE AH AHC AIT
AJA AKR ALLA ALT AMA AMARIN AMATA AMC ANAN APCS APEX APURE AQ ARIP
AS ASAP ASEFA ASIAN ASIMAR ASN ATP30 AUCT BA BAT-3K BCPG BDMS BEAUTY BEC
BEM BFIT BGRIM BGT BH BIG BIZ BKD BLISS BM BOL BPP BSBM BSM
BTC BTNC BTW BUI CBG CCET CCP CGD CHARAN CHO CHUO CI CITY CK
CKP CMO CMR CNT COLOR COMAN CPH CPL CRANE CRD CSP CSR CSS CTW
CWT D DCON DCORP DELTA DIGI DNA DTCI EA EARTH EASON ECF EE EFORL
EIC EMC EPG ERW ESSO ESTAR ETE EVER F&D FANCY FMT FN FOCUS FORTH
FTE FVC GC GENCO GL GLAND GRAMMY GRAND GTB GYT HFT HOTPOT HPT HTECH
HYDRO ICHI ICN IEC IHL III INGRS INOX INSURE IRCP IT ITD ITEL JAS
JCT JSP JTS JWD KAMART KC KCM KDH KIAT KKC KOOL KTIS KWG LALIN
LDC LH LOXLEY LPH LRH LST LTX M MACO MAJOR MALEE MANRIN MAX M-CHAI
MCS MDX MEGA METCO MGT MJD MK MM MODERN MPG MPIC NC NCH NDR
NETBAY NEW NEWS NFC NOBLE NOK NPK NPP NVD NYT OHTL OISHI ORI OTO
PAE PDG PERM PF PICO PJW PLANET PRECHA PMTA POLAR POMPUI PPM PRAKIT PLE
PRIN PRM PTL RAM RCI RCL RICH RICHY RJH ROCK RP RPC RPH RS
S S11 SAFARI SALEE SAM SAMART SAMCO SAMTEL SAPPE SAWAD SAWANG SCI SCP SDC
SE SEAFCO SELIC SF SFP SGF SHANG SIAM SIMAT SKN SKR SKY SLP SMK
SMM SMT SOLAR SPA SPALI SPCG SPG SPORT SPVI SQ SSC SSP STANLY STAR
STEC STHAI STPI SUC SUTHA SVH SVOA SYNEX T TACC TAPAC TASCO TC TCB
TCC TCCC TCJ TCOAT TEAM TFD TFMAMA TGPRO TH THAI THANA THIP THL TIC
TIW TK TKS TM TMC TMI TMW TNDT TNH TNPC TNR TOA TOPP TPAC
TPBI TPCH TPIPL TPIPP TPOLY TPP TR TRC TRITN TRT TRUBB TSF TSI TSR
TSTE TTA TTL TTTM TTW TUCC TWP TWZ TYCN UAC UBIS UEC UKEM UMI
UMS UNIQ UP UPF UPOIC UT UTP UV UVAN VARO VI VNG VPO VTE
WG WHAUP WIN WINNER WORK WORLD WP WPH WR XO YCI YNP YUASA ZIGA
ZMICO Disclaimer
The disclosure of the Anti-Corruption Progress Indicators of a listed company on the Stock Exchange of Thailand, which is assessed by Thaipat Institute, is made in order to comply with the policy and sustainable development plan for the listed companies of the Office of the Securities and Exchange Commission. Thaipat Institute made this assessment based on the information received from the listed company, as stipulated in the form for the assessment of Anti-corruption which refers to the Annual Registration Statement (Form 56-1), Annual Report (Form 56-2), or other relevant documents or reports of such listed company . The assessment result is therefore made from the perspectiv e of Thaipat Institute that is a third party. It is not an assessment of operation and is not based on any inside information. Since this assessment is only the assessment result as of the date appearing in the assessment result, it may be changed after that date or when there is any change to the relevant information. Nevertheless, Krungsri Securities Public Company Limited does not confirm, verify, or certify the accuracy and completeness of the assessment result." Reference Disclosure: Companies participating in Thailand's Private Sector Collective Action Coalition Against Corruption programme (Thai CAC) under Thai Institute of Directors (as of July 31, 2017) are categorised into:
• Companies that have declared their intention to join CAC
• Companies certified by CAC.
www.krungsrisecurities.com
Krungsri Securities Public Company Limited
Headquarters
898 Ploenchit Tower, 3rd Floor, Ploenchit Road, Lumpini Pathumwan, Bangkok 10330 Tel: 0-2659-7000 Fax: 0-2658-5699 Internet Trading: 0-2659-7777
Branches
Emporium 662 Emporium Tower, Fl. 10, Sukhumvit 24 Road Klongton, Klongtoey, Bangkok 10110 Tel: 0-2695-4500 Fax: 0-2695-4599 Central Bangna 589/151 Central City Tower 1 Office, Fl. 27 Bangna-Trad Road, Bangna, Bangkok 10260 Tel: 0-2763-2000 Fax: 0-2399-1448 Rama II 111/917-919 Rama II Road, Smaedum, Bangkhuntien, Bangkok 10150 Tel: 0-2013-7145 Fax: 0-2895-9557 Vibhavadi-rangsit Bank of Ayudhya Public Company Limited 123 Suntowers (B) Building, Vibhavadirangsit Road, Jompol, Jatujak, Bangkok 10900 Tel: 0-2273-8388 Fax: 0-2273-8399 Chonburi 64/17 Sukhumvit Road, Tambol Bang Plasoi, Amphur Muang, Chonburi 20000 Tel: 0-3312-6580 Fax: 0-3312-6588 Hat Yai Branch 90-92-94 Nipat U Tit Nueng Road,Tambol Hat Yai, Amphur Hat Yai, Songkhla 90110 Tel: 0-7422-1229 Fax: 0-7422-1411
Nakhon Pathom 67/1 Ratchadamnoen Road, Tambol Phra Pathom Jaedee, Amphur Muang, Nakhon Pathom 73000 Tel: 0-3427-5500-7 Fax: 0-3421-8989
Suphanburi 249/171-172 Moo 5 Tambol Ta Rahad, Amphur Muang, Suphanburi, 72000 Tel: 0-3596-7981 Fax: 0-3552-2449
Nakhon Ratchasima 168 Chomphon Road, Tambol Nai Muang, Amphur Muang Nakhon Ratchasima, Nakhon Ratchasima 30000 Tel: 0-4425-1211-4 Fax: 0-4425-1215
Khon Kaen 114 Sri Chan Road, Tambol Nai Muang, Amphur Muang, Khon Kaen 40000 Tel: 0-4322-6120 Fax: 0-4322-6180
Chiang Mai 70 Chang Phuak Road, Tambol Sri Phum Amphur Muang, Chiang Mai 50200 Tel: 0-5321-9234-6 Fax: 0-5321-9247
Chiang Rai 231-232 Thamalai Road, Tambol Wiang, Amphur Muang, Chiang Rai 57000 Tel: 0-5371-6489 Fax: 0-5371-6490
Phitsanulok 275/1 Phichaisongkram Road, Tambol Nai Muang, Amphur Muang, Phitsanulok 65000 Tel: 0-5530-3360 Fax: 0-5530-2580
Analyst Team Sector Coverage Central line:
662-659-7000 E-mail
Naphat Chantaraserekul, Head of Research Energy, Petrochemical, Strategy
Construction Materials
ext. 5000 [email protected]
Kittisorn Pruitipat, CFA, FRM Property, ICT, Contractor ext. 5019 [email protected]
Jesada Techahusdin, CFA
Banking, Consumer Finance, Insurance
Insurance Insurance
ext. 5004 [email protected]
Sunthorn Thongthip Food, Transportation, Strategy ext. 5009 [email protected]
Worrapong Tuntiwutthipong Electronic, Automotive, Commerce
Media
ext. 5016 [email protected]
Karun Intrachai Renewable Energy, Food ext. 5010 [email protected]
Teerapol Udomvej Healthcare, Tourism ext. 5012 [email protected]
Kitti Pitakteerabandit Transportation, Media ext. 5008 [email protected]
Artit Jansawang
Mid - Small cap, MAI ext. 5005 [email protected]
Kaushal Ladha, CFA, Assistant Analyst Strategy
Nalinee Praman, Assistant Analyst Mid - Small cap, MAI
Chaiyot Jiwagkul Technical ext. 5006 [email protected]
Fax 662-658-5643 Definition of Ratings
OUTPERFORM - Stocks with an expected capital gain above 10% in the next 12 months for small-caps, above 5% for big-caps
NEUTRAL - Stocks with an expected capital gain between -10% and +10% in the next 12 months for small-caps, -5% to +5% for big-caps
UNDERPERFORM - Stocks with an expected capital gain below 10% in the next 12 months for small-caps, below 5% for big-caps


![Title Surface and interface sciences of Li-ion …...small electric devices because they offered high energy densities [7]. At present, Li-ion batteries are At present, Li-ion batteries](https://img.dokumen.tips/doc/110x75/5fca8c1a4ca84c29b868f81b/title-surface-and-interface-sciences-of-li-ion-small-electric-devices-because.jpg)