Embed Size (px)
Citation preview

Journal of Power Electronics, Vol. 17, No. 2, pp. 501-513, March 2017 501
https://doi.org/10.6113/JPE.2017.17.2.501
ISSN(Print): 1598-2092 / ISSN(Online): 2093-4718
JPE 17-2-18
Fundamental Small-signal Modeling of Li-ion Batteries and a Parameter Evaluation Using Levy’s
Method
Xiaoqiang Zhang†, Mao Zhang*, and Weiping Zhang**
†,*School of Information and Electronics, Beijing Institute of Technology, Beijing, China **School of Electronic and Information Engineering, North China University of Technology, Beijing, China
Abstract
The fundamental small-signal modeling of lithium-ion (Li-ion) batteries and a parameter evaluation approach are investigated
in this study to describe the dynamic behaviors of small signals accurately. The main contributions of the study are as follows. 1) The operational principle of the small signals of Li-ion batteries is revealed to prove that the sinusoidal voltage response of a Li-ion battery is a result of a sinusoidal current stimulation of an AC small signals. 2) Three small-signal measurement conditions, namely stability, causality, and linearity, are proved mathematically proven to ensure the validity of the frequency response of the experimental data. 3) Based on the internal structure and electrochemical operational mechanism of the battery, an AC small-signal model is established to depict its dynamic behaviors. 4) A classical least-squares curve fitting for experimental data, referred as Levy’s method, are introduced and developed to identify small-signal model parameters. Experimental and simulation results show that the measured frequency response data fit well within reading accuracy of the simulated results; moreover, the small-signal parameters identified by Levy’s method are remarkably close to the measured parameters. Although the fundamental and parameter evaluation approaches are discussed for Li-ion batteries, they are expected to be applicable for other batteries. Key words: Levy’s method, Li-ion battery, Parameter evaluation, Small-signal operational principle and model
I. INTRODUCTION
A rechargeable battery pack is a key component that is widely used in consumer applications, from portable devices to uninterruptible power supplies and hybrid electric vehicles [1]. A rechargeable battery, acting as an electrical energy storage element, is an electrochemical device that converts electrical energy to chemical energy during charging and converts chemical energy to electrical energy during discharging. In comparison with other rechargeable batteries, lithium-ion (Li-ion) batteries are preferred because of their high specific power and energy density, high voltage, and
low self-discharge rate [2]. Thus, Li-ion battery is selected in this study. To guarantee the safe, efficient, and durable utilization of batteries, establishing an efficient battery management system (BMS) is necessary for monitoring the operational conditions and status of the battery pack, such as the state of charge (SOC) and state of health (SOH) [3]. Although the SOC and SOH may not be directly measured by any sensors and controlled by exterior conditions, they can still be predicted from model-based estimation methods [4]. Therefore, accurate battery models are important.
However, model complexity and accuracy should be balanced so the models can be embedded in microprocessors and provide accurate results in real time [5]. Therefore, battery models should not only be sufficiently accurate but they should also be simple.
Two types of battery models are reported in the literature, namely: electrochemical and equivalent circuit models. Electrochemical models often achieve high accuracy and are
Manuscript received Sep. 28, 2016; accepted Jan. 11, 2017 Recommended for publication by Associate Editor Jonghoon Kim.
†Corresponding Author: [email protected] Tel: +86-10-88803991, Beijing Institute of Technology
*School of Information and Electronics, Beijing Institute of Tech., China **School of Electronic and Information Engineering, North China Univ. of
Tech., China
© 2017 KIPE
502 Journal of Power Electronics, Vol. 17, No. 2, March 2017
suitable for understanding the distributed electrochemical reactions in electrodes and electrolyte [5]. However, these models are unsuitable for actual BMS because they are based on partial differential equations with the following disadvantages: 1) A large number of parameters in the equations are unknown; 2) The complexity often results in significant requirement for memory and computation; 3) Over-fitting problems are frequently encountered due to significant number of parameters; 4) Robustness is remarkably poor. Conversely, equivalent circuit models can represent the electrical characteristics of batteries. These models are lumped models with relatively few number of parameters and are suitable for BMS development. A comparative study of 12 equivalent circuit models for Li-ion batteries has been studied, and results show that first-order RC model is the best choice [4].
Numerous methods for Li-ion batteries have been investigated to evaluate the first-order RC model parameters. Measuring the Cole–Cole plot of the frequency responses of the equivalent circuit is a widely used approach [6]–[10] in evaluating the equivalent circuit parameters because of its simplicity; however, it has some shortcomings. First, the Cole–Cole plot is only a graphical approximation. Second, the approach is a curve fitting, where the calculated plot seldom matches the exact experimental results, because personal judgment is involved. One may consider a certain circuit to be satisfactory match of the experiment plot, but a more critical researcher may not accept it, because there are one or several fitting points which are far away from the experimental results [11]. Thus, the Bode plot approach has been proposed to evaluate circuit parameters [1] because it produces more accurate parameter results and reduces one’s subjectivity, compared with the Cole–Cole plot. However, the Bode plot approach also has some drawbacks. 1) The admittance transfer function should be normalized with a DC gain; this function also consists of two or three independent time constants, which may result in inaccurate results because three time constants are assumed to be independent. 2) The phase diagram is applied to detect circuit parameters by detecting the maximum, zero, and −π/4 phase. Thus, the Bode plot approach is also a graphical approximation. 3) The DC gain is detected by both charging and discharging processes.
In this study, the fundamental small-signal modeling of Li-ion batteries and a parameter evaluation approach are investigated to describe the small and large dynamic behaviors of the signals accurately. The operational principle of the AC small signals of Li-ion batteries is revealed in Section II. In Section III, three small-signal measurement conditions are proven to ensure the validity of the frequency response of the experimental data in mathematical theory. In Section IV, an AC small-signal battery model, instead of the commonly used equivalent circuit, based on the internal structure and electrochemical mechanism of the battery is
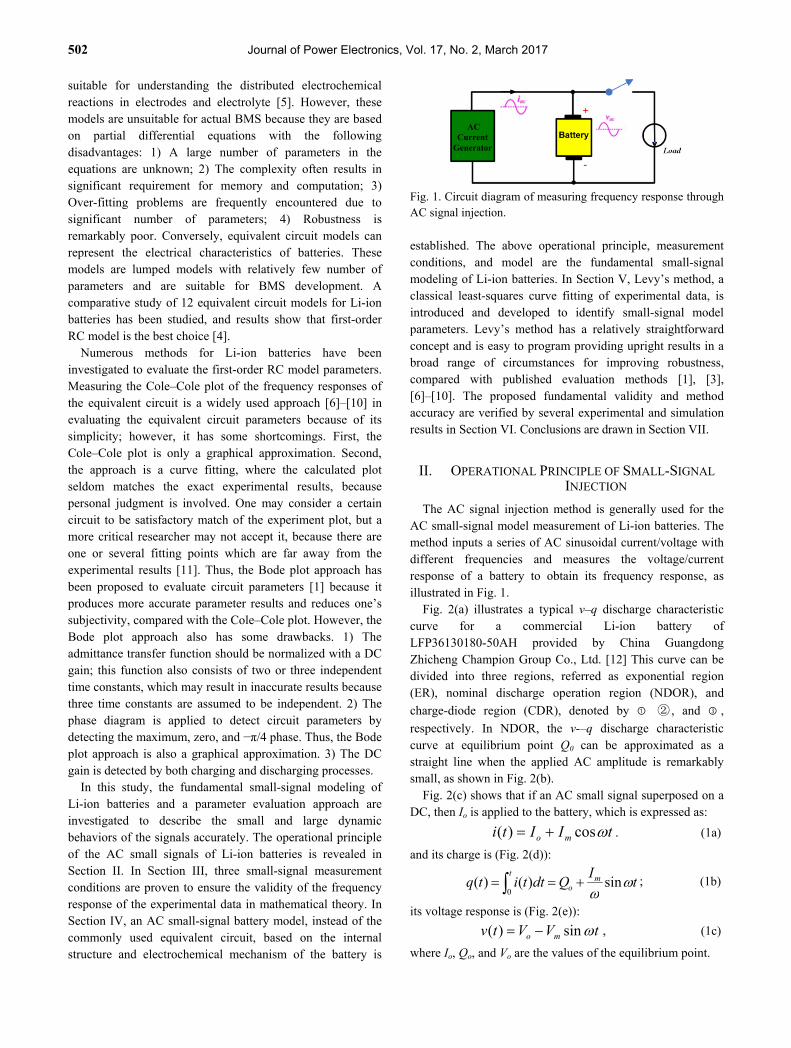
Fig. 1. Circuit diagram of measuring frequency response through AC signal injection.
established. The above operational principle, measurement conditions, and model are the fundamental small-signal modeling of Li-ion batteries. In Section V, Levy’s method, a classical least-squares curve fitting of experimental data, is introduced and developed to identify small-signal model parameters. Levy’s method has a relatively straightforward concept and is easy to program providing upright results in a broad range of circumstances for improving robustness, compared with published evaluation methods [1], [3], [6]–[10]. The proposed fundamental validity and method accuracy are verified by several experimental and simulation results in Section VI. Conclusions are drawn in Section VII.
II. OPERATIONAL PRINCIPLE OF SMALL-SIGNAL INJECTION
The AC signal injection method is generally used for the AC small-signal model measurement of Li-ion batteries. The method inputs a series of AC sinusoidal current/voltage with different frequencies and measures the voltage/current response of a battery to obtain its frequency response, as illustrated in Fig. 1.
Fig. 2(a) illustrates a typical v–q discharge characteristic curve for a commercial Li-ion battery of LFP36130180-50AH provided by China Guangdong Zhicheng Champion Group Co., Ltd. [12] This curve can be divided into three regions, referred as exponential region (ER), nominal discharge operation region (NDOR), and
charge-diode region (CDR), denoted by ① ② , and ③ ,
respectively. In NDOR, the v-–q discharge characteristic curve at equilibrium point Q0 can be approximated as a straight line when the applied AC amplitude is remarkably small, as shown in Fig. 2(b).
Fig. 2(c) shows that if an AC small signal superposed on a DC, then Io is applied to the battery, which is expressed as:
tIIti mo cos)( . (1a)
and its charge is (Fig. 2(d)):
tI
Qdttitqt
mo
sin)()(
0 ; (1b)
its voltage response is (Fig. 2(e)):
tVVtv mo sin)( , (1c)
where Io, Qo, and Vo are the values of the equilibrium point.

Fundamental Small-signal Modeling of Li-ion Batteries and a Parameter Evaluation Using … 503
Fig. 2. Typical v–q discharge curve with superimposed a small sinusoidal signal. (a) Typical v–q discharge curve. (b) Sinusoidal variation voltage v(t) versus charge q. (c) Current waveform. (d) Charge waveform. (e) Output voltage waveform.
The sinusoidal variations in the output voltage is the result of the sinusoidal variations in the input current, as shown in Fig. 2 and Eq. (1). However, the v–q characteristic curve cannot be used to evaluate the equivalent circuit parameters of the AC small signals because it is a steady-state curve.
III. AC SMALL-SIGNAL MEASUREMENT CONDITION
Experimentally, three conditions, namely stability, causality, and linearity, should be fulfilled to validate the experimental data of the measured frequency response of the battery. In this section, these properties related to an AC small-signal model of a Li-ion battery are investigated.
Stability. The overall state of the system must be significantly unchanged during data acquisition in the experiment [13].
If an input current is expressed in Eq. (1a), the average
current over a period i is
TIdttII
Tdtti
Ti omo
2,)cos(
1)(
1 T
0
T
0 . (2a)
Similarly, the average charge and voltage over a period is
oo VvQq , . (2b)
Equations (2a) and (2b) present that the overall state of the battery is maintained, because all average values are equal to that of the equilibrium point, (Io, Qo, Vo). Therefore, AC small
signals may not change the SOC of the battery during the acquisition of the frequency response data, thereby making the battery is stable.
Causality. The AC response measured by the system must be directly correlated to the applied AC stimulus. Protecting the battery from outside perturbations is important in measuring the frequency response. In signal processing, cross-correlation is a measure of similarity between two series as a function of the lag of one relative to the other [14]. In this paper, cross-correlation is used to verify the causality property of the battery. The measured voltage response of the AC small signals of the battery must be directly correlated to the applied AC current stimulus. If an AC small-signal current is applied to the battery, which is expressed as
tIti m cos)( , (3a)
and its voltage response is (Figs. 2(b), 2(c), and 2(e)):
tVtv m sin)( , (3b)
then, the cross-correlation function is defined as [14]
tdtitvRiv
)()(2
1)(
2
0
* , (4)
where * denotes the complex conjugate of )(tv , and ‘τ’ is
the lag. By inserting Eq. (3) into Eq. (4), a cross-correlation function can be obtained.

504 Journal of Power Electronics, Vol. 17, No. 2, March 2017
sin2
2
)2sinsin
2
1
)(cossin2
1)(
2
0
2
0
mm
mm
mmiv
IV
tdt
IV
tdttIVR
( (5)
If τ=T/4, then the cross-correlation function reaches its maximum value. Hence, if i(t) is shifted a quarter period T along the t-axis, then both peaks of i(t) and v(t) are aligned, providing a large contribution to this integral. Therefore, the battery has causality property because the current value of the outputs v(t) only depends on the current and past values of the input i(t) [13]. The causality property is important in protecting the battery from outside perturbation interference in AC small-signal measure.
Linearity. The applied AC amplitude must be sufficiently small to assume a linear response in the first approximation; however, it must also be large enough to measure a response, as shown in Fig. 2.
According to the typical v–q discharge curve shown in Fig. 2(a), the overall v–q discharge equation is expressed as follows, and the proof of the equation is given in the Appendix.
)1(
)1(),(
1
3
1d1
x
qd
Q
q
ooc
eBC
eARIVtqV (6a)
final
tQqtIdtIq ~0o0 o , (6b)
In the NDOR shown in Fig. 2(a), the v–q discharge equation can be simplified as
C
qeARIVtqV Q
q
ooc
)1(),( d1
3
1 , (7a)
xqQqeB dx
q
,0)1( 1, . (7b)
If the input current is expressed as
21o)( iiIti , (8)
where tbitai 2211 coscos ; .
then the discharged charge of the battery is
210)()( qqQditq o
t , (9a)
tb
q
ta
q
22
2
11
1
sin
sin
, (9b)
where Qo is an equilibrium point, and q1 and q2 superimposed at Qo are AC small signals. Thus, substituting Eqs. (8) and (9)
into Eq. (7a) yields
),(),(),(),(v 2211 iQviQvIQViq ooooo , (10a)
C
QRIVIQV o
oocooo 1),( , (10b)
tCQ
AaiQv o 1
111 sin)
1(),(
, (10c)
tCQ
AbiQv o 2
222 sin)
1(),(
, (10d)
where Q is equal to Qd1.
The following conditions are satisfied:
Q
tbtaA
AeA
eeA
eA
Q
tbta
Q
tbta
Q
Q
Q
tbtaQ
o
o
2211
)sinsin(
)sinsin(
)sinsin(
sinsin
)1(
)1(
2211
2211
2211
, (11a)
Q
xe
baQeQQ
Q
x
Q
Q
o
o
1
,)()(,1, 22
21
, (11b)
and the corresponding output voltages for inputs of Io, i1, and i2 are:
),(,
);(,;,
222
111o
iQvQi
iQvQiIQVQI
oo
oooooo
,),(
; (12)
thus an AC small-signal model for Li-ion battery is linear, because the v–q discharging equation satisfies the principle of superposition at the equilibrium point Qo in NDOR. To estimate the equivalent circuit parameters of the Li-ion battery through frequency response, the applied AC amplitude must be small enough to assume a linear response in the first approximation but still large enough to measure a response.
Therefore, acquiring the experimental data of the frequency response data of Li-ion batteries can be used to evaluate its equivalent circuit parameters when the three conditions of stability, causality, and linearity are satisfied.
IV. AC SMALL-SIGNAL MODEL FOR LI-ION BATTERY
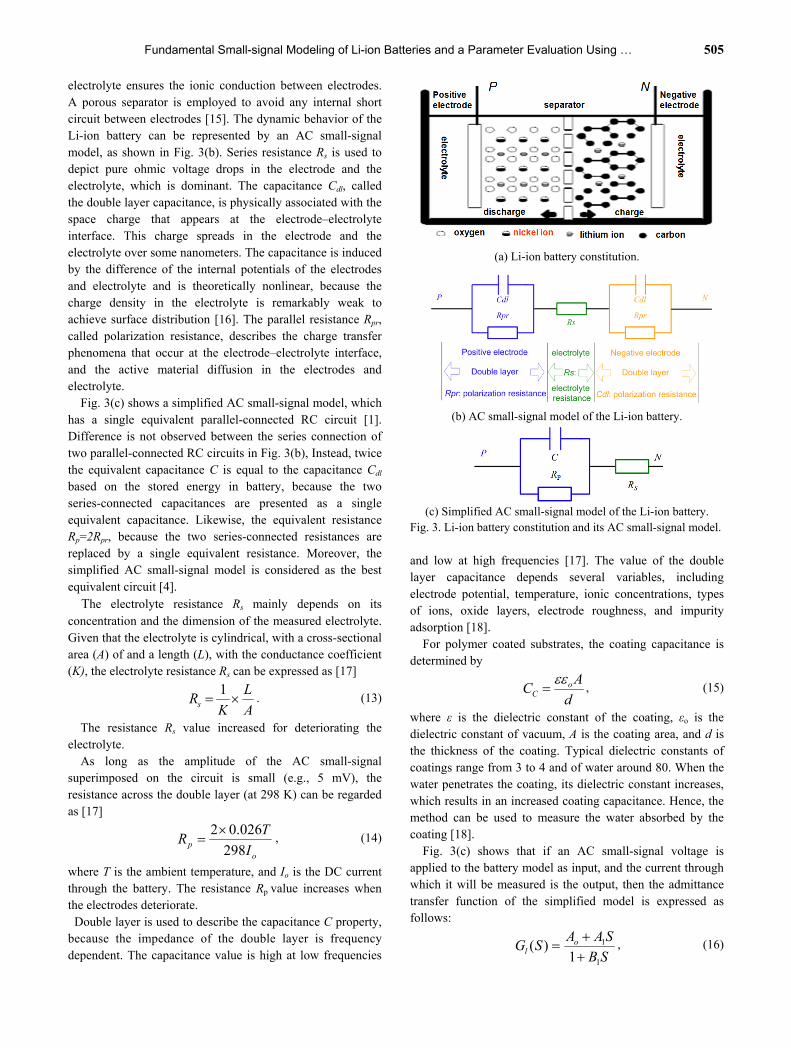
A Li-ion battery is usually composed of two electrodes and an electrolyte, as shown in Fig. 3(a). Electrodes are electronic conductors that contain an active material, whereas the
Fundamental Small-signal Modeling of Li-ion Batteries and a Parameter Evaluation Using … 505
electrolyte ensures the ionic conduction between electrodes. A porous separator is employed to avoid any internal short circuit between electrodes [15]. The dynamic behavior of the Li-ion battery can be represented by an AC small-signal model, as shown in Fig. 3(b). Series resistance Rs is used to depict pure ohmic voltage drops in the electrode and the electrolyte, which is dominant. The capacitance Cdl, called the double layer capacitance, is physically associated with the space charge that appears at the electrode–electrolyte interface. This charge spreads in the electrode and the electrolyte over some nanometers. The capacitance is induced by the difference of the internal potentials of the electrodes and electrolyte and is theoretically nonlinear, because the charge density in the electrolyte is remarkably weak to achieve surface distribution [16]. The parallel resistance Rpr, called polarization resistance, describes the charge transfer phenomena that occur at the electrode–electrolyte interface, and the active material diffusion in the electrodes and electrolyte.
Fig. 3(c) shows a simplified AC small-signal model, which has a single equivalent parallel-connected RC circuit [1]. Difference is not observed between the series connection of two parallel-connected RC circuits in Fig. 3(b), Instead, twice the equivalent capacitance C is equal to the capacitance Cdl based on the stored energy in battery, because the two series-connected capacitances are presented as a single equivalent capacitance. Likewise, the equivalent resistance Rp=2Rpr, because the two series-connected resistances are replaced by a single equivalent resistance. Moreover, the simplified AC small-signal model is considered as the best equivalent circuit [4].
The electrolyte resistance Rs mainly depends on its concentration and the dimension of the measured electrolyte. Given that the electrolyte is cylindrical, with a cross-sectional area (A) of and a length (L), with the conductance coefficient (K), the electrolyte resistance Rs can be expressed as [17]
A
L
KRs
1. (13)
The resistance Rs value increased for deteriorating the electrolyte.
As long as the amplitude of the AC small-signal superimposed on the circuit is small (e.g., 5 mV), the resistance across the double layer (at 298 K) can be regarded as [17]
op I
TR
298
026.02 , (14)
where T is the ambient temperature, and Io is the DC current through the battery. The resistance Rp value increases when the electrodes deteriorate. Double layer is used to describe the capacitance C property, because the impedance of the double layer is frequency dependent. The capacitance value is high at low frequencies
(a) Li-ion battery constitution.
(b) AC small-signal model of the Li-ion battery.
(c) Simplified AC small-signal model of the Li-ion battery.
Fig. 3. Li-ion battery constitution and its AC small-signal model.
and low at high frequencies [17]. The value of the double layer capacitance depends several variables, including electrode potential, temperature, ionic concentrations, types of ions, oxide layers, electrode roughness, and impurity adsorption [18].
For polymer coated substrates, the coating capacitance is determined by
d
AC o
C
, (15)
where ε is the dielectric constant of the coating, εo is the dielectric constant of vacuum, A is the coating area, and d is the thickness of the coating. Typical dielectric constants of coatings range from 3 to 4 and of water around 80. When the water penetrates the coating, its dielectric constant increases, which results in an increased coating capacitance. Hence, the method can be used to measure the water absorbed by the coating [18].
Fig. 3(c) shows that if an AC small-signal voltage is applied to the battery model as input, and the current through which it will be measured is the output, then the admittance transfer function of the simplified model is expressed as follows:
SB
SAASG o
l1
1
1)(
, (16)

506 Journal of Power Electronics, Vol. 17, No. 2, March 2017
Fig. 4. High-frequency model.
where
Spo RR
A
1 , (17a)
Sp
p
RR
CRA
1
, (17b)
Sp
Sp
RR
CRRB
1
. (17c)
The circuit parameters of the battery can be expressed as:
1
1
A
BRS , (18a)
10
101
AA
BAARp
, (18b)
101
21
BAA
AC
. (18c)
For the high-frequency behavior of the battery, a parasitical inductance should be considered in the model, as shown in Fig. 4.
By applying the high-frequency model, the transfer function of the measured battery is expressed as:
221
1
1)(
SBSB
SAASG o
h
, (19)
where
Spo RR
A
1 , (20a)
Sp
p
RR
CRA
1
, (20b)
Sp
Sp
RR
CRRLB
1, (20c)
Sp
p
RR
LCRB
2
. (20d)
The high-frequency model parameters of the battery can be expressed as:
1
2
A
BL , (21a)
0
1
A
ACRp , (21b)
1
0
10
2011
A
A
AA
BABARS
, (21c)
1
0
10
2011
0
1
A
A
AA
BABA
ARp
, (21d)
pRA
AC
0
1 . (21e)
If the coefficients of the transfer functions of Eqs. (16) or (19) can be evaluated by some methods through frequency response, then the model parameters can be determined by Eqs. (18) or (21). Furthermore, the evaluated equivalent circuit parameter can be used to predict the battery health.
V. FREQUENCY RESPONSE CURVE FITTING USING LEVY’S METHOD
Levy’s Method [19] is introduced in this section to evaluate the small-signal model parameters of the Li-ion battery by fitting the measured frequency response curve of its admittance transfer functions, as shown in Eqs. (16) and (19).
Let s=jω, the frequency response of the admittance transfer function in Eq. (19) of the high-frequency model, is determined by
221
1
1)(
BjB
jAAjG o
h
, (22)
where coefficients A0, A1 and B1, B2 are real values and dependent on the high-frequency model parameter shown in Fig. 4. Eqs. (17a)–(17c) demonstrate the relationship between the model parameter and the coefficients.
Separating the numerator and denominator of )( jGh
into their real and imaginary parts yields
)()(
)()(
)(
)()(
j
j
D
NjGh
, (23)
Where
12
21 )(,1)(,)(,)( BBAAo .
Suppose that F(jω) is an ideal frequency response of the Li-ion battery, which coincides exactly with the values indicated by the measured frequency response curve. Then, F(jω) also has real and imaginary parts.
)()()( jIRjF (24)
The numerical difference between the two functions Gh(jω) and F(jω) is defined as the error in fitting, such that
)(
)()()()()(
D
NjFjGjF h . (25)
Multiplying both sides of Eq. (25) by D(ω), weighting function, which is a weighted error, is obtained.
)()()()()( NjFDD (26)
The right side of Eq. (26) can be separated by a function of real and imaginary parts, as shown as follows:
)()(a)()( jjbD , (27)
where a(ω) and b(ω) are functions not only of the frequency but also of the unknown coefficients A0, A1 and B1, B2. If the

Fundamental Small-signal Modeling of Li-ion Batteries and a Parameter Evaluation Using … 507
magnitude is
)()()()( 22 jbaD , (28a)
)()()()()()( IRa , (28b)
)()()()()()( IRb , (28c)
then at any measured frequency ωk,
)()()()( 222
kkkk jbaD . (29)
The sum E of the squared function in Eq. (29) assumes all frequency ωk at which F(jω) has been measured and is expressed as:
])()([)()(0
22
0
2
m
kkk
m
kkk jbaDE . (30)
By using Eqs. (28b) and (28c), Eq. (30) can be written as:
2
0
2 )( kkkkkkk
m
kkkkkkk IRIRE
)( ,
(31) where αk stands for α (ωk) for brevity, and so on.
The unknown polynomial coefficients A1, A0 and B1, B2 shown in Eq. (22) are evaluated by minimizing the function E.
As shown in Eq. (26), the absolute error ε(ω) is generally large when the frequency ω is approaching the pole frequency, D(ω)≈0. Therefore, for a given frequency ω, the magnitude error is roughly proportional to the magnitude of the function being fitted. A larger number of measured frequency points should be selected in a pole point region to reduce the error.
A necessary condition for E to be minimized is:
1,0,0})(
){(0
iA
IR
AIR
A
E
i
kkkkkkkkk
i
km
kkkkkkk
i
, (32a)
1,0,0)})((
)(){(0
iB
RB
IIR
BI
BRIR
B
E
i
kkk
i
kkkkkkkkk
i
kkk
i
kk
m
kkkkkkk
i
.
(32b) Equations (32a) and (32b) denote that the polynomial
coefficients can be solved by minimizing E in all the experimental points. Then, the problem can be formulated by a set of simultaneous algebraic linear equations of the form
2
1
0
2
1
1
0
432
221
322
210
0
0
0
0
0
][]][[
U
T
S
B
B
A
A
UTS
UST
TS
ST
BXA
, (33)
where
4,3,2,1,00
hm
k
hkh , , (34a)
4,3,2,1,0,0
hRS k
m
k
hkh , (34b)
4,3,2,1,0,0
hIT k
m
k
hkh , (34c)
4,3,2,1,0),( 22
0
hIRU kk
m
k
hkh . (34d)
Thus, the numerical value of the unknown coefficients in Eq. (22) may be obtained from Eq. (33) once the elements in matrices of [A] and [B] have been evaluated by the formulas in Eq. (34). The low-frequency model of the Li-ion battery is shown in Fig. 3(c), and its transfer function is expressed in Eq. (16). The unknown coefficients in Eq. (16) can be obtained by the following set of linear equations.
0
]0
0
1
0
1
1
0
221
22
10
T
S
B
A
A
UST
S
T
(35)
The model parameters of the Li-ion battery can be computed numerically based on Based on Levy’s method using the Matlab program.
VI. SMALL-SIGNAL EXPERIMENTS AND RESULTS
A. Small-Signal Test System
Fig. 5 shows a small-signal test system for measuring battery frequency responses. The test system is composed of a programmable electronic DC load (EL 9000 HP) for discharging, a thermal chamber (Terchy Technology Corp.) for environment control, a computer for user–machine interface and data storage, as well as process, and an impedance measurer SI 1260 (Solartron Metrology) for recording battery frequency responses at various excitation frequencies. During the charging/discharging of the battery, voltage, current, and temperature are measured and recorded from 0.01 Hz to 104 Hz .
This small-signal test system can be divided into two parts, the charge and discharge equipment, and the measurement device of the small-signal model parameters,. The charge and discharge equipment comprises the electronic load, dynamic load interface, and impedance measurer. The equipment is designed as a flowing system for accurately regulating the discharging or charging current or voltage of a battery being tested. The electronic load begins to discharge or charge the battery when a DC reference magnitude is sent to the electronic load through the impedance measurer DAC port, the dynamic interface, and the control port of the electronic load. Subsequently, its output current or voltage is used as the feedback magnitude, which is sent to the impedance measurer through the V/I feedback port, the dynamic interface, and the ADC port of the impedance measurer. A PI controller inside

508 Journal of Power Electronics, Vol. 17, No. 2, March 2017
Fig. 5. Battery test system.
the impedance measurer regulates the output voltage or current until the DC feedback magnitude is equal to the DC reference. A sinusoidal input is modulated on top of a precisely generated DC reference to measure the frequency response of the battery being tested. Another part of this test system is the measurement system of the small-signal model parameters, which is designed to record battery frequency response and evaluate model parameters. The equipment comprises the impedance measurer for AC small-signal generation and data collection, and a computer for data storage and process. A convolution method is adopted to identify the phase delay of the impedance, thereby reducing measurement noise; moreover, Parseval’s theorem is used to calculate its magnitude [20]. To evaluate the model parameters precisely, Levy’s method in Section V is employed to fit the measured frequency response curve, and the formulas in Eq. (21) are utilized to calculate the model parameters of Rs, Rp, and C.
B. Frequency Response Measurement and Results
Li-ion batteries of LFP36130180-50AH, provided by China Guangdong Zhicheng Champion Group Co., Ltd [12], are selected for the tests to verify the correction of small-signal modeling and parameter identification. This frequency response is measured by the battery test system shown in Fig. 5. The battery SOC is calculated by integrating the DC current input per second. The SOC recognized in the impedance measurer is set to 100% after the battery is fully charged and paused for 1 h to standardize the initial SOC.
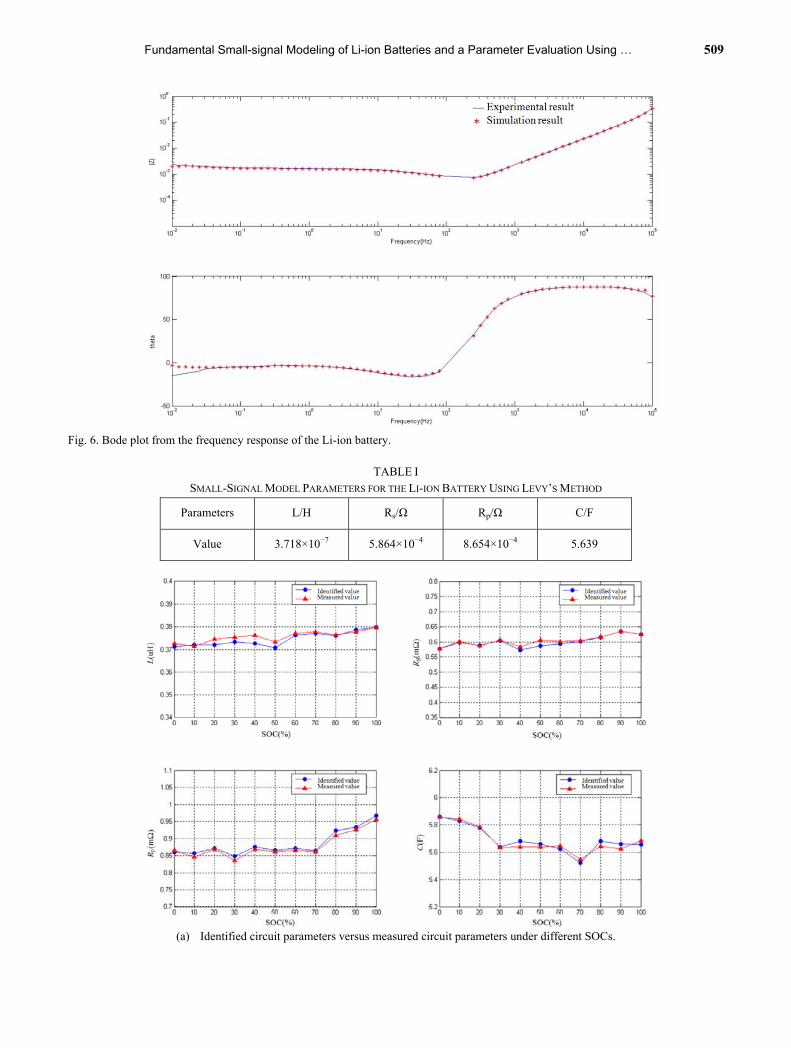
Then, the SOC is calculated by integrating the current at each discharging rate. The tested battery is discharged at 0.5 °C, and the temperature is maintained at room temperature (25 °C). The frequency response data are measured at 71 points between 0.01 Hz and 104Hz, whereas its SOC is maintained at 60%. The blue curve shown in Fig. 6 illustrates the frequency response data measured by the battery test system. Levy’s method is employed to fit the measured frequency response curve based on the measured data, and the formulas in Eq. (21) are utilized to evaluate the equivalent circuit parameters of Rs, Rp, L, and C shown in Table I. The simulated frequency response curve (red curve in Fig. 6) is attained using the calculated circuit parameter and the transfer function shown in Eq. (16). Fig. 6 shows that the measured frequency response curve fits well into the simulated frequency response curve, which parameters are calculated by the Levy’s method. Some errors in the low-frequency phase region can be observed, because a good fit cannot be obtained at low frequency using Levy’s method [21]. The small-signal model parameters are identified every 10% from 0% to 100% of the SOC discharged at 0.5 °C at room temperature (25 °C). The identified and experimental results are shown in Fig. 7(a). The blue and red curves represent the identified and experimental values, respectively. Figure 7(a) shows that the experimental value is close to the identified value. Fig. 7(b) shows Nyquist plot under each 20% from 20% to 80% of the SOC, in which X-axle and Y-axle are real and imaginary parts of the Li-ion battery
Fundamental Small-signal Modeling of Li-ion Batteries and a Parameter Evaluation Using … 509
Fig. 6. Bode plot from the frequency response of the Li-ion battery.
TABLE I
SMALL-SIGNAL MODEL PARAMETERS FOR THE LI-ION BATTERY USING LEVY’S METHOD
Parameters L/H Rs/Ω Rp/Ω C/F
Value 3.718×10⁻⁷ 5.864×10⁻⁴ 8.654×10⁻⁴ 5.639
(a) Identified circuit parameters versus measured circuit parameters under different SOCs.
510 Journal of Power Electronics, Vol. 17, No. 2, March 2017
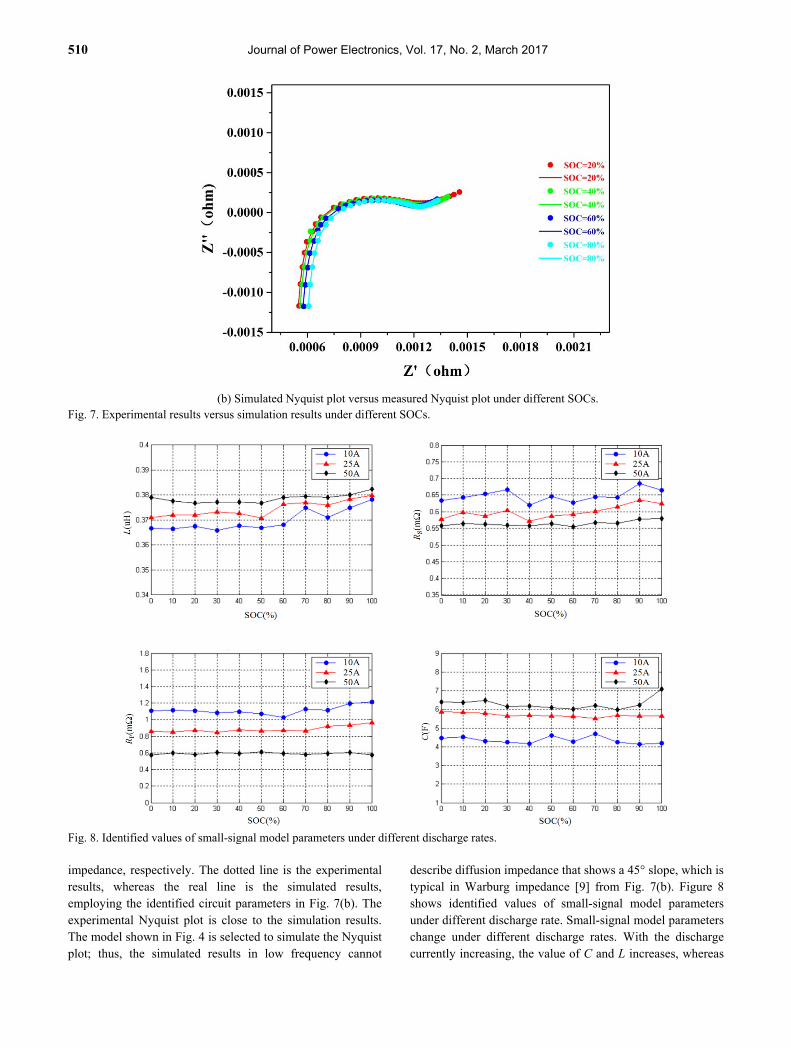
(b) Simulated Nyquist plot versus measured Nyquist plot under different SOCs.
Fig. 7. Experimental results versus simulation results under different SOCs.
Fig. 8. Identified values of small-signal model parameters under different discharge rates.
impedance, respectively. The dotted line is the experimental results, whereas the real line is the simulated results, employing the identified circuit parameters in Fig. 7(b). The experimental Nyquist plot is close to the simulation results. The model shown in Fig. 4 is selected to simulate the Nyquist plot; thus, the simulated results in low frequency cannot
describe diffusion impedance that shows a 45° slope, which is typical in Warburg impedance [9] from Fig. 7(b). Figure 8 shows identified values of small-signal model parameters under different discharge rate. Small-signal model parameters change under different discharge rates. With the discharge currently increasing, the value of C and L increases, whereas

Fundamental Small-signal Modeling of Li-ion Batteries and a Parameter Evaluation Using … 511
that of Rs and Rp decreases.
VII. CONCLUSIONS
Some fundamentals of the modeling of the small signals of Li-ion batteries are investigated as follows. 1) The operational principle of the small signals in this study shows that the battery sinusoidal variations in the output voltage is the result of an AC small-signal sinusoidal input current. 2) Battery satisfies the three small-signal measurement conditions (stability, causality, and linearity), which are mathematically proven in this work. These conditions are important in validating the measured frequency response of the experimental data. 3) An AC small signal model is established to describe its dynamic behaviors, based on the internal structure and electrochemical operational mechanism of the battery.
The mathematical analysis of the dynamic behavior of Li-ion batteries often requires the frequency response to be fitted by a transfer function, which is a ratio of two frequency-dependent polynomials based on experimental test results. The Levy’s method is introduced and developed to evaluate polynomial coefficients. This approach is based on the minimization of the weighted sum of the squares of the errors between the absolute magnitudes of the measured frequency response data and the transfer function considered at various values of the measured frequency. The small-signal equivalent circuit parameters of the Li-ion battery can be computed numerically using the Levy’s Method through the Matlab program. The experimental and simulation results provided in this paper concludes that: (1) the measured frequency response data fit well into the simulated result of the transfer function; (2) the small-signal model parameters are almost independent of SOC. Although the fundamentals and approaches for obtaining model parameters are developed for Li-ion battery, they can also be applied for other batteries.
APPENDIX
Fig. A1 shows a typical v–q discharge characteristic curve for a commercial Li-ion battery of LFP36130180-50AH, provided by China Guangdong Zhicheng Champion Group Co., Ltd. To balance simplification and accuracy, a v–q discharge curve of the battery is divided into three regions, namely ER, NDOR, and CDR, respectively denoted by (1), (2), and (3), in Fig.A1.
The discharge model is similar to the basic equivalent circuit model. However, two new elements have been initially presented to improve model accuracy. One is defined as a charge-controlling voltage source (QCV), which is used to describe battery behaviors in NDOR, whereas the other is referred as a q-diode for depicting CDR characteristics. Both electrical characteristic equations are investigated. The battery
(1) ER; (2) NDOR; (3) CDR
Fig. A1. Typical v–q discharge curve.
discharge circuit model is illustrated in Fig. A2(a). The proposed discharge circuit model consists of six cascaded lumped elements, including a DC voltage source Voc, a current controlling resistance R1, a parallel branch Rp and Cp, a QCV, and a discharge controlling diode, as well as a current integrator. Vbt(q, t) is the battery terminal voltage; Io is a constant discharge current acting as a battery load; a switch SW is employed to control the battery should be discharged. Calculation of Voc and R1
When t<to, the switch SW is turned off, and the battery is in open circuit. The battery terminal voltage is measured as the open voltage Voc, which can be found in the manufacturer datasheet or on its discharge curve shown in Fig. A1. For example, Voc=3.6 V. The voltage across the parallel branch is zero, because the capacitor has zero energy; V2(to) is zero. At to, the SW is turned on; the constant current source is applied to the battery and goes into the discharge process. When the constant current source is considered as a step current source, the equivalent circuit begins a dynamic process. At to, the voltage across the parallel branch should remain zero ( V2 (to)=0 V), because the capacitor Cp voltage cannot change instantaneously. However, the voltage across the QCV and q-diode is zero, because the current integrator has zero-charge output (q(to)=0). The voltage drop is applied to the internal resistance R1, yielding the expression:
o
101
),0(
I
V
I
tVVR
o
btOC
, (A1)
where V1 can be determined in the discharge curve shown in Fig. A1. Time constant τ and charge constant Qτ of parallel branches Rp and Cp
After t0, the capacitor Cp begins to be charged by the constant current source, and the voltage across the parallel branch increases. Hence, the terminal voltage of the battery descends during the charging process of the capacitor, as illustrated in (1) ER of Fig. A1. In the exponential region, the voltage across QCV and q-diode is considered to be zero,

512 Journal of Power Electronics, Vol. 17, No. 2, March 2017
(a) Proposed discharge circuit model.
(b) Numerical simulation discharge model.
Fig. A2. Proposed discharge circuit model and numerical simulation discharge model.
because the integrator produces a few charges. Thus, the terminal voltage of the battery, defined as v–q discharge equation, can be modeled as an exponential function.
)1(),( d1
3
1Q
q
oocbt eARIVtqV
(A2)
11o0 o ,, d
tQqtttIdtIq (A3)
o
ddd
I
QtQQVA
33,
3, 111
2 (A4)
Fig. A1 illustrates that the terminal voltage of the battery arrives at a relative flat region after t1; thus, the parallel branch must have reached the final state or steady state at t1. Hence, V2 and Qd1/3 are defined as the magnitude and charge constant of the charging process for the parallel branch, respectively, as shown in Fig. A1. QCV and q-diode region
Figure A1 shows that the discharge curve can be replaced by a straight line in the NDOR. Therefore, a linear charge controlling voltage source is utilized to model the discharge curve, yielding the v–q discharge equation.
220
1
3
1
~0,~
,-)1(),( d1
d
dQ
q
oocbt
QqtttC
QqeARIVtqV
(A5)
In this region, q is remarkably larger than Qd1, and the slope can be attained by
32211
12
),(),( V
Q
tQVtQV
QQC
dd
dd
, (A6)
where Q and V3 can be obtained from Fig. A1. In the charged-diode region, the discharge curve is
remarkably similar to the forward characteristic of a diode. Consequently, a charge-controlling diode is used to describe the discharge curve in CDR, yielding the following diode equation:
finald
x
q
dbt
QQqttt
eBtQVtqV
~,~
)1(),(),(
232
22
, (A7)
C
QQARIVtQV dd
oocd12
122 ),(
. (A8)
In comparison with a general diode, the coefficient B is defined as a reverse-saturation voltage, and the coefficient x is referred as the thermal capacity. Both parameter values increase with the rise of temperature.
In Eq. (A7), B and x are two unknown parameters. Two arbitrary points in CDR of Fig. A1 are selected to estimate both parameters.
Overall v–q discharge equation and simulation model Based on the above discussion, a battery characteristic
curve can be modeled by an overall v-q equation as follows:
)1(
)1(),(
1
3
1d1
x
qd
Q
q
oocbt
eBC
eARIVtqV (A9)
where final
tQqttttIdtIq ~0,~, 30o0 o .
Equation (A9) is a standard v–q discharge equation because it can be used to predict the discharge characteristic of a battery at standard discharge mode (0.5 °C, 25 °C). A numerical simulation discharge model has been presented using the overall v-q equation, as illustrated in Fig. A2(b).
ACKNOWLEDGMENT
This work was supported by the Natural Science Foundation of China (No. 51277004) and Beijing Municipal
Natural Science Foundation (No. KZ201510009008).
REFERENCES
[1] J. Jang and J. Yoo, “Equivalent circuit evaluation method of lithium polymer battery using bode plot and numerical analysis,” IEEE Trans. Energy Convers., Vol. 26, No. 1, pp. 290–298, Mar. 2011.
[2] B. Scrosati and J. Garche, “Lithium batteries: Status, prospects and future,” Journal of Power Sources, Vol. 195, No. 9, pp. 2419–2430, May 2010.
[3] X. Hu, R. Xiong, and B. Egardt, “Model-based dynamic power assessment of lithium-ion batteries considering different operating conditions,” IEEE Trans. Ind. Informat., Vol. 10, No. 3, pp. 1948–1959, Aug. 2014.
[4] X. Hu, S. Li, and H. Peng, “A comparative study of equivalent circuit models for Li-ion batteries,” Journal of Power Sources, Vol. 198, No. 15, pp. 359-367, Jan. 2012.
[5] B. Pattipati, C. Sankavaram, and K. R. Pattipati, “System identification and estimation framework for pivotal automotive battery management system characteristics,” IEEE Trans. Syst, Man, Cybern, Part C (Applications and Reviews), Vol. 41, No. 6, pp. 869-884, Nov. 2011.

Fundamental Small-signal Modeling of Li-ion Batteries and a Parameter Evaluation Using … 513
[6] M. Chen and G. A. Rincon-Mora, “Accurate electrical battery model capable of predicting runtime and I–V performance, ” IEEE Trans. Energy Convers., Vol. 21, No. 2, pp. 504–511, Jun. 2006.
[7] H. Blanke, O. Bohlen, S. Buller, R. W. De Doncker, B. Fricke, A. Hammouche, D. Linzen, M. Thele, and D. U. Sauer, “Impedance measurements on lead-acid batteries for state-of-charge, state-of-health and cranking capability prognosis in electric and hybrid electric vehicles,” Journal of Power Sources, Vol. 144, No. 2, pp. 418–425, Jun. 2005.
[8] F. Yusivar, H. Haratsu, M. Sato, S. Wakao, K. Kondo, K. Matsuoka, and T. Kawamatsu, “The modeling of lead-acid battery by frequency-response characteristics,” IEEJ Trans. Fundamentals and Material, Vol. 122, No. 8, pp. 715–721, Aug. 2002.
[9] S. Buller, M. Thele, R. W. De Doncker, and E. Karden, “Impedance based simulation models of super capacitors and Li-ion batteries for power electronic applications,” in Industry Applications Conference, Oct. 2003.
[10] R. S. Robinson, “On-line battery testing: a reliable method for determining battery health?”IEEE Telecommunications Energy Conf., pp. 654–661, Oct. 1996.
[11] J. O’M. Bockris, A. K. Reddy, and M. Gamboa-Aldeco, Modern Electrochemistry 2A:Fundamentals of Electrodics, 2nd edition, Kluwer Academic, Chap. 7, pp. 1138, 2000.
[12] Product catalog of zhicheng champion, http://www. zhicheng-champion.com/index.html, 2016.
[13] C. L. Philips, J. M. Parr, and E. Riskin, Signals, Systems, and Transforms, 3th edition, Prentice Hall, Chap. 3, pp. 111-112, 2004.
[14] The definition of the cross-correlation, https://en. wikipedia.org/wiki/Cross-correlationk.
[15] M. Urbain, M. Hinaje, S. Rael, B. Davat, and P. Desprez, “Energetical modeling of lithium-ion batteries including electrode porosity effects,” IEEE Trans. Energy Convers., Vol. 25, No. 3, pp. 862-872, Sep. 2010.
[16] B. E. Conway, Electrochemical Supercapacitors: Scientific Fundamentals and Technological Applications, Kluwer Academic/Plenum Press, Chap. 2, pp. 91-92, 1999.
[17] J. O’M. Bockris, A. K. Reddy, and M. Gamboa-Aldeco, Modern Electrochemistry:Fundamentals of Electrodics, 2nd edition, Kluwer Academic, Chap. 7, pp. 1133-1134, 2000.
[18] Autolab Application Note EIS03 Electrochemical Impedance Spectroscopy (EIS) Part 3- Data Analysis, Ω Metrohm Autolab B.V., Jul. 2011.
[19] E. C. Levy, “Complex-curve fitting,” IRE Trans. Autom. Control, Vol. AC-4, No. 1, pp. 37–43, May 1959.
[20] J. Proakis and D. Manolakis, Digital Signal Processing: Principle, Algorithm, and Applications, 3th edition, Prentice-Hall, 1996.
[21] C. Sanathanan and J. Koerner, “Transfer function synthesis as a ratio of two complex polynomials,” IEEE Trans. Autom. Control, Vol. 8, No. 1, pp.56-58, Jan. 1963.
Xiaoqiang Zhang received his M.S. degree (with honors) from the School of Electrical Engineering, North China University of Technology, Beijing, China in 2007. He is currently working toward his Ph.D. degree in the School of Information and Electronics, Beijing Institute of Technology, Beijing, China. His work focuses on modeling for
high-power Li-ion battery and its application.
Mao Zhang received his M.S. degree from the University of Central Lancashire, Preston, UK in 2011. He is currently working toward his Ph.D. degree in the School of Information and Electronics, Beijing Institute of Technology, Beijing, China. His current research includes the design, analysis, and characterization of power semiconductor
devices, resonant power conversion, and inverters.
Weiping Zhang was born in Xi’an, China in 1957. He received his B.S. degree from the Northeast University, Shenyang, China, in 1982, his M.S. degree from the Beijing Institute of Technology, Beijing, China in 1987 and his Ph.D. degree from the Zhe Jiang University, Hangzhou, China in 1998. He is currently a professor at the North
China University of Technology, Beijing, China. He owns nine Chinese patents, and has authored and co-authored more than 50 journal articles published in referenced journals. His current research interests include high-intensity discharge lamp ballasts, resonant converters, electromagnetic compatibility, power electronic integration, and renewable energy.


![SHORT COURSE ON LITHIUM-ION BATTERIES - NASA · TFAWS 2016 SHORT COURSE ON LITHIUM ION BATTERIES 12 Li-ion batteries generate heat during charge and discharge operations due to [45]:](https://img.dokumen.tips/doc/110x75/5f0838157e708231d420ecdb/short-course-on-lithium-ion-batteries-nasa-tfaws-2016-short-course-on-lithium.jpg)