Embed Size (px)
Citation preview

This is a pre‐publication version of Mapping the East End ‘Labyrinth’ – a book chapter to be published in ‘Jack the Ripper and the East End Labyrinth’, Museum of London and Random House (2008, forthcoming) Dr Laura Vaughan Senior Lecturer in Urban and Suburban Settlement Patterns UCL Bartlett School of Graduate Studies University College London 1‐19 Torrington Place London WC1E 7HB United Kingdom E [email protected] T +44 (0) 20 7679 1981 F +44 (0) 20 916 1887 www.space.bartlett.ucl.ac.uk/people/laura/
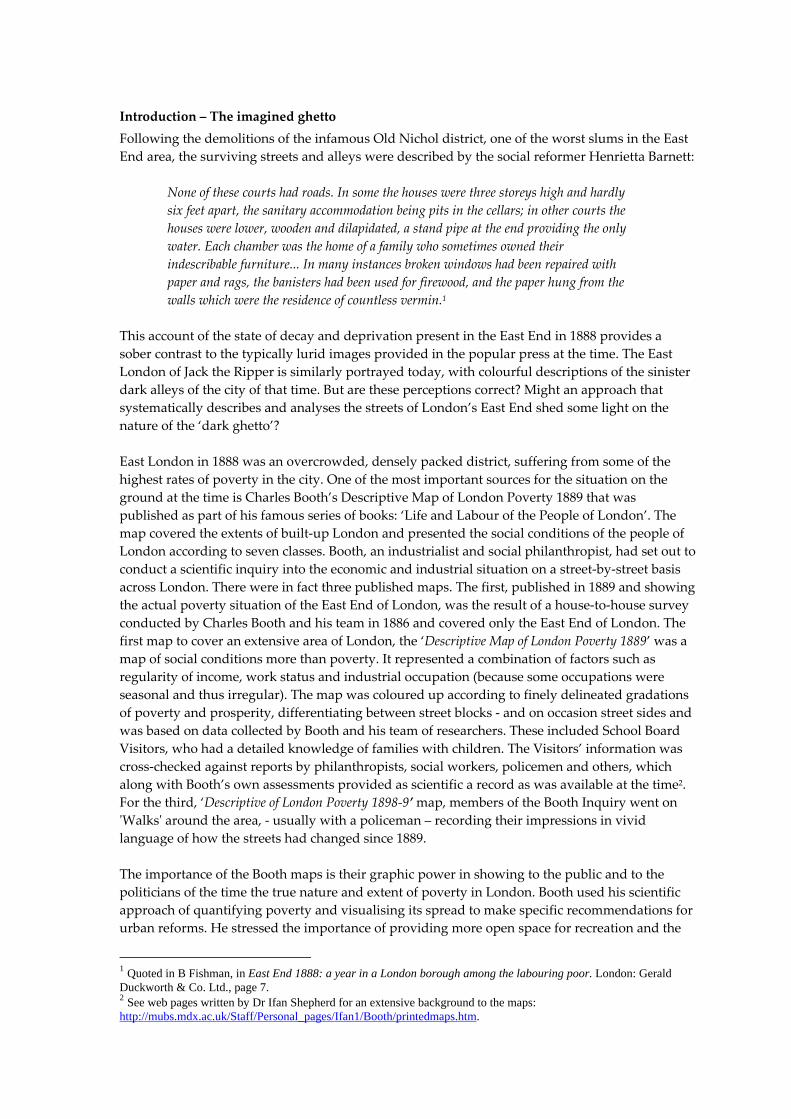
Introduction – The imagined ghetto Following the demolitions of the infamous Old Nichol district, one of the worst slums in the East End area, the surviving streets and alleys were described by the social reformer Henrietta Barnett:
None of these courts had roads. In some the houses were three storeys high and hardly six feet apart, the sanitary accommodation being pits in the cellars; in other courts the houses were lower, wooden and dilapidated, a stand pipe at the end providing the only water. Each chamber was the home of a family who sometimes owned their indescribable furniture... In many instances broken windows had been repaired with paper and rags, the banisters had been used for firewood, and the paper hung from the walls which were the residence of countless vermin.1
This account of the state of decay and deprivation present in the East End in 1888 provides a sober contrast to the typically lurid images provided in the popular press at the time. The East London of Jack the Ripper is similarly portrayed today, with colourful descriptions of the sinister dark alleys of the city of that time. But are these perceptions correct? Might an approach that systematically describes and analyses the streets of London’s East End shed some light on the nature of the ‘dark ghetto’? East London in 1888 was an overcrowded, densely packed district, suffering from some of the highest rates of poverty in the city. One of the most important sources for the situation on the ground at the time is Charles Booth’s Descriptive Map of London Poverty 1889 that was published as part of his famous series of books: ‘Life and Labour of the People of London’. The map covered the extents of built‐up London and presented the social conditions of the people of London according to seven classes. Booth, an industrialist and social philanthropist, had set out to conduct a scientific inquiry into the economic and industrial situation on a street‐by‐street basis across London. There were in fact three published maps. The first, published in 1889 and showing the actual poverty situation of the East End of London, was the result of a house‐to‐house survey conducted by Charles Booth and his team in 1886 and covered only the East End of London. The first map to cover an extensive area of London, the ‘Descriptive Map of London Poverty 1889’ was a map of social conditions more than poverty. It represented a combination of factors such as regularity of income, work status and industrial occupation (because some occupations were seasonal and thus irregular). The map was coloured up according to finely delineated gradations of poverty and prosperity, differentiating between street blocks ‐ and on occasion street sides and was based on data collected by Booth and his team of researchers. These included School Board Visitors, who had a detailed knowledge of families with children. The Visitors’ information was cross‐checked against reports by philanthropists, social workers, policemen and others, which along with Booth’s own assessments provided as scientific a record as was available at the time2. For the third, ‘Descriptive of London Poverty 1898‐9’ map, members of the Booth Inquiry went on ʹWalksʹ around the area, ‐ usually with a policeman – recording their impressions in vivid language of how the streets had changed since 1889. The importance of the Booth maps is their graphic power in showing to the public and to the politicians of the time the true nature and extent of poverty in London. Booth used his scientific approach of quantifying poverty and visualising its spread to make specific recommendations for urban reforms. He stressed the importance of providing more open space for recreation and the
1 Quoted in B Fishman, in East End 1888: a year in a London borough among the labouring poor. London: Gerald Duckworth & Co. Ltd., page 7. 2 See web pages written by Dr Ifan Shepherd for an extensive background to the maps: http://mubs.mdx.ac.uk/Staff/Personal_pages/Ifan1/Booth/printedmaps.htm.

benefit of opening up the hemmed‐in poverty areas. He also used his influence to suggest the introduction of old‐age pensions and revisions to the census to allow data to be gathered on overcrowding, which he viewed as vital to obtaining more accurate figures on population numbers in poor areas as well as for measuring poverty itself.
Booth map of poverty in London, 1889, courtesy Museum of London Even the briefest of looks at Booth’s map, the first of which coincides almost perfectly with the year of the Ripper murders, shows a distribution of prosperity to poverty in a pattern that closely follows the sequence of square and avenue to thoroughfare, road, street, alley, court, yard, to dead‐end, rookery and slum. It is not only the fine scale layout which seems to have had an impact on social conditions – creating pockets of irregularity in the urban grid. Larger scale obstacles in the urban fabric had a deleterious effect on the ability of people to move around and improve their social and economic conditions. Booth frequently noted in his writing that physical boundaries such as railways had the effect of isolating areas, walling off their inhabitants and isolating them from the life of the city. The urban historian H. J. Dyos has pointed out “how often these introspective places were seized by the ʹcriminal classesʹ, whose professional requirements were isolation, an entrance that could be watched and a back exit kept exclusively for the getaway...” Dyos describes how Booth’s maps show how minor changes to the street layout frequently reinforced the tendency of poor areas to be cut off from the life of the city, writing how such changes “acted like tourniquets applied too long, and below them gangrene almost invariable set in… it was sometimes possible to run through the complete declension from meadow to slum in a single generation, or even less”3. Gareth Stedman Jones has also noted that...
One great effect of railway, canals and docks in cutting into human communities [is] a psychological one... East Londoners showed a tendency to become decivilised when their
3 Dyos, 1967 in Cannadine and Reeder, 1982, pages 140-141.
back streets were cut off from main roads by railway embankments... Savage communities in which drunken men and women fought daily in the streets were far harder to clear up, if walls or water surrounded the area on three sides, leaving only one entrance”.4
Booth, Dyos and Stedman Jones all point towards the possibility that changes to the urban layout can itself contribute to the decline of poverty areas. Scientific research into this subject has been taking place for the past 30 years within the field of ‘space syntax’, which uses architectural research methods as tools for studying built space and society.
The streetscape of poverty The study of the physical form of the city and its relationship to poverty helps us understand the East End in 1888. Research into Booth’s map of 1889 has found a strong relationship between the spatial location of poverty and a relative lack of physical accessibility. Yet, the separation between poor and more prosperous streets was not as sharp as previously thought. Although there were pockets of severe deprivation, these were frequently located in close proximity to more affluent areas. 5 The situation in the East End was more complex still if we consider the mix of people living in the area at the time. By the time of the Ripper murders the area contained two principal minority groups: Irish and Jewish. J. A. Jackson has described how the Irish influx had started a generation earlier with the famine of the 1840s, when many Irish migrants arrived in British ports – “destitute, starving and often diseased”6. By 1851 the number of Irish‐born in London had risen to almost 110,000. Due to a range of difficulties to do with their lack of skills and abject poverty, coupled with prejudice, the Irish immigrants continued to suffer from deprivation at the time of the Ripper murders. Lynn Lees has shown that many of them were still present in the East End as the poorest Irish immigrants and their families had to remain close to where work was available7. The other significant group in the area was that of the Jewish immigrants, who similar to the mainly Catholic Irish, had only achieved relatively recent emancipation. Although Jewish resettlement in England is normally dated from 1656, settlement in London in general and the East End of London in particular was still quite limited until 1881. Jewish settlement in Britain, particularly in major port cities, gained momentum in the early 1880s due to economic need in the “Pale of Settlement” (an area on the western edge of the Russian Empire established in 1771 to prevent the Jews of White Russia from spreading throughout Russia) coupled with anti‐Semitic pogroms. This led to large waves of Jewish refugees arriving from Eastern Europe, intensifying the existing established settlement in London from 1882 onwards. Although the Jewish immigrants arrived with similarly high levels of poverty to those of the Irish, some had an advantage in their being a more urbanised and craft‐skilled population. They quickly filled a narrow range of home‐based workshop occupations, such as tailoring and boot‐ and shoe‐making, which enabled small‐scale employment within the immigrant community. Still, there is clear evidence about the extent of Jewish poverty, for example in an article from the Spectator in 18878, figures are given stating that every third Jew in London was in receipt of poor relief and every second Jew belonged to the regular pauper class. Much of this was due to the seasonal 4 Stedman Jones, G. (1971) Outcast London: a study in the relationship between classes in Victorian society. Oxford (Peregrine Penguin Edition, 1984): Clarenden Press, pages 15-16. 5 See Vaughan, L. (2007) The spatial form of poverty in Charles Booth's London, Progress in Planning: special issue on The Syntax of Segregation, edited by Laura Vaughan, 67, 231-250. Online http://eprints.ucl.ac.uk/archive/00003273/. 6 Jackson, J. A. (1964) ‘The Irish’ in London: Aspects of Change, Vol. 3 (Ed. Glass, R.). London: MacGibbon and Kee, page 299. 7 Lees, L. H. (1979) Exiles of Erin: Irish migrants in Victorian London. Manchester: Manchester UP. 8 See B Fishman, 1988, page 134.

nature of their occupations, which led to a precarious livelihood for the incoming Jewish immigrants. Whitechapel was one of the poorest districts in London, it had one of the largest concentrations of lodging houses.. Yet it is important also to note that the district had a wide variety of poverty, as is evident from the Booth maps. The influx of Jewish immigrants in the 1880s provided new unskilled jobs and this influx, coupled with the street layout that contained a fine grain of poverty and relative prosperity cheek by jowl, created a situation of high levels of economic interdependence between the two populations. 9 Despite perceptions of the immigrants living a ‘ghettoised’ life separate from the existing population, spatial analysis coupled with historical evidence suggests that the situation was much more complex: there was likely to have been considerable contact between the two populations. 10 11
9 See Davin, A. (1996) Growing Up Poor: Home, School and Street in London 1870-1914. London: Rivers Oram Press, pages 158-159. 10 See Vaughan, L. (2005) The relationship between physical segregation and social marginalisation in the urban environment, World Architecture, 185, 88-96. Online http://eprints.ucl.ac.uk/archive/00000884/. 11 It is important to note that in addition to the two immigrant populations referred to here, there was a significant population of London-born, indeed, locally born people living in the area. If we look for example at the census of 1891 for the Spitalfields district (see D Rau, 2006), analysis of the dataset finds that 25% of the district were locals and another 27% were Londoners. Of the 18% other British, in addition to some obvious port towns such as Plymouth, Devonport, Folkestone, Portsmouth and Harwich, places of birth given include: Birmingham, Cambridge, Cardiff, Cheltenham, Chesham, Essex, Guernsey and Manchester. As well as the obvious Irish and Jewish countries of origin, other places mentioned are South America, America, Canada and Germany.

Space Syntax Space syntax is a theory of space and a set of analytical, quantitative and descriptive tools for analysing the layout of space in buildings and cities. Originating in the Bartlett School of Architecture, University College London in the 1970s, it started with an attempt to understand if there was an underlying architectural explanation for the social failure of 20th century English housing estates. The research field aims to answer key architectural and urban design questions, starting with whether the layout of cities has an impact on how people use streets.
Space syntax analysis is concerned with systematically describing and analysing streets, squares and all open public space as a continuous system in order to measure how well connected each street space is to its surroundings. This is done by taking an accurate map and drawing a set of intersecting lines through all the spaces of the urban grid so that the grid is covered and all rings of circulation are completed. The resulting set of lines is called an ‘axial map’.
Axial map showing East End area
Space syntax analysis computes all the lines according to their relative depth to each other, using simple mathematical measures. The terminology used to describe this depth states how spatially integrated or segregated it is. The resulting numbers then form the basis for coloured up maps which represent the distribution of spatial accessibility. The range of numbers goes from red for the most accessible (integrated) through the colour spectrum to blue for the least accessible (segregated).
Processed Axial map showing EastEnd area
By examining space in this way we can analyse the correspondence between spatial segregation/integration and social statistics. For example, we can research whether there is a relationship between the location of burglaries and housing layout; or, whether more successful shopping streets have spatial characteristics in common. This is done by using statistical analysis to measure the correspondence between spatial and social measures.
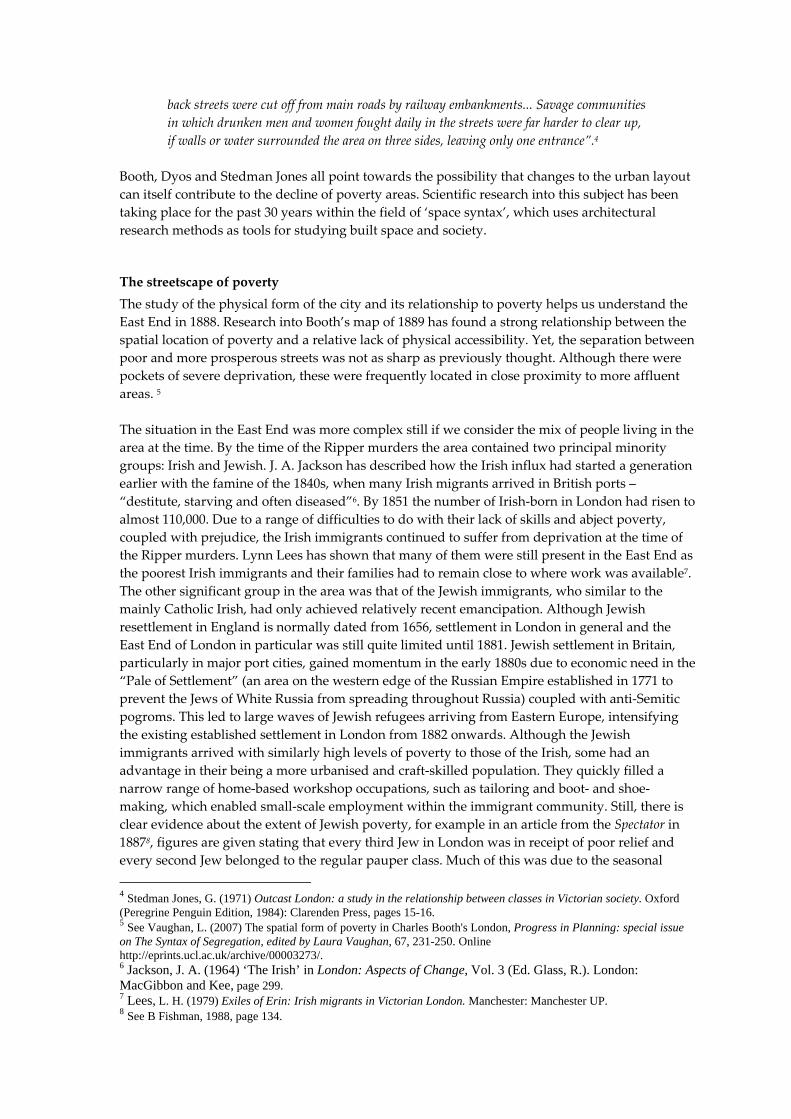
“The worst street I have seen so far” A striking illustration of the ability of maps to shed light on the spatial context of the area can be found in the Goad Fire Insurance plans. From the 1880s the Goad Company was dominant in the field of fire insurance plans and they used large scale (40’=1”) plans to record their surveys of fire insurance risk across Britain, concentrating on major towns and cities. They used a wide range of colours, signs and symbols to show information such as building materials (brick, stone or concrete; wood, metal or timber), windows, building heights, roofs and skylights as well as street widths and the precise building footprint. In addition, building use (shop, dwelling and so on) was recorded. The surveys were undertaken on a 5 yearly basis (and in some cases more frequently) to capture information on the level of fire risk, such as a hay store as opposed to a boot factory, as well as to record the spatial concentration of policy holders of individual insurance companies. If we consider one of the murder victims attributed to Jack the Ripper, we can see how the maps can shed light on the urban environment at the time. Mary Jane Kelly is believed to have been aged around twenty‐five and, like the other victims, in poverty at the time of her death in November 1888. Bill Fishman describes that the murdered body of Mary Jane Kelly was found in a “filthy one‐roomed dwelling at No. 9 of the enclosed Millers Court off Dorset Street”. The Goad Fire Insurance map for the Dorset Street area shows that Millers Court was an extremely narrow, enclosed courtyard surrounded by two‐storey brick‐built dwellings. It was entered from a roof‐tiled passageway leading north from Dorset Street. The street, coloured on the Booth map as black, ‘vicious, semi‐criminal’, can be seen on the Goad plan as comprising run‐down low‐rent tenement houses, extensive lodging houses to accommodate the itinerant poor and only a handful of shops and public houses. Dorset Street’s western end faced the Providence Row Night Refuge and School and to the east it faced the wider, better lit expanses of Commercial Street. The Goad plan suggests that the route from Commercial Street would not have been particularly well observed late at night, with a boot factory and public house framing the entrance from the main road, leading past shops on Dorset Street, with only the dwellings overlooking Millers Court itself likely to have provided any witnesses. At the larger scale, the plan illustrates the wide range of housing and building types in the area, from shops and small warehouses and factories with dwellings over on Commercial Street to lodging houses in Dorset Street and White’s Row.
Section of Goad Fire Insurance plan, Vol. 11, sheet 314 © and database right Crown Copyright and Landmark Information Group Ltd.

Millers Court was just two turnings away from Commercial Street, which contained workshops and tailoring establishments, employing the skilled and semi‐skilled inhabitants of the area. Overlaid on the map of building layout at the time (redrawn from the Booth maps), is an extract from a ‘space syntax’ map of spatial accessibility coloured up in shades from red to dark blue to represent values ranging on a scale from integrated to segregated. It is notable, on the one hand, that Dorset Street is coloured in the middle‐to‐high tones of the scale, indicating relatively high levels of accessibility and indeed the street itself was only a few steps off Commercial Street, which was one of the main streets in the district. But the court itself was more segregated, with a lower level of accessibility. This is typical of the street layout of the time, with a juxtaposition of segregated back alleys a few turnings away from the local main street. Looking at the map, it is evident how the spatial structure of the area created the possibility for busy and quiet streets to be located within close proximity to each other.12 The location of the murder site quite close to Commercial Street is not surprising, bearing in mind that the perpetrator probably met his victims on relatively busy streets. On the other hand, in order to carry out the murder, he needed the relative quiet of the back alleys of the area, and, in this case, Mary Jane Kelly’s single room lodging in Miller’s Court. It is striking to note that if we look at the location of the other murder sites, a similar spatial structure is revealed, with the streets typically being in the medium to low colour range, but not completely segregated, as might have been envisaged.
Space syntax map showing distribution of integration from red (integrated) to blue (segregated) in the vicinity of Dorset Street Taking into consideration the social and economic situation of the surrounding streets, we see in the illustration showing the murder location in relation to Booth’s classification of poverty classes that there was a dramatic drop in economic situation between the dwellings and shops on Commercial Street ‐ coloured red, and the buildings in the alleys and courts just a few steps away ‐ which were coloured in the lowest classification of black. 13
12 Contemporary space syntax research by Bill Hillier and colleagues into urban layout and crime supports these conclusions. In a paper called ‘Can Streets be Made Safe?’, he maintains that safer streets can be created by relatively minor changes to street layout, such as avoiding rear access points, making sure that public spaces are continuously aligned by building entrances and making sure that building entrances can be seen from each other. Such changes can have a measurable impact on natural surveillance and help to deter street crime. See Hillier, B. (2004) Can streets be made safe?, Urban Design International,, 9, 31-45. Online http://eprints.ucl.ac.uk/archive/00001060/. 13 It is important to note that the classification of streets as red on the maps, ostensibly denoting a comfortable ‘middle class’ situation, masks a finer set of distinctions which can be found in the published statistics. It is likely that these
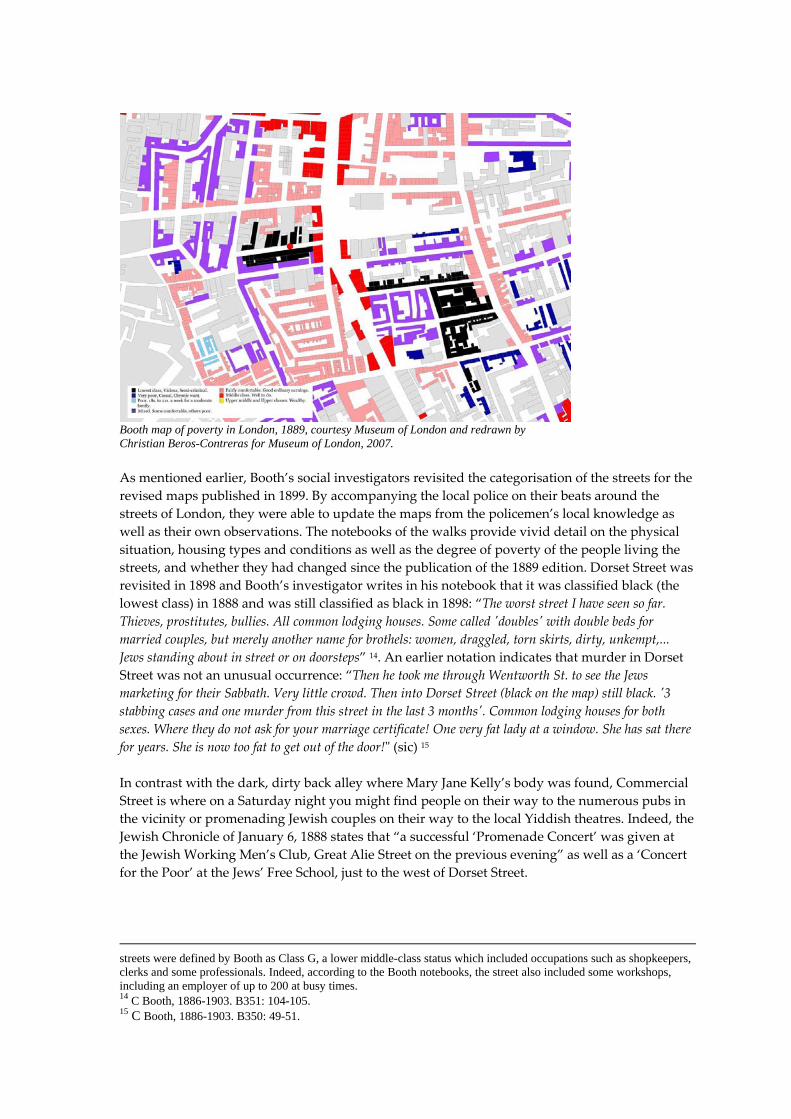
Booth map of poverty in London, 1889, courtesy Museum of London and redrawn by Christian Beros-Contreras for Museum of London, 2007. As mentioned earlier, Booth’s social investigators revisited the categorisation of the streets for the revised maps published in 1899. By accompanying the local police on their beats around the streets of London, they were able to update the maps from the policemen’s local knowledge as well as their own observations. The notebooks of the walks provide vivid detail on the physical situation, housing types and conditions as well as the degree of poverty of the people living the streets, and whether they had changed since the publication of the 1889 edition. Dorset Street was revisited in 1898 and Booth’s investigator writes in his notebook that it was classified black (the lowest class) in 1888 and was still classified as black in 1898: “The worst street I have seen so far. Thieves, prostitutes, bullies. All common lodging houses. Some called ʹdoublesʹ with double beds for married couples, but merely another name for brothels: women, draggled, torn skirts, dirty, unkempt,... Jews standing about in street or on doorsteps” 14. An earlier notation indicates that murder in Dorset Street was not an unusual occurrence: “Then he took me through Wentworth St. to see the Jews marketing for their Sabbath. Very little crowd. Then into Dorset Street (black on the map) still black. ʹ3 stabbing cases and one murder from this street in the last 3 monthsʹ. Common lodging houses for both sexes. Where they do not ask for your marriage certificate! One very fat lady at a window. She has sat there for years. She is now too fat to get out of the door!ʺ (sic) 15 In contrast with the dark, dirty back alley where Mary Jane Kelly’s body was found, Commercial Street is where on a Saturday night you might find people on their way to the numerous pubs in the vicinity or promenading Jewish couples on their way to the local Yiddish theatres. Indeed, the Jewish Chronicle of January 6, 1888 states that “a successful ‘Promenade Concert’ was given at the Jewish Working Men’s Club, Great Alie Street on the previous evening” as well as a ‘Concert for the Poor’ at the Jews’ Free School, just to the west of Dorset Street.
streets were defined by Booth as Class G, a lower middle-class status which included occupations such as shopkeepers, clerks and some professionals. Indeed, according to the Booth notebooks, the street also included some workshops, including an employer of up to 200 at busy times. 14 C Booth, 1886-1903. B351: 104-105. 15 C Booth, 1886-1903. B350: 49-51.
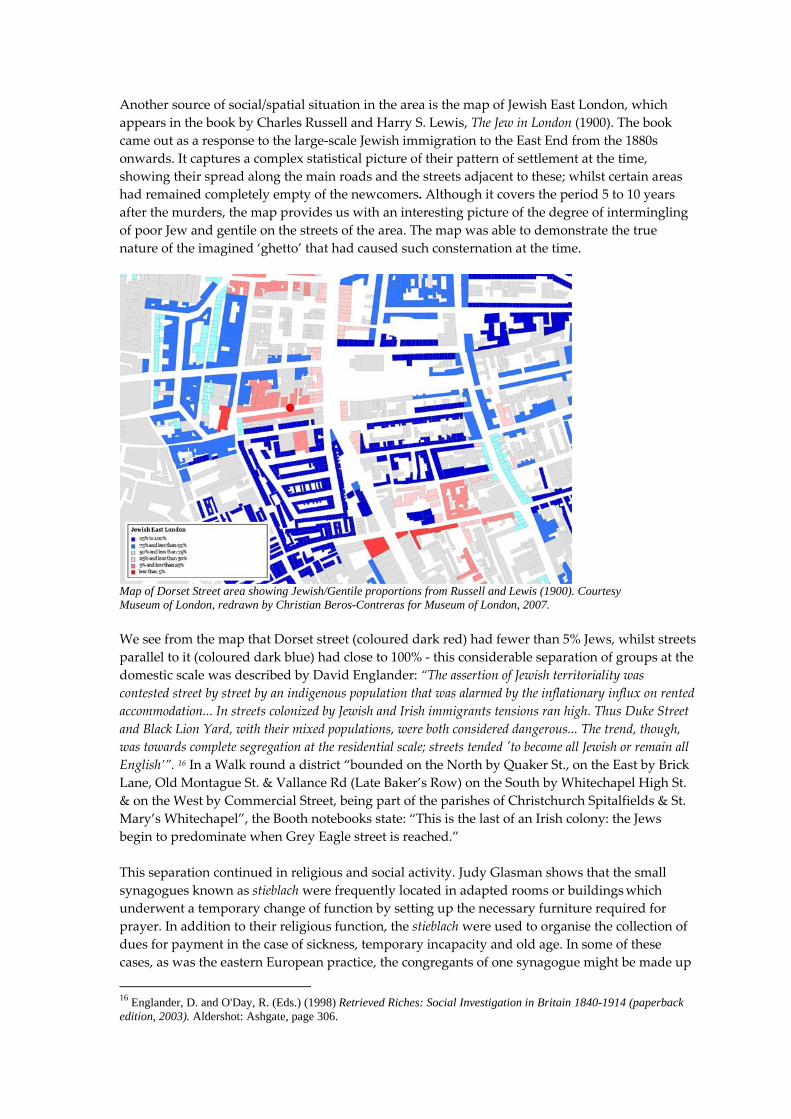
Another source of social/spatial situation in the area is the map of Jewish East London, which appears in the book by Charles Russell and Harry S. Lewis, The Jew in London (1900). The book came out as a response to the large‐scale Jewish immigration to the East End from the 1880s onwards. It captures a complex statistical picture of their pattern of settlement at the time, showing their spread along the main roads and the streets adjacent to these; whilst certain areas had remained completely empty of the newcomers. Although it covers the period 5 to 10 years after the murders, the map provides us with an interesting picture of the degree of intermingling of poor Jew and gentile on the streets of the area. The map was able to demonstrate the true nature of the imagined ‘ghetto’ that had caused such consternation at the time.
Map of Dorset Street area showing Jewish/Gentile proportions from Russell and Lewis (1900). Courtesy Museum of London, redrawn by Christian Beros-Contreras for Museum of London, 2007. We see from the map that Dorset street (coloured dark red) had fewer than 5% Jews, whilst streets parallel to it (coloured dark blue) had close to 100% ‐ this considerable separation of groups at the domestic scale was described by David Englander: “The assertion of Jewish territoriality was contested street by street by an indigenous population that was alarmed by the inflationary influx on rented accommodation... In streets colonized by Jewish and Irish immigrants tensions ran high. Thus Duke Street and Black Lion Yard, with their mixed populations, were both considered dangerous... The trend, though, was towards complete segregation at the residential scale; streets tended ʹto become all Jewish or remain all English’”. 16 In a Walk round a district “bounded on the North by Quaker St., on the East by Brick Lane, Old Montague St. & Vallance Rd (Late Baker’s Row) on the South by Whitechapel High St. & on the West by Commercial Street, being part of the parishes of Christchurch Spitalfields & St. Mary’s Whitechapel”, the Booth notebooks state: “This is the last of an Irish colony: the Jews begin to predominate when Grey Eagle street is reached.” This separation continued in religious and social activity. Judy Glasman shows that the small synagogues known as stieblach were frequently located in adapted rooms or buildings which underwent a temporary change of function by setting up the necessary furniture required for prayer. In addition to their religious function, the stieblach were used to organise the collection of dues for payment in the case of sickness, temporary incapacity and old age. In some of these cases, as was the eastern European practice, the congregants of one synagogue might be made up
16 Englander, D. and O'Day, R. (Eds.) (1998) Retrieved Riches: Social Investigation in Britain 1840-1914 (paperback edition, 2003). Aldershot: Ashgate, page 306.

of members of the same trade. As shown by Anne Kershen, grouping by trade led to grouping by trade union17. So even though religious observance was lesser than in the old country, this did not lead to Jewish immigrants stopping their attendance at a synagogue as it served both as a source of their social network and as an economic support structure. This is illustrated by the map of churches, schools and pubs, which shows the close juxtaposition of the churches and synagogues of the area, but with a street‐wise separation between them.
Dorset Street area adapted from map of ‘Religious Worship, Public Elementary Schools and Licensed Houses’ c. 1899-1900 held by Museum of London. Redrawn by Christian Beros-Contreras for Museum of London, 2007. The 1891 census provides us with more information about the population mix in the vicinity of the murder locations 18. Taking Dorset Street as the locus of the analysis, it is evident that of the 372 inhabitants, 42% of Jewish workers for whom there is an occupation listed, were in the clothing manufacturing business, and only 3% of their non‐Jewish neighbours were classified as such. In contrast, the most common occupations for the non‐Jewish inhabitants were Carman (large vehicle driver who moved furniture or large goods, 5%), Docker (dock worker who loaded and unloaded cargo, 13%), Hawker (9%) or Labourer (10%); the comparative proportions for their Jewish neighbours were close to nil. It is clear that there was little common ground between the two immigrant groups from the point of view of industrial activity, but to what degree were the Jewish immigrants separated from their neighbours outside of work? Whilst the relatively prosperous inhabitants tended to be quite segregated by religion, the poorest were apparently not in a position to do so to the same extent. Numerous entries in the notebooks record there being a mixture of Jewish and Irish in the same street and occasionally in the same dwelling, see for example the following text transcribed from the Booth notebooks:
17 Kershen, A. (1995) Uniting the Tailors: Trade Unionism Amongst the Tailors of London and Leeds, 1870-1939. Ilford, Essex: Frank Cass & Co., page 37. 18 See Rau, D. 1996. "The 1891 Census in Spitalfields: as source for migration," in Patterns of Migration, 1860-1914: proceedings of the conference of the Jewish Historical Society and the Institute of Jewish Studies, University College London. Edited by A. Newman and S. W. Massil, pp. 283-291. London: JHSE in assoc. Institute of Jewish Studies, UCL.

“West along Brushfield St. North up Gun St. Very rough. Mixture of dwelling houses & factories. 3 st[orey] & attic houses. A Jewish common lodging at the N.W. end. Where the Jew thieves congregate. It is called ʹthe poor Jews homeʹ on the board outside. South of Brushfield St. Gun Lane is rougher than the North end. Street narrow. Loft across from wall to wall. Old boots & mess in St. 4½ st[orey] houses, a lodging house at S.E. end. Dilapidated looking: ticket of leave men living here: at least dark blue on map purple. ʹBut it is not a street particularly noted for prostitutes!’ at the North end is Fort St. Fairly well to do. Pink rather than purple of map: ‘Jew middlemen live hereʹ ‐‐‐‐ it is Steward St. 4 storied. Windows dirty but pink in map purple. Duke St. has houses on East side. The west side is all factories & warehouses. Character d[ark] blue to [light blue] in [1888] map purple. The coster flower & fruit sellers in Liverpool St. come from here! Inhabitants are a mixture of Jews & Irish. South into Artillery Lane. 3 st[orey] synagogue on West side.”19 If we return to the space syntax maps we see that there were quite well integrated streets very close to the more segregated back alleys. What does this tell us about the character of the East End’s local streets? Previous research has shown that the spatial form of the city sets in motion the process by which collections of buildings become the living cities we know, with all their density and diversity of spaces and activities. Studies of cities around the world have found that the layout of the urban grid shapes movement flows, so that some locations in the grid are naturally movement‐rich, while others are naturally movement‐poor. The consequence for places like the East End, is that although the different class and religious groups might be separated at the residential scale (in the back streets) once they were in the busy main roads, they are not only ‘co‐present’ ‐ the basic ingredient of community ‐ they also had a potential for social interaction, at the very least through trade and industry.
Conclusions Prior to 1888, piecemeal slum clearances had taken place in the East End and elsewhere in London. These had only a localised effect and in fact, in some areas overcrowding and concentration of poverty was exacerbated by the clearance of adjacent neighbourhoods. This caused the closed, crooked courts to fill up with the most impoverished people of the district that had been cleared. Following the publication of Booth’s maps (and the Ripper murders themselves), there was increasing public pressure to clear out the poor areas, and tidy up the existing “almost endless intricacy of courts and yards crossing each other... like a rabbit warren” (as described by Henry Mayhew in ‘London Labour and the London Poor’). Robin Evans has since commented that the campaign to destroy the poor areas of the 19th century, was due to their being viewed in the public eye at the time to be breeding grounds for indecency. Overcrowding was linked with immorality. The morphology – the physical form and layout of the city– was itself viewed by the general public as a source of the immorality of its inhabitants, and was considered to be a significant obstacle to policing20. Booth’s maps were able to lift the curtain of image and stereotypes and to create an informed basis for new legislation to alleviate the situation of the East End. As has been shown by Bill Fishman, following the Ripper murders two Acts of Parliament were passed that were to have a profound effect on the living conditions of the East End: The House of the Working Classes Act 1890, which enabled local authorities to purchase land for improvement schemes and The Public Health Amendment Act 1890, which empowered every urban authority to make bye‐laws regarding supply of water to WCs, paving of yards and other aspects of sanitation. Under this act, unhealthy areas could be reported to the local
19 C Booth, 1886-1903. B351: 100-101. 20 Evans, R. Rookeries and Model Dwellings: English housing reform and the moralities of private space in Evans, R. (1997) Translations from Drawing to Building and Other Essays. London: Architectural Association.

authority on the grounds that any houses, courts or alleys were unfit for human habitation due to their narrowness, closeness, bad arrangement or bad condition of streets and houses. Rather than overcrowding: urban layout, the morphology itself, had been identified as the source of urban degeneration. By the end of the 19th century a number of Building Acts were passed so as to transform the traditional London morphology. These Acts required minimum street widths, maximum ratio of height to street width, no courts, no entrances closed off from the streets and no dead end streets. These rules led to building at higher densities, with greater distance between the blocks than before. Instead of building dense aggregations of two storey houses arranged in courts and alleys, housing was constructed with a setback from the road in front of the block to cope with the new height requirements, and with open space between the blocks at the rear. The new rules also prevented infill development due to the spacing restrictions. Height limits led to more restrictions on building proximity (due to the need for air circulation). Regulations were also set governing the form of staircase and balcony access. Although balconies were highly valued by tenants, this was seen as an unhealthy mixing of people within a block. Finally, legislation was made increasingly about rooms and their layout – minimum sizes were laid out and houses were ideally to be self contained. For the first time legislation explicitly defined the ways the buildings could be arranged and guaranteed that in the future there were to be no more complicated arrangements of rooms without outside access, light and air. All of these Acts together were seen to solve the problem of the poor: to safeguard health, to reform morals and ensure supervision. In addition they were planned to eliminate close association and high density which seemed to be so undesirable in the working classes. Thus began the end of philanthropic housing and the start of municipal and government‐led housing provision. If the labyrinth ever truly existed in 1888, it was soon to be straightened out by legislation and the beginning of the process of dispersing the poorest classes to the suburbs was to be set in motion. Jerry White sums this up succinctly:
Within six years Jack the Ripper had done more to destroy the Flower and Dean Street rookery than fifty years of road building, slum clearance and unabated pressure from the police, Poor Law Guardians, Vestries and Sanitary Officers.21
21 White, J. (2003) Rothschild Buildings: life in an East End tenement block 1887-1920. London: Pimlico, pages 29-30.
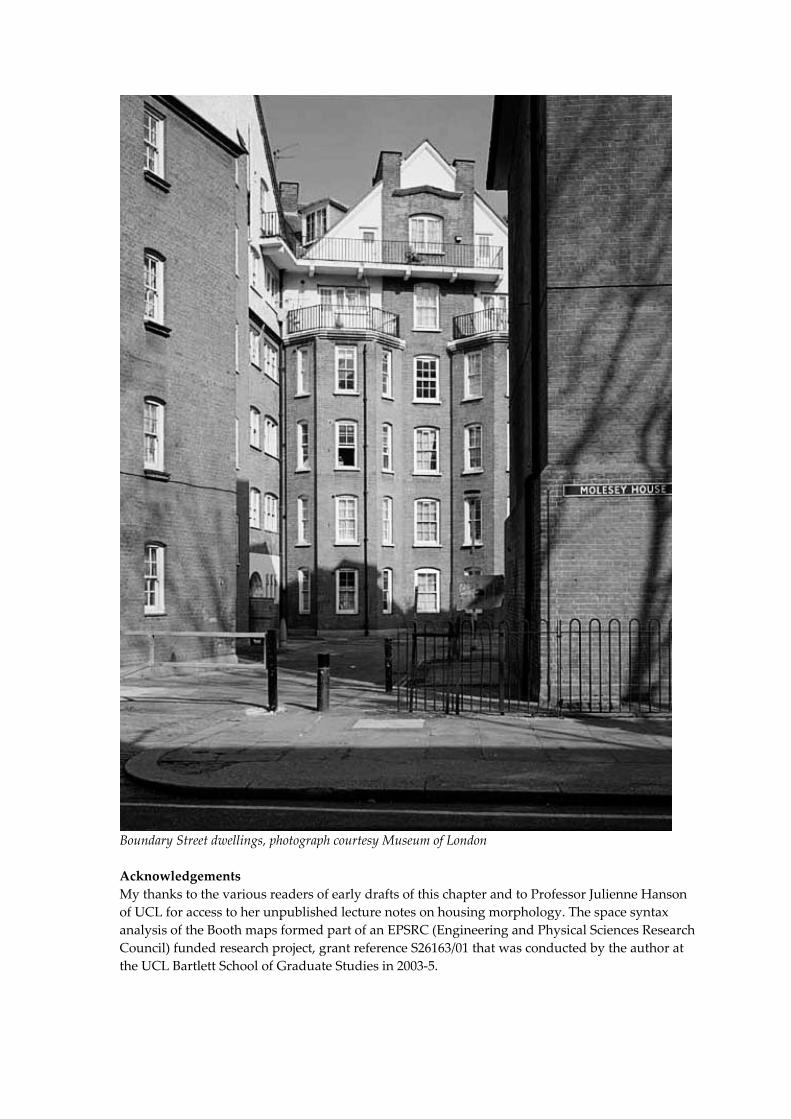
Boundary Street dwellings, photograph courtesy Museum of London Acknowledgements My thanks to the various readers of early drafts of this chapter and to Professor Julienne Hanson of UCL for access to her unpublished lecture notes on housing morphology. The space syntax analysis of the Booth maps formed part of an EPSRC (Engineering and Physical Sciences Research Council) funded research project, grant reference S26163/01 that was conducted by the author at the UCL Bartlett School of Graduate Studies in 2003‐5.
Further reading A good starting point for studying maps as a source of London’s history is P. Whitfield (2007) London: a life in maps. London: The British Library. See also the London Topographical Society’s printed version of the Charles Booth maps of 1889, which includes an illuminating introduction by D. Reeder (Publication no 130, 1984). Many other publications of the London Topographical Society are useful in this context, particularly the gazetteer and large‐format maps, see G. W. Bacon (1987) The A to Z of Victorian London, Kent & London: Harry Margary. On the internet, British History Online, http://www.british‐history.ac.uk/, contains a digital library of many key sources of maps and books for urban history and historical geography. The original Booth papers can be read at the London School of Economics and Political Science archive and online at http://booth.lse.ac.uk/. Edited extracts from his Life and Labour of the People in London can be found in H.W. Pfautz (1967): On the city: physical pattern and social structure; selected writings of Charles Booth: University of Chicago Press. A review of the methods of Booth’s study can be found in R. OʹDay and D. Englander (1993) Mr. Charles Boothʹs Inquiry: life and labour of the people in London reconsidered, London: Hambledon Press. In the field of urban history, the collection of papers by H.J. Dyos provides insight into the impact of urban development on life in the late nineteenth century, see Exploring the Urban Past: Essays in urban history, Cambridge: Cambridge University Press, edited by D. Cannadine and D. Reeder (1982). H. Carter’s work, in particular: An Introduction to Urban Historical Geography, London: Edward Arnold (1983), provides an important overview from mediaeval times onwards on this subject area. The most important starting point for space syntax analysis of the urban transformations wrought on London’s housing is J. Hanson’s (2000) ‘Urban transformations: a history of design ideas’, Urban Design International, 5, 97‐122, available online at http://eprints.ucl.ac.uk/archive/00001397/. Other key texts on space syntax are the first book published in the field: The Social Logic of Space B. Hillier and J. Hanson (1984), Cambridge: CUP and the edited collection by B. Hillier (1996) Space is the Machine: a configurational theory of architecture. Cambridge: CUP, available online at http://eprints.ucl.ac.uk/archive/00003881/. An interesting counterpoint to space syntax is the field of urban morphology and the work of M. P. Conzen is a good starting point – see ‘Analytical Approaches to the Urban Landscape’ (1978) in Dimensions of Human Geography: essays on some familiar and neglected themes, Chicago: Dept. of Geography, University of Chicago, 128‐110. The field of ethnic geography has burgeoned in the past 50 years, but some important starting points are C. Clarke, D. Ley and C. Peach (Eds.) (1984) Geography & Ethnic Pluralism. London: Allen & Unwin. Other key texts are P. Jackson (1987) Race and racism: essays in social geography, London: Allen & Unwin, 254‐275. as well as C. Peach ‘The Ghetto and the Ethnic Enclave’ (2005) in Desegregating the City: ghettos, enclaves and inequality edited by D. P. Varady, Albany: State University of New York Press, 31‐48. ‘The ethnic geography of EthniCities: The ʹAmerican modelʹ and residential concentration in London’, Ethnicities, 2, 209‐235, by R. Johnston, J. Forrest and M. Poulsen (2002) provide insight into the contemporary city, whilst a vital text on the geography of poverty is R. Lupton’s (2003) Poverty Street: The Dynamics of Neighbourhood Decline and Renewal. Bristol: The Policy Press.

![Actros 4844 KActros 4844 K - Mercedes-Benz · Actros 4844 KActros 4844 K [*] Item opcional. | Os dados apresentados em pesos consideram a versão de série do veículo e podem mudar](https://img.dokumen.tips/doc/110x75/5b702f787f8b9aad128d1830/actros-4844-kactros-4844-k-mercedes-benz-actros-4844-kactros-4844-k-item.jpg)