Embed Size (px)
Citation preview
Professor Andrew Markus
mapping social cohesion
2011the scanlon foundation surveys summary report

Copies of this report can be accessed and downloaded atwww.arts.monash.edu.au/mapping-population ISBN: 978-0-9871080-5-0Published in 2011 This work is copyright. Apart for any use permitted under the Copyright Act 1968, no part of it may be reproduced by any process without written permission from the publisher. Requests and inquiries concerning reproduction rights should be directed to the publisher: ACJC, Faculty of ArtsMonash UniversityBuilding H, Level 8, Caulfield campus900 Dandenong RoadCaulfield EastVictoria 3145Australia

CONTENTS Executive summary........................................................................................................................................................... 1
Project objectives ............................................................................................................................................................. 4
Scope and methodology ................................................................................................................................................... 5
The survey context ........................................................................................................................................................... 6
Prominence of issues ........................................................................................................................................................ 8
Ethnic diversity in the Australian population ................................................................................................................. 11
What is social cohesion?................................................................................................................................................. 12
The Scanlon‐Monash Index (SMI) of Social Cohesion ..................................................................................................... 13
SMI 1: Sense of belonging ...................................................................................................................................... 14
SMI 2: Sense of worth ............................................................................................................................................ 14
SMI 3: Social justice and equity .............................................................................................................................. 15
SMI 4: Participation ................................................................................................................................................ 16
SMI 5: Acceptance and rejection ........................................................................................................................... 17
Ranking of issues ............................................................................................................................................................ 19
Trust and community involvement ................................................................................................................................ 21
Immigration .................................................................................................................................................................... 23
Religious groups ............................................................................................................................................................. 33
Asylum seekers ............................................................................................................................................................... 34
Attitudes by political identification ................................................................................................................................ 39
Intolerance of diversity ................................................................................................................................................... 46
Acknowledgements ........................................................................................................................................................ 50


Mapping Social Cohesion 2011 1
Executive summary
This report presents the findings of the fourth Scanlon Foundation Mapping Social Cohesion Survey conducted in June–July 2011. It builds on the knowledge gained through the three earlier Scanlon Foundation surveys conducted in 2007, 2009 and 2010, providing for the first time in Australian surveying a series of detailed surveys on social cohesion and population issues. Participants in the four national surveys total more than 8,000, with an additional 3,300 participants in the 2007 and 2009 local area surveys. A detailed questionnaire has been employed, with the 2011 survey comprising 81 questions.
The 2011 survey was conducted at a time of economic recovery, in the aftermath of the Global Financial Crisis whose impact in Australia was relatively minor. In June 2011 the rate of unemployment was 4.9%, one of the lowest in the industrialised world. This was also a time of declining population growth, with annual growth falling from a peak of 2.2% in 2008 to an estimated 1.5% in 2010.
In 2010 there was much public discussion of immigration levels and future population targets. The peak was reached during the campaigning for the August federal election, which produced a minority government and on‐going bitter political partisanship. In the first half of 2011 immigration received less attention. In contrast, policy to deal with asylum seekers who reach Australia by boat at times dominated public attention and continued to be a major talking point in the period leading to and during the 2011 survey. How has this context affected Australian attitudes, and what are the implications for social cohesion?
An overview of Australian opinion is provided by the Scanlon‐Monash Index of Social Cohesion (SMI). In 2010 the SMI registered decline across all five indicators. In 2011 the broad pattern was one of stabilisation, but close to the relatively low level of the previous year; there was marginal upward movement in indicators of belonging, participation and social justice, little change in sense of worth, and decline in the indicator of acceptance and rejection.
With regard to pride and sense of belonging, the Scanlon Foundation surveys – and other polling over the last 30 years – consistently affirm that the vast majority of Australians have a high level of identification with their country, the fundamental prerequisite for any cohesive society. Almost unanimously Australians express a strong sense of belonging (94%), take great pride in the Australian way of life (93%) and believe that its maintenance is important (92%).
Nearly nine out of ten respondents (89%) indicate that ‘taking all things into consideration’, they are happy with their lives.
There is less consistency in other indicators.
There has been significant fluctuation in attitudes to immigration over the last three decades, with the peak of negative sentiment above 70%. In 2010 there was a marked rise in the proportion agreeing that the intake was ‘too high’, up from 37% to 47%. In 2011 there was a return to the pattern of response found in 2007 and 2009: the proportion that considered the intake to be ‘too high’ fell to 39%, while 55% considered that the intake was ‘about right’ or ‘too low’.
To explore the relative importance of arguments in favour of immigration, respondents were presented with four statements that have been made in support of ‘an increase in Australia’s population’. The strongest level of agreement (56%) was in response to the proposition that ‘we need more people for economic growth’, followed by agreement that ‘we need more people because our population is ageing’ (47%). Agreement with the need to increase population for purposes of defence, the ‘populate or perish’ idea prominent in the years after the Second World War, was a distant fourth (19%).
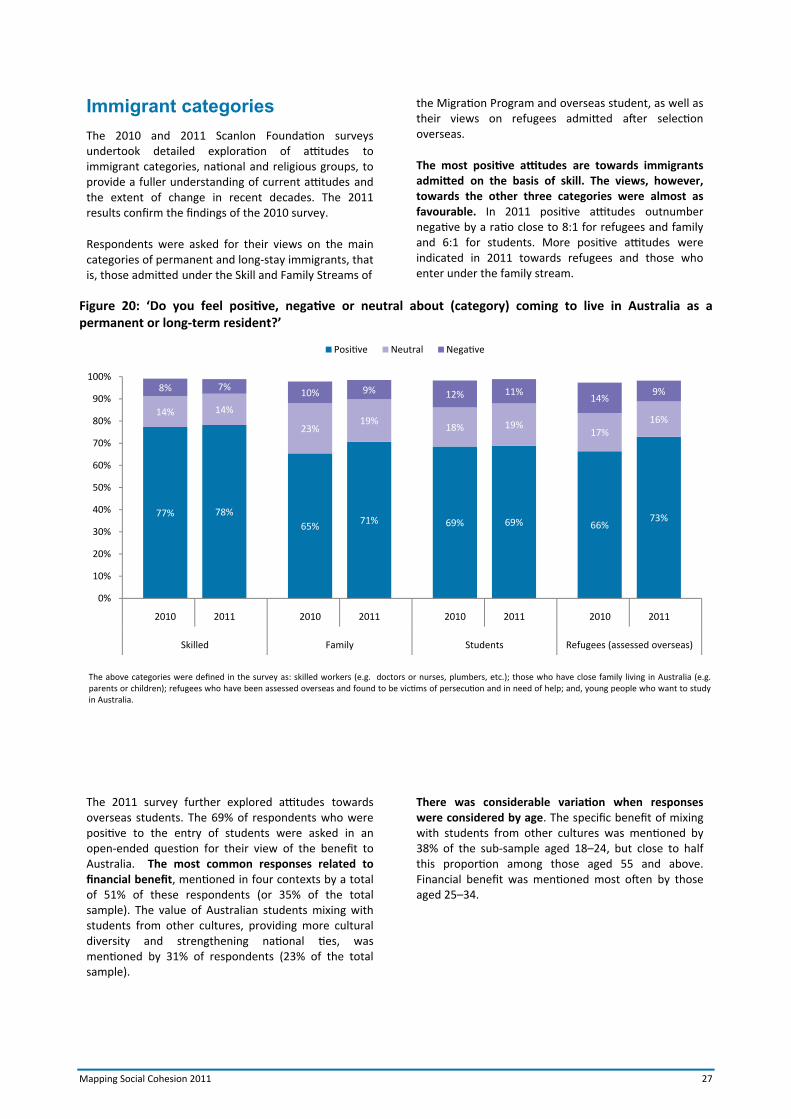
Respondents were asked for their views on the main categories of permanent and long‐stay immigrants, that is, those admitted under the Skill or Family Streams of the Migration Program, the Humanitarian Program and overseas students. The most positive attitude was towards immigrants admitted on the basis of skill. Attitudes towards the other three categories were, however, almost as favourable. Thus 78% were favourable to the skill category; 73% to humanitarian entrants (specified as refugees admitted after overseas assessment of their claims); 71% to family; and 69% to students. There was a large measure of consistency between the findings of the 2010 and 2011 surveys, with increase in favourable views of the family and humanitarian categories.
The 2011 survey, for the first time, also asked respondents for their view on the benefit of overseas students to Australia. The most common response related to financial benefit. Among those aged 18–24, the age group with whom overseas students have most interaction, benefit was understood in terms of the opportunity to get to know those from other cultures.
The 2010 and 2011 surveys asked respondents if their feelings were positive, negative or neutral towards immigrants from 12 specified national groups. Indicative of long‐term change in Australian opinion, there is now a large measure of acceptance of groups once stigmatised.
2 Mapping Social Cohesion 2011
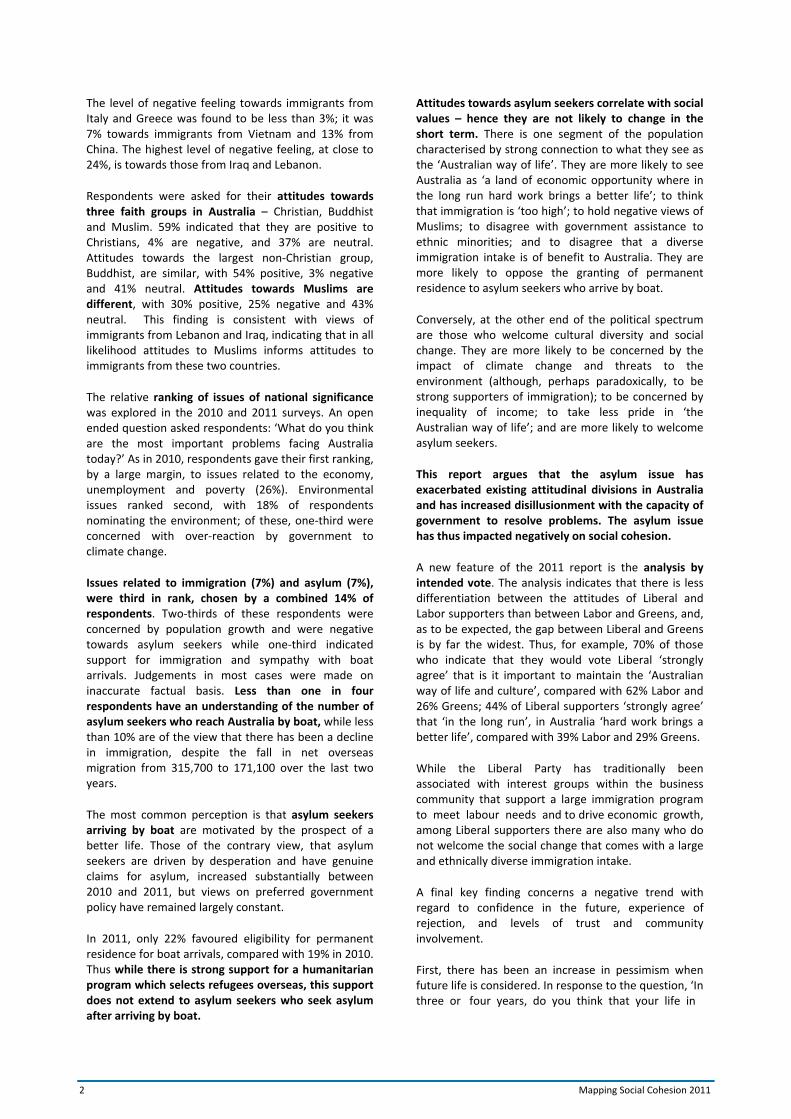
The level of negative feeling towards immigrants from Italy and Greece was found to be less than 3%; it was 7% towards immigrants from Vietnam and 13% from China. The highest level of negative feeling, at close to 24%, is towards those from Iraq and Lebanon.
Respondents were asked for their attitudes towards three faith groups in Australia – Christian, Buddhist and Muslim. 59% indicated that they are positive to Christians, 4% are negative, and 37% are neutral. Attitudes towards the largest non‐Christian group, Buddhist, are similar, with 54% positive, 3% negative and 41% neutral. Attitudes towards Muslims are different, with 30% positive, 25% negative and 43% neutral. This finding is consistent with views of immigrants from Lebanon and Iraq, indicating that in all likelihood attitudes to Muslims informs attitudes to immigrants from these two countries.
The relative ranking of issues of national significance was explored in the 2010 and 2011 surveys. An open ended question asked respondents: ‘What do you think are the most important problems facing Australia today?’ As in 2010, respondents gave their first ranking, by a large margin, to issues related to the economy, unemployment and poverty (26%). Environmental issues ranked second, with 18% of respondents nominating the environment; of these, one‐third were concerned with over‐reaction by government to climate change.
Issues related to immigration (7%) and asylum (7%), were third in rank, chosen by a combined 14% of respondents. Two‐thirds of these respondents were concerned by population growth and were negative towards asylum seekers while one‐third indicated support for immigration and sympathy with boat arrivals. Judgements in most cases were made on inaccurate factual basis. Less than one in four respondents have an understanding of the number of asylum seekers who reach Australia by boat, while less than 10% are of the view that there has been a decline in immigration, despite the fall in net overseas migration from 315,700 to 171,100 over the last two years.
The most common perception is that asylum seekers arriving by boat are motivated by the prospect of a better life. Those of the contrary view, that asylum seekers are driven by desperation and have genuine claims for asylum, increased substantially between 2010 and 2011, but views on preferred government policy have remained largely constant.
In 2011, only 22% favoured eligibility for permanent residence for boat arrivals, compared with 19% in 2010. Thus while there is strong support for a humanitarian program which selects refugees overseas, this support does not extend to asylum seekers who seek asylum after arriving by boat.
Attitudes towards asylum seekers correlate with social values – hence they are not likely to change in the short term. There is one segment of the population characterised by strong connection to what they see as the ‘Australian way of life’. They are more likely to see Australia as ‘a land of economic opportunity where in the long run hard work brings a better life’; to think that immigration is ‘too high’; to hold negative views of Muslims; to disagree with government assistance to ethnic minorities; and to disagree that a diverse immigration intake is of benefit to Australia. They are more likely to oppose the granting of permanent residence to asylum seekers who arrive by boat.
Conversely, at the other end of the political spectrum are those who welcome cultural diversity and social change. They are more likely to be concerned by the impact of climate change and threats to the environment (although, perhaps paradoxically, to be strong supporters of immigration); to be concerned by inequality of income; to take less pride in ‘the Australian way of life’; and are more likely to welcome asylum seekers.
This report argues that the asylum issue has exacerbated existing attitudinal divisions in Australia and has increased disillusionment with the capacity of government to resolve problems. The asylum issue has thus impacted negatively on social cohesion.
A new feature of the 2011 report is the analysis by intended vote. The analysis indicates that there is less differentiation between the attitudes of Liberal and Labor supporters than between Labor and Greens, and, as to be expected, the gap between Liberal and Greens is by far the widest. Thus, for example, 70% of those who indicate that they would vote Liberal ‘strongly agree’ that is it important to maintain the ‘Australian way of life and culture’, compared with 62% Labor and 26% Greens; 44% of Liberal supporters ‘strongly agree’ that ‘in the long run’, in Australia ‘hard work brings a better life’, compared with 39% Labor and 29% Greens.
While the Liberal Party has traditionally been associated with interest groups within the business community that support a large immigration program to meet labour needs and to drive economic growth, among Liberal supporters there are also many who do not welcome the social change that comes with a large and ethnically diverse immigration intake.
A final key finding concerns a negative trend with regard to confidence in the future, experience of rejection, and levels of trust and community involvement.
First, there has been an increase in pessimism when future life is considered. In response to the question, ‘In three or four years, do you think that your life in
Mapping Social Cohesion 2011 3
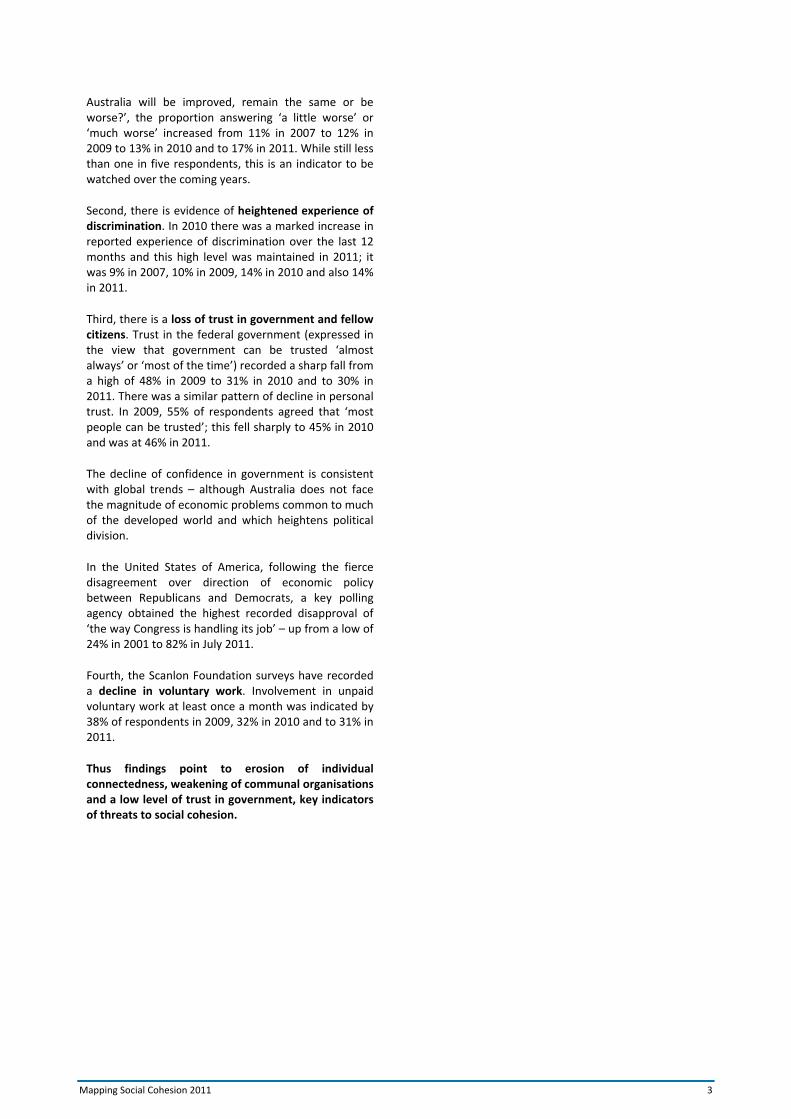
Australia will be improved, remain the same or be worse?’, the proportion answering ‘a little worse’ or ‘much worse’ increased from 11% in 2007 to 12% in 2009 to 13% in 2010 and to 17% in 2011. While still less than one in five respondents, this is an indicator to be watched over the coming years.
Second, there is evidence of heightened experience of discrimination. In 2010 there was a marked increase in reported experience of discrimination over the last 12 months and this high level was maintained in 2011; it was 9% in 2007, 10% in 2009, 14% in 2010 and also 14% in 2011.
Third, there is a loss of trust in government and fellow citizens. Trust in the federal government (expressed in the view that government can be trusted ‘almost always’ or ‘most of the time’) recorded a sharp fall from a high of 48% in 2009 to 31% in 2010 and to 30% in 2011. There was a similar pattern of decline in personal trust. In 2009, 55% of respondents agreed that ‘most people can be trusted’; this fell sharply to 45% in 2010 and was at 46% in 2011.
The decline of confidence in government is consistent with global trends – although Australia does not face the magnitude of economic problems common to much of the developed world and which heightens political division.
In the United States of America, following the fierce disagreement over direction of economic policy between Republicans and Democrats, a key polling agency obtained the highest recorded disapproval of ‘the way Congress is handling its job’ – up from a low of 24% in 2001 to 82% in July 2011.
Fourth, the Scanlon Foundation surveys have recorded a decline in voluntary work. Involvement in unpaid voluntary work at least once a month was indicated by 38% of respondents in 2009, 32% in 2010 and to 31% in 2011.
Thus findings point to erosion of individual connectedness, weakening of communal organisations and a low level of trust in government, key indicators of threats to social cohesion.

4 Mapping Social Cohesion 2011
Project objectives
Since it was established in June 2001, the Scanlon Foundation has pursued a mission to support ‘the advance of Australia as a welcoming, prosperous and cohesive nation’. The Foundation’s social cohesion research program guides its Australia‐wide grant‐based investment in programs designed to promote diversity and social cohesion.
Historically immigration has been central to Australia’s economic and social development, a contribution that is unlikely to diminish in the foreseeable future. One simple but critical question arising from this expectation is whether, over the next five decades, Australia can sustain the migration and social cohesion success story of the past five decades.
In order to address this question, the Monash Institute for the Study of Global Movements and the Australian Multicultural Foundation, with Scanlon Foundation funding, commissioned Professor Andrew Markus from Monash University to design and undertake a benchmark measure of social cohesion, with the aim of repeating the study every two years. The benchmark survey was undertaken in June–July 2007 by the Melbourne‐based research company The Social Research Centre.
It is important to note that rather than look at social cohesion in the abstract, the benchmark survey was designed to examine cohesion within the context of the social impact of a prolonged period of sustained and significant immigration. Towards this end, the focus was to establish a national measure of social cohesion and to underpin it with a series of comparative surveys undertaken in areas of high immigrant concentration where, it is predicted, the potential for social tension is higher.
The Foundation continues to provide significant funding towards on‐going, independent, primary research which can continue the development of our knowledge about social cohesion. This made possible a replication of the 2007 survey in 2009.
In 2010, however, following a review of previous findings, it was decided to change the frequency of surveys from a two‐year cycle to annual national surveys, supplemented by local surveys every third year (to be next administered in 2012). This change now provides the opportunity for annual tracking of Australian public opinion at a time of heightened public discussion across a range of issues related to immigration and social cohesion and resulted in the 2010 and 2011 surveys.
In addition to the landmark Mapping Social Cohesion surveys, the Foundation continues to create awareness and stimulate knowledge‐based discussion about Australia's population growth and the relationship between immigration and social cohesion. To further this end, the Foundation has supported the establishment and on‐going development of the Mapping Australia’s Population internet site1, based at Monash University and under the direction of Professor Markus and Mr Bruce Smith. This site seeks to augment informed public discussion of immigration and population issues by making available the findings of the Scanlon Foundation surveys. To provide a context, it also provides an inventory of other relevant surveying undertaken in Australia and statistical data on immigration and population sourced from government publications.
The Foundation continues to utilise the results of this research to initiate on‐the‐ground action programs designed to address factors which affect social cohesion in areas where the potential for tension is most evident.
1 See http://www.arts.monash.edu.au/mapping‐population

Mapping Social Cohesion 2011 5
Scope and methodology
The 2011 Scanlon Foundation survey is the fourth in the series, following earlier surveys in 2007, 2009 and 2010.
The four surveys have adopted a uniform methodology and all have been administered by the Melbourne‐ based Social Research Centre.
The surveys use a random sampling methodology, with the sample stratified geographically. A minimum of 200 interviews are undertaken in each Australian state or territory (1,600 interviews out of the overall total of 2,000). The remaining 400 interviews are allocated across the three states under‐represented by the initial sample allocation (NSW, Victoria and Queensland) in proportion to the population of those states.
Interviews are conducted by telephone (Computer Assisted Telephone Interviewing), utilising a list‐assisted Random Digit Dialling (RDD) sampling frame with respondents selected using the ‘next birthday’ method. In addition to English, respondents have the option of completing the survey in one of eight community languages.
A feature of the Scanlon Foundation surveys is the relatively large sample base of 2,000. The major polling agencies utilise smaller samples: for example, the Newspoll national surveys typically use a sample of 1,150‐1,200 and the Nielsen poll a sample of 1,400. The annual Lowy Institute Poll of public opinion on foreign policy employs a sample of 1,000 and the quarterly ANU Poll a sample of 1,200. These sample bases are expected to yield a maximum sampling error of plus or minus three percentage points. The larger Scanlon Foundation sample, while not significantly improving the maximum sample error at the aggregate level, makes possible more reliable analysis of sub‐samples, for example age group, educational attainment or intended vote.
The design of the questionnaire is informed by on‐ going review of Australian and international research. The survey includes questions used in contemporary and earlier surveys, to provide the basis to check reliability and to enhance understanding of shifts in opinion over time.
The content of the questionnaire has been modified in the second and subsequent surveys in light of findings on the degree of consistency (hence predictability) of response. While questions required for calculation of the Scanlon‐Monash Index of Social Cohesion were retained, other questions were deleted to enable inclusion of new modules and individual questions.
For example, the 2009 survey included a module exploring attitudes at the neighbourhood level. The 2010 survey included questions on future population targets, attitudes to government immigration selection criteria and nationality of immigrants, asylum issues, the rationale for support and opposition to immigration, and government handling of infrastructure planning issues.
The 2011 survey repeated most questions added in 2010 to provide further understanding of the extent of volatility of opinion on population and asylum issues; in addition, new questions explored attitudes on the benefit to Australia of the presence of overseas students, perception of the actual number of asylum seekers arriving by boat, and arguments for and against immigration.
Full details of changes to the questionnaire are provided in the methodological report (Appendix 2: Questionnaire revisions), available for download on the Mapping Australia’s Population internet site.
The 2011 questionnaire was administered from 15 June to 18 July. It comprised 81 questions (60 substantive and 21 demographic) and took on average 20.5 minutes to complete.
Weighting of survey results
Survey data is weighted to bring the achieved respondent profile into line with Australian Bureau of Statistics demographic indicators.
A rim weighting procedure developed by the Social Research Centre makes possible weighting of data for four variables, age, gender, educational attainment and country of birth, and, where necessary, to also adjust for disproportionate aspects of the sample design (i.e. disproportionate geographic distribution). This compares with the industry standard of weighting for two variables: age and sex. Where possible, proportions were taken from the 2009 ABS Estimated Residential Population statistics rather than 2006 Census data – this applied to the population estimates of age by gender by geographic location.
The weights applied to the samples were:
National: state population (NSW, VIC, QLD, SA, WA, TAS, NT, ACT); age (18–34, 35–44, 45–54, 55 plus); gender (male, female); education (university graduate, not university graduate); country of birth (Australia, overseas English‐speaking country [Canada, Ireland, New Zealand, South Africa, the United Kingdom, the United States], overseas non‐English‐speaking).
6 Mapping Social Cohesion 2011
The survey context
Economic conditions and the labour market
The 2009 survey was conducted in the context of marked deterioration in the economic environment. In the midst of the Global Financial Crisis, there was perception of the most severe economic challenge for industrialised economies since the Great Depression of the 1930s. In a climate of economic uncertainty there were projections of a significant increase in unemployment, which had risen from a low of 4.3% in 2007 to 5.9% in June 2009.
In contrast, the 2010 survey was undertaken at a time of improvement in economic conditions. Unemployment had fallen to 5.6% in December 2009 and in June 2010, the month of the survey, it was 5.2%. On the negative side, bank interest rates increased; in July 2009 the Reserve Bank of Australia cash rate was at a low 3.0%; by June 2010 it was 4.5%, with higher rate increases in variable interest housing loans by leading banks. House prices in the 12 months to June 2010 rose 24.3% in Melbourne, 21.4% in Sydney, 13.0% in Perth, 11.6% in Adelaide and 8.5% in Brisbane.
The six months prior to the 2011 survey experienced further marginal improvement in economic conditions. In the second half of 2010 unemployment peaked at 5.4%. In the first six months of 2011 unemployment was in the range 4.9% – 5.0%. In June it was 4.9%.
The level of full‐time employment increased marginally in the first six months of 2011. In February 2011 there were 11,413,000 persons in full‐time employment. In June there were 11,455,200 employed, an increase of some 40,000 persons.
The labour force participation rate in the first six months of 2011 was in the range 65.5% to 65.8%; in June 2011 it was 65.6%.
Unemployment in June 2011 was lowest in Western Australia at 4.2%, highest in Tasmania at 5.6%; the level in other states was 4.7% in Victoria, 5.1% in New South Wales, 5.2% in Queensland and 5.3% in South Australia.
Population growth
Over the years 2007–09 there was rapid population growth in Australia. Whereas annual population growth averaged 1.4% between 1970–2010, between 2006 and 2009 annual growth was at or above 1.8%, with a peak of 2.2% in 2008 (the highest rate since the 1960s). The population grew by an estimated 1.9% in 2009. Growth was at a much lower rate of 1.5% in 2010.
In June 2004 the Estimated Resident Population was 20.1 million; in June 2011, 22.6 million, an increase in seven years of 2.5 million.
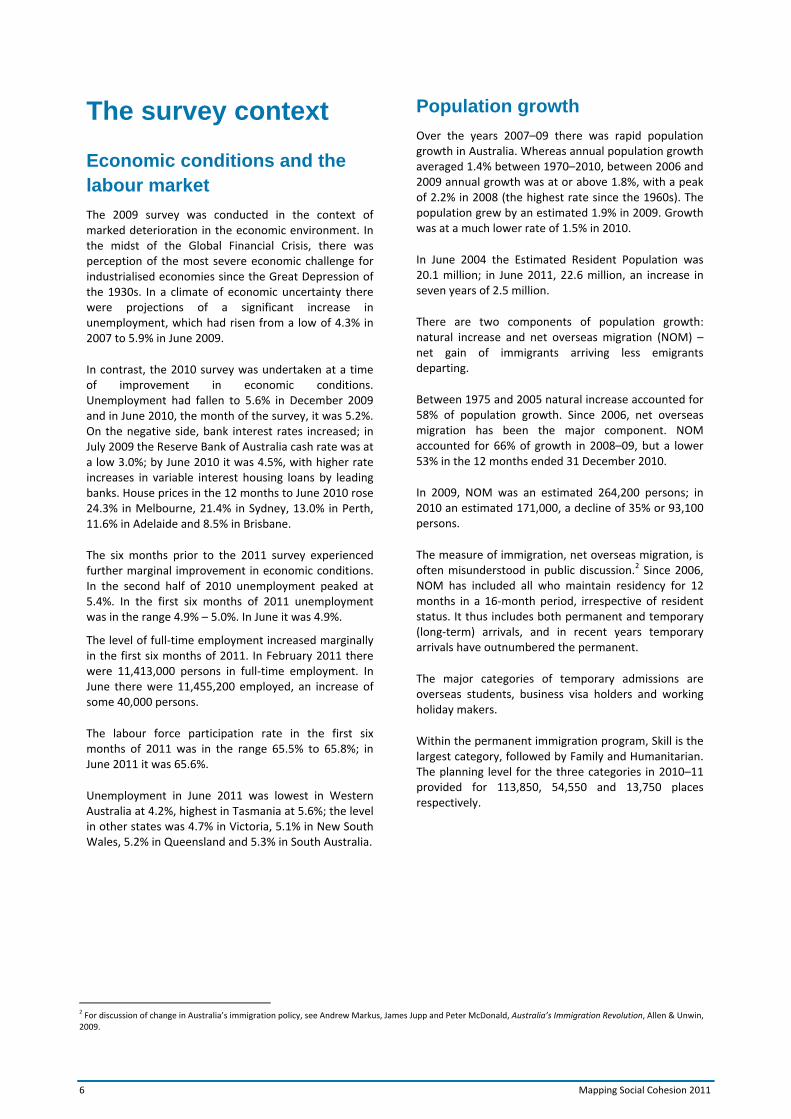
There are two components of population growth: natural increase and net overseas migration (NOM) – net gain of immigrants arriving less emigrants departing.
Between 1975 and 2005 natural increase accounted for 58% of population growth. Since 2006, net overseas migration has been the major component. NOM accounted for 66% of growth in 2008–09, but a lower 53% in the 12 months ended 31 December 2010.
In 2009, NOM was an estimated 264,200 persons; in 2010 an estimated 171,000, a decline of 35% or 93,100 persons.
The measure of immigration, net overseas migration, is often misunderstood in public discussion.2 Since 2006, NOM has included all who maintain residency for 12 months in a 16‐month period, irrespective of resident status. It thus includes both permanent and temporary (long‐term) arrivals, and in recent years temporary arrivals have outnumbered the permanent.
The major categories of temporary admissions are overseas students, business visa holders and working holiday makers.
Within the permanent immigration program, Skill is the largest category, followed by Family and Humanitarian. The planning level for the three categories in 2010–11 provided for 113,850, 54,550 and 13,750 places respectively.
2 For discussion of change in Australia’s immigration policy, see Andrew Markus, James Jupp and Peter McDonald, Australia’s Immigration Revolution, Allen & Unwin, 2009.
Mapping Social Cohesion 2011 7
Figure 1: Components of annual population growth, 1982–2010
Source: Australian Bureau of Statistics, Australian Demographic Statistics, December quarter 2010, catalogue number 3101.0 (released 23 June 2011).
Table 1: Population growth and components of growth, Australia 2005‐2010
Year Natural Increase
Net Overseas Migration
Growth on previous year
Growth on previous year
'000 '000 '000 %
2005 132.0 137.0 291.9 1.4
2006 134.0 182.2 329.6 1.6
2007 145.5 244.1 389.6 1.9
2008 151.6 315.7 467.3 2.2
2009 (est.) 157.2 264.1 421.3 1.9
2010 (est.) 154.4 171.1 325.5 1.5
Source: Australian Bureau of Statistics, Australian Demographic Statistics, December quarter 2010, catalogue number 3101.0 (released 23 June 2011).
0
100
200
300
400
500
Dec‐1983
Dec‐1986
Dec‐1989
Dec‐1992
Dec‐1995
Dec‐1998
Dec‐2001
Dec‐2004
Dec 2007
Dec 2010
Natural Increase
Net overseas migration
Total Growth

8 Mapping Social Cohesion 2011
Prominence of issues
A content analysis was undertaken of the coverage of population issues in the print media to provide further understanding of the relative prominence of issues at the time of the Scanlon Foundation surveys. A keyword search using the terms ‘asylum’, ‘immigration and Australia’, and ‘population and Australia’ was undertaken utilising an electronic database of Australian newspapers (NewsBank) available through the Monash University Library. The following five newspapers were searched for the period January 2007 to June 2011:
The Australian, national broadsheet, News Limited;
The Age, Melbourne broadsheet, Fairfax;
Sydney Morning Herald, Sydney broadsheet, Fairfax;
Herald Sun, Melbourne tabloid, News Limited;
Daily Telegraph, Sydney tabloid, News Limited.
The pattern indicated spikes or periods of heightened coverage, followed by lower intensity over a period of months. There was consistently greater number of items recorded for The Australian than for the two Fairfax broadsheets. Whereas population issues received attention throughout the period surveyed, the asylum issue received little notice until April 2009, a consequence of the resumption of boat arrivals in Australia’s north‐west, particularly the region of Christmas Island – a population movement that had all but ceased in 2002 following the enactment of what has become known as the Howard government’s ‘Pacific solution’.
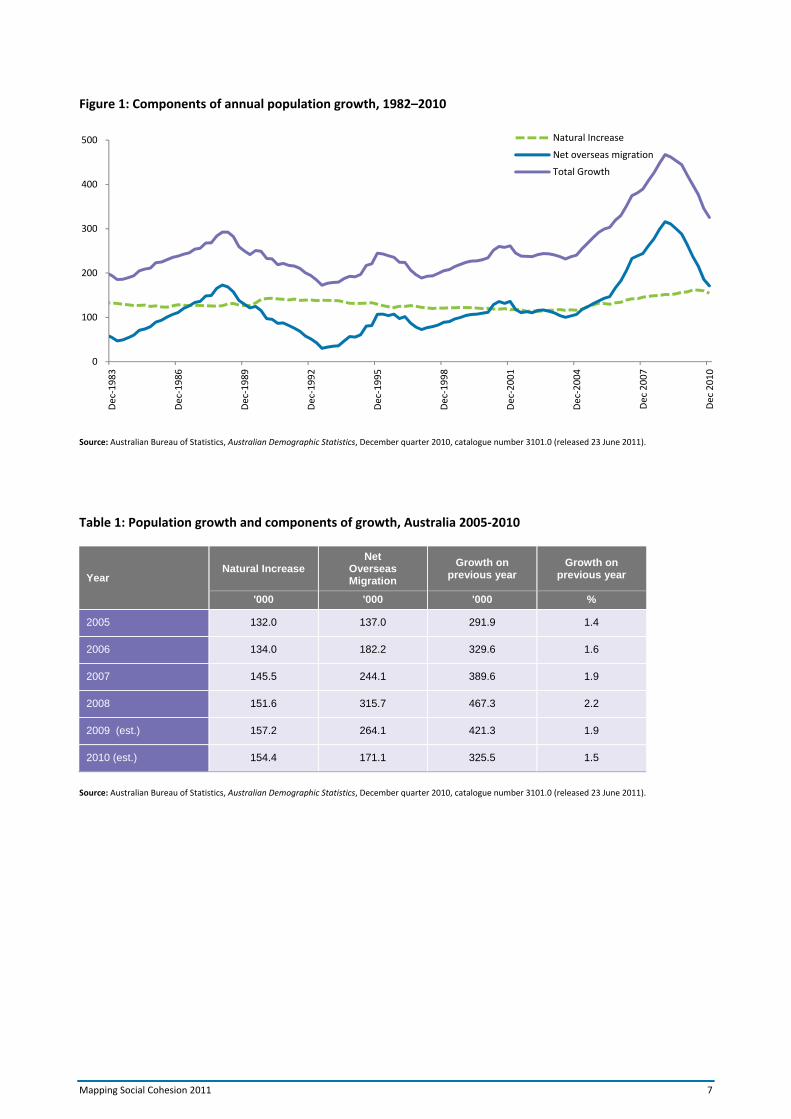
Four major findings are derived from the content analysis: 1. The high point of coverage of asylum and
population issues occurred in the context of the 2010 election campaign, immediately after the 2010 Scanlon Foundation survey.
2. There was increasing coverage of asylum and population issues in the 12 months preceding the election campaign, when compared with the years 2007–2009.
3. Following the 2010 election (held in August), there has been less attention to asylum and population issues, but the level of coverage is higher than during 2008.
4. There was a spike in attention to asylum issues in May 2011 – this was associated with the Gillard government’s attempts to introduce off‐shore processing of asylum seekers through an agreement with the Malaysian government and subsequent discussion of the merits and morality of the government’s approach.

Mapping Social Cohesion 2011 9
Figure 2: Keyword search: ‘Immigration’ (including asylum) and ‘Australia’; broadsheet newspapers, number of articles, 2007–2011
Figure 3: Keyword search: ‘Immigration’ (including asylum) and ‘Australia’; tabloid newspapers, number of articles, 2007‐2011
0
50
100
150
200
250
300
350
400
450
Jan‐07
Mar‐07
May‐07
Jul‐07
Sep‐07
Nov‐07
Jan‐08
Mar‐08
May‐08
Jul‐08
Sep‐08
Nov‐08
Jan‐09
Mar‐09
May‐09
Jul‐09
Sep‐09
Nov‐09
Jan‐10
Mar‐10
May‐10
Jul‐10
Sep‐10
Nov‐10
Jan‐11
Mar‐11
May‐11
Sydney Morning HeraldThe AgeThe Australian
0
20
40
60
80
100
120
Jan‐07
Mar‐07
May‐07
Jul‐07
Sep‐07
Nov‐07
Jan‐08
Mar‐08
May‐08
Jul‐08
Sep‐08
Nov‐08
Jan‐09
Mar‐09
May‐09
Jul‐09
Sep‐09
Nov‐09
Jan‐10
Mar‐10
May‐10
Jul‐10
Sep‐10
Nov‐10
Jan‐11
Mar‐11
May‐11
Herald Sun
Daily Telegraph
10 Mapping Social Cohesion 2011
Figure 4: Keyword search: ‘Immigration’ (including asylum) and ‘Australia’; broadsheet newspapers with trendline, number of articles, 2010–2011
Figure 5: Keyword search: ‘Immigration’ (including asylum) and ‘Australia’; tabloid newspapers with trendline, number of articles, 2010–2011
0
100
200
300
400
500
600
700
800
Jan‐10
Feb‐10
Mar‐10
Apr‐10
May‐10
Jun‐10
Jul‐10
Aug‐10
Sep‐10
Oct‐10
Nov‐10
Dec‐10
Jan‐11
Feb‐11
Mar‐11
Apr‐11
May‐11
Jun‐11
SMH, The Age & Australian combined
Trendline (two‐month moving average)
0
50
100
150
200
250
Jan‐10
Feb‐10
Mar‐10
Apr‐10
May‐10
Jun‐10
Jul‐10
Aug‐10
Sep‐10
Oct‐10
Nov‐10
Dec‐10
Jan‐11
Feb‐11
Mar‐11
Apr‐11
May‐11
Jun‐11
Herald Sun & Daily Telegraph combined
Trendline (two‐month moving average)
Mapping Social Cohesion 2011 11
Ethnic diversity in the Australian population
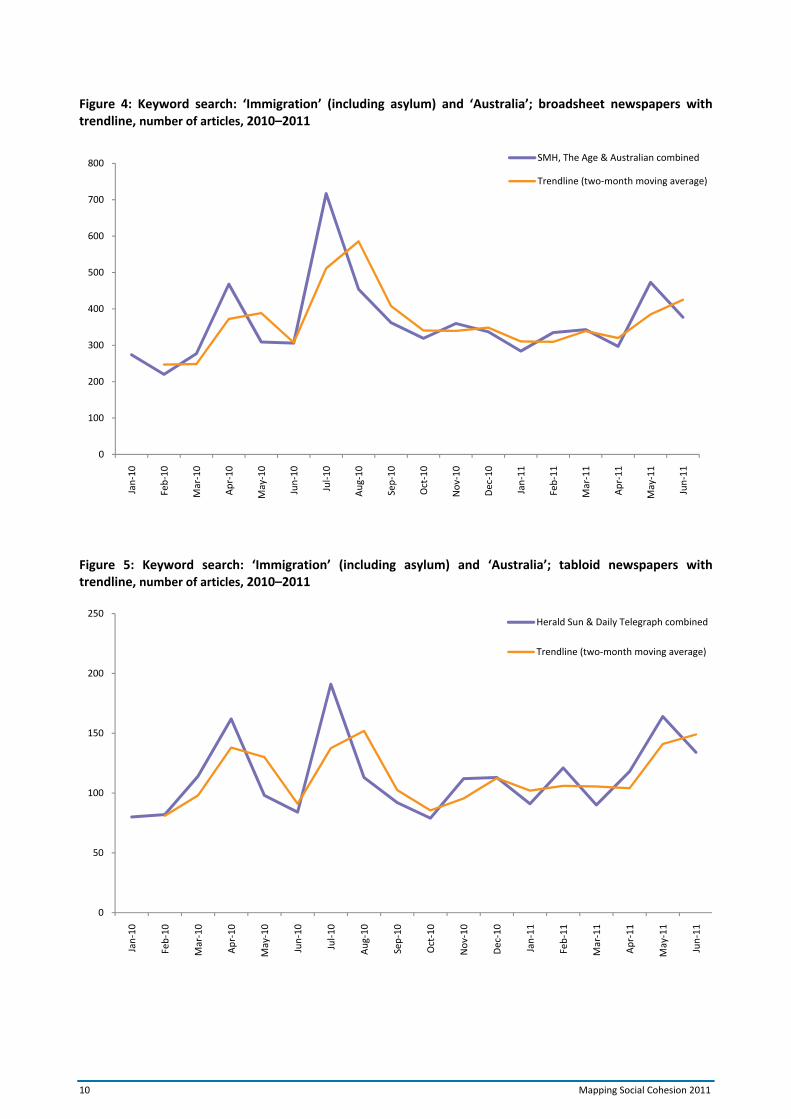
At the 2006 census, 23.9% of the Australian population was born overseas. This level had increased to an estimated 26.4% by mid‐2009, representing 5.8 million people. Of the capital cities, in 2006 the largest proportion of overseas‐born resided in Sydney (34.5%), followed by Perth (33.7%), Melbourne (31.0%), Adelaide (25.1%), Brisbane (23.2%) and Hobart (12.8%). The proportion of overseas‐born in the mainland capitals is unevenly spread, with concentrations above 50% in some Local Government Areas (LGA). In Melbourne, the largest concentrations of overseas‐born are located in the central, south‐eastern and western regions of the city; in Sydney they are located in the central and western regions. The extent of diversity that characterises areas of high immigrant concentration is evident in the profile of Greater Dandenong LGA.
Greater Dandenong, in the south‐east of Melbourne, had a population of 125,520 at the time of the 2006 census, comprising some 150 national groups. The proportion born overseas has risen from 38% in 1991 to 56% in 2006, with an overseas‐born concentration in the 80–100% range in parts of the LGA. 82% of the population have one or both parents born overseas; 19% of the overseas‐born arrived between 2001 and 2006; 62% speak a language other than English in their homes; 26% (16,480 persons) speak English not well or not at all; and 10% speak Vietnamese and 4% Khmer.
Figure 6: People born overseas as a percentage of the total population based on place of usual residence, 2006. Greater Dandenong (Local Government Area) by census collection district
Source: © Copyright Commonwealth of Australia & PSMA Australia 2007

12 Mapping Social Cohesion 2011
What is social cohesion?
As a concept, social cohesion has a long tradition in academic enquiry. It is of fundamental importance when discussing the role of consensus and conflict in society. From the mid‐1990s, interest in the dynamics of social cohesion grew amid concerns prompted by the impact of globalisation, economic change and fears fuelled by the ‘war on terror’. There is, however, no agreed definition of social cohesion. Most current definitions dwell on intangibles, such as sense of belonging, attachment to the group, willingness to participate and to share outcomes. They do, however, include three common elements:
Shared vision: Most researchers maintain that social cohesion requires universal values, mutual respect and common aspirations or identity shared by their members.
A property of a group or community: Social cohesion describes a well‐functioning core group or community in which there are shared goals and responsibilities and a readiness to co‐operate with the other members.
A process: Social cohesion is generally viewed not simply as an outcome, but as a continuous and seemingly never‐ending process of achieving social harmony.
Differences in definition concern the factors that enhance (and erode) the process of communal harmony, and the relative weight attached to the operation of specific factors. The key factors are:
Economic: Levels of unemployment and poverty, income distribution, population mobility, health, life satisfaction and sense of security, and government responsiveness to issues of poverty and disadvantage.
Political: Levels of political participation and social involvement, including the extent of voluntarism, the development of social capital, understood in terms of networks, norms and social trust that facilitate coordination and co‐operation for mutual benefit.
Socio‐cultural: Levels of consensus and divergence (homogeneity and heterogeneity) on issues of local and national significance.
The present survey has adopted an eclectic, wide‐ranging approach, influenced by the work of social scientists Jane Jenson and Paul Bernard, to incorporate five domains:
Belonging: Shared values, identification with Australia, trust.
Social justice and equity: Evaluation of national policies.
Participation: Voluntary work, political and co‐operative involvement.
Acceptance and rejection, legitimacy: Experience of discrimination, attitudes towards minorities and newcomers.
Worth: Life satisfaction and happiness, future expectations.

Mapping Social Cohesion 2011 13
The Scanlon-Monash Index (SMI) of Social Cohesion
A nominal index of social cohesion has been developed using the findings of the 2007 national survey to provide baseline data. The following questions, validated by factor analysis, were employed to construct the index for the five domains of social cohesion:
Belonging: Indication of pride in the Australian way of life and culture; sense of belonging; importance of maintaining Australian way of life and culture.
Worth: Satisfaction with present financial situation and indication of happiness over the last year.
Social justice and equity: Views on the adequacy of financial support for people on low incomes; the gap between high and low incomes; Australia as a land of economic opportunity; trust in the Australian government.
Participation (political): Voted in an election; signed a petition; contacted a Member of Parliament; participated in a boycott; attended a protest.
Acceptance and rejection, legitimacy: The scale measures rejection, indicated by negative view of immigration from many different countries; reported experience of discrimination in the last 12 months; disagreement with government support to ethnic minorities for maintenance of customs and traditions; feeling that life in three or four years will be worse.
After trialling several models, a procedure was adopted which draws attention to minor shifts in opinion and reported experience, rather than one which compresses or diminishes the impact of change by, for example, calculating the mean score for a set of responses.3 The purpose of the index is to heighten awareness of shifts in opinion which may call for closer attention and analysis.
Comparison of the 2007 and 2009 findings reveals slight change, with variation in the range 2.8–5.6 points in four of the five domains of social cohesion. Variation was at its peak in the index of social justice and equity, which was up 12.4 points. The average variation was 1.2 points.
In contrast, the 2010 index revealed lower scores in all five domains. The largest variation was in the index of social justice and equity, which fell by 20.5 points, reflecting both the heightened expectations that the Rudd government would deliver significant change following the 11 years of the Howard government and the disappointment of those expectations.
The 2011 index indicates divergent patterns, with the average score marginally higher than the 2010 average and higher scores in three of the five domains. The domains of belonging and worth mirror the 2009 and 2010 findings and show little change across the four surveys. Participation has increased by 8.4 points since 2010 and is close to the 2009 level. The index of social justice and equity shows marginal positive movement, but remains 5.4 points below the 2007 level and 18 points below 2009. The greatest variation is in the index of acceptance and rejection; there is continuing negative movement across the four surveys and the 2011 result was 24.7 points below the 2007 baseline.
Table 2: The Scanlon‐Monash Index (SMI) of Social Cohesion, 2007‐2011
2007 Index
2009 Index
2010 Index
2011 Index
Change 2010–11
(percentage points)
Direction of change
1. Sense of belonging 100 96.9 95.0 96.6 +1.6 Higher
2. Sense of worth 100 97.2 96.7 96.5 -0.2 Lower
3. Social justice and equity 100 112.4 91.9 94.4 +2.4 Higher
4. Participation 100 105.3 98.0 106.4 +8.4 Higher
5. Acceptance (rejection) 100 94.4 81.5 75.3 -6.2 Lower
Average 100 101.2 92.6 93.8 +1.2 Higher
3 The nominal index scores the level of agreement (or disagreement in the index of rejection). The highest level of response (for example, ‘strongly agree’) is scored twice the value of the second level (‘agree’). Responses within four of the five indexes are equalised; within the index of participation, activities requiring greater initiative (contacting a Member of Parliament, participating in a boycott, attending a protest) are accorded double the weight of the more passive activities of voting (compulsory in Australia) and signing a petition. See Andrew Markus and Jessica Arnup, Mapping Social Cohesion 2009: The Scanlon Foundations Surveys Full Report (2010), section 12
14 Mapping Social Cohesion 2011
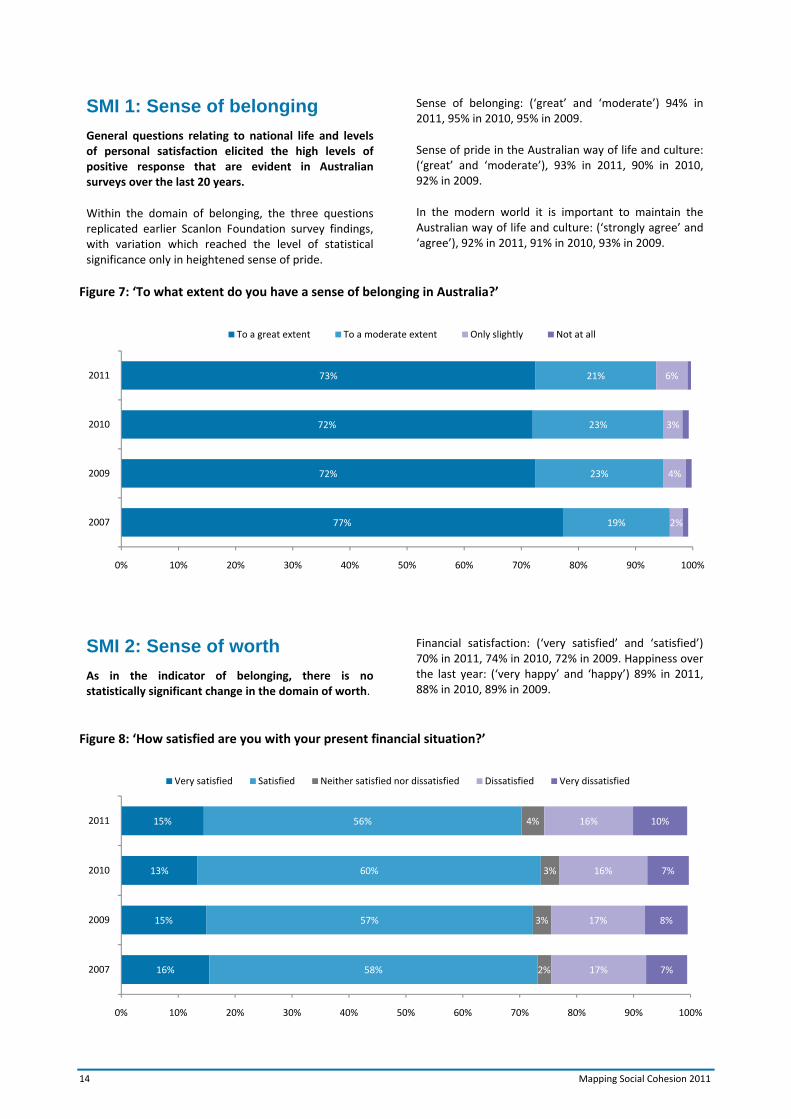
SMI 1: Sense of belonging
General questions relating to national life and levels of personal satisfaction elicited the high levels of positive response that are evident in Australian surveys over the last 20 years.
Within the domain of belonging, the three questions replicated earlier Scanlon Foundation survey findings, with variation which reached the level of statistical significance only in heightened sense of pride.
Sense of belonging: (‘great’ and ‘moderate’) 94% in 2011, 95% in 2010, 95% in 2009.
Sense of pride in the Australian way of life and culture: (‘great’ and ‘moderate’), 93% in 2011, 90% in 2010, 92% in 2009.
In the modern world it is important to maintain the Australian way of life and culture: (‘strongly agree’ and ‘agree’), 92% in 2011, 91% in 2010, 93% in 2009.
Figure 7: ‘To what extent do you have a sense of belonging in Australia?’
Figure 8: ‘How satisfied are you with your present financial situation?’
77%
72%
72%
73%
19%
23%
23%
21%
2%
4%
3%
6%
0% 10% 20% 30% 40% 50% 60% 70% 80% 90% 100%
2007
2009
2010
2011
To a great extent To a moderate extent Only slightly Not at all
16%
15%
13%
15%
58%
57%
60%
56%
2%
3%
3%
4%
17%
17%
16%
16%
7%
8%
7%
10%
0% 10% 20% 30% 40% 50% 60% 70% 80% 90% 100%
2007
2009
2010
2011
Very satisfied Satisfied Neither satisfied nor dissatisfied Dissatisfied Very dissatisfied
SMI 2: Sense of worth
As in the indicator of belonging, there is no statistically significant change in the domain of worth.
Financial satisfaction: (‘very satisfied’ and ‘satisfied’) 70% in 2011, 74% in 2010, 72% in 2009. Happiness over the last year: (‘very happy’ and ‘happy’) 89% in 2011, 88% in 2010, 89% in 2009.
Mapping Social Cohesion 2011 15
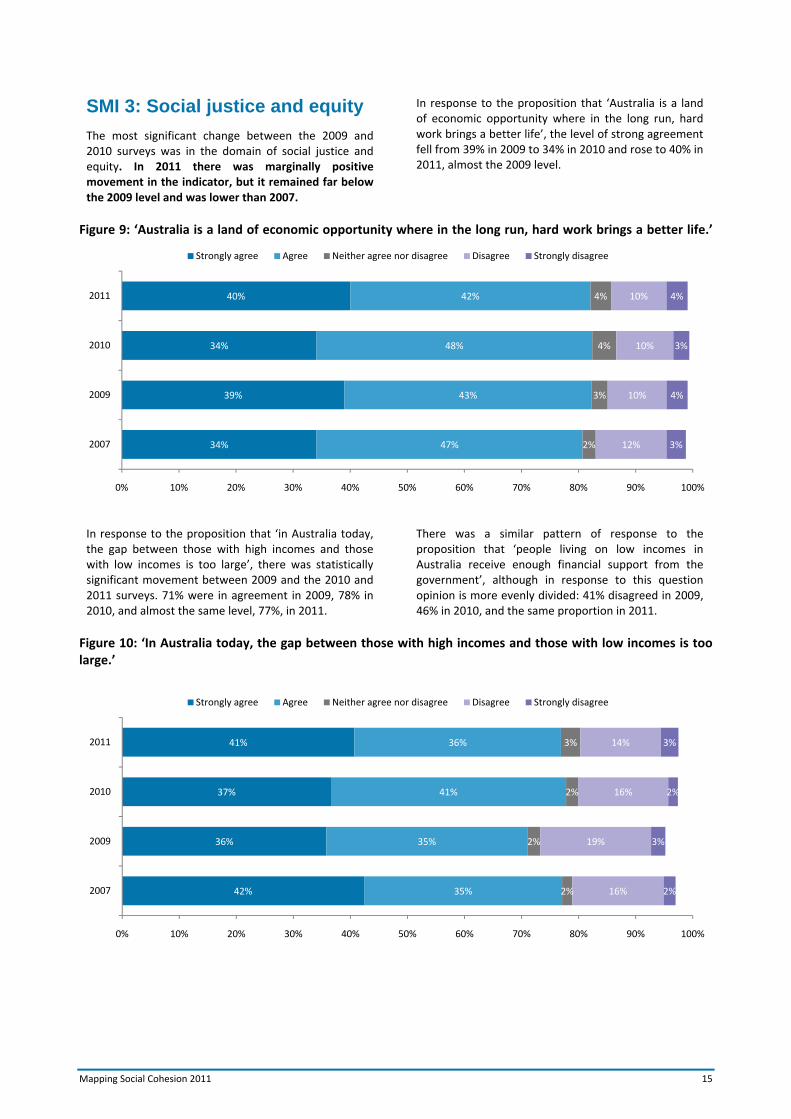
SMI 3: Social justice and equity
The most significant change between the 2009 and 2010 surveys was in the domain of social justice and equity. In 2011 there was marginally positive movement in the indicator, but it remained far below the 2009 level and was lower than 2007.
In response to the proposition that ‘Australia is a land of economic opportunity where in the long run, hard work brings a better life’, the level of strong agreement fell from 39% in 2009 to 34% in 2010 and rose to 40% in 2011, almost the 2009 level.
Figure 9: ‘Australia is a land of economic opportunity where in the long run, hard work brings a better life.’
In response to the proposition that ‘in Australia today, the gap between those with high incomes and those with low incomes is too large’, there was statistically significant movement between 2009 and the 2010 and 2011 surveys. 71% were in agreement in 2009, 78% in 2010, and almost the same level, 77%, in 2011.
There was a similar pattern of response to the proposition that ‘people living on low incomes in Australia receive enough financial support from the government’, although in response to this question opinion is more evenly divided: 41% disagreed in 2009, 46% in 2010, and the same proportion in 2011.
Figure 10: ‘In Australia today, the gap between those with high incomes and those with low incomes is too large.’
34%
39%
34%
40%
47%
43%
48%
42%
2%
3%
4%
4%
12%
10%
10%
10%
3%
4%
3%
4%
0% 10% 20% 30% 40% 50% 60% 70% 80% 90% 100%
2007
2009
2010
2011
Strongly agree Agree Neither agree nor disagree Disagree Strongly disagree
42%
36%
37%
41%
35%
35%
41%
36%
2%
2%
2%
3%
16%
19%
16%
14%
2%
3%
2%
3%
0% 10% 20% 30% 40% 50% 60% 70% 80% 90% 100%
2007
2009
2010
2011
Strongly agree Agree Neither agree nor disagree Disagree Strongly disagree
16 Mapping Social Cohesion 2011
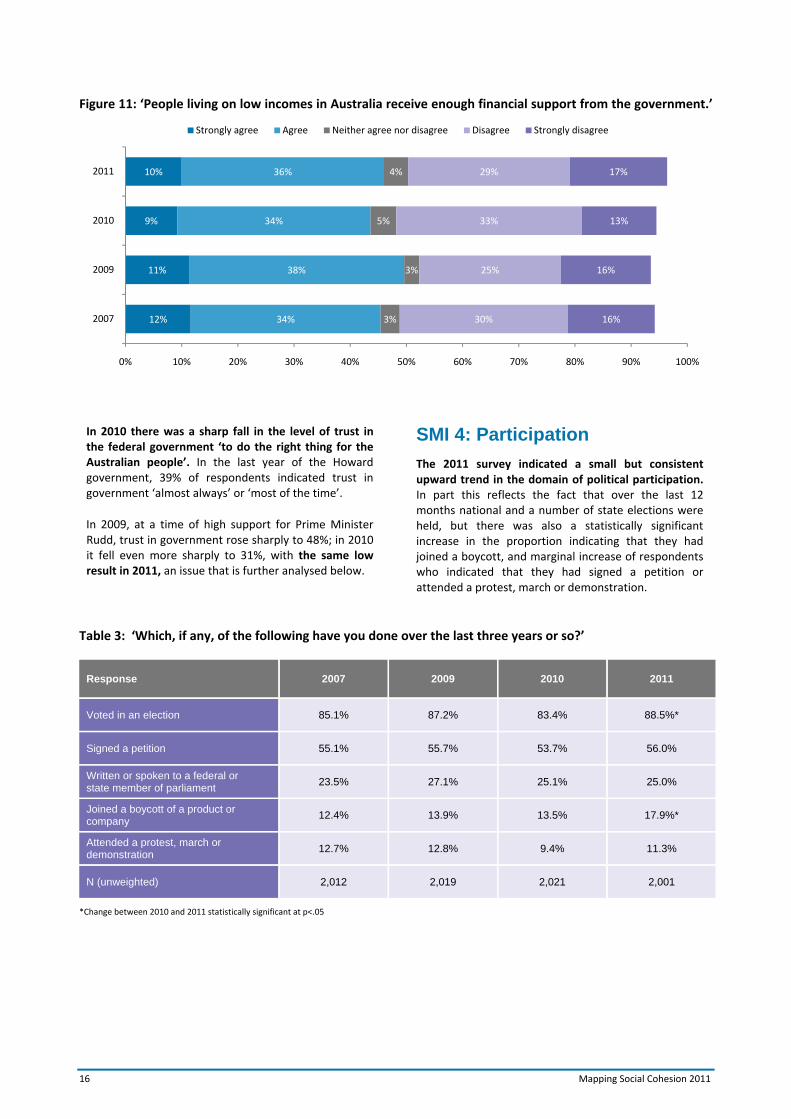
Figure 11: ‘People living on low incomes in Australia receive enough financial support from the government.’
In 2010 there was a sharp fall in the level of trust in the federal government ‘to do the right thing for the Australian people’. In the last year of the Howard government, 39% of respondents indicated trust in government ‘almost always’ or ‘most of the time’.
In 2009, at a time of high support for Prime Minister Rudd, trust in government rose sharply to 48%; in 2010 it fell even more sharply to 31%, with the same low result in 2011, an issue that is further analysed below.
SMI 4: Participation
The 2011 survey indicated a small but consistent upward trend in the domain of political participation. In part this reflects the fact that over the last 12 months national and a number of state elections were held, but there was also a statistically significant increase in the proportion indicating that they had joined a boycott, and marginal increase of respondents who indicated that they had signed a petition or attended a protest, march or demonstration.
Table 3: ‘Which, if any, of the following have you done over the last three years or so?’
Response 2007 2009 2010 2011
Voted in an election 85.1% 87.2% 83.4% 88.5%*
Signed a petition 55.1% 55.7% 53.7% 56.0%
Written or spoken to a federal or state member of parliament
23.5% 27.1% 25.1% 25.0%
Joined a boycott of a product or company
12.4% 13.9% 13.5% 17.9%*
Attended a protest, march or demonstration
12.7% 12.8% 9.4% 11.3%
N (unweighted) 2,012 2,019 2,021 2,001
*Change between 2010 and 2011 statistically significant at p<.05
12%
11%
9%
10%
34%
38%
34%
36%
3%
3%
5%
4%
30%
25%
33%
29%
16%
16%
13%
17%
0% 10% 20% 30% 40% 50% 60% 70% 80% 90% 100%
2007
2009
2010
2011
Strongly agree Agree Neither agree nor disagree Disagree Strongly disagree
Mapping Social Cohesion 2011 17
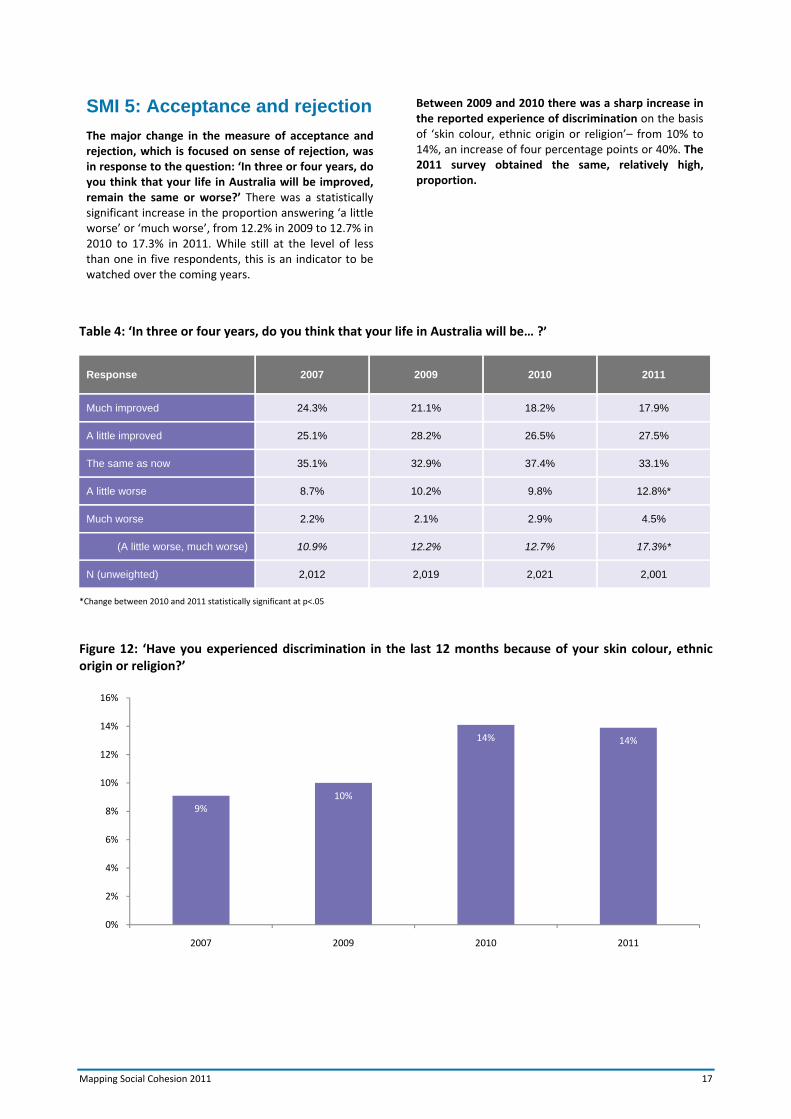
SMI 5: Acceptance and rejection
The major change in the measure of acceptance and rejection, which is focused on sense of rejection, was in response to the question: ‘In three or four years, do you think that your life in Australia will be improved, remain the same or worse?’ There was a statistically significant increase in the proportion answering ‘a little worse’ or ‘much worse’, from 12.2% in 2009 to 12.7% in 2010 to 17.3% in 2011. While still at the level of less than one in five respondents, this is an indicator to be watched over the coming years.
Between 2009 and 2010 there was a sharp increase in the reported experience of discrimination on the basis of ‘skin colour, ethnic origin or religion’– from 10% to 14%, an increase of four percentage points or 40%. The 2011 survey obtained the same, relatively high, proportion.
Table 4: ‘In three or four years, do you think that your life in Australia will be… ?’
Response 2007 2009 2010 2011
Much improved 24.3% 21.1% 18.2% 17.9%
A little improved 25.1% 28.2% 26.5% 27.5%
The same as now 35.1% 32.9% 37.4% 33.1%
A little worse 8.7% 10.2% 9.8% 12.8%*
Much worse 2.2% 2.1% 2.9% 4.5%
(A little worse, much worse) 10.9% 12.2% 12.7% 17.3%*
N (unweighted) 2,012 2,019 2,021 2,001
*Change between 2010 and 2011 statistically significant at p<.05
Figure 12: ‘Have you experienced discrimination in the last 12 months because of your skin colour, ethnic origin or religion?’
9%10%
14% 14%
0%
2%
4%
6%
8%
10%
12%
14%
16%
2007 2009 2010 2011
18 Mapping Social Cohesion 2011
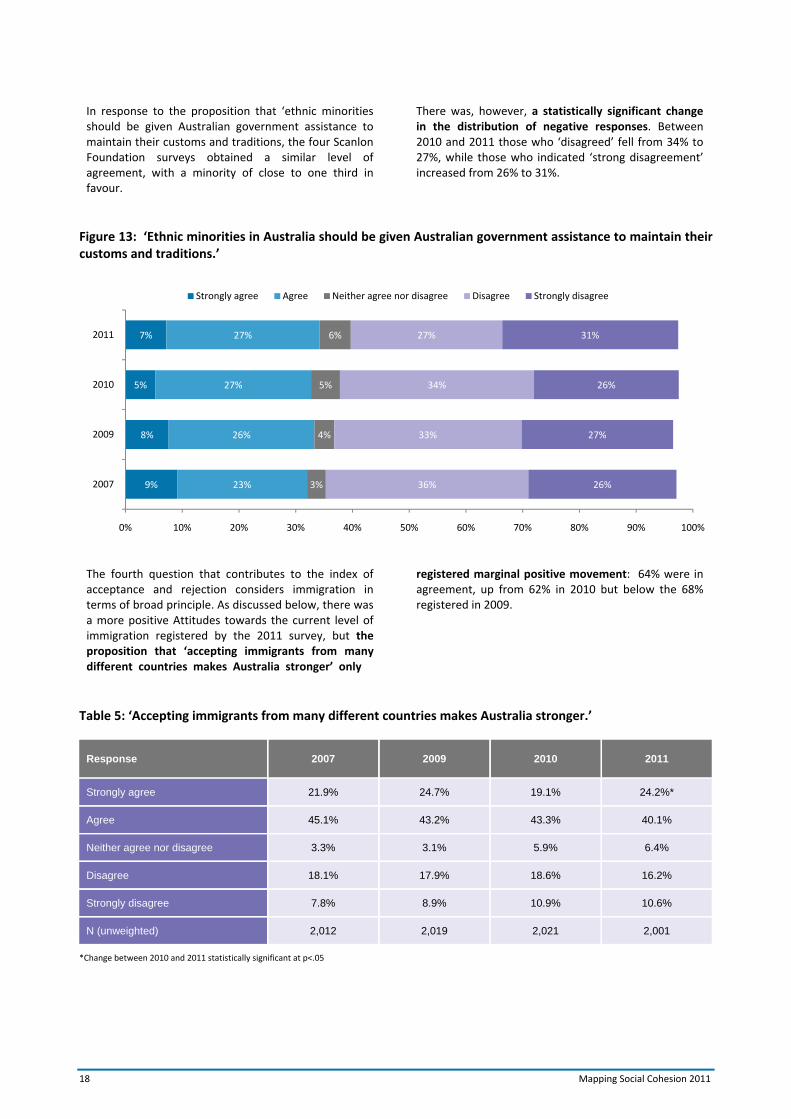
In response to the proposition that ‘ethnic minorities should be given Australian government assistance to maintain their customs and traditions, the four Scanlon Foundation surveys obtained a similar level of agreement, with a minority of close to one third in favour.
There was, however, a statistically significant change in the distribution of negative responses. Between 2010 and 2011 those who ‘disagreed’ fell from 34% to 27%, while those who indicated ‘strong disagreement’ increased from 26% to 31%.
Figure 13: ‘Ethnic minorities in Australia should be given Australian government assistance to maintain their customs and traditions.’
The fourth question that contributes to the index of acceptance and rejection considers immigration in terms of broad principle. As discussed below, there was a more positive Attitudes towards the current level of immigration registered by the 2011 survey, but the proposition that ‘accepting immigrants from many different countries makes Australia stronger’ only
registered marginal positive movement: 64% were in agreement, up from 62% in 2010 but below the 68% registered in 2009.
Table 5: ‘Accepting immigrants from many different countries makes Australia stronger.’
Response 2007 2009 2010 2011
Strongly agree 21.9% 24.7% 19.1% 24.2%*
Agree 45.1% 43.2% 43.3% 40.1%
Neither agree nor disagree 3.3% 3.1% 5.9% 6.4%
Disagree 18.1% 17.9% 18.6% 16.2%
Strongly disagree 7.8% 8.9% 10.9% 10.6%
N (unweighted) 2,012 2,019 2,021 2,001
*Change between 2010 and 2011 statistically significant at p<.05
9%
8%
5%
7%
23%
26%
27%
27%
3%
4%
5%
6%
36%
33%
34%
27%
26%
27%
26%
31%
0% 10% 20% 30% 40% 50% 60% 70% 80% 90% 100%
2007
2009
2010
2011
Strongly agree Agree Neither agree nor disagree Disagree Strongly disagree
Mapping Social Cohesion 2011 19
Ranking of issues
There has been extensive media discussion of population, immigration and asylum issues over the last 12 months, with particular attention on government policy towards asylum seekers. The Scanlon Foundation survey sought to determine if the extent of political and media discussion matches widely held community priorities. The answer from the 2011 survey is a qualified negative.
The first question in the 2011 Scanlon Foundation survey was open‐ended. Respondents were asked ‘What do you think are the most important problems facing Australia today?’ The value of an open‐ended question is that it leaves it to respondents to stipulate issues that are important to them, rather than requiring selection from a pre‐determined and necessarily limited list. Further, with regard to three issues– asylum, immigration and climate change– the survey coded both positive and negative responses, a procedure not adopted in other published ranking polls.
There was little change between 2010 and 2011 in the rank order and proportions stipulating the most important issues. As in 2010, respondents gave their first ranking, by a large margin (25.5%), to issues related to the economy, unemployment and poverty. Environmental issues ranked second: 17.7% of respondents nominated the environment, comprising 11.4% who indicated concern and 6.3% who indicated
scepticism and over‐reaction by government. Issues related to the quality of government and political leadership ranked third.
Next in ranking were immigration, population and asylum issues. The proportion specifying immigration and population issues, at 6.9%, was within 0.1 percentage point of the finding of the 2010 survey. These comprised 5.2% indicating concern with the level of immigration and population growth, while 1.7 specified support of a larger immigration intake.
The issue of asylum seekers was specified by 6.6% of respondents, within 0.2 percentage points of the 2010 result; those making negative comment about asylum seekers declined from 5.7% to 4.0%, whereas those indicating concern over the treatment of asylum seekers increased from 0.7% to 2.6%.
Social issues including childcare, family breakdown, lack of direction and drug use were specified by 6% of respondents and seven issues were specified by between 4% and 1% of respondents. As in 2010, there was almost no reference to Indigenous issues.
Immigration and asylum issues are thus each of first‐rank importance for close to one in 15 respondents; when combined, they are of first rank importance for one in eight respondents. It is reasonable to argue that these issues should be combined to obtain a true indication of the relative importance of population issues: in the minds of many respondents, asylum seekers are seen to be immigrants – and to be having a significant impact on Australia’s total immigration intake. Less than one in four respondents have an accurate sense of the number of asylum seekers who reach Australia by boat, while an even lower proportion have accurate understanding of the decrease in immigrant numbers over the last two years.
But it should not be assumed that there is a uniformity of view among those who give a high ranking to population issues; when responses are disaggregated, differentiating those with negative and positive views, it is found that a total of 9.2% of respondents indicate a negative view of asylum seekers and concern over population growth, while 4.3% indicate support for immigration and express sympathy for asylum seekers.
Thus population issues, broadly defined, are of third rank significance, ranked first by one in eight respondents, as determined by an open‐ended question. This is higher than the average result of past surveys, for example the long‐run findings of Newspoll, but it is low by high levels recorded in a number of
European polls. For example, late in the period of the Blair government, immigration and race relations was consistently the top‐ranked issue. The Eurobarometer survey in 2006 indicated that 64% of respondents in Spain ranked immigration as one of the two most important issues facing the country.4
4 Ipsos Mori Social Research Institute, Blair’s Britain: The Social and Cultural Legacy, 2008, p. 19; European Commission, Eurobarometer 66: Public Opinion in the European Union

20 Mapping Social Cohesion 2011
Table 6: ‘What do you think are the most important problems facing Australia today?’
Rank Issue 2010
First mention 2011
First mention
1 Economy/ unemployment/ poverty 22.2% 25.5%
2
Environment – climate change/ water shortages (concern)
15.1%
11.4%
17.7% Environment – overreaction to climate change/ carbon tax (sceptical)
6.3%
3 Quality of government/ politicians 11.2% 12.7%
4
Immigration/ population growth (concern)
6.8%
5.2%
6.9% Immigration/population – too low/ need more people (supportive)
1.7%
5
Asylum seekers – too many/ refugees/ boat people/ illegal immigrants (negative comment) 6.4%
4.0%
6.6% Asylum seekers – poor treatment, sympathy towards refugees/ boat people/ illegal immigrants
2.6%
6 Social issues – (family, child care, drug use, family breakdown, lack of personal direction, etc)
6.4% 6.0%
7 Health/ medical/ hospitals 5.6% 4.2%
8 Housing shortage/ affordability/ interest rates 2.1% 3.1%
9 Crime/ law and order 3.8% 1.7%
10 Racism 1.1% 1.6%
10 Education/ schools 2.2% 1.4%
12 Indigenous issues 0.1% 0.8%
13 Industrial relations/ trade unions na 0.6%
14 Defence/ national security/ terrorism na 0.5%
15 Other/ nothing/ don’t know 16.1% 10.8%
Total 100% 100%
N (unweighted) 2,021 100%
Mapping Social Cohesion 2011 21
Trust and community involvement
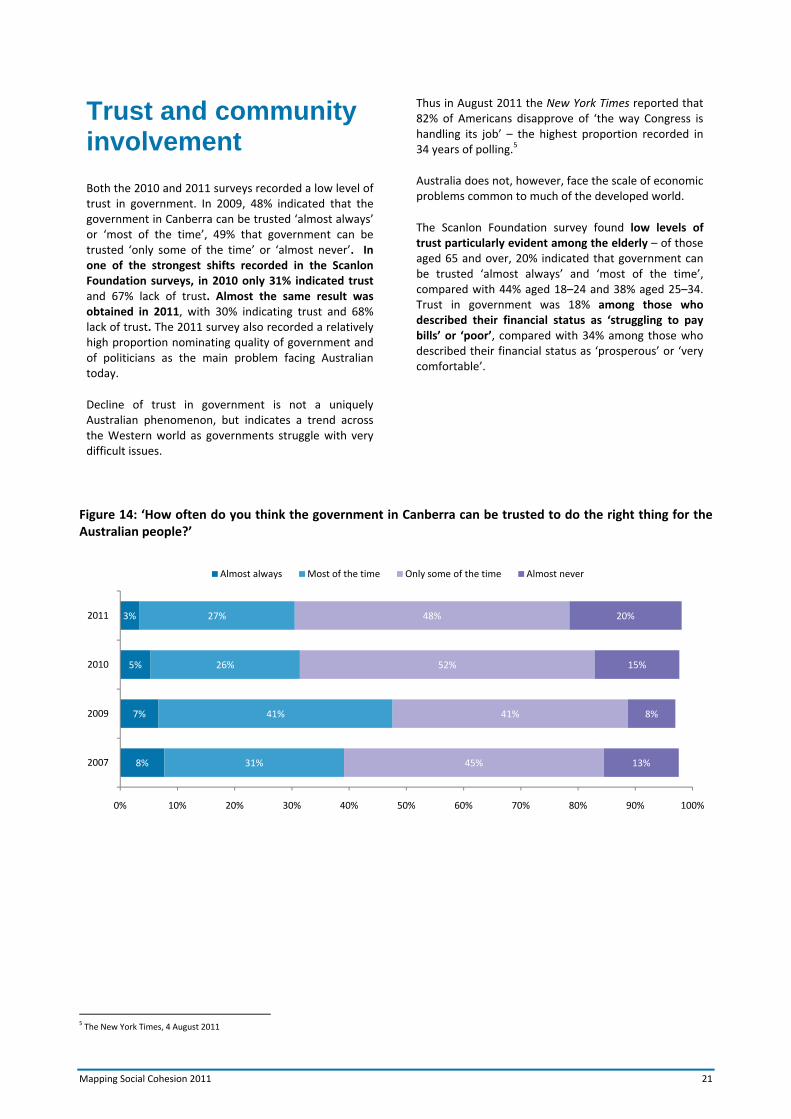
Both the 2010 and 2011 surveys recorded a low level of trust in government. In 2009, 48% indicated that the government in Canberra can be trusted ‘almost always’ or ‘most of the time’, 49% that government can be trusted ‘only some of the time’ or ‘almost never’. In one of the strongest shifts recorded in the Scanlon Foundation surveys, in 2010 only 31% indicated trust and 67% lack of trust. Almost the same result was obtained in 2011, with 30% indicating trust and 68% lack of trust. The 2011 survey also recorded a relatively high proportion nominating quality of government and of politicians as the main problem facing Australian today.
Decline of trust in government is not a uniquely Australian phenomenon, but indicates a trend across the Western world as governments struggle with very difficult issues.
Thus in August 2011 the New York Times reported that 82% of Americans disapprove of ‘the way Congress is handling its job’ – the highest proportion recorded in 34 years of polling.5
Australia does not, however, face the scale of economic problems common to much of the developed world.
The Scanlon Foundation survey found low levels of trust particularly evident among the elderly – of those aged 65 and over, 20% indicated that government can be trusted ‘almost always’ and ‘most of the time’, compared with 44% aged 18–24 and 38% aged 25–34. Trust in government was 18% among those who described their financial status as ‘struggling to pay bills’ or ‘poor’, compared with 34% among those who described their financial status as ‘prosperous’ or ‘very comfortable’.
Figure 14: ‘How often do you think the government in Canberra can be trusted to do the right thing for the Australian people?’
5 The New York Times, 4 August 2011
8%
7%
5%
3%
31%
41%
26%
27%
45%
41%
52%
48%
13%
8%
15%
20%
0% 10% 20% 30% 40% 50% 60% 70% 80% 90% 100%
2007
2009
2010
2011
Almost always Most of the time Only some of the time Almost never

22 Mapping Social Cohesion 2011
Table 7: ‘How often do you think the government in Canberra can be trusted to do the right thing for the Australian people?’, by age
Response 18–24 25–34 35–44 45–54 55–64 65+
Almost always 7.8% 3.3% 2.7% 1.4% 3.5% 2.6%
Most of the time 35.7% 35.0% 28.3% 22.4% 25.7% 17.7%
Only some of the time 52.0% 46.0% 44.7% 54.3% 44.0% 47.7%
Almost never 2.9% 15.4% 22.5% 19.3% 26.8% 27.7%
N (unweighted) 90 168 317 430 465 525
The 2010 and 2011 Scanlon Foundation surveys have also recorded a decline in trust in other people. This measure is based on a question posed in several surveys conducted between 1983 and 2003, with respondents given the options that most people ‘can be trusted’, that one ‘can’t be too careful’, or that it is not possible to answer.
The 2007 Scanlon benchmark survey found an increased level of trust in fellow Australians, when compared to results of the earlier surveys. The 2009 survey replicated the 2007 finding, but the 2010 and 2011 surveys registered a sharp fall, from 55% agreeing that most people ‘can be trusted’ to 45%–46%.
Figure 15: ‘Most people can be trusted’, Scanlon Foundation Surveys 2007–2011 and earlier surveys compared
48%
40%46%
41%
53% 55%
45% 46%
0%
10%
20%
30%
40%
50%
60%
1983 1995 2001 2003 2007 2009 2010 2011
The 2010 and 2011 surveys also registered a decline in community involvement, as indicated by voluntary work.
Respondents were asked about involvement in ‘unpaid voluntary work’, which was defined as ‘any unpaid help you give to the community in which you live, or to an organisation or group to which you belong.
It could be to a school, a sporting club, the elderly, a religious group or people who have recently arrived to settle in Australia.’ In 2009, 38% of respondents indicated that they performed such unpaid voluntary work at least once a month; in 2010 this proportion fell to 32% and to 31% in 2011.
Mapping Social Cohesion 2011 23
Immigration
Immigration level – actual and perceived
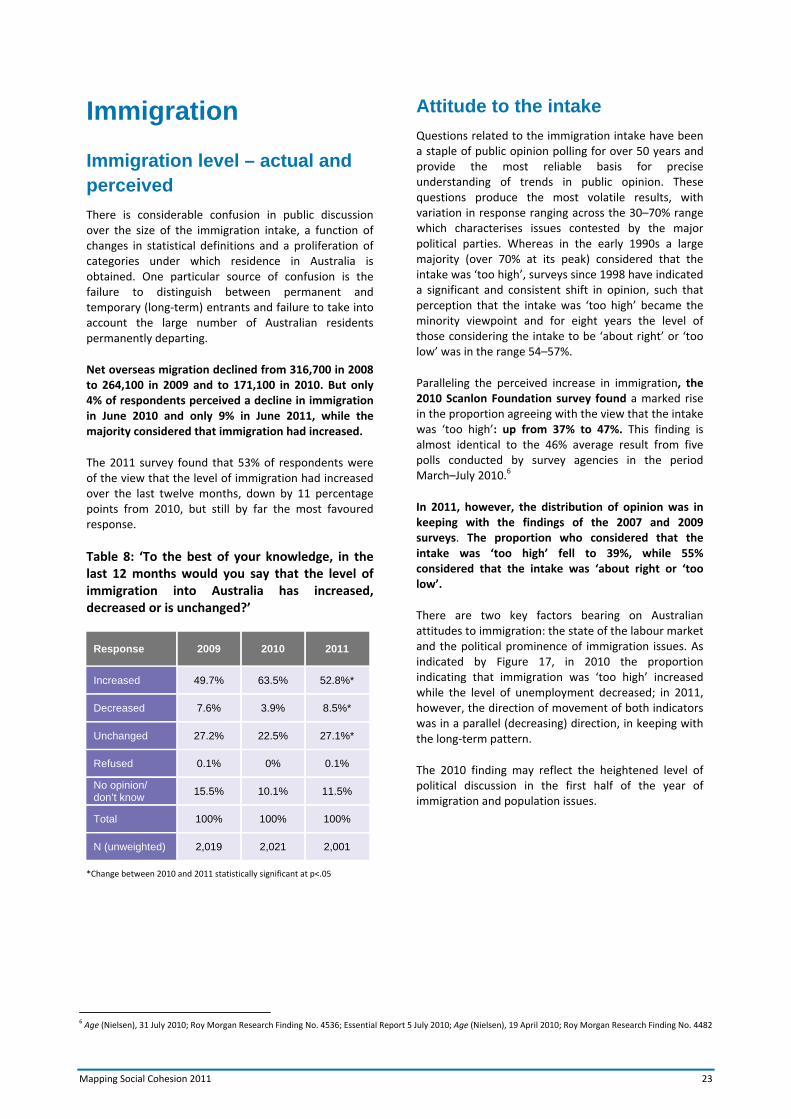
There is considerable confusion in public discussion over the size of the immigration intake, a function of changes in statistical definitions and a proliferation of categories under which residence in Australia is obtained. One particular source of confusion is the failure to distinguish between permanent and temporary (long‐term) entrants and failure to take into account the large number of Australian residents permanently departing.
Net overseas migration declined from 316,700 in 2008 to 264,100 in 2009 and to 171,100 in 2010. But only 4% of respondents perceived a decline in immigration in June 2010 and only 9% in June 2011, while the majority considered that immigration had increased.
The 2011 survey found that 53% of respondents were of the view that the level of immigration had increased over the last twelve months, down by 11 percentage points from 2010, but still by far the most favoured response.
Table 8: ‘To the best of your knowledge, in the last 12 months would you say that the level of immigration into Australia has increased, decreased or is unchanged?’
Response 2009 2010 2011
Increased 49.7% 63.5% 52.8%*
Decreased 7.6% 3.9% 8.5%*
Unchanged 27.2% 22.5% 27.1%*
Refused 0.1% 0% 0.1%
No opinion/ don’t know
15.5% 10.1% 11.5%
Total 100% 100% 100%
N (unweighted) 2,019 2,021 2,001
*Change between 2010 and 2011 statistically significant at p<.05
Attitude to the intake
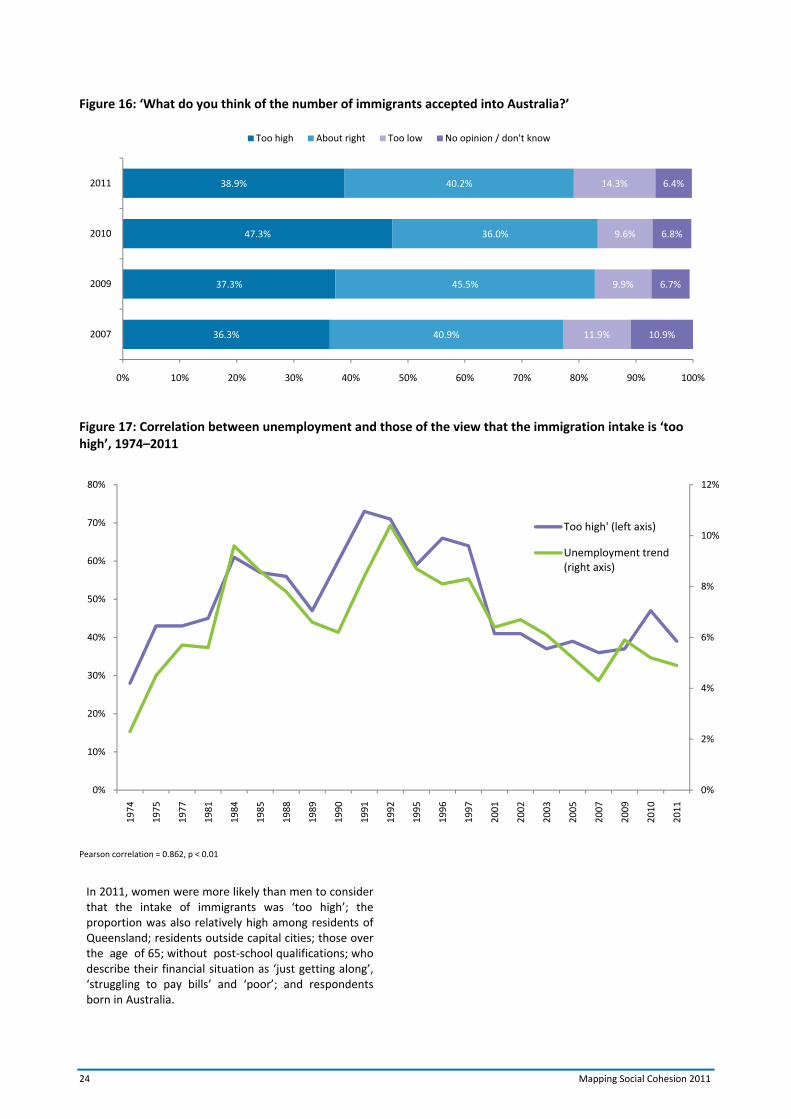
Questions related to the immigration intake have been a staple of public opinion polling for over 50 years and provide the most reliable basis for precise understanding of trends in public opinion. These questions produce the most volatile results, with variation in response ranging across the 30–70% range which characterises issues contested by the major political parties. Whereas in the early 1990s a large majority (over 70% at its peak) considered that the intake was ‘too high’, surveys since 1998 have indicated a significant and consistent shift in opinion, such that perception that the intake was ‘too high’ became the minority viewpoint and for eight years the level of those considering the intake to be ‘about right’ or ‘too low’ was in the range 54–57%.
Paralleling the perceived increase in immigration, the 2010 Scanlon Foundation survey found a marked rise in the proportion agreeing with the view that the intake was ‘too high’: up from 37% to 47%. This finding is almost identical to the 46% average result from five polls conducted by survey agencies in the period March–July 2010.6
In 2011, however, the distribution of opinion was in keeping with the findings of the 2007 and 2009 surveys. The proportion who considered that the intake was ‘too high’ fell to 39%, while 55% considered that the intake was ‘about right or ‘too low’.
There are two key factors bearing on Australian attitudes to immigration: the state of the labour market and the political prominence of immigration issues. As indicated by Figure 17, in 2010 the proportion indicating that immigration was ‘too high’ increased while the level of unemployment decreased; in 2011, however, the direction of movement of both indicators was in a parallel (decreasing) direction, in keeping with the long‐term pattern.
The 2010 finding may reflect the heightened level of political discussion in the first half of the year of immigration and population issues.
6 Age (Nielsen), 31 July 2010; Roy Morgan Research Finding No. 4536; Essential Report 5 July 2010; Age (Nielsen), 19 April 2010; Roy Morgan Research Finding No. 4482
24 Mapping Social Cohesion 2011
Figure 16: ‘What do you think of the number of immigrants accepted into Australia?’
Figure 17: Correlation between unemployment and those of the view that the immigration intake is ‘too high’, 1974–2011
Pearson correlation = 0.862, p < 0.01
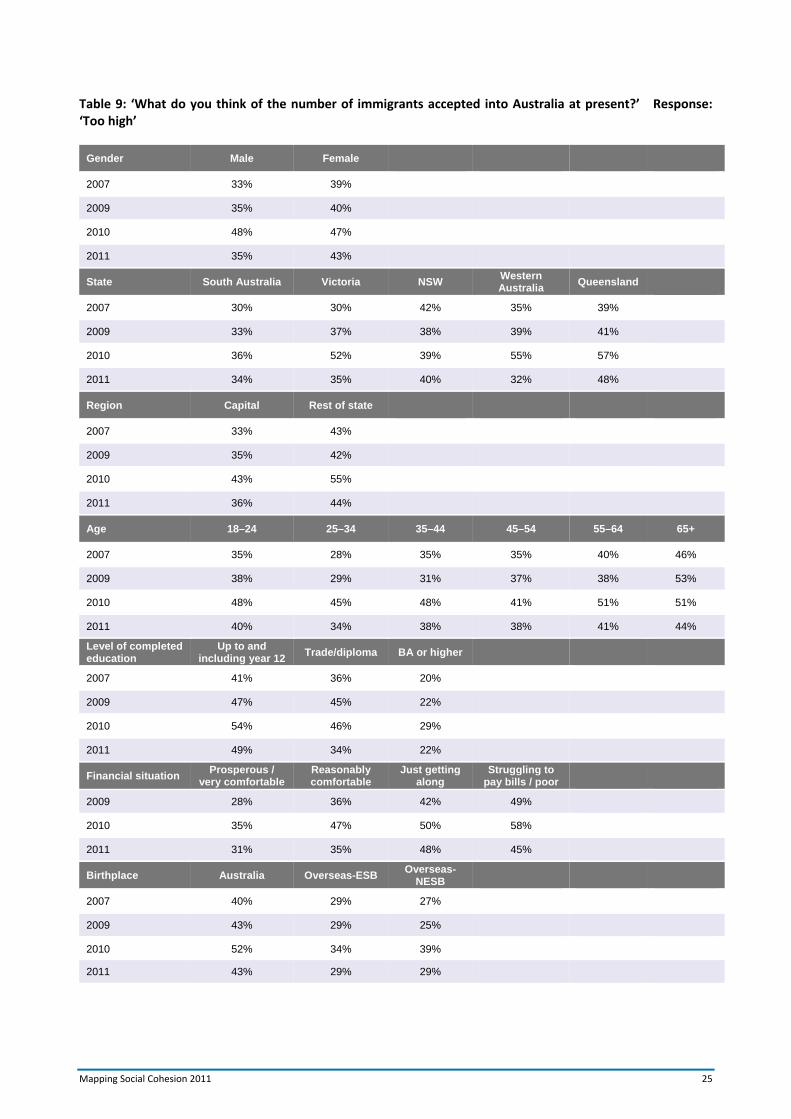
In 2011, women were more likely than men to consider that the intake of immigrants was ‘too high’; the proportion was also relatively high among residents of Queensland; residents outside capital cities; those over the age of 65; without post‐school qualifications; who describe their financial situation as ‘just getting along’, ‘struggling to pay bills’ and ‘poor’; and respondents born in Australia.
36.3%
37.3%
47.3%
38.9%
40.9%
45.5%
36.0%
40.2%
11.9%
9.9%
9.6%
14.3%
10.9%
6.7%
6.8%
6.4%
0% 10% 20% 30% 40% 50% 60% 70% 80% 90% 100%
2007
2009
2010
2011
Too high About right Too low No opinion / don't know
0%
2%
4%
6%
8%
10%
12%
0%
10%
20%
30%
40%
50%
60%
70%
80%
1974
1975
1977
1981
1984
1985
1988
1989
1990
1991
1992
1995
1996
1997
2001
2002
2003
2005
2007
2009
2010
2011
Too high' (left axis)
Unemployment trend (right axis)
Mapping Social Cohesion 2011 25
Table 9: ‘What do you think of the number of immigrants accepted into Australia at present?’ Response: ‘Too high’
Gender Male Female
2007 33% 39%
2009 35% 40%
2010 48% 47%
2011 35% 43%
State South Australia Victoria NSW Western Australia
Queensland
2007 30% 30% 42% 35% 39%
2009 33% 37% 38% 39% 41%
2010 36% 52% 39% 55% 57%
2011 34% 35% 40% 32% 48%
Region Capital Rest of state
2007 33% 43%
2009 35% 42%
2010 43% 55%
2011 36% 44%
Age 18–24 25–34 35–44 45–54 55–64 65+
2007 35% 28% 35% 35% 40% 46%
2009 38% 29% 31% 37% 38% 53%
2010 48% 45% 48% 41% 51% 51%
2011 40% 34% 38% 38% 41% 44%
Level of completed education
Up to and including year 12
Trade/diploma BA or higher
2007 41% 36% 20%
2009 47% 45% 22%
2010 54% 46% 29%
2011 49% 34% 22%
Financial situation Prosperous /
very comfortable Reasonably comfortable
Just getting along
Struggling to pay bills / poor
2009 28% 36% 42% 49%
2010 35% 47% 50% 58%
2011 31% 35% 48% 45%
Birthplace Australia Overseas-ESB Overseas-
NESB
2007 40% 29% 27%
2009 43% 29% 25%
2010 52% 34% 39%
2011 43% 29% 29%

26 Mapping Social Cohesion 2011
Arguments for and against immigration
The 2011 survey explored the relative importance of arguments that are made concerning immigration. Following an introduction which told respondents that various reasons were given ‘for and against immigration’, they were presented with four statements made ‘to increase Australia’s population’ and then four statements ‘not to increase Australia’s population’. The statements were posed in random order, to rule out biasing of results by a fixed listing of options.
The statements in favour were:
a. We need more people for economic growth;
b. We need more people to increase the cultural
diversity of Australia;
c. We need a larger population to defend the country
against attack in the future;
d. We need more people because our population is
ageing.
The highest proportion (56%) expressing ‘strong agreement’ and ‘agreement’ was for economic growth, followed closely (47%) by consideration of the impact of ageing. The value of increasing cultural diversity ranked third (33%) and agreement with the need to increase population for purposes of defence, the ‘populate or perish’ idea which informed government policy in the years after the Second World War, was a distant fourth (19%).
The statements against immigration were:
a. Our cities are too crowded now
b. We already have too much cultural diversity
c. Our natural environment cannot cope with a larger
population
d. Immigration will increase unemployment
Responses to the negative arguments indicated less differentiation. The lowest level of agreement (36%) was with the view that there was already too much cultural diversity. The argument that cities were too crowded obtained the highest level of agreement (56%), closely followed by concern for the natural environment (50%) and the fear that unemployment would be increased (48%).
Figure 18: Arguments in support of immigration Figure 19: Arguments against immigration
16%12%
9% 6%
40%
35%
24%
13%
0%
10%
20%
30%
40%
50%
60%
Economic growth
Ageing population
Cultural diversity
Defend the country
Agree
Strongly agree
20% 20%16%
10%
36%30%
32%
26%
0%
10%
20%
30%
40%
50%
60%
Cities too crowded
Natural environment cannot cope
Increase unemployment
Too much cultural diversity
Agree
Strongly agree
Mapping Social Cohesion 2011 27
Immigrant categories The 2010 and 2011 Scanlon Fou n surveys undertook detailed explora of tudes to immigrant categories, n onal and religious groups, to provide a fuller understanding of current tudes and the extent of change in recent decades. The 2011 results confirm the findings of the 2010 survey.
Respondents were asked for their views on the main categories of permanent and long-stay immigrants, that is, those admi d under the Skill and Family Streams of
the Migra on Program and overseas student, as well as their views on refugees er overseas.
The most ve des are towards immigrants d on the basis of skill. The views, however,
towards the other three categories were almost as favourable. In 2011 posi ve outnumber
by a ra o close to 8:1 for refugees and family and 6:1 for students. More udes were indicated in 2011 towards refugees and those who enter under the family stream.
Figure 20: ‘Do you feel or neutral about (category) coming to live in Australia as a permanent or long-term resident?’
The above categories were defined in the survey as: skilled workers (e.g. doctors or nurses, plumbers, etc.); those who have close family living in Australia (e.g. parents or children); refugees who have been assessed overseas and found to be vic ms of persecu on and in need of help; and, young people who want to study in Australia.
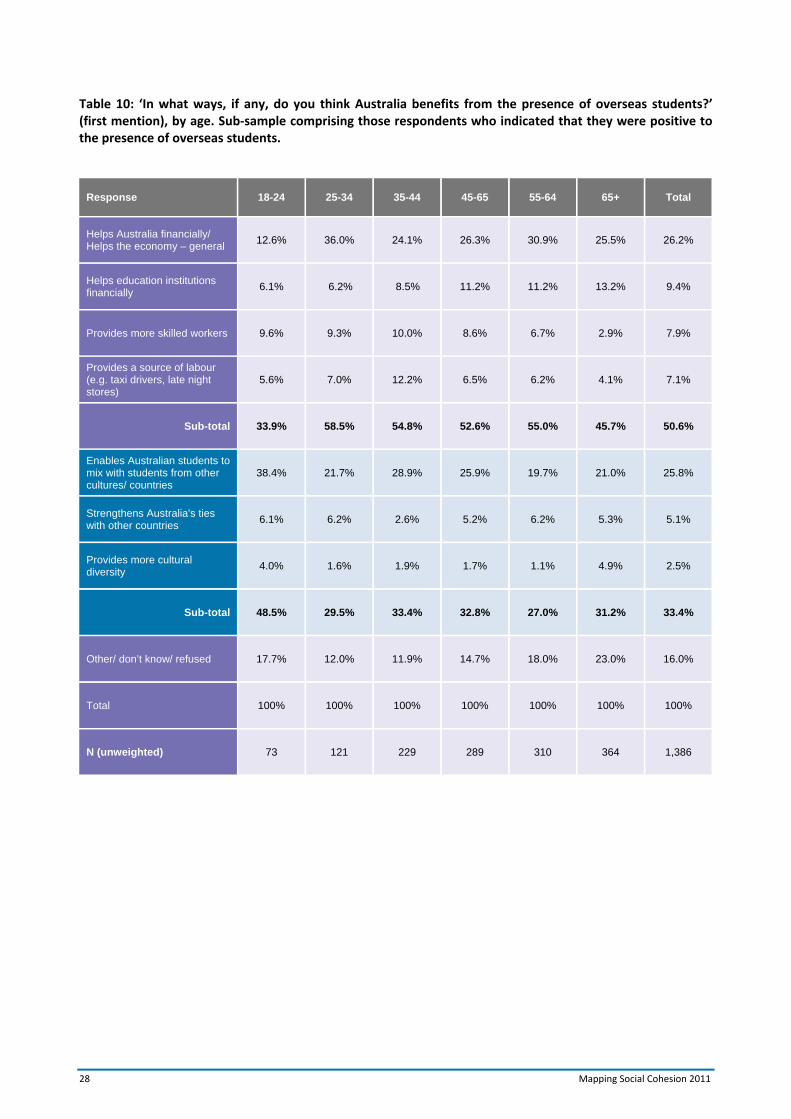
The 2011 survey further explored tudes towards overseas students. The 69% of respondents who were
to the entry of students were asked in an open-ended qu for their view of the benefit to Australia. The most common responses related to financial benefit, me ed in four contexts by a total of 51% of these respondents (or 35% of the total sample). The value of Australian students mixing with students from other cultures, providing more cultural diversity and strengthening n onal es, was
by 31% of respondents (23% of the total sample).
There was considerable when responses were considered by age. The specific benefit of mixing with students from other cultures was men oned by 38% of the sub-sample aged 18–24, but close to half this propo on among those aged 55 and above. Financial benefit was oned most o en by those aged 25–34.
77% 78%65% 71% 69% 69% 66%
73%
14% 14%
23%19%
18% 19%17%
16%
8% 7% 10% 9% 12% 11%14%
9%
0%
10%
20%
30%
40%
50%
60%
70%
80%
90%
100%
2010 2011 2010 2011 2010 2011 2010 2011
seegufeRstnedutSylimaFdellikS (assessed overseas)
Posi ve Neutral ve
28 Mapping Social Cohesion 2011
Table 10: ‘In what ways, if any, do you think Australia benefits from the presence of overseas students?’ (first mention), by age. Sub‐sample comprising those respondents who indicated that they were positive to the presence of overseas students.
Response 18-24 25-34 35-44 45-65 55-64 65+ Total
Helps Australia financially/ Helps the economy – general
12.6% 36.0% 24.1% 26.3% 30.9% 25.5% 26.2%
Helps education institutions financially
6.1% 6.2% 8.5% 11.2% 11.2% 13.2% 9.4%
Provides more skilled workers 9.6% 9.3% 10.0% 8.6% 6.7% 2.9% 7.9%
Provides a source of labour (e.g. taxi drivers, late night stores)
5.6% 7.0% 12.2% 6.5% 6.2% 4.1% 7.1%
Sub-total 33.9% 58.5% 54.8% 52.6% 55.0% 45.7% 50.6%
Enables Australian students to mix with students from other cultures/ countries
38.4% 21.7% 28.9% 25.9% 19.7% 21.0% 25.8%
Strengthens Australia's ties with other countries
6.1% 6.2% 2.6% 5.2% 6.2% 5.3% 5.1%
Provides more cultural diversity
4.0% 1.6% 1.9% 1.7% 1.1% 4.9% 2.5%
Sub-total 48.5% 29.5% 33.4% 32.8% 27.0% 31.2% 33.4%
Other/ don’t know/ refused 17.7% 12.0% 11.9% 14.7% 18.0% 23.0% 16.0%
Total 100% 100% 100% 100% 100% 100% 100%
N (unweighted) 73 121 229 289 310 364 1,386
Mapping Social Cohesion 2011 29
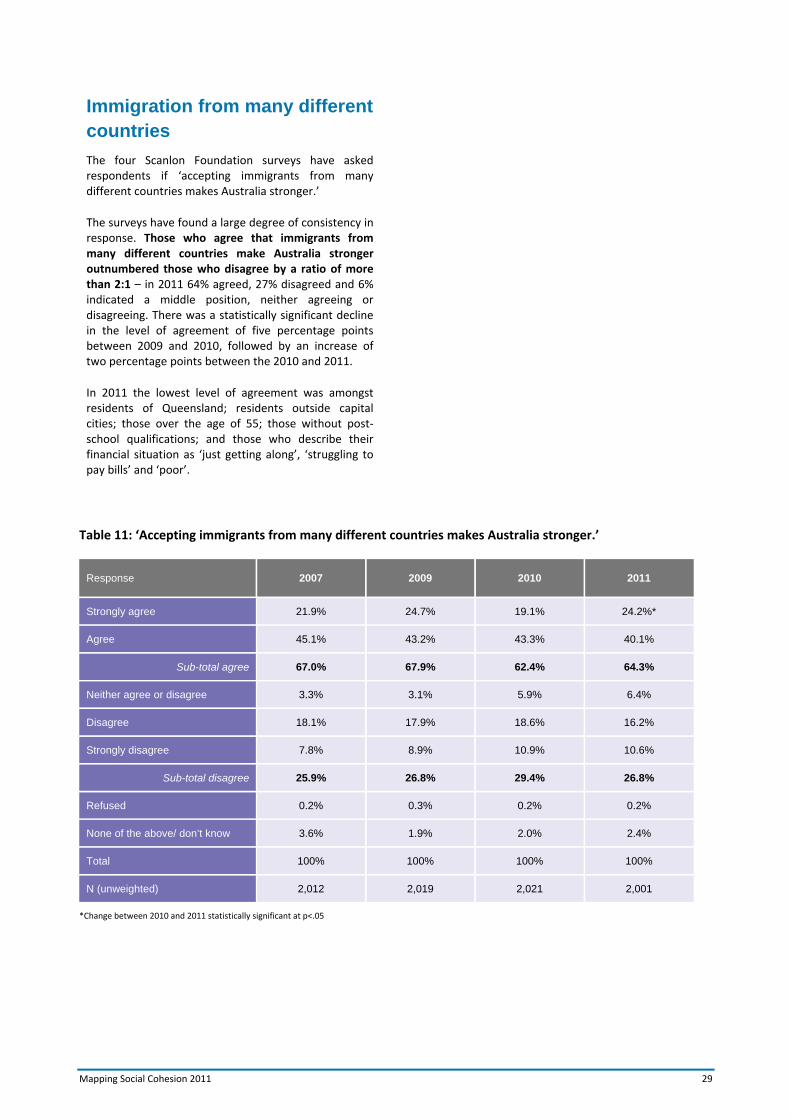
Table 11: ‘Accepting immigrants from many different countries makes Australia stronger.’
Response 2007 2009 2010 2011
Strongly agree 21.9% 24.7% 19.1% 24.2%*
Agree 45.1% 43.2% 43.3% 40.1%
Sub-total agree 67.0% 67.9% 62.4% 64.3%
Neither agree or disagree 3.3% 3.1% 5.9% 6.4%
Disagree 18.1% 17.9% 18.6% 16.2%
Strongly disagree 7.8% 8.9% 10.9% 10.6%
Sub-total disagree 25.9% 26.8% 29.4% 26.8%
Refused 0.2% 0.3% 0.2% 0.2%
None of the above/ don’t know 3.6% 1.9% 2.0% 2.4%
Total 100% 100% 100% 100%
N (unweighted) 2,012 2,019 2,021 2,001
*Change between 2010 and 2011 statistically significant at p<.05
Immigration from many different countries
The four Scanlon Foundation surveys have asked respondents if ‘accepting immigrants from many different countries makes Australia stronger.’
The surveys have found a large degree of consistency in response. Those who agree that immigrants from many different countries make Australia stronger outnumbered those who disagree by a ratio of more than 2:1 – in 2011 64% agreed, 27% disagreed and 6% indicated a middle position, neither agreeing or disagreeing. There was a statistically significant decline in the level of agreement of five percentage points between 2009 and 2010, followed by an increase of two percentage points between the 2010 and 2011.
In 2011 the lowest level of agreement was amongst residents of Queensland; residents outside capital cities; those over the age of 55; those without post‐school qualifications; and those who describe their financial situation as ‘just getting along’, ‘struggling to pay bills’ and ‘poor’.

30 Mapping Social Cohesion 2011
Table 12: ‘Accepting immigrants from many different countries makes Australia stronger.’ Response: ‘Strongly agree’ and ‘agree’
Gender Male Female
2007 73% 62%
2009 69% 67%
2010 62% 62%
2011 65% 64%
State South Australia Victoria New South
Wales Western Australia
Queensland
2007 75% 70% 64% 67% 65%
2009 71% 76% 65% 59% 65%
2010 65% 64% 67% 50% 57%
2011 60% 74% 65% 61% 53%
Region Capital Rest of state
2007 70% 62%
2009 71% 62%
2010 66% 57%
2011 67% 59%
Age 18–24 25–34 35–44 45–54 55–64 65+
2007 75% 71% 72% 66% 66% 57%
2009 71% 73% 73% 67% 67% 55%
2010 69% 67% 65% 65% 61% 51%
2011 76% 69% 67% 62% 59% 55%
Level of completed education
Up to and including year 12
Trade / diploma BA or higher
2007 63% 66% 83%
2009 63% 61% 78%
2010 57% 62% 81%
2011 57% 67% 82%
Financial situation Prosperous /
very comfortable Reasonably comfortable
Just getting along
Struggling to pay bills / poor
2009 75% 68% 68% 53%
2010 75% 62% 56% 55%
2011 74% 67% 59% 54%
Birthplace Australia Overseas-
ESB Overseas-
NESB
2007 64% 69% 75%
2009 64% 71% 78%
2010 59% 68% 68%
2011 62% 65% 74%
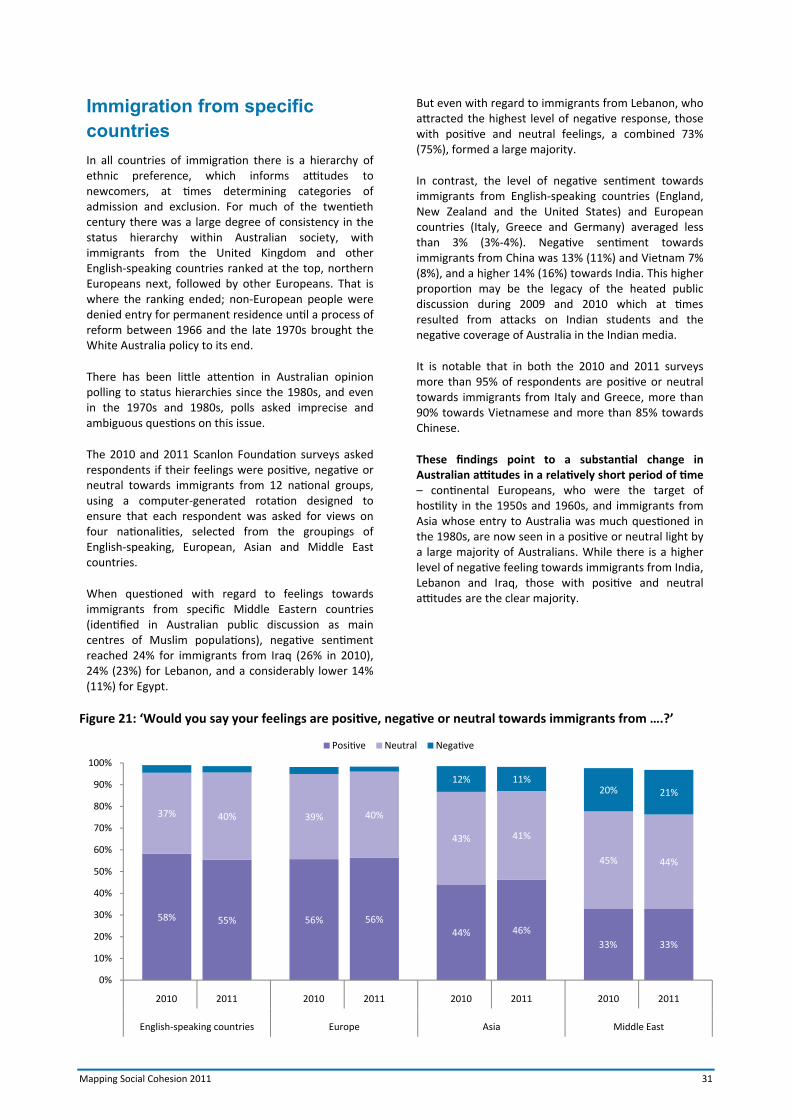
Mapping Social Cohesion 2011 31
Immigration from specific countriesIn all countries of immigration there is a hierarchy of ethnic preference, which informs attitudes to newcomers, at times determining categories of admission and exclusion. For much of the twentieth century there was a large degree of consistency in the status hierarchy within Australian society, with immigrants from the United Kingdom and other English-speaking countries ranked at the top, northern Europeans next, followed by other Europeans. That is where the ranking ended; non-European people were denied entry for permanent residence until a process of reform between 1966 and the late 1970s brought the White Australia policy to its end.
There has been little attention in Australian opinion polling to status hierarchies since the 1980s, and even in the 1970s and 1980s, polls asked imprecise and ambiguous questions on this issue.
The 2010 and 2011 Scanlon Foundation surveys asked respondents if their feelings were positive, negative or neutral towards immigrants from 12 national groups, using a computer-generated rotation designed to ensure that each respondent was asked for views on four nationalities, selected from the groupings of English-speaking, European, Asian and Middle East countries.
When questioned with regard to feelings towards immigrants from specific Middle Eastern countries (identified in Australian public discussion as main centres of Muslim populations), negative sentiment reached 24% for immigrants from Iraq (26% in 2010), 24% (23%) for Lebanon, and a considerably lower 14% (11%) for Egypt.
But even with regard to immigrants from Lebanon, who attracted the highest level of negative response, those with positive and neutral feelings, a combined 73% (75%), formed a large majority.
In contrast, the level of negative sentiment towards immigrants from English-speaking countries (England, New Zealand and the United States) and European countries (Italy, Greece and Germany) averaged less than 3% (3%-4%). Negative sentiment towards immigrants from China was 13% (11%) and Vietnam 7% (8%), and a higher 14% (16%) towards India. This higher proportion may be the legacy of the heated public discussion during 2009 and 2010 which at times resulted from attacks on Indian students and the negative coverage of Australia in the Indian media.
It is notable that in both the 2010 and 2011 surveys more than 95% of respondents are positive or neutral towards immigrants from Italy and Greece, more than 90% towards Vietnamese and more than 85% towards Chinese.
These findings point to a substantial change in Australian attitudes in a relatively short period of time – continental Europeans, who were the target of hostility in the 1950s and 1960s, and immigrants from Asia whose entry to Australia was much questioned in the 1980s, are now seen in a positive or neutral light by a large majority of Australians. While there is a higher level of negative feeling towards immigrants from India, Lebanon and Iraq, those with positive and neutral attitudes are the clear majority.
Figure 21: ‘Would you say your feelings are positive, negative or neutral towards immigrants from ….?’
58% 55% 56% 56%44% 46%
37% 40% 39% 40%
43% 41%
45% 44%
12% 11%20% 21%
0%
10%
20%
30%
40%
50%
60%
70%
80%
90%
100%
English-speaking elddiMaisAeporuEseirtnuoc East
Positive Neutral Negative
33% 33%
2010 2011 2010 2011 2010 2011 2010 2011

32 Mapping Social Cohesion 2011
Table 13: ‘Would you say your feelings are positive, negative or neutral towards immigrants from ….?’
Very positive Somewhat
positive Sub-total positive Neutral
Somewhat negative
Very negative Sub-total negative
Refused / don't know
Total N (unweighted)
2010 2011 2010 2011 2010 2011 2010 2011 2010 2011 2010 2011 2010 2011 2010 2011 2010/ 2011
2010 2011
ENGLISH-SPEAKING
England 25.5% 30.0% 36.1% 28.5% 61.6% 58.5% 34.9% 37.8% 1.3% 1.6% 1.0% 0.0% 2.3% 1.6% 1.2% 2.0% 100% 675 723
New Zealand 24.3% 32.0% 38.6% 26.3% 62.9% 58.2% 32.8% 38.2% 2.2% 1.7% 1.1% 0.4% 3.3% 2.1% 1.0% 1.4% 100% 672 601
USA 14.0% 18.4% 36.2% 31.2% 50.2% 49.6% 44.2% 44.5% 4.3% 3.6% 0.6% 1.4% 4.7% 4.9% 0.8% 1.0% 100% 674 677
Average
58.2% 55.4%
3.5% 2.9%
EUROPE
Italy 28.3% 28.6% 30.2% 28.2% 58.5% 56.7% 38.5% 39.7% 1.8% 2.0% 0.9% 0.5% 2.7% 2.5% 0.4% 1.0% 100% 673 696
Greece 18.9% 19.7% 37.6% 34.9% 56.5% 54.6% 38.7% 40.3% 1.7% 1.9% 0.6% 0.8% 2.3% 2.7% 2.4% 2.4% 100% 674 659
Germany 19.1% 25.4% 33.1% 32.1% 52.2% 57.5% 40.4% 39.0% 3.3% 1.1% 1.2% 0.5% 4.5% 1.7% 3.0% 1.9% 100% 674 646
Average
55.7% 56.3%
3.2% 2.3%
ASIA
China 13.3% 14.8% 33.5% 31.1% 46.8% 45.8% 40.9% 40.3% 8.1% 8.5% 2.5% 4.2% 10.6% 12.7% 1.5% 1.2% 100% 675 688
Vietnam 12.6% 21.6% 32.2% 28.5% 44.8% 50.1% 45.2% 41.1% 6.1% 4.4% 2.3% 2.6% 8.4% 7.0% 1.6% 1.7% 100% 675 645
India 12.1% 12.1% 28.7% 30.5% 40.8% 42.6% 41.7% 41.4% 12.7% 9.8% 3.7% 3.9% 16.4% 13.7% 1.1% 2.3% 100% 671 668
Average
44.1% 46.2%
11.8% 11.1%
MIDDLE EAST
Lebanon 9.0% 9.8% 22.9% 22.0% 31.9% 31.8% 42.7% 40.7% 15.3% 14.7% 7.4% 9.2% 22.7% 23.9% 2.7% 3.6% 100% 675 709
Egypt 13.7% 12.9% 26.9% 24.5% 40.5% 37.4% 44.8% 44.5% 6.0% 9.2% 5.1% 4.8% 11.1% 14.0% 3.5% 4.0% 100% 671 628
Iraq 7.0% 8.9% 18.8% 20.4% 25.8% 29.3% 47.1% 45.3% 15.8% 12.9% 10.0% 10.6% 25.8% 23.5% 1.3% 1.9% 100% 675 664
Average
32.8% 32.8%
19.9% 20.5%
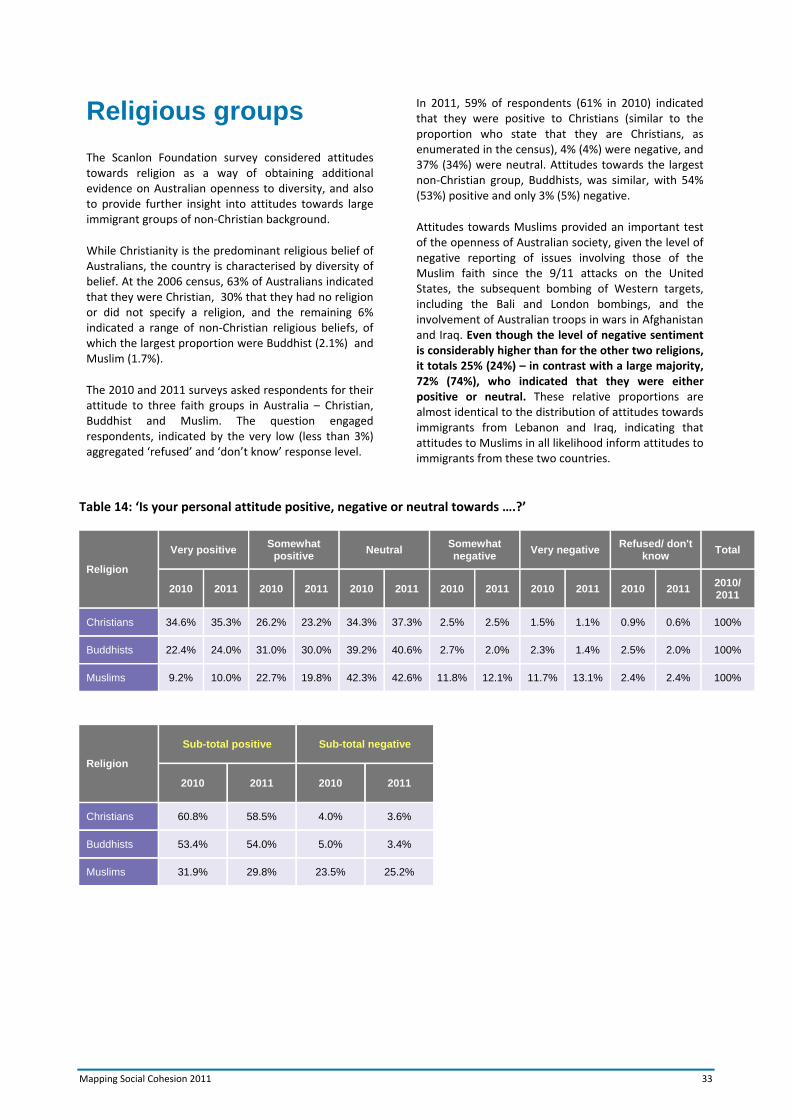
Mapping Social Cohesion 2011 33
Religious groups
The Scanlon Foundation survey considered attitudes towards religion as a way of obtaining additional evidence on Australian openness to diversity, and also to provide further insight into attitudes towards large immigrant groups of non‐Christian background.
While Christianity is the predominant religious belief of Australians, the country is characterised by diversity of belief. At the 2006 census, 63% of Australians indicated that they were Christian, 30% that they had no religion or did not specify a religion, and the remaining 6% indicated a range of non‐Christian religious beliefs, of which the largest proportion were Buddhist (2.1%) and Muslim (1.7%).
The 2010 and 2011 surveys asked respondents for their attitude to three faith groups in Australia – Christian, Buddhist and Muslim. The question engaged respondents, indicated by the very low (less than 3%) aggregated ‘refused’ and ‘don’t know’ response level.
In 2011, 59% of respondents (61% in 2010) indicated that they were positive to Christians (similar to the proportion who state that they are Christians, as enumerated in the census), 4% (4%) were negative, and 37% (34%) were neutral. Attitudes towards the largest non‐Christian group, Buddhists, was similar, with 54% (53%) positive and only 3% (5%) negative.
Attitudes towards Muslims provided an important test of the openness of Australian society, given the level of negative reporting of issues involving those of the Muslim faith since the 9/11 attacks on the United States, the subsequent bombing of Western targets, including the Bali and London bombings, and the involvement of Australian troops in wars in Afghanistan and Iraq. Even though the level of negative sentiment is considerably higher than for the other two religions, it totals 25% (24%) – in contrast with a large majority, 72% (74%), who indicated that they were either positive or neutral. These relative proportions are almost identical to the distribution of attitudes towards immigrants from Lebanon and Iraq, indicating that attitudes to Muslims in all likelihood inform attitudes to immigrants from these two countries.
Table 14: ‘Is your personal attitude positive, negative or neutral towards ….?’
Religion
Very positive Somewhat
positive Neutral Somewhat
negative Very negative Refused/ don't
know Total
2010 2011 2010 2011 2010 2011 2010 2011 2010 2011 2010 2011 2010/ 2011
Christians 34.6% 35.3% 26.2% 23.2% 34.3% 37.3% 2.5% 2.5% 1.5% 1.1% 0.9% 0.6% 100%
Buddhists 22.4% 24.0% 31.0% 30.0% 39.2% 40.6% 2.7% 2.0% 2.3% 1.4% 2.5% 2.0% 100%
Muslims 9.2% 10.0% 22.7% 19.8% 42.3% 42.6% 11.8% 12.1% 11.7% 13.1% 2.4% 2.4% 100%
Religion
Sub-total positive Sub-total negative
2010 2011 2010 2011
Christians 60.8% 58.5% 4.0% 3.6%
Buddhists 53.4% 54.0% 5.0% 3.4%
Muslims 31.9% 29.8% 23.5% 25.2%
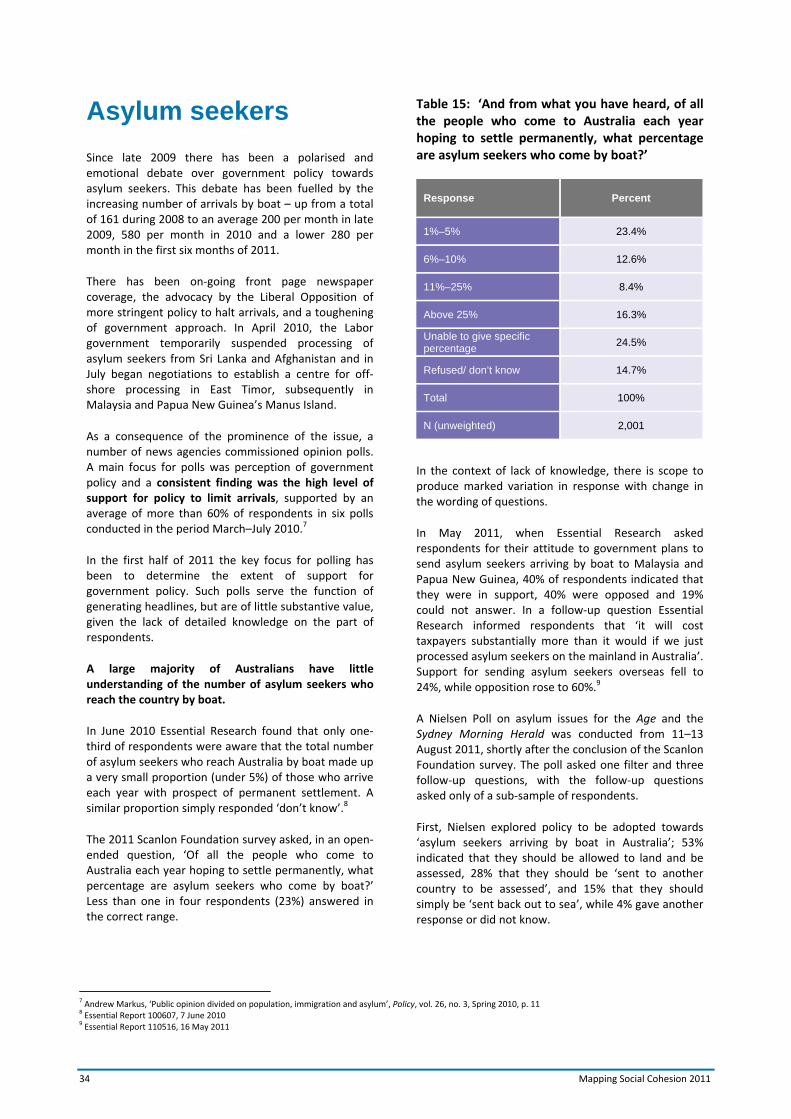
34 Mapping Social Cohesion 2011
Asylum seekers
Since late 2009 there has been a polarised and emotional debate over government policy towards asylum seekers. This debate has been fuelled by the increasing number of arrivals by boat – up from a total of 161 during 2008 to an average 200 per month in late 2009, 580 per month in 2010 and a lower 280 per month in the first six months of 2011.
There has been on‐going front page newspaper coverage, the advocacy by the Liberal Opposition of more stringent policy to halt arrivals, and a toughening of government approach. In April 2010, the Labor government temporarily suspended processing of asylum seekers from Sri Lanka and Afghanistan and in July began negotiations to establish a centre for off‐shore processing in East Timor, subsequently in Malaysia and Papua New Guinea’s Manus Island.
As a consequence of the prominence of the issue, a number of news agencies commissioned opinion polls. A main focus for polls was perception of government policy and a consistent finding was the high level of support for policy to limit arrivals, supported by an average of more than 60% of respondents in six polls conducted in the period March–July 2010.7
In the first half of 2011 the key focus for polling has been to determine the extent of support for government policy. Such polls serve the function of generating headlines, but are of little substantive value, given the lack of detailed knowledge on the part of respondents.
A large majority of Australians have little understanding of the number of asylum seekers who reach the country by boat.
In June 2010 Essential Research found that only one‐ third of respondents were aware that the total number of asylum seekers who reach Australia by boat made up a very small proportion (under 5%) of those who arrive each year with prospect of permanent settlement. A similar proportion simply responded ‘don’t know’.8
The 2011 Scanlon Foundation survey asked, in an open‐ ended question, ‘Of all the people who come to Australia each year hoping to settle permanently, what percentage are asylum seekers who come by boat?’ Less than one in four respondents (23%) answered in the correct range.
Table 15: ‘And from what you have heard, of all the people who come to Australia each year hoping to settle permanently, what percentage are asylum seekers who come by boat?’
Response Percent
1%–5% 23.4%
6%–10% 12.6%
11%–25% 8.4%
Above 25% 16.3%
Unable to give specific percentage
24.5%
Refused/ don’t know 14.7%
Total 100%
N (unweighted) 2,001
In the context of lack of knowledge, there is scope to produce marked variation in response with change in the wording of questions.
In May 2011, when Essential Research asked respondents for their attitude to government plans to send asylum seekers arriving by boat to Malaysia and Papua New Guinea, 40% of respondents indicated that they were in support, 40% were opposed and 19% could not answer. In a follow‐up question Essential Research informed respondents that ‘it will cost taxpayers substantially more than it would if we just processed asylum seekers on the mainland in Australia’. Support for sending asylum seekers overseas fell to 24%, while opposition rose to 60%.9
A Nielsen Poll on asylum issues for the Age and the Sydney Morning Herald was conducted from 11–13 August 2011, shortly after the conclusion of the Scanlon Foundation survey. The poll asked one filter and three follow‐up questions, with the follow‐up questions asked only of a sub‐sample of respondents.
First, Nielsen explored policy to be adopted towards ‘asylum seekers arriving by boat in Australia’; 53% indicated that they should be allowed to land and be assessed, 28% that they should be ‘sent to another country to be assessed’, and 15% that they should simply be ‘sent back out to sea’, while 4% gave another response or did not know.
7 Andrew Markus, ‘Public opinion divided on population, immigration and asylum’, Policy, vol. 26, no. 3, Spring 2010, p. 11 8 Essential Report 100607, 7 June 2010 9 Essential Report 110516, 16 May 2011
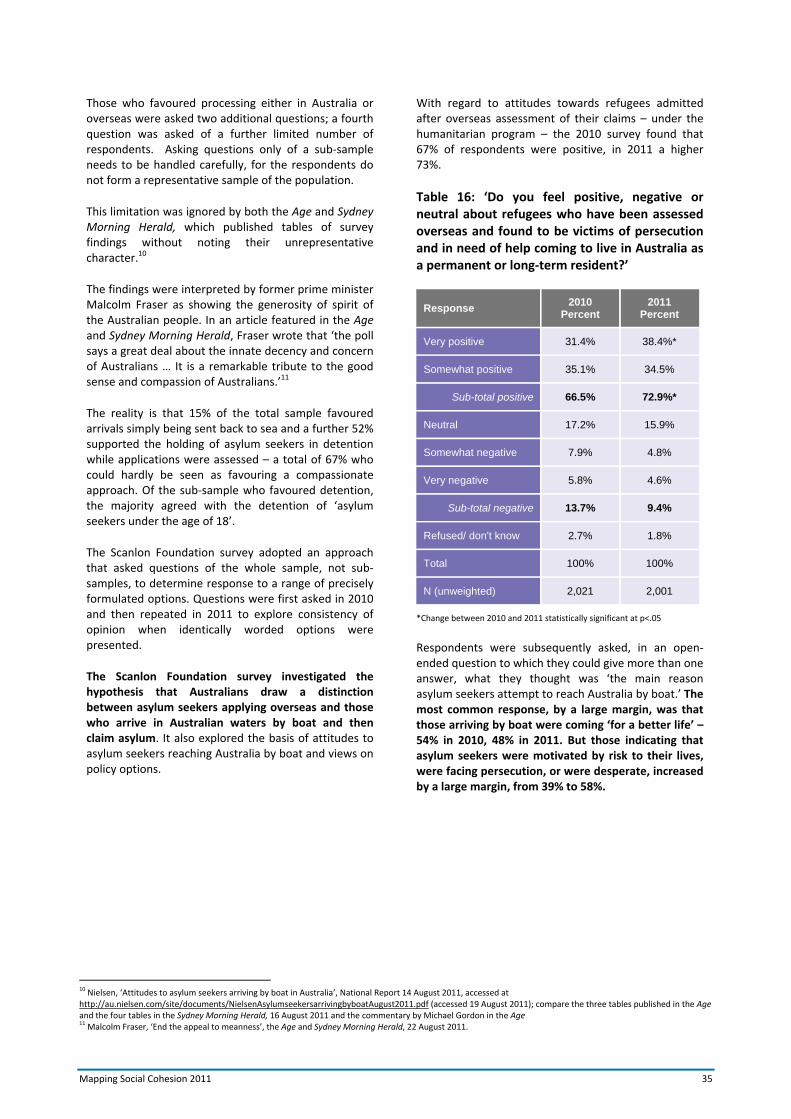
Mapping Social Cohesion 2011 35
Those who favoured processing either in Australia or overseas were asked two additional questions; a fourth question was asked of a further limited number of respondents. Asking questions only of a sub‐sample needs to be handled carefully, for the respondents do not form a representative sample of the population.
This limitation was ignored by both the Age and Sydney Morning Herald, which published tables of survey findings without noting their unrepresentative character.10
The findings were interpreted by former prime minister Malcolm Fraser as showing the generosity of spirit of the Australian people. In an article featured in the Age and Sydney Morning Herald, Fraser wrote that ‘the poll says a great deal about the innate decency and concern of Australians … It is a remarkable tribute to the good sense and compassion of Australians.’11
The reality is that 15% of the total sample favoured arrivals simply being sent back to sea and a further 52% supported the holding of asylum seekers in detention while applications were assessed – a total of 67% who could hardly be seen as favouring a compassionate approach. Of the sub‐sample who favoured detention, the majority agreed with the detention of ‘asylum seekers under the age of 18’.
The Scanlon Foundation survey adopted an approach that asked questions of the whole sample, not sub‐samples, to determine response to a range of precisely formulated options. Questions were first asked in 2010 and then repeated in 2011 to explore consistency of opinion when identically worded options were presented.
The Scanlon Foundation survey investigated the hypothesis that Australians draw a distinction between asylum seekers applying overseas and those who arrive in Australian waters by boat and then claim asylum. It also explored the basis of attitudes to asylum seekers reaching Australia by boat and views on policy options.
With regard to attitudes towards refugees admitted after overseas assessment of their claims – under the humanitarian program – the 2010 survey found that 67% of respondents were positive, in 2011 a higher 73%.
Table 16: ‘Do you feel positive, negative or neutral about refugees who have been assessed overseas and found to be victims of persecution and in need of help coming to live in Australia as a permanent or long‐term resident?’
Response 2010
Percent 2011
Percent
Very positive 31.4% 38.4%*
Somewhat positive 35.1% 34.5%
Sub-total positive 66.5% 72.9%*
Neutral 17.2% 15.9%
Somewhat negative 7.9% 4.8%
Very negative 5.8% 4.6%
Sub-total negative 13.7% 9.4%
Refused/ don't know 2.7% 1.8%
Total 100% 100%
N (unweighted) 2,021 2,001
*Change between 2010 and 2011 statistically significant at p<.05
Respondents were subsequently asked, in an open‐ended question to which they could give more than one answer, what they thought was ‘the main reason asylum seekers attempt to reach Australia by boat.’ The most common response, by a large margin, was that those arriving by boat were coming ‘for a better life’ – 54% in 2010, 48% in 2011. But those indicating that asylum seekers were motivated by risk to their lives, were facing persecution, or were desperate, increased by a large margin, from 39% to 58%.
10 Nielsen, ‘Attitudes to asylum seekers arriving by boat in Australia’, National Report 14 August 2011, accessed at http://au.nielsen.com/site/documents/NielsenAsylumseekersarrivingbyboatAugust2011.pdf (accessed 19 August 2011); compare the three tables published in the Age and the four tables in the Sydney Morning Herald, 16 August 2011 and the commentary by Michael Gordon in the Age 11 Malcolm Fraser, ‘End the appeal to meanness’, the Age and Sydney Morning Herald, 22 August 2011.

36 Mapping Social Cohesion 2011
Table 17: ‘What do you think is the main reason asylum seekers try to reach Australia by boat?’ (Multiple response)
Response 2010
Percent 2011
Percent
Are in fear of their lives 9.2% 13.9%*
Are facing persecution 15.4% 19.1%*
Desperation/ desperate 14.3% 24.5%*
Sub-total 38.9% 57.5%
For a better life 54.2% 47.6%*
Are living in poverty 7.5% 9.0%
Sub-total 61.7% 56.6%
Are queue jumpers 9.7% 11.1%
Are wealthy and can afford it 1.5% 4.8%*
Government too slack/ easy to get into Australia
8.0% 1.8%*
Sub-total 19.2% 17.7%
Other/ refused/ don’t know 12.1% 11.5%
*Change between 2010 and 2011 statistically significant at p<.05. Note: Tables do not add to 100% as respondents could specify more than one reason; in 2010 , 32% of respondents did so, in 2011, 43%.
Respondents were then presented with four statements and asked which came closest to their view concerning ‘policy for dealing with asylum seekers trying to reach Australia by boat’. The four options were:
1. They should be allowed to apply for permanent residence;
2. They should be allowed to apply for temporary residence only;
3. They should be kept in detention until they can be sent back;
4. Their boats should be turned back.
Responses indicate that between 2010 and 2011, while perceptions concerning the motives of asylum seekers changed at a level of statistical significance, change in views on policy was only marginal. In 2010, 19% favoured permanent residence, 22% in 2011; agreement with the option of ‘temporary residence only’ increased from 37% to 39%; agreement with detention until deportation fell from 13% to 12%; and agreement with turning back boats fell from 27% to 23%.

Mapping Social Cohesion 2011 37
Figure 22: ‘Which of the following four statements comes closest to your view about the best policy for dealing with asylum seekers trying to reach Australia by boat?’
Respondents were also asked for their view on ‘how the government is handling the asylum seeker issue?’ One third of respondents considered that the government was doing an average job, but only 7% rated its performance as good (down from 11% in 2010); 56% rated it as poor, an increase from 47% in 2010. The ratio of good to poor changed from approximately 1:4 in 2010 to 1:8 in 2011.
Table 18: ‘What do you think of how the government is handling the asylum seeker issue? Overall do you think they are doing a good job, an average job or a poor job? How well is government doing?’
*Change between 2010 and 2011 statistically significant at p<.05
Response 2010 2011
Very good 1.8% 2.1%
Good 9.4% 5.2%*
Sub-total 11.2% 7.3%*
Average 37.5% 33.8%
Poor 21.3% 19.4%
Very poor 25.4% 36.1%*
Sub-total 46.7% 55.5%*
Refused/ Don’t know 4.6% 3.4%
Total 100% 100%
N (unweighted) 2,021 2,001
A general finding from this set of questions, and polling by a number of agencies over the last ten years, is that the arrival of boats is met with a high level of negativity. This is in marked contrast with the positive attitudes towards the admission of refugees who have been assessed overseas under the humanitarian program and found to be in need of protection.
What is the significance of the asylum issue for social cohesion? The answer would seem to be that it has direct negative impact, for it is an issue that fuels disillusionment with government and heightens division within the population.
Right of asylum engages people; it sparks passionate debate. In the years of the Howard government there was harsh criticism of policies seen as grossly unjust. Over the last two years, as first the Rudd and then the Gillard government attempted a range of reforms, without achieving a desirable outcome, the level of criticism increased. People of differing political persuasions are close to unanimous in the view that the government is incapable of dealing with this issue of fundamental importance for the nation. Thus in 2011, just 9% of those who are most favourable to asylum seekers think that the government is doing a good or very good job in its handling of asylum and an even smaller 4% of those who are most negative.
19%
37%
13%
27%
4%
22%
39%
12%
23%
5%
0%
5%
10%
15%
20%
25%
30%
35%
40%
45%
Permanent residence Temporary residence only Detain and send back Turn back boats Refused/Don't know
2010
2011

38 Mapping Social Cohesion 2011
The asylum issue contributes to widespread disillusionment with government. It is daily in the news as boat arrivals and protests in detention centres receive prominent media coverage, often on the front pages of newspapers. The issue is further magnified as Opposition leader Tony Abbott and Scott Morrison, the Shadow Minister for Population, Immigration and Citizenship, focus on government failures and their own formula to ‘stop the boats’, while Greens spokesmen and prominent advocates for asylum seekers criticise what they depict as immoral policies.
The statistical technique of factor analysis establishes a link between views on asylum policy and immigration. Views on asylum correlate with views on immigration, as well as a range of other issues, including national identity and cultural diversity – hence they are not likely to change in the short term. This is illustrated by comparing the outlook of those who would prevent asylum seekers from landing with those who would permit them to apply for permanent residence.
Those who would prevent landing have a stronger connection to what they see as the ‘Australian way of life’, are some four times more likely to think that immigration is too high, to hold negative views of Muslims and to disagree with government assistance to ethnic minorities; they are six times more likely to disagree that a diverse immigration intake is of benefit to Australia.
The asylum issue thus has the effect of heightening polarisation of the community. Contrary to generalisations about the attitude of ‘the Australian people’, there are fundamental attitudinal division within the Australian population, with differentiation evident when national identity, attitudes to minorities and cultural pluralism are considered. Divisions over asylum directly link to and exacerbate these divisions.
Table 19: Ten selected questions by views on the best policy for dealing with asylum seekers who reach Australia by boat
Questions and responses Permanent residence
Temporary residence only
Detain and send back
Turn back boats
Total
Sense of belonging – ‘great extent’ 70.6% 73.0% 70.3% 76.6% 72.5%
Pride in ‘Australian way of life’ – ‘great extent’
44.1% 60.5% 62.4% 64.3% 57.5%
Important to maintain ‘Australian way of life’ – ‘strongly agree’
38.2% 63.4% 66.5% 75.1% 59.8%
Perception of immigration over the last 12 months –‘ increased’
36.0% 53.6% 56.1% 69.5% 52.8%
Immigration intake – ‘too high’ 14.2% 33.5% 52.9% 63.9% 38.9%
Immigration from many different countries makes Australia stronger – ‘strongly agree’
7.7% 22.1% 37.6% 49.3% 26.8%
Assist ethnic minorities to maintain customs and traditions – ‘strongly disagree’
15.6% 23.1% 44.3% 59.5% 31.0%
Attitude to Muslims – negative 10.0% 19.1% 41.5% 43.4% 25.2%
Government handling of the asylum seeker issue – ‘very poor’
34.5% 24.5% 35.3% 60.8% 36.1%
N (unweighted) 490 726 222 451 2,001

Mapping Social Cohesion 2011 39
Attitudes by political identification
The Scanlon Foundation survey asked those respondents who were Australian citizens ‘If there was a Federal election held today, for which party would you probably vote?’
There were sufficient respondents to analyse three groups – those who indicate that they would probably vote Liberal/ National (n=681), more than 95% of whom indicated support for the Liberal Party and who will be referred to as Liberal in the following discussion, those who would probably vote Labor (n=494) and probably vote Greens (n=222). A large number of respondents indicated either ‘don’t know’ (n=242), declined to answer (n=74), or indicated support for ‘independents’ or another political party (n=181); thus a total of 497 respondents or 25.9% of the total did not indicate support for the major parties.
With the ‘don’t know’ and ‘declined’ responses excluded, the party political support closely matched the results of Newspoll surveys conducted during the time of the Scanlon Foundation survey.
It is important to analyse attitudes held by supporters of specific political parties as it is a factor of prime importance in the electoral positioning of the parties and impacts on the determination of government policy. This information is often known to parties from their own market research, but is not generally made public.
Given that the Greens are primarily defined by their concern for environmental issues, it is expected that Greens supporters will express most concern over the impact of climate change, and this expectation was met. When asked to rank the most important problems facing Australia today, 33% of Greens supporters first mentioned climate change, water shortage or the environment, compared with 15% Labor and just 6% Liberal. In contrast, 9% of Liberal supporters first mentioned over‐reaction to climate change and negative view of the carbon tax, compared to 4% Greens and 3% Labor supporters.
Table 20: Intended vote, June 2011
Party Scanlon Foundation
15 June – 18 July 2011
Average Newspoll
10–12 June; 24–26 June; 8–10 July
Labor Party 31% 29%
Liberal/ National 44% 47%
Greens 13% 11%
Independents and Other 12% 12%
Total 100% 100%
N (unweighted) 1,869 1,150 for each poll
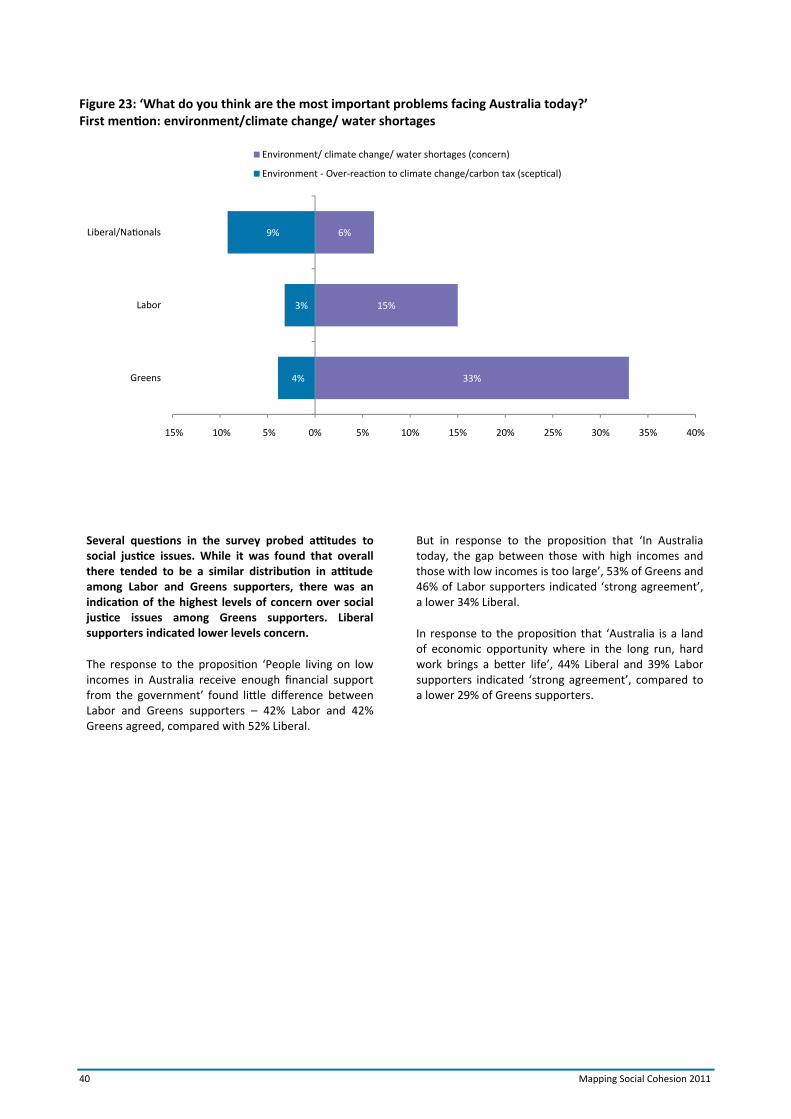
40 Mapping Social Cohesion 2011
Figure 23: ‘What do you think are the most important problems facing Australia today?’ First mention: environment/climate change/ water shortages
Several questions in the survey probed attitudes to social justice issues. While it was found that overall there tended to be a similar distribution in attitude among Labor and Greens supporters, there was an indication of the highest levels of concern over social justice issues among Greens supporters. Liberal supporters indicated lower levels concern.
The response to the proposition ‘People living on low incomes in Australia receive enough financial support from the government’ found little difference between Labor and Greens supporters – 42% Labor and 42% Greens agreed, compared with 52% Liberal.
But in response to the proposition that ‘In Australia today, the gap between those with high incomes and those with low incomes is too large’, 53% of Greens and 46% of Labor supporters indicated ‘strong agreement’, a lower 34% Liberal.
In response to the proposition that ‘Australia is a land of economic opportunity where in the long run, hard work brings a better life’, 44% Liberal and 39% Labor supporters indicated ‘strong agreement’, compared to a lower 29% of Greens supporters.
33%
15%
6%
4%
3%
9%
15% 10% 5% 0% 5% 10% 15% 20% 25% 30% 35% 40%
Greens
Labor
Liberal/Nationals
Environment/ climate change/ water shortages (concern)
Environment - Over-reaction to climate change/carbon tax (sceptical)

Mapping Social Cohesion 2011 41
Figure 24: ‘In Australia today, the gap between those with high incomes and those with low incomes is too large.’
Population issues were much discussed in the first half of 2010, with discussion focused on the level of immigration and a projection that Australia’s population would reach 36 million by 2050. The 2010 Scanlon Foundation survey asked respondents for their views on the projected 36 million. An almost identical proportion of Greens and Liberal supporters – 59% and 60% – indicated that they considered 36 million to be too high, compared with a lower 41% of Labor supporters.
The 2011 survey found Greens supporters most likely to ‘strongly agree’ with the proposition that ‘our natural environment cannot cope with a larger population’: 27% of Greens supporters and 20% of Liberal supporters indicated ‘strong agreement’, compared with 17% Labor.
But there was a different response when the current level of immigration was considered. 46% of Liberal supporters, 39% Labor and a markedly lower 21% of Greens agreed that the intake was ‘too high’.
Two factors may explain this apparent contradiction in attitudes among Greens supporters, whereby there is support for the current level of immigration but heightened concern over the future impact of immigration.
First, there is indication that Greens have a more realistic appraisal of current immigration levels. Thus while 57% of Liberal supporters and 54% Labor are of the view that over the last 12 months immigration has increased, only 39% of Greens share this view.
Second, Greens may be more universal than nationalist in outlook, a view that is supported by the following analysis. It seems that when considering current immigration levels, among a significant segment of Greens supporters universal values prevail over environmental concerns.
In contrast, there is consistent indication that a substantial segment of Liberal supporters are less supportive of immigration. It is possible that this opposition is political, in that any policy settings of the Labor government will be negatively viewed and attitudes will change once there is a Coalition government. While there may be validity in such an interpretation, the survey data indicates that among a substantial segment of Liberal supporters there is suspicion of policy which has the effect of increasing ethnic diversity within the Australian population. This segment is characterised by stronger identification with what they define as traditional Australian values and support for policies which work to assimilate diverse immigrant populations.
Thus while the Liberal Party has a long-standing association with interest groups within the business community which support a large immigration program, with immigration viewed not only as the means to meet labour demand but also as an engine of economic growth, among Liberal supporters there are also many who do not welcome the social change that comes with a large and ethnically diverse immigration intake.
6%
9%
21%
33%
40%
35%
53%
46%
34%
40% 20% 0% 20% 40% 60% 80% 100%
Greens
Labor
Liberal/Nationals
Neither agree/ disagree
Disagree Strongly disagree
None of the above/ don't know
Agree
Strongly agree

42 Mapping Social Cohesion 2011
Among this segment of Liberals, to a significant extent also among Labor supporters, and to a much smaller extent among Greens, there are a number of indicators of negative attitudes towards increased religious and cultural diversity. For example, there is much stronger identification with Christianity. The 2010 Scanlon Foundation survey asked respondents ‘How important is it to you that the main religion in Australia continues to be Christianity?’ 65% of Liberal, 52% Labor and a much lower 28% Greens supporters responded that it was ‘very important’ or ‘important’.
The 2011 survey asked ‘Is your attitude positive, negative or neutral towards Christians?’ 66% Liberal, 58% Labor and 40% Greens indicated a ‘very positive’ or ‘somewhat positive’ attitude, almost identical with the result obtained in the 2010 survey (67% Liberal, 59% Labor and 42% Greens).
A series of questions explored identification with Australia. While there is a large degree of commonality in outlook when strong and moderate level responses are aggregated, a marked difference is evident when attention is narrowed to the strong (or most definite) level.
The smallest variation was recorded in response to a question on sense of belonging in Australia. 81% Liberal, 76% Labor and 61% Greens indicated sense of belonging to ‘a great extent’.
But when respondents were asked in a more specific question ‘To what extent do you take pride in the Australian way of life and culture?’, Liberal supporters were more than twice as likely as Greens to indicate ‘to a great extent’: this was the response of 65% Liberal supporters, 59% Labor but only 29% of Greens.
In response to the proposition that ‘In the modern world, maintaining the Australian way of life and culture is important’, 70% of Liberal, 62% Labor and 26% Greens supporters indicated that they ‘strongly agreed’.
In response to questions concerning a diverse immigration intake and cultural maintenance, there was a similar pattern of response, with Liberal supporters at one end of the spectrum and Greens at the other. Thus in response to the proposition that ‘accepting immigrants from many different countries makes Australia stronger’, 15% Liberal, 24% Labor and 44% Greens supporters indicated that they ‘strongly agreed’.
Figure 25: ‘To what extent do you take pride in the Australian way of life and culture?’
13%
6%
56%
34%
30%
29%
59%
65%
20% 0% 20% 40% 60% 80% 100%
Greens
Labor
Liberal/Nationals
Only slightly Not at all To a moderate extent aTo great extent

Mapping Social Cohesion 2011 43
Figure 26: ‘Accepting immigrants from many different countries makes Australia stronger’
When presented with the proposition that ‘ethnic minorities in Australia should be given Australian government assistance to maintain their customs and traditions’, only 3% Liberal, 8% Labor and 16% Greens were in ‘strong agreement’; when ‘strong agreement’ and ‘agreement’ were combined, the result was 24% Liberal, 42% Labor and 56% Greens.
Respondents were asked if it was better for a country ‘if different racial or ethnic groups blend in to the larger society’, better if they ‘maintain their distinct customs and traditions’, or both. The strongest preference among Liberal supporters, at 72%, was for groups to blend in to the larger society; this option was selected by 61% of Labor supporters but only a minority of Greens supporters (28%).
Figure 27: ‘Which of the following two statements is closest to your view? It is better for a country if different racial or ethnic groups maintain their distinct customs and traditions OR if these groups adapt and blend into the larger society’
6%
19%
17%
9%
13%
43%
40%
45%
44%
24%
15%
60% 40% 20% 0% 20% 40% 60% 80% 100%
Greens
Labor
Liberal/Nationals
Neither agree/ disagree
DisagreeStrongly disagree
Refused/none/don't know
Agree Strongly agree
28%
61%
72%
34%
20%
16%
37%
16%
11%
80% 60% 40% 20% 0% 20% 40% 60% 80%
Greens
Labor
Liberal/Nationals
Better if these groups adapt and blend into the larger society
Refused/ don't know Agree with both
Better if they maintain their distinct customs and traditions
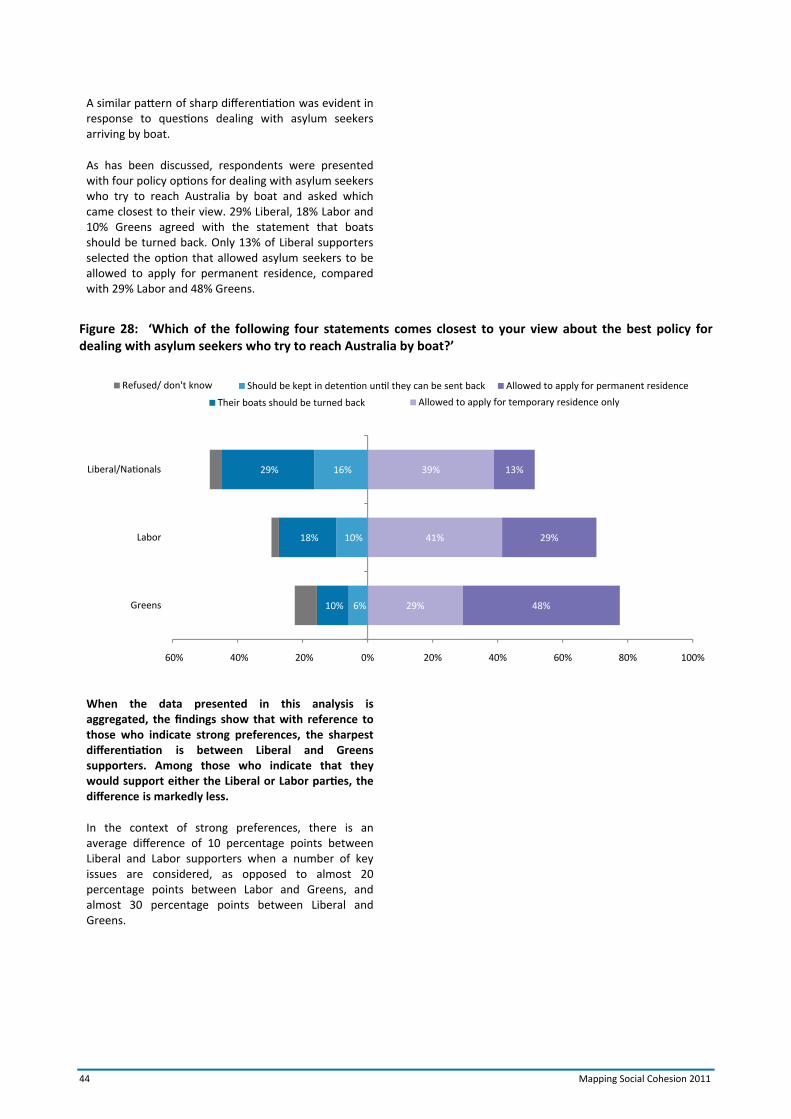
44 Mapping Social Cohesion 2011
A similar pattern of sharp differentiation was evident in response to questions dealing with asylum seekers arriving by boat.
As has been discussed, respondents were presented with four policy options for dealing with asylum seekers who try to reach Australia by boat and asked which came closest to their view. 29% Liberal, 18% Labor and 10% Greens agreed with the statement that boats should be turned back. Only 13% of Liberal supporters selected the option that allowed asylum seekers to be allowed to apply for permanent residence, compared with 29% Labor and 48% Greens.
Figure 28: ‘Which of the following four statements comes closest to your view about the best policy for dealing with asylum seekers who try to reach Australia by boat?’
When the data presented in this analysis is aggregated, the findings show that with reference to those who indicate strong preferences, the sharpest differentiation is between Liberal and Greens supporters. Among those who indicate that they would support either the Liberal or Labor parties, the difference is markedly less.
In the context of strong preferences, there is an average difference of 10 percentage points between Liberal and Labor supporters when a number of key issues are considered, as opposed to almost 20 percentage points between Labor and Greens, and almost 30 percentage points between Liberal and Greens.
6%
10%
16%
10%
18%
29%
29%
41%
39%
48%
29%
13%
60% 40% 20% 0% 20% 40% 60% 80% 100%
Greens
Labor
Liberal/Nationals
Should be kept in detention until they can be sent back
Their boats should be turned back
Refused/ don't know
Allowed to apply for temporary residence only
Allowed to apply for permanent residence
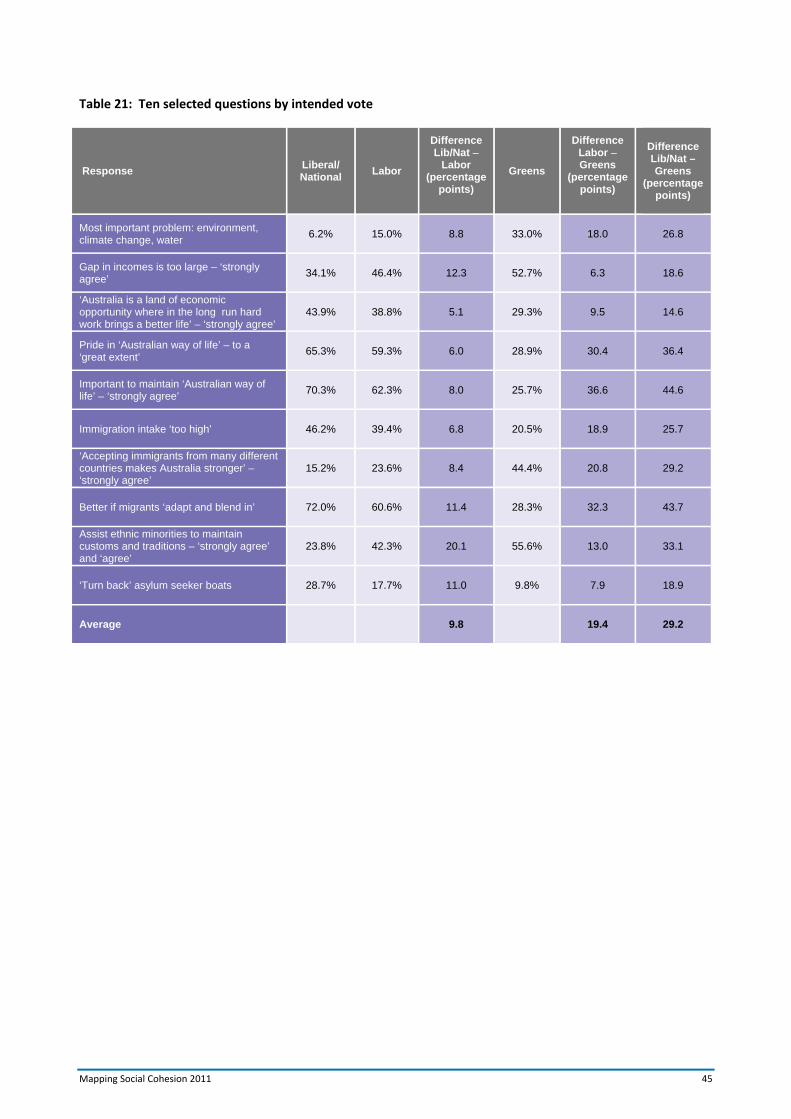
Mapping Social Cohesion 2011 45
Table 21: Ten selected questions by intended vote
Response Liberal/ National
Labor
Difference Lib/Nat –
Labor (percentage
points)
Greens
Difference Labor – Greens
(percentage points)
Difference Lib/Nat – Greens
(percentage points)
Most important problem: environment, climate change, water
6.2% 15.0% 8.8 33.0% 18.0 26.8
Gap in incomes is too large – ‘strongly agree’
34.1% 46.4% 12.3 52.7% 6.3 18.6
‘Australia is a land of economic opportunity where in the long run hard work brings a better life’ – ‘strongly agree’
43.9% 38.8% 5.1 29.3% 9.5 14.6
Pride in ‘Australian way of life’ – to a ‘great extent’
65.3% 59.3% 6.0 28.9% 30.4 36.4
Important to maintain ‘Australian way of life’ – ‘strongly agree’
70.3% 62.3% 8.0 25.7% 36.6 44.6
Immigration intake ‘too high’ 46.2% 39.4% 6.8 20.5% 18.9 25.7
‘Accepting immigrants from many different countries makes Australia stronger’ – ‘strongly agree’
15.2% 23.6% 8.4 44.4% 20.8 29.2
Better if migrants ‘adapt and blend in’ 72.0% 60.6% 11.4 28.3% 32.3 43.7
Assist ethnic minorities to maintain customs and traditions – ‘strongly agree’ and ‘agree’
23.8% 42.3% 20.1 55.6% 13.0 33.1
‘Turn back’ asylum seeker boats 28.7% 17.7% 11.0 9.8% 7.9 18.9
Average
9.8 19.4 29.2
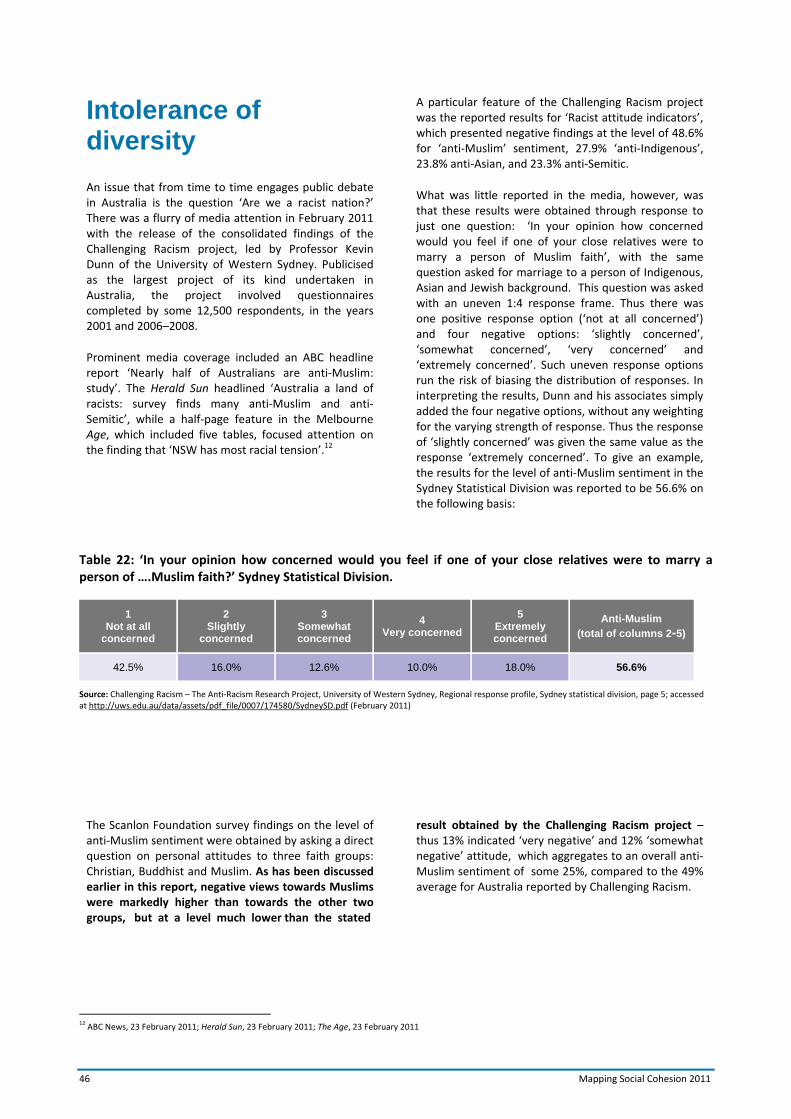
46 Mapping Social Cohesion 2011
Table 22: ‘In your opinion how concerned would you feel if one of your close relatives were to marry a person of ….Muslim faith?’ Sydney Statistical Division.
Source: Challenging Racism – The Anti‐Racism Research Project, University of Western Sydney, Regional response profile, Sydney statistical division, page 5; accessed at http://uws.edu.au/data/assets/pdf_file/0007/174580/SydneySD.pdf (February 2011)
The Scanlon Foundation survey findings on the level of anti‐Muslim sentiment were obtained by asking a direct question on personal attitudes to three faith groups: Christian, Buddhist and Muslim. As has been discussed earlier in this report, negative views towards Muslims were markedly higher than towards the other two groups, but at a level much lower than the stated
result obtained by the Challenging Racism project – thus 13% indicated ‘very negative’ and 12% ‘somewhat negative’ attitude, which aggregates to an overall anti‐Muslim sentiment of some 25%, compared to the 49% average for Australia reported by Challenging Racism.
12 ABC News, 23 February 2011; Herald Sun, 23 February 2011; The Age, 23 February 2011
Intolerance of diversity
An issue that from time to time engages public debate in Australia is the question ‘Are we a racist nation?’ There was a flurry of media attention in February 2011 with the release of the consolidated findings of the Challenging Racism project, led by Professor Kevin Dunn of the University of Western Sydney. Publicised as the largest project of its kind undertaken in Australia, the project involved questionnaires completed by some 12,500 respondents, in the years 2001 and 2006–2008.
Prominent media coverage included an ABC headline report ‘Nearly half of Australians are anti‐Muslim: study’. The Herald Sun headlined ‘Australia a land of racists: survey finds many anti‐Muslim and anti‐Semitic’, while a half‐page feature in the Melbourne Age, which included five tables, focused attention on the finding that ‘NSW has most racial tension’.12
A particular feature of the Challenging Racism project was the reported results for ‘Racist attitude indicators’, which presented negative findings at the level of 48.6% for ‘anti‐Muslim’ sentiment, 27.9% ‘anti‐Indigenous’, 23.8% anti‐Asian, and 23.3% anti‐Semitic.
What was little reported in the media, however, was that these results were obtained through response to just one question: ‘In your opinion how concerned would you feel if one of your close relatives were to marry a person of Muslim faith’, with the same question asked for marriage to a person of Indigenous, Asian and Jewish background. This question was asked with an uneven 1:4 response frame. Thus there was one positive response option (‘not at all concerned’) and four negative options: ‘slightly concerned’, ‘somewhat concerned’, ‘very concerned’ and ‘extremely concerned’. Such uneven response options run the risk of biasing the distribution of responses. In interpreting the results, Dunn and his associates simply added the four negative options, without any weighting for the varying strength of response. Thus the response of ‘slightly concerned’ was given the same value as the response ‘extremely concerned’. To give an example, the results for the level of anti‐Muslim sentiment in the Sydney Statistical Division was reported to be 56.6% on the following basis:
1 Not at all
concerned
2 Slightly
concerned
3 Somewhat concerned
4 Very concerned
5 Extremely concerned
Anti-Muslim (total of columns 2-5)
42.5% 16.0% 12.6% 10.0% 18.0% 56.6%
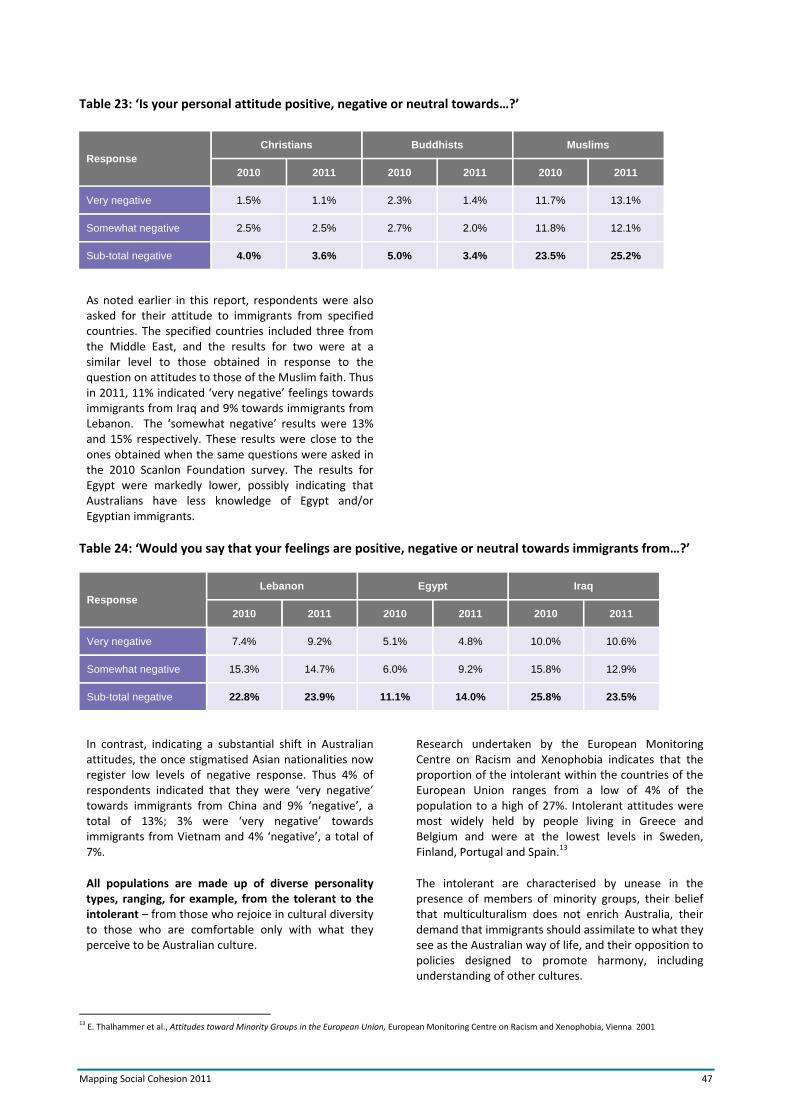
Mapping Social Cohesion 2011 47
Table 23: ‘Is your personal attitude positive, negative or neutral towards…?’
Table 24: ‘Would you say that your feelings are positive, negative or neutral towards immigrants from…?’
In contrast, indicating a substantial shift in Australian attitudes, the once stigmatised Asian nationalities now register low levels of negative response. Thus 4% of respondents indicated that they were ‘very negative’ towards immigrants from China and 9% ‘negative’, a total of 13%; 3% were ‘very negative’ towards immigrants from Vietnam and 4% ‘negative’, a total of 7%.
All populations are made up of diverse personality types, ranging, for example, from the tolerant to the intolerant – from those who rejoice in cultural diversity to those who are comfortable only with what they perceive to be Australian culture.
Research undertaken by the European Monitoring Centre on Racism and Xenophobia indicates that the proportion of the intolerant within the countries of the European Union ranges from a low of 4% of the population to a high of 27%. Intolerant attitudes were most widely held by people living in Greece and Belgium and were at the lowest levels in Sweden, Finland, Portugal and Spain.13
The intolerant are characterised by unease in the presence of members of minority groups, their belief that multiculturalism does not enrich Australia, their demand that immigrants should assimilate to what they see as the Australian way of life, and their opposition to policies designed to promote harmony, including understanding of other cultures.
13 E. Thalhammer et al., Attitudes toward Minority Groups in the European Union, European Monitoring Centre on Racism and Xenophobia, Vienna 2001
Response
Christians Buddhists Muslims
2010 2011 2010 2011 2010 2011
Very negative 1.5% 1.1% 2.3% 1.4% 11.7% 13.1%
Somewhat negative 2.5% 2.5% 2.7% 2.0% 11.8% 12.1%
Sub-total negative 4.0% 3.6% 5.0% 3.4% 23.5% 25.2%
As noted earlier in this report, respondents were also asked for their attitude to immigrants from specified countries. The specified countries included three from the Middle East, and the results for two were at a similar level to those obtained in response to the question on attitudes to those of the Muslim faith. Thus in 2011, 11% indicated ‘very negative’ feelings towards immigrants from Iraq and 9% towards immigrants from Lebanon. The ‘somewhat negative’ results were 13% and 15% respectively. These results were close to the ones obtained when the same questions were asked in the 2010 Scanlon Foundation survey. The results for Egypt were markedly lower, possibly indicating that Australians have less knowledge of Egypt and/or Egyptian immigrants.
Response
Lebanon Egypt Iraq
2010 2011 2010 2011 2010 2011
Very negative 7.4% 9.2% 5.1% 4.8% 10.0% 10.6%
Somewhat negative 15.3% 14.7% 6.0% 9.2% 15.8% 12.9%
Sub-total negative 22.8% 23.9% 11.1% 14.0% 25.8% 23.5%
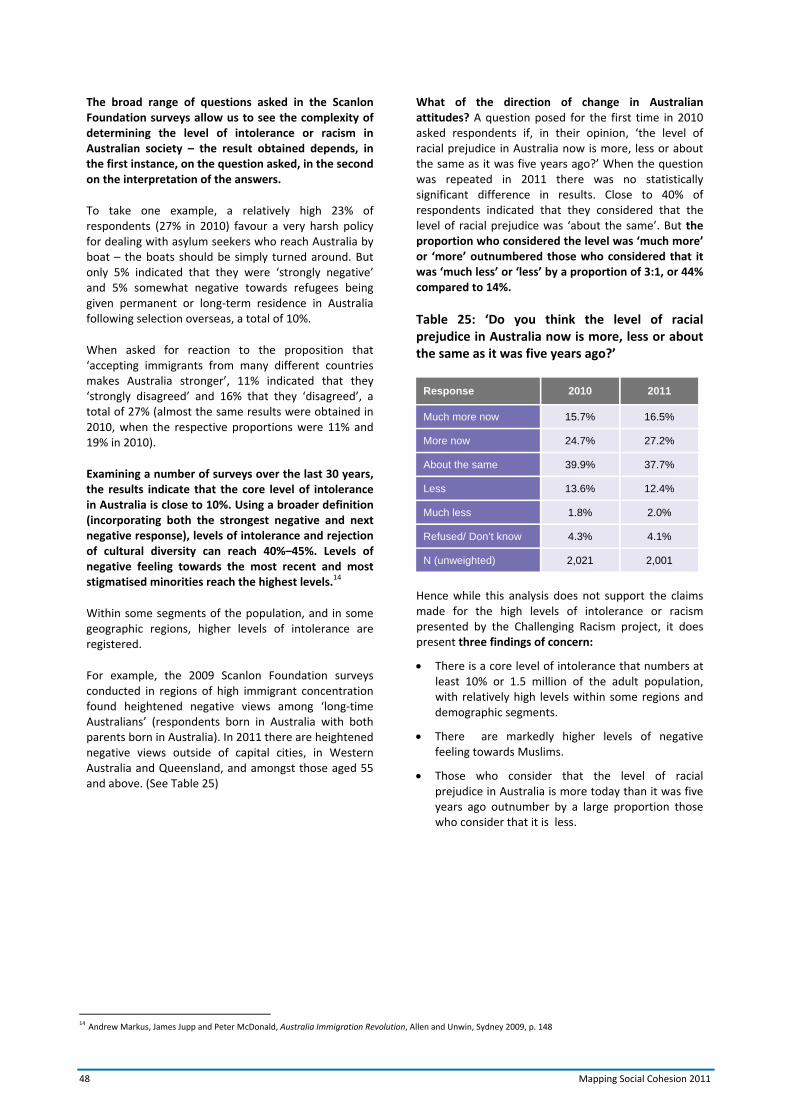
48 Mapping Social Cohesion 2011
14 Andrew Markus, James Jupp and Peter McDonald, Australia Immigration Revolution, Allen and Unwin, Sydney 2009, p. 148
The broad range of questions asked in the Scanlon Foundation surveys allow us to see the complexity of determining the level of intolerance or racism in Australian society – the result obtained depends, in the first instance, on the question asked, in the second on the interpretation of the answers.
To take one example, a relatively high 23% of respondents (27% in 2010) favour a very harsh policy for dealing with asylum seekers who reach Australia by boat – the boats should be simply turned around. But only 5% indicated that they were ‘strongly negative’ and 5% somewhat negative towards refugees being given permanent or long‐term residence in Australia following selection overseas, a total of 10%.
When asked for reaction to the proposition that ‘accepting immigrants from many different countries makes Australia stronger’, 11% indicated that they ‘strongly disagreed’ and 16% that they ‘disagreed’, a total of 27% (almost the same results were obtained in 2010, when the respective proportions were 11% and 19% in 2010).
Examining a number of surveys over the last 30 years, the results indicate that the core level of intolerance in Australia is close to 10%. Using a broader definition (incorporating both the strongest negative and next negative response), levels of intolerance and rejection of cultural diversity can reach 40%–45%. Levels of negative feeling towards the most recent and most stigmatised minorities reach the highest levels.14
Within some segments of the population, and in some geographic regions, higher levels of intolerance are registered.
For example, the 2009 Scanlon Foundation surveys conducted in regions of high immigrant concentration found heightened negative views among ‘long‐time Australians’ (respondents born in Australia with both parents born in Australia). In 2011 there are heightened negative views outside of capital cities, in Western Australia and Queensland, and amongst those aged 55 and above. (See Table 25)
What of the direction of change in Australian attitudes? A question posed for the first time in 2010 asked respondents if, in their opinion, ‘the level of racial prejudice in Australia now is more, less or about the same as it was five years ago?’ When the question was repeated in 2011 there was no statistically significant difference in results. Close to 40% of respondents indicated that they considered that the level of racial prejudice was ‘about the same’. But the proportion who considered the level was ‘much more’ or ‘more’ outnumbered those who considered that it was ‘much less’ or ‘less’ by a proportion of 3:1, or 44% compared to 14%.
Table 25: ‘Do you think the level of racial prejudice in Australia now is more, less or about the same as it was five years ago?’
Response 2010 2011
Much more now 15.7% 16.5%
More now 24.7% 27.2%
About the same 39.9% 37.7%
Less 13.6% 12.4%
Much less 1.8% 2.0%
Refused/ Don’t know 4.3% 4.1%
N (unweighted) 2,021 2,001
Hence while this analysis does not support the claims made for the high levels of intolerance or racism presented by the Challenging Racism project, it does present three findings of concern:
There is a core level of intolerance that numbers at least 10% or 1.5 million of the adult population, with relatively high levels within some regions and demographic segments.
There are markedly higher levels of negative feeling towards Muslims.
Those who consider that the level of racial prejudice in Australia is more today than it was five years ago outnumber by a large proportion those who consider that it is less.

Mapping Social Cohesion 2011 49
Table 26: Level of negative sentiment, selected questions, 2011
Response
Total (all respondents) Born in Australia, both parents born
in Australia Aged 55+
Resident of Queensland or Western Australia
Strongly disagree/very
negative
Disagree/ somewhat negative
Total disagree/ negative
Strongly disagree/
very negative
Disagree/ somewhat negative
Total disagree/ negative
Strongly disagree/
very negative
Disagree/ somewhat negative
Total disagree/ negative
Strongly disagree/
very negative
Disagree/ somewhat negative
Total disagree/ negative
‘Accepting immigrants from many different countries makes Australia stronger’ (Strongly disagree/ disagree)
10.6% 16.2% 26.8% 13.4% 19.0% 32.4% 14.5% 17.2% 31.7% 12.6% 22.2% 34.8%
Feelings towards immigrants from Lebanon (Very/ somewhat negative)
9.2% 14.7% 23.9% 11.4% 17.0% 28.4% 11.6% 23.1% 34.7% 7.4% 14.6% 22.0%
Feelings towards immigrants from China (Very/ somewhat negative)
4.2% 8.5% 12.7% 5.3% 7.6% 12.9% 3.3% 9.1% 12.4% 0.4% 9.9% 10.3%
Is your personal attitude positive, negative or neutral towards Muslims? (Very/ somewhat negative)
13.1% 12.1% 25.2% 14.5% 12.8% 27.3% 19.0% 16.3% 35.3% 18.0% 10.1% 28.1%
Attitude to ‘refugees who have been assessed overseas and found to be … in need of help coming to live in Australia’ (Very/ somewhat negative)
4.6% 4.8% 9.4% 5.0% 5.4% 10.4% 5.4% 6.1% 11.5% 5.6% 7.9% 13.5%
N (unweighted)
Total 2,001 1,160 990 496
‘from Lebanon’ 709 403 365 170
‘from China’ 688 421 335 166

50 Mapping Social Cohesion 2011
Acknowledgements
This project has been made possible with the financial support and vision of the Scanlon Foundation. The author is particularly grateful to Mr Peter Scanlon, Chairman, and Mr Tony Fry, Chief Executive Officer of the Scanlon Foundation, for the support provided.
Professor John Nieuwenhuysen of Monash University and Dr Hass Dellal of the Australian Multicultural Foundation played key roles in the initial planning and implementation of the project.
Mr Bruce Smith of the Scanlon Foundation provided sound advice and support at all stages of the project implementation and data analysis.
Ms Tanya Munz provided research assistance, undertook SPSS data analysis and designed this publication.
Survey administration was undertaken by The Social Research Centre. Mr Darren Pennay (Managing Director) and Mr David Blackmore (Research Director) provided expert advice, including advice on questionnaire design and aspects of data analysis, and developed and applied the survey weighting.
Monash University provided the research environment that sustained the project.
Credits
Andrew Markus is the Pratt Foundation research professor in the School of Historical, International and Philosophical Studies, Monash University, and a Fellow of the Academy of the Social Sciences in Australia. He has published extensively in the field of Australian indigenous and immigration history. His publications include Australia’s Immigration Revolution (Allen & Unwin, Sydney 2009), co‐authored with James Jupp and Peter McDonald; Race: John Howard and the Remaking of Australia (Allen & Unwin, Sydney, 2001) and Building a New Community: Immigration and the Victorian Economy (editor, Allen & Unwin, Sydney, 2001).
The Scanlon Foundation is a member of Philanthropy Australia, the national membership organisation for grant‐making trusts and foundations. Established in June 2001, the Foundation’s mission, ‘to support the creation of a cohesive Australian society’, has led to the support of a number of social cohesion research projects, including this fourth survey of social cohesion in Australia.
The Australian Multicultural Foundation was established in 1989 as a legacy of Australia’s Bicentenary, to promote an awareness among the people of Australia of the diversity of cultures, and the contributions made by those from different backgrounds to the development of Australia’s social, cultural and economic wellbeing, by adopting issues of national significance and initiating projects in any worthwhile field or activity to the benefit of the community.