Embed Size (px)
Citation preview
Mapping Internet Sensors With Probe Response Attacks
John Bethencourt Jason Franklin Mary Vernon
Computer Sciences DepartmentUniversity of Wisconsin, Madison
{bethenco, jfrankli, vernon}@cs.wisc.edu
AbstractInternet sensor networks, including honeypots and loganalysis centers such as the SANS Internet Storm Cen-ter, are used as a tool to detect malicious Internet traf-fic. For maximum effectiveness, such networks publishpublic reports without disclosing sensor locations, so thatthe Internet community can take steps to counteract themalicious traffic. Maintaining sensor anonymity is crit-ical because if the set of sensors is known, a maliciousattacker could avoid the sensors entirely or could over-whelm the sensors with errant data.
Motivated by the growing use of Internet sensors as atool to monitor Internet traffic, we show that networksthat publicly report statistics are vulnerable to intelligentprobing to determine the location of sensors. In particu-lar, we develop a new “probe response” attack techniquewith a number of optimizations for locating the sensorsin currently deployed Internet sensor networks and illus-trate the technique for a specific case study that showshow the attack would locate the sensors of the SANS In-ternet Storm Center using the published data from thosesensors. Simulation results show that the attack can de-termine the identity of the sensors in this and other sen-sor networks in less than a week, even under a limitedadversarial model. We detail critical vulnerabilities inseveral current anonymization schemes and demonstratethat we can quickly and efficiently discover the sensorseven in the presence of sophisticated anonymity preserv-ing methods such as prefix-preserving permutations orBloom filters. Finally, we consider the characteristics ofan Internet sensor which make it vulnerable to probe re-sponse attacks and discuss potential countermeasures.
1 IntroductionThe occurrence of widespread Internet attacks has re-sulted in the creation of systems for monitoring and pro-ducing statistics related to Internet traffic patterns andanomalies. Such systems include log collection and anal-ysis centers [1, 2, 3, 4, 5], collaborative intrusion detec-tion systems [6, 7], honeypots [8, 9], Internet sinks [10],
and network telescopes [11]. The integrity of these sys-tems is based upon the critical assumption that the IP ad-dresses of systems that serve as sensors are secret. If theset of sensors for a particular network is discovered, theintegrity of the data produced by that network is greatlydiminished, as a malicious adversary can avoid the sen-sors or skew the statistics by poisoning the sensor’s data.
Distributed Internet sensors aid in the detection ofwidespread Internet attacks [12, 13] which might other-wise be detectable only within the firewall and IDS logsof an individual organization or through a forensic anal-ysis of compromised systems. In addition, systems suchas Autograph [14], Honeycomb [15], and EarlyBird [16]which rely on Internet sensors to capture worm packetcontents for use in the automatic generation of worm sig-natures would be unable to defend against worms whichavoid their previously mapped monitoring points.
Of primary concern to the security community are In-ternet sensors that enable collaborative intrusion detec-tion through a wide area perspective of the Internet. Suchsystems are in their infancy, but have been proposed insystems like DOMINO [6] and have been partially imple-mented in security log analysis centers like the SANS In-ternet Storm Center [1]. Other examples include Syman-tec’s DeepSight [17], myNetWatchman [18], the Uni-versity of Michigan Internet Motion Sensor [19, 20],CAIDA [2], and iSink [10]. In most cases, sourcessubmit logs to a central repository which then producesstatistics and in some cases provides a query interfaceto a database. In such systems, the probe attacks de-veloped in this paper can compromise the anonymity ofthose who submit logs to the analysis center and thus en-able an attacker to avoid detection. Similarly, the probeattacks developed in this paper can compromise the iden-tity of systems that are used as honeypots that report sim-ilar kinds of attack statistics. In this case, the sensor net-work might still detect malicious activity from wormsthat probe randomly [21, 22] or due to backscatter fromspoofed addresses used in denial of service attacks [23],but many new attacks could be designed to avoid detec-
14th USENIX Security SymposiumUSENIX Association 193
14th USENIX Security Symposium
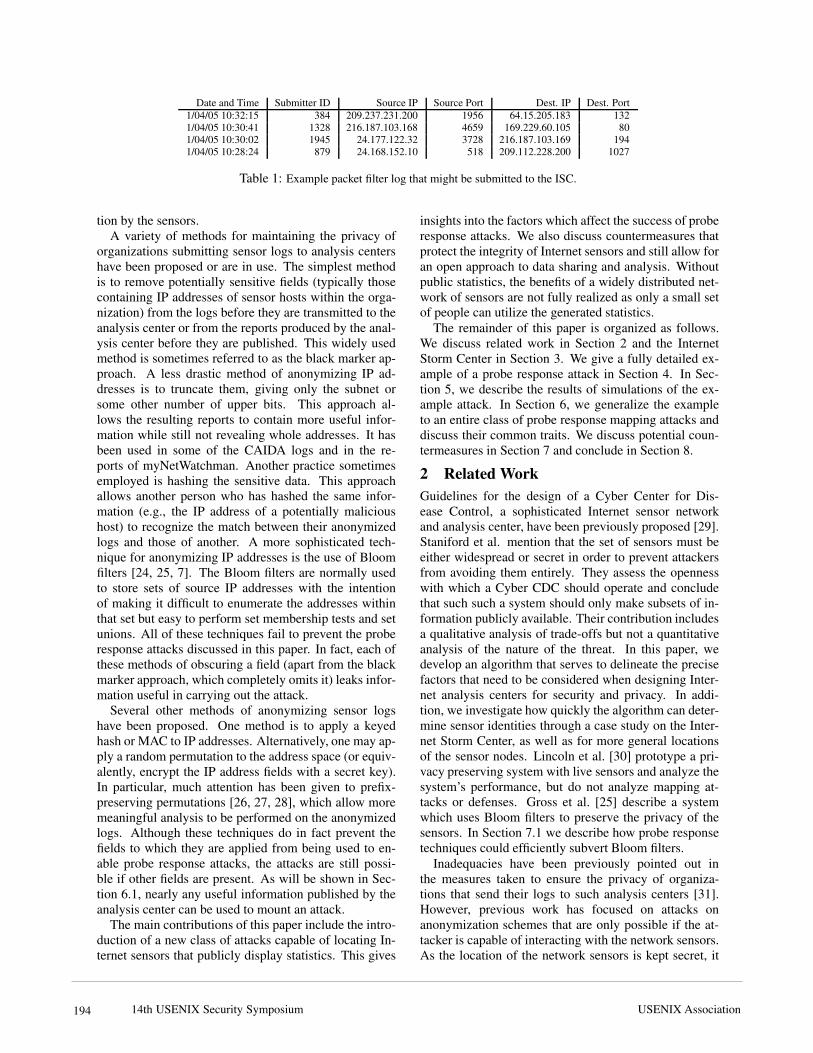
Date and Time Submitter ID Source IP Source Port Dest. IP Dest. Port1/04/05 10:32:15 384 209.237.231.200 1956 64.15.205.183 1321/04/05 10:30:41 1328 216.187.103.168 4659 169.229.60.105 801/04/05 10:30:02 1945 24.177.122.32 3728 216.187.103.169 1941/04/05 10:28:24 879 24.168.152.10 518 209.112.228.200 1027
Table 1: Example packet filter log that might be submitted to the ISC.
tion by the sensors.A variety of methods for maintaining the privacy of
organizations submitting sensor logs to analysis centershave been proposed or are in use. The simplest methodis to remove potentially sensitive fields (typically thosecontaining IP addresses of sensor hosts within the orga-nization) from the logs before they are transmitted to theanalysis center or from the reports produced by the anal-ysis center before they are published. This widely usedmethod is sometimes referred to as the black marker ap-proach. A less drastic method of anonymizing IP ad-dresses is to truncate them, giving only the subnet orsome other number of upper bits. This approach al-lows the resulting reports to contain more useful infor-mation while still not revealing whole addresses. It hasbeen used in some of the CAIDA logs and in the re-ports of myNetWatchman. Another practice sometimesemployed is hashing the sensitive data. This approachallows another person who has hashed the same infor-mation (e.g., the IP address of a potentially malicioushost) to recognize the match between their anonymizedlogs and those of another. A more sophisticated tech-nique for anonymizing IP addresses is the use of Bloomfilters [24, 25, 7]. The Bloom filters are normally usedto store sets of source IP addresses with the intentionof making it difficult to enumerate the addresses withinthat set but easy to perform set membership tests and setunions. All of these techniques fail to prevent the proberesponse attacks discussed in this paper. In fact, each ofthese methods of obscuring a field (apart from the blackmarker approach, which completely omits it) leaks infor-mation useful in carrying out the attack.
Several other methods of anonymizing sensor logshave been proposed. One method is to apply a keyedhash or MAC to IP addresses. Alternatively, one may ap-ply a random permutation to the address space (or equiv-alently, encrypt the IP address fields with a secret key).In particular, much attention has been given to prefix-preserving permutations [26, 27, 28], which allow moremeaningful analysis to be performed on the anonymizedlogs. Although these techniques do in fact prevent thefields to which they are applied from being used to en-able probe response attacks, the attacks are still possi-ble if other fields are present. As will be shown in Sec-tion 6.1, nearly any useful information published by theanalysis center can be used to mount an attack.
The main contributions of this paper include the intro-duction of a new class of attacks capable of locating In-ternet sensors that publicly display statistics. This gives
insights into the factors which affect the success of proberesponse attacks. We also discuss countermeasures thatprotect the integrity of Internet sensors and still allow foran open approach to data sharing and analysis. Withoutpublic statistics, the benefits of a widely distributed net-work of sensors are not fully realized as only a small setof people can utilize the generated statistics.
The remainder of this paper is organized as follows.We discuss related work in Section 2 and the InternetStorm Center in Section 3. We give a fully detailed ex-ample of a probe response attack in Section 4. In Sec-tion 5, we describe the results of simulations of the ex-ample attack. In Section 6, we generalize the exampleto an entire class of probe response mapping attacks anddiscuss their common traits. We discuss potential coun-termeasures in Section 7 and conclude in Section 8.
2 Related WorkGuidelines for the design of a Cyber Center for Dis-ease Control, a sophisticated Internet sensor networkand analysis center, have been previously proposed [29].Staniford et al. mention that the set of sensors must beeither widespread or secret in order to prevent attackersfrom avoiding them entirely. They assess the opennesswith which a Cyber CDC should operate and concludethat such such a system should only make subsets of in-formation publicly available. Their contribution includesa qualitative analysis of trade-offs but not a quantitativeanalysis of the nature of the threat. In this paper, wedevelop an algorithm that serves to delineate the precisefactors that need to be considered when designing Inter-net analysis centers for security and privacy. In addi-tion, we investigate how quickly the algorithm can deter-mine sensor identities through a case study on the Inter-net Storm Center, as well as for more general locationsof the sensor nodes. Lincoln et al. [30] prototype a pri-vacy preserving system with live sensors and analyze thesystem’s performance, but do not analyze mapping at-tacks or defenses. Gross et al. [25] describe a systemwhich uses Bloom filters to preserve the privacy of thesensors. In Section 7.1 we describe how probe responsetechniques could efficiently subvert Bloom filters.
Inadequacies have been previously pointed out inthe measures taken to ensure the privacy of organiza-tions that send their logs to such analysis centers [31].However, previous work has focused on attacks onanonymization schemes that are only possible if the at-tacker is capable of interacting with the network sensors.As the location of the network sensors is kept secret, it
USENIX Association194

Port Reports Sources Targets325 99321 65722 39
1025 269526 51710 47358139 875993 42595 180544
3026 395320 35683 40808135 3530330 155705 270303225 8657692 366825 268953
5000 202542 36207 376896346 2523129 271789 2558
Table 2: Example excerpt from an ISC port report.
is not possible to carry out such attacks. Little to no at-tention has been given to the problem of discovering thelocation of the sensors. We provide techniques that ac-complish this. In addition, little attention has been givento the fact that the identity of the organizations and thespecific addresses they monitor must remain secret to en-sure the integrity of the statistics produced by the anal-ysis center, particularly if the statistics are meant to beemployed in stemming malicious behavior. By demon-strating that it is possible to foil the current methods formaintaining the secrecy of the sensor locations, we showthe importance of this issue.
For example, Pang and Paxson [32] consider the pos-sibility of “indirect exposure” allowing attackers to dis-cover the values of anonymized data fields by consid-ering other parts of the available information. They donot, however, consider how or whether one might beable to map the locations of Internet sensors, a prereq-uisite to interacting with them. Similarly, Xu et al. [28]describe a prefix-preserving permutation based methodfor anonymizing IP addresses that is provably as secureas the TCPdpriv scheme [27] and consider the extent towhich additional address mappings may be discovered ifsome are already known. They also mention active at-tacks in passing and point out that defense against theseattacks is tricky. We develop in depth an active map-ping attack that is effective even on reports that subjectIP addresses to prefix-preserving permutations and fur-ther discuss countermeasures.
3 Background: the Internet Storm Center3.1 OverviewThe Internet Storm Center of the SANS Institute is one ofthe most important existing examples of systems whichcollect data from Internet sensors and publish public re-ports. Furthermore, it is a challenging network to map,as will be shown in Section 5.5, due to its large numberof sensors with non-contiguous IP addresses. Thus, inorder to demonstrate the possibility of mapping sensorswith probe response attacks in general, we describe andevaluate the algorithm initially using the ISC and thengeneralize the algorithm and simulation results to othersensor networks. In this way, the ISC serves as a casestudy in the feasibility of mapping sensor locations.
The ISC collects firewall and IDS logs from approxi-
mately 2,000 organizations, ranging from individuals touniversities and corporations [33]. This collection takesplace through the ISC’s DShield project [34]. The ISCanalyzes and aggregates this information and automati-cally publishes several types of reports which can be re-trieved from the ISC website. These reports are useful fordetecting new worms and blacklisting hosts controlled bymalicious users, among other things. Currently, the logssubmitted through the DShield project are almost en-tirely packet filter logs listing failed connection attempts.They are normally submitted to the ISC database auto-matically by client programs running on the participatinghosts, typically once per hour. The logs submitted are ofthe form depicted in Table 1. These logs are used to pro-duce the reports published by the ISC, including the topten destination ports and source IP addresses in the pastday, a “port report” for each destination port, a “subnetreport,” autonomous system reports, and country reports.
3.2 Port ReportsIn general, many types of information collected by In-ternet sensors and published in reports may be used toconduct probe response attacks, as will be discussed inSection 6. For our case study using the ISC, we will pri-marily concern ourselves with the ISC’s port reports, asthese are representative of the type of statistics that otherInternet sensor networks may provide and are general innature. A fictional excerpt of a port report is given inTable 2. A full listing all of the 216 possible destina-tion ports that had any activity in a particular day maybe obtained from the ISC website. For each port, thereport gives three statistics, the number of (unfortunatelynamed) “reports,” the number of sources, and the numberof targets. The number of sources is the number of dis-tinct source IP addresses appearing among the log entrieswith the given destination port; similarly, the number oftargets is the number of distinct destination IP addresses.The number of “reports” is the total number of log en-tries with that destination port (generally, one for eachpacket). Although the port reports are presented by dayand numbers in the port report reflect the totals for thatday, the port reports are updated more frequently thandaily. One may gain the effect of receiving a port re-port for a more fine-grained time interval by periodicallyrequesting the port report for the current day and sub-tracting off the values last seen in its fields.
4 Example AttackWe now present a detailed algorithm which uses astraightforward divide and conquer strategy along withsome less obvious practical improvements to map thesensor locations using information found in the ISC portreports. In Section 6 we outline how the algorithm couldbe applied to map the sensors in other networks (includ-ing Symantec DeepSight and myNetWatchman) usinginformation in those sensor network reports.
14th USENIX Security SymposiumUSENIX Association 195
14th USENIX Security Symposium
... ...
......
S3
...
SnS2
...
S1
1
packetson port p 2
packetson port p 3
packetson port p n
packetson port p
IP address space
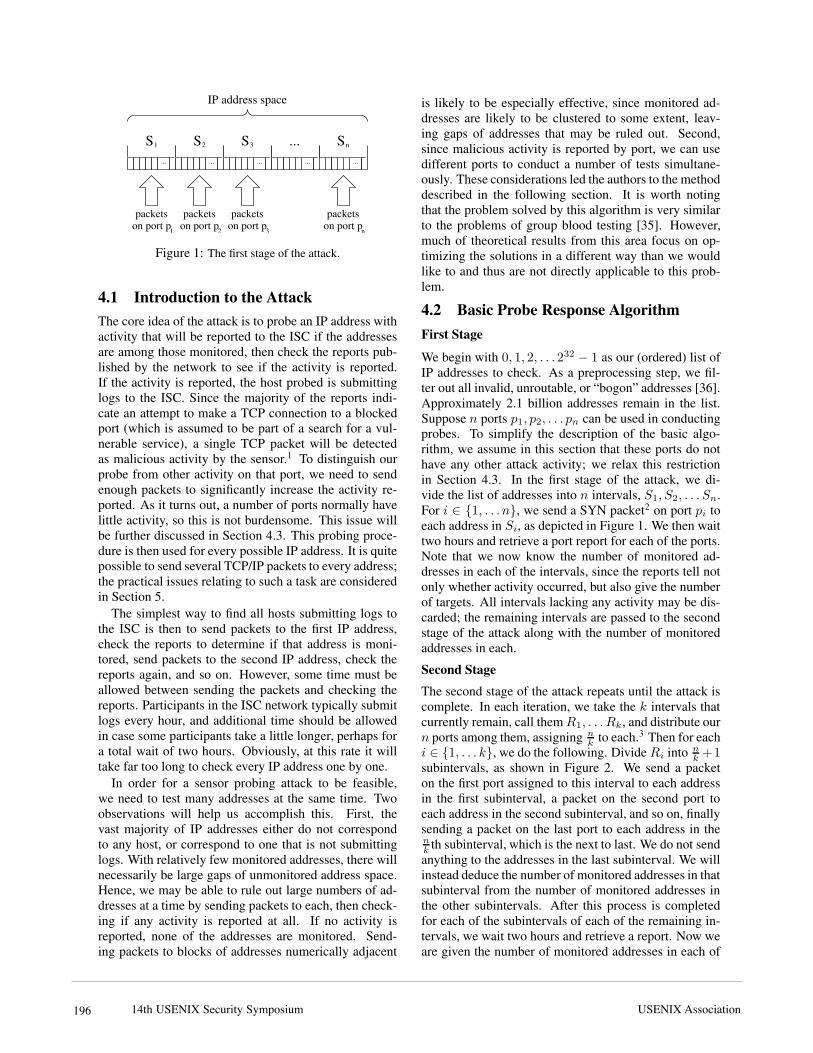
Figure 1: The first stage of the attack.
4.1 Introduction to the AttackThe core idea of the attack is to probe an IP address withactivity that will be reported to the ISC if the addressesare among those monitored, then check the reports pub-lished by the network to see if the activity is reported.If the activity is reported, the host probed is submittinglogs to the ISC. Since the majority of the reports indi-cate an attempt to make a TCP connection to a blockedport (which is assumed to be part of a search for a vul-nerable service), a single TCP packet will be detectedas malicious activity by the sensor.1 To distinguish ourprobe from other activity on that port, we need to sendenough packets to significantly increase the activity re-ported. As it turns out, a number of ports normally havelittle activity, so this is not burdensome. This issue willbe further discussed in Section 4.3. This probing proce-dure is then used for every possible IP address. It is quitepossible to send several TCP/IP packets to every address;the practical issues relating to such a task are consideredin Section 5.
The simplest way to find all hosts submitting logs tothe ISC is then to send packets to the first IP address,check the reports to determine if that address is moni-tored, send packets to the second IP address, check thereports again, and so on. However, some time must beallowed between sending the packets and checking thereports. Participants in the ISC network typically submitlogs every hour, and additional time should be allowedin case some participants take a little longer, perhaps fora total wait of two hours. Obviously, at this rate it willtake far too long to check every IP address one by one.
In order for a sensor probing attack to be feasible,we need to test many addresses at the same time. Twoobservations will help us accomplish this. First, thevast majority of IP addresses either do not correspondto any host, or correspond to one that is not submittinglogs. With relatively few monitored addresses, there willnecessarily be large gaps of unmonitored address space.Hence, we may be able to rule out large numbers of ad-dresses at a time by sending packets to each, then check-ing if any activity is reported at all. If no activity isreported, none of the addresses are monitored. Send-ing packets to blocks of addresses numerically adjacent
is likely to be especially effective, since monitored ad-dresses are likely to be clustered to some extent, leav-ing gaps of addresses that may be ruled out. Second,since malicious activity is reported by port, we can usedifferent ports to conduct a number of tests simultane-ously. These considerations led the authors to the methoddescribed in the following section. It is worth notingthat the problem solved by this algorithm is very similarto the problems of group blood testing [35]. However,much of theoretical results from this area focus on op-timizing the solutions in a different way than we wouldlike to and thus are not directly applicable to this prob-lem.
4.2 Basic Probe Response AlgorithmFirst Stage
We begin with 0, 1, 2, . . .232 − 1 as our (ordered) list ofIP addresses to check. As a preprocessing step, we fil-ter out all invalid, unroutable, or “bogon” addresses [36].Approximately 2.1 billion addresses remain in the list.Suppose n ports p1, p2, . . . pn can be used in conductingprobes. To simplify the description of the basic algo-rithm, we assume in this section that these ports do nothave any other attack activity; we relax this restrictionin Section 4.3. In the first stage of the attack, we di-vide the list of addresses into n intervals, S1, S2, . . . Sn.For i ∈ {1, . . . n}, we send a SYN packet2 on port pi toeach address in Si, as depicted in Figure 1. We then waittwo hours and retrieve a port report for each of the ports.Note that we now know the number of monitored ad-dresses in each of the intervals, since the reports tell notonly whether activity occurred, but also give the numberof targets. All intervals lacking any activity may be dis-carded; the remaining intervals are passed to the secondstage of the attack along with the number of monitoredaddresses in each.
Second StageThe second stage of the attack repeats until the attack iscomplete. In each iteration, we take the k intervals thatcurrently remain, call them R1, . . . Rk, and distribute ourn ports among them, assigning n
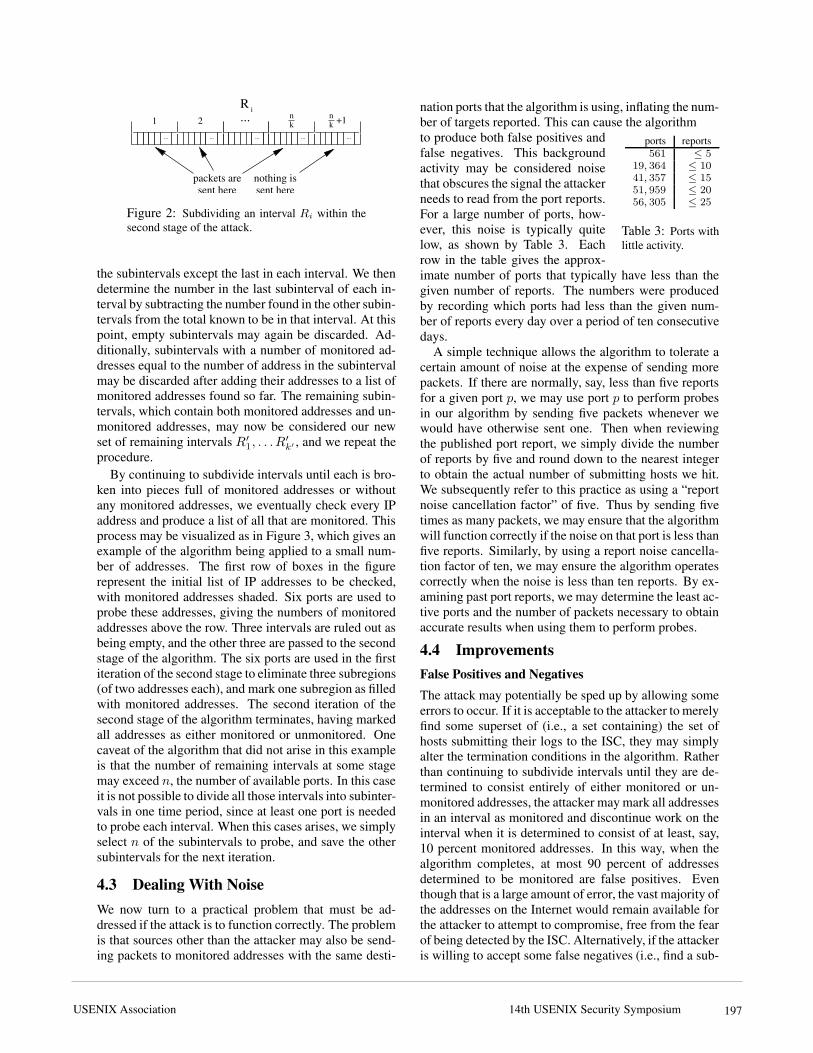
k to each.3 Then for eachi ∈ {1, . . . k}, we do the following. Divide Ri into n
k +1subintervals, as shown in Figure 2. We send a packeton the first port assigned to this interval to each addressin the first subinterval, a packet on the second port toeach address in the second subinterval, and so on, finallysending a packet on the last port to each address in thenk th subinterval, which is the next to last. We do not sendanything to the addresses in the last subinterval. We willinstead deduce the number of monitored addresses in thatsubinterval from the number of monitored addresses inthe other subintervals. After this process is completedfor each of the subintervals of each of the remaining in-tervals, we wait two hours and retrieve a report. Now weare given the number of monitored addresses in each of
USENIX Association196
packets aresent here
nothing issent here
...... ...... ...
+1nk1 2
R i
kn...
Figure 2: Subdividing an interval Ri within thesecond stage of the attack.
the subintervals except the last in each interval. We thendetermine the number in the last subinterval of each in-terval by subtracting the number found in the other subin-tervals from the total known to be in that interval. At thispoint, empty subintervals may again be discarded. Ad-ditionally, subintervals with a number of monitored ad-dresses equal to the number of address in the subintervalmay be discarded after adding their addresses to a list ofmonitored addresses found so far. The remaining subin-tervals, which contain both monitored addresses and un-monitored addresses, may now be considered our newset of remaining intervals R′
1, . . .R′k′ , and we repeat the
procedure.By continuing to subdivide intervals until each is bro-
ken into pieces full of monitored addresses or withoutany monitored addresses, we eventually check every IPaddress and produce a list of all that are monitored. Thisprocess may be visualized as in Figure 3, which gives anexample of the algorithm being applied to a small num-ber of addresses. The first row of boxes in the figurerepresent the initial list of IP addresses to be checked,with monitored addresses shaded. Six ports are used toprobe these addresses, giving the numbers of monitoredaddresses above the row. Three intervals are ruled out asbeing empty, and the other three are passed to the secondstage of the algorithm. The six ports are used in the firstiteration of the second stage to eliminate three subregions(of two addresses each), and mark one subregion as filledwith monitored addresses. The second iteration of thesecond stage of the algorithm terminates, having markedall addresses as either monitored or unmonitored. Onecaveat of the algorithm that did not arise in this exampleis that the number of remaining intervals at some stagemay exceed n, the number of available ports. In this caseit is not possible to divide all those intervals into subinter-vals in one time period, since at least one port is neededto probe each interval. When this cases arises, we simplyselect n of the subintervals to probe, and save the othersubintervals for the next iteration.
4.3 Dealing With NoiseWe now turn to a practical problem that must be ad-dressed if the attack is to function correctly. The problemis that sources other than the attacker may also be send-ing packets to monitored addresses with the same desti-
nation ports that the algorithm is using, inflating the num-ber of targets reported. This can cause the algorithmto produce both false positives and ports reports
561 ≤ 519, 364 ≤ 1041, 357 ≤ 1551, 959 ≤ 2056, 305 ≤ 25
Table 3: Ports withlittle activity.
false negatives. This backgroundactivity may be considered noisethat obscures the signal the attackerneeds to read from the port reports.For a large number of ports, how-ever, this noise is typically quitelow, as shown by Table 3. Eachrow in the table gives the approx-imate number of ports that typically have less than thegiven number of reports. The numbers were producedby recording which ports had less than the given num-ber of reports every day over a period of ten consecutivedays.
A simple technique allows the algorithm to tolerate acertain amount of noise at the expense of sending morepackets. If there are normally, say, less than five reportsfor a given port p, we may use port p to perform probesin our algorithm by sending five packets whenever wewould have otherwise sent one. Then when reviewingthe published port report, we simply divide the numberof reports by five and round down to the nearest integerto obtain the actual number of submitting hosts we hit.We subsequently refer to this practice as using a “reportnoise cancellation factor” of five. Thus by sending fivetimes as many packets, we may ensure that the algorithmwill function correctly if the noise on that port is less thanfive reports. Similarly, by using a report noise cancella-tion factor of ten, we may ensure the algorithm operatescorrectly when the noise is less than ten reports. By ex-amining past port reports, we may determine the least ac-tive ports and the number of packets necessary to obtainaccurate results when using them to perform probes.
4.4 ImprovementsFalse Positives and NegativesThe attack may potentially be sped up by allowing someerrors to occur. If it is acceptable to the attacker to merelyfind some superset of (i.e., a set containing) the set ofhosts submitting their logs to the ISC, they may simplyalter the termination conditions in the algorithm. Ratherthan continuing to subdivide intervals until they are de-termined to consist entirely of either monitored or un-monitored addresses, the attacker may mark all addressesin an interval as monitored and discontinue work on theinterval when it is determined to consist of at least, say,10 percent monitored addresses. In this way, when thealgorithm completes, at most 90 percent of addressesdetermined to be monitored are false positives. Eventhough that is a large amount of error, the vast majority ofthe addresses on the Internet would remain available forthe attacker to attempt to compromise, free from the fearof being detected by the ISC. Alternatively, if the attackeris willing to accept some false negatives (i.e., find a sub-
14th USENIX Security SymposiumUSENIX Association 197

14th USENIX Security Symposium
1 1 1 1 0000 01
0 0 011 1 12 1
2 0 3 2 0 0
Stage 1
Stage 2
Figure 3: Illustration of the sensor probing algorithm.
set of the hosts participating in the network), they maydiscard an interval if the fraction of the addresses that aremonitored within it is less than a certain threshold, againspeeding up the attack. In Section 5 we provide quantita-tive results on the speedup provided by these techniquesin the case of mapping the ISC.
Using Multiple Source Addresses
Speed improvements may also be obtained by taking ad-vantage of the sources field of the port reports. By spoof-ing source IP addresses while sending out probes, an at-tacker may encode additional information discernible inthis field. If in the course of probing an interval of ad-dresses with a single port, the attacker sends multiplepackets to each address from various numbers of sourceIP addresses and takes note of the number of sources re-ported, they may learn something about the distributionof monitored addresses within the interval in addition tothe number of monitored addresses. The following is amethod for accomplishing this.Multiple Source Technique Before probing an intervalof addresses on some port, we further divide the intervalinto some number of pieces k, hereafter referred to asthe “multiple source factor.” To the addresses in the firstpiece, we send packets from a single source. To each ofthe addresses in the second piece, we send packets fromtwo sources. For the third piece, we send packets fromfour source addresses to each address. In general, wesend packets from 2i−1 source addresses to each addressin the ith piece. Note that we already are sending multi-ple packets to each address in order to deal with the noisedescribed in Section 4.3. If 2k−1 is less than or equalto the report noise cancellation factor, then we can em-ploy this technique without sending any more packets;otherwise, more bandwidth is required to send all 2k−1
packets to each address.When the port report is received, we may determine
whether any of the pieces lacked monitored addresses byconsidering the number of sources reported. For exam-ple, suppose k = 3 (i.e., we divide our interval into threepieces) and five sources are reported. Then we know thatthere are monitored addresses in the first and third in-
tervals, and that there are no monitored addresses in thesecond interval. This additional information increasesthe efficiency of the probing algorithm by often reducingthe size of the intervals that need to be considered in thenext iteration, at the expense of potentially increasing thebandwidth usage. Of course, this technique is only use-ful to a limited degree, due to the exponential increasein the number of packets necessary to use it more exten-sively. Depending on the level of noise on the port, usinga multiple source factor of two or three achieves an im-provement in probing efficiency with little to no increasein the bandwidth requirements.
Noise In order for this technique to perform accurately,we must deal with noise appearing in the sources field ofthe port reports in addition to the reports field. If evena single source address other than those spoofed by theattacker is counted in the reported number of sources,the attacker will have a completely inaccurate picture ofwhich pieces are empty. This problem may be solvedin a manner similar to the method for tolerating noise inthe number of reports. Rather than sending sets of pack-ets with 1, 2, 4, . . . and 2k−1 different source addressesto the k pieces, we may use 1m, 2m, 4m, . . . and 2k−1msources, where m is a positive integer hereafter referredto as the “source noise cancellation factor.” Then thereported number of sources may be divided by m androunded down, ensuring accurate results if the noise inthe number of sources was less than m. For example,if a particular port normally has less than three sourcesreported (when the attacker is not carrying out their at-tack) and the attacker is dividing each interval into fourpieces, they may send sets of packets with 3, 6, 12, and24 sources. If seventeen sources are then reported, theydivide by three and round down to obtain five, the sumof one and four. The attacker may then conclude that thesecond and fourth intervals have no monitored addresses,and that the first and third intervals do have monitoredaddresses.
Egress Filtering There is another practical concern re-lating to this technique, and that is egress filtering ofIP packets with spoofed sources. The careful attacker
USENIX Association198

should be able to avoid running into any problems withthis by selecting source addresses similar to actual onesthat are then likely to be valid addresses within the samenetwork. Not many such addresses are needed (since thistechnique will likely only be employed to a limited de-gree for the aforementioned reasons of bandwidth), andit is a simple task to verify whether packets with a givenspoofed address will be filtered before leaving the net-work. All that is necessary is to send one to an availablemachine outside the network and see if it arrives.
5 Simulation of the AttackIn the following section we describe the results of severalsimulated probe response attacks on the ISC, assumingthe set of ISC sensor locations as well as various otherpossible sets of sensor locations. For each attack, we de-tail the results including the time required and the num-ber of packets sent, along with a description of how theattack progresses under various levels of resources andwith optimizations to our algorithm.
In the first scenario, we determine the exact set ofmonitored addresses. While this attack is the most ac-curate, it is also the most time consuming. Dependingon the intentions of the attacker (see Section 5.6), it maynot be necessary to find the exact set of monitored ad-dresses. Thus, we also simulate finding a superset and asubset of the monitored addresses. These scenarios maybe more practically useful since they require less timeand resources.
In each case, we examine the interaction between theaccuracy, time, and resources necessary to undertake ourattack. We demonstrate that the proposed attack is fea-sible with limited resources and under time constraints,and discuss the impact on the integrity of the sensor net-work reports. Since an attacker can obtain an accuratemap of the sensors in less than a week, the integrity ofthe sensor network reports is at risk. Section 6 discusseshow to apply the algorithm using reports from other sen-sor networks, and Section 7 discusses possible counter-measures that sensor networks can use to improve theirvulnerability to such attacks.
5.1 Adversarial ModelsAvailable BandwidthIn order to examine a broad range of scenarios, we pro-vide the results of simulations under three distinct ad-versarial models, the primary difference between mod-els being the resources of the attacker. Our first attackerhas 1.544 Mbps of upload bandwidth, equivalent to a T1line and hereafter will be referred to as the T1 attacker.Our second attacker has significantly more upload band-width, 38.4 Mbps, and hereafter will be referred to asthe fractional T3 attacker or, for brevity, the T3 attacker.Finally, we examine the rate at which an attacker with384 Mbps of bandwidth could complete our attack. Thisadversary will be referred to as the OC6 attacker.
While each attacker is denoted by a specific Internetconnection, our algorithm is not dependent upon a par-ticular Internet connection or attacker configuration. Ouralgorithm can be executed on a distributed collection ofmachines or a single machine, with the time required tocomplete our attack dependent only on the aggregate up-load bandwidth. Neither the number of machines northeir specific configurations are important as long as theycan be coordinated to act in unison. In addition, becauseour attack does not require a response to be received froma probe or any significant amount of state to be main-tained, we can ignore download bandwidth, network la-tency, and computing resources.
BotnetsOne potential way to acquire the necessary bandwidthis to use a “botnet,” or collection of compromised ma-chines acting in unison. The technology required to co-ordinate such a collection of machines for a probe re-sponse attack is currently available and is under someestimations commonly used. The most ubiquitous fam-ilies of botnet software are reported to be Gaobot, Ran-dex, and Spybot. The required upload bandwidth for theT1 attacker could easily be achieved by a dozen cablemodems, a very small botnet. Similarly, the upload band-width for the fractional T3 attacker and the OC6 attackercould be achieved by using around 250 and 2,500 cablemodems, respectively. Botnets of these scales are not un-common [37].
It should be noted that the bandwidth required for theswift completion of the attack varies widely based uponthe noise cancellation factors and the multiple source fac-tor. In all of our attack scenarios, we have configured theparameters of our algorithm to best match the resourcesof the attacker, resulting in a near optimal outcome foreach attacker. Since the only factors that affect the timerequired for our attack to complete are the upload band-width and parameters to the algorithm, it is reasonablyeasy to find a near optimal set of parameters for any givenbandwidth. In addition, the number of ports that havesufficiently low noise to be used in our attack can eas-ily be calculated from past port reports and is found toremain steady throughout the duration of the attack.
Variation in PerformanceEach of our attackers is representative of a class of adver-saries ranging from the most basic attacker with a dozenmachines to a sophisticated and resourceful group withthousands of machines at their command. Using theseclasses of attackers, we show the tradeoffs between ac-curacy, time, and resources while providing concrete re-sults including the time required to complete the attackand the rate at which the attack progresses.
What may not be immediately obvious is the fact thatalmost any level of resources is sufficient to map the ad-dresses monitored by a log collection and analysis centerin a few months. For instance, while not a likely case,
14th USENIX Security SymposiumUSENIX Association 199

14th USENIX Security Symposium
an attacker equipped only with a DSL line could find theexact set of addresses monitored by the ISC in under fourmonths. Log collection projects with fewer participantsthan the ISC could be mapped in even less time.
5.2 Finding the Set of Monitored Ad-dresses
First, we detail the results of our simulation of the fullyaccurate attack, which finds the exact set of monitoredaddresses. Two useful statistics that will help us to ex-plain the specifics of an attack are the number of probessent and the fraction of monitored addresses known ata particular time. We explain the significance of each ofthese statistics and then use them to highlight similaritiesand differences in the simulations under different adver-sarial models.
Number of Probes Sent
As previously explained in Section 4.2, our attack uti-lizes repeated probing of IP addresses with SYN packets.Since we must probe approximately 2.1 billion addresseswith at least one packet each, the number of packets sentby an attack is significant. While the specifics vary basedon the optimizations used, when finding the exact set ofmonitored addresses, our algorithm may send from ninebillion to twenty seven billion SYN packets over a sev-eral day to several week period. As a result of this heftyrequirement, our three attackers, with their widely differ-ent upload bandwidths, are able to complete the attack inwidely differing times. For instance, the time required tofind the set of monitored addresses exactly ranges fromaround 3 days for the OC6 attacker to approximately 34days for the T1 attacker. While the time required to com-plete an attack is not directly proportional to the numberof probes sent, as upload bandwidth increases, the timerequired to complete an attack monotonically decreases.
Figure 4 shows the specific number of packets sent perattacker and the rate at which packets are sent when find-ing the exact set of monitored addresses. The bend in thecurve represents the point at which the attacker’s band-width is sufficient to send all the packets required for aparticular two hour interval within the same two hour in-terval. Before the bend, the attacker’s progress is limitedby the rate at which they can send out packets. This pe-riod generally corresponds to the first stage of the attack,that is, the initial probing of the entire non-bogon addressspace. The bandwidth used in this stage accounts for themajority of the total bandwidth used, as large portions ofthe address space are ruled out in this first pass. After thebend, the attacker’s progress is limited by the two hourwait between sending a set of probes and checking thecorresponding port reports. This situation is generallythe case throughout most of the iterations of the secondstage of the algorithm. For the remainder of our analy-sis, we will focus on the second statistic, the fraction ofmonitored addresses known at a particular time.
0
1e+09
2e+09
3e+09
4e+09
5e+09
6e+09
7e+09
8e+09
9e+09
1e+10
0 5 10 15 20 25 30 35
pack
ets
sent
time (days)
(a) Packets sent by T1 adversary.
0
2e+09
4e+09
6e+09
8e+09
1e+10
1.2e+10
1.4e+10
1.6e+10
0 0.5 1 1.5 2 2.5 3 3.5 4 4.5 5
pack
ets
sent
time (days)
(b) Packets sent by fractional T3 adversary.
0
5e+09
1e+10
1.5e+10
2e+10
2.5e+10
3e+10
0 0.5 1 1.5 2 2.5 3
pack
ets
sent
time (days)
(c) Packets sent by OC6 adversary.
Figure 4: Number of packets sent for each attacksimulation.
USENIX Association200
0
0.2
0.4
0.6
0.8
1
0 5 10 15 20 25 30 35
fract
ion
ofm
onito
red
addr
esse
sfo
und
time (days)
(a) T1 adversary progress.
0
0.2
0.4
0.6
0.8
1
0 0.5 1 1.5 2 2.5 3 3.5 4 4.5 5
fract
ion
ofm
onito
red
addr
esse
sfo
und
time (days)
(b) T3 adversary progress.
0
0.2
0.4
0.6
0.8
1
0 0.5 1 1.5 2 2.5 3
fract
ion
ofm
onito
red
addr
esse
sfo
und
time (days)
(c) OC6 adversary progress.
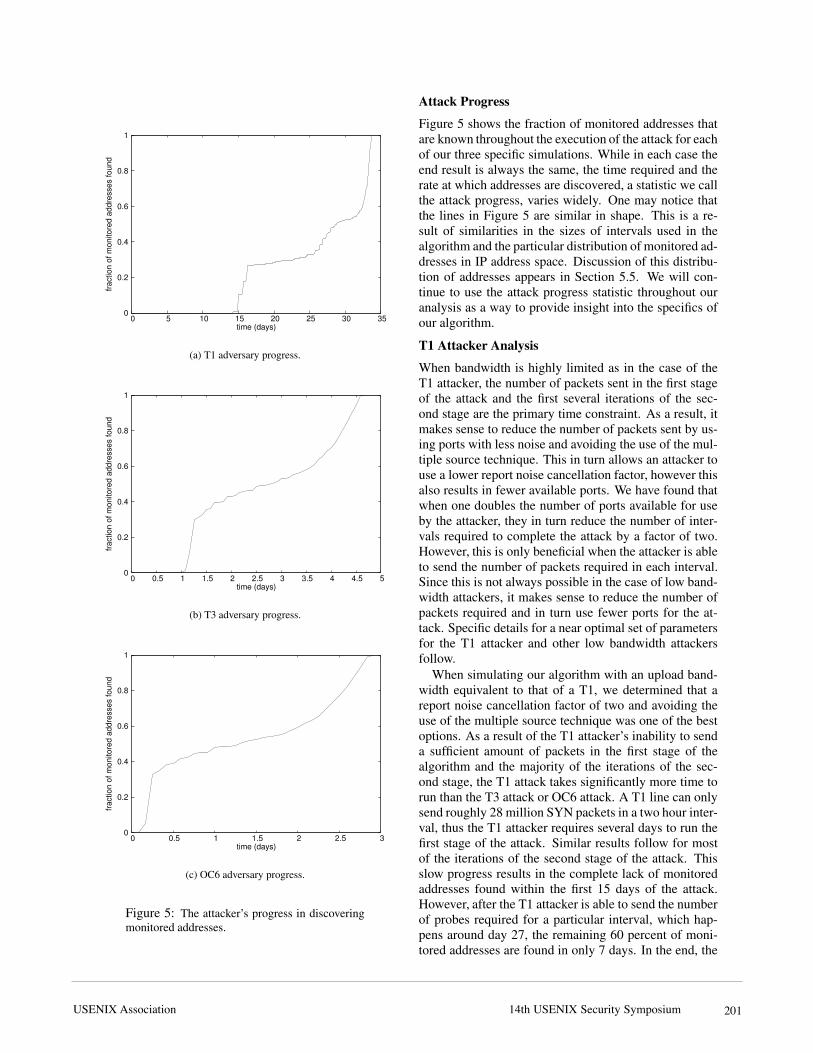
Figure 5: The attacker’s progress in discoveringmonitored addresses.
Attack Progress
Figure 5 shows the fraction of monitored addresses thatare known throughout the execution of the attack for eachof our three specific simulations. While in each case theend result is always the same, the time required and therate at which addresses are discovered, a statistic we callthe attack progress, varies widely. One may notice thatthe lines in Figure 5 are similar in shape. This is a re-sult of similarities in the sizes of intervals used in thealgorithm and the particular distribution of monitored ad-dresses in IP address space. Discussion of this distribu-tion of addresses appears in Section 5.5. We will con-tinue to use the attack progress statistic throughout ouranalysis as a way to provide insight into the specifics ofour algorithm.
T1 Attacker Analysis
When bandwidth is highly limited as in the case of theT1 attacker, the number of packets sent in the first stageof the attack and the first several iterations of the sec-ond stage are the primary time constraint. As a result, itmakes sense to reduce the number of packets sent by us-ing ports with less noise and avoiding the use of the mul-tiple source technique. This in turn allows an attacker touse a lower report noise cancellation factor, however thisalso results in fewer available ports. We have found thatwhen one doubles the number of ports available for useby the attacker, they in turn reduce the number of inter-vals required to complete the attack by a factor of two.However, this is only beneficial when the attacker is ableto send the number of packets required in each interval.Since this is not always possible in the case of low band-width attackers, it makes sense to reduce the number ofpackets required and in turn use fewer ports for the at-tack. Specific details for a near optimal set of parametersfor the T1 attacker and other low bandwidth attackersfollow.
When simulating our algorithm with an upload band-width equivalent to that of a T1, we determined that areport noise cancellation factor of two and avoiding theuse of the multiple source technique was one of the bestoptions. As a result of the T1 attacker’s inability to senda sufficient amount of packets in the first stage of thealgorithm and the majority of the iterations of the sec-ond stage, the T1 attack takes significantly more time torun than the T3 attack or OC6 attack. A T1 line can onlysend roughly 28 million SYN packets in a two hour inter-val, thus the T1 attacker requires several days to run thefirst stage of the attack. Similar results follow for mostof the iterations of the second stage of the attack. Thisslow progress results in the complete lack of monitoredaddresses found within the first 15 days of the attack.However, after the T1 attacker is able to send the numberof probes required for a particular interval, which hap-pens around day 27, the remaining 60 percent of moni-tored addresses are found in only 7 days. In the end, the
14th USENIX Security SymposiumUSENIX Association 201
14th USENIX Security Symposium
0
0.1
0.2
0.3
0.4
0.5
0.6
0.7
0.8
0 2 4 6 8 10 12 14 16
fract
ion
ofm
onito
red
addr
esse
sfo
und
time (days)
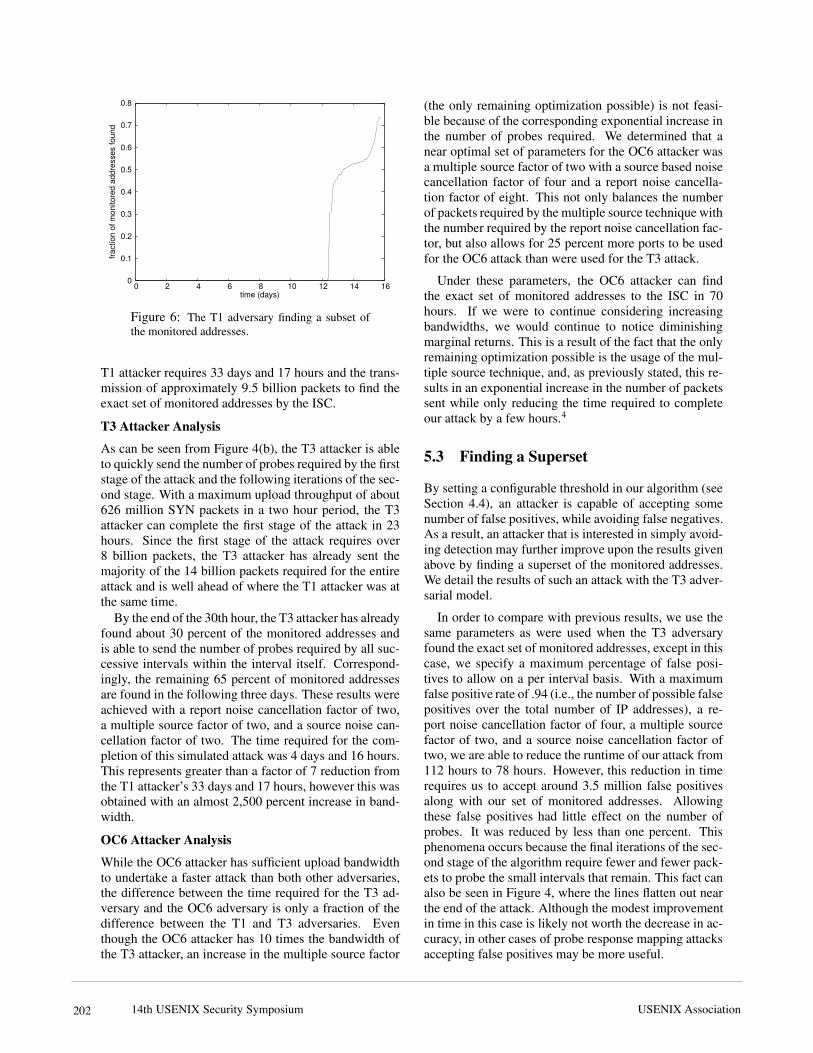
Figure 6: The T1 adversary finding a subset ofthe monitored addresses.
T1 attacker requires 33 days and 17 hours and the trans-mission of approximately 9.5 billion packets to find theexact set of monitored addresses by the ISC.
T3 Attacker Analysis
As can be seen from Figure 4(b), the T3 attacker is ableto quickly send the number of probes required by the firststage of the attack and the following iterations of the sec-ond stage. With a maximum upload throughput of about626 million SYN packets in a two hour period, the T3attacker can complete the first stage of the attack in 23hours. Since the first stage of the attack requires over8 billion packets, the T3 attacker has already sent themajority of the 14 billion packets required for the entireattack and is well ahead of where the T1 attacker was atthe same time.
By the end of the 30th hour, the T3 attacker has alreadyfound about 30 percent of the monitored addresses andis able to send the number of probes required by all suc-cessive intervals within the interval itself. Correspond-ingly, the remaining 65 percent of monitored addressesare found in the following three days. These results wereachieved with a report noise cancellation factor of two,a multiple source factor of two, and a source noise can-cellation factor of two. The time required for the com-pletion of this simulated attack was 4 days and 16 hours.This represents greater than a factor of 7 reduction fromthe T1 attacker’s 33 days and 17 hours, however this wasobtained with an almost 2,500 percent increase in band-width.
OC6 Attacker Analysis
While the OC6 attacker has sufficient upload bandwidthto undertake a faster attack than both other adversaries,the difference between the time required for the T3 ad-versary and the OC6 adversary is only a fraction of thedifference between the T1 and T3 adversaries. Eventhough the OC6 attacker has 10 times the bandwidth ofthe T3 attacker, an increase in the multiple source factor
(the only remaining optimization possible) is not feasi-ble because of the corresponding exponential increase inthe number of probes required. We determined that anear optimal set of parameters for the OC6 attacker wasa multiple source factor of two with a source based noisecancellation factor of four and a report noise cancella-tion factor of eight. This not only balances the numberof packets required by the multiple source technique withthe number required by the report noise cancellation fac-tor, but also allows for 25 percent more ports to be usedfor the OC6 attack than were used for the T3 attack.
Under these parameters, the OC6 attacker can findthe exact set of monitored addresses to the ISC in 70hours. If we were to continue considering increasingbandwidths, we would continue to notice diminishingmarginal returns. This is a result of the fact that the onlyremaining optimization possible is the usage of the mul-tiple source technique, and, as previously stated, this re-sults in an exponential increase in the number of packetssent while only reducing the time required to completeour attack by a few hours.4
5.3 Finding a Superset
By setting a configurable threshold in our algorithm (seeSection 4.4), an attacker is capable of accepting somenumber of false positives, while avoiding false negatives.As a result, an attacker that is interested in simply avoid-ing detection may further improve upon the results givenabove by finding a superset of the monitored addresses.We detail the results of such an attack with the T3 adver-sarial model.
In order to compare with previous results, we use thesame parameters as were used when the T3 adversaryfound the exact set of monitored addresses, except in thiscase, we specify a maximum percentage of false posi-tives to allow on a per interval basis. With a maximumfalse positive rate of .94 (i.e., the number of possible falsepositives over the total number of IP addresses), a re-port noise cancellation factor of four, a multiple sourcefactor of two, and a source noise cancellation factor oftwo, we are able to reduce the runtime of our attack from112 hours to 78 hours. However, this reduction in timerequires us to accept around 3.5 million false positivesalong with our set of monitored addresses. Allowingthese false positives had little effect on the number ofprobes. It was reduced by less than one percent. Thisphenomena occurs because the final iterations of the sec-ond stage of the algorithm require fewer and fewer pack-ets to probe the small intervals that remain. This fact canalso be seen in Figure 4, where the lines flatten out nearthe end of the attack. Although the modest improvementin time in this case is likely not worth the decrease in ac-curacy, in other cases of probe response mapping attacksaccepting false positives may be more useful.
USENIX Association202
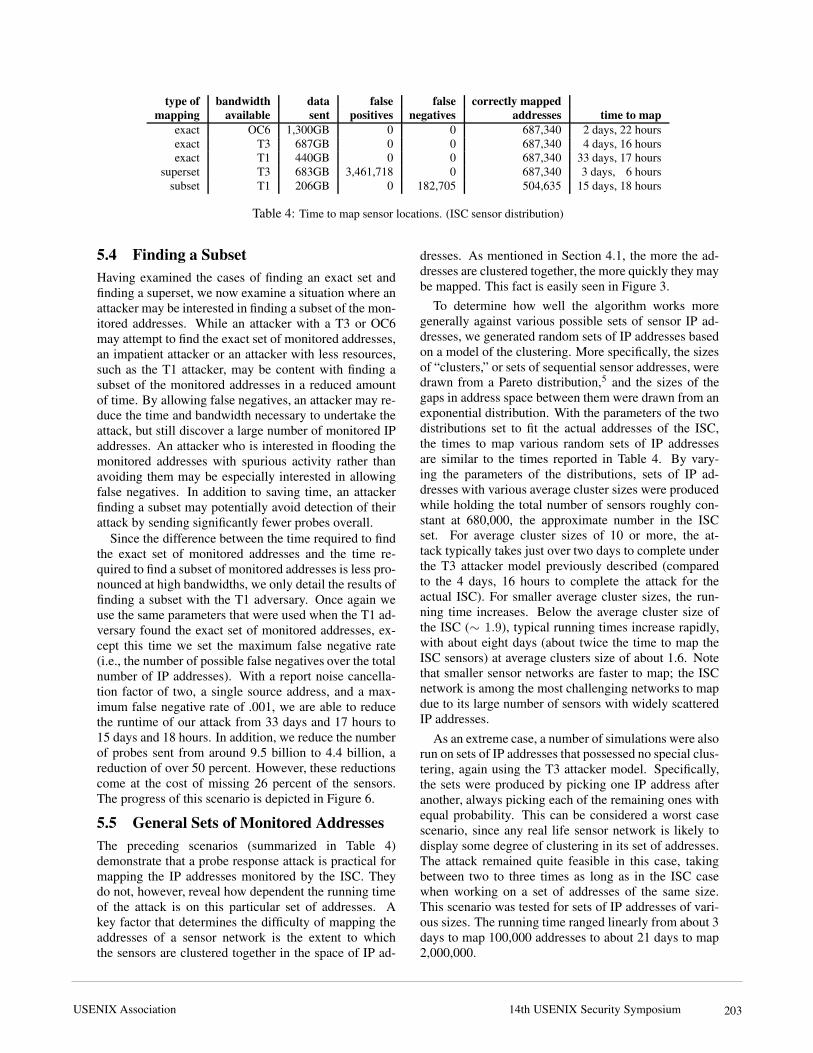
type of bandwidth data false false correctly mappedmapping available sent positives negatives addresses time to map
exact OC6 1,300GB 0 0 687,340 2 days, 22 hoursexact T3 687GB 0 0 687,340 4 days, 16 hoursexact T1 440GB 0 0 687,340 33 days, 17 hours
superset T3 683GB 3,461,718 0 687,340 3 days, 6 hourssubset T1 206GB 0 182,705 504,635 15 days, 18 hours
Table 4: Time to map sensor locations. (ISC sensor distribution)
5.4 Finding a SubsetHaving examined the cases of finding an exact set andfinding a superset, we now examine a situation where anattacker may be interested in finding a subset of the mon-itored addresses. While an attacker with a T3 or OC6may attempt to find the exact set of monitored addresses,an impatient attacker or an attacker with less resources,such as the T1 attacker, may be content with finding asubset of the monitored addresses in a reduced amountof time. By allowing false negatives, an attacker may re-duce the time and bandwidth necessary to undertake theattack, but still discover a large number of monitored IPaddresses. An attacker who is interested in flooding themonitored addresses with spurious activity rather thanavoiding them may be especially interested in allowingfalse negatives. In addition to saving time, an attackerfinding a subset may potentially avoid detection of theirattack by sending significantly fewer probes overall.
Since the difference between the time required to findthe exact set of monitored addresses and the time re-quired to find a subset of monitored addresses is less pro-nounced at high bandwidths, we only detail the results offinding a subset with the T1 adversary. Once again weuse the same parameters that were used when the T1 ad-versary found the exact set of monitored addresses, ex-cept this time we set the maximum false negative rate(i.e., the number of possible false negatives over the totalnumber of IP addresses). With a report noise cancella-tion factor of two, a single source address, and a max-imum false negative rate of .001, we are able to reducethe runtime of our attack from 33 days and 17 hours to15 days and 18 hours. In addition, we reduce the numberof probes sent from around 9.5 billion to 4.4 billion, areduction of over 50 percent. However, these reductionscome at the cost of missing 26 percent of the sensors.The progress of this scenario is depicted in Figure 6.
5.5 General Sets of Monitored AddressesThe preceding scenarios (summarized in Table 4)demonstrate that a probe response attack is practical formapping the IP addresses monitored by the ISC. Theydo not, however, reveal how dependent the running timeof the attack is on this particular set of addresses. Akey factor that determines the difficulty of mapping theaddresses of a sensor network is the extent to whichthe sensors are clustered together in the space of IP ad-
dresses. As mentioned in Section 4.1, the more the ad-dresses are clustered together, the more quickly they maybe mapped. This fact is easily seen in Figure 3.
To determine how well the algorithm works moregenerally against various possible sets of sensor IP ad-dresses, we generated random sets of IP addresses basedon a model of the clustering. More specifically, the sizesof “clusters,” or sets of sequential sensor addresses, weredrawn from a Pareto distribution,5 and the sizes of thegaps in address space between them were drawn from anexponential distribution. With the parameters of the twodistributions set to fit the actual addresses of the ISC,the times to map various random sets of IP addressesare similar to the times reported in Table 4. By vary-ing the parameters of the distributions, sets of IP ad-dresses with various average cluster sizes were producedwhile holding the total number of sensors roughly con-stant at 680,000, the approximate number in the ISCset. For average cluster sizes of 10 or more, the at-tack typically takes just over two days to complete underthe T3 attacker model previously described (comparedto the 4 days, 16 hours to complete the attack for theactual ISC). For smaller average cluster sizes, the run-ning time increases. Below the average cluster size ofthe ISC (∼ 1.9), typical running times increase rapidly,with about eight days (about twice the time to map theISC sensors) at average clusters size of about 1.6. Notethat smaller sensor networks are faster to map; the ISCnetwork is among the most challenging networks to mapdue to its large number of sensors with widely scatteredIP addresses.
As an extreme case, a number of simulations were alsorun on sets of IP addresses that possessed no special clus-tering, again using the T3 attacker model. Specifically,the sets were produced by picking one IP address afteranother, always picking each of the remaining ones withequal probability. This can be considered a worst casescenario, since any real life sensor network is likely todisplay some degree of clustering in its set of addresses.The attack remained quite feasible in this case, takingbetween two to three times as long as in the ISC casewhen working on a set of addresses of the same size.This scenario was tested for sets of IP addresses of vari-ous sizes. The running time ranged linearly from about 3days to map 100,000 addresses to about 21 days to map2,000,000.
14th USENIX Security SymposiumUSENIX Association 203
14th USENIX Security Symposium
5.6 Summary and ConsequencesPerhaps the most interesting results of the simulationsusing the addresses monitored by the ISC presented inTable 4 are the cases of discovering the exact set of mon-itored addresses in about a month with low bandwidthand in about three days with high bandwidth. The conse-quences of a malicious user successfully mapping a set ofsensors are severe. Armed with a list of the IP addressesmonitored by a log collection and analysis center, an at-tacker could avoid the monitored addresses in any futuresuspicious activities (such as port scanning). It wouldeven be possible to include the list in any worms they re-leased,6 allowing the worms to avoid scanning any mon-itored addresses as they spread. Such attacks would goundetected (at least by the analysis center in question).Since organizations such as the ISC are often the firstto discover the spread of new worms, a worm avoidingthe addresses they monitor may go undetected for a longtime. Another technique an attacker armed with a list ofmonitored addresses might employ is to flood monitoredaddresses with activity, causing valid alerts to be lost inthe noise.
The most important thing to realize when consider-ing the consequences of an adversary having obtaineda list of monitored addresses is that the damage doneto the distributed monitoring effort is essentially perma-nent. If the list were publicly released, future alerts aris-ing from those monitored addresses could not be consid-ered an accurate picture of the malicious activities occur-ring within the Internet. Since organizations cannot eas-ily change the IP addresses available to them, and sincedistributed monitoring projects cannot arbitrarily selectwho will participate, accumulating a new set of secretlymonitored IP addresses could be an extremely time con-suming task.
6 Generalizing the AttackWe return now to the fact that our example algorithm formapping a set of sensors is highly tailored to our exam-ple, the ISC, and its port reports. It is certainly conceiv-able that some change may be made to the way this in-formation is reported that will confound the algorithm asit is given. But given such a change, how may we besure that all attacks similar to the one given may be pre-vented? To address this problem, we need to understandwhat essentially allows the example attack to work.
6.1 Covert Channels in ReportsBy sending probes with different destination ports to dif-ferent IP addresses and considering which ports have ac-tivity reported, the attacker is able to gain some informa-tion about the set of IP addresses that could have possiblyreceived the probes. In this way, the destination port ap-pearing in a packet sent out and later in the port reports isused by the attacker as a covert channel [38] in a messageto themselves. The covert channel stores partial informa-
tion about the IP address to which the probe was directed.Similarly, (and here we are considering the “probe” tobe all the packets sent to a particular address in a singleround of the second stage of the algorithm) we see thatthe number of packets sent and the number of distinctsource IP addresses they contain are covert channels thatmay be used to store additional information.
Viewed in this light, it is clear that many possible fieldsof information one may imagine appearing in the reportspublished by a sensor analysis center are suitable for useas covert channels in probe response attacks. Character-istics of attacks or probes that may be reported includethe following.
• Time / date• Source IP• Source network• Source port• Destination network7
• Destination port• Protocol (TCP or UDP)• Packet length• Captured payload data or signature
Our case study attack uses the time a probe was sent out,its destination port, and its set of source IP addresses asthe covert channels. The possibility of characteristics ofpackets being used as a covert channel has been previ-ously mentioned by Xu, et al. [28].
6.2 Other Internet Sensor NetworksTo demonstrate the generality of our algorithm, we out-line how an attacker could map the Symantec DeepSightAnalyzer and the myNetWatchman sensor network. Ta-ble 5 summarizes the essential mapping information forSymantec DeepSight, myNetWatchman, ISC, and themodeled ISC distribution.
Symantec DeepSight
Besides the SANS Internet Storm Center, the largest In-ternet sensor network that publicly displays statistics isSymantec’s DeepSight network. Designed much likethe ISC, DeepSight provides a sensor client called theDeepSight Extractor which, once installed, forwards fire-wall and IDS logs from a monitored address to a centrallog analysis center named the DeepSight Analyzer. TheDeepSight Analyzer then produces summaries and statis-tics related to the specific security events seen by the par-ticular client. After installing the client software, a par-ticular client can log into the DeepSight system and viewstatistics concerning the attacks seen in their own logs.This differentiates the reports of the DeepSight systemfrom those of the ISC since the DeepSight system doesnot provide a global report of the activity sensed by allclients, but rather primarily a view of the events seen bya specific client.
USENIX Association204

Despite the fact that DeepSight primarily provides in-formation concerning security events seen in a particularclient’s logs, they are still vulnerable to a probe responseattack. In order to see how an attacker would map theDeepSight network, we first need to analyze the outputprovided by DeepSight. DeepSight provides each clientwith a detailed report of the attacks seen in their logsincluding the time and date, source IP address, sourceport, destination port, and the number of other clients af-fected by a particular attack. Each report listed containsroughly forty-two to seventy-four bits usable to the at-tacker as a covert channel. There are about ten in thetime field, sixteen in each port field, and zero to thirty-two in the source address field (depending on whetherthe attacker needs to worry about egress filtering whenspoofing source addresses and to what extent if so). Withthis information, an attacker could map DeepSight witha few simple modifications to our algorithm.
First, instead of using strictly the time, destinationport, and set of source IP addresses to encode the des-tination address as in the ISC example, an attacker couldencode the destination address in the source IP, destina-tion port, source port, and time fields. Since the source IPaddress alone provides sufficient space to encode the des-tination IP address, encoding information in the sourceand destination ports and time field is not strictly neces-sary but could be useful for noise reduction purposes orif egress filtering is an issue. Second, for each uniquecombination of fields which the attacker uses to encodethe destination address, the attacker will have to submita log to DeepSight which contains these specific fields.This will allow an attacker to view the required responsestatistics for that probe in the DeepSight system, mostimportantly, the number of other clients that receivedthe probe. Using these two simple modifications to ourexample algorithm, an attacker should be able to en-code sufficient information in each probe such that theDeepSight network could be mapped in a single pass ofprobes.
myNetWatchman
Another important example of an Internet Sensor net-work that displays public statistics is myNetWatchman.The myNetWatchman sensor network groups the eventsof the past hour by source IP and lists them in the“Largest Incidents: Last Hour” report. For each sourceIP, this report lists the time, target subnet, source port,and destination port of the most recent event. The ad-dresses monitored by myNetWatchman could be discov-ered in a single pass of probes using this or other avail-able reports.
6.3 Other Types of ReportsNecessity of Event CountsIt is important to note that it is not even strictly nec-essary for the reports to include the number of events
network bandwidth probes sent time to mapDeepSight - 2.1 billion single pass of probes
myNetWatchman - 2.1 billion single pass of probesSANS ISC T3 14 billion 4 days 16 hours
Modeled ISC T3 20 billion 6 days 6 hours
Table 5: Essential mapping results.
matching some criteria, but only their presence or ab-sence. In terms of the algorithm of the example attackas given in Section 4.2, it would no longer be possibleto avoid sending probes to the last addresses in each in-terval. Instead, probes would always have to be sent toall the subintervals. Also, a different scheme would beneeded to overcome the noise problem described in Sec-tion 4.3 (probably sending several probes to an intervaland only marking it as containing a submitting address ifthe corresponding port consistently reports activity), butthe attack could still be made to work.
Top ListsOne type of report commonly produced by log analysiscenters is the “top list” or “hot list,” essentially a list ofthe most common values of a field within the reports.For example, the “Top 10 Ports” report produced by theISC is a list of the most frequently occurring destinationports among events in the past day. The number of valueslisted on the report may be a fixed number (in this caseten), or it may vary as in the case of reports that list allvalues occurring more often than some threshold. Suchtop list reports tend to be less useful for conducting proberesponse attacks for a couple reasons. Reports with afixed length typically report very little total information.A probe response attack based only on the ISC “Top 10Ports” report would take far too long to be feasible. Also,it may be necessary to generate a very large amount ofactivity to appear on a top list, also making the attackinfeasible. Nevertheless, other such reports still merita critical look to determine if they may be sufficient tolaunch a probe response attack. Such reports are likely tobe more dangerous if they may be requested for variouscriteria (e.g., top ten ports used in attacks directed at aparticular subnet rather than just top ten ports).
7 Countermeasures7.1 Current MethodsSeveral methods are in use or have been proposed forpreventing information published in reports from beingmisused.
Hashing and EncryptionOne common technique is to hash some or all of theabove fields. However, in general this does not impairthe attack as the attacker (having generated the origi-nal probes) has a list of the possible preimages, whichallows for an efficient dictionary attack. However, en-crypting a field with a key not publicly available (or us-
14th USENIX Security SymposiumUSENIX Association 205

14th USENIX Security Symposium
ing a keyed hash such as HMAC-SHA1) would preventthe use of that field in a covert channel. Unfortunately,it would also prevent nearly any use of the informationin that field by those who read the published reports forlegitimate purposes. Prefix-preserving permutations [28]have been proposed a method for obscuring source IP ad-dresses while still allowing useful analysis to take place.Obscuring source IP addresses with encryption (whetheror not it is prefix-preserving) does not, however, preventprobe response attacks, as any of the other characteristicslisted in Section 6.1 may be used.
Bloom Filters
The Bloom filters popular for storing a set of source IPaddresses [25, 7] suffer from similar problems. In gen-eral, a Bloom filter storing a set of IP addresses is in factsafe from dictionary attacks due to the false positive fea-ture of Bloom filters. Even with a relatively low rate offalse positives, say 0.1 percent, the number of false posi-tives resulting from checking all non-bogon IP addressesagainst the filter is on the order of two million (likelymuch more than the number of addresses actually storedin the filter). However, Bloom filters do not stand upto the iterations of a probe response attack. As an ex-ample, suppose some analysis center receives logs frommonitored addresses and at the end of each time intervalpublishes a Bloom filter containing the source addressesobserved. Sending probes to all non-bogon addresseswith the destination address encoded in the source ad-dress, then checking for those addresses in the resultingBloom filter would produce on the order of two millionfalse positives (along with the true positives). Sendinga second set of probes to all positives would reduce thenumber of false positives to about two thousand, and af-ter re-probing those positives, approximately two falsepositives would remain. One more round would likelyeliminate all remaining false positives, an accurate setof monitored addresses having been determined in fourprobe response iterations. There are of course the ad-ditional complications of noise and egress filtering, butthis example illustrates that the number of false positivesdecreases exponentially with respect to the number of it-erations of the probe response attack.
7.2 Information LimitingPrivate Reports
The most immediately apparent way to prevent attackersfrom mapping the locations of the sensors is to limit theinformation published in the reports. The most heavyhanded implementation of this strategy is to eliminatepublic reports entirely and only provide reports to per-sons and organizations that can be trusted to not attemptto map the sensor locations and not disclose reports toothers. Clearly, such an approach severely limits the util-ity of the network. Only a select few obtain any benefitat all from the information collected and the analysis per-
formed on that information.
Top Lists
The strategy of producing no public reports is proba-bly overly cautious. It is likely possible to publish avariety of the “top list” style reports described in Sec-tion 6.3 without disclosing enough information to enablefast probe response attacks, provided some care is used.However, such lists do not provide anything approachinga complete picture of the activity within the Internet. Inparticular, publishing only top list style reports allows at-tackers to ensure their continued secrecy by intentionallylimiting their activity to the extent necessary to stay offthe lists.
Query Limiting
Alternatively, a log analysis center may provide full pub-lic reports or queries of all kinds, but limit the rateat which they can be downloaded. This may be ac-complished by requiring payment for each report down-loaded. The payment may be monetary, or it may takea more virtual form. Such virtual payments may be thecomputational effort required to solve a puzzle or the hu-man interaction necessary to answer a CAPTCHA [39].These transactional networks are similar to those pro-posed by researchers who are attempting to stem theflood of spam email. This may be used in conjunctionwith providing complete reports free of payment to anyorganizations that are completely trusted.
Sampling
Another strategy in limiting the information available toan attacker attempting to map the sensor locations is tosample the logs coming into the analysis center beforegenerating reports from them. For example, the analysiscenter may discard every log it receives with probabil-ity 4
5 . Large scale phenomena such as worm outbreaksand port scanning should remain clearly visible in the re-ports [10], but a probe response attack would be moredifficult. The probability of a single probe sent by an at-tacker to a monitored address resulting in a false negativewould be 4
5 ; to reduce this, the attacker would need tosend multiple probes. If the attacker wished to reduce itto, say, 1 percent, they would need to send twenty probes.A twenty-fold increase in bandwidth is substantial, anda large number of false negatives would still likely resultif the attacker attempted to map a network with hundredsof thousands of monitored addresses in that manner. Ofcourse, this technique of sampling the incoming alertsdoes reduce the useful information produced by the anal-ysis center. It has an advantage over the strategy of onlypublishing top list style reports, however. In this casethere is no way for an attacker to be certain they will notappear in a report by limiting their activity. Even smallamounts of malicious activity have a chance of being re-ported.
USENIX Association206
7.3 Other TechniquesScan PreventionAn additional countermeasure which effectively rendersour current algorithm useless is the widespread adoptionof IPv6. With a search space of 128 bits, IPv6 greatlyreduces the feasibility of TCP/UDP scanning and pre-vents the first stage of our attack from completing ina reasonable amount of time. Mechanisms for reduc-ing the search space required for scanning in IPv6 suchas exploiting dual-stacked networks, compiling addresslists, and mining DNS have been previously addressedin [40]. While IPv6 is an effective countermeasure, thewidespread adoption of IPv6 is out of the control of asensor network and hence is an impractical countermea-sure.
Delayed ReportingBy waiting to publish public reports for a period of time,an Internet sensor network can force an attacker to ex-pend more time and bandwidth in mapping a network. Toundertake a probe response attack in the face of delayedreporting, an attacker has two primary options: eitherwait to receive the responses from the most recent probesor continue probing using a nonadaptive probe responsealgorithm. Nonadaptive probe response algorithms donot rely on the responses of the previous round’s probesto select the next intervals to probe, rather they continueprobing and partitioning a likely larger search space thannecessary under the assumption that a report will be pro-duced at some point in time and that this report will allowfor a much larger search space reduction than a singleround of probe responses would have. However, sincenonadaptive algorithms do not reduce the search spaceafter each round of probes, they require significantlymore probes to be sent and hence increase the bandwidthnecessary for an attack to complete. We defer a full dis-cussion of nonadaptive probing to future work. The otheralternative of waiting for reports to be published is likelyonly possible if the delay is small. Of course, if a net-work can be probed in a single round then a waiting timeof one week before publishing reports is not an effec-tive countermeasure. Hence, delayed reporting shouldbe used in conjunction with another technique which re-duces the amount of information leakage. It should alsobe noted that the utility of a network designed to pro-duce near real time notifications of new attacks is greatlyreduced by delayed reporting.
Eliminating Inadvertent ExposureOur final countermeasure is more of a practical sugges-tion rather than a general countermeasure. Internet sen-sor networks and log analysis centers should avoid pub-lishing information about the specific distribution of ad-dresses they monitor. A simple example should serve tohighlight the primary types of information that must beeliminated from log analysis center descriptions. Take
for example a log analysis center that publicly providestheir complete sensor distribution, perhaps monitoringa single /8. In this case, we can simply probe all /8’sand wait for a single probe to show up in the statis-tics reported by the sensor network. The singular factthat the log analysis center monitors a /8 network pro-vides us with enough information to reduce the numberof probes sent by our attack from several billion to 256!Even more complicated distributions like those providedin [20] should be eliminated as they provide very littleuseful information and make the attacker’s job much eas-ier. It should be noted that systems like honeypots, iSink,and network telescopes which often monitor contiguousaddress space are particularly vulnerable to this sort ofinadvertent exposure.
8 ConclusionIn this paper we developed a general attack techniquecalled probe response, which is capable of determin-ing the location of Internet sensors that publicly displaystatistics. In addition, through the use of the probe re-sponse algorithm, we demonstrated critical vulnerabili-ties in several anonymization and privacy schemes cur-rently in use in Internet analysis centers. We simulated aprobe response attack on the SANS Internet Storm Cen-ter, as well as on various distributions of sensor nodesthat could occur in other sensor networks, and were ableto determine the set of monitored addresses within a fewdays with limited resources. Finally, we outlined the con-sequences of a successful mapping of Internet sensors,alternative reporting schemes, and countermeasures thatdefend against the attacks.
Our current mapping algorithm is an adaptive proberesponse algorithm as each round depends on the out-put of the previous round. On-going and future workincludes developing and evaluating a nonadaptive ap-proach for efficiently mapping Internet sensor networksthat infrequently provide data sets or delay reports. Suchnetworks include the University of Michigan InternetMotion Sensor [19, 20], CAIDA [2], and iSink [10]. An-other issue to be investigated in future work is the effec-tiveness of proposed countermeasures.
AcknowledgmentsWe would like to acknowledge Johannes Ullrich of theSANS Institute for providing access to the DShield logs.We would also like to thank Eric Bach for his valuableinsights and pointers and the anonymous reviewers fortheir suggestions. This work was supported in part by theU.S. Army Research Laboratory and the U.S. Army Re-search Office under grant number #DAAD19-01-1-0502.Jason Franklin performed this research while on appoint-ment as a U.S. Department of Homeland Security (DHS)Scholar under the DHS Scholarship and Fellowship Pro-gram.
14th USENIX Security SymposiumUSENIX Association 207
14th USENIX Security Symposium
References[1] The SANS Internet Storm Center,
http://isc.sans.org.[2] CAIDA, the Cooperative Association for Internet Data Analysis,
http://www.caida.org.[3] Computer Emergency Response Team. AirCERT. http://
www.cert.org/kb/aircert/, 2003.[4] C. Zou, L. Gao, W. Gong, and D. Towsley. Monitoring and Early
Warning for Internet Worms. Proceedings of CCS’03, October2003.
[5] The National Strategy to Secure Cyberspace,http://www.securecyberspace.gov.
[6] V. Yegneswaran, P. Barford, and S. Jha. Global Intrusion Detec-tion in the DOMINO Overlay System. Proceedings of the 2004Network and Distributed System Security Symposium (NDSS2004), February 2004.
[7] M. Locasto, J. Parekh, S. Stolfo, A. Keromytis, T. Malkin, and V.Misra. Collaborative Distributed Intrusion Detection. Tech Re-port CUCS-012-04, Department of Computer Science, ColumbiaUniversity, 2004.
[8] N. Provos. Honeyd - a virtual honeypot daemon. Proceedings ofthe 10th DFN-CERT Workshop, February 2003.
[9] L. Spitzner. Know Your Enemy: Honeynets. HoneynetProject, http://project.honeynet.org/papers/honeynet.
[10] V. Yegneswaran, P. Barford, and D. Plonka. On the Design andUtility of Internet Sinks for Network Abuse Monitoring. Proceed-ings of Symposium on Recent Advances in Intrusion Detection(RAID), September 2003.
[11] D. Moore. Network Telescopes: Observing Small or Distant Se-curity Events. Invited Presentation at the 11th USENIX SecuritySymposium (SEC 02), August 2002.
[12] V. Yegneswaran, P. Barford, and J. Ullrich. Internet Intrusions:Global Characteristics and Prevalence. Proceedings of ACM SIG-METRICS, June 2003.
[13] R. Pang, V. Yegneswaran, P. Barford, V. Paxson, and L. Peter-son. Characteristics of Internet Background Radiation, Proceed-ings of ACM SIGCOMM/USENIX Internet Measurement Confer-ence, October 2004.
[14] H. Kim and B. Karp. Autograph: Toward Automated, DistributedWorm Signature Detection. USENIX Security Symposium, 2004.
[15] C. Kreibich and J. Crowcroft. Honeycomb — Creating IntrusionDetection Signatures Using Honeypots. Proceedings of the IEEESymposium on Security and Privacy, May 2004.
[16] S. Singh, C. Estan, G. Varghese, and S. Savage. The EarlyBirdSystem for Real-time Detection of Unknown Worms. TechnicalReport CS2003-0761, UCSD, August 2003.
[17] Symantec DeepSight Threat Management System TechnologyBrief
[18] The myNetWatchman Project,http://www.mynetwatchman.com.
[19] The University of Michigan Motion Sensor,http://ims.eecs.umich.edu.
[20] M. Bailey, E. Cooke, F. Jahanian, J. Nazario, and D. Watson.The Internet Motion Sensor: A Distributed Blackhole MonitoringSystem. Proceedings of the 12th Annual Network and DistributedSystem Security Symposium, February 2005.
[21] D. Moore, C. Shannon, and J. Brown. Code-Red: A Case Studyon the spread and victims of an Internet worm. Proceedings of the2nd ACM Internet Measurement Workshop, pages 273-284. ACMPress, November 2002.
[22] D. Moore, V. Paxson, S. Savage, C. Shannon, S. Staniford, and N.Weaver. Inside the Slammer Worm. IEEE Security and Privacy,1(4):33-29, July 2003.
[23] D. Moore, G. Voelker, and S. Savage. Inferring Internet Denial-of-Service Activity. Proceedings of USENIX Security Sympo-sium, 2001.
[24] B. Bloom. Space/Time Trade-Offs in Hash Coding With Allow-able Errors. Communications of the ACM, 1970. 13(7): p. 422-426.
[25] P. Gross, J. Parekh, and G. Kaiser. Secure “Selecticast” forCollaborative Intrusion Detection Systems. Proceedings of the3rd International Workshop on Distributed Event-Based Systems(DEBS’04), May 2004.
[26] A. Slagell, J. Wang, and W. Yurcik. Network Log Anonymiza-tion: Application of Crypto-PAn to Cisco Netflows. Proceed-ings of the Workshop on Secure Knowledge Management 2004,September 2004.
[27] G. Minshall. TCPdpriv: Program for Eliminating Confidential In-formation from Traces. Ipsilon Networks, Inc. http://ita.ee.lbl.gov/html/contrib/tcpdpriv.html
[28] J. Xu, J. Fan, M. Ammar, and S. Moon. Prefix-Preserving IP Ad-dress Anonymization: Measurement-based Security Evaluationand a New Cryptography-based Scheme. Proceedings of the 10thIEEE International Conference on Network Protocols (ICNP’02),November 2002.
[29] S. Staniford, V. Paxson, and N. Weaver. How to 0wn the Internetin Your Spare Time. Proceedings of the 11th USENIX SecuritySymposium, 2002.
[30] P. Lincoln, P. Porras, and V. Shmatikov. Privacy-Preserving Shar-ing and Correlation of Security Alerts. Proceedings of the 13thUSENIX Security Symposium, 2004.
[31] A. Slagell and W. Yurcik. Sharing Computer Network Logs forSecurity and Privacy: A Motivation for New Methodologies ofAnonymization. ACM Computing Research Repository (CoRR)Technical Report 0409005, September 2004.
[32] R. Pang and V. Paxson. A High-level Programming Environmentfor Packet Trace Anonymization and Transformation. Proceed-ings of SIGCOMM 2003, August 2003.
[33] K. Carr and D. Duffy. Taking the Internet by storm. CSOon-line.com, April 2003.
[34] The DShield Project,http://www.dshield.org.
[35] D.Z. Du, F. Hwang. Combinatorial Group Testing and Its Appli-cations, World Scientific, Singapore, 2000.
[36] The Cymru Project Bogon List,http://www.cymru.com/Bogons/.
[37] Symantec Internet Security Threat Report, Volume VI, Septem-ber 2004.
[38] B. Lampson. A Note on the Confinement Problem. Communica-tions of the ACM 16, 10 (Oct. 1973), p. 613-615.
[39] L. von Ahn, M. Blum, N. Hopper, and J. Langford. CAPTCHA:Using Hard AI Problems for Security. EUROCRPYT 2003.
[40] T. Chown. IPv6 Implications for TCP/UDP Port Scanning. IETFInternet Work In Progress Draft, July 2004.
Notes1The authors verified this by sending a number of packets to exter-
nal hosts submitting to ISC and verifying that the activity appeared inthe port reports as expected.
2We do not bother waiting to complete a TCP handshake, as this isnot necessary for activity to be reported.
3Briefly, we round nk
to the nearest integer, adjusting as necessaryto ensure the total number of ports used is n.
4The minimum time encountered to determine the exact set of ad-dresses monitored by the ISC was found to be 2 days and 8 hours, butthe bandwidth required makes this case unreasonable.
5The sizes of clusters of sensor addresses in the ISC are fit ex-tremely well by a power law, motivating the use of the Pareto distri-bution for cluster sizes in the model.
6At four bytes per address, a list of 700,000 IP addresses is onlyabout 2.7MB, and may be compressed to an even smaller size.
7We assume the whole destination IP address is never reported, oth-erwise the attack is trivial.
USENIX Association208