Embed Size (px)
Citation preview

2016 Annual Report
Mapping Growth
Mapping G
rowth 2016 A
nnual Report
Achievements and Progress2016 was a year of many achievements. We generated $1.5 billion in funds from operations (adjusted), achieved returns above cost of capital and maintained adjusted EPS essentially flat with last year, weathering a challenging environment. The team drove a significant turnaround in Food & Ingredients and Sugar & Bioenergy by structurally improving the underlying competitiveness of our operations, and, while it was a tough year for Agribusiness, the segment finished on a strong note.
On the back of strong cash generation, we continued our prudent focus on capital allocation, returning over $450 million to shareholders through dividends and share repurchases. Capex of $784 million was $66 million below our guidance and is tracking approximately $275 million below our 2014–2017 target. Throughout the year, we also delivered $135 million of cost and efficiency benefits, exceeding our 2016 target by $10 million.
It was a year of significant progress in executing our strategy. We made multiple portfolio enhancements that will build sustainable value in Bunge. Our value-added food and ingredients portfolio was enriched with the acquisitions of edible oil producers Walter Rau Neusser and Ana Gida in Europe. We expect similar benefits in our Mexican milling business from the pending acquisition of Grupo Minsa. We also improved our winning footprint, replacing our Rio de Janeiro mill with a more efficient facility and advancing the upgrade of our export terminal in New Orleans. In our Agribusiness portfolio, we completed a multi-seed crush plant in Ukraine, built our first soft seed crushing plant in China and complemented our strong soy crushing presence in Spain, Portugal and Italy with the acquisition of two plants in Northern Europe.1
Partnerships remain important, and in 2016 we created regional joint ventures with industry leaders. Two focus on export flows: a partnership with SALIC that is building a highly efficient, coast-to-coast Canadian grain operation, and an expanded relationship with Amaggi, through which we operate logistics assets in northern Brazil. The first will fill a key gap in our footprint and the second will
1. Acquisitions of Ana Gida and the Northern Europe crush plants were announced in 2016 and closed Q1 2017.
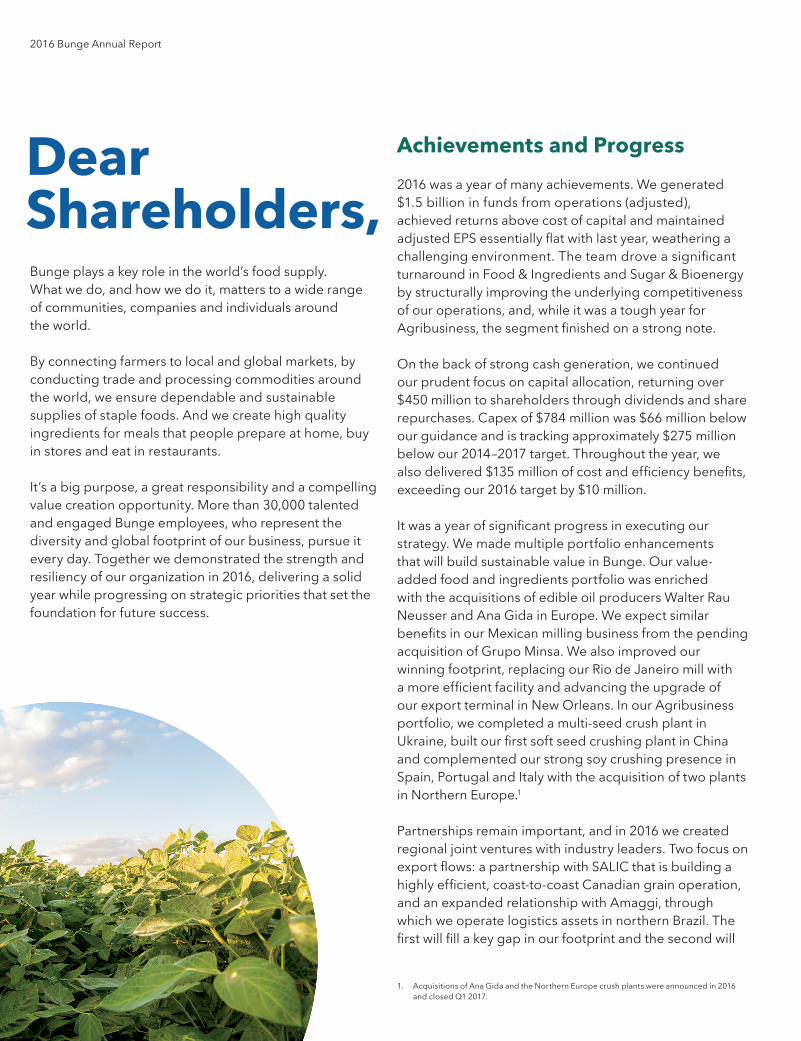
Dear Shareholders,Bunge plays a key role in the world’s food supply. What we do, and how we do it, matters to a wide range of communities, companies and individuals around the world.
By connecting farmers to local and global markets, by conducting trade and processing commodities around the world, we ensure dependable and sustainable supplies of staple foods. And we create high quality ingredients for meals that people prepare at home, buy in stores and eat in restaurants.
It’s a big purpose, a great responsibility and a compelling value creation opportunity. More than 30,000 talented and engaged Bunge employees, who represent the diversity and global footprint of our business, pursue it every day. Together we demonstrated the strength and resiliency of our organization in 2016, delivering a solid year while progressing on strategic priorities that set the foundation for future success.
2016 Bunge Annual Report
enable us to run a new system at full capacity. Another two partnerships enhance our value chains in Southeast Asia. One with Wilmar strengthens our value chain in Vietnam, and another with OFI expands our oils distribution capabilities in Asia.
ZERO-INCIDENT VISIONUnderpinning these accomplishments is our unwavering commitment to safety. We progressed on our journey toward a zero-incident safety culture, introducing new processes and standards with a specific focus on eliminating high potential exposures. More than 3 million training touch points were performed, in the form of toolbox talks and online learning, and we introduced our families and extended communities around the world to the importance of safety via 62 family safety days. These combined efforts contributed to a 34% reduction in lost time incidents and a lower number of safety incidents overall.
ACTING, CONSERVING & ENGAGINGSustainability is central to our vision. Our philosophy is to “Act, Conserve, Engage” by working internally to reduce our environmental footprint, collaborating across value chains to increase traceability and transparency, and tackling big issues like deforestation. Our work in the palm oil sector is a good example. We have made progress in increasing the traceability of our palm supply — reaching nearly 90 percent globally and 95 percent outside of Asia — while enhancing our governance. We were honored to have our efforts in sustainability recognized with a AAA sustainability rating from MSCI.
Mapping the Way ForwardAs we look to 2017 and beyond, growing earnings in a meaningful way remains our number one financial goal.
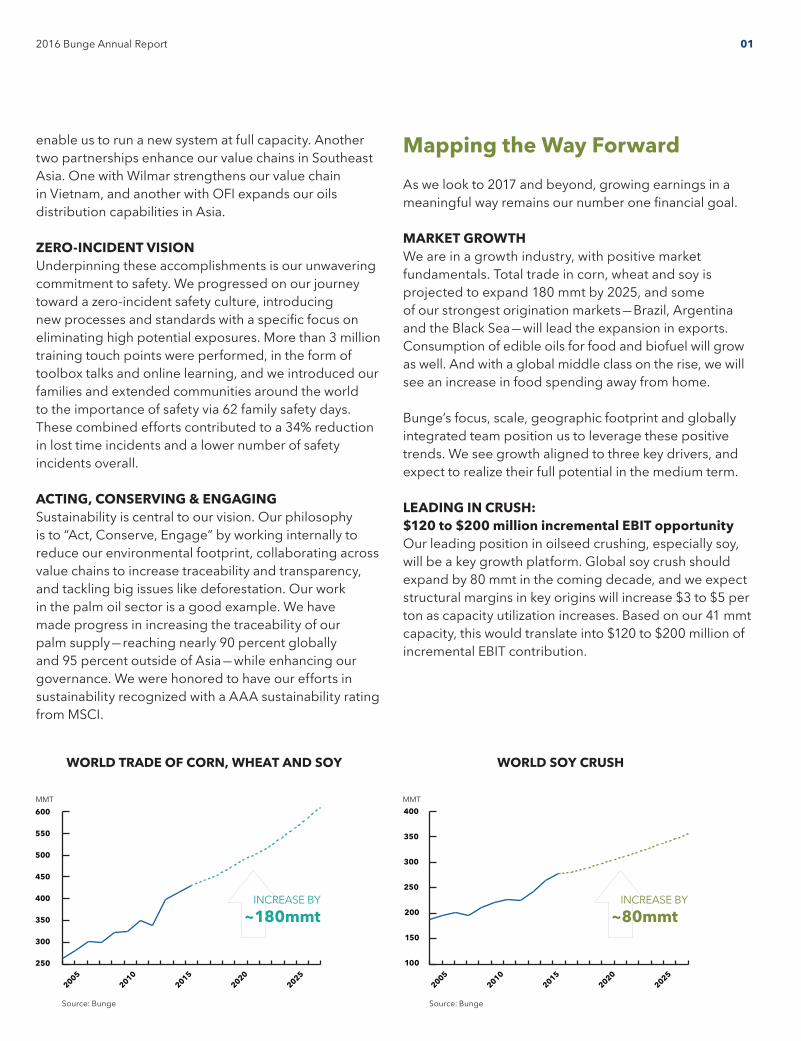
MARKET GROWTHWe are in a growth industry, with positive market fundamentals. Total trade in corn, wheat and soy is projected to expand 180 mmt by 2025, and some of our strongest origination markets — Brazil, Argentina and the Black Sea — will lead the expansion in exports. Consumption of edible oils for food and biofuel will grow as well. And with a global middle class on the rise, we will see an increase in food spending away from home.
Bunge’s focus, scale, geographic footprint and globally integrated team position us to leverage these positive trends. We see growth aligned to three key drivers, and expect to realize their full potential in the medium term.
LEADING IN CRUSH: $120 to $200 million incremental EBIT opportunityOur leading position in oilseed crushing, especially soy, will be a key growth platform. Global soy crush should expand by 80 mmt in the coming decade, and we expect structural margins in key origins will increase $3 to $5 per ton as capacity utilization increases. Based on our 41 mmt capacity, this would translate into $120 to $200 million of incremental EBIT contribution.
WORLD SOY CRUSH
MMT
100
150
200
250
300
350
400
~80mmtINCREASE BY
20052010
20152020
20252005
250
300
350
400
450
500
550
600MMT
20052010
20152020
2025
~180mmtINCREASE BY
250
300
350
400
450
500
550
600
WORLD TRADE OF CORN, WHEAT AND SOY
MMT
Source: Bunge Source: Bunge
2016 Bunge Annual Report 01
ADDING TO VALUE ADDED: $100 to $125 million incremental EBIT opportunityAs the world’s largest producer of softseed oils and a regional leader in milling in the Americas, we are already in a strong position to serve — and help B2B customers manage — consumer demand for foods with health, functionality, clean label and sustainability traits. And we’re investing in the world-class formulation capabilities, people, technologies and assets necessary to provide value-added solutions that are ahead of the curve. Recent bolt- on acquisitions have broadened our product offerings and capabilities, while providing expanded market and customer access.
There is room for a lot more value added growth in Food & Ingredients, both in increasing our offerings to existing customers, and in expanding our customer base. Today, we estimate our share of wallet among key customers is approximately 10 percent, and with the capabilities we have been building, we see room to grow. We are focused on increasing our sales of value-added products, knowing that a 10 percent increase in sales can deliver $30 million of incremental EBIT. All told, we expect our efforts to generate $100 to $125 million in additional EBIT.
ENSURING EFFICIENCY: $250 million incremental EBIT opportunityThe effort we have put into building a culture of continuous improvement and the successful execution of asset and process optimization programs have generated material benefits. We are more than halfway to our 2014–2017 target of $345 million of improvements, with $255 million achieved so far. Between 2018 and 2020, we forecast benefits of an additional $250 million from industrial operations, logistics and SG&A, approximately half of which should hit the bottom line.
The Bottom LineWhile the beginning of 2017 will be slow, overall market conditions should be more favorable. Strong demand for proteins and oils will increase crush utilization and margins, and commercialization of crops will normalize with the arrival of record production in South America. In Food & Ingredients, we expect 2017 to be a year of growth in earnings driven by an increased share of added value products and overall volumes. In sugar milling, we are confident in our ability to deliver another solid year of performance, while continuing to seek alternatives to reduce exposure to the business. We will continue to drive performance improvements across all of our businesses, with $100 million of benefits planned for this year. We expect strong cash from operations to support our returns-driven approach to capital allocation.
Bunge has never been stronger. We are focused on what we do best — oilseeds and grains. We are a more streamlined and integrated company than we have ever been, and we are using our size and scale to reach a larger set of customers with a broader portfolio of offerings. Our talented, diverse team exemplifies the Bunge core values of citizenship, teamwork and entrepreneurship, and has proven its tenacity and adaptability.
As we enter our third century of operations, our team is primed for even greater success — standing on a solid foundation, focused on growing markets and executing a clear, effective strategy. I am proud of the team for bringing us to where we are, and grateful to you, our shareholders, for your continuing support.
Best regards, Soren Schroder
2016 Bunge Annual Report02
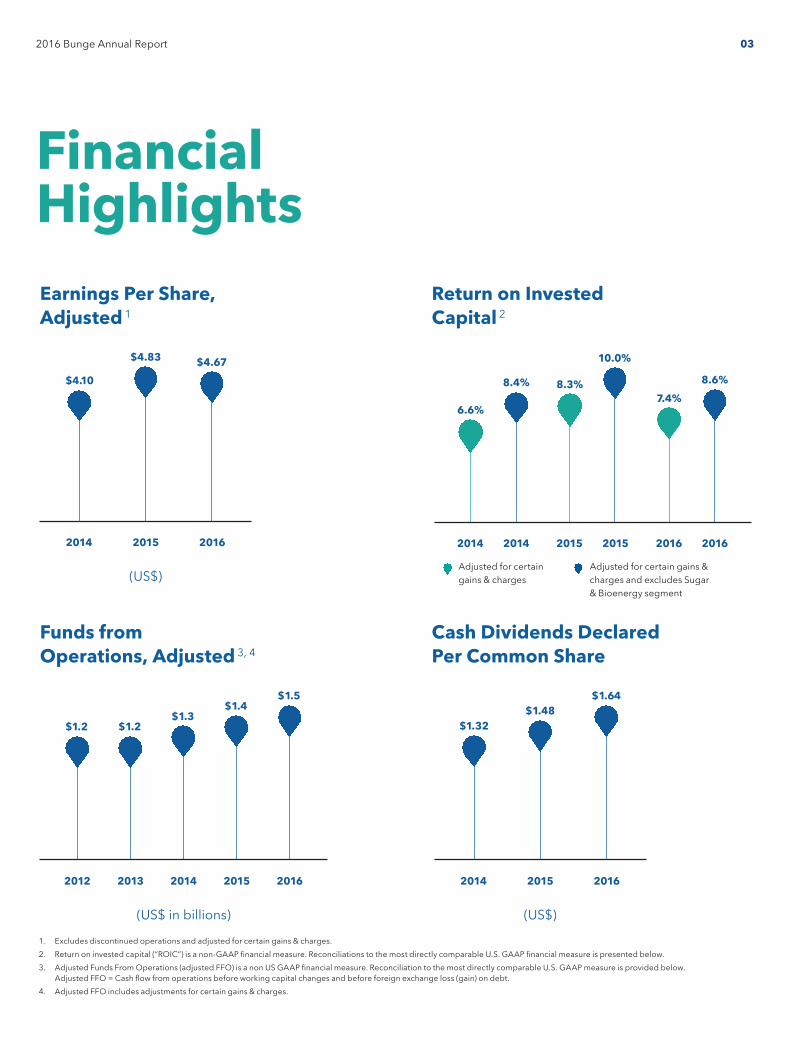
Financial HighlightsEarnings Per Share, Adjusted 1
Cash Dividends Declared Per Common Share
Return on Invested Capital 2
Funds from Operations, Adjusted 3, 4
Adjusted for certain gains & charges
Adjusted for certain gains & charges and excludes Sugar & Bioenergy segment
1. Excludes discontinued operations and adjusted for certain gains & charges.2. Return on invested capital (“ROIC”) is a non-GAAP financial measure. Reconciliations to the most directly comparable U.S. GAAP financial measure is presented below.3. Adjusted Funds From Operations (adjusted FFO) is a non US GAAP financial measure. Reconciliation to the most directly comparable U.S. GAAP measure is provided below.
Adjusted FFO = Cash flow from operations before working capital changes and before foreign exchange loss (gain) on debt.4. Adjusted FFO includes adjustments for certain gains & charges.
10.0%
7.4%8.6%8.3%8.4%
6.6%
2015 20152014 2014 2016 2016
$4.83 $4.67$4.10
(US$)
2014 2015 2016
$1.48$1.64
$1.32
(US$)
2014 2015 2016
(US$ in billions)
$1.2 $1.2$1.3
$1.4$1.5
201420132012 2015 2016
2016 Bunge Annual Report 03
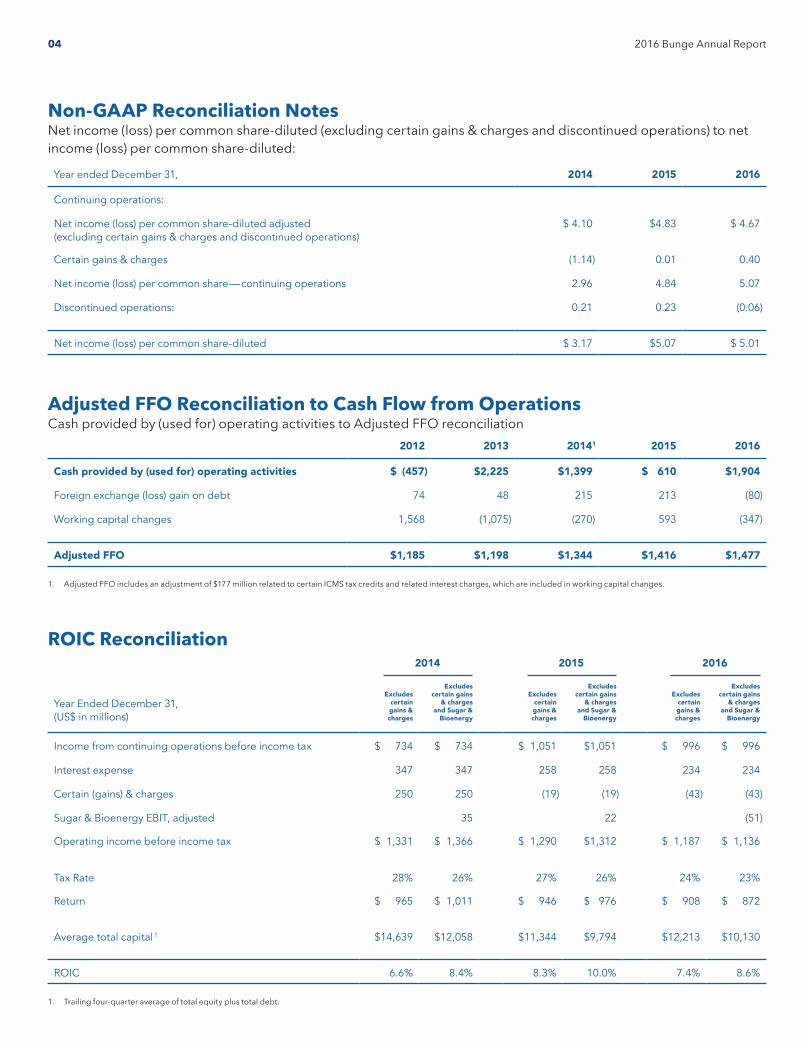
ROIC Reconciliation 2014 2015 2016
Year Ended December 31, (US$ in millions)
Excludes certain gains & charges
Excludes certain gains
& charges and Sugar &
Bioenergy
Excludes certain gains & charges
Excludes certain gains
& charges and Sugar &
Bioenergy
Excludes certain gains & charges
Excludes certain gains
& charges and Sugar &
Bioenergy
Income from continuing operations before income tax $ 734 $ 734 $ 1,051 $1,051 $ 996 $ 996
Interest expense 347 347 258 258 234 234
Certain (gains) & charges 250 250 (19) (19) (43) (43)
Sugar & Bioenergy EBIT, adjusted 35 22 (51)
Operating income before income tax $ 1,331 $ 1,366 $ 1,290 $1,312 $ 1,187 $ 1,136
Tax Rate 28% 26% 27% 26% 24% 23%
Return $ 965 $ 1,011 $ 946 $ 976 $ 908 $ 872
Average total capital 1 $14,639 $12,058 $11,344 $9,794 $12,213 $10,130
ROIC 6.6% 8.4% 8.3% 10.0% 7.4% 8.6%
1. Trailing four-quarter average of total equity plus total debt.
Adjusted FFO Reconciliation to Cash Flow from OperationsCash provided by (used for) operating activities to Adjusted FFO reconciliation
2012 2013 20141 2015 2016
Cash provided by (used for) operating activities $ (457) $2,225 $1,399 $ 610 $1,904
Foreign exchange (loss) gain on debt 74 48 215 213 (80)
Working capital changes 1,568 (1,075) (270) 593 (347)
Adjusted FFO $1,185 $1,198 $1,344 $1,416 $1,477
1. Adjusted FFO includes an adjustment of $177 million related to certain ICMS tax credits and related interest charges, which are included in working capital changes.
Non-GAAP Reconciliation NotesNet income (loss) per common share-diluted (excluding certain gains & charges and discontinued operations) to net income (loss) per common share-diluted:
Year ended December 31, 2014 2015 2016
Continuing operations:
Net income (loss) per common share-diluted adjusted (excluding certain gains & charges and discontinued operations)
$ 4.10 $4.83 $ 4.67
Certain gains & charges (1.14) 0.01 0.40
Net income (loss) per common share — continuing operations 2.96 4.84 5.07
Discontinued operations: 0.21 0.23 (0.06)
Net income (loss) per common share-diluted $ 3.17 $5.07 $ 5.01
2016 Bunge Annual Report04
29MAR201300314706
UNITED STATES SECURITIES AND EXCHANGE COMMISSIONWashington, DC 20549
FORM 10-K
� ANNUAL REPORT PURSUANT TO SECTION 13 OR 15(d) OF THE SECURITIES EXCHANGE ACT OF 1934For the fiscal year ended December 31, 2016or
� TRANSITION REPORT PURSUANT TO SECTION 13 OR 15(d) OF THE SECURITIES EXCHANGE ACT OF 1934For the transition period from to
Commission File Number 001-16625
BUNGE LIMITED(Exact name of registrant as specified in its charter)
(State or other jurisdiction of incorporation or organization)Bermuda
(IRS Employer Identification No.)98-0231912
(Address of principal executive offices)50 Main Street
White Plains, New York USA(Zip Code)
10606(Registrant’s telephone number, including area code)
(914) 684-2800
Securities registered pursuant to Section 12(b) of the Act:Title of each class
Common Shares, par value $.01 per shareName of each exchange on which registered
New York Stock ExchangeSecurities registered pursuant to Section 12(g) of the Act: None
Indicate by check mark if the registrant is a well-known seasoned issuer, as defined in Rule 405 of the SecuritiesAct. Yes � No �
Indicate by check mark if the registrant is not required to file reports pursuant to Section 13 or Section 15(d) of theSecurities Act. Yes � No �
Indicate by check mark whether the registrant (1) has filed all reports required to be filed by Section 13 or 15(d) of theSecurities Exchange Act of 1934 during the preceding 12 months (or for such shorter period that the registrant wasrequired to file such reports), and (2) has been subject to such filing requirements for the past 90 days. Yes � No �
Indicate by check mark whether the registrant has submitted electronically and posted on its corporate web site, if any,every Interactive Data File required to be submitted and posted pursuant to Rule 405 of Regulation S-T (§232.405 of thischapter) during the preceding 12 months (or for such shorter period that the registrant was required to submit and postsuch files). Yes � No �
Indicate by check mark if disclosure of delinquent filers pursuant to Item 405 of Regulation S-K is not contained herein,and will not be contained, to the best of registrant’s knowledge, in definitive proxy or information statements incorporatedby reference in Part III of this Form 10-K or any amendment to this Form 10-K. �
Indicate by check mark whether the registrant is a large accelerated filer, an accelerated filer, a non-accelerated filer, or asmaller reporting company. See the definitions of ‘‘large accelerated filer,’’ ‘‘accelerated filer,’’ and ‘‘smaller reportingcompany’’ in Rule 12b-2 of the Exchange Act:Large Accelerated filer � Accelerated filer � Non-accelerated filer � (do not check if asmaller reporting company) Smaller reporting company �
Indicate by check mark whether the registrant is a shell company (as defined in Rule 12b-2 of the Act). Yes � No �
The aggregate market value of registrant’s common shares held by non-affiliates, based upon the closing price of ourcommon shares on the last business day of the registrant’s most recently completed second fiscal quarter, June 30, 2016,as reported by the New York Stock Exchange, was approximately $8,220 million. Common shares held by executive officersand directors and persons who own 10% or more of the issued and outstanding common shares have been excluded sincesuch persons may be deemed affiliates. This determination of affiliate status is not a determination for any other purpose.
As of February 17, 2017, 139,508,796 Common Shares, par value $.01 per share, were issued and outstanding.
DOCUMENTS INCORPORATED BY REFERENCE
Portions of the proxy statement for the 2017 Annual General Meeting of Shareholders to be held on May 25, 2017 areincorporated by reference into Part III.

i
TABLE OF CONTENTS
PAGE
PART I
Item 1. Business . . . . . . . . . . . . . . . . . . . . . . . . . . . . . . . . . . . . . . . . . . . . . . . . . . . . . . . . . . . . . . . . . . . . . . . . . . . . . . . . . . . . . . . . . . . . . . . . . . . . . . . . . . . . . . . . . . . . . . . . . . . . . . . . . . . . . . 1
Item 1A. Risk Factors . . . . . . . . . . . . . . . . . . . . . . . . . . . . . . . . . . . . . . . . . . . . . . . . . . . . . . . . . . . . . . . . . . . . . . . . . . . . . . . . . . . . . . . . . . . . . . . . . . . . . . . . . . . . . . . . . . . . . . . . . . . . . . . . . 9
Item 1B. Unresolved Staff Comments . . . . . . . . . . . . . . . . . . . . . . . . . . . . . . . . . . . . . . . . . . . . . . . . . . . . . . . . . . . . . . . . . . . . . . . . . . . . . . . . . . . . . . . . . . . . . . . . . . . . . . . . . . . . 15
Item 2. Properties . . . . . . . . . . . . . . . . . . . . . . . . . . . . . . . . . . . . . . . . . . . . . . . . . . . . . . . . . . . . . . . . . . . . . . . . . . . . . . . . . . . . . . . . . . . . . . . . . . . . . . . . . . . . . . . . . . . . . . . . . . . . . . . . . . . . 15
Item 3. Legal Proceedings . . . . . . . . . . . . . . . . . . . . . . . . . . . . . . . . . . . . . . . . . . . . . . . . . . . . . . . . . . . . . . . . . . . . . . . . . . . . . . . . . . . . . . . . . . . . . . . . . . . . . . . . . . . . . . . . . . . . . . . . . 16
Item 4. Mine Safety Disclosures . . . . . . . . . . . . . . . . . . . . . . . . . . . . . . . . . . . . . . . . . . . . . . . . . . . . . . . . . . . . . . . . . . . . . . . . . . . . . . . . . . . . . . . . . . . . . . . . . . . . . . . . . . . . . . . . . 16
PART II
Item 5. Market for Registrant’s Common Equity, Related Stockholder Matters and Issuer Purchases of EquitySecurities. . . . . . . . . . . . . . . . . . . . . . . . . . . . . . . . . . . . . . . . . . . . . . . . . . . . . . . . . . . . . . . . . . . . . . . . . . . . . . . . . . . . . . . . . . . . . . . . . . . . . . . . . . . . . . . . . . . . . . . . . . . . . . . . . . 17
Item 6. Selected Financial Data . . . . . . . . . . . . . . . . . . . . . . . . . . . . . . . . . . . . . . . . . . . . . . . . . . . . . . . . . . . . . . . . . . . . . . . . . . . . . . . . . . . . . . . . . . . . . . . . . . . . . . . . . . . . . . . . . . 19
Item 7. Management’s Discussion and Analysis of Financial Condition and Results of Operations. . . . . . . . . . . . . . . . . . . . . . . . . . . 20
Item 7A. Quantitative and Qualitative Disclosures About Market Risk . . . . . . . . . . . . . . . . . . . . . . . . . . . . . . . . . . . . . . . . . . . . . . . . . . . . . . . . . . . . . . . . . . 40
Item 8. Financial Statements and Supplementary Data. . . . . . . . . . . . . . . . . . . . . . . . . . . . . . . . . . . . . . . . . . . . . . . . . . . . . . . . . . . . . . . . . . . . . . . . . . . . . . . . . . . . 43
Item 9. Changes in and Disagreements with Accountants on Accounting and Financial Disclosure . . . . . . . . . . . . . . . . . . . . . . . . . 43
Item 9A. Controls and Procedures. . . . . . . . . . . . . . . . . . . . . . . . . . . . . . . . . . . . . . . . . . . . . . . . . . . . . . . . . . . . . . . . . . . . . . . . . . . . . . . . . . . . . . . . . . . . . . . . . . . . . . . . . . . . . . . . . 43
Item 9B. Other Information . . . . . . . . . . . . . . . . . . . . . . . . . . . . . . . . . . . . . . . . . . . . . . . . . . . . . . . . . . . . . . . . . . . . . . . . . . . . . . . . . . . . . . . . . . . . . . . . . . . . . . . . . . . . . . . . . . . . . . . . . . 45
PART III
Item 10. Directors, Executive Officers, and Corporate Governance. . . . . . . . . . . . . . . . . . . . . . . . . . . . . . . . . . . . . . . . . . . . . . . . . . . . . . . . . . . . . . . . . . . . . . . 45
Item 11. Executive Compensation . . . . . . . . . . . . . . . . . . . . . . . . . . . . . . . . . . . . . . . . . . . . . . . . . . . . . . . . . . . . . . . . . . . . . . . . . . . . . . . . . . . . . . . . . . . . . . . . . . . . . . . . . . . . . . . . . 45
Item 12. Security Ownership of Certain Beneficial Owners and Management and Related Stockholder Matters. . . . . . . . . . . 45
Item 13. Certain Relationships and Related Transactions, and Director Independence . . . . . . . . . . . . . . . . . . . . . . . . . . . . . . . . . . . . . . . . . . . . 45
Item 14. Principal Accounting Fees and Services . . . . . . . . . . . . . . . . . . . . . . . . . . . . . . . . . . . . . . . . . . . . . . . . . . . . . . . . . . . . . . . . . . . . . . . . . . . . . . . . . . . . . . . . . . . . . 45
PART IV
Item 15. Exhibits, Financial Statement Schedules . . . . . . . . . . . . . . . . . . . . . . . . . . . . . . . . . . . . . . . . . . . . . . . . . . . . . . . . . . . . . . . . . . . . . . . . . . . . . . . . . . . . . . . . . . . . . 46
Schedule II – Valuation and Qualifying Accounts . . . . . . . . . . . . . . . . . . . . . . . . . . . . . . . . . . . . . . . . . . . . . . . . . . . . . . . . . . . . . . . . . . . . . . . . . . . . . . . . . . . . . . . . . . . . . . . . . E-1
INDEX TO CONSOLIDATED FINANCIAL STATEMENTS . . . . . . . . . . . . . . . . . . . . . . . . . . . . . . . . . . . . . . . . . . . . . . . . . . . . . . . . . . . . . . . . . . . . . . . . . . . . . . . . . . . . . . . . F-1
SIGNATURES. . . . . . . . . . . . . . . . . . . . . . . . . . . . . . . . . . . . . . . . . . . . . . . . . . . . . . . . . . . . . . . . . . . . . . . . . . . . . . . . . . . . . . . . . . . . . . . . . . . . . . . . . . . . . . . . . . . . . . . . . . . . . . . . . . . . . . . . . . . . . . . . S-1
2016 Bunge Annual Report i
ii
CAUTIONARY STATEMENT REGARDING FORWARD LOOKING STATEMENTSThe Private Securities Litigation Reform Act of 1995 provides a • our ability to achieve the efficiencies, savings and other‘‘safe harbor’’ for forward looking statements to encourage benefits anticipated from our cost reduction, margincompanies to provide prospective information to investors. This improvement, operational excellence and other businessAnnual Report on Form 10-K includes forward looking optimization initiatives;statements that reflect our current expectations and projections
• industry conditions, including fluctuations in supply, demandabout our future results, performance, prospects andand prices for agricultural commodities and other rawopportunities. Forward looking statements include allmaterials and products that we sell and use in our business,statements that are not historical in nature. We have tried tofluctuations in energy and freight costs and competitiveidentify these forward looking statements by using wordsdevelopments in our industries;including ‘‘may,’’ ‘‘will,’’ ‘‘should,’’ ‘‘could,’’ ‘‘expect,’’ ‘‘anticipate,’’
‘‘believe,’’ ‘‘plan,’’ ‘‘intend,’’ ‘‘estimate,’’ ‘‘continue’’ and similar• weather conditions and the impact of crop and animalexpressions. These forward looking statements are subject to a
disease on our business;number of risks, uncertainties, assumptions and other factorsthat could cause our actual results, performance, prospects or
• global and regional economic, agricultural, financial andopportunities to differ materially from those expressed in, orcommodities market, political, social and health conditions;implied by, these forward looking statements. These factors
include the risks, uncertainties, trends and other factors • operational risks, including industrial accidents and naturaldiscussed under the headings ‘‘Item 1A. Risk Factors,’’ as well disasters; andas ‘‘Item 1. Business,’’ ‘‘Item 7. Management’s Discussion andAnalysis of Financial Condition and Results of Operations,’’ and • other factors affecting our business generally.elsewhere in this Annual Report on Form 10-K, including:
In light of these risks, uncertainties and assumptions, you• changes in governmental policies and laws affecting our should not place undue reliance on any forward looking
business, including agricultural and trade policies and statements contained in this Annual Report on Form 10-K.environmental, tax and biofuels regulation; Additional risks that we may currently deem immaterial or that
are not presently known to us could also cause the forward• our funding needs and financing sources; looking events discussed in this Annual Report on Form 10-K
not to occur. Except as otherwise required by federal securities• changes in foreign exchange policy or rates;law, we undertake no obligation to publicly update or reviseany forward looking statements, whether as a result of new• the outcome of pending regulatory and legal proceedings;information, future events, changed circumstances or any otherreason after the date of this Annual Report on Form 10-K.• our ability to complete, integrate and benefit from
acquisitions, divestitures, joint ventures and strategicalliances;
ii 2016 Bunge Annual Report
1
Our Sugar and Bioenergy segment produces and sells sugarPART I and ethanol derived from sugarcane, as well as energy derivedfrom the sugar and ethanol production process, through ourITEM 1. BUSINESSoperations in Brazil. Our operations in this segment alsoinclude global trading and merchandising of sugar and ethanol.References in this Annual Report on Form 10-K to ‘‘Bunge
Limited,’’ ‘‘Bunge,’’ ‘‘the Company,’’ ‘‘we,’’ ‘‘us’’ and ‘‘our’’ refer toOur Fertilizer segment is involved in producing, blending andBunge Limited and its consolidated subsidiaries, unless thedistributing fertilizer products for the agricultural industry incontext otherwise indicates.South America, with production and blending assets andoperations in Argentina and port facilities in Brazil and
BUSINESS OVERVIEW Argentina.
We are a leading global agribusiness and food company with 2016 Summary Operating Highlights. In our Agribusinessintegrated operations that stretch from the farm field to segment in 2016 we continued to expand our global network ofconsumer foods. We believe we are a leading: integrated assets. We formed joint ventures with leading
regional players in Brazil and Asia-Pacific, to increase• global oilseed processor and producer of vegetable oils and operating, marketing and logistics synergies and announced
protein meals, based on processing capacity; the acquisition of oilseed processing plants and operations inthe Netherlands and France. In addition, we continued• global grain processor, based on volume;upgrading and expanding an existing port terminal in theUnited States, completed the construction of an oilseed• seller of packaged vegetable oils worldwide, based on sales;processing plant in Ukraine and progressed on theconstruction of an oilseed processing plant in Asia-Pacific. In• producer and seller of wheat flours and bakery mixes andour Food and Ingredients businesses, we acquired a vegetabledry milled corn products in North and South America, basedoil blends producer for large-scale commercial customers,on volume; andbased in Germany. In addition, we announced the acquisitions
• producer of sugar and ethanol in Brazil and global trader of a leading olive oil and seed oil producer in Turkey and aand merchandiser of sugar, based on volume. leading corn flour producer in North America. We also
completed the construction of a wheat mill in Rio de JaneiroWe conduct our operations in five segments: Agribusiness, state, Brazil. In our Sugar and Bioenergy segment, ourEdible Oil Products, Milling Products, Sugar and Bioenergy and sugarcane milling operations benefitted from higher globalFertilizer. We refer to the Edible Oil and Milling Products sugar prices and improved domestic market conditions insegments collectively as our Food and Ingredients businesses. Brazil, as well as lower costs and greater efficiency due to ourOur strategy is to profitably grow our position in our core grain continuous performance improvement initiatives.and oilseed value chains, capitalizing on our integrated globalfootprint and key origination, logistics, processing and risk HISTORY AND CORPORATE INFORMATIONmanagement competencies while pursuing operationalexcellence. We also are focused on growing our value added Bunge Limited is a limited liability company formed under theFood and Ingredients businesses so that over time they laws of Bermuda. We are registered with the Registrar ofrepresent a more significant percentage of our earnings. Our Companies in Bermuda under registration number EC20791.strategy is aligned with long-term global macroeconomic and We trace our history back to 1818 when we were founded as aconsumer growth trends, including a commitment to trading company in Amsterdam, The Netherlands. We are asustainability. holding company, and substantially all of our operations are
conducted through our subsidiaries. Our principal executiveOur Agribusiness segment is an integrated, global business offices and corporate headquarters are located at 50 Mainprincipally involved in the purchase, storage, transport, Street, White Plains, New York, 10606, United States of Americaprocessing and sale of agricultural commodities and and our telephone number is (914) 684-2800. Our registeredcommodity products. Our Agribusiness operations and assets office is located at 2 Church Street, Hamilton, HM 11,are located in North and South America, Europe and Bermuda.Asia-Pacific, and we have merchandising and distributionoffices throughout the world.
AGRIBUSINESS
Our Food and Ingredients businesses, which consist of twoOverview. Our Agribusiness segment is an integrated, global
reportable business segments: Edible Oil Products and Milling business involved in the purchase, storage, transport,Products, include businesses that produce and sell edible oil processing and sale of agricultural commodities andbased products, including vegetable oils, shortenings, commodity products while managing risk across variousmargarines and mayonnaise and milled grain products such as product lines. The principal agricultural commodities that wewheat flours, bakery mixes, corn-based products and rice. The handle in this segment are oilseeds, primarily soybeans,operations and assets of our Edible Oil Products segment are rapeseed, canola and sunflower seed, and grains, primarilylocated in North and South America, Europe and Asia-Pacific wheat and corn. We process oilseeds into vegetable oils andand the operations and assets of our Milling Products segment protein meals, principally for the food, animal feed andare located in North and South America.
2016 Bunge Annual Report 1
2
biodiesel industries, through a global network of facilities. Our weather, government programs and policies and farmerfootprint is well balanced, with approximately 35% of our planting and selling decisions, our operations in major cropprocessing capacity located in South America, 28% in growing regions globally have enabled us to source adequateNorth America, 23% in Europe and 14% in Asia-Pacific. raw materials for our operational needs.
Customers. We sell agricultural commodities and processed Competition. Due to their commodity nature, markets for ourcommodity products to customers throughout the world. The products are highly competitive and subject to productprincipal purchasers of our oilseeds, grains and oilseed meal substitution. Competition is principally based on price, quality,are animal feed manufacturers, livestock producers, wheat and product and service offerings and geographic location. Majorcorn millers and other oilseed processors. As a result, our competitors include but are not limited to: The Archer Danielsagribusiness operations generally benefit from global demand Midland Co. (‘‘ADM’’), Cargill Incorporated (‘‘Cargill’’), Louisfor protein, primarily for poultry and pork products. The Dreyfus Group (‘‘Louis Dreyfus’’), Glencore International PLCprincipal purchasers of the unrefined vegetable oils produced and large regional companies such as Wilmar Internationalin this segment are our own Food and Ingredients businesses Limited and COFCO Agri Limited (‘‘COFCO’’) largely inand third-party edible oil processing companies, which use Asia-Pacific.these oils as raw materials in the production of edible oilproducts for the food service, food processor and retail FOOD AND INGREDIENTSmarkets. In addition, we sell oil products for various non-fooduses, including industrial applications and the production of Overview. Our Food and Ingredients businesses include twobiodiesel. reportable business segments: Edible Oil Products and Milling
Products. We primarily sell our products to three customerDistribution and Logistics. We have developed an extensive types or market channels: food processors, food serviceglobal logistics network to transport our products, including companies and retail outlets. The principal raw materials usedtrucks, railcars, river barges and ocean freight vessels. Typically, in our Food and Ingredients businesses are various crude andwe either lease the transportation assets or contract with third further processed vegetable oils in our Edible Oil Productsparties for these services. To better serve our customer base segment, and wheat, corn and rice in our Milling Productsand develop our global distribution and logistics capabilities, segment. These raw materials are agricultural commodities thatwe own or operate either directly or through joint venture we either produce or purchase from third parties. We believearrangements, various port terminal facilities globally, including that our global integrated business model enables us to realizein Brazil, Argentina, the United States, Canada, Russia, Ukraine, synergies between our Agribusiness and Food and IngredientsPoland, Vietnam and Australia. operations through raw material procurement, logistics, risk
management and co-location of industrial facilities, enabling usFinancial Services and Activities. We also offer various financial to supply customers with reliable, high quality products on aservices, principally trade structured finance and financial risk global basis. Additionally, our Food and Ingredients businessesmanagement services for customers and other third parties. are focused on capitalizing on growing global consumer foodOur trade structured finance operations leverage our trends, including a desire for less processed, healthier foods,international trade flows to generate trade finance derived interest in new flavors and increases in snacking and eatingliquidity in emerging markets for customers and other third outside the home.parties. Our financial risk management services includestructuring and marketing over-the-counter (‘‘OTC’’) risk
Edible Oil Productsmanagement products to enable agricultural producers andend users of commodities to manage their commodity price
Products. Our edible oil products include packaged and bulkrisk exposures. Through our Financial Services Group we also oils, shortenings, margarines, mayonnaise and other productsengage in proprietary trading of foreign exchange and other derived from the vegetable oil refining process. We primarilyfinancial instruments. Additionally, in Brazil, we provide use soybean, sunflower, rapeseed and canola oil that wefinancing services to farmers from whom we purchase produce in our Agribusiness segment oilseed processingsoybeans and other agricultural commodities. Our farmer operations as raw materials in this business. We are a leadingfinancing activities are an integral part of our grain and oilseed seller of packaged vegetable oils worldwide, based on sales.origination activities as they help assure the annual supply of We have edible oil refining and packaging facilities in Northraw materials for our Brazilian agribusiness operations. America, South America, Europe and Asia-Pacific. Our edible
oil products business is largely business to business (‘‘B2B’’)Biodiesel. We own and operate biodiesel facilities in Europefocused in North America, in Brazil and Europe it is a mix ofand Brazil and have equity method investments in biodieselB2B and business to consumer (‘‘B2C’’), and in Asia-Pacific itproducers in Europe and Argentina. This business isis largely a B2C focused business.complementary to our core Agribusiness operations as in each
case we supply some of the raw materials (crude vegetable oilIn Brazil, our retail edible oil brands include Soya, the leadingand soybean meal) used in their production processes.packaged vegetable oil brand, as well as Primor and Salada.We are also a leading producer in the Brazilian margarineRaw Materials. We purchase oilseeds and grains either directlymarket with our brands Delicia and Primor, as well as infrom farmers or indirectly through intermediaries. Although themayonnaise with our Soya, Primor and Salada brands. Inavailability and price of agricultural commodities may, in anyshortenings, we are a leading supplier to the food processorgiven year, be affected by unpredictable factors such as
2 2016 Bunge Annual Report

3
market. We also produce processed tomato and other staple Competition. Competition is based on a number of factors,food products, including sauces, condiments and seasonings in including price, raw material procurement, distributionBrazil under several brand names. capabilities and cost structure, brand recognition, product
quality, innovation, technical support, new productIn the United States and Canada, we offer our customers high introductions, composition and nutritional value and advertisingquality solutions to fit their goals, such as reducing trans-fats and promotion. Our products may compete with widelyor lowering saturated fats. Our products include Nutra-Clear NT advertised, well-known, branded products, as well as privateUltra, a high oleic canola oil that is trans-fat free and low in label and customized products. In the United States andsaturated fats and Pro-Formance NT, a high oleic soybean oil Canada, our principal competitors in the Edible Oil Productsthat is highly stable and trans-fat free. We have also developed segment include ADM, Cargill, Stratas Foods LLC, Unilever NV/proprietary fiber addition processes that allow bakery and food PLC (‘‘Unilever’’) and Ventura Foods LLC. In Brazil, our principalprocessor customers to achieve significant reductions in competitors also include ADM, Cargill, Imcopa, BRF S.A. andsaturated fats in shortenings. We also offer expeller pressed JBS S.A. In Europe, our principal competitors include ADM,and physically refined oils to food service customers under the Cargill, Unilever and various local companies in each country.brand Whole Harvest and also produce margarines and butteryspreads, including our leading brand Country Premium, for food Milling Productsservice, food processor and retail private label customers.
Products. Our Milling Products segment activities include theIn Europe, we are a leader in consumer packaged vegetable production and sale of a variety of wheat flours and bakeryoils, which are sold in various geographies under brand names mixes in Brazil and Mexico, corn-based products in the Unitedincluding Venusz, Floriol, Kujawski, Olek, Unisol, Ideal, Oleina, States and Mexico derived from the corn dry milling processMaslenitsa, Oliwier, Salat and Rozumnitsa, and a leader in and milled rice products in the United States and Brazil.margarines, including our brand names Smakowita, MasloRosline, Masmix, Optima, Deli Reform, Keiju, Evesol, Linco, Our brands in Brazil include Suprema, Soberana, Primor andGottgott, Suvela and Finuu. Most recently, we have introduced Predileta wheat flours and Gradina, and Pre-Mescla bakeryOptima margarine with DHA for consumers interested in premixes. Our wheat flour and bakery mix brands in Mexicoadding omega-3 fatty acids to their diets. Additionally, we have include Espiga, Esponja, Francesera, Chulita, Galletera andintroduced first cold pressed oils and spice and herb enhanced Pastelera. Our corn milling products consist primarily ofproducts under our Deli Reform brand. dry-milled corn meals, flours and flaking and brewer’s grits, as
well as soy-fortified corn meal, corn-soy blend and otherWith the acquisition of a majority share in Walter Rau Neusser similar products. As part of our corn portfolio, we also sellOl und Fett Aktiengesellschaft (‘‘Walter Rau Neusser’’) in 2016, whole grain and fiber ingredients. In the United States, wea leading oils & fats producer in Germany, we are now a have most recently added ancient grains, such as quinoa andsignificant oils supplier in the West European foodservice millet to our portfolio. We have also introduced a range ofchannel. We also supply a range of refined seed oils (sunflower extruded products that include die cut pellets for the snackand rapeseed) in bulk formats to industrial food processors food industry. Additionally, we offer non-GMO products in thewho are among the leading brand owners in the global food United States, including corn varieties. We mill and sell bulkindustry. and packaged rice in the United States and also sell branded
rice in Brazil under the Primor brand.In December 2016, we announced the acquisition of Ana GydaYhtiyac Maddeleri ve Sanayi Ticaret A.S (‘‘Ana Gyda’’), a In August 2016, we announced the acquisition of a controllingleading Turkish olive oil and seed oil producer. Ana Gyda is the interest in Grupo Minsa, S.A.B. de C.V. (‘‘Minsa’’), a leadingowner of Komili, the market leading olive oil brand in Turkey. corn flour producer in North America. As part of theThe transaction closed on February 21, 2017. transaction, Bunge will control four mills in Mexico and two in
the United States, which produce a broad portfolio of brandedIn India, our brands include Dalda, Ginni and Chambal in edible corn flours and pre-mixes for tortillas and other products. Theoils; Dalda and Gagan in vanaspati; and Masterline in transaction is expected to close in the first half of 2017, subjectprofessional bakery fats. In China, our edible oil brand is Dou to certain closing conditions, including the resolution ofWei Jia. In Asia-Pacific, we recently entered into distribution pending litigation brought by a former shareholder of thearrangements to sell and distribute packaged softseed oils and parent company of Minsa challenging the proposed acquisition.coconut oil.
Customers. The primary customers for our wheat millingCustomers. Our customers include baked goods companies, products are food processing, bakery and food servicesnack food producers, restaurant chains, foodservice companies. The primary customers for our corn millingdistributors and other food manufacturers who use vegetable products are companies in the food-processing sector, such asoils and shortenings as ingredients in their operations, as well cereal, snack, bakery and brewing companies, as well as theas grocery chains, wholesalers, distributors and other retailers U.S. Government for humanitarian assistance programs. Ourwho sell to consumers under our brand names or under private rice milling business sells to customers in the food service andlabels. These customers include global and national food food processing channels, as well as for export markets.processors and manufacturers, many of which are leadingbrand owners in their product categories.
2016 Bunge Annual Report 3

4
Competition. Competition is based on a variety of factors, Our mills are supplied with sugarcane grown on approximatelyincluding price, raw material procurement, brand recognition, 326,000 hectares of land. This land represents approximatelyproduct quality, nutritional profile, dietary trends and 19,000 hectares of land that we own, 211,000 hectares of landdistribution capabilities. In Brazil, our major competitors are that we manage under agricultural partnership arrangementsGlencore, M. Dias Branco, J.Macedo and Moinho Anaconda, as and 96,000 hectares of land farmed by third-party farmers. Inwell as many small regional producers. Our major competitors 2016, approximately 67% of our total milled sugarcane camein North American corn milling include Cargill, Didion Milling from our owned or managed plantations and 33% wasCompany, SEMO Milling, LLC and Life Line Foods, LLC. Our purchased from third-party suppliers. Payments under themajor competitors in our U.S. rice milling business include agricultural partnership agreements and third-party supplyADM and Farmers’ Rice Cooperative. Our major competitors in contracts are based on a formula, which factors in the volumeMexico include Grupo Elizondo, Molinera de Mexico and Grupo of sugarcane per hectare, sucrose content of the sugarcaneTrimex. and market prices for sugarcane, which are set by Consecana,
the Sao Paulo state sugarcane, sugar and ethanol council.SUGAR AND BIOENERGY
Our sugarcane planting and harvesting processes aresubstantially mechanized. Mechanized harvesting does notOverview. We are a leading, integrated producer of sugar andrequire burning of the cane prior to harvesting, significantlyethanol in Brazil, and a leading global trader and merchandiserreducing the environmental impact when compared to manualof sugar. We own and operate eight sugarcane mills in Brazil,harvesting, and resulting in improved soil condition.the world’s largest producer and exporter of sugar. As of
December 31, 2016, our mills had a total crushing capacity ofLogistics. Harvested sugarcane is loaded onto trucks andapproximately 21 million metric tons per year. Sugarcane,trailers and transported to our mills. Since the sucrose contentwhich is the raw material that we use to produce sugar andof the sugarcane begins to degrade rapidly after harvesting, weethanol, is supplied by a combination of our own plantationsseek to minimize the time and distance between the cutting ofand third-party farmers. Additionally, through cogenerationthe cane and its delivery to our mills for processing.facilities at our sugarcane mills, we produce electricity from the
burning of sugarcane bagasse (the fibrous portion of the Products. Our mills allow us to produce ethanol, sugar andsugarcane that remains after the extraction of sugarcane juice) electricity, as further described below. At mills that producein boilers, which enables our mills to meet their energy both sugar and ethanol, we are able to adjust our productionrequirements. Any surplus electricity is sold to the local grid or mix within certain capacity limits between ethanol and sugar,other large third-party users of electricity. Our trading and as well as, for certain mills, between different types of sugarmerchandising operations engage in marketing and selling (raw and crystal) and ethanol (hydrous and anhydrous). Thesugar through regional marketing offices in various locations ability to adjust our production mix allows us to respond toand managing the sugar price risk for our business. changes in customer demand and market prices.
Since 2014, after our decision of reducing the capital allocated Sugar. Our current maximum sugar production capacity isto this business and focusing our investments primarily on 5,900 metric tons per day, which in a season of 5,000 hours ofagricultural productivity increase and industrial yields, the milling, results in an annual maximum production capacity ofbusiness has experienced a significant turnaround. The approximately 1.2 million metric tons of sugar. We produce twostrengthening of our sugarcane milling operations in Brazil, types of sugar: very high polarity (‘‘VHP’’) raw sugar and whitebringing the operating costs down and efficiencies up resulted crystal sugar. VHP sugar is similar to the raw sugar traded onin significantly improved results. The early stage of an major commodities exchanges, including the standard NY11anticipated cycle of higher sugar prices and changes in the contract, and is sold almost exclusively for export. Crystal sugarfuel policy for the domestic market should contribute to further is a non-refined white sugar and is principally soldimprovement of our results. Additionally, as previously domestically in Brazil.announced, we are continuing to explore alternatives to reduce
Ethanol. Our current maximum ethanol production capacity isour exposure to the Brazilian sugarcane industry. However, the6,200 cubic meters per day, which in a season of 5,000 hoursnature and timing of any potential outcome or transaction isof milling, results in an annual maximum production capacityuncertain and cannot be predicted.of over 1.3 million cubic meters of ethanol. We produce and
Raw Materials. Sugarcane is our principal raw material in this sell two types of ethanol: hydrous and anhydrous. Hydroussegment, and we both produce it and procure it through third- ethanol is consumed directly as a transport fuel, whileparty supply contracts. The annual harvesting cycle in Brazil anhydrous ethanol is blended with gasoline in transport fuels.typically begins in late March/early April and ends in late
Electricity. We generate electricity from burning sugarcaneNovember/early December. Once planted, sugarcane isbagasse in our mills. As of December 31, 2016, our totalharvested for five to seven years on average, but the yieldinstalled cogeneration capacity was approximately 322decreases with each harvest over the life cycle of the cane. Asmegawatts, with approximately 131 megawatts available fora result, after this period, old sugarcane plants are typicallyresale to third parties after supplying our mills’ energyremoved and the area is replanted. The quality and yield of therequirements, representing approximately 596,000 megawattharvested cane are also affected by factors such as soil quality,hours of electricity available for resale.topography, weather and agricultural practices.
4 2016 Bunge Annual Report
5
Customers. The sugar we produce at our mills is sold in both is readily available in the international market from multiplethe Brazilian domestic and export markets. Our domestic sources.customers are primarily in the confectionary and food
Competition. Competition is based on a number of factors,processing industries. The ethanol we produce is primarily soldincluding delivered price, product offering and quality, location,to customers for use in the Brazilian domestic market to meetaccess to raw materials, production efficiency and customerthe demand for fuel. We also export ethanol in the internationalservice, including, in some cases, customer financing terms.market. Our sugar trading and merchandising operationsOur main competitors in our fertilizer operations in Argentinapurchase and sell sugar and ethanol from our own operationsare ASP (Agrium), YPF, Profertil, Nidera, Yara International andas well as third parties to meet international demand.Louis Dreyfus.
Other. We have a minority investment in a U.S. corn basedethanol production facility and a 50% interest in a joint venture RISK MANAGEMENTthat produces corn based ethanol in Argentina. We have a
Risk management is a fundamental aspect of our business.49.9% interest in a joint venture with TerraVia Holdings, Inc.Engaging in the hedging of risk exposures and anticipating(formerly Solazyme, Inc.) for the development and productionmarket developments are critical to protect and enhance ourof value added oils and feed ingredients, which uses sugarreturn on assets. As such, we are active in derivative marketssupplied by one of our mills as a raw material.for agricultural commodities, energy, ocean freight, foreign
Competition. We compete with other sugar and ethanol currency and interest rates. We seek to leverage the marketproducers in Brazil and internationally, and in the global market insights that we gain through our global operations across ourwith beet sugar processors, producers of other sweeteners and businesses by actively managing our physical and financialother biofuels producers. The industry is highly competitive, positions on a daily basis. See ‘‘Item 7A. Quantitative andwith raw material procurement, cost structure, selling price and Qualitative Disclosures About Market Risk.’’distribution capabilities being important competitive factors.Our major competitors in Brazil include Cosan Limited/Raizen, INSURANCESao Martinho S.A., Biosev (Louis Dreyfus) and ED&F Man. Ourmajor international competitors include British Sugar PLC, In each country where we conduct business, our operationsSudzucker AG, Cargill, Tereos Group, Sucden Group and and assets are subject to varying degrees of risk andCOFCO. uncertainty. We insure our businesses and assets in each
country in a manner that it deems appropriate for a companyFERTILIZER of our size and activities, based on an analysis of the relative
risks and costs. We believe that our geographic dispersion ofOverview. Through our operations in Argentina, we produce, assets helps mitigate risk to our business from an adverseblend and distribute a range of NPK fertilizers, including event affecting a specific facility; however, if we were to incur aphosphate-based liquid and solid nitrogen fertilizers. NPK significant loss or liability for which we were not fully insured,refers to nitrogen (N), phosphate (P) and potassium (K), the it could have a materially adverse effect on our business,main components of chemical fertilizers, used for crop financial condition and results of operations.production primarily of soybeans, corn and wheat. Ouroperations in Argentina are closely linked to our grain OPERATING SEGMENTS AND GEOGRAPHIC AREASorigination activities as we supply fertilizer to producers whosupply us with grain. We also have a 75% controlling interest in We have included financial information about our reportablea single super phosphate production (‘‘SSP’’) plant and a segments and our operations by geographic area in Note 26 ofstrategically located river port facility in Argentina. In Brazil, we the notes to our consolidated financial statements.supply fertilizer to farmers as part of our grain originationactivities, and operate a fertilizer terminal in the Port of Santos. RESEARCH AND DEVELOPMENT, INNOVATION, PATENTS AND
LICENSESProducts and Services. We offer a complete fertilizer portfolio,including SSP, ammonia, urea and ammonium thiosulfate that Our research and development activities are focused onwe produce, as well as monoammonium phosphate (‘‘MAP’’), developing products and improving processes that will drivediammonium phosphate, triple supersphosphate, urea, UAN, growth or otherwise add value to our core business operations.ammonium sulfate and potassium chloride that we purchase In our Food and Ingredients business, we have nine researchfrom third parties and resell. We market our products under and development centers globally dedicated to supportingthe Bunge brand, as well as the Solmix brand for liquid product development and enhancement. Additionally, ourfertilizers. global innovation activities involve scouting, developing, buying,
selling and/or licensing next generation technologies in food,Raw Materials. Our principal raw materials in this segment arefeed and fuel.concentrated phosphate rock, sulfuric acid, natural gas,
ammonium nitrate and sulphur. The prices of fertilizer raw Our total research and development expenses were $17 millionmaterials are typically based on international prices that reflect for the year 2016, $16 million for the year 2015 and $20 millionglobal supply and demand factors and global transportation for the year 2014. As of December 31, 2016, our research andand other logistics costs. Each of these fertilizer raw materials development organization consisted of 119 employees
worldwide.
2016 Bunge Annual Report 5

6
We own trademarks on the majority of the brands we produce and our facilities are subject to periodic inspection byin our Food and Ingredients and Fertilizer businesses. We governmental agencies. In addition, we are subject to othertypically obtain long-term licenses for the remainder. We have laws and government policies affecting the food andpatents covering some of our products and manufacturing agriculture industries, including food and feed safety,processes. However, we do not consider any of these patents nutritional and labeling requirements and food security policies.to be material to our business. We believe we have taken From time-to-time, agricultural production shortfalls in certainappropriate steps to either own or license all intellectual regions and growing demand for agricultural commodities forproperty rights that are material to carrying out our business. feed, food and fuel use have caused prices for relevant
agricultural commodities to rise. High commodity prices andregional crop shortfalls have led, and in the future may lead,SEASONALITYgovernments to impose price controls, tariffs, export restrictions
In our Agribusiness segment, while there is a degree of and other measures designed to assure adequate domesticseasonality in the growing season and procurement of our supplies and/or mitigate price increases in their domesticprincipal raw materials, such as oilseeds and grains, we markets, as well as increase the scrutiny of competitivetypically do not experience material fluctuations in volume conditions in their markets.between the first and second half of the year since we are
Many countries globally are using and producing biofuels asgeographically diversified between the northern and southernalternatives to traditional fossil fuels. Biofuels convert crops,hemispheres, and we sell and distribute products throughoutsuch as sugarcane, corn, soybeans, palm, rapeseed or canolathe year. However, the first fiscal quarter of the year hasand other oilseeds, into ethanol or biodiesel to extend, enhancegenerally been our weakest in terms of financial results due toor substitute for fossil fuels. Production of biofuels hasthe timing of the North and South American oilseed harvestsincreased significantly in the last decade in response to bothas the North American harvest peaks in the third and fourthperiods of high fossil fuel prices and to government incentivesfiscal quarters and the South American harvest peaks in thefor the production of biofuels offered in many countries,second fiscal quarter, and thus our North and South Americanincluding the United States, Brazil, Argentina and manygrain merchandising and oilseed processing activities areEuropean countries. Furthermore, in several countries,generally at lower levels during the first quarter.governmental authorities are mandating biofuels use in
In our Food and Ingredients segments, demand for certain of transport fuel at specified levels. As such, the markets forour food items may be influenced by holidays and other annual agricultural commodities used in the production of biofuelsevents. have become increasingly affected by the growth of the
biofuels industry and related legislation.We experience seasonality in our Sugar and Bioenergy segmentas a result of the Brazilian sugarcane growing cycle. In the ENVIRONMENTAL MATTERS AND SUSTAINABILITYCenter-South of Brazil, the sugarcane harvesting periodtypically begins in late March/early April and ends in late We incorporate a commitment to sustainability into many of theNovember/early December. This creates fluctuations in our areas of our business; from how we plan and develop oursugar and ethanol inventories, which usually peak in December strategic goals and operate our facilities, to how we doto cover sales between crop harvests. These factors result in business with our suppliers and customers and engage withearnings being weighted towards the second half of the year. our communities. Our philosophy is to ‘‘Act, Conserve andThis segment is also impacted by the yield development of the Engage’’ and our efforts include policies and initiatives tosugarcane crops over the course of the crop year with sugar reduce deforestation, conserve resources in our operations andcontent reaching its highest level in the middle of the crop. As engage across our sector to address the sustainabilitya result of the above factors, there may be significant challenges in the agribusiness and food value chain.variations in our results of operations from one quarter toanother. We are subject to various environmental protection and
occupational health and safety laws and regulations in theIn our Fertilizer segment, we are subject to seasonal trends countries in which we operate. Our operations may emit orbased on the South American agricultural growing cycle as release certain substances, which may be regulated or limitedfarmers typically purchase the bulk of their fertilizer needs in by applicable laws and regulations. In addition, we handle andthe second half of the year. dispose of materials and wastes classified as hazardous or
toxic by one or more regulatory agencies. Our operations areGOVERNMENT REGULATION also subject to laws relating to environmental licensing of
facilities, restrictions on land use in certain protected areas,We are subject to a variety of laws in each of the countries in forestry reserve requirements, limitations on the burning ofwhich we operate which govern various aspects of our sugarcane and water use. We incur costs to comply withbusiness, including the processing, handling, storage, transport health, safety and environmental regulations applicable to ourand sale of our products; risk management activities; land-use activities and have made and expect to make substantialand ownership of land, including laws regulating the capital expenditures on an ongoing basis to continue to ensureacquisition or leasing of rural properties by certain entities and our compliance with environmental laws and regulations.individuals; and environmental, health and safety matters. To However, due to our extensive operations across multipleoperate our facilities, we must obtain and maintain numerous industries and jurisdictions globally, we are exposed to the riskpermits, licenses and approvals from governmental agencies
6 2016 Bunge Annual Report

7
of claims and liabilities under environmental regulations. In addition, you may read and copy any materials we file withViolation of these laws and regulations can result in substantial the SEC at the SEC’s Public Reference Room at 100 F Street,fines, administrative sanctions, criminal penalties, revocations N.E., Washington, D.C. 20549 and may obtain information onof operating permits and/or shutdowns of our facilities. the operation of the Public Reference Room by calling the SEC
at 1-800-SEC-0330. The SEC maintains a website that containsAdditionally, our business could be affected in the future by reports, proxy and information statements, and otherregulation or taxation of greenhouse gas emissions or policies information regarding issuers that file electronically. The SECrelated to national emission reduction plans. It is difficult to website address is www.sec.gov.assess the potential impact of any resulting regulation ofgreenhouse gas emissions. Potential consequences could EXECUTIVE OFFICERS AND KEY EMPLOYEES OF THE COMPANYinclude increased energy, transportation and raw materialcosts, and we may be required to make additional investments Set forth below is certain information concerning the executiveto modify our facilities, equipment and processes. As a result, officers and key employees of the company.the effects of additional climate change regulatory initiativescould have adverse impacts on our business and results of NAME POSITIONoperations. Compliance with environmental laws and
Soren Schroder Chief Executive Officerregulations did not materially affect our earnings or competitive Todd Bastean Chief Executive Officer, Bunge North Americaposition in 2016. Thomas Boehlert Executive Vice President - Chief Financial
OfficerDeborah Borg Executive Vice President - Chief HumanEMPLOYEES
Resources OfficerGordon Hardie Managing Director, Food & IngredientsAs of December 31, 2016, we had approximately 32,000Enrique Humanes Chief Executive Officer, Bunge Southern Coneemployees. Many of our employees are represented by laborTommy Jensen Chief Executive Officer, Bunge Europe, Middleunions, and their employment is governed by collective East & Africa
bargaining agreements. In general, we consider our employee David Kabbes General Counsel and Managing Director,relations to be good. Corporate Affairs
Pierre Mauger Chief Development OfficerRaul Padilla Chief Executive Officer, Bunge Brazil andAVAILABLE INFORMATION
Managing Director, Sugar & BioenergyBrian Thomsen Managing Director, Bunge Global AgribusinessOur website address is www.bunge.com. Through the
and Chief Executive Officer, Bunge Product Lines‘‘Investors: SEC Filings’’ section of our website, it is possible toaccess our periodic report filings with the Securities and Soren Schroder, 55. Mr. Schroder has been our Chief ExecutiveExchange Commission (‘‘SEC’’) pursuant to Section 13(a) or Officer since June 1, 2013. Prior to his current position, he was15(d) of the Securities Exchange Act of 1934, as amended (the the Chief Executive Officer of Bunge North America since April‘‘Exchange Act’’), including our Annual Report on Form 10-K, 2010. Previously, he served as Vice President of Agribusinessquarterly reports on Form 10-Q and current reports on for Bunge Europe since June 2006 and in a variety ofForm 8-K, and any amendments to those reports. These reports agribusiness leadership roles at the company in the Unitedare made available free of charge. Also, filings made pursuant States and Europe since joining Bunge in 2000. Prior to joiningto Section 16 of the Exchange Act with the SEC by our Bunge, he worked for over 15 years at Continental Grain andexecutive officers, directors and other reporting persons with Cargill. Mr. Schroder is a member of Rabobank International’srespect to our common shares are made available, free of North American Agribusiness Advisory Board. He holds acharge, through our website. Our periodic reports and bachelor’s degree in Economics from Connecticut College.amendments and the Section 16 filings are available throughour website as soon as reasonably practicable after such Todd Bastean, 50. Mr. Bastean became Chief Executive Officer,report, amendment or filing is electronically filed with or Bunge North America, in June 2013. He started his career atfurnished to the SEC. Bunge in 1994 and became Chief Financial Officer of Bunge
North America in 2010. Before assuming that role, he served asThrough the ‘‘Investors: Corporate Governance’’ section of our Vice President and General Manager of Bunge North America’swebsite, it is possible to access copies of the charters for our Milling and Biofuels business units, and as Vice President andAudit Committee, Compensation Committee, Finance and Risk Chief Administrative Officer of its Grain and Milling businessPolicy Committee, Corporate Governance and Nominations units. He also held positions in strategic planning and auditing.Committee and Sustainability and Corporate Responsibility Prior to joining Bunge, he worked for KPMG Peat Marwick.Committee. Our corporate governance guidelines and our Code Mr. Bastean holds a B.S. in Accounting from Western Illinoisof Conduct are also available in this section of our website. University.Each of these documents is made available, free of charge,
Thomas Boehlert, 57. Mr. Boehlert assumed the role of Chiefthrough our website.Financial Officer on January 1, 2017. Previously, he was Chief
The foregoing information regarding our website and its Executive Officer, President and a Director of First Nickel Inc.content is for your convenience only. The information contained from 2011 to 2015. First Nickel entered Canadian receivershipin or connected to our website is not deemed to be in August 2015. Prior to that, he was Chief Financial Officer forincorporated by reference in this report or filed with the SEC. Kinross Gold Corporation from 2006 to 2011 and served as
Chief Financial Officer for several energy companies, including
2016 Bunge Annual Report 7

8
Texas Genco, Direct Energy and Sithe Energies, Inc. Previously, Bunge in 2003, he held leadership positions at Animex S.A. inMr. Boehlert spent 14 years in banking with Credit Suisse, Poland, a subsidiary of Smithfield Foods, Continental Grain inwhere his focus was on the electric power, natural resources Poland and Germany, and Jyske Bank A/S in Denmark. He hasand infrastructure sectors, and where he built and headed the a Bachelor’s degree in Finance from Aarhus School of Businessfirm’s London-based project finance business covering Europe, at Aarhus University, Denmark, and has completed theAfrica and the Middle East. He started his career as an auditor Advanced Management Program at Harvard Business School.at a KPMG predecessor firm in 1983. Mr. Boehlert is a Certified
David Kabbes, 54. Mr. Kabbes became General Counsel andPublic Accountant and holds a B.A. in Accounting from IndianaManaging Director, Corporate Affairs in February 2015 afterUniversity and an M.B.A. in Finance from New York University.serving as Senior Vice President, Corporate and Legal Affairs
Deborah Borg, 40. Ms. Borg assumed the role of Chief Human for Bunge North America since 2000, where he oversaw theResources Officer in January 2016. She joined Bunge from legal, government and industry affairs, communications, foreignDow Chemical, where she served as President Dow USA, a role trade support and environmental functions. Prior to joiningin which she was responsible for regional business strategy Bunge in 2000, he was Executive Vice President, Secretary andand external relationships with customers, government General Counsel at Purina Mills, a corporate attorney at Kochorganizations and joint venture partners. She started her career Industries, Inc., a partner at Schiff Hardin & Waite and anat Dow in 2000 as Human Resources Manager for Australia / associate at Thompson Coburn. He received a bachelor’sNew Zealand, and went on to hold regional and business HR degree in business from Quincy University and a law degreeroles in Asia, Europe and North America. She also served as from the University of Illinois.Global HR Director, Marketing and Sales, and led the Human
Pierre Mauger, 44. Mr. Mauger has served as ChiefCapital Planning and Development function for Dow focusingDevelopment Officer since September 2013. Prior to joiningon talent acquisition, retention, diversity and development.Bunge, Mr. Mauger was a partner at McKinsey & Company,Previously, Ms. Borg served in HR and talent development roleswhere he led the firm’s agriculture service line in Europe, thewith General Motors Australia. She holds a Bachelor ofMiddle East and Africa from 2009 to 2013, overseeing clientBusiness Management in Human Resources and a Master inrelationships with leading global companies in the commodityTraining and Change Management from Victoria University,processing and trading, agrochemicals and fertilizer sectors, asAustralia.well as with governments. Prior to that, he served as a partner
Gordon Hardie, 53. Mr. Hardie has served as Managing in the firm’s consumer goods practice. He joined McKinsey asDirector, Food & Ingredients since July 2011. Prior to joining an associate in 2000. Mr. Mauger previously worked as anBunge, Mr. Hardie founded Morningside Partners, a corporate auditor at Nestle and KPMG. He holds a B.Sc. in Economicsstrategy and M&A advisory firm focused on the food and and Business Finance from Brunel University in the Unitedbeverage industries in 2009. Prior to that, from 2003 to 2009, Kingdom and an M.B.A. from INSEAD.he led the Fresh Baking Division of Goodman Fielder Ltd, the
Raul Padilla, 61. Mr. Padilla became Chief Executive Officer ofleading producer of bakery brands in Australia and NewBunge Brazil in May 2014. He has also served as ManagingZealand, and held leadership roles at companies in a variety ofDirector, Sugar and Bioenergy, since September 2014. Prior tointernational markets, including as Group General Manager,that, he served as Managing Director, Bunge GlobalMarketing at Southcorp Wines; Vice President, Asia-Pacific,Agribusiness and Chief Executive Officer, Bunge Product LinesMiddle East and Africa at Fosters Group International; andsince July 2010. Prior to that, he was Chief Executive Officer ofRegional Director, Americas & Asia-Pacific at Pernod Ricard.Bunge Argentina since 1999, having joined the company inHe holds a Bachelor’s degree in European Language and1997 as Commercial Director. Mr. Padilla has over 30 years ofPsychology from the National University of Ireland, Universityexperience in the oilseed processing and grain handlingCollege Cork and an M.B.A. from the University College Dublin,industries in Argentina, beginning his career with La PlataMichael Smurfit Graduate School of Business.Cereal in 1977. He has served as President of the Argentine
Enrique Humanes, 57. Mr. Humanes has served as Chief National Oilseed Crushers Association, Vice President of theExecutive Officer of Bunge Argentina since February 2011 and International Association of Seed Crushers and Director of thepreviously served as interim Chief Executive Officer of Bunge Buenos Aires Cereal Exchange and the Rosario FuturesArgentina since July 2010. He started his career at the Exchange. Mr. Padilla is a graduate of the University of Buenoscompany in 2000 as the Operations Director of Bunge Aires.Argentina. Prior to joining Bunge, he served in industrial roles
Brian Thomsen, 50. Mr. Thomsen became Managing Director,at Unilever and Dow Chemical. He holds an undergraduateBunge Global Agribusiness and Chief Executive Officer, Bungedegree in chemical engineering from the Technology UniversityProduct Lines in May 2014. Previously, he served as Managingof Rosario, a postgraduate degree in Process ManagementDirector, Global Grains and Oilseeds Product Lines. He joinedAdministration from Rice University and an M.B.A. from IDEAthe company in 2004 as Director, Grains Product Line. Prior toin Argentina.Bunge, Mr. Thomsen was Managing Director, Dry Commodity
Tommy Jensen, 55. Mr. Jensen has served as Chief Executive Trading at Nidera, and previously served in global trading andOfficer of Bunge Europe, Middle East and Africa (‘‘Bunge management roles at Cargill. He started his career in 1988 atEMEA’’) since May 2012 and previously served as Bunge Aarhus Oil, a Danish crush and refining company, and is aEMEA’s Chief Operating Officer, Vice President, Northern and graduate of the International Academy of Business in Aarhus,Central Europe and Managing Director, Poland. Prior to joining Denmark.
8 2016 Bunge Annual Report

9
We face intense competition in each of our businesses.ITEM 1A. RISK FACTORS
We face significant competition in each of our businesses andRISK FACTORSwe have numerous competitors, some of which are larger and
Our business, financial condition or results of operations could have greater financial resources than we have. As many of thebe materially adversely affected by any of the risks and products we sell are global commodities, the markets for ouruncertainties described below. Additional risks not presently products are highly price competitive and in many casesknown to us, or that we currently deem immaterial, may also sensitive to product substitution. In addition, to competeimpair our financial condition and business operations. See effectively, we must continuously focus on improving efficiency‘‘Cautionary Statement Regarding Forward Looking Statements.’’ in our production and distribution operations, as well as
developing and maintaining appropriate market share andcustomer relationships. We also compete for talent in ourRISKS RELATING TO OUR BUSINESS AND INDUSTRIESindustries, particularly commercial personnel. Competition could
Adverse weather conditions, including as a result of future cause us to lose market share and talented employees, exitclimate change, may adversely affect the availability, quality certain lines of business, increase marketing or otherand price of agricultural commodities and agricultural expenditures or reduce pricing, each of which could have ancommodity products, as well as our operations and operating adverse effect on our business and profitability.results.
We are subject to fluctuations in agricultural commodity andAdverse weather conditions have historically caused volatility in other raw material prices caused by other factors outside ofthe agricultural commodity industry and consequently in our our control that could adversely affect our operating results.operating results by causing crop failures or significantlyreduced harvests, which may affect the supply and pricing of Prices for agricultural commodities and their by-products,the agricultural commodities that we sell and use in our including, among others, soybeans, corn, wheat, sugar andbusiness, reduce demand for our fertilizer products and ethanol, like those of other commodities, are often volatile andnegatively affect the creditworthiness of agricultural producers sensitive to local and international changes in supply andwho do business with us. demand caused by factors outside of our control, including
farmer planting and selling decisions, government agricultureAdditionally, our sugar production depends on the volume and programs and policies, global inventory levels, demand forsucrose content of the sugarcane that we cultivate or that is biofuels, weather and crop conditions and demand for andsupplied to us by third-party growers. Both sugarcane crop supply of, competing commodities and substitutes. Theseyields and sucrose content depend significantly on weather factors may cause volatility in our operating results.conditions, such as rainfall and prevailing temperatures, whichcan vary substantially. Adverse weather conditions can also Our fertilizer business may also be adversely affected byimpair our ability to harvest and transport sugarcane to our fluctuations in the prices of agricultural commodities andmills, leading to decreased productivity and higher production fertilizer raw materials that are caused by market factorscosts. As a result, unfavorable weather conditions have had beyond our control. Increases in fertilizer prices due to higherand could in the future have a material adverse effect on our raw material costs have in the past and could in the futuresugar operations. adversely affect demand for our fertilizer products. Additionally,
as a result of competitive conditions in our Food andSevere adverse weather conditions, such as hurricanes or Ingredients and Fertilizer segments, we may not be able tosevere storms, may also result in extensive property damage, recoup increases in raw material costs through increases inextended business interruption, personal injuries and other loss sales prices for our products, which may adversely affect ourand damage to us. Our operations also rely on dependable and profitability.efficient transportation services. A disruption in transportationservices, as a result of weather conditions or otherwise, may
We are vulnerable to the effects of supply and demandalso significantly adversely impact our operations.imbalances in our industries.
Additionally, the potential physical impacts of climate changeHistorically, the market for some of our agriculturalare uncertain and may vary by region. These potential effectscommodities and fertilizer products has been cyclical, withcould include changes in rainfall patterns, water shortages,periods of high demand and capacity utilization stimulatingchanging sea levels, changing storm patterns and intensities,new plant investment and the addition of incrementaland changing temperature levels that could adversely impactprocessing or production capacity by industry participants toour costs and business operations, the location and costs ofmeet the demand. The timing and extent of this expansion mayglobal agricultural commodity production and the supply andthen produce excess supply conditions in the market, which,demand for agricultural commodities. These effects could beuntil the supply/demand balance is again restored, negativelymaterial to our results of operations, liquidity or capitalimpacts product prices and operating results. During times ofresources.reduced market demand, we may suspend or reduceproduction at some of our facilities. The extent to which weefficiently manage available capacity at our facilities will affectour profitability.
2016 Bunge Annual Report 9

10
Fluctuations in energy prices could adversely affect our Brazil, and proceedings regarding the violation of federaloperating results. budget laws resulted in the impeachment of former Brazilian
President Dilma Rousseff. The weakened economic and politicalOur operating costs and selling prices of certain of our situation and outlook in Brazil has adversely affected consumerproducts are sensitive to changes in energy prices. Our confidence levels and spending, which has led to significantlyindustrial operations utilize significant amounts of electricity, reduced demand for products in our Food and Ingredientsnatural gas and coal, and our transportation operations are businesses in the country. The timing of any economicdependent upon diesel fuel and other petroleum-based improvement is uncertain, and there can be no assurance thatproducts. Significant increases in the cost of these items could economic and political conditions will not deteriorate further inadversely affect our operating costs and results. the near term. Additionally, a slowdown in China’s economy
over a prolonged period could lead to reduced demand forWe also sell certain biofuel products, such as ethanol and agricultural commodities. To the extent that such economic andbiodiesel, which are closely related to, or may be substituted political conditions negatively impact consumer and businessfor, petroleum products. As a result, the selling prices of confidence and consumption patterns or volumes, our businessethanol and biodiesel can be impacted by the selling prices of and results of operations could be significantly and adverselyoil, gasoline and diesel fuel. In turn, the selling prices of the affected.agricultural commodities and commodity products that we sell,such as corn and vegetable oils that are used as feedstocks for We are subject to economic, political and other risks of doingbiofuels, are also sensitive to changes in the market price for business globally and in emerging markets.biofuels, and consequently world petroleum prices as well.Prices for petroleum products and biofuels are affected by We are a global business with a substantial majority of ourmarket factors and government fuel policies, over which we assets and operations located outside the United States. Inhave no control. Lower prices for oil, gasoline or diesel fuel addition, part of our strategy involves expanding our businesscould result in decreased selling prices for ethanol, biodiesel in several emerging market regions, including Eastern Europe,and their raw materials, which could adversely affect our Asia-Pacific, the Middle East and Africa. Volatile internationalrevenues and operating results. Additionally, the prices of economic, political and market conditions may have a negativesugar and sugarcane-based ethanol are also correlated, and, impact on our operating results and our ability to achieve ourtherefore, a decline in world sugar prices may also adversely business strategies.affect the selling price of the ethanol we produce in Brazil.
Due to the international nature of our business, we areWe are subject to global and regional economic downturns exposed to currency exchange rate fluctuations. Changes inand related risks. exchange rates between the U.S. dollar and other currencies,
particularly the Brazilian real, the Argentine peso, the euro andThe level of demand for our products is affected by global and certain Eastern European currencies affect our revenues andregional demographic and macroeconomic conditions, expenses that are denominated in local currencies, affect farmincluding population growth rates and changes in standards of economics in those regions and may also have a negativeliving. A significant downturn in global economic growth, or impact on the value of our assets located outside of the Unitedrecessionary conditions in major geographic regions, may lead States.to reduced demand for agricultural commodities, which couldadversely affect our business and results of operations. We are also exposed to other risks of international operations,
including:Additionally, weak global economic conditions and adverseconditions in global financial and capital markets, including • adverse trade policies or trade barriers on agriculturalconstraints on the availability of credit, have in the past commodities and commodity products;adversely affected, and may in the future adversely affect, the
• inflation and hyperinflationary economic conditions andfinancial condition and creditworthiness of some of ouradverse economic effects resulting from governmentalcustomers, suppliers and other counterparties, which in turnattempts to control inflation, such as imposition of wage andmay negatively impact our financial condition and results ofprice controls and higher interest rates;operations. See ‘‘Item 7. Management’s Discussion and
Analysis of Financial Condition and Results of Operations’’ and• changes in laws and regulations or their interpretation or‘‘Item 7A. Quantitative and Qualitative Disclosures About
enforcement in the countries where we operate, such as taxMarket Risk’’ for more information.laws, including the risk of future adverse tax regulation inthe United States relating to our status as a BermudaFor example, after a period of accelerated economic expansion,company;Brazil’s economic growth rates began to decline over the past
four years, with the country experiencing recessions in 2015• difficulties in enforcing agreements or judgments andand 2016, while facing increasing inflation. Weak
collecting receivables in foreign jurisdictions;macroeconomic conditions in Brazil are expected to continueinto 2017. At the same time, ongoing, high profile political
• sovereign risk;corruption scandals have led to criminal charges being filedagainst various prominent business and political figures in
10 2016 Bunge Annual Report

11
• exchange controls or other currency restrictions and Additionally, continuing efforts to change the regulation oflimitations on the movement of funds, such as on the financial markets, including the U.S. Dodd-Frank Act andremittance of dividends by subsidiaries; European regulations, may subject large users of derivatives,
such as Bunge, to extensive new oversight and regulation.• inadequate infrastructure; Such initiatives could impose significant additional costs on us,
including operating and compliance costs, and could materially• government intervention, including through expropriation, or affect the availability, as well as the cost and terms, of certain
regulation of the economy or natural resources, including transactions. Future governmental policies, regulations orrestrictions on foreign ownership of land or other assets; actions affecting our industries may adversely affect the supply
of, demand for and prices of our products, restrict our ability to• the requirement to comply with a wide variety of foreign and do business and cause our financial results to suffer.
United States laws and regulations that apply to internationaloperations, including, without limitation, economic sanctions
Increases in commodity prices can increase the scrutiny toregulations, labor laws, import and export regulations,which we are subject under antitrust laws.anti-corruption and anti-bribery laws, as well as other laws
or regulations discussed in this ‘‘Item 1A. Risk Factors’’ We are subject to antitrust and competition laws in varioussection; countries throughout the world. We cannot predict how these
laws or their interpretation, administration and enforcement will• challenges in maintaining an effective internal controlchange over time, particularly in periods of significant priceenvironment with operations in multiple internationalincreases in our industries. Changes or developments inlocations, including language differences, varying levels ofantitrust laws globally, or in their interpretation, administrationU.S. Generally Accepted Accounting Principles (‘‘U.S. GAAP’’)or enforcement, may limit our existing or future operations andexpertise in international locations and multiple financialgrowth. Increases in food and fertilizer prices have in the pastinformation systems; andresulted in increased scrutiny of our industries under antitrustand competition laws in Europe, Brazil and other jurisdictions• labor disruptions, civil unrest, significant political instability,and increase the risk that these laws could be interpreted,wars or other armed conflict or acts of terrorism.administered or enforced in a manner that could affect ouroperations or impose liability on us in a manner that couldThese risks could adversely affect our operations, businesshave a material adverse effect on our operating results andstrategies and operating results. Additionally, recent events,financial condition.including the 2016 U.S. presidential election and potential
future changes in U.S. and global trade policies are creating alevel of uncertainty for multinational companies. As we We may be adversely affected by a shortage of sugarcane orcontinue to operate and expand our business globally, our by high sugarcane costs.success will depend, in part, on our ability to anticipate,
Sugarcane is our principal raw material used in the productionrespond to and effectively manage these and other changesof ethanol and sugar. Our ability to secure an adequate supplyand risks.of sugarcane depends on our ability to negotiate and maintainsatisfactory land rights and supply contracts with third parties.Government policies and regulations, particularly thoseCurrently, approximately 94% of the land we use for sugarcaneaffecting the agricultural sector and related industries, couldsupply is not owned by us, with such land typically managedadversely affect our operations and profitability.through agricultural partnership agreements having an averageremaining term of four years. We cannot guarantee that theseAgricultural commodity production and trade flows areagreements will be renewed after their respective terms or thatsignificantly affected by government policies and regulations.any such renewals will be on terms and conditions satisfactoryGovernmental policies affecting the agricultural industry, suchto us. A significant shortage of sugarcane supply or increase inas taxes, tariffs, duties, subsidies, import and export restrictionsthe cost of available sugarcane, including as a result of theon agricultural commodities and commodity products andtermination of our partnership or supply contracts or theenergy policies (including biofuels mandates), can influenceinability to enter into alternative arrangements on economicindustry profitability, the planting of certain crops versus otherterms, would likely have an adverse effect on our business anduses of agricultural resources, the location and size of cropfinancial performance, and such effect could be material.production, whether unprocessed or processed commodity
products are traded and the volume and types of imports andexports. In addition, international trade disputes can adversely We may not realize the anticipated benefits of acquisitions,affect agricultural commodity trade flows by limiting or divestitures or joint ventures.disrupting trade between countries or regions.
We have been an active acquirer of other companies, and weIncreases in prices for, among other things, food, fuel and crop have joint ventures with several partners. Part of our strategyinputs, such as fertilizers, have become the subject of involves acquisitions, alliances and joint ventures designed tosignificant discussion by governmental bodies and the public expand and enhance our business. Our ability to benefit fromthroughout the world in recent years. In some countries, this acquisitions, joint ventures and alliances depends on manyhas led to the imposition of policies such as price controls, factors, including our ability to identify suitable prospects,tariffs and export restrictions on agricultural commodities. access funding sources on acceptable terms, negotiate
2016 Bunge Annual Report 11

12
favorable transaction terms and successfully consummate and personnel. Additionally, expected cost savings or otherintegrate any businesses we acquire. In addition, we may anticipated efficiencies or benefits from divestitures may alsodecide, from time to time, to divest certain of our assets or be difficult to achieve or maximize.businesses. Our ability to successfully complete a divestiture
Additionally, we have several joint ventures and investmentswill depend on, among other things, our ability to identifywhere we may have limited control over governance, financialbuyers that are prepared to acquire such assets or businessesreporting and operations. As a result, we face certainon acceptable terms and to adjust and optimize our retainedoperating, financial and other risks relating to thesebusinesses following the divestiture.investments, including risks related to the financial strength of
Our acquisition or divestiture activities may involve our joint venture partners or their willingness to provideunanticipated delays, costs and other problems. If we adequate funding for the joint venture, having differingencounter unexpected problems with one of our acquisitions, objectives from our partners, the inability to implement somealliances or divestitures, our senior management may be actions with respect to the joint venture’s activities that we mayrequired to divert attention away from other aspects of our believe are favorable if the joint venture partner does notbusinesses to address these problems. Additionally, we may fail agree, compliance risks relating to actions of the joint ventureto consummate proposed acquisitions or divestitures, after or our partners and the risk that we will be unable to resolveincurring expenses and devoting substantial resources, disputes with the joint venture partner. As a result, theseincluding management time, to such transactions. investments may contribute significantly less than anticipated
to our earnings and cash flows.Acquisitions also pose the risk that we may be exposed tosuccessor liability relating to actions by an acquired company We are subject to industry and other risks that couldand its management before the acquisition. The due diligence adversely affect our reputation and financial results.we conduct in connection with an acquisition, and anycontractual guarantees or indemnities that we receive from the We are subject to food and feed industry risks which include,sellers of acquired companies, may not be sufficient to protect but are not limited to, spoilage, contamination, tampering orus from, or compensate us for, actual liabilities. A material other adulteration of products, product liability claims andliability associated with an acquisition could adversely affect recalls and government regulation, regarding matters such asour reputation and results of operations and reduce the food and feed safety, nutritional standards and geneticallybenefits of the acquisition. Additionally, acquisitions involve modified organisms. We are also subject to shifts in customerother risks, such as differing levels of management and internal and consumer preferences and concerns regarding thecontrol effectiveness at the acquired entities, systems outbreak of disease associated with livestock and poultry,integration risks, the risk of impairment charges relating to including avian or swine influenza. These risks could not onlygoodwill and intangible assets recorded in connection with adversely affect our business and operating results but alsoacquisitions, the risk of significant accounting charges resulting our corporate reputation.from the completion and integration of a sizeable acquisition,the need to fund increased capital expenditures and working As a company whose products comprise staple food and feedcapital requirements, our ability to retain and motivate products sold globally, maintaining a good corporate reputationemployees of acquired entities and other unanticipated is critical to our continued success. Reputational value is basedproblems and liabilities. in large part on perceptions, which can shift rapidly in
response to negative incidents. The failure or alleged failure toDivestitures may also expose us to potential liabilities or claims maintain high standards for quality, safety, integrity,for indemnification, as we may be required to retain certain environmental sustainability and social responsibility, includingliabilities or indemnify buyers for certain matters, including with respect to raw materials and services obtained fromenvironmental or litigation matters, associated with the assets suppliers, even if untrue, may result in tangible effects, such asor businesses that we sell. The magnitude of any such retained reduced demand for our products, disruptions to ourliability or indemnification obligation may be difficult to quantify operations, increased costs and loss of market share toat the time of the transaction, and its cost to us could competitors. Our reputation and results of operations couldultimately exceed the proceeds we receive for the divested also be adversely impacted by changing consumer preferencesassets or businesses. Divestitures also have other inherent and perceptions relating to some of the products we sell, suchrisks, including possible delays in closing transactions as with regard to the quantity and type of fats, sugars and(including potential difficulties in obtaining regulatory grains consumed as well as concerns regarding geneticallyapprovals), the risk of lower-than-expected sales proceeds for modified crops. Failure to anticipate, adapt or respondthe divested businesses and unexpected costs or other effectively to these trends or issues may result in materialdifficulties associated with the separation of the businesses to adverse effects on our business, financial condition, and resultsbe sold from our information technology and other systems of operations.and management processes, including the loss of key
12 2016 Bunge Annual Report

13
We are subject to environmental, health and safety regulation obligations to us, our financial condition, results of operationsin numerous jurisdictions. We may be subject to substantial or cash flows could be materially and adversely affected.costs, liabilities and other adverse effects on our business
In Brazil, where there are limited third-party financing sourcesrelating to these matters.available to farmers, we provide financing to farmers from
Our operations are regulated by environmental, health and whom we purchase soybeans and other agriculturalsafety laws and regulations in the countries where we operate, commodities through prepaid commodity purchase contractsincluding those governing the labeling, use, storage, discharge and advances, which are generally intended to be short-term inand disposal of hazardous materials. These laws and nature and are typically secured by the farmer’s crop and aregulations require us to implement procedures for the mortgage on the farmer’s land and other assets to provide ahandling of hazardous materials and for operating in potentially means of repayment in the potential event of crop failure orhazardous conditions and they impose liability on us for the shortfall. At December 31, 2016 and 2015, respectively, we hadcleanup of environmental contamination. In addition to approximately $966 million and $847 million in outstandingliabilities arising out of our current and future operations for prepaid commodity purchase contracts and advances towhich we have ongoing processes to manage compliance with farmers. We are exposed to the risk that the underlying cropregulatory obligations, we may be subject to liabilities for past will be insufficient to satisfy a farmer’s obligation under theoperations at current facilities and in some cases to liabilities financing arrangements as a result of weather and cropfor past operations at facilities that we no longer own or growing conditions, and other factors that influence the price,operate. We may also be subject to liabilities for operations of supply and demand for agricultural commodities. In addition,acquired companies. We may incur material costs or liabilities any collateral held by us as part of these financing transactionsto comply with environmental, health and safety requirements. may not be sufficient to fully protect us from loss.In addition, our industrial activities can result in seriousaccidents that could result in personal injuries, facility We are a capital intensive business and depend on cashshutdowns, reputational harm to our business and/or the provided by our operations as well as access to externalexpenditure of significant amounts to remediate safety issues financing to operate and expand our business.or repair damaged facilities.
We require significant amounts of capital to operate ourIn addition, continued government and public emphasis in business and fund capital expenditures. In addition, ourcountries where we operate on environmental issues, including working capital needs are directly affected by the prices ofclimate change, conservation and natural resource agricultural commodities, with increases in commodity pricesmanagement, have resulted in and could result in new or more generally causing increases in our borrowing levels. We arestringent forms of regulatory oversight of our industries, also required to make substantial capital expenditures toincluding increased environmental controls, land-use maintain, upgrade and expand our extensive network ofrestrictions affecting us or our suppliers and other conditions storage facilities, processing plants, refineries, mills, logisticsthat could have a material adverse effect on our business, assets and other facilities to keep pace with competitivefinancial condition and results of operations. For example, developments, technological advances and safety andcertain aspects of our business and the larger food production environmental standards. Furthermore, the expansion of ourchain generate carbon emissions. The imposition of regulatory business and pursuit of acquisitions or other businessrestrictions on greenhouse gas emissions, which may include opportunities may require us to have access to significantlimitations on greenhouse gas emissions, other restrictions on amounts of capital. If we are unable to generate sufficient cashindustrial operations, taxes or fees on greenhouse gas flows or raise sufficient external financing on attractive termsemissions and other measures, could affect land-use decisions, to fund these activities, including as a result of a tightening inthe cost of agricultural production and the cost and means of the global credit markets, we may be forced to limit ourprocessing and transporting of our products, which could operations and growth plans, which may adversely impact ouradversely affect our business, cash flows and results of competitiveness and, therefore, our results of operations.operations.
As of December 31, 2016, we had $5,015 million unused andavailable borrowing capacity under various committedWe are exposed to credit and counterparty risk relating tolong-term credit facilities and $4,264 million in total debt. Ourour customers in the ordinary course of business. Indebt could limit our ability to obtain additional financing, limitparticular, we advance capital and provide other financingour flexibility in planning for, or reacting to, changes in thearrangements to farmers in Brazil and, as a result, ourmarkets in which we compete, place us at a competitivebusiness and financial results may be adversely affected ifdisadvantage compared to our competitors that are lessthese farmers are unable to repay the capital advanced toleveraged than we are and require us to dedicate more cashthem.on a relative basis to servicing our debt and less to developing
We have various credit terms with customers, and our our business. This may limit our ability to run our business andcustomers have varying degrees of creditworthiness, which use our resources in the manner in which we would like.exposes us to the risk of non-payment or other default under Furthermore, difficult conditions in global credit or financialour contracts and other arrangements with them. In the event markets generally could adversely impact our ability tothat we experience significant defaults on their payment refinance maturing debt or the cost or other terms of such
refinancing, as well as adversely affect the financial position of
2016 Bunge Annual Report 13

14
the lenders with whom we do business, which may reduce our disruptions in logistics or information systems, as well asability to obtain financing for our operations. See ‘‘Item 7. natural disasters, pandemics, acts of terrorism and otherManagement’s Discussion and Analysis of Financial Condition external factors over which we have no control. While weand Results of Operations – Liquidity and Capital Resources.’’ insure ourselves against many of these types of risks in
accordance with industry standards, our level of insurance mayOur credit ratings are important to our liquidity. While our debt not cover all losses. The loss of, or damage to, any of ouragreements do not have any credit rating downgrade triggers facilities could have a material adverse effect on our business,that would accelerate the maturity of our debt, a reduction in results of operations and financial condition.our credit ratings would increase our borrowing costs and,depending on their severity, could impede our ability to obtain Our information technology systems and processes maycredit facilities or access the capital markets in the future on suffer a significant breach or disruption that may adverselyfavorable terms. A significant increase in our borrowing costs affect our ability to conduct our business.could impair our ability to compete effectively in our businessrelative to competitors with higher credit ratings. Our information technology systems, some of which are
dependent on services provided by third parties, provide criticalOur risk management strategies may not be effective. data and services for internal and external users, including
procurement and inventory management, transactionOur business is affected by fluctuations in agricultural processing, financial, commercial and operational data, humancommodity prices, transportation costs, energy prices, interest resources management, legal and tax compliance informationrates and foreign currency exchange rates. We engage in and other information and processes necessary to operate andhedging transactions to manage these risks. However, our manage our business. Our information technology andexposures may not always be fully hedged and our hedging infrastructure may experience attacks by hackers, breaches orstrategies may not be successful in minimizing our exposure to other failures or disruptions that could compromise ourthese fluctuations. In addition, our risk management strategies systems and the information stored there. While we havemay seek to position our overall portfolio relative to expected implemented security measures and disaster recovery plansmarket movements. While we have implemented a broad range designed to protect the security and continuity of our networksof control procedures and policies to mitigate potential losses, and critical systems, these measures may not adequatelythey may not in all cases successfully protect us from losses prevent adverse events such as breaches or failures fromthat have the potential to impair our financial position. See occurring or mitigate their severity if they do occur. If our‘‘Item 7A. Quantitative and Qualitative Disclosures About information technology systems are breached, damaged or failMarket Risk.’’ to function properly due to any number of causes, such as
security breaches or cyber based attacks, systemsWe may not be able to achieve the efficiencies, savings and implementation difficulties, catastrophic events or powerother benefits anticipated from our cost reduction, margin outages, and our security, contingency disaster recovery orimprovement and other business optimization initiatives. other risk mitigation plans do not effectively mitigate these
occurrences on a timely basis, we may experience a materialWe are continually implementing programs throughout the disruption in our ability to manage our business operations, ascompany to reduce costs, increase efficiencies and enhance well as significant costs and lost business opportunities untilour business. Initiatives currently in process or implemented in they are remediated. We may also be subject to legal claims orthe past several years include the outsourcing of certain proceedings, liability under laws that protect the privacy ofadministrative activities in several regions, the rationalization of personal information, potential regulatory penalties and damagemanufacturing operations globally, including the closing of to our reputation. These impacts may adversely impact ourfacilities, and the implementation of operational improvement business, results of operations and financial condition, as wellprogram in our Food and Ingredients businesses. Unexpected as our competitive position.delays, increased costs, adverse effects on our internal controlenvironment, inability to retain and motivate employees or Changes in tax laws or exposure to additional tax liabilitiesother challenges arising from these initiatives could adversely could have a material impact on our financial condition andaffect our ability to realize the anticipated savings or other results of operationsintended benefits of these activities.
We are subject to income taxes as well as non-income taxes inThe loss of or a disruption in our manufacturing and various jurisdictions throughout the world. Tax authorities maydistribution operations or other operations and systems could disagree with certain positions we have taken and assessadversely affect our business. additional taxes, along with interest and penalties. We regularly
assess the likely outcomes of these audits in order to assessWe are engaged in manufacturing and distribution activities on the appropriateness of our tax assets and liabilities. However,a global scale, and our business depends on our ability to the calculation of such liabilities involves significant judgmentexecute and monitor, on a daily basis, a significant number of in the interpretation of complex tax regulations in manytransactions across numerous markets or geographies. As a jurisdictions. Therefore, any dispute with a taxing authority mayresult, we are subject to the risks inherent in such activities, result in a payment or outcome that is significantly differentincluding industrial accidents, environmental events, fires, from current estimates. There can be no assurance that we willexplosions, strikes and other labor or industrial disputes and accurately predict the outcomes of these audits and the actual
14 2016 Bunge Annual Report
15
outcomes of these audits could have a material impact on our We have anti-takeover provisions in our bye-laws that mayconsolidated earnings and financial condition in the periods in discourage a change of control.which they are recognized.
Our bye-laws contain provisions that could make it moreAdditionally, changes in tax laws could materially impact our difficult for a third party to acquire us without the consent oftax rate and the monetization of recoverable tax assets our Board of Directors. These provisions provide for:(indirect tax credits). For example, various proposals involving
• directors to be removed without cause at any special generalU.S. corporate tax reform could have a material impact on ourmeeting only upon the affirmative vote of at least 66% of allfinancial condition and results of operations. The recent effortsvotes attaching to all shares then in issue entitling thein corporate tax transparency by the Organization of Economicholder to attend and vote on the resolution;Cooperation and Development (‘‘OECD’’) resulting in additional
mandated disclosures will likely cause additional scrutiny on• restrictions on the time period in which directors may bethe Company’s tax positions and potentially increased tax
nominated;liabilities.
• our Board of Directors to determine the powers, preferencesRISKS RELATING TO OUR COMMON SHARES and rights of our preference shares and to issue the
preference shares without shareholder approval; andWe are a Bermuda company, and it may be difficult toenforce judgments against us and our directors and executive • an affirmative vote of at least 66% of all votes attaching toofficers. all shares then in issue entitling the holder to attend and
vote on the resolution for some business combinationWe are a Bermuda exempted company. As a result, the rightstransactions, which have not been approved by our Board ofof holders of our common shares will be governed by BermudaDirectors.law and our memorandum of association and bye-laws. The
rights of shareholders under Bermuda law may differ from the These provisions, as well as any additional anti-takeoverrights of shareholders of companies or corporations measures our Board of Directors could adopt in the future,incorporated in other jurisdictions, including the United States. could make it more difficult for a third party to acquire us,Several of our directors and some of our officers are even if the third party’s offer may be considered beneficial bynon-residents of the United States, and a substantial portion of many shareholders. As a result, shareholders may be limited inour assets and the assets of those directors and officers are their ability to obtain a premium for their shares.located outside the United States. As a result, it may bedifficult to effect service of process on those persons in the
ITEM 1B. UNRESOLVED STAFF COMMENTSUnited States or to enforce in the U.S. judgments obtained inU.S. courts against us or those persons based on civil liability Not applicable.provisions of the U.S. securities laws. It is doubtful whethercourts in Bermuda will enforce judgments obtained in other
ITEM 2. PROPERTIESjurisdictions, including the United States, against us or ourdirectors or officers under the securities laws of those
The following tables provide information on our principaljurisdictions or entertain actions in Bermuda against us or ouroperating facilities as of December 31, 2016.directors or officers under the securities laws of other
jurisdictions.FACILITIES BY BUSINESS AREA
Our bye-laws restrict shareholders from bringing legal actionAGGREGATE DAILY AGGREGATEagainst our officers and directors.
PRODUCTION STORAGEOur bye-laws contain a broad waiver by our shareholders of (metric tons) CAPACITY CAPACITYany claim or right of action, both individually and on our behalf,
Business Areaagainst any of our officers or directors. The waiver applies toany action taken by an officer or director, or the failure of an Agribusiness 146,236 17,354,480officer or director to take any action, in the performance of his
Food and Ingredients 101,213 1,932,970or her duties, except with respect to any matter involving anySugar and Bioenergy 112,493 806,521fraud or dishonesty on the part of the officer or director. This
waiver limits the right of shareholders to assert claims against Fertilizer 16,004 995,133our officers and directors unless the act, or failure to act,involves fraud or dishonesty.
2016 Bunge Annual Report 15

16
FACILITIES BY GEOGRAPHIC REGION lease that expires in June 2025. We also own or lease otheroffice space for our operations worldwide.
AGGREGATE DAILY AGGREGATE We believe that our facilities are adequate to address ourPRODUCTION STORAGE operational requirements.
(metric tons) CAPACITY CAPACITY
Region ITEM 3. LEGAL PROCEEDINGSNorth America 104,972 6,666,770 We are subject to various legal proceedings and risks globallySouth America 192,999 10,797,758 in the course of our business, including claims, suits, and
government investigations involving competition, tax, labor andEurope 50,246 2,667,311employment, commercial disputes and other matters. Although
Asia-Pacific 27,729 957,265 we cannot accurately predict the amount of any liability thatmay ultimately arise with respect to any of these matters, we
Agribusiness make provisions for potential liabilities when we deem themprobable and reasonably estimable. These provisions are based
In our Agribusiness segment, we have 174 commodity storage on current information and legal advice and are adjusted fromfacilities globally that are located close to agricultural time to time according to developments. We do not expect theproduction areas or export locations. We also have 49 oilseed outcome of these proceedings, net of established reserves, toprocessing plants globally. We have 56 merchandising and have a material adverse effect on our financial condition ordistribution offices throughout the world. results of operations. Due to their inherent uncertainty,
however, there can be no assurance as to the ultimateFood and Ingredients outcome of current or future litigation, proceedings,
investigations or claims and it is possible that a resolution ofIn our Food and Ingredients businesses, we have 105 refining, one or more such proceedings could result in fines andpackaging and milling facilities throughout the world. In penalties that could adversely affect our business, consolidatedaddition, to facilitate distribution in Brazil, we operate 20 financial position, results of operations, or cash flows in adistribution centers. particular period.
For a discussion of certain legal and tax matters relating toSugar and BioenergyArgentina and Brazil, see Notes 13 and 20 to our consolidated
In our Sugar and Bioenergy segment, we have eight sugarcane financial statements included as part of this Annual Report onmills, all of which are located in Brazil within close proximity to Form 10-K. Additionally, we are a party to a large number ofsugarcane production areas. We also manage land through labor and civil claims relating to our Brazilian operations. Weagricultural partnership agreements for the cultivation of have reserved an aggregate of $76 million and $74 million forsugarcane as described under ‘‘Item 1. Business – Sugar and labor and civil claims, respectively, as of December 31, 2016.Bioenergy.’’ The labor claims primarily relate to dismissals, severance,
health and safety, salary adjustments and supplementaryretirement benefits. The civil claims relate to various legalFertilizerproceedings and disputes, including disputes with suppliers
In our Fertilizer segment, we operate four fertilizer processing and customers and include approximately 93 million Brazilianand blending plants in Argentina and fertilizer ports in Brazil reais (approximately $28 million as of December 31, 2016)and Argentina. related to a legacy environmental claim in Brazil.
Other ITEM 4. MINE SAFETY DISCLOSURES
Our corporate headquarters in White Plains, New York, Not applicable.occupies approximately 66,300 square feet of space under a
16 2016 Bunge Annual Report

17
cumulative convertible perpetual preference shares are entitledPART II to annual dividends per share in the amount of $4.875 per yearpayable quarterly, when, as and if declared by the Board ofITEM 5. MARKET FOR REGISTRANT’S COMMONDirectors in accordance with the terms of these shares. AnyEQUITY, RELATED STOCKHOLDER MATTERS ANDfuture determination to pay dividends will, subject to theISSUER PURCHASES OF EQUITY SECURITIES provisions of Bermuda law, be at the discretion of our Board ofDirectors and will depend upon then existing conditions,(a) Market Informationincluding our financial condition, results of operations,contractual and other relevant legal or regulatory restrictions,Our common shares trade on the New York Stock Exchangecapital requirements, business prospects and other factors ourunder the ticker symbol ‘‘BG’’. The following table sets forth, forBoard of Directors deems relevant.the periods indicated, the high and low closing prices of our
common shares, as reported on the New York Stock Exchange.Under Bermuda law, a company’s board of directors may notdeclare or pay dividends from time to time if there are(US$) HIGH LOWreasonable grounds for believing that the company is, or would
2017 after the payment be, unable to pay its liabilities as theybecome due or that the realizable value of its assets wouldFirst quarter (to February 17, 2017) $77.78 $67.81thereby be less than of its liabilities. Under our bye-laws, each
2016 common share is entitled to dividends if, as and whendividends are declared by our Board of Directors, subject toFourth quarter $73.61 $58.64any preferred dividend right of the holders of any preferenceThird quarter 66.21 57.76shares. There are no restrictions on our ability to transfer fundsSecond quarter 67.77 55.62(other than funds denominated in Bermuda dollars) in or out ofFirst quarter 66.82 47.79Bermuda or to pay dividends to U.S. residents who are holders
2015 of our common shares.
Fourth quarter $79.41 $61.81 We paid quarterly dividends on our common shares of $0.38Third quarter 89.86 68.94 per share in the first two quarters of 2016 and $0.42 per shareSecond quarter 92.85 83.16 in the last two quarters of 2016. We paid quarterly dividendsFirst quarter 92.31 78.50 on our common shares of $0.34 per share in the first two
quarters of 2015 and $0.38 per share in the last two quarters(b) Approximate Number of Holders of Common Stock of 2015. We have declared a regular quarterly cash dividend of
$0.42 per share payable on March 2, 2017 to shareholders ofTo our knowledge, based on information provided by record on February 16, 2017.Computershare Investor Services LLC, our transfer agent, as ofDecember 31, 2016, we had 139,500,862 common shares (d) Securities Authorized for Issuance Under Equityoutstanding, which were held by approximately 81 registered Compensation Plansholders.
The following table sets forth certain information, as of(c) Dividends December 31, 2016, with respect to our equity compensation
plans.We intend to pay cash dividends to holders of our commonshares on a quarterly basis. In addition, holders of our 4.875%
(a) (b) (c)WEIGHTED-AVERAGE NUMBER OF SECURITIESEXERCISE PRICE PER REMAINING AVAILABLE FOR
NUMBER OF SECURITIES SHARE OF FUTURE ISSUANCE UNDERTO BE ISSUED UPON OUTSTANDING EQUITY COMPENSATION
EXERCISE OF OPTIONS, PLANS (EXCLUDINGOUTSTANDING OPTIONS, WARRANTS SECURITIES REFLECTED INWARRANTS AND RIGHTS AND RIGHTS COLUMN (A))Plan category
Equity compensation plans approved by shareholders(1) . . . . . . . . . . . . . . . . . . . . . . . . . 7,498,109(2) $69.35(3) 5,880,219(4)
Equity compensation plans not approved by shareholders(5) . . . . . . . . . . . . . . . . . . . . 12,664(6) (7) (8)
Total . . . . . . . . . . . . . . . . . . . . . . . . . . . . . . . . . . . . . . . . . . . . . . . . . . . . . . . . . . . . . . . . . . . . . . . . . . . . . . . . . . . . . . . . . . 7,510,773 $69.35 5,880,219
(1) Includes our 2016 Equity Incentive Plan, 2009 Equity Incentive Plan, Equity Incentive Plan, Non-Employee Directors’ Equity Incentive Plan and 2007 Non-Employee Directors’ EquityIncentive Plan.
(2) Includes non-statutory stock options outstanding as to 5,940,719 common shares, performance-based restricted stock unit awards outstanding as to 1,495,824 common shares and4,025 vested and deferred restricted stock units outstanding (including, for all restricted and deferred restricted stock unit awards outstanding, dividend equivalents payable incommon shares) under our 2009 Equity Incentive Plan. This number also includes non-statutory stock options outstanding as to 9,100 common shares under our 2016 Equity Incentive
2016 Bunge Annual Report 17

1MAR201709590242
18
Plan and 24,028 and 24,413 unvested restricted stock units under our 2007 Non-Employee Directors’ Equity Incentive Plan and 2016 Equity Incentive Plan, respectively. Dividendequivalent payments that are credited to each participant’s account are paid in our common shares at the time an award is settled. Vested deferred restricted stock units are paid atthe time the applicable deferral period lapses.
(3) Calculated based on non-statutory stock options outstanding under our 2016 Equity Incentive Plan, 2009 Equity Incentive Plan, Equity Incentive Plan and our Non-EmployeeDirectors’ Equity Incentive Plan. This number excludes outstanding time-based restricted stock unit and performance-based restricted stock unit awards under the 2016 EquityIncentive Plan, 2009 Equity Incentive Plan and restricted and deferred restricted stock unit awards under the 2007 Non-Employee Directors’ Equity Incentive Plan.
(4) Includes dividend equivalents payable in common shares. Shares available under our 2016 Equity Incentive Plan may be used for any type of award authorized under the plan.Awards under the plan may be in the form of statutory or non-statutory stock options, restricted stock units (including performance-based) or other awards that are based on thevalue of our common shares. Our 2016 Equity Incentive Plan provides that the maximum number of common shares issuable under the plan is 5,800,000, subject to adjustment inaccordance with the terms of the plan. This number also includes shares available for future issuance under our 2007 Non-Employee Directors’ Equity Incentive Plan. Our 2007Non-Employee Directors’ Equity Incentive Plan provides that the maximum number of common shares issuable under the plan may not exceed 600,000, subject to adjustment inaccordance with the terms of the plan. No additional awards may be granted under the Equity Incentive Plan and the Non-Employee Directors’ Equity Incentive Plan.
(5) Includes our Non-Employee Directors’ Deferred Compensation Plan.
(6) Includes rights to acquire 12,664 common shares under our Non-Employee Directors’ Deferred Compensation Plan pursuant to elections by our non-employee directors.
(7) Not applicable.
(8) Our Non-Employee Directors’ Deferred Compensation Plan does not have an explicit share limit.
(e) Performance Graph the quarter ended December 31, 2016. The graph sets thebeginning value of our common shares and the Indices at
The performance graph shown below compares the quarterly $100, and assumes that all dividends are reinvested. All Indexchange in cumulative total shareholder return on our common values are weighted by the capitalization of the companiesshares with the Standard & Poor’s (S&P) 500 Stock Index and included in the Index.the S&P Food Products Index from December 31, 2011 through
Comparison of 5 Year Cumulative Total Return
0
50
100
150
200
250Bunge, Ltd. S&P 500 Index - Total Returns S&P Food Products
Dec-1
1
Mar
-12
Jun-
12
Sep-1
2
Dec-1
2
Mar
-13
Jun-
13
Sep-1
3
Dec-1
3
Mar
-14
Jun-
14
Sep-1
4
Dec-1
4
Mar
-15
Jun-
15
Sep-1
5
Dec-1
5
Mar
-16
Jun-
16
Sep-1
6
Dec-1
6
(f) Purchases of Equity Securities by Registrant and Bunge completed the previous program of $975 million duringAffiliated Purchasers the first quarter of 2015 with the repurchase of 2,460,600
common shares for $200 million.In May 2015, we established a new program for the repurchaseof up to $500 million of our issued and outstanding common Any repurchases may be made from time to time through ashares. The program has no expiration date. Bunge did not variety of means, including in the open market, in privatelyrepurchase any common shares during the fourth quarter negotiated transactions or through other means as determinedended December 31, 2016. Bunge repurchased 3,296,230 by us, and in compliance with applicable legal requirements.common shares for the twelve months ended December 31, The timing and number of any shares repurchased will depend2016 under this program for $200 million. Total repurchases on a variety of factors, including share price and marketunder the program from its inception in May 2015 through conditions, and the program may be suspended orDecember 31, 2016 were 4,707,440 shares for $300 million. discontinued at any time at our discretion.
18 2016 Bunge Annual Report

19
Our consolidated financial statements are prepared in U.S.ITEM 6. SELECTED FINANCIAL DATAdollars and in accordance with U.S. GAAP. The selected
The following table sets forth our selected historical historical financial information as of and for the years endedconsolidated financial information for each of the five periods December 31, 2016, 2015, 2014, 2013 and 2012 are derivedindicated. You should read this information together with from our audited consolidated financial statements and related‘‘Item 7. Management’s Discussion and Analysis of Financial notes. Activities of the Fertilizer segment reported in continuingCondition and Results of Operations’’ and with the operations include our port operations in Brazil, our fertilizerconsolidated financial statements and notes to the consolidated production operations in Argentina and our 50% equity interestfinancial statements included elsewhere in this Annual Report in the Morocco joint venture through the date of its sale.on Form 10-K.
YEAR ENDED DECEMBER 31,(US$ in millions) 2016 2015 2014 2013 2012
Consolidated Statements of Income Data:Net sales . . . . . . . . . . . . . . . . . . . . . . . . . . . . . . . . . . . . . . . . . . . . . . . . . . . . . . . . . . . . . . . . . . . . . . . . . . . . . . . . . . . . . . . . . . . . . . . . . . . . . . . . . . . . . . . . $ 42,679 $ 43,455 $ 57,161 $ 61,347 $ 60,991Cost of goods sold . . . . . . . . . . . . . . . . . . . . . . . . . . . . . . . . . . . . . . . . . . . . . . . . . . . . . . . . . . . . . . . . . . . . . . . . . . . . . . . . . . . . . . . . . . . . . . . . . . . . . (40,269) (40,762) (54,540) (58,587) (58,418)
Gross profit . . . . . . . . . . . . . . . . . . . . . . . . . . . . . . . . . . . . . . . . . . . . . . . . . . . . . . . . . . . . . . . . . . . . . . . . . . . . . . . . . . . . . . . . . . . . . . . . . . . . . . . . . . . . . 2,410 2,693 2,621 2,760 2,573Selling, general and administrative expenses . . . . . . . . . . . . . . . . . . . . . . . . . . . . . . . . . . . . . . . . . . . . . . . . . . . . . . . . . . . . . . . . . . . (1,286) (1,435) (1,691) (1,559) (1,563)Interest income . . . . . . . . . . . . . . . . . . . . . . . . . . . . . . . . . . . . . . . . . . . . . . . . . . . . . . . . . . . . . . . . . . . . . . . . . . . . . . . . . . . . . . . . . . . . . . . . . . . . . . . . 51 43 87 76 53Interest expense . . . . . . . . . . . . . . . . . . . . . . . . . . . . . . . . . . . . . . . . . . . . . . . . . . . . . . . . . . . . . . . . . . . . . . . . . . . . . . . . . . . . . . . . . . . . . . . . . . . . . . . (234) (258) (347) (363) (294)Foreign exchange gains (losses) . . . . . . . . . . . . . . . . . . . . . . . . . . . . . . . . . . . . . . . . . . . . . . . . . . . . . . . . . . . . . . . . . . . . . . . . . . . . . . . . . . . . (8) (8) 47 53 88Other income (expense) – net . . . . . . . . . . . . . . . . . . . . . . . . . . . . . . . . . . . . . . . . . . . . . . . . . . . . . . . . . . . . . . . . . . . . . . . . . . . . . . . . . . . . . . 12 (18) 17 44 (92)Gain on disposition of equity interests and sale of assets . . . . . . . . . . . . . . . . . . . . . . . . . . . . . . . . . . . . . . . . . . . . . . . . . . . 122 47 - 3 85Equity investment impairments . . . . . . . . . . . . . . . . . . . . . . . . . . . . . . . . . . . . . . . . . . . . . . . . . . . . . . . . . . . . . . . . . . . . . . . . . . . . . . . . . . . . (59) - - - -Goodwill and intangible impairments . . . . . . . . . . . . . . . . . . . . . . . . . . . . . . . . . . . . . . . . . . . . . . . . . . . . . . . . . . . . . . . . . . . . . . . . . . . . . (12) (13) - - (514)Gain on acquisition of controlling interest . . . . . . . . . . . . . . . . . . . . . . . . . . . . . . . . . . . . . . . . . . . . . . . . . . . . . . . . . . . . . . . . . . . . . . - - - - 36
Income from continuing operations before income tax . . . . . . . . . . . . . . . . . . . . . . . . . . . . . . . . . . . . . . . . . . . . . . . . . . . . . . 996 1,051 734 1,014 372Income tax (expense) benefit . . . . . . . . . . . . . . . . . . . . . . . . . . . . . . . . . . . . . . . . . . . . . . . . . . . . . . . . . . . . . . . . . . . . . . . . . . . . . . . . . . . . . . (220) (296) (249) (904) 6
Income from continuing operations . . . . . . . . . . . . . . . . . . . . . . . . . . . . . . . . . . . . . . . . . . . . . . . . . . . . . . . . . . . . . . . . . . . . . . . . . . . . . . . 776 755 485 110 378Income (loss) from discontinued operations, net of tax . . . . . . . . . . . . . . . . . . . . . . . . . . . . . . . . . . . . . . . . . . . . . . . . . . . . . . (9) 35 32 97 (342)
Net income . . . . . . . . . . . . . . . . . . . . . . . . . . . . . . . . . . . . . . . . . . . . . . . . . . . . . . . . . . . . . . . . . . . . . . . . . . . . . . . . . . . . . . . . . . . . . . . . . . . . . . . . . . . . . 767 790 517 207 36Net loss (income) attributable to noncontrolling interests . . . . . . . . . . . . . . . . . . . . . . . . . . . . . . . . . . . . . . . . . . . . . . . . . . (22) 1 (2) 99 28
Net income attributable to Bunge . . . . . . . . . . . . . . . . . . . . . . . . . . . . . . . . . . . . . . . . . . . . . . . . . . . . . . . . . . . . . . . . . . . . . . . . . . . . . . . . . 745 791 515 306 64Convertible preference share dividends and other obligations . . . . . . . . . . . . . . . . . . . . . . . . . . . . . . . . . . . . . . . . . . . . . (36) (53) (48) (76) (36)
Net income available to Bunge common shareholders . . . . . . . . . . . . . . . . . . . . . . . . . . . . . . . . . . . . . . . . . . . . . . . . . . . . . . . . $ 709 $ 738 $ 467 $ 230 $ 28
YEAR ENDED DECEMBER 31,(US$, except outstanding share data) 2016 2015 2014 2013 2012
Per Share Data:Earnings per common share – basic(1)
Net income (loss) from continuing operations . . . . . . . . . . . . . . . . . . . . . . . . . . . . . . . . . . . $ 5.13 $ 4.90 $ 2.98 $ 0.91 $ 2.53Net income (loss) from discontinued operations . . . . . . . . . . . . . . . . . . . . . . . . . . . . . . . . (0.06) 0.24 0.22 0.66 (2.34)
Net income (loss) to Bunge common shareholders . . . . . . . . . . . . . . . . . . . . . . . . . . . . . . $ 5.07 $ 5.14 $ 3.20 $ 1.57 $ 0.19
Earnings per common share – diluted(2)
Net income (loss) from continuing operations . . . . . . . . . . . . . . . . . . . . . . . . . . . . . . . . . . . $ 5.07 $ 4.84 $ 2.96 $ 0.90 $ 2.51Net income (loss) from discontinued operations . . . . . . . . . . . . . . . . . . . . . . . . . . . . . . . . (0.06) 0.23 0.21 0.65 (2.32)
Net income (loss) to Bunge common shareholders . . . . . . . . . . . . . . . . . . . . . . . . . . . . . . $ 5.01 $ 5.07 $ 3.17 $ 1.55 $ 0.19
Cash dividends declared per common share . . . . . . . . . . . . . . . . . . . . . . . . . . . . . . . . . . . . . . $ 1.64 $ 1.48 $ 1.32 $ 1.17 $ 1.06
Weighted-average common shares outstanding – basic . . . . . . . . . . . . . . . . . . . . . . . . 139,845,124 143,671,546 146,209,508 147,204,082 146,000,541Weighted-average common shares outstanding – diluted(2) . . . . . . . . . . . . . . . . . . . . 148,226,475 152,238,967 147,230,778 148,257,309 147,135,486
2016 Bunge Annual Report 19

20
YEAR ENDED DECEMBER 31,(US$ in millions) 2016 2015 2014 2013 2012
Consolidated Cash Flow Data:Cash provided by (used for) operating activities . . . . . . . . . . . . . . . . . . . . . . . . . . . . . . . . . . . . . . . . . . . . . . . . . . . . . . . . . . . . . . . . . . . . . . . . . . . $1,904 $ 610 $ 1,399 $ 2,225 $ (457)Cash provided by (used for) investing activities . . . . . . . . . . . . . . . . . . . . . . . . . . . . . . . . . . . . . . . . . . . . . . . . . . . . . . . . . . . . . . . . . . . . . . . . . . . . (926) (802) (685) (429) (967)Cash provided by (used for) financing activities . . . . . . . . . . . . . . . . . . . . . . . . . . . . . . . . . . . . . . . . . . . . . . . . . . . . . . . . . . . . . . . . . . . . . . . . . . . (488) 360 (1,058) (1,565) 1,206
DECEMBER 31,(US$ in millions) 2016 2015 2014 2013 2012
Consolidated Balance Sheet Data:Cash and cash equivalents . . . . . . . . . . . . . . . . . . . . . . . . . . . . . . . . . . . . . . . . . . . . . . . . . . . . . . . . . . . . . . . . . . . . . . . . . . . . . . . . . . . . . . . . . . . . . . . . $ 934 $ 411 $ 362 $ 742 $ 569Inventories(3) . . . . . . . . . . . . . . . . . . . . . . . . . . . . . . . . . . . . . . . . . . . . . . . . . . . . . . . . . . . . . . . . . . . . . . . . . . . . . . . . . . . . . . . . . . . . . . . . . . . . . . . . . . . . . . . . . 4,773 4,466 5,554 5,796 6,590Working capital(4) . . . . . . . . . . . . . . . . . . . . . . . . . . . . . . . . . . . . . . . . . . . . . . . . . . . . . . . . . . . . . . . . . . . . . . . . . . . . . . . . . . . . . . . . . . . . . . . . . . . . . . . . . . . 3,408 3,576 4,377 5,237 5,703Total assets . . . . . . . . . . . . . . . . . . . . . . . . . . . . . . . . . . . . . . . . . . . . . . . . . . . . . . . . . . . . . . . . . . . . . . . . . . . . . . . . . . . . . . . . . . . . . . . . . . . . . . . . . . . . . . . . . . 19,188 17,914 21,425 26,771 27,266Short-term debt, including current portion of long-term debt . . . . . . . . . . . . . . . . . . . . . . . . . . . . . . . . . . . . . . . . . . . . . . . . . . 1,195 1,517 1,002 1,465 2,317Long-term debt . . . . . . . . . . . . . . . . . . . . . . . . . . . . . . . . . . . . . . . . . . . . . . . . . . . . . . . . . . . . . . . . . . . . . . . . . . . . . . . . . . . . . . . . . . . . . . . . . . . . . . . . . . . . . 3,069 2,926 2,848 3,169 3,518Convertible perpetual preference shares(2) . . . . . . . . . . . . . . . . . . . . . . . . . . . . . . . . . . . . . . . . . . . . . . . . . . . . . . . . . . . . . . . . . . . . . . . . . . . 690 690 690 690 690Common shares and additional paid-in-capital . . . . . . . . . . . . . . . . . . . . . . . . . . . . . . . . . . . . . . . . . . . . . . . . . . . . . . . . . . . . . . . . . . . . . . 5,144 5,106 5,054 4,968 4,910Total equity . . . . . . . . . . . . . . . . . . . . . . . . . . . . . . . . . . . . . . . . . . . . . . . . . . . . . . . . . . . . . . . . . . . . . . . . . . . . . . . . . . . . . . . . . . . . . . . . . . . . . . . . . . . . . . . . . . $ 7,343 $ 6,652 $ 8,690 $10,088 $11,255
YEAR ENDED DECEMBER 31,(in millions of metric tons) 2016 2015 2014 2013 2012
Other Data:Volumes:Agribusiness . . . . . . . . . . . . . . . . . . . . . . . . . . . . . . . . . . . . . . . . . . . . . . . . . . . . . . . . . . . . . . . . . . . . . . . . . . . . . . . . . . . . . . . . . . . . . . . . . . . . . . . . . . . . . . . . . . . . . . . . . . . . . . . . . 134.6 134.1 138.7 137.4 132.8
Edible Oil Products . . . . . . . . . . . . . . . . . . . . . . . . . . . . . . . . . . . . . . . . . . . . . . . . . . . . . . . . . . . . . . . . . . . . . . . . . . . . . . . . . . . . . . . . . . . . . . . . . . . . . . . . . . . . . . . . . . . . . 7.0 6.8 6.9 7.0 6.7Milling Products . . . . . . . . . . . . . . . . . . . . . . . . . . . . . . . . . . . . . . . . . . . . . . . . . . . . . . . . . . . . . . . . . . . . . . . . . . . . . . . . . . . . . . . . . . . . . . . . . . . . . . . . . . . . . . . . . . . . . . . . . . 4.5 4.2 4.5 4.0 4.3
Total Food and Ingredients . . . . . . . . . . . . . . . . . . . . . . . . . . . . . . . . . . . . . . . . . . . . . . . . . . . . . . . . . . . . . . . . . . . . . . . . . . . . . . . . . . . . . . . . . . . . . . . . . . . . . . . . . . . . . . 11.5 11.0 11.4 11.0 11.0Sugar and Bioenergy . . . . . . . . . . . . . . . . . . . . . . . . . . . . . . . . . . . . . . . . . . . . . . . . . . . . . . . . . . . . . . . . . . . . . . . . . . . . . . . . . . . . . . . . . . . . . . . . . . . . . . . . . . . . . . . . . . . . . . . 8.8 10.4 9.7 10.3 8.6Fertilizer . . . . . . . . . . . . . . . . . . . . . . . . . . . . . . . . . . . . . . . . . . . . . . . . . . . . . . . . . . . . . . . . . . . . . . . . . . . . . . . . . . . . . . . . . . . . . . . . . . . . . . . . . . . . . . . . . . . . . . . . . . . . . . . . . . . . . 1.3 1.0 1.1 1.0 1.0
(1) Earnings per common share-basic is computed by dividing net income available to common shareholders by the weighted-average number of common shares outstanding for theperiod.
(2) Bunge has 6,900,000 4.875% cumulative convertible perpetual preference shares outstanding. Each cumulative convertible preference share has an initial liquidation preference of$100 per share plus accumulated and unpaid dividends up to a maximum of an additional $25 per share. As a result of adjustments made to the initial conversion price because cashdividends paid on Bunge Limited’s common shares exceeded certain specified thresholds, each cumulative convertible preference share is convertible, at the holder’s option, at anytime, into approximately 1.1507 Bunge Limited common shares (7,939,830 Bunge Limited common shares), subject to certain additional anti-dilution adjustments.
(3) Included in inventories were readily marketable inventories of $3,855 million, $3,666 million, $4,409 million, $4,600 million, $5,306 million at December 31, 2016, 2015, 2014,2013 and 2012, respectively. Readily marketable inventories are agricultural commodity inventories, such as soybeans, soybean meal, soybean oil, corn and wheat that are readilyconvertible to cash because of their commodity characteristics, widely available markets and international pricing mechanisms. Working capital is calculated as current assets lesscurrent liabilities.
measure that is widely used by analysts and investors inITEM 7. MANAGEMENT’S DISCUSSION ANDBunge’s industries. Total Segment EBIT is a non-U.S. GAAPANALYSIS OF FINANCIAL CONDITION ANDfinancial measure and is not intended to replace net incomeRESULTS OF OPERATIONSattributable to Bunge, the most directly comparable U.S. GAAP
The following should be read in conjunction with ‘‘Cautionary financial measure.Statement Regarding Forward Looking Statements’’ and ourcombined consolidated financial statements and notes thereto OPERATING RESULTSincluded in Item 15 of this Annual Report on Form 10-K.
FACTORS AFFECTING OPERATING RESULTSNon-U.S. GAAP Financial Measures
Bunge Limited, a Bermuda company, together with itssubsidiaries, is a leading global agribusiness and foodTotal segment earnings before interest and taxes (‘‘EBIT’’) is ancompany operating in the farm-to-consumer food chain. Theoperating performance measure used by Bunge’s managementcommodity nature of the Company’s principal products, as wellto evaluate segment operating activities. Bunge’s managementas regional and global supply and demand variations thatbelieves total segment EBIT is a useful measure of operatingoccur as an inherent part of the business make volumes anprofitability, since the measure allows for an evaluation of theimportant operating measure. Accordingly, information isperformance of its segments without regard to its financingincluded in ‘‘Segment Results’’ that summarizes certain items inmethods or capital structure. In addition, EBIT is a financial
20 2016 Bunge Annual Report

21
our consolidated statements of income and volumes by commodities, including whether to change the location of orreportable segment. The common unit of measure for all adjust our own oilseed processing capacity.reported volumes is metric tons. A description of reported
Additionally, price fluctuations and availability of commoditiesvolumes for each reportable segment has also been includedmay cause fluctuations in our working capital, such asin the discussion of key factors affecting results of operationsinventories, accounts receivable and borrowings over thein each of our business segments as discussed below.course of a given year. For example, increased availability ofcommodities at harvest times often causes fluctuations in ourAgribusinessinventories and borrowings. Increases in agricultural commodityprices will also generally cause our cash flow requirements toIn the Agribusiness segment, we purchase, store, transport,increase as our operations require increased use of cash toprocess and sell agricultural commodities and commodityacquire inventories and fund daily settlement requirements onproducts. Profitability in this segment is affected by theexchange traded futures that we use to hedge our physicalavailability and market prices of agricultural commodities andinventories.processed commodity products and the availability and costs of
energy, transportation and logistics services. Profitability in ouroilseed processing operations is also impacted by volumes Food and Ingredientsprocured, processed and sold and by capacity utilization rates.
In the Food and Ingredients business, which consists of ourAvailability of agricultural commodities is affected by manyEdible Oil Products and Milling Products segments, ourfactors, including weather, farmer planting and sellingoperating results are affected by changes in the prices of rawdecisions, plant diseases, governmental policies andmaterials, such as crude vegetable oils and grains, the mix ofagricultural sector economic conditions. Reported volumes inproducts that we sell, changes in consumer eating habits,this segment primarily reflect (i) grains and oilseeds originatedchanges in per capita incomes, consumer purchasing powerfrom farmers, cooperatives or other aggregators and fromlevels, availability of credit to customers, governmental dietarywhich ‘‘origination margins’’ are earned; (ii) oilseeds processedguidelines and policies, changes in regional economicin our oilseed processing facilities and from which ‘‘crushingconditions and the general competitive environment in ourmargins’’ are earned – representing the margin from themarkets. Raw material inputs to our production processes inindustrial separation of the oilseed into its protein meal andthe Edible Oil Products and Milling Products segments arevegetable oil components, both of which are separatelargely sourced at market prices from our Agribusinesscommodity products; and (iii) third party sales of grains,segment. Reported volumes in these segments reflect third-oilseeds and related commodity products merchandisedparty sales of our finished products and, as such, include thethrough our distribution businesses and from whichsales of products derived from raw materials sourced from the‘‘distribution margins’’ are earned. The foregoing sub-segmentAgribusiness segment as well as from third-parties. The unit ofvolumes may overlap as they produce separate margin capturemeasure for these volumes is metric tons as these businessesopportunities. For example, oilseeds procured in our Southare linked to the commodity raw materials, which are theirAmerican grain origination activities may be processed in ourprimary inputs.oilseed processing facilities in Asia-Pacific and will be reflected
at both points within the segment. As such, these reportedvolumes do not represent solely volumes of net sales to third- Sugar and Bioenergyparties, but rather where margin is earned, appropriately
The Sugar and Bioenergy segment is an integrated businessreflecting their contribution to our global network’s capacitywhich primarily includes the procurement and growing ofutilization and profitability.sugarcane and the production of sugar, ethanol and electricity
Demand for our purchased and processed agribusiness in our eight mills in Brazil, global sugar trading andproducts is affected by many factors, including global and merchandising activities and investment interests in affiliates.regional economic conditions, changes in per capita incomes,
Profitability in this segment is affected by the availability andthe financial condition of customers and customer access toquality of sugarcane, which impacts our capacity utilizationcredit, worldwide consumption of food products, particularlyrates and the amount of sugar that can be extracted from thepork and poultry, population growth rates, relative prices ofsugarcane, and by market prices of sugarcane, sugar andsubstitute agricultural products, outbreaks of diseaseethanol. Availability and quality of sugarcane is affected byassociated with livestock and poultry, and demand formany factors, including weather, geographical factors such asrenewable fuels produced from agricultural commodities andsoil quality and topography, and agricultural practices. Oncecommodity products.planted, sugarcane may be harvested for several continuous
We expect that the factors described above will continue to years, but the yield decreases with each subsequent harvest.affect global supply and demand for our agribusiness products As a result, the current optimum economic cycle is generallyfor the foreseeable future. We also expect that, from time to five or six consecutive harvests, depending on location. Wetime, imbalances will likely exist between oilseed processing own and/or have partnership agreements to manage farmlandcapacity and demand for oilseed products in certain regions, on which we grow and harvest sugarcane. We also purchasewhich impacts our decisions regarding whether, when and sugarcane from third parties. Prices of sugarcane in Brazil arewhere to purchase, store, transport, process or sell these established by Consecana, the Sao Paulo state sugarcane,
sugar and ethanol council, and are based on the sucrose
2016 Bunge Annual Report 21

22
content of the cane and the market prices of sugar and Additionally, we record transaction gains or losses on monetaryethanol. Demand for our products is affected by such factors assets and liabilities that are not denominated in the functionalas changes in global or regional economic conditions, the currency of the entity. These amounts are remeasured intofinancial condition of customers and customer access to credit, their respective functional currencies at exchange rates as ofworldwide consumption of food products, population growth the balance sheet date, with the resulting gains or lossesrates, changes in per capita incomes and demand for and included in the entity’s statement of income and, therefore, ingovernmental support of renewable fuels produced from our consolidated statements of income as foreign exchangeagricultural commodities, including sugarcane. We expect that gains (losses).these factors will continue to affect supply and demand for our
We primarily use a combination of equity and intercompanysugar and bioenergy products in the foreseeable future.loans to finance our subsidiaries. Intercompany loans that areReported volumes in this segment reflect third-party sales ofof a long-term investment nature with no intention ofsugar and ethanol.repayment in the foreseeable future are consideredpermanently invested and as such are treated as analogous toFertilizerequity for accounting purposes. As a result, any foreignexchange translation gains or losses on such permanentlyIn the Fertilizer segment, demand for our products is affectedinvested intercompany loans are reported in accumulated otherby the profitability of the agricultural sectors we serve, thecomprehensive income (loss) in our consolidated balanceavailability of credit to farmers, agricultural commodity prices,sheets. In contrast, foreign exchange translation gains or lossesthe types of crops planted, the number of acres planted, theon intercompany loans that are not of a permanent nature arequality of the land under cultivation and weather-related issuesrecorded in our consolidated statements of income as foreignaffecting the success of the harvests. Our profitability isexchange gains (losses).impacted by international selling prices for fertilizers and
fertilizer raw materials, such as phosphate, sulfur, ammonia andurea, ocean freight rates and other import costs, as well as Income Taxesimport volumes at the port facilities we manage. As our
As a Bermuda exempted company, we are not subject tooperations are in South America, primarily Argentina, ourincome taxes on income in our jurisdiction of incorporation.results in this segment are typically seasonal, with fertilizerHowever, our subsidiaries, which operate in multiple taxsales normally concentrated in the third and fourth quarters ofjurisdictions, are subject to income taxes at various statutorythe year due to the timing of the South American agriculturalrates ranging from 0% to 39%. The jurisdictions thatcycle. Reported volumes in this segment reflect third-partysignificantly impact our effective tax rate are Brazil, the Unitedsales of our finished products.States, Argentina and Bermuda. Determination of taxable
In addition to these industry related factors which impact our income requires the interpretation of related and often complexbusiness areas, our results of operations in all business areas tax laws and regulations in each jurisdiction where we operateand segments are affected by the following factors: and the use of estimates and assumptions regarding future
events.Foreign Currency Exchange Rates
RESULTS OF OPERATIONSDue to the global nature of our operations, our operatingresults can be materially impacted by foreign currency 2016 Overviewexchange rates. Both translation of our foreign subsidiaries’
Net income attributable to Bunge for 2016 decreased byfinancial statements and foreign currency transactions can$46 million to $745 million compared to $791 million for 2015.affect our results. On a monthly basis, for subsidiaries whoseThis decrease in net income was driven by a decline in Totalfunctional currency is their local currency, subsidiarySegment EBIT of $105 million, as discussed below, and lowerstatements of income and cash flows must be translated intoresults in discontinued operations of $44 million is primarilyU.S. dollars for consolidation purposes based on weighted-due to the impact of cumulative translation adjustments,average exchange rates in each monthly period. As a result,partially offset by lower income tax expense of $76 million andfluctuations of local currencies compared to the U.S. dollarlower net interest costs of $32 million. Income tax expense induring each monthly period impact our consolidated2016 included net tax benefits of $34 million that resultedstatements of income and cash flows for each reported periodprimarily from refund claims in North America and the release(quarter and year-to-date) and also affect comparisonsof deferred income tax valuation allowances in Brazil, partiallybetween those reported periods. Subsidiary balance sheets areoffset by unrecognized tax benefits in Asia-Pacific. Interesttranslated using exchange rates as of the balance sheet dateexpense in 2016 included a $26 million reversal of interestwith the resulting translation adjustments reported in ourrecorded in previous years.consolidated balance sheets as a component of other
comprehensive income (loss). Included in accumulated otherTotal segment EBIT of $1,143 million in 2016 decreased fromcomprehensive income for the years ended December 31, 2016,$1,248 million in 2015. EBIT for 2016 included $120 million of2015, and 2014 were foreign exchange net translation gainsgains on the disposition of equity interests of port and(losses) of $709 million, $(2,546) million, and $(1,411) million,transshipment operations in Brazil and oilseed crush operationsrespectively, resulting from the translation of our foreignin Vietnam and a $14 million gain related to a wheat export taxsubsidiaries’ assets and liabilities.
22 2016 Bunge Annual Report

23
contingency settlement in Brazil. In addition, 2016 EBIT to results by Moinho Pacifico, a wheat mill in Brazil, which weincluded impairment charges of $44 million and $15 million of acquired in the fourth quarter of 2015. Gross profit in Mexicoequity investments in Brazil and Asia-Pacific, respectively, was lower resulting from reduced volumes. In 2016, weimpairment charges of $12 million of intangible assets, recovered $14 million of wheat import taxes in Brazil that we$9 million of asset impairment charges in our fertilizer have paid in prior years.operations in Argentina, an $8 million provision for long-term
Sugar and Bioenergy segment EBIT in 2016 was a loss ofreceivables in Brazil and $3 million of restructuring charges in$4 million compared to a loss of $27 million in 2015. Theour industrial sugar operations in Brazil. EBIT for 2015 includesimproved results were primarily driven by higher sugar anda $47 million gain on the sale of certain grain assets in CanadaBrazilian ethanol prices, operational improvements in ourto G3 Canada Limited (formerly the Canadian Wheat Board)industrial operations and foreign exchange gains, partly offsetand a $30 million reversal of an export tax contingency inby lower volumes and increased local currency costs in BrazilArgentina. In addition 2015 EBIT includes a $13 milliondriven by inflation. In 2016, we recorded $44 million ofgoodwill impairment charge in our Brazilian tomato productsimpairment charges in our equity method investment for thebusiness, impairment charges in our equity method investmentdevelopment and production of value added oils and feedin a freight shipping company of $14 million and a $15 millioningredients in Brazil, $8 million to provision for certainimpairment charge as a result of the announced closure of along-term receivables in Brazil and $3 million for restructuringpackaged oil plant in the United States, as well as a $9 millioncharges in our sugar milling business.charge for administrative tax assessment fees related to export
activities in our Argentine subsidiary.Fertilizer segment EBIT increased to $29 million in 2016compared to $5 million in 2015. In 2016 gross profit increasedAgribusiness segment EBIT of $875 million for 2016 wasas a result of higher volumes and margins in Argentina, as$233 million lower compared to $1,108 million in 2015. Thedemand from farmers increased due to larger crop areas. Inprimary drivers of this decrease included weaker crush marginsaddition, in 2016 we recorded the reversal of a natural gasin our soy processing operations and lower grain originationtariff contingency from prior years totaling $11 million. Resultsresults in Brazil due to weaker farmer selling compared to ain 2015 were impacted due to a strike in one of our plants.strong performance in 2015. In addition, our risk management
activities contributed to a lesser extent to our results in 2016as compared to 2015. Foreign exchange results were losses of Segment Results$7 million in 2016 as compared to gains of $67 million in 2015.
Bunge has five reportable segments – Agribusiness, Edible OilThe decrease in EBIT in 2016 was partly offset by a reductionProducts, Milling Products, Sugar and Bioenergy andof SG&A expenses and improved results in certain of ourFertilizer – which are organized based upon similar economicnon-consolidated equity investments in Brazil and Asia.characteristics and are similar in nature of products and
Edible Oil Products segment EBIT was $112 million in 2016 services offered, the nature of production processes, the typecompared to $59 million in 2015. Gross profit increased and class of customer and distribution methods. The$35 million driven by higher volumes and stronger margins. In Agribusiness segment is characterized by both inputs andBrazil, results improved due to higher market share for outputs being agricultural commodities and thus high volumepackaged oils products, in Canada demand for refined oil and low margin. The Edible Oil Products segment involves theshowed strong growth, and in India, both volumes and margins manufacturing and marketing of products derived fromimproved. Gross profit was adversely impacted by weaker vegetable oils. The Milling Products segment involves theresults in our margarines business in Europe. SG&A expense manufacturing and marketing of products derived primarilywas lower in the year ended December 31, 2016 compared to from wheat and corn. The Sugar and Bioenergy segmentthe same period a year ago, driven by cost-cutting and involves sugarcane growing and milling in Brazil, sugar andefficiency initiatives. In 2015, results included impairment ethanol trading and merchandising in various countries, as wellcharges related to goodwill in our Brazil tomato products as sugarcane-based ethanol production and corn-basedbusiness and the closure of an oil packaging facility in the ethanol investments and related activities. The FertilizerUnited States. segment includes the activities of our port operations in Brazil
and Argentina and blending and distribution operations inMilling Products segment EBIT increased by $28 million to Argentina.$131 million in 2016 from $103 million in 2015, primarily drivenby higher volumes and margins in Brazil and the contribution
2016 Bunge Annual Report 23

24
A summary of certain items in our consolidated statements of income and volumes by reportable segment for the periodsindicated is set forth below.
YEAR ENDED DECEMBER 31,(US$ in millions) 2016 2015 2014
Volume (in thousands of metric tons):Agribusiness . . . . . . . . . . . . . . . . . . . . . . . . . . . . . . . . . . . . . . . . . . . . . . . . . . . . . . . . . . . . . . . . . . . . . . . . . . . . . . . . . . . . . . . . . . . . . . . . . . . . . . . . . . . . . . . . . . . . . . . . . . . . . . . . . . . . . . . . . . . . 134,605 134,136 138,690Edible Oil Products . . . . . . . . . . . . . . . . . . . . . . . . . . . . . . . . . . . . . . . . . . . . . . . . . . . . . . . . . . . . . . . . . . . . . . . . . . . . . . . . . . . . . . . . . . . . . . . . . . . . . . . . . . . . . . . . . . . . . . . . . . . . . . . . . . . . 6,989 6,831 6,845Milling Products . . . . . . . . . . . . . . . . . . . . . . . . . . . . . . . . . . . . . . . . . . . . . . . . . . . . . . . . . . . . . . . . . . . . . . . . . . . . . . . . . . . . . . . . . . . . . . . . . . . . . . . . . . . . . . . . . . . . . . . . . . . . . . . . . . . . . . . . 4,498 4,199 4,514Sugar and Bioenergy . . . . . . . . . . . . . . . . . . . . . . . . . . . . . . . . . . . . . . . . . . . . . . . . . . . . . . . . . . . . . . . . . . . . . . . . . . . . . . . . . . . . . . . . . . . . . . . . . . . . . . . . . . . . . . . . . . . . . . . . . . . . . . . . . . 8,847 10,440 9,678Fertilizer . . . . . . . . . . . . . . . . . . . . . . . . . . . . . . . . . . . . . . . . . . . . . . . . . . . . . . . . . . . . . . . . . . . . . . . . . . . . . . . . . . . . . . . . . . . . . . . . . . . . . . . . . . . . . . . . . . . . . . . . . . . . . . . . . . . . . . . . . . . . . . . . 1,272 979 1,090
Net sales:Agribusiness . . . . . . . . . . . . . . . . . . . . . . . . . . . . . . . . . . . . . . . . . . . . . . . . . . . . . . . . . . . . . . . . . . . . . . . . . . . . . . . . . . . . . . . . . . . . . . . . . . . . . . . . . . . . . . . . . . . . . . . . . . . . . . . . . . . . . . . . . . . . $ 30,061 $ 31,267 $ 42,109Edible Oil Products . . . . . . . . . . . . . . . . . . . . . . . . . . . . . . . . . . . . . . . . . . . . . . . . . . . . . . . . . . . . . . . . . . . . . . . . . . . . . . . . . . . . . . . . . . . . . . . . . . . . . . . . . . . . . . . . . . . . . . . . . . . . . . . . . . . . 6,859 6,698 7,972Milling Products . . . . . . . . . . . . . . . . . . . . . . . . . . . . . . . . . . . . . . . . . . . . . . . . . . . . . . . . . . . . . . . . . . . . . . . . . . . . . . . . . . . . . . . . . . . . . . . . . . . . . . . . . . . . . . . . . . . . . . . . . . . . . . . . . . . . . . . . 1,647 1,609 2,064Sugar and Bioenergy . . . . . . . . . . . . . . . . . . . . . . . . . . . . . . . . . . . . . . . . . . . . . . . . . . . . . . . . . . . . . . . . . . . . . . . . . . . . . . . . . . . . . . . . . . . . . . . . . . . . . . . . . . . . . . . . . . . . . . . . . . . . . . . . . . 3,709 3,495 4,542Fertilizer . . . . . . . . . . . . . . . . . . . . . . . . . . . . . . . . . . . . . . . . . . . . . . . . . . . . . . . . . . . . . . . . . . . . . . . . . . . . . . . . . . . . . . . . . . . . . . . . . . . . . . . . . . . . . . . . . . . . . . . . . . . . . . . . . . . . . . . . . . . . . . . . 403 386 474
Total . . . . . . . . . . . . . . . . . . . . . . . . . . . . . . . . . . . . . . . . . . . . . . . . . . . . . . . . . . . . . . . . . . . . . . . . . . . . . . . . . . . . . . . . . . . . . . . . . . . . . . . . . . . . . . . . . . . . . . . . . . . . . . . . . . . . . . . . . . . . . . . . . . . $ 42,679 $ 43,455 $ 57,161
Cost of goods sold:Agribusiness . . . . . . . . . . . . . . . . . . . . . . . . . . . . . . . . . . . . . . . . . . . . . . . . . . . . . . . . . . . . . . . . . . . . . . . . . . . . . . . . . . . . . . . . . . . . . . . . . . . . . . . . . . . . . . . . . . . . . . . . . . . . . . . . . . . . . . . . . . . . $(28,571) $(29,409) $(40,367)Edible Oil Products . . . . . . . . . . . . . . . . . . . . . . . . . . . . . . . . . . . . . . . . . . . . . . . . . . . . . . . . . . . . . . . . . . . . . . . . . . . . . . . . . . . . . . . . . . . . . . . . . . . . . . . . . . . . . . . . . . . . . . . . . . . . . . . . . . . . (6,420) (6,294) (7,424)Milling Products . . . . . . . . . . . . . . . . . . . . . . . . . . . . . . . . . . . . . . . . . . . . . . . . . . . . . . . . . . . . . . . . . . . . . . . . . . . . . . . . . . . . . . . . . . . . . . . . . . . . . . . . . . . . . . . . . . . . . . . . . . . . . . . . . . . . . . . . (1,378) (1,372) (1,753)Sugar and Bioenergy . . . . . . . . . . . . . . . . . . . . . . . . . . . . . . . . . . . . . . . . . . . . . . . . . . . . . . . . . . . . . . . . . . . . . . . . . . . . . . . . . . . . . . . . . . . . . . . . . . . . . . . . . . . . . . . . . . . . . . . . . . . . . . . . . . (3,550) (3,331) (4,583)Fertilizer . . . . . . . . . . . . . . . . . . . . . . . . . . . . . . . . . . . . . . . . . . . . . . . . . . . . . . . . . . . . . . . . . . . . . . . . . . . . . . . . . . . . . . . . . . . . . . . . . . . . . . . . . . . . . . . . . . . . . . . . . . . . . . . . . . . . . . . . . . . . . . . . (350) (356) (413)
Total . . . . . . . . . . . . . . . . . . . . . . . . . . . . . . . . . . . . . . . . . . . . . . . . . . . . . . . . . . . . . . . . . . . . . . . . . . . . . . . . . . . . . . . . . . . . . . . . . . . . . . . . . . . . . . . . . . . . . . . . . . . . . . . . . . . . . . . . . . . . . . . . . . . $(40,269) $(40,762) $(54,540)
Gross profit (loss):Agribusiness . . . . . . . . . . . . . . . . . . . . . . . . . . . . . . . . . . . . . . . . . . . . . . . . . . . . . . . . . . . . . . . . . . . . . . . . . . . . . . . . . . . . . . . . . . . . . . . . . . . . . . . . . . . . . . . . . . . . . . . . . . . . . . . . . . . . . . . . . . . . $ 1,490 $ 1,858 $ 1,742Edible Oil Products . . . . . . . . . . . . . . . . . . . . . . . . . . . . . . . . . . . . . . . . . . . . . . . . . . . . . . . . . . . . . . . . . . . . . . . . . . . . . . . . . . . . . . . . . . . . . . . . . . . . . . . . . . . . . . . . . . . . . . . . . . . . . . . . . . . . 439 404 548Milling Products . . . . . . . . . . . . . . . . . . . . . . . . . . . . . . . . . . . . . . . . . . . . . . . . . . . . . . . . . . . . . . . . . . . . . . . . . . . . . . . . . . . . . . . . . . . . . . . . . . . . . . . . . . . . . . . . . . . . . . . . . . . . . . . . . . . . . . . . 269 237 311Sugar and Bioenergy . . . . . . . . . . . . . . . . . . . . . . . . . . . . . . . . . . . . . . . . . . . . . . . . . . . . . . . . . . . . . . . . . . . . . . . . . . . . . . . . . . . . . . . . . . . . . . . . . . . . . . . . . . . . . . . . . . . . . . . . . . . . . . . . . . 159 164 (41)Fertilizer . . . . . . . . . . . . . . . . . . . . . . . . . . . . . . . . . . . . . . . . . . . . . . . . . . . . . . . . . . . . . . . . . . . . . . . . . . . . . . . . . . . . . . . . . . . . . . . . . . . . . . . . . . . . . . . . . . . . . . . . . . . . . . . . . . . . . . . . . . . . . . . . 53 30 61
Total . . . . . . . . . . . . . . . . . . . . . . . . . . . . . . . . . . . . . . . . . . . . . . . . . . . . . . . . . . . . . . . . . . . . . . . . . . . . . . . . . . . . . . . . . . . . . . . . . . . . . . . . . . . . . . . . . . . . . . . . . . . . . . . . . . . . . . . . . . . . . . . . . . . $ 2,410 $ 2,693 $ 2,621
Selling, general & administrative expenses:Agribusiness . . . . . . . . . . . . . . . . . . . . . . . . . . . . . . . . . . . . . . . . . . . . . . . . . . . . . . . . . . . . . . . . . . . . . . . . . . . . . . . . . . . . . . . . . . . . . . . . . . . . . . . . . . . . . . . . . . . . . . . . . . . . . . . . . . . . . . . . . . . . $ (706) $ (851) $ (875)Edible Oil Products . . . . . . . . . . . . . . . . . . . . . . . . . . . . . . . . . . . . . . . . . . . . . . . . . . . . . . . . . . . . . . . . . . . . . . . . . . . . . . . . . . . . . . . . . . . . . . . . . . . . . . . . . . . . . . . . . . . . . . . . . . . . . . . . . . . . (320) (328) (482)Milling Products . . . . . . . . . . . . . . . . . . . . . . . . . . . . . . . . . . . . . . . . . . . . . . . . . . . . . . . . . . . . . . . . . . . . . . . . . . . . . . . . . . . . . . . . . . . . . . . . . . . . . . . . . . . . . . . . . . . . . . . . . . . . . . . . . . . . . . . . (127) (123) (168)Sugar and Bioenergy . . . . . . . . . . . . . . . . . . . . . . . . . . . . . . . . . . . . . . . . . . . . . . . . . . . . . . . . . . . . . . . . . . . . . . . . . . . . . . . . . . . . . . . . . . . . . . . . . . . . . . . . . . . . . . . . . . . . . . . . . . . . . . . . . . (112) (109) (156)Fertilizer . . . . . . . . . . . . . . . . . . . . . . . . . . . . . . . . . . . . . . . . . . . . . . . . . . . . . . . . . . . . . . . . . . . . . . . . . . . . . . . . . . . . . . . . . . . . . . . . . . . . . . . . . . . . . . . . . . . . . . . . . . . . . . . . . . . . . . . . . . . . . . . . (21) (24) (10)
Total . . . . . . . . . . . . . . . . . . . . . . . . . . . . . . . . . . . . . . . . . . . . . . . . . . . . . . . . . . . . . . . . . . . . . . . . . . . . . . . . . . . . . . . . . . . . . . . . . . . . . . . . . . . . . . . . . . . . . . . . . . . . . . . . . . . . . . . . . . . . . . . . . . . $ (1,286) $ (1,435) $ (1,691)
Foreign exchange gain (loss):Agribusiness . . . . . . . . . . . . . . . . . . . . . . . . . . . . . . . . . . . . . . . . . . . . . . . . . . . . . . . . . . . . . . . . . . . . . . . . . . . . . . . . . . . . . . . . . . . . . . . . . . . . . . . . . . . . . . . . . . . . . . . . . . . . . . . . . . . . . . . . . . . . $ (7) $ 67 $ 39Edible Oil Products . . . . . . . . . . . . . . . . . . . . . . . . . . . . . . . . . . . . . . . . . . . . . . . . . . . . . . . . . . . . . . . . . . . . . . . . . . . . . . . . . . . . . . . . . . . . . . . . . . . . . . . . . . . . . . . . . . . . . . . . . . . . . . . . . . . . (1) - (4)Milling Products . . . . . . . . . . . . . . . . . . . . . . . . . . . . . . . . . . . . . . . . . . . . . . . . . . . . . . . . . . . . . . . . . . . . . . . . . . . . . . . . . . . . . . . . . . . . . . . . . . . . . . . . . . . . . . . . . . . . . . . . . . . . . . . . . . . . . . . . (7) (8) (8)Sugar and Bioenergy . . . . . . . . . . . . . . . . . . . . . . . . . . . . . . . . . . . . . . . . . . . . . . . . . . . . . . . . . . . . . . . . . . . . . . . . . . . . . . . . . . . . . . . . . . . . . . . . . . . . . . . . . . . . . . . . . . . . . . . . . . . . . . . . . . 9 (68) 19Fertilizer . . . . . . . . . . . . . . . . . . . . . . . . . . . . . . . . . . . . . . . . . . . . . . . . . . . . . . . . . . . . . . . . . . . . . . . . . . . . . . . . . . . . . . . . . . . . . . . . . . . . . . . . . . . . . . . . . . . . . . . . . . . . . . . . . . . . . . . . . . . . . . . . (2) 1 1
Total . . . . . . . . . . . . . . . . . . . . . . . . . . . . . . . . . . . . . . . . . . . . . . . . . . . . . . . . . . . . . . . . . . . . . . . . . . . . . . . . . . . . . . . . . . . . . . . . . . . . . . . . . . . . . . . . . . . . . . . . . . . . . . . . . . . . . . . . . . . . . . . . . . . $ (8) $ (8) $ 47
Noncontrolling interests:Agribusiness . . . . . . . . . . . . . . . . . . . . . . . . . . . . . . . . . . . . . . . . . . . . . . . . . . . . . . . . . . . . . . . . . . . . . . . . . . . . . . . . . . . . . . . . . . . . . . . . . . . . . . . . . . . . . . . . . . . . . . . . . . . . . . . . . . . . . . . . . . . . $ (21) $ (9) $ (23)Edible Oil Products . . . . . . . . . . . . . . . . . . . . . . . . . . . . . . . . . . . . . . . . . . . . . . . . . . . . . . . . . . . . . . . . . . . . . . . . . . . . . . . . . . . . . . . . . . . . . . . . . . . . . . . . . . . . . . . . . . . . . . . . . . . . . . . . . . . . (13) (8) (9)Milling Products . . . . . . . . . . . . . . . . . . . . . . . . . . . . . . . . . . . . . . . . . . . . . . . . . . . . . . . . . . . . . . . . . . . . . . . . . . . . . . . . . . . . . . . . . . . . . . . . . . . . . . . . . . . . . . . . . . . . . . . . . . . . . . . . . . . . . . . . - - -Sugar and Bioenergy . . . . . . . . . . . . . . . . . . . . . . . . . . . . . . . . . . . . . . . . . . . . . . . . . . . . . . . . . . . . . . . . . . . . . . . . . . . . . . . . . . . . . . . . . . . . . . . . . . . . . . . . . . . . . . . . . . . . . . . . . . . . . . . . . . - - (1)Fertilizer . . . . . . . . . . . . . . . . . . . . . . . . . . . . . . . . . . . . . . . . . . . . . . . . . . . . . . . . . . . . . . . . . . . . . . . . . . . . . . . . . . . . . . . . . . . . . . . . . . . . . . . . . . . . . . . . . . . . . . . . . . . . . . . . . . . . . . . . . . . . . . . . (2) (1) (5)
Total . . . . . . . . . . . . . . . . . . . . . . . . . . . . . . . . . . . . . . . . . . . . . . . . . . . . . . . . . . . . . . . . . . . . . . . . . . . . . . . . . . . . . . . . . . . . . . . . . . . . . . . . . . . . . . . . . . . . . . . . . . . . . . . . . . . . . . . . . . . . . . . . . . . $ (36) $ (18) $ (38)
24 2016 Bunge Annual Report
25
YEAR ENDED DECEMBER 31,(US$ in millions) 2016 2015 2014
Other income (expense):Agribusiness . . . . . . . . . . . . . . . . . . . . . . . . . . . . . . . . . . . . . . . . . . . . . . . . . . . . . . . . . . . . . . . . . . . . . . . . . . . . . . . . . . . . . . . . . . . . . . . . . . . . . . . . . . . . . . . . . . . . . . . . . . . . . . . . . . . . . . . . . . . . $ 24 $ (3) $ 8Edible Oil Products . . . . . . . . . . . . . . . . . . . . . . . . . . . . . . . . . . . . . . . . . . . . . . . . . . . . . . . . . . . . . . . . . . . . . . . . . . . . . . . . . . . . . . . . . . . . . . . . . . . . . . . . . . . . . . . . . . . . . . . . . . . . . . . . . . . . 7 4 5Milling Products . . . . . . . . . . . . . . . . . . . . . . . . . . . . . . . . . . . . . . . . . . . . . . . . . . . . . . . . . . . . . . . . . . . . . . . . . . . . . . . . . . . . . . . . . . . . . . . . . . . . . . . . . . . . . . . . . . . . . . . . . . . . . . . . . . . . . . . . (4) (3) (4)Sugar and Bioenergy . . . . . . . . . . . . . . . . . . . . . . . . . . . . . . . . . . . . . . . . . . . . . . . . . . . . . . . . . . . . . . . . . . . . . . . . . . . . . . . . . . . . . . . . . . . . . . . . . . . . . . . . . . . . . . . . . . . . . . . . . . . . . . . . . . (16) (15) 10Fertilizer . . . . . . . . . . . . . . . . . . . . . . . . . . . . . . . . . . . . . . . . . . . . . . . . . . . . . . . . . . . . . . . . . . . . . . . . . . . . . . . . . . . . . . . . . . . . . . . . . . . . . . . . . . . . . . . . . . . . . . . . . . . . . . . . . . . . . . . . . . . . . . . . 1 (1) (2)
Total . . . . . . . . . . . . . . . . . . . . . . . . . . . . . . . . . . . . . . . . . . . . . . . . . . . . . . . . . . . . . . . . . . . . . . . . . . . . . . . . . . . . . . . . . . . . . . . . . . . . . . . . . . . . . . . . . . . . . . . . . . . . . . . . . . . . . . . . . . . . . . . . . . . $ 12 $ (18) $ 17
Gain on disposition of equity interests and sale of assets - Agribusiness . . . . . . . . . . . . . . . . . . . . . . . . . . . . . . . . . . . . . . . . . . . . . . . . . . . . . . . . . . . . $ 122 $ 47 $ -
Equity investment impairment - Agribusiness . . . . . . . . . . . . . . . . . . . . . . . . . . . . . . . . . . . . . . . . . . . . . . . . . . . . . . . . . . . . . . . . . . . . . . . . . . . . . . . . . . . . . . . . . . . . . . . . $ (15) $ - $ -
Intangible asset impairment - Agribusiness . . . . . . . . . . . . . . . . . . . . . . . . . . . . . . . . . . . . . . . . . . . . . . . . . . . . . . . . . . . . . . . . . . . . . . . . . . . . . . . . . . . . . . . . . . . . . . . . . . . $ (12) $ - $ -
Goodwill impairment - Edible Oil Products . . . . . . . . . . . . . . . . . . . . . . . . . . . . . . . . . . . . . . . . . . . . . . . . . . . . . . . . . . . . . . . . . . . . . . . . . . . . . . . . . . . . . . . . . . . . . . . . . . . $ - $ (13) $ -
Equity investment impairment - Sugar and Bioenergy . . . . . . . . . . . . . . . . . . . . . . . . . . . . . . . . . . . . . . . . . . . . . . . . . . . . . . . . . . . . . . . . . . . . . . . . . . . . . . . . . . . . . $ (44) $ - $ -
Segment EBIT(1)
Agribusiness . . . . . . . . . . . . . . . . . . . . . . . . . . . . . . . . . . . . . . . . . . . . . . . . . . . . . . . . . . . . . . . . . . . . . . . . . . . . . . . . . . . . . . . . . . . . . . . . . . . . . . . . . . . . . . . . . . . . . . . . . . . . . . . . . . . . . . . . . . . . $ 875 $ 1,108 $ 890Edible Oil Products . . . . . . . . . . . . . . . . . . . . . . . . . . . . . . . . . . . . . . . . . . . . . . . . . . . . . . . . . . . . . . . . . . . . . . . . . . . . . . . . . . . . . . . . . . . . . . . . . . . . . . . . . . . . . . . . . . . . . . . . . . . . . . . . . . . . 112 59 58Milling Products . . . . . . . . . . . . . . . . . . . . . . . . . . . . . . . . . . . . . . . . . . . . . . . . . . . . . . . . . . . . . . . . . . . . . . . . . . . . . . . . . . . . . . . . . . . . . . . . . . . . . . . . . . . . . . . . . . . . . . . . . . . . . . . . . . . . . . . . 131 103 131Sugar and Bioenergy . . . . . . . . . . . . . . . . . . . . . . . . . . . . . . . . . . . . . . . . . . . . . . . . . . . . . . . . . . . . . . . . . . . . . . . . . . . . . . . . . . . . . . . . . . . . . . . . . . . . . . . . . . . . . . . . . . . . . . . . . . . . . . . . . . (4) (27) (168)Fertilizer . . . . . . . . . . . . . . . . . . . . . . . . . . . . . . . . . . . . . . . . . . . . . . . . . . . . . . . . . . . . . . . . . . . . . . . . . . . . . . . . . . . . . . . . . . . . . . . . . . . . . . . . . . . . . . . . . . . . . . . . . . . . . . . . . . . . . . . . . . . . . . . . 29 5 45
Total . . . . . . . . . . . . . . . . . . . . . . . . . . . . . . . . . . . . . . . . . . . . . . . . . . . . . . . . . . . . . . . . . . . . . . . . . . . . . . . . . . . . . . . . . . . . . . . . . . . . . . . . . . . . . . . . . . . . . . . . . . . . . . . . . . . . . . . . . . . . . . . . . . . $ 1,143 $ 1,248 $ 956
Depreciation, depletion and amortization:Agribusiness . . . . . . . . . . . . . . . . . . . . . . . . . . . . . . . . . . . . . . . . . . . . . . . . . . . . . . . . . . . . . . . . . . . . . . . . . . . . . . . . . . . . . . . . . . . . . . . . . . . . . . . . . . . . . . . . . . . . . . . . . . . . . . . . . . . . . . . . . . . . $ (236) $ (234) $ (240)Edible Oil Products . . . . . . . . . . . . . . . . . . . . . . . . . . . . . . . . . . . . . . . . . . . . . . . . . . . . . . . . . . . . . . . . . . . . . . . . . . . . . . . . . . . . . . . . . . . . . . . . . . . . . . . . . . . . . . . . . . . . . . . . . . . . . . . . . . . . (94) (90) (96)Milling Products . . . . . . . . . . . . . . . . . . . . . . . . . . . . . . . . . . . . . . . . . . . . . . . . . . . . . . . . . . . . . . . . . . . . . . . . . . . . . . . . . . . . . . . . . . . . . . . . . . . . . . . . . . . . . . . . . . . . . . . . . . . . . . . . . . . . . . . . (62) (46) (47)Sugar and Bioenergy . . . . . . . . . . . . . . . . . . . . . . . . . . . . . . . . . . . . . . . . . . . . . . . . . . . . . . . . . . . . . . . . . . . . . . . . . . . . . . . . . . . . . . . . . . . . . . . . . . . . . . . . . . . . . . . . . . . . . . . . . . . . . . . . . . (143) (160) (208)Fertilizer . . . . . . . . . . . . . . . . . . . . . . . . . . . . . . . . . . . . . . . . . . . . . . . . . . . . . . . . . . . . . . . . . . . . . . . . . . . . . . . . . . . . . . . . . . . . . . . . . . . . . . . . . . . . . . . . . . . . . . . . . . . . . . . . . . . . . . . . . . . . . . . . (12) (15) (16)
Total . . . . . . . . . . . . . . . . . . . . . . . . . . . . . . . . . . . . . . . . . . . . . . . . . . . . . . . . . . . . . . . . . . . . . . . . . . . . . . . . . . . . . . . . . . . . . . . . . . . . . . . . . . . . . . . . . . . . . . . . . . . . . . . . . . . . . . . . . . . . . . . . . . . $ (547) $ (545) $ (607)
Net income attributable to Bunge . . . . . . . . . . . . . . . . . . . . . . . . . . . . . . . . . . . . . . . . . . . . . . . . . . . . . . . . . . . . . . . . . . . . . . . . . . . . . . . . . . . . . . . . . . . . . . . . . . . . . . . . . . . . . . . $ 745 $ 791 $ 515
(1) We refer to our earnings before interest and taxes as ‘‘Segment EBIT’’. Total Segment EBIT is an operating performance measure used by Bunge’s management to evaluate itssegments’ operating activities. Total segment EBIT is a non-U.S. GAAP financial measure and is not intended to replace net income attributable to Bunge, the most directlycomparable U.S. GAAP financial measure. Bunge’s management believes segment EBIT is a useful measure of its segments’ operating profitability, since the measure allows for anevaluation of the performance of its segments without regard to its financing methods or capital structure. In addition, EBIT is a financial measure that is widely used by analysts andinvestors in Bunge’s industries. Total segment EBIT is not a measure of consolidated operating results under U.S. GAAP and should not be considered as an alternative to net incomeattributable to Bunge or any other measure of consolidated operating results under U.S. GAAP.
A reconciliation of net income attributable to Bunge to Total segment EBIT follows:
YEAR ENDED DECEMBER 31,(US$ in millions) 2016 2015 2014
Net income attributable to Bunge . . . . . . . . . . . . . . . . . . . . . . . . . . . . . . . . . . . . . . . . . . . . . . . . . . . . . . . . . . . . . . . . . . . . . . . . . . . . . . . . . . . . . . . . . . . . . . . . . . . . . . . . . . . . . . . . . . . . . . . . $ 745 $ 791 $515Interest income . . . . . . . . . . . . . . . . . . . . . . . . . . . . . . . . . . . . . . . . . . . . . . . . . . . . . . . . . . . . . . . . . . . . . . . . . . . . . . . . . . . . . . . . . . . . . . . . . . . . . . . . . . . . . . . . . . . . . . . . . . . . . . . . . . . . . . . . . . . . . . . (51) (43) (87)Interest expense . . . . . . . . . . . . . . . . . . . . . . . . . . . . . . . . . . . . . . . . . . . . . . . . . . . . . . . . . . . . . . . . . . . . . . . . . . . . . . . . . . . . . . . . . . . . . . . . . . . . . . . . . . . . . . . . . . . . . . . . . . . . . . . . . . . . . . . . . . . . . . 234 258 347Income tax expense . . . . . . . . . . . . . . . . . . . . . . . . . . . . . . . . . . . . . . . . . . . . . . . . . . . . . . . . . . . . . . . . . . . . . . . . . . . . . . . . . . . . . . . . . . . . . . . . . . . . . . . . . . . . . . . . . . . . . . . . . . . . . . . . . . . . . . . . . 220 296 249(Income) loss from discontinued operations . . . . . . . . . . . . . . . . . . . . . . . . . . . . . . . . . . . . . . . . . . . . . . . . . . . . . . . . . . . . . . . . . . . . . . . . . . . . . . . . . . . . . . . . . . . . . . . . . . . . . . . . . . . 9 (35) (32)Noncontrolling interests’ share of interest and tax . . . . . . . . . . . . . . . . . . . . . . . . . . . . . . . . . . . . . . . . . . . . . . . . . . . . . . . . . . . . . . . . . . . . . . . . . . . . . . . . . . . . . . . . . . . . . . . . . . (14) (19) (36)
Total segment EBIT . . . . . . . . . . . . . . . . . . . . . . . . . . . . . . . . . . . . . . . . . . . . . . . . . . . . . . . . . . . . . . . . . . . . . . . . . . . . . . . . . . . . . . . . . . . . . . . . . . . . . . . . . . . . . . . . . . . . . . . . . . . . . . . . . . . . . . . . . . $1,143 $1,248 $956
2016 Compared to 2015 $791 million in 2015. This decline resulted primarily from adecrease in Total Segment EBIT of $105 million and reduced
Net Income Attributable to Bunge. For the year ended income from discontinued operations of $44 million, partiallyDecember 31, 2016, net income attributable to Bunge of offset by lower income tax expenses of $76 million, lower net$745 million represents a decrease of $46 million from interest expense of $24 million and higher interest income of
2016 Bunge Annual Report 25
26
$8 million. Agribusiness Segment EBIT decreased by cost of goods sold in the year ended December 31, 2016 when$233 million primarily due to lower gross profit driven by compared to the same period last year.weaker results in our oilseed processing and grain origination
Gross profit decreased 20% to $1,490 million, frombusinesses, trading and distribution activities and risk$1,858 million in 2015, primarily driven by lower results inmanagement contributions that were lower than the sameoilseed processing and grain origination and to a lesser extentperiod last year, partially offset by lower industrial and SG&Ain our trading and distribution businesses. In oilseeds, soyexpenses. Results in 2016 benefitted from $120 million of gainsprocessing results in the United States, Brazil and Europeon the disposition of equity interests of port and transshipmentdeclined from a strong performance in 2015 due to lower crushoperations in Brazil and an oilseed crush facility in Vietnammargins. In grain origination, gross profit in Brazil significantlyand 2015 results included a $47 million gain on the sale ofdeclined from strong performances in the same period lastgrain assets in Canada. The Agribusiness Segment EBITyear, primarily due to slower farmer selling and lower margins.decline was partially offset by an increase in EBIT across allIn trading and distribution, results declined primarily due toother segments. Edible Oil Products Segment EBIT improvedlower contribution from our risk management activities.$53 million primarily due to improved results in Brazil and
lower SG&A expense. Milling Products Segment EBIT improvedSG&A expenses were $706 million in 2016 compared to$28 million primarily driven by increased gross profit in Brazil$851 million in 2015. This reduction was primarily driven by afrom stronger demand for flour in the food service industry, thereduction in headcount, cost-cutting initiatives, lower bad debtcontribution to results from a wheat mill acquired in the fourthexpenses and the result of the conversion of local currencyquarter of 2015 and a recovery of $14 million in Brazilian wheatcosts into U.S. dollars as a result of the weakening of mostimport taxes paid in prior years. Sugar and Bioenergy Segmentglobal currencies relative to the U.S. dollar, with exception ofEBIT improved $23 million primarily due to foreign exchangethe Brazilian real, which appreciated in 2016.gains, partly offset by restructuring and impairment charges.
Fertilizer Segment EBIT improved $24 million primarily due toForeign exchange results in 2016 were a loss of $7 million,increased gross profit because of higher fertilizer sales incompared to gains of $67 million in 2015. These results wereArgentina driven by higher fertilizer usage by farmers and therelated primarily to results on certain currency hedges and thereversal of a gas tariff contingency from prior years totalingmovements in the Brazilian real and Argentine peso.$11 million. Income tax expense decreased $76 million due to
the effect of reduced taxable income and a lower effective tax Gains on the disposition of grain and oilseed assets wererate in 2016 primarily due to geographical earnings mix and $120 million in 2016. The disposition of a 50% ownershipthe net positive impact of certain income tax benefits and interest in our Terfron port and transshipment terminal in Brazilcharges. Interest expense included the $26 million reversal of to Amaggi Exportacao E Importacao Ltda. (‘‘Amaggi’’) resultedinterest recorded in previous years in Brazil and Argentina. in a $92 million gain and $2 million related losses recorded inDiscontinued operations results declined $44 million primarily foreign exchange results. Additionally, the disposition of a 45%driven by the translation impact of a stronger Brazilian real interest in our Vietnam crush operations to Wilmar Internationalrelative to the U.S. dollar in 2016. Limited (‘‘Wilmar’’) resulted in a gain of $30 million. In 2015, a
gain of $47 million was recorded on the sale of Canadian grainIncome Tax Expense. In the year ended December 31, 2016,assets to G3 Canada Limited (formerly the Canadian Wheatincome tax expense was $220 million compared to $296 millionBoard).in 2015. The effective tax rate in 2016 was 22% compared to
28% in 2015. The lower effective tax rate in 2016 was primarilyOther income (expense)-net was income of $24 million anddue to the favorable impact of refund claims in North Americaexpense of $3 million for 2016 and 2015, respectively. Theand Europe, along with favorable geographical earnings mix.improvement in other income (expense)-net was primarily dueto improvements in the results of certain non-consolidatedAgribusiness Segment. Agribusiness segment net salesequity investments; mostly in our logistics joint ventures indecreased 4% to $30.1 billion in 2016 compared to $31.3 billionBrazil and in PT Bumiraya Investindo (‘‘BRI’’), our palm oilin 2015, with volumes being essentially flat. Volumes wereplantation joint venture in Indonesia.lower in Brazil driven by reduced farmer selling and a reduced
corn crop due to drought. In Asia, volumes were lower in ourImpairment and restructuring charges of $27 million in 2016oilseed processing businesses driven by weaker margins and inincluded an impairment charge of $15 million for BRI andour trading and distribution businesses. These decreases were$12 million for intangible assets related to aquaculture andpartially offset by higher volumes in grain origination in Northother related patents.America and Europe, which benefitted from larger crops and in
Argentina as a result of normalized commercialization following Noncontrolling interests represent (income) loss attributed tothe elimination on grain export taxes and the devaluation of the noncontrolling interest holders in joint venture operationsthe Argentine peso in December 2015. that are consolidated in our financial statements.
Noncontrolling interests generated income of $21 million inCost of goods sold decreased by 3% to $28.6 billion in 2016,2016 compared to income of $9 million in 2015. The increasedcompared with $29.4 billion last year in line with the reductions2016 income was primarily driven by our oilseed processingin net sales noted above. In addition, lower industrial costs dueactivities in Asia-Pacific and Europe partially offset by theto the relative weakening of most currencies to the U.S. dollardeconsolidation of a Brazilian grain terminal, which reportedand certain insurance recovery benefits contributed to lowerincome in 2015.
26 2016 Bunge Annual Report
27
Segment EBIT decreased to $875 million in 2016 from decreases in Mexico. The net volume increase was mostly$1,108 million in 2015, primarily driven by lower gross profit offset by the weakening of the Mexican peso by 18% againstdue to weaker crush margins that drove reduced soy the U.S. dollar and lower selling prices of flour due to lowerprocessing results in the United States, Brazil and Spain, commodity prices in wheat, our primary raw material.weaker softseed processing results in Europe, lower grain
Cost of goods sold increased slightly to $1,378 million in 2016origination results in Brazil due to weaker farmer sellingfrom $1,372 million in 2015, primarily driven by volumecompared to a strong performance in 2015, and lowerincrease, partially offset by lower commodity prices in wheat,contributions from risk management. Foreign exchange resultsand net foreign exchange effects on local currency industrialreduced Segment EBIT by $74 million. The decrease wascosts, lower energy prices in the United States and a recoverypartially offset by $120 million pre-tax gains on the dispositionof $14 million in Brazilian wheat import taxes paid in priorof equity interests in Brazil and Vietnam and lower SG&Ayears.expenses. In 2015, we recorded a pre-tax gain of $47 million
on the sale of certain grain assets in Canada.Gross profit improved by $32 million to $269 million in 2016
Edible Oil Products Segment. Edible oil products segment net from $237 million in 2015, primarily from higher volumes andsales were $6.9 billion in 2016 compared to $6.7 billion in 2015. improved unit margins in wheat milling products in Brazil, theThese higher sales are primarily due to a volume increase of incremental gross profit from the acquisition of the Moinho2% resulting from a higher market share of packaged oil Pacifico wheat mill in Brazil, which occurred in the fourthproducts in Brazil, refined oils in Canada and the additional net quarter of 2015 and the recovery of $14 million in Braziliansales derived from our acquisition of a 62.8% equity stake in import taxes paid in prior years. These increases were partiallyWalter Rau Neusser in Germany. offset by lower gross profit in Mexico as volumes were lower in
2016 compared to 2015.Cost of goods sold increased 2% to $6.4 billion in 2016 from$6.3 billion in 2015. The higher costs were in line with the SG&A expenses increased to $127 million in 2016 fromincrease in net sales, as noted above. In 2015, cost of goods $123 million in 2015, mainly due to SG&A expenses related tosold was negatively impacted by a $15 million impairment the Moinho Pacifico wheat mill in Brazil, which we acquired incharge related to the closure of an edible oils packaging the fourth quarter of 2015. This increase was partially offset byfacility in the United States. the net translation benefit of the stronger Brazilian real and
weaker Mexican peso on the translation of local currencyGross profit increased 9% to $439 million in 2016 from expenses to U.S. dollars as well as benefits from our$404 million in 2015. The increase was primarily driven by performance improvement initiatives to contain costs.higher market share for packaged oils products in Brazil,stronger demand for refined oil in Canada and improved Segment EBIT increased to $131 million in 2016 fromvolumes and margins in India, partially offset by weaker $103 million in 2015, primarily as a result of higher gross profitmargins in our margarines business in Europe. In addition, in Brazil due to higher volumes and improved margins, resultsgross profit for 2015 was reduced by the $15 million from the Moinho Pacifico wheat mill, acquired in the fourthimpairment charge noted above. quarter of 2015 and a recovery of $14 million in Brazilian wheat
import taxes paid in prior years.SG&A expenses decreased to $320 million in 2016 from$328 million in 2015, primarily as a result of lower marketing Sugar and Bioenergy Segment. Sugar and Bioenergy segmentexpenses, savings from cost-cutting initiatives and the net sales increased 6% to $3.7 billion in 2016 compared toweakening of most currencies relative to the U.S. dollar, partly $3.5 billion in 2015, as a result of higher average market pricesoffset by the appreciation of the Brazilian real in 2016. of raw sugar and ethanol of 39% and 24%, respectively. The
impact on sales of these price increases was partially offset byGoodwill and intangible impairments of $13 million in 2015a decrease in volumes in our industrial operations due to therepresent the full impairment of goodwill in our Brazilianadverse weather in Brazil that reduced crushing volume and intomato products business.our global trading and merchandising activities, where higherglobal sugar prices reduced demand. In addition, sales in ourSegment EBIT increased by $53 million to $112 million in 2016,industrial operations in Brazil were lower driven by ourcompared to $59 million in 2015. Gross profit improved due tocommercial decision to carry less inventories into 2016 than weincreased market share in Brazil packaged oils, improveddid in the previous year.results in refined oil in Canada and India, and lower SG&A
expenses. Additionally, 2015 included impairment chargesCost of goods sold increased 7% to $3.6 billion in 2016related to the goodwill of the Brazil tomato products businesscompared to $3.3 billion in 2015, in line with the sales increaseand the closure of an edible oils packaging facility in thenoted above, primarily due to the increase in sugar and ethanolUnited States.prices, partially offset by a decline in volumes.
Milling Products Segment. Milling products segment net salesincreased by 2% to $1,647 million in 2016 from $1,609 million Gross profit was $159 million in 2016 compared to $164 millionin 2015, primarily from an 8% increase in volumes primarily as in 2015. In 2016, higher sugar and ethanol prices in Brazil werea result of our acquisition of the Moinho Pacifico wheat mill in partly offset by lower volumes, which drove per unit increasesBrazil, which occurred in the fourth quarter of 2015. In in sugar and ethanol industrial cost. Gross profit in 2015addition, sales increased in our rice and corn milling benefitted from the classification of currency hedge lossesbusinesses in the United States, partially offset by volume reported separately in foreign exchange gains and losses.
2016 Bunge Annual Report 27
28
SG&A expenses were $112 million in 2016, 3% higher Interest. A summary of consolidated interest income andcompared to $109 million in 2015, driven by increases in local expense for the periods indicated follows:currency costs in Brazil due to higher inflation, partially offsetby lower personnel costs from cost-cutting initiative. In addition YEAR ENDED DECEMBER 31,the appreciation of the Brazilian real, relative to the U.S. dollar (US$ in millions) 2016 2015resulted in higher expense when converted into U.S. dollar.
Interest income $ 51 $ 43Interest expense (234) (258)Foreign exchange results in 2016 were gains of $9 million,
compared to losses of $68 million in 2015. These results wereInterest income increased by $8 million to $51 million in 2016related primarily to results on certain currency hedges.compared to $43 million in 2015, primarily due to higheraverage cash and cash equivalent balances held in certainEquity investment impairment charges of $44 million in 2016Brazilian operating entities. Interest expense decreasedincluded an impairment charge of our equity investment in$24 million to $234 million in 2016 from $258 million in 2015,Solazyme Bunge Renewable Oils (‘‘SB Oils’’), our joint ventureprimarily due to the reversal of previously recorded interestthat operates a commercial-scale algae oils facility adjacent toexpense of $16 million for certain ICMS tax credits in Brazilour Moema sugarcane mill in Brazil.that were recorded in 2014 and $10 million related to unpaid
Segment EBIT improved by $23 million to a loss of $4 million in tariffs for natural gas in Argentina, which were found invalid by2016, compared to a loss of $27 million in 2015 primarily due an Argentine Supreme Court ruling in 2016.to improved results in our industrial operations and foreign
Discontinued Operations. Discontinued operations results inexchange gains on certain currency hedges partially offset by2016 were a loss of $9 million, net of tax, compared to incomeimpairment of $44 million in SB Oils.of $35 million, net of tax, in 2015. Results declined in 2016
Fertilizer Segment. Fertilizer segment net sales increased 4% to primarily due to cumulative translation adjustments, driven by$403 million in 2016 compared to $386 million in 2015, the appreciation of the Brazilian real relative to the U.S. dollar.primarily due to an increase of 30% in volumes from highernitrogen and phosphate fertilizer usage in Argentina as a result 2015 Compared to 2014of expanded corn and wheat planting areas. The impact ofhigher sales was substantially offset by a decrease in global Net Income Attributable to Bunge. Net income attributable tonitrogen, phosphate and single superphosphate prices. In 2015 Bunge for 2015 was $791 million compared to $515 million forvolumes were impacted by a strike in one of our plants. 2014. The increase in Total Segment EBIT of $292 million
discussed below and reduced net interest cost of $45 millionCost of goods sold was $350 million in 2016, compared to driven by lower average borrowings during the year was$356 million in 2015 driven by lower industrial costs and lower partially offset by the higher income tax expense ($296 millioncosts from nitrogen, as we were required to import higher cost in 2015 compared with $249 million in 2014) on the highernitrogen last year due to the 2015 strike. This was partially income from continuing operations, before taxes.offset by an increase in volumes in 2016. In addition, in 2016
Income Tax Expense. In 2015, income tax expense fromwe recorded a reversal of a natural gas tariff reserve ofcontinuing operations increased to $296 million from$11 million due to a recent Argentine Supreme Court decision$249 million in 2014 and the effective tax rate in 2015finding the tariff invalid. We also recorded a $9 milliondecreased to 28% compared to 34% in 2014. Income taximpairment charge in 2016 on long lived assets related to aexpenses in 2015 included net tax charges of $16 million thatfertilizer production line in one of our plants in Argentina.resulted primarily from the establishment of income tax
Gross profit increased to $53 million in 2016 from $30 million in valuation allowances in Asia-Pacific partially offset by the2015. The increase was primarily driven by improved gross release of income tax valuation allowances in North America.profit in Argentina resulting from the increased usage of The lower effective tax rate for 2015 resulted mainly fromfertilizers by the Argentine farmer from planting a larger crop geographical earnings mix and valuation allowance movements.area, improved fertilizer unit margins and lower product costs.
Agribusiness Segment. Agribusiness segment net salesGross profit in 2015 was impacted by a strike in one of ourdecreased 26% to $31.3 billion in 2015 compared toplants.$42.1 billion in 2014. The decrease was primarily driven bysignificantly lower global commodity prices in 2015 comparedSegment EBIT improved by $24 million to $29 million in 2016to 2014, especially soybean prices which were on average 24%compared to $5 million in 2015, primarily due to improvedlower. Volumes decreased 3% driven by lower grain originationgross profit driven by higher volumes and margins inand grain and oilseed trading and distribution volumes,Argentina.partially offset by higher oilseed processing volumes. In ourgrains business, origination volumes declined in North Americadue to lower farmer selling and a reduction in volumes relatedto the sale of certain Canadian grain assets in the third quarterto G3 Canada Limited (formerly the Canadian Wheat Board).Argentina grain origination was down as farmers retained their
28 2016 Bunge Annual Report
29
crops in anticipation of a more favorable environment following Segment EBIT increased 24% to $1,108 million in 2015 fromthe December presidential election. The reduced grain $890 million in 2014 primarily as a result of improved grossorigination volumes in North America and Argentina were profit in our oilseed processing business, grain trading andpartly offset by higher volumes in Brazil during the latter part distribution business, a reduction in SG&A, primarily from theof 2015 as farmers were strong sellers in order to fix their local weakening of global currencies against the U.S. dollar and aBrazilian real sales at relatively high rates as the Brazilian real $47 million gain on the sale of certain assets in Canada to G3weakened against the U.S. dollar. In oilseed processing, higher Canada Limited.volumes in North America, Asia, Brazil and Argentina driven by
Edible Oil Products Segment. Edible Oil Products segment netstrong crush margins were fully offset by lower globalsales were $6.7 billion in 2015 compared to $8.0 billion in 2014.commodity prices. In our trading and distribution businesses,The lower net sales in 2015 were primarily a result of lowervolumes were lower in both grains and oilseeds in mostglobal vegetable oil prices and the translation impact of weakerregions due to a soft margin environment.global currencies relative to the U.S. dollar. Volumes in 2015were essentially flat as higher demand in India and China wereCost of goods sold decreased by 27% to $29.4 billion in 2015,offset by a decline in Brazil and Europe, resulting from weakcompared with $40.4 billion last year as a result of lower globaleconomic conditions, which directly impacted packaged oil andcommodity prices and the translation effect of weaker globalmargarine demand.currencies compared with 2014. The average global price of
soybeans, corn and wheat declined 24%, 9% and 14%,Cost of goods sold decreased 15% to $6.3 billion in 2015 fromrespectively in 2015 compared to 2014. The volume decline of$7.4 billion in 2014, due to lower raw material costs resulting3% noted above also contributed to the decline in cost offrom market price declines of edible oils, lower demand ingoods sold. Improvement in ocean freight costs, particularlyBrazil and Europe, which lowered production volumes, and thebunker fuel procurement, and in ports and services alsotranslation impact of the weaker global currencies relative tocontributed to the lower year-over-year cost. In addition, in thethe U.S. dollar. Cost of goods sold in 2015 included ansecond quarter of 2015 we reversed a $30 million export taximpairment charge of $15 million related to the announcedcontingency in our Argentine subsidiary.closure of one of our U.S. edible oil packaging facilities.
Gross profit increased 7% to $1,858 million in 2015 fromGross profit in 2015 decreased to $404 million from$1,742 million in 2014, primarily driven by improved$548 million in 2014. The decrease was driven by lowerperformance in our oilseed processing business, particularly involumes and margins in Brazil and Europe as consumersChina, Argentina, the U.S., and Brazil, partially offset byreduced purchases and traded down to lower value products.declines in softseed processing in Europe and Canada. GrainThe impact of the weaker economic environment was partlytrading and distribution also benefitted from improved oceanoffset by cost benefits from our performance improvementfreight costs and port logistics operations. These increasesprograms. An impairment charge of $15 million in 2015 relatingmore than offset weak grain origination margins in the Unitedto the closure of a U.S. facility also contributed to the reducedStates primarily driven by lack of export demand due to thegross profit.impacts of stronger U.S. dollar.
SG&A expenses decreased to $328 million in 2015 fromSG&A expenses were $851 million in 2015 compared to$482 million in 2014, primarily as a result of the translation$875 million in 2014. SG&A benefitted in 2015 from weakerbenefits of the strengthening U.S. dollar relative to other globalcurrencies as local currency costs were translated into U.S.currencies, notably the Brazilian real, Argentine peso and eurodollars, partially offset by an impairment charge of $14 millionas well as our cost reduction initiatives. In addition, 2014in our equity method investment in a freight shipping companyincluded $98 million of expenses related to certain ICMS taxand a $9 million charge of administrative tax assessment feescredits in Brazil.related to export activities in our Argentine subsidiary for 2008
through 2009.A goodwill impairment charge of $13 million, representing all ofthe goodwill of the Brazilian tomato products business, wasForeign exchange gains were $67 million in 2015 compared torecorded in the fourth quarter of 2015 upon completion of ourgains of $39 million in the same period of 2014. These resultsannual impairment analysis.were primarily driven by movements in the Brazilian real and
the Argentine peso.Segment EBIT was $59 million in 2015 compared to $58 millionin 2014. EBIT for 2015 included a charge of $15 million for theNoncontrolling interests represent (income) loss attributed toannounced closure of a packaged oil plant in the United Statesthe noncontrolling interest holders in joint venture operationsand a $13 million goodwill impairment charge in our Brazilianthat are consolidated in our financial statements. The incometomato products business. EBIT for 2014 included an expenseof $9 million in 2015 compared to income of $23 million inof $98 million related to certain ICMS tax credits in Brazil.2014 and was primarily driven by lower results in our U.S.Excluding the effects of these items, results declined byPacific Northwest port operation and oilseed and biodiesel$69 million driven by lower volumes and margins in Brazilproduction joint ventures in Europe.edible oils, and margarines in Europe as consumerspulled-back on purchases and traded down to lower valueGain on the sale of Canadian grain assets to G3 Canadaproducts. This was partially offset by lower SG&A expenses asLimited (formerly the Canadian Wheat Board) was $47 million.a result of the factors noted above.
2016 Bunge Annual Report 29

30
Milling Products Segment. Milling Products segment sales impairment and related charges related to one of our sugardecreased by 22% to $1,609 million in 2015 from $2,064 million mills. Excluding the impairment and related charges, resultsin 2014 in part due to approximately 9% lower average prices improved by $92 million primarily driven by improved results infor corn and 14% lower average prices for wheat. Volumes our industrial operations resulting from increased efficiency,declined 7% compared to the same period last year, primarily both in volumes crushed and lower related industrial costs, asin our wheat milling business in Brazil, which was impacted by well as higher volumes and margins in cogeneration. In ourthe weak economic environment that depressed demand, as global trading and distribution operations, higher volumes werewell as in our U.S. corn milling operations, driven by soft more than offset by lower margins.demand in the ready-to-eat cereal and brewery industries.
SG&A expenses were $109 million in 2015, 30% lower comparedAdditionally, the foreign exchange impact from the devaluationto $156 million in 2014, driven by translation benefits of theof the Brazilian real and Mexican peso against the U.S. dollardevaluation of the Brazilian real on local currency costs, and costfor our Brazilian and Mexican operations negatively impactedreduction and efficiency initiatives in our sugar milling business. Insales.addition, 2015 and 2014 included $5 million and $20 million,
Cost of goods sold decreased 22% to $1,372 million in 2015 respectively, of restructuring costs, which include costs of ourfrom $1,753 million in 2014 primarily due to lower volumes, strategic review of the sugar milling business.lower commodity raw material costs in corn and wheat and the
Foreign exchange results in 2015 were losses of $68 million,translation impact of the devaluation of the Brazilian real andcompared to gains of $19 million in 2014. These results wereMexican peso against the U.S. dollar.related primarily to results on certain currency hedges.
Gross profit decreased to $237 million in 2015, fromOther income (expenses) — net was expense of $15 million in$311 million in 2014, primarily due to lower volumes and2015 compared to income of $10 million in 2014. Results in ourmargins in Brazil related to food service and retail channelsNorth American ethanol investment were lower as theand lower volumes in U.S. corn milling as a result of depresseddecrease in global oil prices resulted in lower ethanol margins.demand from the ready-to-eat cereal and brewery industries inResults also decreased in our joint venture for the productionthe first half of 2015. Margins in Brazil were adverselyof renewable oils in Brazil and our corn wet-milling jointimpacted by the effects of the currency devaluation.venture in Argentina.
SG&A expenses decreased by $45 million to $123 million inSegment EBIT improved by $141 million to a loss of $27 million2015 from $168 million in 2014 mainly resulting from thein 2015, compared to a loss of $168 million in 2014. Resultsbenefit of the weaker Brazilian real and Mexican peso on thewere impacted by $5 million of restructuring charges andtranslation of local currency expenses. In addition, 2014$133 million of impairment and restructuring charges in 2015included $14 million of expenses related to certain ICMS taxand 2014, respectively. Excluding the impairment andcredits in Brazil.restructuring charges, results improved by $13 million due to
Segment EBIT decreased to $103 million in 2015 from improved performance in our industrial milling operations in$131 million in 2014, as weaker demand in Brazil and the U.S. Brazil and lower SG&A expenses from the translation benefit ofresulted in lower volumes and margins, partially offset by lower the weaker Brazilian real on local currency costs, partiallySG&A expenses. offset by foreign exchange losses and lower results in certain
joint ventures.Sugar and Bioenergy Segment. Sugar and Bioenergy segmentnet sales decreased to $3.5 billion in 2015 compared to Fertilizer Segment. Fertilizer segment net sales decreased 19%$4.5 billion in 2014. The 23% decrease in sales was primarily to $386 million in 2015 compared to $474 million in 2014,driven by lower global average prices of sugar and the primarily due to lower fertilizer imports in Brazil. In Argentina,significant devaluation of the Brazilian real impacting our local sales declined mainly due to lower volumes driven by reducedcurrency net sales when translated into U.S. dollars. This was fertilizer usage by Argentine farmers as a result of the localpartially offset by higher average domestic ethanol prices in economic environment and lower farm margins for corn andBrazil and an increase in volumes. On average, the futures wheat production. In addition, in the first quarter of 2015,price of raw sugar was 20% lower in 2015 compared 2014. volumes were reduced due to a strike at one of our facilities.Average ethanol prices in Brazil were higher by 8% driven by a
Cost of goods sold was $356 million in 2015, compared tolarge increase in the fourth quarter. Partially offsetting the$413 million in 2014. Lower volumes and raw material costssales decreases was an improvement in volumes of 8%and the translation benefit of the weaker Argentine peso, werecompared to 2014, primarily due to increased activity in ourpartly offset by higher cost imports of nitrogen due to theglobal trading and merchandising operations.aforementioned strike.
Cost of goods sold decreased 27% to $3.3 billion in 2015,Gross profit decreased to $30 million in 2015 from $61 millioncompared to $4.6 billion in 2014, primarily driven by lowerin 2014. The decrease was primarily driven by lower volumesprices of purchased sugarcane and the impact of the weakerand not fully recovered industrial costs in our Brazilian portBrazilian real relative to the U.S. dollar, partially offset by higheroperations. Gross profit in our Argentine operation wasvolumes.impacted by higher production costs, depressed volumes from
Gross profit was $164 million in 2015. This compared to a loss lower farmer fertilizer usage and impacts of a strike at one ofof $41 million in 2014, which included $113 million of our facilities.
30 2016 Bunge Annual Report
31
SG&A was $24 million in 2015 compared to $10 million in 2014. assets are generally financed with a combination of equity andThe lower expense in 2014 includes the reversal of certain long-term debt.value added tax, labor and bad debt provisions in Brazil.
Our current ratio, which is a widely used measure of liquidityNoncontrolling interests represents (income) loss attributed to and is defined as current assets divided by current liabilities,the noncontrolling interest holders in operations that are was 1.44 and 1.49 at December 31, 2016 and 2015,consolidated in our financial statements. The $1 million income respectively.in 2015 and $5 million income in 2014 represents the
Cash and Cash Equivalents. Cash and cash equivalents werenoncontrolling interests share of income at our non-wholly$934 million at December 31, 2016 and $411 million atowned Brazilian port operations.December 31, 2015. Cash balances are managed in accordancewith our investment policy, the objectives of which are toSegment EBIT decreased to $5 million in 2015, compared topreserve the principal value of our cash assets, maintain a high$45 million in 2014, mainly driven by lower gross profit in ourdegree of liquidity and deliver competitive returns subject toBrazilian port operations, the impact of the strike and weakerprevailing market conditions. Cash balances are invested infarmer usage of fertilizer in Argentina and the positive SG&Ashort-term deposits with highly rated financial institutions andimpact on 2014 results.in U.S. government securities.
Interest. A summary of consolidated interest income andReadily Marketable Inventories (‘‘RMI’’). RMI are agriculturalexpense for the periods indicated follows:commodity inventories, such as soybeans, soybean meal,soybean oil, corn, wheat, and sugar that are readily convertibleYEAR ENDED DECEMBER 31,to cash because of their commodity characteristics, widely(US$ in millions) 2015 2014available markets and international pricing mechanisms. RMI in
Interest income $ 43 $ 87 our Agribusiness segment are reported at fair value and wereInterest expense (258) (347) $3,593 million at December 31, 2016 and $3,393 million at
December 31, 2015. Of these amounts $2,523 million andInterest income decreased to $43 million when compared to $2,513 million were attributable to merchandising activities atthe same period of 2014, as a result of lower cash investments December 31, 2016 and December 31, 2015, respectively. RMIin Brazil and Argentina and $12 million of accumulated interest at fair value in the aggregate amount of $123 million andon a loan provided to and repaid by a related party in 2014. $110 million at December 31, 2016 and December 31, 2015,Interest expense decreased by 26% compared to last year, respectively, were included in our Edible Oil Products segmentprimarily due to lower average outstanding debt, mainly as a inventories. The Sugar and Bioenergy segment included RMI ofresult of reduced working capital requirements due to lower $139 million and $163 million at December 31, 2016 andglobal commodity prices in 2015 and interest charges of December 31, 2015, respectively which can be attributed to our$65 million related to certain ICMS tax credits in Brazil. trading and merchandising business.
Discontinued Operations. Discontinued operations results in Financing Arrangements and Outstanding Indebtedness. We2015 were income of $35 million, net of tax, compared to conduct most of our financing activities through a centralizedincome of $32 million, net of tax, in 2014. Results in 2015, financing structure that provides the company efficient accessincluded gains in Brazilian fertilizer driven by foreign exchange to debt and capital markets. This structure includes a mastergains and the recovery of previously written-off farmer trust, the primary assets of which consist of intercompanyreceivables, which were partly offset by losses in our asset loans made to Bunge Limited and its subsidiaries. Certain ofmanagement business. Results in 2014 included benefits Bunge Limited’s 100% owned finance subsidiaries, Bungerelated to a tax amnesty program in Brazil and collections of Limited Finance Corp., Bunge Finance Europe B.V. and Bungepreviously written-off farmer receivables. Asset Funding Corp., fund the master trust with short and
long-term debt obtained from third parties, including throughLIQUIDITY AND CAPITAL RESOURCES our commercial paper program and certain credit facilities, as
well as the issuance of senior notes. Borrowings by theseLiquidity finance subsidiaries carry full, unconditional guarantees by
Bunge Limited.Our main financial objectives are to prudently manage financialrisks, ensure consistent access to liquidity and minimize cost of Revolving Credit Facilities. At December 31, 2016, we hadcapital in order to efficiently finance our business and maintain $5,015 million of aggregate committed borrowing capacitybalance sheet strength. We generally finance our ongoing under our commercial paper program and various revolvingoperations with cash flows generated from operations, issuance bilateral and syndicated credit facilities, of which all wasof commercial paper, borrowings under various bilateral and unused and available. The following table summarizes thesesyndicated revolving credit facilities, term loans and proceeds facilities as of the periods presented:from the issuance of senior notes. Acquisitions and long-lived
2016 Bunge Annual Report 31
32
TOTAL COMMITTEDCAPACITY BORROWINGS OUTSTANDING
COMMERCIAL PAPER PROGRAM DECEMBER 31, DECEMBER 31, DECEMBER 31,AND REVOLVING CREDIT FACILITIES MATURITIES 2016 2016 2015
(US$ in millions)
Commercial Paper . . . . . . . . . . . . . . . . . . . . . . . . . . . . . . . . . . . . . . . . . . . . . . . . . . . . . . . . . . . . . . . . . . . . . . . . . . . . . . . . . . . . . . . . . . . . . . 2019 $ 600 $ - $ -Long-Term Revolving Credit Facilities(1) . . . . . . . . . . . . . . . . . . . . . . . . . . . . . . . . . . . . . . . . . . . . . . . . . . . . . . . . . . . . . . . . . . . 2018 - 2019 4,415 - 752
Total . . . . . . . . . . . . . . . . . . . . . . . . . . . . . . . . . . . . . . . . . . . . . . . . . . . . . . . . . . . . . . . . . . . . . . . . . . . . . . . . . . . . . . . . . . . . . . . . . . . . . . . . . . . . . . . $5,015 $ - $752
(1) Borrowings under the revolving credit facilities that have maturities greater than one year from the date of the consolidated balance sheets are classified as long-term debt,consistent with the long-term maturity of the underlying facilities. However, individual borrowings under the revolving credit facilities are generally short-term in nature, bear interestat variable rates and can be repaid or renewed as each such individual borrowing matures.
On June 24, 2016, we completed the refinancing on a requirements. At December 31, 2016 and 2015, no borrowings$200 million three-year committed unsecured bilateral revolving were outstanding under these bilateral short-term credit lines.credit facility, to mature on June 24, 2019. A further
Short and long-term debt. Our short and long-term debt$500 million of unsecured bilateral revolving credit facilitiesdecreased by $179 million at December 31, 2016 fromwere refinanced on September 23, 2016 to mature onDecember 31, 2015, primarily due to a decrease in workingSeptember 23, 2019. Borrowings under these Facilities bearcapital requirements in the latter part of the year. For the yearinterest at LIBOR plus a margin, which will vary from 0.65% toended December 31, 2016, our average short and long-term1.40% per annum based on the credit ratings on its seniordebt outstanding was approximately $5,201 million compared tolong-term unsecured debt. Amounts under the Facilities thatapproximately $4,316 million for the year ended December 31,remain undrawn are subject to a commitment fee payable at a2015, primarily due to higher average working capital financingrate ranging from 0.20% to 0.25%.requirements, driven by higher average global commodityprices. Our long-term debt outstanding balance wasIn addition to committed credit facilities, from time-to-time, we,$4,007 million at December 31, 2016 compared tothrough our financing subsidiaries, enter into bilateral$3,795 million at December 31, 2015. The following tableshort-term credit lines as necessary based on our financingsummarizes our short-term debt activity at December 31, 2016.
WEIGHTED WEIGHTEDAVERAGE AVERAGE
OUTSTANDING INTEREST HIGHEST AVERAGE INTERESTBALANCE AT RATE AT BALANCE BALANCE RATE
DECEMBER 31, DECEMBER 31, OUTSTANDING DURING DURING(US$ in millions) 2016 2016 DURING 2016 2016 2016
Bank Borrowings . . . . . . . . . . . . . . . . . . . . . . . . . . . . . . . . . . . . . . . . . . . . . . . . . . . . . . . . . . . . . . . . . . . . . . $257 8.69% $1,179 $ 671 5.02%Commercial Paper . . . . . . . . . . . . . . . . . . . . . . . . . . . . . . . . . . . . . . . . . . . . . . . . . . . . . . . . . . . . . . . . . . . - 565 278 0.67%
Total . . . . . . . . . . . . . . . . . . . . . . . . . . . . . . . . . . . . . . . . . . . . . . . . . . . . . . . . . . . . . . . . . . . . . . . . . . . . . . . . . . . . . $257(1) 8.69% $1,744 $ 949 3.75%
(1) Includes $148 million of local currency borrowings in certain Central and Eastern European, South American, South African and Asia-Pacific countries at a weighted average interestrate of 13.63% as of December 31, 2016.
On August 15, 2016, we completed the sale of $700 million 1.85% senior notes due June 16, 2023 (‘‘Notes’’). Additionally,aggregate principal amount of 3.25% senior notes due on November 17, 2016 we completed the sale of 200 millionAugust 15, 2026. The unsecured senior notes were issued by euro (approximately $214 million) of the Notes bringing theBunge’s 100% owned finance subsidiary, Bunge Limited aggregate principal amount to 800 million euro. The NotesFinance Corp., and are fully and unconditionally guaranteed by were issued by Bunge’s 100% owned finance subsidiary, BungeBunge. The offering was made pursuant to a registration Finance Europe B.V., and are fully and unconditionallystatement filed with the U.S. Securities and Exchange guaranteed by Bunge. The offering was made pursuant to aCommission. The net proceeds of $695 million were used for registration statement filed with the U.S. Securities andgeneral corporate purposes, including, but not limited to, the Exchange Commission. The aggregated net proceeds ofrepayment of outstanding indebtedness, which includes 802 million euro (approximately $887 million) were used forindebtedness under revolving credit facilities. general corporate purposes, including, but not limited to the
repayment of outstanding indebtedness, which includesOn June 16, 2016, we completed the sale of 600 million euro indebtedness under revolving credit facilities.(approximately $670 million) aggregate principal amount of
32 2016 Bunge Annual Report

33
The following table summarizes our short and long-term debt: Our debt agreements do not have any credit rating downgradetriggers that would accelerate maturity of our debt. However,credit rating downgrades would increase our borrowing costsDECEMBER 31,under our syndicated credit facilities and, depending on their(US$ in millions) 2016 2015severity, could impede our ability to obtain credit facilities or
Short-term debt:(1)access the capital markets in the future on competitive terms.
Short-term debt, including consolidated investment A significant increase in our borrowing costs could impair ourfund debt(2)(3) $ 257 $ 648 ability to compete effectively in our business relative to
Current portion of long-term debt 938 869 competitors with higher credit ratings.Total short-term debt 1,195 1,517
Our credit facilities and certain senior notes require us toLong-term debt(4):comply with specified financial covenants, including minimumBilateral revolving credit facilities expiry 2016 - 300net worth, minimum current ratio, a maximum debt toRevolving credit facilities expiry 2018 - 452capitalization ratio and limitations on secured indebtedness. WeTerm loan due 2019 – three-month Yen LIBOR pluswere in compliance with these covenants as of December 31,0.75% (Tranche A) 243 2372016.Term loan due 2019 – fixed Yen interest rate of 0.96%
(Tranche B) 51 50Trade Receivable Securitization Program We initially entered into
Term loan due 2019 – three-month LIBOR plus 1.30%our trade receivable securitization program (the ‘‘Program’’) in
(Tranche C) 85 85June 2011, which provides us with an additional source of
4.10% Senior Notes due 2016 - 500liquidity. On May 26, 2016, Bunge and certain of its
5.90% Senior Notes due 2017 250 250subsidiaries renewed and amended its $700 million trade
3.20% Senior Notes due 2017 600 600receivables securitization program, which terminates on
8.50% Senior Notes due 2019 600 600May 26, 2021. However, each committed purchaser’s
3.50% Senior Notes due 2020 497 497commitment to fund trade receivables sold under the Program
1.85% Senior Notes due 2023 – Euro 843 -will terminate on May 26, 2019 unless extended in accordance
3.25% Senior Notes due 2026 694 -with the terms of the receivables transfer agreement.
Other(5) 144 224
Subtotal 4,007 3,795 At December 31, 2016 and 2015, $628 million and $524 million,respectively, of receivables sold under the Program wereLess: Current portion of long-term debt (938) (869)derecognized from our consolidated balance sheets. Proceeds
Total long-term debt including consolidated investment received in cash related to transfers of receivables under thefund debt 3,069 2,926 Program totaled $9,197 million and $10,396 million for the years
ended December 31, 2016 and 2015, respectively. In addition,Total debt $4,264 $4,443cash collections from customers on receivables previously soldwere $9,176 million and $10,542 million for the years ended(1) Includes secured debt of $7 million and $36 million at December 31, 2016 and
December 31, 2015, respectively. December 31, 2016 and 2015, respectively. As this is arevolving facility, cash collections from customers are
(2) Includes $148 million and $137 million of local currency borrowings in certain Centralreinvested to fund new receivable sales. Gross receivables soldand Eastern European, South American, South African and Asia-Pacific countries at aunder the Program for the years ended December 31, 2016 andweighted average interest rate of 13.63% and 15.54% as of December 31, 2016 and 2015,
respectively. 2015 were $9,405 million and $10,601 million, respectively.These sales resulted in discounts of $6 million for the year
(3) There is no consolidated investment fund debt as of December 31, 2016. Includesended December 31, 2016, $5 million for the year endedconsolidated investment fund debt, for which Bunge elected to account for $22 million atDecember 31, 2015 and $7 million for the year endedfair value as of December 31, 2015.
December 31, 2014, which were included in SG&A in the(4) Includes secured debt of $34 million and $47 million at December 31, 2016 and consolidated statements of income. Servicing fees under theDecember 31, 2015, respectively.
Program were not significant in any period.(5) There is no consolidated investment fund debt as of December 31, 2016. Includesconsolidated investment fund debt, for which Bunge elected to account for $53 million at Our risk of loss following the sale of the trade receivables isfair value as of December 31, 2015. limited to the deferred purchase price receivable (‘‘DPP’’),
which at December 31, 2016 and 2015 had a fair value ofCredit Ratings. Bunge’s debt ratings and outlook by major$87 million and $79 million, respectively, and is included incredit rating agencies at December 31, 2016 were as follows:other current assets in our consolidated balance sheets (seeNote 17 to our consolidated financial statements). The DPP will
SHORT-TERM LONG-TERM be repaid in cash as receivables are collected, generally withinDEBT(1) DEBT OUTLOOK 30 days. Delinquencies and credit losses on trade receivables
Standard & Poor’s A-1 BBB Stable sold under the Program during the years ended December 31,Moody’s P-1 Baa2 Stable 2016, 2015 and 2014 were insignificant. We have reflected allFitch Not rated BBB Stable cash flows under the Program as operating cash flows in the
consolidated statements of cash flows for the years ended(1) Short-term rating applies only to Bunge Asset Funding Corp., the issuer under our
December 31, 2016 and 2015.commercial paper program.
2016 Bunge Annual Report 33
34
Interest Rate Swap Agreements. We may use interest rate swaps Limited’s common shares exceeded certain specifiedas hedging instruments and record the swaps at fair value in thresholds, each convertible perpetual preference share isthe consolidated balance sheets with changes in fair value convertible, at the holder’s option, at any time into 1.1507recorded contemporaneously in earnings. Additionally, the Bunge Limited common shares, based on the conversion pricecarrying amount of the associated debt is adjusted through of $86.901 per share, subject to certain additional anti-dilutionearnings for changes in the fair value due to changes in adjustments (which represents 7,939,830 Bunge Limitedbenchmark interest rates. Ineffectiveness, as defined in ASC common shares at December 31, 2016). At any time, if theTopic 815 Derivatives and Hedging, is recognized to the extent closing price of our common shares equals or exceeds 130% ofthat these two adjustments do not offset. the conversion price for 20 trading days during any consecutive
30 trading days (including the last trading day of such period),Equity. Total equity is set forth in the following table: we may elect to cause the convertible perpetual preference
shares to be automatically converted into Bunge LimitedDECEMBER 31, common shares at the then-prevailing conversion price. The
(US$ in millions) 2016 2015 convertible perpetual preference shares are not redeemable byus at any time.
Convertible perpetual preference shares $ 690 $ 690Common shares 1 1
Cash FlowsAdditional paid-in capital 5,143 5,105Retained earnings 8,208 7,725
Our cash flow from operations varies depending on, amongAccumulated other comprehensive income (5,978) (6,360)
other items, the market prices and timing of the purchase andTreasury shares, at cost (2016 – 12,882,313 and 2015 –
sale of our inventories. Generally, during periods when9,586,083) (920) (720)
commodity prices are rising, our Agribusiness operationsTotal Bunge shareholders’ equity 7,144 6,441 require increased use of cash to support working capital toNoncontrolling interests 199 211 acquire inventories and fund daily settlement requirements on
exchange traded futures that we use to minimize price riskTotal equity $ 7,343 $ 6,652related to our inventories.
Total Bunge shareholders’ equity increased to $7,144 million at 2016 Compared to 2015. In 2016, our cash and cashDecember 31, 2016 from $6,441 million at December 31, 2015. equivalents increased by $523 million reflecting the net effectThe change in equity was primarily due to net income of cash flows from operating, investing and financing activities.attributable to Bunge for the year ended December 31, 2016 of For the year ended December 31, 2015, our cash and cash$745 million and cumulative translation gains of $709 million, equivalents increased by $49 million reflecting the net effect ofresulting from the revaluation of global currencies relative to cash flows from operating, investing and financing activities.the U.S. dollar in 2016. This increase partially offset by paiddividends to common and preferred shareholders of Cash provided by our operating activities was $1,904 million for$223 million and $34 million, respectively and treasury shares the year ended December 31, 2016 compared to $610 millionacquired of $200 million. for the year ended December 31, 2015. Net cash inflows from
operating activities for the years ended December 31, 2016 andNoncontrolling interest decreased to $199 million at 2015, were principally due to net income, includingDecember 31, 2016 from $211 million at December 31, 2015 adjustments for non-cash items, and a decrease in the use ofprimarily due to deconsolidation of a variable interest entity cash for net operating assets and liabilities. In 2016, higherthat was previously consolidated and dividends paid to prices for sugar and the soybean complex, together withnon-controlling interest holders, partly offset by the acquisition essentially flat volumes resulted in higher working capitalof a majority share in Walter Rau Neusser. needs, however this was more than offset by initiatives to
reduce working capital and an appreciation of the Brazilian realAt December 31, 2016, we had 6,900,000 4.875% cumulative relative to the U.S. dollar, which mostly impacted tradeconvertible perpetual preference shares outstanding with an accounts payable in our Brazilian operations. In 2015, theaggregate liquidation preference of $690 million. Each increase in net operating assets and liabilities was primarilyconvertible perpetual preference share has an initial liquidation due to increases in secured advances to farmers in Southpreference of $100, which will be adjusted for any accumulated America, who were motivated to sell their record level crops asand unpaid dividends. The convertible perpetual preference the Brazilian real and Argentine peso depreciated relative toshares carry an annual dividend of $4.875 per share payable the U.S. dollar.quarterly. As a result of adjustments made to the initialconversion price because cash dividends paid on Bunge
34 2016 Bunge Annual Report
35
Certain of our non-U.S. operating subsidiaries are primarily investments in SB Oils, our joint venture with TerraViafunded with U.S. dollar-denominated debt, while currency risk Holdings Inc. to produce renewable oils in Brazil and G3.is hedged with U.S. dollar denominated assets. The functional
Cash used for financing activities was $488 million in the yearcurrency of our operating subsidiaries is generally the localended December 31, 2016, compared to cash provided bycurrency. In addition, certain of our U.S. dollar functionalfinancing activities of $360 million for the year endedoperating subsidiaries outside the United States are partiallyDecember 31, 2015. The cash used for financing activities isfunded with local currency borrowings, while the currency riskprimarily reflecting lower working capital needs, partially offsetis hedged with local currency denominated assets. Theby an increase of cash used for investing activities. Dividendsfinancial statements of our subsidiaries are calculated in thepaid to our common shareholders and holders of ourfunctional currency, and when the local currency is theconvertible preference shares were $257 million andfunctional currency, translated into U.S. dollar. U.S. dollar-$241 million, for the years ended December 31, 2016 and 2015,denominated loans are remeasured into their respectiverespectively. In connection with our common share repurchasefunctional currencies at exchange rates at the applicableprogram, in 2016, we purchased 3,296,230 of our commonbalance sheet date. Local currency loans are remeasured intoshares at a cost of $200 million and in 2015, we purchasedU.S. dollar at the exchange rate at the applicable balance sheet3,871,810 of our common shares at a cost of $300 million. Indate. The resulting gain or loss is included in our consolidatedthe year ended December 31, 2016, we paid $25 million ofstatements of income as foreign exchange gains or losses. Fordividends to non-controlling interest holders and $39 million forthe years ended December 31, 2016 and December 31, 2015,the acquisition of the non-controlling interest of a joint venturewe recorded foreign exchange losses of $80 million and gainsin Europe.of $213 million, respectively, which were included as
adjustments to reconcile net income to cash used for operating2015 Compared to 2014. In 2015, our cash and cashactivities in the line item ‘‘Foreign exchange loss (gain) onequivalents increased by $49 million reflecting the net effect ofdebt’’ in our consolidated statements of cash flows. Thiscash flows from operating, investing and financing activities.adjustment is required because the cash flow impacts of theseFor the year ended December 31, 2014, our cash and cashgains or losses are non-cash items and will represent financingequivalents decreased by $380 million.activities when the subsidiary repays the underlying debt and
therefore, have no impact on cash flows from operations. Cash provided by our operating activities was $610 million forthe year ended December 31, 2015 compared to $1,399 millionCash used for investing activities was $926 million for the yearfor the year ended December 31, 2014. Net cash inflows fromended December 31, 2016 compared to $802 million for theoperating activities for the year ended December 31, 2015 wereyear ended December 31, 2015. During 2016, payments madeprincipally due to net income, including adjustments for nonfor capital expenditures of $784 million, compared tocash items, partially offset by an increase in the use of cash$649 million during 2015, were primarily related to replanting offor net operating assets and liabilities. The increase in netsugarcane and maintenance and improvements for ouroperating assets and liabilities is primarily due to increases inindustrial sugar business in Brazil, upgrade and expansion ofsecured advances to farmers in South America who werean export terminal in the United States, construction of amotivated to sell their record level crops as the Brazilian realwheat milling facility in Brazil, the expansion of a port facility inand Argentine peso depreciated relative to the U.S. dollar. TheUkraine and the construction of oilseed processing plants innet cash provided by operating activities for the year endedUkraine and Asia-Pacific. In addition, we acquired forDecember 31, 2014 were principally due to net income,$34 million Walter Rau Neusser, a vegetable oil blendsincluding adjustments for non-cash items. The decrease in netproducer for large-scale commercial customers, based inoperating assets and liabilities in 2014 is primarily due to lowerGermany. In the year ended December 31, 2015, we paidworking capital levels than at December 31, 2013, resulting$347 million for the acquisitions of businesses, net of cashfrom, on average, lower global commodity prices, which effectacquired. In the year ended December 31, 2016, we had cashwas partially offset by the impact of the depreciation fromoutflows related to settlements of net investment hedges ofcertain currencies including the Brazilian real, Argentine peso,$375 million in the year ended December 31, 2016, primarilyUkrainian hryvnia and the euro relative to the U.S. dollar.driven by the appreciation of the Brazilian real relative to the
US dollar in 2016, compared to cash inflows of $203 million in Certain of our non U.S. operating subsidiaries are primarilythe year ended December 31, 2015. Proceeds from disposition funded with U.S. dollar denominated debt, while currency riskof investment in affiliates included $145 million and $33 million is hedged with U.S. dollar denominated assets. The functionalfor the disposition of equity interests of operations in Brazil currency of our operating subsidiaries is generally the localand Vietnam, respectively. In addition, we sold 10% of our currency. Also, certain of our U.S. dollar functional operatingminority share in G3 Global Holdings GP Inc. (‘‘G3’’) for net subsidiaries outside the United States are partially funded withproceeds of $37 million to our joint venture partner, Saudi local currency borrowings, while the currency risk is hedgedAgricultural and Livestock Investment Company (or SALIC). with local currency denominated assets. The financialProceeds from and payments for investments for both years statements of our subsidiaries are calculated in the functional2016 and 2015 included primarily purchases and sales of currency, and when the local currency is the functionalcertain marketable securities and other short term investments. currency, translated into U.S. dollar. U.S. dollar denominatedInvestments in affiliates in 2016 included additional loans are remeasured into their respective functional currencies
at exchange rates at the applicable balance sheet date. Local
2016 Bunge Annual Report 35

36
currency loans are remeasured into U.S. dollar at the exchange 2014, respectively. In connection with our common sharerate at the applicable balance sheet date. The resulting gain or repurchase program, in 2015 we purchased 3,871,810 of ourloss is included in our consolidated statements of income as common shares at a cost of $300 million and in 2014 weforeign exchange gains or losses. For the years ended purchased 3,780,987 of our common shares at a cost ofDecember 31, 2015 and December 31, 2014, we recorded $300 million. For the year ended December 31, 2014, financingforeign exchange gains of $213 million and $215 million, activities reflected reduced financing requirements due to arespectively, which were included as adjustments to reconcile declining global commodity price environment.net income to cash used for operating activities in the line item‘‘Foreign exchange loss (gain) on debt’’ in our consolidated Brazilian Farmer Creditstatements of cash flows. This adjustment is required becausethe cash flow impacts of these gains or losses are non cash Background. We advance funds to farmers, primarily in Brazil,items and will represent financing activities when the through secured advances to suppliers and prepaid commoditysubsidiary repays the underlying debt and therefore, have no purchase contracts. These activities are generally intended toimpact on cash flows from operations. be short-term in nature. The ability of our customers and
suppliers to repay these amounts is affected by agriculturalCash used for investing activities was $802 million for the year economic conditions in the relevant geography, which are, inended December 31, 2015 compared to cash used of turn, affected by commodity prices, currency exchange rates,$685 million for the year ended December 31, 2014. During crop input costs and crop quality and yields. As a result, these2015, payments made for capital expenditures of $649 million arrangements are typically secured by the farmer’s crop and, inwere primarily related to replanting of sugarcane and many cases, the farmer’s land and other assets. Upon farmermaintenance and improvements for our industrial sugar default, we generally initiate legal proceedings to recover thebusiness in Brazil, upgrade and expansion of an export defaulted amounts. However, the legal recovery processterminal in the United States, construction of a wheat milling through the judicial system is a long-term process, generallyfacility in Brazil, the expansion of a port facility in Ukraine and spanning a number of years. As a result, once accounts haveconstruction of oilseed processing plants in Ukraine and in been submitted to the judicial process for recovery, we mayAsia Pacific. We also acquired Moinho Pacifico, a Brazilian also seek to renegotiate certain terms with the defaultingwheat mill and port terminal in Santos, Brazil, Whole Harvest farmer in order to accelerate recovery of amounts owed. InFoods, a U.S. refiner and packager of expeller pressed addition, we have tightened our credit policies to reducecommercial cooking oil and Heartland Harvest, Inc., a U.S. exposure to higher risk accounts and have increased collateralbased producer of die cut pellets for the snack food industry, requirements for certain customers.and the remaining interest in a Spanish biodiesel productionfacility. Proceeds from settlement of net investment hedges Because Brazilian farmer credit exposures are denominated intotaled $203 million. Proceeds from sales of investment in local currency, reported values are impacted by movements inaffiliates included net proceeds of $88 million for the sale of the value of the Brazilian real when translated into U.S. dollars.certain assets in our grain business in Canada to G3 Canada From December 31, 2015 to December 31, 2016, the BrazilianLimited (formerly the Canadian Wheat Board). Capital real appreciated by approximately 17%, increasing the reportedexpenditures in 2015 were $649 million, 23% lower compared farmer credit exposure balances when translated into U.S.to $839 million in 2014, as a result of management’s disciplined dollars.capital management and generally lower capital expenditures
We periodically evaluate the collectability of our farmerin our industrial Sugar and Bioenergy operations in Brazil.receivable and record allowances if we determine thatProceeds from and payments for investments for both yearscollection is doubtful. We base our determination of the2015 and 2014 included primarily sales of assets in funds inallowance on analyses of credit quality of individual accounts,our asset management business and the purchases and salesconsidering also the economic and financial condition of theof certain marketable securities and other short termfarming industry and other market conditions as well as theinvestments. Investments in affiliates in 2015 included ourvalue of any collateral related to amounts owed. Wepayment for our share of G3 Canada Limited (formerly thecontinuously review defaulted farmer receivables forCanadian Wheat Board) and additional investments in SB Oils,impairment on an individual account basis. We consider allour joint venture with Solazyme, Inc. to produce renewable oilsaccounts in legal collections processes to be defaulted andin Brazil. Investments in affiliates in 2014 included primarilypast due. For such accounts, we determine the allowance forinvestments in SB Oils.uncollectible amounts based on the fair value of the associated
Cash provided by financing activities was $360 million in the collateral, net of estimated costs to sell. For all renegotiatedyear ended December 31, 2015, compared to cash used for accounts (current and past due), we consider changes in farmfinancing activities of $1,058 million for the year ended economic conditions and other market conditions, our historicalDecember 31, 2014. The increase in cash provided by financing experience related to renegotiated accounts and the fair valueactivities was primarily due to net borrowings of debt of of collateral in determining the allowance for doubtful$882 million, which were used to fund capital expenditures and accounts.increased activity in acquisitions of businesses and investments
Secured Advances to Suppliers and Prepaid Commodity Contracts.in affiliates. Dividends paid to our common shareholders andWe purchase soybeans through prepaid commodity purchaseholders of our convertible preference shares were $241 millioncontracts (advance cash payments to suppliers againstand $221 million, for the years ended December 31, 2015 and
36 2016 Bunge Annual Report
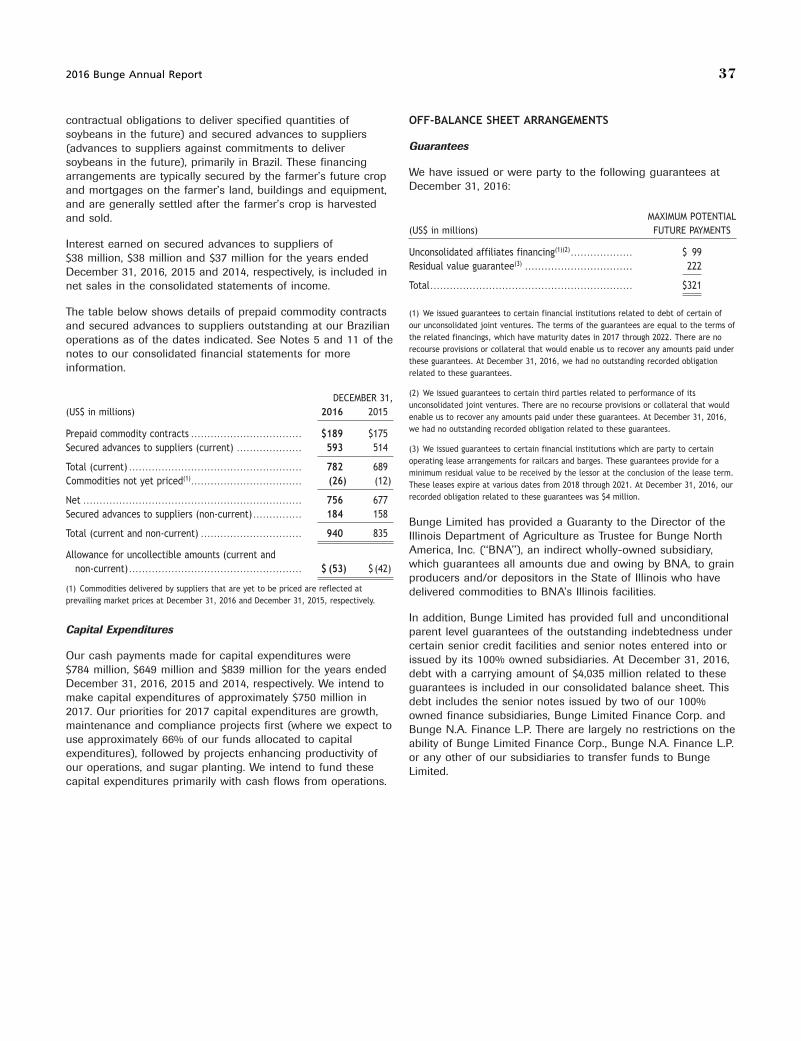
37
contractual obligations to deliver specified quantities of OFF-BALANCE SHEET ARRANGEMENTSsoybeans in the future) and secured advances to suppliers
Guarantees(advances to suppliers against commitments to deliversoybeans in the future), primarily in Brazil. These financing
We have issued or were party to the following guarantees atarrangements are typically secured by the farmer’s future cropDecember 31, 2016:and mortgages on the farmer’s land, buildings and equipment,
and are generally settled after the farmer’s crop is harvestedMAXIMUM POTENTIALand sold.
(US$ in millions) FUTURE PAYMENTSInterest earned on secured advances to suppliers of
Unconsolidated affiliates financing(1)(2) . . . . . . . . . . . . . . . . . . . $ 99$38 million, $38 million and $37 million for the years endedResidual value guarantee(3) . . . . . . . . . . . . . . . . . . . . . . . . . . . . . . . . . 222December 31, 2016, 2015 and 2014, respectively, is included inTotal . . . . . . . . . . . . . . . . . . . . . . . . . . . . . . . . . . . . . . . . . . . . . . . . . . . . . . . . . . . . . . $321net sales in the consolidated statements of income.
The table below shows details of prepaid commodity contracts (1) We issued guarantees to certain financial institutions related to debt of certain ofour unconsolidated joint ventures. The terms of the guarantees are equal to the terms ofand secured advances to suppliers outstanding at our Brazilianthe related financings, which have maturity dates in 2017 through 2022. There are nooperations as of the dates indicated. See Notes 5 and 11 of therecourse provisions or collateral that would enable us to recover any amounts paid undernotes to our consolidated financial statements for morethese guarantees. At December 31, 2016, we had no outstanding recorded obligation
information. related to these guarantees.
(2) We issued guarantees to certain third parties related to performance of itsDECEMBER 31,unconsolidated joint ventures. There are no recourse provisions or collateral that would
(US$ in millions) 2016 2015 enable us to recover any amounts paid under these guarantees. At December 31, 2016,we had no outstanding recorded obligation related to these guarantees.Prepaid commodity contracts . . . . . . . . . . . . . . . . . . . . . . . . . . . . . . . . . . $189 $175
Secured advances to suppliers (current) . . . . . . . . . . . . . . . . . . . . 593 514 (3) We issued guarantees to certain financial institutions which are party to certainoperating lease arrangements for railcars and barges. These guarantees provide for a
Total (current) . . . . . . . . . . . . . . . . . . . . . . . . . . . . . . . . . . . . . . . . . . . . . . . . . . . . . 782 689minimum residual value to be received by the lessor at the conclusion of the lease term.
Commodities not yet priced(1) . . . . . . . . . . . . . . . . . . . . . . . . . . . . . . . . . . (26) (12) These leases expire at various dates from 2018 through 2021. At December 31, 2016, ourrecorded obligation related to these guarantees was $4 million.Net . . . . . . . . . . . . . . . . . . . . . . . . . . . . . . . . . . . . . . . . . . . . . . . . . . . . . . . . . . . . . . . . . . . 756 677
Secured advances to suppliers (non-current) . . . . . . . . . . . . . . . 184 158Bunge Limited has provided a Guaranty to the Director of the
Total (current and non-current) . . . . . . . . . . . . . . . . . . . . . . . . . . . . . . . 940 835 Illinois Department of Agriculture as Trustee for Bunge NorthAmerica, Inc. (‘‘BNA’’), an indirect wholly-owned subsidiary,Allowance for uncollectible amounts (current andwhich guarantees all amounts due and owing by BNA, to grainnon-current) . . . . . . . . . . . . . . . . . . . . . . . . . . . . . . . . . . . . . . . . . . . . . . . . . . . . . $ (53) $ (42)producers and/or depositors in the State of Illinois who have
(1) Commodities delivered by suppliers that are yet to be priced are reflected at delivered commodities to BNA’s Illinois facilities.prevailing market prices at December 31, 2016 and December 31, 2015, respectively.
In addition, Bunge Limited has provided full and unconditionalCapital Expenditures parent level guarantees of the outstanding indebtedness under
certain senior credit facilities and senior notes entered into orOur cash payments made for capital expenditures were issued by its 100% owned subsidiaries. At December 31, 2016,$784 million, $649 million and $839 million for the years ended debt with a carrying amount of $4,035 million related to theseDecember 31, 2016, 2015 and 2014, respectively. We intend to guarantees is included in our consolidated balance sheet. Thismake capital expenditures of approximately $750 million in debt includes the senior notes issued by two of our 100%2017. Our priorities for 2017 capital expenditures are growth, owned finance subsidiaries, Bunge Limited Finance Corp. andmaintenance and compliance projects first (where we expect to Bunge N.A. Finance L.P. There are largely no restrictions on theuse approximately 66% of our funds allocated to capital ability of Bunge Limited Finance Corp., Bunge N.A. Finance L.P.expenditures), followed by projects enhancing productivity of or any other of our subsidiaries to transfer funds to Bungeour operations, and sugar planting. We intend to fund these Limited.capital expenditures primarily with cash flows from operations.
2016 Bunge Annual Report 37

38
CONTRACTUAL OBLIGATIONS
The following table summarizes our scheduled contractual obligations and their expected maturities at December 31, 2016, andthe effect such obligations are expected to have on our liquidity and cash flows in the future periods indicated.
PAYMENTS DUE BY PERIOD
2022 AND(US$ in millions) Total 2017 2018-2019 2020-2021 THEREAFTER
Short-term debt . . . . . . . . . . . . . . . . . . . . . . . . . . . . . . . . . . . . . . . . . . . . . . . . . . . . . . . . . . . . . . . . . . . . . . . . . . . . . . . . . . . . . . . . . . . . . . . . $ 257 $ 257 $ – $ – $ –Long-term debt(1) . . . . . . . . . . . . . . . . . . . . . . . . . . . . . . . . . . . . . . . . . . . . . . . . . . . . . . . . . . . . . . . . . . . . . . . . . . . . . . . . . . . . . . . . . . . . . . . 4,024 938 1,006 529 1,551Variable interest rate obligations . . . . . . . . . . . . . . . . . . . . . . . . . . . . . . . . . . . . . . . . . . . . . . . . . . . . . . . . . . . . . . . . . . . . . . . . . . . 14 4 9 1 –Interest obligations on fixed rate debt . . . . . . . . . . . . . . . . . . . . . . . . . . . . . . . . . . . . . . . . . . . . . . . . . . . . . . . . . . . . . . . . . . . . 542 125 193 95 129Non-cancelable lease obligations(2) . . . . . . . . . . . . . . . . . . . . . . . . . . . . . . . . . . . . . . . . . . . . . . . . . . . . . . . . . . . . . . . . . . . . . . . . . 668 152 214 131 171Capital commitments . . . . . . . . . . . . . . . . . . . . . . . . . . . . . . . . . . . . . . . . . . . . . . . . . . . . . . . . . . . . . . . . . . . . . . . . . . . . . . . . . . . . . . . . . . 72 59 13 – –Freight supply agreements(3) . . . . . . . . . . . . . . . . . . . . . . . . . . . . . . . . . . . . . . . . . . . . . . . . . . . . . . . . . . . . . . . . . . . . . . . . . . . . . . . . . 650 156 180 159 155Inventory purchase commitments . . . . . . . . . . . . . . . . . . . . . . . . . . . . . . . . . . . . . . . . . . . . . . . . . . . . . . . . . . . . . . . . . . . . . . . . . . 16 16 – – –Power supply purchase commitments . . . . . . . . . . . . . . . . . . . . . . . . . . . . . . . . . . . . . . . . . . . . . . . . . . . . . . . . . . . . . . . . . . . . . . 108 79 26 3 –
Total contractual cash obligations(4)(5) . . . . . . . . . . . . . . . . . . . . . . . . . . . . . . . . . . . . . . . . . . . . . . . . . . . . . . . . . . . . . . . . . . . . . $6,351 $1,786 $1,641 $918 $2,006
(1) Excludes changes in long-term debt attributable to fair value hedge accounting of $17 million.
(2) Represents future minimum payments under non-cancelable leases with initial or remaining terms of one year or more.
(3) In the ordinary course of business, we enter into purchase commitments for time on ocean freight vessels and freight service on railroad lines for the purpose of transportingagricultural commodities. In addition, we sell time on these ocean freight vessels when excess freight capacity is available. Payments to be received by us under such reletagreements are anticipated to be approximately $10 million in 2017. These agreements range from two months to approximately seven years in the case of ocean freight vessels and 5to 9 years in the case of railroad services. Actual amounts paid under these contracts may differ due to the variable components of these agreements and the amount of incomeearned by us on the sale of excess capacity. The railroad freight services agreements require a minimum monthly payment regardless of the actual level of freight services used by us.The costs of our freight supply agreements are typically passed through to our customers as a component of the prices we charge for our products. However, changes in the marketvalue of freight compared to the rates at which we have contracted for freight may affect margins on the sales of agricultural commodities.
(4) Does not include estimated payments of liabilities associated with uncertain income tax positions. As of December 31, 2016, Bunge had tax liabilities of $130 million, includinginterest and penalties. At this time, we are unable to make a reasonably reliable estimate of the timing of payments in individual years in connection with these tax liabilities;therefore, such amounts are not included in the above contractual obligation table. See Note 13 to our consolidated financial statements.
(5) Does not include obligations for pension and postretirement benefits for which we expect to make employer contributions of $21 million in 2017. We also expect to make asignificant contribution to our plans in future years.
In addition, we have entered into partnership agreements for CRITICAL ACCOUNTING POLICIES AND ESTIMATESthe production of sugarcane. These agreements have an
The Company’s accounting policies are more fully described inaverage remaining life of four years and cover approximatelyNote 1 to our consolidated financial statements included as211,017 hectares of land under cultivation. Amounts owedpart of this Annual Report on Form 10-K. As disclosed inunder these agreements are dependent on several variablesNote 1, the preparation of financial statements in conformityincluding the quantity of sugarcane produced per hectare, thewith U.S. GAAP requires management to make substantialtotal recoverable sugar (‘‘ATR’’) per ton of sugarcane producedjudgment or estimation in their application that mayand the price for each kilogram of ATR as determined bysignificantly affect reported amounts in the financial statementsConsecana, the Sao Paulo state sugarcane, sugar and ethanoland accompanying notes. Actual results could differcouncil. During the years ended December 31, 2016, 2015 andsignificantly from those estimates. The Company believes that2014, we made payments related to these agreements ofthe following discussion addresses the Company’s most critical$154 million, $125 million and $162 million, respectively. Ofaccounting policies, which are those that are most important tothese amounts $89 million, $75 million and $95 million for thethe portrayal of the Company’s financial condition and resultsyears ended December 31, 2016, 2015 and 2014, respectively,of operations and require management’s most difficult,were advances for future purchases and $65 million,subjective and complex judgments.$50 million and $67 million were included in cost of goods sold
in the consolidated statements of income for the years endedDecember 31, 2016, 2015 and 2014, respectively. Allowances for Uncollectible Accounts
Accounts receivable and secured advances to suppliers areEmployee Benefit Plansstated at the historical carrying amounts net of write-offs andallowances for uncollectible accounts. We establish anWe expect to contribute $13 million to our defined benefitallowance for uncollectible trade accounts receivable andpension plans and $8 million to our postretirement healthcaresecured advances to farmers based on historical experience,benefit plans in 2017.
38 2016 Bunge Annual Report
39
farming, economic and other market conditions as well as condition of the counterparties to these derivative instrumentsspecific identified customer collection issues. Uncollectible could result in additional fair value adjustments and changes inaccounts are written off when a settlement is reached for an expense reflected in cost of goods sold, foreign exchange oramount that is less than the outstanding historical balance or interest expense. We did not have significant valuationwhen we have determined that collection of the balance is adjustments relating to non-performance by counterparties atunlikely. December 31, 2016 or 2015.
We follow the accounting guidance on the disclosure of the Our RMI, forward purchase and sale contracts, and exchangecredit quality of financing receivables and the allowance for traded futures and options are primarily valued at fair value.credit losses which requires information to be disclosed at RMI are freely-traded, have quoted market prices, may be solddisaggregated levels, defined as portfolio segments and without significant additional processing and have predictableclasses. Based upon an analysis of credit losses and risk and insignificant disposal costs. We estimate fair values offactors to be considered in determining the allowance for commodity inventories and forward purchase and salecredit losses, we have determined that the long-term contracts based on exchange-quoted prices, adjusted forreceivables from farmers in Brazil are a single portfolio differences in local markets. Changes in the fair values ofsegment. these inventories and contracts are recognized in our
consolidated statements of income as a component of cost ofWe evaluate this single portfolio segment by class of goods sold. If we used different methods or factors to estimatereceivables, which is defined as a level of information (below a fair values, amounts reported as inventories and unrealizedportfolio segment) in which the receivables have the same gains and losses on derivative contracts in the consolidatedinitial measurement attribute and a similar method for balance sheets and cost of goods sold could differ.assessing and monitoring risk. We have identified accounts in Additionally, if market conditions change subsequent tolegal collection processes and renegotiated amounts as classes year-end, amounts reported in future periods as inventories,of long-term receivables from farmers. Valuation allowances for unrealized gains and losses on derivative contracts and cost ofaccounts in legal collection processes are determined by us on goods sold could differ.individual accounts based on the fair value of the collateralprovided as security for the secured advance or credit sale. The Recoverable Taxesfair value is determined using a combination of internal andexternal resources, including published information concerning We evaluate the collectability of our recoverable taxes andBrazilian land values by region. For determination of the record allowances if we determine that collection is doubtful.valuation allowances for renegotiated amounts, we consider Recoverable taxes include value-added taxes paid upon thehistorical experience with the individual farmers, current acquisition of fixed assets, raw materials and taxable servicesweather and crop conditions, as well as the fair value of and other transactional taxes, which can be recovered in cashnon-crop collateral. or as compensation against income taxes, or other taxes we
may owe, primarily in Brazil. Management’s assumption aboutFor both classes, a long-term receivable from farmers in Brazil the collectability of recoverable taxes requires significantis considered impaired, based on current information and judgment because it involves an assessment of the ability andevents, if we determine it to be probable that all amounts due willingness of the applicable federal or local government tounder the original terms of the receivable will not be collected. refund the taxes. The balance of these allowances fluctuatesRecognition of interest income on secured advances to farmers depending on the sales activity of existing inventories,is suspended once the farmer defaults on the originally purchases of new inventories, percentages of export sales,scheduled delivery of agricultural commodities as the collection seasonality, changes in applicable tax rates, cash payment byof future income is determined not to be probable. No the applicable government agencies and compensation ofadditional interest income is accrued from the point of default outstanding balances against income or certain other taxesuntil ultimate recovery, where amounts collected are credited owed to the applicable governments. At December 31, 2016first against the receivable and then to any unrecognized and 2015, the allowance for recoverable taxes was $35 millioninterest income. and $32 million, respectively. We continue to monitor the
economic environment and events taking place in theInventories and Derivatives applicable countries and in cases where we determine that
recovery is doubtful, recoverable taxes are reduced byWe use derivative instruments for the purpose of managing the allowances for the estimated unrecoverable amounts.exposures associated with agricultural commodity prices,transportation costs, foreign currency exchange rates, interest Property, Plant and Equipment and Other Finite-Livedrates and energy costs and for positioning our overall portfolio Intangible Assetsrelative to expected market movements in accordance withestablished policies and procedures. We are exposed to loss in Long-lived assets include property, plant and equipment andthe event of non-performance by counterparties to certain of other finite-lived intangible assets. When facts andthese contracts. The risk of non-performance is routinely circumstances indicate that the carrying values of property,monitored and adjustments recorded, if necessary, to account plant and equipment assets may be impaired, an evaluation offor potential non-performance. Different assumptions, changes recoverability is performed by comparing the carrying value ofin economic circumstances or the deterioration of the financial the assets to the undiscounted projected future cash flows to
2016 Bunge Annual Report 39
40
be generated by such assets. If it appears that the carrying NEW ACCOUNTING PRONOUNCEMENTSvalue of our assets is not recoverable, we recognize an
See Note 1 – Nature of Business, Basis of Presentation, andimpairment loss as a charge against results of operations. OurSignificant Accounting Policies to our consolidated financialjudgments related to the expected useful lives of property,statements in this Annual Report on Form 10-K.plant and equipment assets and our ability to realize
undiscounted cash flows in excess of the carrying amount ofsuch assets are affected by factors such as the ongoing ITEM 7A. QUANTITATIVE AND QUALITATIVEmaintenance of the assets, changes in economic conditions DISCLOSURES ABOUT MARKET RISKand changes in operating performance. As we assess the
RISK MANAGEMENTongoing expected cash flows and carrying amounts of ourproperty, plant and equipment assets, changes in these factors
As a result of our global operating and financing activities, wecould cause us to realize material impairment charges. Weare exposed to changes in, among other things, agriculturalrecorded impairment charges of $9 million for the year endedcommodity prices, transportation costs, foreign currencyDecember 31, 2016 primarily related to the impairment of anexchange rates, interest rates and energy costs which mayArgentina fertilizer plant.affect our results of operations and financial position. Weactively monitor and manage these various market risksContingenciesassociated with our business activities. Our risk managementdecisions take place in various locations but exposure limitsWe are a party to a large number of claims and lawsuits,are centrally set and monitored, operating under a globalprimarily non-income tax and labor claims in Brazil andgovernance framework. We have a corporate risk managementnon-income tax claims in Argentina, and have accrued ourgroup which analyzes and monitors various risk exposuresestimates of the probable costs to resolve these claims. Theseglobally. Additionally, our Board of Directors’ Finance and Riskestimates have been developed in consultation with in-housePolicy Committee oversees our global governance frameworkand outside counsel and are based on an analysis of potentialincluding all risk management policies and limits.results, assuming a combination of litigation and settlement
strategies. Future results of operations for any particularWe use derivative instruments for the purpose of managing thequarterly or annual period could be materially affected byexposures associated with commodity prices, transportationchanges in our assumptions or the effectiveness of ourcosts, foreign currency exchange rates, interest rates andstrategies relating to these proceedings. For more informationenergy costs and for positioning our overall portfolio relative toon tax and labor claims in Brazil, see ‘‘Item 3. Legalexpected market movements in accordance with establishedProceedings.’’policies and procedures. We enter into derivative instrumentsprimarily with major financial institutions, commodity exchangesIncome Taxesin the case of commodity futures and options, or approvedexchange clearing shipping companies in the case of oceanWe record valuation allowances to reduce our deferred taxfreight. While these derivative instruments are subject toassets to the amount that we are likely to realize. We considerfluctuations in value, for hedged exposures those fluctuationsprojections of future taxable income and prudent tax planningare generally offset by the changes in fair value of thestrategies to assess the need for and the size of the valuationunderlying exposures. The derivative instruments that we useallowances. If we determine that we can realize a deferred taxfor hedging purposes are intended to reduce the volatility onasset in excess of our net recorded amount, we decrease theour results of operations; however, they can occasionally resultvaluation allowance, thereby decreasing income tax expense.in earnings volatility, which may be material. See Note 14 toConversely, if we determine that we are unable to realize all orthe consolidated financial statements in this Annual Report onpart of our net deferred tax asset, we increase the valuationForm 10-K for a more detailed discussion of our use ofallowance, thereby increasing income tax expense.derivative instruments.
We apply a ‘‘more likely than not’’ threshold to the recognitionCREDIT AND COUNTERPARTY RISKand de-recognition of tax benefits. Accordingly we recognize
the amount of tax benefit that has a greater than 50 percentThrough our normal business activities, we are subject tolikelihood of being ultimately realized upon settlement. Thesignificant credit and counterparty risks that arise throughcalculation of our uncertain tax positions involves uncertaintiesnormal commercial sales and purchases, including forwardin the application of complex tax regulations in a multitude ofcommitments to buy or sell, and through various other OTCjurisdictions across our global operations. Future changes inderivative instruments that we utilize to manage risks inherentjudgment related to the ultimate resolution of unrecognized taxin our business activities. We define credit and counterpartybenefits will affect the earnings in the quarter of such change.risk as a potential financial loss due to the failure of aAt December 31, 2016 and 2015, we had recorded uncertaincounterparty to honor its obligations. The exposure is measuredtax positions of $130 million and $64 million, respectively, in ourbased upon several factors, including unpaid accountsconsolidated balance sheets. For additional information onreceivable from counterparties and unrealized gains from OTCincome taxes, please refer to Note 13 of the consolidatedderivative instruments (including forward purchase and salefinancial statements.contracts). Credit and counterparty risk also includes sovereigncredit risk. We actively monitor credit and counterparty risk
40 2016 Bunge Annual Report
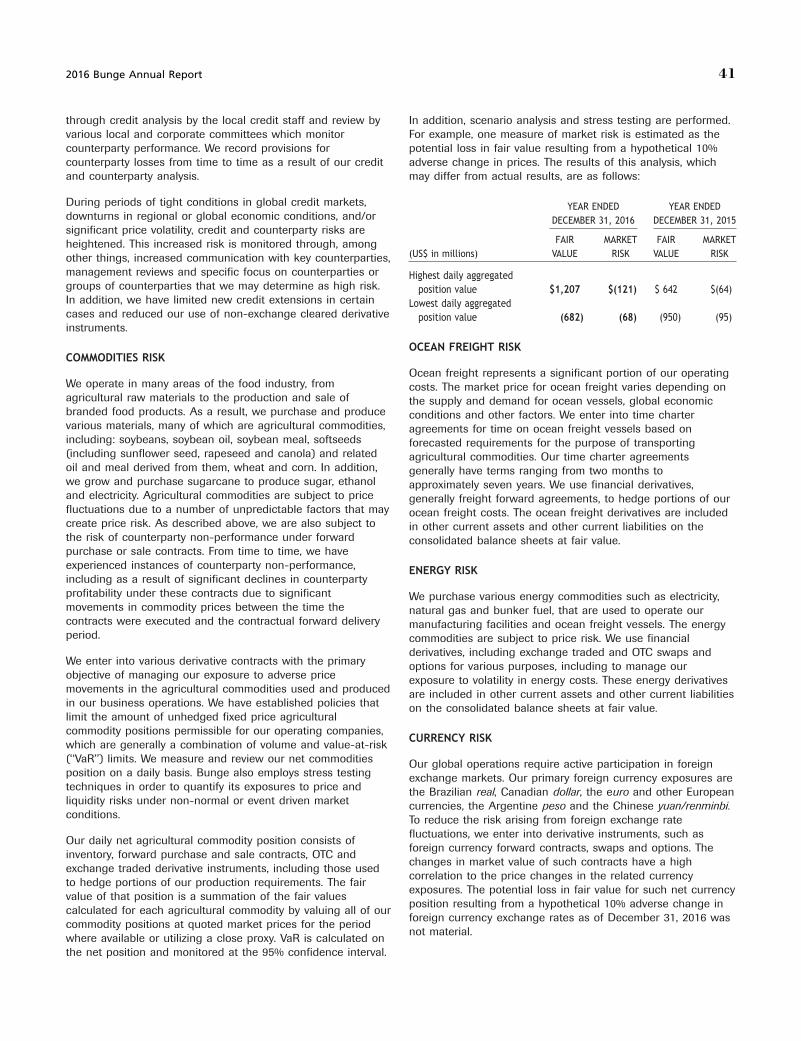
41
through credit analysis by the local credit staff and review by In addition, scenario analysis and stress testing are performed.various local and corporate committees which monitor For example, one measure of market risk is estimated as thecounterparty performance. We record provisions for potential loss in fair value resulting from a hypothetical 10%counterparty losses from time to time as a result of our credit adverse change in prices. The results of this analysis, whichand counterparty analysis. may differ from actual results, are as follows:
During periods of tight conditions in global credit markets, YEAR ENDED YEAR ENDEDdownturns in regional or global economic conditions, and/or DECEMBER 31, 2016 DECEMBER 31, 2015significant price volatility, credit and counterparty risks are
FAIR MARKET FAIR MARKETheightened. This increased risk is monitored through, among(US$ in millions) VALUE RISK VALUE RISKother things, increased communication with key counterparties,
management reviews and specific focus on counterparties or Highest daily aggregatedgroups of counterparties that we may determine as high risk. position value $1,207 $(121) $ 642 $(64)In addition, we have limited new credit extensions in certain Lowest daily aggregatedcases and reduced our use of non-exchange cleared derivative position value (682) (68) (950) (95)instruments.
OCEAN FREIGHT RISKCOMMODITIES RISK
Ocean freight represents a significant portion of our operatingWe operate in many areas of the food industry, from costs. The market price for ocean freight varies depending onagricultural raw materials to the production and sale of the supply and demand for ocean vessels, global economicbranded food products. As a result, we purchase and produce conditions and other factors. We enter into time chartervarious materials, many of which are agricultural commodities, agreements for time on ocean freight vessels based onincluding: soybeans, soybean oil, soybean meal, softseeds forecasted requirements for the purpose of transporting(including sunflower seed, rapeseed and canola) and related agricultural commodities. Our time charter agreementsoil and meal derived from them, wheat and corn. In addition, generally have terms ranging from two months towe grow and purchase sugarcane to produce sugar, ethanol approximately seven years. We use financial derivatives,and electricity. Agricultural commodities are subject to price generally freight forward agreements, to hedge portions of ourfluctuations due to a number of unpredictable factors that may ocean freight costs. The ocean freight derivatives are includedcreate price risk. As described above, we are also subject to in other current assets and other current liabilities on thethe risk of counterparty non-performance under forward consolidated balance sheets at fair value.purchase or sale contracts. From time to time, we haveexperienced instances of counterparty non-performance, ENERGY RISKincluding as a result of significant declines in counterpartyprofitability under these contracts due to significant We purchase various energy commodities such as electricity,movements in commodity prices between the time the natural gas and bunker fuel, that are used to operate ourcontracts were executed and the contractual forward delivery manufacturing facilities and ocean freight vessels. The energyperiod. commodities are subject to price risk. We use financial
derivatives, including exchange traded and OTC swaps andWe enter into various derivative contracts with the primary options for various purposes, including to manage ourobjective of managing our exposure to adverse price exposure to volatility in energy costs. These energy derivativesmovements in the agricultural commodities used and produced are included in other current assets and other current liabilitiesin our business operations. We have established policies that on the consolidated balance sheets at fair value.limit the amount of unhedged fixed price agriculturalcommodity positions permissible for our operating companies,
CURRENCY RISKwhich are generally a combination of volume and value-at-risk(‘‘VaR’’) limits. We measure and review our net commodities Our global operations require active participation in foreignposition on a daily basis. Bunge also employs stress testing exchange markets. Our primary foreign currency exposures aretechniques in order to quantify its exposures to price and the Brazilian real, Canadian dollar, the euro and other Europeanliquidity risks under non-normal or event driven market currencies, the Argentine peso and the Chinese yuan/renminbi.conditions. To reduce the risk arising from foreign exchange rate
fluctuations, we enter into derivative instruments, such asOur daily net agricultural commodity position consists offoreign currency forward contracts, swaps and options. Theinventory, forward purchase and sale contracts, OTC andchanges in market value of such contracts have a highexchange traded derivative instruments, including those usedcorrelation to the price changes in the related currencyto hedge portions of our production requirements. The fairexposures. The potential loss in fair value for such net currencyvalue of that position is a summation of the fair valuesposition resulting from a hypothetical 10% adverse change incalculated for each agricultural commodity by valuing all of ourforeign currency exchange rates as of December 31, 2016 wascommodity positions at quoted market prices for the periodnot material.where available or utilizing a close proxy. VaR is calculated on
the net position and monitored at the 95% confidence interval.
2016 Bunge Annual Report 41

42
When determining our exposure, we exclude intercompany We recognized gains of approximately $3 million, $9 million andloans that are deemed to be permanently invested. The $12 million, respectively, as a reduction of interest expense inrepayments of permanently invested intercompany loans are the consolidated statements of income, related to thenot planned or anticipated in the foreseeable future and amortization of deferred gains on termination of interest ratetherefore, are treated as analogous to equity for accounting swap agreements for the years ended December 31, 2016,purposes. As a result, the foreign exchange gains and losses 2015 and 2014.on these borrowings are excluded from the determination of
Foreign Exchange Derivatives. We use a combination of foreignnet income and recorded as a component of accumulatedexchange forward, swap and option contracts in certain of ourother comprehensive income (loss) in the consolidated balanceoperations to mitigate the risk from exchange rate fluctuationssheets. Included in other comprehensive income (loss) arein connection with certain commercial and balance sheetforeign exchange losses of $257 million and $541 million forexposures. The foreign exchange forward swap and optionthe years ended December 31, 2016 and 2015, respectively,contracts may be designated as cash flow hedges. We mayrelated to permanently invested intercompany loans.also use net investment hedges to partially offset thetranslation adjustments arising from the remeasurement of ourINTEREST RATE RISKinvestment in certain of our foreign subsidiaries.
We have debt in fixed and floating rate instruments. We areWe assess, both at the inception of the hedge and on anexposed to market risk due to changes in interest rates. Weongoing basis, whether the derivatives that are used in hedgemay enter into interest rate swap agreements to manage ourtransactions are highly effective in offsetting changes in theinterest rate exposure related to our debt portfolio.hedged items.
The aggregate fair value of our short and long-term debt,Commodity Derivatives. We use derivative instruments tobased on market yields at December 31, 2016, wasprimarily manage exposure to movements associated with$4,420 million with a carrying value of $4,264 million.agricultural commodity prices. We generally use exchangetraded futures and options contracts to minimize the effects ofA hypothetical 100 basis point increase in the interest yields onchanges in the prices of agricultural commodities onour senior note debt at December 31, 2016 would result in aagricultural commodity inventories and forward purchase anddecrease of approximately $22 million in the fair value of oursale contracts, but may also from time to time enter into OTCdebt. Similarly, a decrease of 100 basis points in the interestcommodity transactions, including swaps, which are settled inyields on our debt at December 31, 2016 would cause ancash at maturity or termination based on exchange-quotedincrease of approximately $22 million in the fair value of ourfutures prices. Changes in fair values of exchange tradeddebt.futures contracts representing the unrealized gains and/orlosses on these instruments are settled daily generally throughA hypothetical 1% change in LIBOR would result in a changeour 100% owned futures clearing subsidiary. Forward purchaseof approximately $36 million in our interest expense on ourand sale contracts are primarily settled through delivery ofvariable rate debt at December 31, 2016. Some of our variableagricultural commodities. While we consider these exchangerate debt is denominated in currencies other than in U.S.traded futures and forward purchase and sale contracts to bedollars and is indexed to non-U.S. dollar-based interest rateeffective economic hedges, we do not designate or account forindices, such as EURIBOR and TJLP and certain benchmarkthe majority of our commodity contracts as hedges. Changes inrates in local bank markets. As such, the hypothetical 1%fair values of these contracts and related RMI are included inchange in interest rate ignores the potential impact of anycost of goods sold in the consolidated statements of income.currency movements.The forward contracts require performance of both us and thecontract counterparty in future periods. Contracts to purchaseDerivative Instrumentsagricultural commodities generally relate to current or futurecrop years for delivery periods quoted by regulated commodityInterest Rate Derivatives. Interest rate derivatives used by us asexchanges. Contracts for the sale of agricultural commoditieshedging instruments are recorded at fair value in thegenerally do not extend beyond one future crop cycle.consolidated balance sheets with changes in fair value
recorded contemporaneously in earnings. Certain of theseOcean Freight Derivatives. We use derivative instrumentsswap agreements may be designated as fair value hedges. Thereferred to as freight forward agreements, or FFAs, and FFAcarrying amount of the associated hedged debt is also adjustedoptions to hedge portions of our current and anticipated oceanthrough earnings for changes in the fair value arising fromfreight costs. A portion of the ocean freight derivatives may bechanges in benchmark interest rates. Ineffectiveness isdesignated as fair value hedges of our firm commitments torecognized to the extent that these two adjustments do notpurchase time on ocean freight vessels. Changes in the fairoffset. We may enter into interest rate swap agreements for thevalue of the ocean freight derivatives that are qualified,purpose of managing certain of our interest rate exposures. Wedesignated and highly effective as a fair value hedge, alongmay also enter into interest rate basis swap agreements thatwith the gain or loss on the hedged firm commitments todo not qualify as hedges for accounting purposes. Changes inpurchase time on ocean freight vessels that is attributable tofair value of such interest rate basis swap agreements arethe hedged risk, are recorded in earnings. Changes in the fairrecorded in earnings.values of ocean freight derivatives that are not designated ashedges are also recorded in earnings.
42 2016 Bunge Annual Report

43
Energy Derivatives. We use derivative instruments for various reporting is designed to provide reasonable assurancepurposes including to manage our exposure to volatility in regarding the reliability of financial reporting and theenergy costs. Our operations use substantial amounts of preparation of financial statements for external purposes inenergy, including natural gas, coal and fuel oil, including accordance with U.S. Generally Accepted Accountingbunker fuel. Principles.
For more information, see Note 14 to our consolidated financial Under the supervision and with the participation ofstatements included as part of this Annual Report on management, including our Chief Executive Officer and ChiefForm 10-K. Financial Officer, we conducted an evaluation of the
effectiveness of our internal control over financial reporting asITEM 8. FINANCIAL STATEMENTS AND of the end of the fiscal year covered by this annual reportSUPPLEMENTARY DATA based on the framework in Internal Control – Integrated
Framework (2013) issued by the Committee of SponsoringOur financial statements and related schedule required by this Organizations of the Treadway Commission or COSO.item are contained on pages F-1 through F-72 and onpage E-1 of this Annual Report on Form 10-K. See Item 15(a) Based on this assessment, management concluded that Bungefor a listing of financial statements provided. Limited’s internal control over financial reporting was effective
as of the end of the fiscal year covered by this annual report.ITEM 9. CHANGES IN AND DISAGREEMENTS
Deloitte & Touche LLP, the independent registered publicWITH ACCOUNTANTS ON ACCOUNTING ANDaccounting firm that has audited and reported on BungeFINANCIAL DISCLOSURELimited’s consolidated financial statements included in this
None. annual report, has issued its written attestation report onBunge Limited’s internal control over financial reporting, which
ITEM 9A. CONTROLS AND PROCEDURES is included in this Annual Report on Form 10-K.
DISCLOSURE CONTROLS AND PROCEDURESCHANGES IN INTERNAL CONTROL OVER FINANCIALREPORTINGDisclosure controls and procedures are the controls and other
procedures that are designed to provide reasonable assuranceThere has been no change in our internal control over financialthat information required to be disclosed by the issuer in thereporting during the fourth fiscal quarter ended December 31,reports that it files or submits under the Exchange Act of 1934,2016 that has materially affected, or is reasonably likely toas amended (the ‘‘Exchange Act’’) is recorded, processed,materially affect, our internal control over financial reporting.summarized and reported within the time periods specified in
the Securities and Exchange Commission’s rules and forms.INHERENT LIMITATIONS ON EFFECTIVENESS OF CONTROLS
Disclosure controls and procedures include, without limitation,controls and procedures designed to ensure that information Our management, including our Chief Executive Officer and ourrequired to be disclosed by an issuer in the reports that it files Chief Financial Officer, does not expect that our disclosureor submits under the Exchange Act is accumulated and controls or our internal control over financial reporting willcommunicated to the issuer’s management, including the prevent or detect all errors and all fraud. A control system, noprincipal executive and principal financial officer, or persons matter how well designed and operated, can provide onlyperforming similar functions, as appropriate, to allow timely reasonable, not absolute, assurance that the control system’sdecisions regarding required disclosure. objectives will be met. The design of a control system must
reflect the fact that there are resource constraints, and theAs of December 31, 2016, we carried out an evaluation, underbenefits of controls must be considered relative to their costs.the supervision and with the participation of our management,Further, because of the inherent limitations in all controlincluding our Chief Executive Officer and Chief Financialsystems, no evaluation of controls can provide absoluteOfficer, of the effectiveness of the design and operation of ourassurance that misstatements due to error or fraud will notdisclosure controls and procedures, as that term is defined inoccur or that all control issues and instances of fraud, if any,Exchange Act Rules 13a-15(e) and 15d-15(e), as of the end ofwithin the company have been detected. These inherentthe period covered by this Annual Report on Form 10-K. Basedlimitations include the realities that judgments in decision-upon that evaluation, our Chief Executive Officer and Chiefmaking can be faulty and that breakdowns can occur becauseFinancial Officer have concluded that our disclosure controlsof simple error or mistake. Controls may also be circumventedand procedures were effective at the reasonable assuranceby the individual acts of some persons, by collusion of two orlevel as of the end of the fiscal year covered by this Annualmore people or by management override of the controls. TheReport on Form 10-K.design of any system of controls is based in part on certainassumptions about the likelihood of future events, and thereMANAGEMENT’S REPORT ON INTERNAL CONTROL OVERcan be no assurance that any design will succeed in achievingFINANCIAL REPORTINGits stated goals under all potential future conditions. Projections
Bunge Limited’s management is responsible for establishing of any evaluation of controls effectiveness to future periods areand maintaining adequate internal control over financial subject to risks. Over time, controls may become inadequatereporting, as such term is defined in Exchange Act because of changes in conditions or deterioration in theRules 13a-15(f). Bunge Limited’s internal control over financial degree of compliance with policies or procedures.
2016 Bunge Annual Report 43

44
REPORT OF INDEPENDENT REGISTERED PUBLIC ACCOUNTING FIRM
To the Board of Directors and Shareholders ofBunge LimitedWhite Plains, New York
We have audited the internal control over financial reporting of Bunge Limited and subsidiaries (the ‘‘Company’’) as ofDecember 31, 2016, based on criteria established in Internal Control – Integrated Framework (2013) issued by the Committee ofSponsoring Organizations of the Treadway Commission. The Company’s management is responsible for maintaining effectiveinternal control over financial reporting and for its assessment of the effectiveness of internal control over financial reporting,included in the accompanying Management’s Report on Internal Control Over Financial Reporting. Our responsibility is to expressan opinion on the Company’s internal control over financial reporting based on our audit.
We conducted our audit in accordance with the standards of the Public Company Accounting Oversight Board (United States).Those standards require that we plan and perform the audit to obtain reasonable assurance about whether effective internalcontrol over financial reporting was maintained in all material respects. Our audit included obtaining an understanding of internalcontrol over financial reporting, assessing the risk that a material weakness exists, testing and evaluating the design andoperating effectiveness of internal control based on the assessed risk, and performing such other procedures as we considerednecessary in the circumstances. We believe that our audit provides a reasonable basis for our opinion.
A company’s internal control over financial reporting is a process designed by, or under the supervision of, the company’sprincipal executive and principal financial officers, or persons performing similar functions, and effected by the company’s boardof directors, management, and other personnel to provide reasonable assurance regarding the reliability of financial reporting andthe preparation of financial statements for external purposes in accordance with generally accepted accounting principles. Acompany’s internal control over financial reporting includes those policies and procedures that (1) pertain to the maintenance ofrecords that, in reasonable detail, accurately and fairly reflect the transactions and dispositions of the assets of the company;(2) provide reasonable assurance that transactions are recorded as necessary to permit preparation of financial statements inaccordance with generally accepted accounting principles, and that receipts and expenditures of the company are being madeonly in accordance with authorizations of management and directors of the company; and (3) provide reasonable assuranceregarding prevention or timely detection of unauthorized acquisition, use, or disposition of the company’s assets that could have amaterial effect on the financial statements.
Because of the inherent limitations of internal control over financial reporting, including the possibility of collusion or impropermanagement override of controls, material misstatements due to error or fraud may not be prevented or detected on a timelybasis. Also, projections of any evaluation of the effectiveness of the internal control over financial reporting to future periods aresubject to the risk that the controls may become inadequate because of changes in conditions, or that the degree of compliancewith the policies or procedures may deteriorate.
In our opinion, the Company maintained, in all material respects, effective internal control over financial reporting as ofDecember 31, 2016, based on the criteria established in Internal Control – Integrated Framework (2013) issued by the Committeeof Sponsoring Organizations of the Treadway Commission.
We have also audited, in accordance with the standards of the Public Company Accounting Oversight Board (United States), theconsolidated financial statements and financial statement schedule as of and for the year ended December 31, 2016 of theCompany and our report dated February 28, 2017 expressed an unqualified opinion on the consolidated financial statements andfinancial statement schedule.
/s/ Deloitte & Touche LLP
New York, New YorkFebruary 28, 2017
44 2016 Bunge Annual Report

45
ITEM 9B. OTHER INFORMATION ITEM 12. SECURITY OWNERSHIP OF CERTAINBENEFICIAL OWNERS AND MANAGEMENT AND
None. RELATED STOCKHOLDER MATTERS
We will provide information that is responsive to this Item 12 inPART III our definitive proxy statement for our 2017 Annual GeneralMeeting of Shareholders under the caption ‘‘Share OwnershipInformation required by Items 10, 11, 12, 13 and 14 of Part III isof Directors, Executive Officers and Principal Shareholders’’ andomitted from this Annual Report on Form 10-K and will be filedpossibly elsewhere therein. That information is incorporated inin a definitive proxy statement for our 2017 Annual Generalthis Item 12 by reference. The information required by this itemMeeting of Shareholders.with respect to our equity compensation plan information isfound in Part II of this Annual Report on Form 10-K under the
ITEM 10. DIRECTORS, EXECUTIVE OFFICERS, caption ‘‘Item 5. Market for Registrant’s Common Equity,AND CORPORATE GOVERNANCE Related Stockholder Matters and Issuer Purchases of Equity
Securities – Securities Authorized for Issuance Under EquityWe will provide information that is responsive to this Item 10 in Compensation Plans,’’ which information is incorporated hereinour definitive proxy statement for our 2017 Annual General by reference.Meeting of Shareholders under the captions ‘‘Election ofDirectors,’’ ‘‘Section 16(a) Beneficial Ownership Reporting
ITEM 13. CERTAIN RELATIONSHIPS ANDCompliance,’’ ‘‘Corporate Governance – Board Meetings andRELATED TRANSACTIONS, AND DIRECTORCommittees – Audit Committee,’’ ‘‘Corporate Governance –INDEPENDENCEBoard Composition and Independence,’’ ‘‘Audit Committee
Report,’’ ‘‘Corporate Governance – Corporate GovernanceWe will provide information that is responsive to this Item 13 inGuidelines and Code of Conduct’’ and possibly elsewhereour definitive proxy statement for our 2017 Annual Generaltherein. That information is incorporated in this Item 10 byMeeting of Shareholders under the captions ‘‘Corporatereference. The information required by this item with respect toGovernance – Board Composition and Independence,’’ ‘‘Certainour executive officers and key employees is found in Part I ofRelationships and Related Party Transactions’’ and possiblythis Annual Report on Form 10-K under the captionelsewhere therein. That information is incorporated in this‘‘Item 1. Business – Executive Officers and Key Employees ofItem 13 by reference.the Company,’’ which information is incorporated herein by
reference.ITEM 14. PRINCIPAL ACCOUNTING FEES ANDSERVICESITEM 11. EXECUTIVE COMPENSATIONWe will provide information that is responsive to this Item 14 inWe will provide information that is responsive to this Item 11 inour definitive proxy statement for our 2017 Annual Generalour definitive proxy statement for our 2017 Annual GeneralMeeting of Shareholders under the caption ‘‘Appointment ofMeeting of Shareholders under the captions ‘‘ExecutiveIndependent Auditor’’ and possibly elsewhere therein. ThatCompensation,’’ ‘‘Director Compensation,’’ ‘‘Compensationinformation is incorporated in this Item 14 by reference.Committee Report,’’ and possibly elsewhere therein. That
information is incorporated in this Item 11 by reference.
2016 Bunge Annual Report 45
46
PART IV
See ‘‘Index to Exhibits’’ set forth below.ITEM 15. EXHIBITS, FINANCIAL STATEMENTSCHEDULES EXHIBIT
NUMBER DESCRIPTION
a. (1) (2) Financial Statements and Financial Statement 3.1 Memorandum of Association (incorporated by reference fromSchedules the Registrant’s Form F-1 (No. 333-65026) filed July 13, 2001)
3.2 Certificate of Deposit of Memorandum of Increase of ShareSee ‘‘Index to Consolidated FinancialCapital (incorporated by reference from the Registrant’sStatements’’ on page F-1 and FinancialForm 10-Q filed August 11, 2008)Statement Schedule II – Valuation and
3.3* Bye-laws, amended and restated as of May 25, 2016Qualifying Accounts on page E-1 of thisAnnual Report on Form 10-K. 4.1 Form of Common Share Certificate (incorporated by reference
from the Registrant’s Form 10-K filed March 3, 2008)a. (3) Exhibits
4.2 Certificate of Designation of 4.875% Cumulative ConvertibleThe exhibits listed in the accompanying Perpetual Preference Shares (incorporated by reference fromindex to exhibits are filed or incorporated by the Registrant’s Form 8-K filed November 20, 2006)reference as part of this Form 10-K. 4.3 Form of 4.875% Cumulative Convertible Perpetual Preference
Share Certificate (incorporated by reference from theCertain of the agreements filed as exhibitsRegistrant’s Form 8-K filed November 20, 2006)to this Form 10-K contain representations
4.4 The instruments defining the rights of holders of the long-termand warranties by the parties to thedebt securities of Bunge and its subsidiaries are omittedagreements that have been made solely forpursuant to Item 601(b)(4)(iii) of Regulation S-K. Bunge herebythe benefit of the parties to the agreement,agrees to furnish copies of these instruments to the Securitieswhich may have been included in theand Exchange Commission upon requestagreement for the purpose of allocating risk
between the parties rather than establishing 10.1 Fifth Amended and Restated Pooling Agreement, dated as ofmatters as facts and may have been June 28, 2004, among Bunge Funding Inc., Bunge Managementqualified by disclosures that were made to Services Inc., as Servicer, and The Bank of New York Mellon, asthe parties in connection with the Trustee (incorporated by reference from the Registrant’snegotiation of these agreements and not Form 10-K filed February 27, 2012)necessarily reflected in the agreements.
10.2 Fifth Amended and Restated Series 2000-1 Supplement, datedAccordingly, the representations andas of June 28, 2004, among Bunge Funding Inc., Bungewarranties contained in these agreementsManagement Services, Inc., as Servicer, Cooperatieve Centralemay not describe the actual state of affairsRaiffeisen-Boerenleenbank B.A., ‘‘Rabobank International,’’of Bunge Limited or its subsidiaries as of theNew York Branch, as Letter of Credit Agent, JPMorgan Chasedate that these representations andBank, N.A., as Administrative Agent, The Bank of New Yorkwarranties were made or at any other time.Mellon, as Collateral Agent and Trustee, and Bunge AssetInvestors should not rely on theseFunding Corp., as Series 2000-1 Purchaser (incorporated byrepresentations and warranties asreference from the Registrant’s Form 10-K filed February 27,statements of fact. Additional information2012)about Bunge Limited and its subsidiaries
may be found elsewhere in this Annual 10.3 Twelfth Amended and Restated Liquidity Agreement, dated asReport on Form 10-K and Bunge Limited’s of November 20, 2014, among Bunge Asset Funding Corp., theother public filings, which are available financial institutions party thereto, Citibank, N.A., aswithout charge through the SEC’s website at Syndication Agent, BNP Paribas and The Bank of Tokyowww.sec.gov. Mitsubishi UFJ, Ltd., as Co-Documentation Agents, and
JPMorgan Chase Bank, N.A., as Administrative Agent(incorporated by reference from the Registrant’s Form 8-K filedNovember 24, 2014)
10.4 Annex X, dated as of November 20, 2014 (incorporated byreference from the Registrant’s Form 8-K filed onNovember 24, 2014)
46 2016 Bunge Annual Report

47
EXHIBIT EXHIBITNUMBER DESCRIPTION NUMBER DESCRIPTION
10.5 Eighth Amended and Restated Guaranty, dated as of 10.10 Guaranty, dated as of November 20, 2014, by Bunge Limited,November 20, 2014, by Bunge Limited, as Guarantor, to as Guarantor, to JPMorgan Chase Bank, N.A., as administrativeCooperatieve Centrale Raiffeisen-Boerenleenbank B.A., agent under the Revolving Credit Agreement (incorporated by‘‘Rabobank International,’’ New York Branch, in its capacity as reference from the Registrant’s Form 8-K filed onthe letter of credit agent under the Letter of Credit November 24, 2014)Reimbursement Agreement for the benefit of the Letter of 10.11 Amended and Restated Credit Agreement, dated June 17,Credit Banks, JPMorgan Chase Bank, N.A., in its capacity as the 2014, among Bunge Limited Finance Corp., as Borrower,administrative agent under the Liquidity Agreement, for the CoBank ACB, as Administrative Agent and Lead Arranger, andbenefit of the Liquidity Banks and The Bank of New York Mellon certain lenders party thereto (incorporated by reference from(formerly known as The Bank of New York), in its capacity as the Registrant’s Form 10-K filed on March 2, 2015)collateral agent under the Security Agreement and as trustee
10.12 Amended and Restated Guaranty, dated as of June 17, 2014,under the Pooling Agreement (incorporated by reference frombetween Bunge Limited, as Guarantor, and CoBank ACB, asthe Registrant’s Form 8-K filed on November 24, 2014)Administrative Agent (incorporated by reference from the
10.6 Facility Agreement, dated March 17, 2014, among Bunge Registrant’s Form 10-K filed on March 2, 2015)Finance Europe B.V., as Borrower, ABN AMRO Bank N.V., BNP
10.13 Eighth Amendment to and Restatement of the ReceivablesParibas, ING Bank N.V., Lloyds Bank plc, The Royal Bank ofTransfer Agreement, dated May 26, 2016, among BungeScotland plc, Citigroup Global Markets Limited, CooperatieveSecuritization B.V., as Seller, Koninklijke Bunge B.V.Centrale Raiffeisen-Boerenleenbank B.A. (trading as Rabobank(f/k/a Bunge Finance B.V.), as Master Servicer, the personsInternational), Credit Agricole Corporate and Investment Bank,from time to time party thereto as Conduit Purchasers, theHSBC Bank plc, Industrial and Commercial Bank of China Ltd.,persons from time to time party thereto as CommittedNew York Branch, Mizuho Bank, Ltd., Natixis, SG AmericasPurchasers, the persons from time to time party thereto asSecurities LLC, Standard Chartered Bank, The Bank of Tokyo-Purchaser Agents, Cooperatieve Rabobank U.A. (f/k/a CentraleMitsubishi UFJ, Ltd. and Unicredit Bank AG, New York Branch,Raiffeisen-Boerenleenbank B.A.), as Administrative Agent andas Mandated Lead Arrangers, the financial institutions fromPurchaser Agent, and Bunge Limited, as Performancetime to time party thereto, and ABN AMRO Bank N.V., as AgentUndertaking Provider (incorporated by reference from the(incorporated by reference from the Registrant’s Form 8-K filedRegistrant’s Form 10-Q filed on July 28, 2016)on March 19, 2014)
10.14 Ninth Amendment to the Receivables Transfer Agreement,10.7 Amendment Agreement, dated August 10, 2015, relating to thedated June 30, 2016, among Bunge Securitization B.V., asFacility Agreement, dated March 17, 2014, among BungeSeller, Koninklijke Bunge B.V., as Master Servicer, the personsFinance Europe B.V., as Borrower, ABN AMRO Bank N.V., BNPfrom time to time party thereto as Conduit Purchasers, theParibas, ING Bank N.V., Lloyds Bank plc, The Royal Bank ofpersons from time to time party thereto as CommittedScotland plc, Citigroup Global Markets Limited, CooperatievePurchasers, the persons from time to time party thereto asCentrale Raiffeisen-Boerenleenbank B.A. (trading as RabobankPurchaser Agents, Cooperatieve Rabobank U.A., asInternational), Credit Agricole Corporate and Investment Bank,Administrative Agent and Purchaser Agent, and Bunge Limited,HSBC Bank plc, Industrial and Commercial Bank of China Ltd.,as Performance Undertaking Provider (incorporated byNew York Branch, Mizuho Bank, Ltd., Natixis, SG Americasreference from the Registrant’s form 10-Q filed on July 28,Securities LLC, Standard Chartered Bank, The Bank of Tokyo-2016)Mitsubishi UFJ, Ltd. and Unicredit Bank AG, New York Branch,
as Mandated Lead Arrangers, the financial institutions from 10.15* Tenth Amendment to the Receivables Transfer Agreement,time to time party thereto, and ABN AMRO Bank N.V., as Agent dated October 11, 2016, among Bunge Securitization B.V., as(incorporated by reference from Registrant’s Form 8-K filed on Seller, Koninklijke Bunge B.V., as Master Servicer, the personsAugust 10, 2015) from time to time party thereto as Conduit Purchasers, the
persons from time to time party thereto as Committed10.8 Amended and Restated Guaranty, dated as of August 10, 2015,Purchasers, the persons from time to time party thereto asby Bunge Limited, as Guarantor, to ABN AMRO Bank N.V., asPurchaser Agents, Cooperatieve Rabobank U.A., asAgent (incorporated by reference from the Registrant’sAdministrative Agent and Purchaser Agent, and Bunge Limited,Form 8-K filed on August 10, 2015)as Performance Undertaking Provider
10.9 Revolving Credit Agreement, dated as of November 20, 2014,10.16* Amendment to and Restatement of the Servicing Agreement,among Bunge Limited Finance Corp., as Borrower, Citibank,
dated May 26, 2016, among Bunge Securitization B.V., as Seller,N.A., as Syndication Agent, BNP Paribas and The Bank of TokyoBunge North America Capital, Inc., as U.S. IntermediateMitsubishi UFJ, Ltd., as Co-Documentation Agents, JPMorganTransferor, Cooperatieve Rabobank U.A., as ItalianChase Bank, N.A., as Administrative Agent, and certain lendersIntermediate Transferor, Koninklijke Bunge B.V., as Masterparty thereto (incorporated by reference from the Registrant’sServicer, the persons named therein as Sub-Servicers, andForm 8-K filed on November 24, 2014)Cooperatieve Rabobank U.A., as Administrative Agent
2016 Bunge Annual Report 47

48
EXHIBIT EXHIBITNUMBER DESCRIPTION NUMBER DESCRIPTION
10.17 Performance and Indemnity Agreement, dated June 1, 2011, 10.26 Form of Nonqualified Stock Option Award Agreement (effectivebetween Bunge Limited, as Performance Undertaking Provider as of 2005) under the Bunge Limited Equity Incentive Planand Cooperatieve Centrale Raiffeisen-Boerenleenbank B.A., as (incorporated by reference from the Registrant’s Form 10-KAdministrative Agent (incorporated by reference from the filed March 15, 2006)Registrant’s Form 10-Q filed on August 9, 2011) 10.27 Bunge Limited 2009 Equity Incentive Plan (incorporated by
10.18 First Amendment to Performance and Indemnity Agreement, reference from the Registrant’s Definitive Proxy Statementdated May 24, 2012, between Bunge Limited, as Performance filed April 11, 2014)Undertaking Provider and Cooperatieve Centrale Raiffeisen- 10.28 Form of Nonqualified Stock Option Award Agreement under theBoerenleenbank B.A., as Administrative Agent (incorporated by 2009 Bunge Limited Equity Incentive Plan (incorporated byreference from the Registrant’s Form 10-Q filed on August 1, reference from the Registrant’s Form 10-K filed March 1, 2011)2012)
10.29 Form of Restricted Stock Unit Award Agreement under the 200910.19 Subordinated Loan Agreement, dated June 1, 2011, among Bunge Limited Equity Incentive Plan (incorporated by reference
Bunge Finance B.V., as Subordinated Lender, Bunge from the Registrant’s Form 10-K filed March 1, 2011)Securitization B.V., as Seller, Bunge Finance B.V., as Master
10.30 Form of Performance Based Restricted Stock Unit-Target EPSServicer, and Cooperatieve Centrale Raiffeisen-BoerenleenbankAward Agreement under the 2009 Bunge Limited EquityB.A., as Administrative Agent (incorporated by reference fromIncentive Plan (incorporated by reference from the Registrant’sthe Registrant’s Form 10-Q filed on August 9, 2011)Form 10-K filed March 1, 2011)
++10.20 U.S. Receivables Purchase Agreement, dated June 1, 2011,10.31 Bunge Limited 2016 Equity Incentive Plan (incorporated byamong Bunge North America, Inc., Bunge Oils, Inc., Bunge
reference from the Registrant’s Definitive Proxy StatementNorth America (East), LLC, Bunge Milling, Inc., Bunge Northfiled April 15, 2016)America (OPD West), Inc., each as a Seller, respectively, Bunge
Finance B.V., as Seller Agent, and Bunge North America 10.32* Form of Global Stock Option Agreement under the 2016 BungeCapital, Inc., as the Buyer (incorporated by reference from the Limited Equity Incentive PlanRegistrant’s Form 10-Q filed on August 9, 2011)
10.33* Form of Global Restricted Stock Unit Agreement under the10.21 First Amendment to U.S. Receivables Purchase Agreement, 2016 Bunge Limited Equity Incentive Plan (for RSUs subject to
dated June 15, 2012, among Bunge North America, Inc., Bunge pro rata vesting)Oils, Inc., Bunge North America (East), LLC, Bunge
10.34* Form of Global Restricted Stock Unit Agreement under theMilling, Inc., Bunge North America (OPD West), Inc., each as a
2016 Bunge Limited Equity Incentive Plan (for RSUs subject toSeller, respectively, Bunge Finance B.V., as Seller Agent, and
cliff vesting)Bunge North America Capital, Inc., as the Buyer (incorporated
10.35* Form of Global Performance Unit Agreement under the 2016by reference from the Registrant’s Form 10-Q filed onBunge Limited Equity Incentive PlanAugust 1, 2012)
10.36 Bunge Limited Non-Employee Directors’ Equity Incentive Plan10.22* Second Amendment to the U.S. Receivables Purchase(Amended and Restated as of February 25, 2005) (incorporatedAgreement, dated June 30, 2016, among Bunge Northby reference from the Registrant’s Form 10-K filed March 16,America, Inc., Bunge Oils, Inc., Bunge North America2005)(East), LLC, Bunge Milling, Inc., Bunge North America (OPD
West), Inc., each as a Seller, respectively, Koninklijke 10.37 Bunge Limited 2007 Non-Employee Directors’ Equity IncentiveBunge B.V., as Seller Agent, Bunge North America Capital, Inc., Plan (Amended and Restated as of December 31, 2008)as the Buyer, and Cooperatieve Rabobank U.A., as (incorporated by reference from the Registrant’s Form 10-KAdministrative Agent filed March 2, 2009)
++10.23 U.S. Intermediate Transfer Agreement, dated June 1, 2011, 10.38 Form of Deferred Restricted Stock Unit Award Agreementamong Bunge North America Capital, Inc., as the Transferor, (effective as of 2007) under the Bunge Limited 2007Bunge Finance B.V., as the Transferor Agent, and Bunge Non-Employee Directors’ Equity Incentive Plan (incorporated bySecuritization B.V., as the Transferee (incorporated by reference from the Registrant’s Form 10-K filed March 3, 2008)reference from the Registrant’s Form 10-Q filed on August 9,
10.39 Form of Restricted Stock Unit Award Agreement under the2011)Bunge Limited 2007 Non-Employee Directors’ Equity Incentive
10.24 First Amendment to U.S. Intermediate Transfer Agreement, Plan (incorporated by reference from the Registrant’sdated June 15, 2012, among Bunge North America Form 10-K filed March 1, 2010)Capital, Inc., as the Transferor, Bunge Finance B.V., as the
10.40 Form of Nonqualified Stock Option Award Agreement (effectiveTransferor Agent, and Bunge Securitization B.V., as theas of 2005) under the Bunge Limited Non-Employee Directors’Transferee (incorporated by reference from the Registrant’sEquity Incentive Plan (incorporated by reference from theForm 10-Q filed on August 1, 2012)Registrant’s Form 10-K filed March 15, 2006)
10.25 Bunge Limited Equity Incentive Plan (Amended and Restated asof December 31, 2008) (incorporated by reference from theRegistrant’s Form 10-K filed March 2, 2009)
48 2016 Bunge Annual Report
49
EXHIBIT EXHIBITNUMBER DESCRIPTION NUMBER DESCRIPTION
10.41 Bunge Limited Deferred Compensation Plan for Non-Employee 10.52 Employment Agreement, dated as of February 6, 2013,Directors (Amended and Restated as of December 31, 2008) between Bunge Limited and Soren Schroder (incorporated by(incorporated by reference from the Registrant’s Form 10-K reference from the Registrant’s Form 8-K filed February 7,filed March 2, 2009) 2013)
10.42 Bunge Excess Benefit Plan (Amended and Restated as of 10.53* Offer Letter, dated as of April 11, 2014 for Brian ThomsenJanuary 1, 2009) (incorporated by reference from the 10.54* Offer Letter, dated as of December 7, 2016, for ThomasRegistrant’s Form 10-K filed March 2, 2009) Boehlert
10.43 Bunge Excess Contribution Plan (Amended and Restated as of 12.1* Computation of Ratio of Earnings to Fixed ChargesJanuary 1, 2009) (incorporated by reference from the
21.1* Subsidiaries of the RegistrantRegistrant’s Form 10-K filed March 2, 2009)
23.1* Consent of Deloitte & Touche LLP10.44 Bunge U.S. SERP (Amended and Restated as of January 1, 2011)(incorporated by reference from the Registrant’s Form 10-K 31.1* Certification of Bunge Limited’s Chief Executive Officerfiled March 1, 2011) pursuant to Section 302 of the Sarbanes Oxley Act
10.45 Bunge Limited Employee Deferred Compensation Plan 31.2* Certification of Bunge Limited’s Chief Financial Officer(effective January 1, 2008) (incorporated by reference from pursuant to Section 302 of the Sarbanes Oxley Actthe Registrant’s Form 10-K filed March 2, 2009)
32.1* Certification of Bunge Limited’s Chief Executive Officer10.46 Bunge Limited Annual Incentive Plan (effective January 1, pursuant to Section 906 of the Sarbanes Oxley Act
2011) (incorporated by reference from the Registrant’s32.2* Certification of Bunge Limited’s Chief Financial Officer
Definitive Proxy Statement filed April 16, 2010)pursuant to Section 906 of the Sarbanes Oxley Act
10.47 Description of Non-Employee Directors’ Compensation101* The following financial information from Bunge Limited’s
(effective as of January 1, 2014)Annual Report on Form 10-K for the fiscal year ended
10.48 Offer Letter, amended and restated as of December 31, 2008, December 31, 2015 formatted in Extensible Business Reportingfor Andrew J. Burke (incorporated by reference from the Language (XBRL): (i) the Consolidated Statements of Income,Registrant’s Form 10-K filed March 2, 2009) (ii) the Consolidated Balance Sheets, (iii) the Consolidated
Statements of Cash Flows, (iv) the Consolidated Statements of10.49 Compensation Letter to Andrew J. Burke, dated August 3, 2011Shareholders’ Equity, (v) the Notes to the Consolidated(incorporated by reference from the Registrant’s Form 10-QFinancial Statements and (vi) Schedule II – Valuation andfiled on August 9, 2011)Qualifying Accounts
10.50 Offer Letter, dated as of June 14, 2011, for Gordon Hardie* Filed herewith.(incorporated by reference from the Registrant’s Form 10-Q
filed on August 9, 2011) ++ Portions of this exhibit have been omitted and filed separately with the Securitiesand Exchange Commission as part of an application for confidential treatment pursuant10.51 Offer Letter, dated as of September 24, 2010, for Raul Padillato Rule 24b-2 of the Securities Exchange Act of 1934, as amended.(incorporated by reference from the Registrant’s Form 10-Q
filed on November 9, 2011)
2016 Bunge Annual Report 49

(This page has been left blank intentionally.)

E-1
BUNGE LIMITEDSCHEDULE II – VALUATION AND QUALIFYING ACCOUNTS(US$ IN MILLIONS)
BALANCE AT CHARGED TO CHARGED TO BALANCEBEGINNING OF COSTS AND OTHER DEDUCTIONS AT END OF
DESCRIPTION PERIOD EXPENSES ACCOUNTS(b) FROM RESERVES PERIOD
FOR THE YEAR ENDED DECEMBER 31, 2014Allowances for doubtful accounts(a) . . . . . . . . . . . . . . . . . . . . . . . . . . . . . . . . . . . . . . . . . . . . . . . . $ 283 71 (23) (84)(c) $ 247Allowances for secured advances to suppliers . . . . . . . . . . . . . . . . . . . . . . . . . . . . . . . . . . $ 75 9 (7) (16) $ 61Allowances for recoverable taxes . . . . . . . . . . . . . . . . . . . . . . . . . . . . . . . . . . . . . . . . . . . . . . . . . . $ 70 7 (14) (20) $ 43Income tax valuation allowances . . . . . . . . . . . . . . . . . . . . . . . . . . . . . . . . . . . . . . . . . . . . . . . . . . . $1,048 76 (46)(d) – $1,078FOR THE YEAR ENDED DECEMBER 31, 2015Allowances for doubtful accounts(a) . . . . . . . . . . . . . . . . . . . . . . . . . . . . . . . . . . . . . . . . . . . . . . . . $ 247 64 (47) (54)(c) $ 210Allowances for secured advances to suppliers . . . . . . . . . . . . . . . . . . . . . . . . . . . . . . . . . . $ 61 11 (21) (9) $ 42Allowances for recoverable taxes . . . . . . . . . . . . . . . . . . . . . . . . . . . . . . . . . . . . . . . . . . . . . . . . . . $ 43 7 (16) (2) $ 32Income tax valuation allowances . . . . . . . . . . . . . . . . . . . . . . . . . . . . . . . . . . . . . . . . . . . . . . . . . . . $1,078 44 (324)(d) – $ 798FOR THE YEAR ENDED DECEMBER 31, 2016Allowances for doubtful accounts(a) . . . . . . . . . . . . . . . . . . . . . . . . . . . . . . . . . . . . . . . . . . . . . . . . $ 210 45 15 (58)(c) $ 212Allowances for secured advances to suppliers . . . . . . . . . . . . . . . . . . . . . . . . . . . . . . . . . . $ 42 1 9 (2) $ 50Allowances for recoverable taxes . . . . . . . . . . . . . . . . . . . . . . . . . . . . . . . . . . . . . . . . . . . . . . . . . . $ 32 162 1 (160) $ 35Income tax valuation allowances . . . . . . . . . . . . . . . . . . . . . . . . . . . . . . . . . . . . . . . . . . . . . . . . . . . $ 798 (44) 85(d) – $ 839
(a) This includes an allowance for doubtful accounts for current and non-current trade accounts receivables.
(b) This consists primarily of foreign exchange translation adjustments.
(c) Such amounts include write-offs of uncollectible accounts and recoveries.
(d) Includes primarily cumulative translation adjustments.
2016 Bunge Annual Report E-1

(This page has been left blank intentionally.)

F-1
INDEX TO CONSOLIDATED FINANCIAL STATEMENTS
PAGE
Consolidated Financial StatementsReport of Independent Registered Public Accounting Firm . . . . . . . . . . . . . . . . . . . . . . . . . . . . . . . . . . . . . . . . . . . . . . . . . . . . . . . . . . . . . . . . . . . . . . . . . . . . . . . . . . . . . . . . . . . . . . . . . . . . . . . . . . . . . . . . . . . . . . . F-2Consolidated Statements of Income for the Years Ended December 31, 2016, 2015 and 2014 . . . . . . . . . . . . . . . . . . . . . . . . . . . . . . . . . . . . . . . . . . . . . . . . . . . . . . . . . . . . . . . . . . . . . . . . . . . F-3Consolidated Statements of Comprehensive Income (Loss) for the Years Ended December 31, 2016, 2015 and 2014 . . . . . . . . . . . . . . . . . . . . . . . . . . . . . . . . . . . . . . . . . . . . . . F-4Consolidated Balance Sheets at December 31, 2016 and 2015 . . . . . . . . . . . . . . . . . . . . . . . . . . . . . . . . . . . . . . . . . . . . . . . . . . . . . . . . . . . . . . . . . . . . . . . . . . . . . . . . . . . . . . . . . . . . . . . . . . . . . . . . . . . . . . . . . . F-5Consolidated Statements of Cash Flows for the Years Ended December 31, 2016, 2015 and 2014 . . . . . . . . . . . . . . . . . . . . . . . . . . . . . . . . . . . . . . . . . . . . . . . . . . . . . . . . . . . . . . . . . . . . . . F-6Consolidated Statements of Changes in Equity and Redeemable Noncontrolling Interests for the Years Ended December 31, 2016, 2015 and 2014 . . . . . . . F-7Notes to the Consolidated Financial Statements . . . . . . . . . . . . . . . . . . . . . . . . . . . . . . . . . . . . . . . . . . . . . . . . . . . . . . . . . . . . . . . . . . . . . . . . . . . . . . . . . . . . . . . . . . . . . . . . . . . . . . . . . . . . . . . . . . . . . . . . . . . . . . . . . . . . F-8
2016 Bunge Annual Report F-1
F-2
REPORT OF INDEPENDENT REGISTERED PUBLIC ACCOUNTING FIRM
To the Board of Directors and Shareholders ofBunge LimitedWhite Plains, New York
We have audited the accompanying consolidated balance sheets of Bunge Limited and subsidiaries (the ‘‘Company’’) as ofDecember 31, 2016 and 2015, and the related consolidated statements of income, comprehensive income (loss), changes in equityand redeemable noncontrolling interests, and cash flows for each of the three years in the period ended December 31, 2016. Ouraudits also included the financial statement schedule listed in the Index at Item 15. These financial statements and the financialstatement schedule are the responsibility of the Company’s management. Our responsibility is to express an opinion on thefinancial statements and the financial statement schedule based on our audits.
We conducted our audits in accordance with the standards of the Public Company Accounting Oversight Board (United States).Those standards require that we plan and perform the audit to obtain reasonable assurance about whether the financialstatements are free of material misstatement. An audit includes examining, on a test basis, evidence supporting the amounts anddisclosures in the financial statements. An audit also includes assessing the accounting principles used and significant estimatesmade by management, as well as evaluating the overall financial statement presentation. We believe that our audits provide areasonable basis for our opinion.
In our opinion, such consolidated financial statements present fairly, in all material respects, the financial position of BungeLimited and subsidiaries as of December 31, 2016 and 2015, and the results of their operations and their cash flows for each ofthe three years in the period ended December 31, 2016, in conformity with accounting principles generally accepted in the UnitedStates of America. Also, in our opinion, such financial statement schedule, when considered in relation to the basic consolidatedfinancial statements taken as a whole, presents fairly, in all material respects, the information set forth therein.
We have also audited, in accordance with the standards of the Public Company Accounting Oversight Board (United States), theCompany’s internal control over financial reporting as of December 31, 2016, based on the criteria established in Internal Control –Integrated Framework (2013) issued by the Committee of Sponsoring Organizations of the Treadway Commission and our reportdated February 28, 2017 expressed an unqualified opinion on the Company’s internal control over financial reporting.
/s/ Deloitte & Touche LLP
New York, New YorkFebruary 28, 2017
F-2 2016 Bunge Annual Report
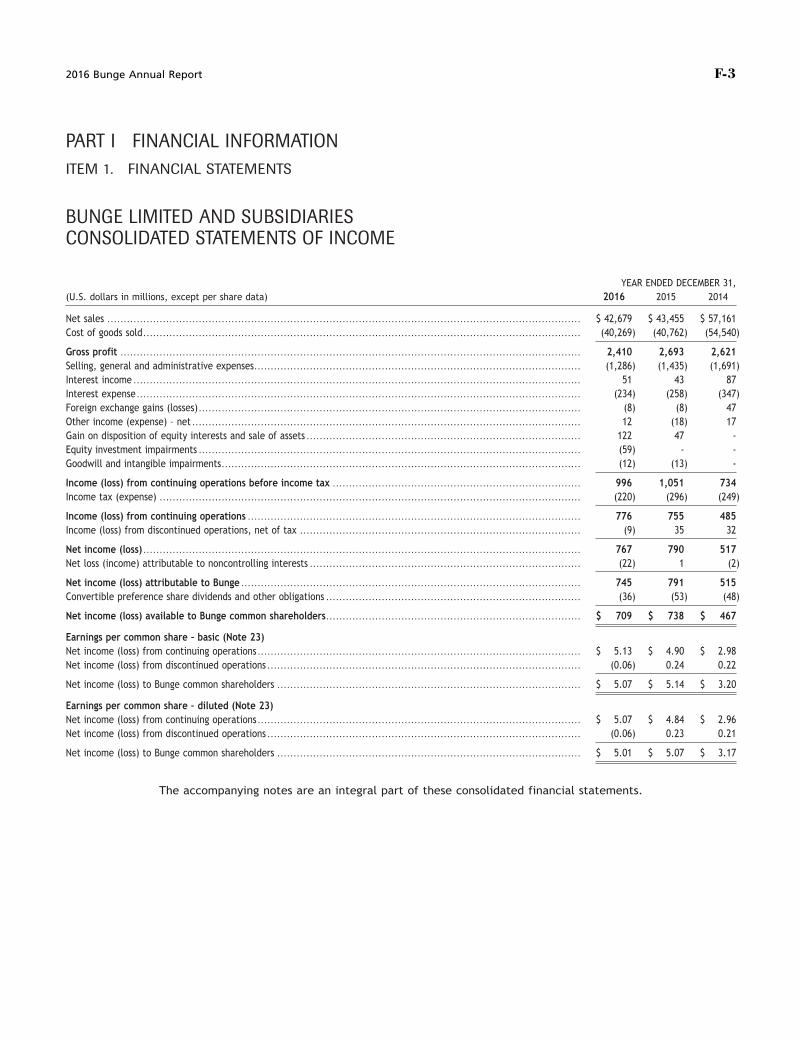
F-3
PART I FINANCIAL INFORMATIONITEM 1. FINANCIAL STATEMENTS
BUNGE LIMITED AND SUBSIDIARIESCONSOLIDATED STATEMENTS OF INCOME
YEAR ENDED DECEMBER 31,(U.S. dollars in millions, except per share data) 2016 2015 2014
Net sales . . . . . . . . . . . . . . . . . . . . . . . . . . . . . . . . . . . . . . . . . . . . . . . . . . . . . . . . . . . . . . . . . . . . . . . . . . . . . . . . . . . . . . . . . . . . . . . . . . . . . . . . . . . . . . . . . . . . . . . . . . . . . . . . . . . . . . . . . . . . . . . . . $ 42,679 $ 43,455 $ 57,161Cost of goods sold . . . . . . . . . . . . . . . . . . . . . . . . . . . . . . . . . . . . . . . . . . . . . . . . . . . . . . . . . . . . . . . . . . . . . . . . . . . . . . . . . . . . . . . . . . . . . . . . . . . . . . . . . . . . . . . . . . . . . . . . . . . . . . . . . . . . . . (40,269) (40,762) (54,540)
Gross profit . . . . . . . . . . . . . . . . . . . . . . . . . . . . . . . . . . . . . . . . . . . . . . . . . . . . . . . . . . . . . . . . . . . . . . . . . . . . . . . . . . . . . . . . . . . . . . . . . . . . . . . . . . . . . . . . . . . . . . . . . . . . . . . . . . . . . . . . . . . . . 2,410 2,693 2,621Selling, general and administrative expenses . . . . . . . . . . . . . . . . . . . . . . . . . . . . . . . . . . . . . . . . . . . . . . . . . . . . . . . . . . . . . . . . . . . . . . . . . . . . . . . . . . . . . . . . . . . . . . . . . . . . (1,286) (1,435) (1,691)Interest income . . . . . . . . . . . . . . . . . . . . . . . . . . . . . . . . . . . . . . . . . . . . . . . . . . . . . . . . . . . . . . . . . . . . . . . . . . . . . . . . . . . . . . . . . . . . . . . . . . . . . . . . . . . . . . . . . . . . . . . . . . . . . . . . . . . . . . . . . 51 43 87Interest expense . . . . . . . . . . . . . . . . . . . . . . . . . . . . . . . . . . . . . . . . . . . . . . . . . . . . . . . . . . . . . . . . . . . . . . . . . . . . . . . . . . . . . . . . . . . . . . . . . . . . . . . . . . . . . . . . . . . . . . . . . . . . . . . . . . . . . . . . (234) (258) (347)Foreign exchange gains (losses) . . . . . . . . . . . . . . . . . . . . . . . . . . . . . . . . . . . . . . . . . . . . . . . . . . . . . . . . . . . . . . . . . . . . . . . . . . . . . . . . . . . . . . . . . . . . . . . . . . . . . . . . . . . . . . . . . . . . . (8) (8) 47Other income (expense) – net . . . . . . . . . . . . . . . . . . . . . . . . . . . . . . . . . . . . . . . . . . . . . . . . . . . . . . . . . . . . . . . . . . . . . . . . . . . . . . . . . . . . . . . . . . . . . . . . . . . . . . . . . . . . . . . . . . . . . . . 12 (18) 17Gain on disposition of equity interests and sale of assets . . . . . . . . . . . . . . . . . . . . . . . . . . . . . . . . . . . . . . . . . . . . . . . . . . . . . . . . . . . . . . . . . . . . . . . . . . . . . . . . . . . . 122 47 -Equity investment impairments . . . . . . . . . . . . . . . . . . . . . . . . . . . . . . . . . . . . . . . . . . . . . . . . . . . . . . . . . . . . . . . . . . . . . . . . . . . . . . . . . . . . . . . . . . . . . . . . . . . . . . . . . . . . . . . . . . . . . (59) - -Goodwill and intangible impairments . . . . . . . . . . . . . . . . . . . . . . . . . . . . . . . . . . . . . . . . . . . . . . . . . . . . . . . . . . . . . . . . . . . . . . . . . . . . . . . . . . . . . . . . . . . . . . . . . . . . . . . . . . . . . . (12) (13) -
Income (loss) from continuing operations before income tax . . . . . . . . . . . . . . . . . . . . . . . . . . . . . . . . . . . . . . . . . . . . . . . . . . . . . . . . . . . . . . . . . . . . . . . . . . . . 996 1,051 734Income tax (expense) . . . . . . . . . . . . . . . . . . . . . . . . . . . . . . . . . . . . . . . . . . . . . . . . . . . . . . . . . . . . . . . . . . . . . . . . . . . . . . . . . . . . . . . . . . . . . . . . . . . . . . . . . . . . . . . . . . . . . . . . . . . . . . . . . (220) (296) (249)
Income (loss) from continuing operations . . . . . . . . . . . . . . . . . . . . . . . . . . . . . . . . . . . . . . . . . . . . . . . . . . . . . . . . . . . . . . . . . . . . . . . . . . . . . . . . . . . . . . . . . . . . . . . . . . . . . . 776 755 485Income (loss) from discontinued operations, net of tax . . . . . . . . . . . . . . . . . . . . . . . . . . . . . . . . . . . . . . . . . . . . . . . . . . . . . . . . . . . . . . . . . . . . . . . . . . . . . . . . . . . . . . (9) 35 32
Net income (loss) . . . . . . . . . . . . . . . . . . . . . . . . . . . . . . . . . . . . . . . . . . . . . . . . . . . . . . . . . . . . . . . . . . . . . . . . . . . . . . . . . . . . . . . . . . . . . . . . . . . . . . . . . . . . . . . . . . . . . . . . . . . . . . . . . . . . . . 767 790 517Net loss (income) attributable to noncontrolling interests . . . . . . . . . . . . . . . . . . . . . . . . . . . . . . . . . . . . . . . . . . . . . . . . . . . . . . . . . . . . . . . . . . . . . . . . . . . . . . . . . . . (22) 1 (2)
Net income (loss) attributable to Bunge . . . . . . . . . . . . . . . . . . . . . . . . . . . . . . . . . . . . . . . . . . . . . . . . . . . . . . . . . . . . . . . . . . . . . . . . . . . . . . . . . . . . . . . . . . . . . . . . . . . . . . . . 745 791 515Convertible preference share dividends and other obligations . . . . . . . . . . . . . . . . . . . . . . . . . . . . . . . . . . . . . . . . . . . . . . . . . . . . . . . . . . . . . . . . . . . . . . . . . . . . . . (36) (53) (48)
Net income (loss) available to Bunge common shareholders . . . . . . . . . . . . . . . . . . . . . . . . . . . . . . . . . . . . . . . . . . . . . . . . . . . . . . . . . . . . . . . . . . . . . . . . . . . . . . $ 709 $ 738 $ 467
Earnings per common share – basic (Note 23)Net income (loss) from continuing operations . . . . . . . . . . . . . . . . . . . . . . . . . . . . . . . . . . . . . . . . . . . . . . . . . . . . . . . . . . . . . . . . . . . . . . . . . . . . . . . . . . . . . . . . . . . . . . . . . . . $ 5.13 $ 4.90 $ 2.98Net income (loss) from discontinued operations . . . . . . . . . . . . . . . . . . . . . . . . . . . . . . . . . . . . . . . . . . . . . . . . . . . . . . . . . . . . . . . . . . . . . . . . . . . . . . . . . . . . . . . . . . . . . . . . (0.06) 0.24 0.22
Net income (loss) to Bunge common shareholders . . . . . . . . . . . . . . . . . . . . . . . . . . . . . . . . . . . . . . . . . . . . . . . . . . . . . . . . . . . . . . . . . . . . . . . . . . . . . . . . . . . . . . . . . . . . . $ 5.07 $ 5.14 $ 3.20
Earnings per common share – diluted (Note 23)Net income (loss) from continuing operations . . . . . . . . . . . . . . . . . . . . . . . . . . . . . . . . . . . . . . . . . . . . . . . . . . . . . . . . . . . . . . . . . . . . . . . . . . . . . . . . . . . . . . . . . . . . . . . . . . . $ 5.07 $ 4.84 $ 2.96Net income (loss) from discontinued operations . . . . . . . . . . . . . . . . . . . . . . . . . . . . . . . . . . . . . . . . . . . . . . . . . . . . . . . . . . . . . . . . . . . . . . . . . . . . . . . . . . . . . . . . . . . . . . . . (0.06) 0.23 0.21
Net income (loss) to Bunge common shareholders . . . . . . . . . . . . . . . . . . . . . . . . . . . . . . . . . . . . . . . . . . . . . . . . . . . . . . . . . . . . . . . . . . . . . . . . . . . . . . . . . . . . . . . . . . . . . $ 5.01 $ 5.07 $ 3.17
The accompanying notes are an integral part of these consolidated financial statements.
2016 Bunge Annual Report F-3

F-4
BUNGE LIMITED AND SUBSIDIARIESCONSOLIDATED STATEMENTS OF COMPREHENSIVE INCOME (LOSS)
YEAR ENDED DECEMBER 31,(U.S. dollars in millions) 2016 2015 2014
Net income (loss) . . . . . . . . . . . . . . . . . . . . . . . . . . . . . . . . . . . . . . . . . . . . . . . . . . . . . . . . . . . . . . . . . . . . . . . . . . . . . . . . . . . . . . . . . . . . . . . . . . . . . . . . . . . . . . . . . . . . . . . . . . . . . . . . . . . . . . . . $ 767 $ 790 $ 517Other comprehensive income (loss):
Foreign exchange translation adjustment . . . . . . . . . . . . . . . . . . . . . . . . . . . . . . . . . . . . . . . . . . . . . . . . . . . . . . . . . . . . . . . . . . . . . . . . . . . . . . . . . . . . . . . . . . . . . . . . . . . . . . . 713 (2,550) (1,419)Unrealized gains (losses) on designated cash flow and net investment hedges, net of tax (expense) benefit of nil, nil
and nil . . . . . . . . . . . . . . . . . . . . . . . . . . . . . . . . . . . . . . . . . . . . . . . . . . . . . . . . . . . . . . . . . . . . . . . . . . . . . . . . . . . . . . . . . . . . . . . . . . . . . . . . . . . . . . . . . . . . . . . . . . . . . . . . . . . . . . . . . . . . . . . . (305) 147 21Unrealized gains (losses) on investments, net of tax (expense) benefit of nil, nil and $2 . . . . . . . . . . . . . . . . . . . . . . . . . . . . . . . . . . . . . . . . . . . - - (2)Reclassification of realized net losses (gains) to net income, net of tax expense (benefit) of nil, nil and nil . . . . . . . . . . . . . . . . . . (11) 77 (9)Pension adjustment, net of tax (expense) benefit of $4, $1 and $32 . . . . . . . . . . . . . . . . . . . . . . . . . . . . . . . . . . . . . . . . . . . . . . . . . . . . . . . . . . . . . . . . . . . . . (11) 20 (85)
Total other comprehensive income (loss) . . . . . . . . . . . . . . . . . . . . . . . . . . . . . . . . . . . . . . . . . . . . . . . . . . . . . . . . . . . . . . . . . . . . . . . . . . . . . . . . . . . . . . . . . . . . . . . . . . . . . . . . . . . 386 (2,306) (1,494)
Total comprehensive income (loss) . . . . . . . . . . . . . . . . . . . . . . . . . . . . . . . . . . . . . . . . . . . . . . . . . . . . . . . . . . . . . . . . . . . . . . . . . . . . . . . . . . . . . . . . . . . . . . . . . . . . . . . . . . . . . . . . . . . 1,153 (1,516) (977)Less: comprehensive (income) loss attributable to noncontrolling interest . . . . . . . . . . . . . . . . . . . . . . . . . . . . . . . . . . . . . . . . . . . . . . . . . . . . . . . . . . . . . (26) 5 6
Total comprehensive income (loss) attributable to Bunge . . . . . . . . . . . . . . . . . . . . . . . . . . . . . . . . . . . . . . . . . . . . . . . . . . . . . . . . . . . . . . . . . . . . . . . . . . . . . . . . . . . $ 1,127 $(1,511) $ (971)
The accompanying notes are an integral part of these consolidated financial statements.
F-4 2016 Bunge Annual Report

F-5
BUNGE LIMITED AND SUBSIDIARIESCONSOLIDATED BALANCE SHEETS
DECEMBER 31, DECEMBER 31,(U.S. dollars in millions, except share data) 2016 2015
ASSETSCurrent assets:
Cash and cash equivalents . . . . . . . . . . . . . . . . . . . . . . . . . . . . . . . . . . . . . . . . . . . . . . . . . . . . . . . . . . . . . . . . . . . . . . . . . . . . . . . . . . . . . . . . . . . . . . . . . . . . . . . . . . . . . . . . . . . . . . . . . . $ 934 $ 411Time deposits under trade structured finance program (Note 3) . . . . . . . . . . . . . . . . . . . . . . . . . . . . . . . . . . . . . . . . . . . . . . . . . . . . . . . . . . . . . . . . . . . . . . . . . . 64 325Trade accounts receivable (less allowances of $122 and $125) (Note 17) . . . . . . . . . . . . . . . . . . . . . . . . . . . . . . . . . . . . . . . . . . . . . . . . . . . . . . . . . . . . . . . 1,676 1,607Inventories (Note 4) . . . . . . . . . . . . . . . . . . . . . . . . . . . . . . . . . . . . . . . . . . . . . . . . . . . . . . . . . . . . . . . . . . . . . . . . . . . . . . . . . . . . . . . . . . . . . . . . . . . . . . . . . . . . . . . . . . . . . . . . . . . . . . . . . . 4,773 4,466Deferred income taxes (Note 13) . . . . . . . . . . . . . . . . . . . . . . . . . . . . . . . . . . . . . . . . . . . . . . . . . . . . . . . . . . . . . . . . . . . . . . . . . . . . . . . . . . . . . . . . . . . . . . . . . . . . . . . . . . . . . . . . . - 208Other current assets (Note 5) . . . . . . . . . . . . . . . . . . . . . . . . . . . . . . . . . . . . . . . . . . . . . . . . . . . . . . . . . . . . . . . . . . . . . . . . . . . . . . . . . . . . . . . . . . . . . . . . . . . . . . . . . . . . . . . . . . . . . . 3,645 3,899
Total current assets . . . . . . . . . . . . . . . . . . . . . . . . . . . . . . . . . . . . . . . . . . . . . . . . . . . . . . . . . . . . . . . . . . . . . . . . . . . . . . . . . . . . . . . . . . . . . . . . . . . . . . . . . . . . . . . . . . . . . . . . . . . . . . . . . . . . . 11,092 10,916
Property, plant and equipment, net (Note 6) . . . . . . . . . . . . . . . . . . . . . . . . . . . . . . . . . . . . . . . . . . . . . . . . . . . . . . . . . . . . . . . . . . . . . . . . . . . . . . . . . . . . . . . . . . . . . . . . . . . . . 5,099 4,736Goodwill (Note 7) . . . . . . . . . . . . . . . . . . . . . . . . . . . . . . . . . . . . . . . . . . . . . . . . . . . . . . . . . . . . . . . . . . . . . . . . . . . . . . . . . . . . . . . . . . . . . . . . . . . . . . . . . . . . . . . . . . . . . . . . . . . . . . . . . . . . . . . . 373 418Other intangible assets, net (Note 8) . . . . . . . . . . . . . . . . . . . . . . . . . . . . . . . . . . . . . . . . . . . . . . . . . . . . . . . . . . . . . . . . . . . . . . . . . . . . . . . . . . . . . . . . . . . . . . . . . . . . . . . . . . . . . . . 336 326Investments in affiliates (Note 10) . . . . . . . . . . . . . . . . . . . . . . . . . . . . . . . . . . . . . . . . . . . . . . . . . . . . . . . . . . . . . . . . . . . . . . . . . . . . . . . . . . . . . . . . . . . . . . . . . . . . . . . . . . . . . . . . . . 373 329Deferred income taxes (Note 13) . . . . . . . . . . . . . . . . . . . . . . . . . . . . . . . . . . . . . . . . . . . . . . . . . . . . . . . . . . . . . . . . . . . . . . . . . . . . . . . . . . . . . . . . . . . . . . . . . . . . . . . . . . . . . . . . . . . . 524 417Time deposits under trade structured finance program (Note 3) . . . . . . . . . . . . . . . . . . . . . . . . . . . . . . . . . . . . . . . . . . . . . . . . . . . . . . . . . . . . . . . . . . . . . . . . . . . . 464 -Other non-current assets (Note 11) . . . . . . . . . . . . . . . . . . . . . . . . . . . . . . . . . . . . . . . . . . . . . . . . . . . . . . . . . . . . . . . . . . . . . . . . . . . . . . . . . . . . . . . . . . . . . . . . . . . . . . . . . . . . . . . . . 927 772
Total assets . . . . . . . . . . . . . . . . . . . . . . . . . . . . . . . . . . . . . . . . . . . . . . . . . . . . . . . . . . . . . . . . . . . . . . . . . . . . . . . . . . . . . . . . . . . . . . . . . . . . . . . . . . . . . . . . . . . . . . . . . . . . . . . . . . . . . . . . . . . . . . . $19,188 $17,914
LIABILITIES AND EQUITYCurrent liabilities:
Short-term debt (Note 15) . . . . . . . . . . . . . . . . . . . . . . . . . . . . . . . . . . . . . . . . . . . . . . . . . . . . . . . . . . . . . . . . . . . . . . . . . . . . . . . . . . . . . . . . . . . . . . . . . . . . . . . . . . . . . . . . . . . . . . . . . . $ 257 $ 648Current portion of long-term debt (Note 16) . . . . . . . . . . . . . . . . . . . . . . . . . . . . . . . . . . . . . . . . . . . . . . . . . . . . . . . . . . . . . . . . . . . . . . . . . . . . . . . . . . . . . . . . . . . . . . . . . . . 938 869Letter of credit obligations under trade structured finance program (Note 3) . . . . . . . . . . . . . . . . . . . . . . . . . . . . . . . . . . . . . . . . . . . . . . . . . . . . . . . . 528 325Trade accounts payable . . . . . . . . . . . . . . . . . . . . . . . . . . . . . . . . . . . . . . . . . . . . . . . . . . . . . . . . . . . . . . . . . . . . . . . . . . . . . . . . . . . . . . . . . . . . . . . . . . . . . . . . . . . . . . . . . . . . . . . . . . . . . 3,485 2,675Deferred income taxes (Note 13) . . . . . . . . . . . . . . . . . . . . . . . . . . . . . . . . . . . . . . . . . . . . . . . . . . . . . . . . . . . . . . . . . . . . . . . . . . . . . . . . . . . . . . . . . . . . . . . . . . . . . . . . . . . . . . . . . - 60Other current liabilities (Note 12) . . . . . . . . . . . . . . . . . . . . . . . . . . . . . . . . . . . . . . . . . . . . . . . . . . . . . . . . . . . . . . . . . . . . . . . . . . . . . . . . . . . . . . . . . . . . . . . . . . . . . . . . . . . . . . . . 2,476 2,763
Total current liabilities . . . . . . . . . . . . . . . . . . . . . . . . . . . . . . . . . . . . . . . . . . . . . . . . . . . . . . . . . . . . . . . . . . . . . . . . . . . . . . . . . . . . . . . . . . . . . . . . . . . . . . . . . . . . . . . . . . . . . . . . . . . . . . . . 7,684 7,340Long-term debt (Note 16) . . . . . . . . . . . . . . . . . . . . . . . . . . . . . . . . . . . . . . . . . . . . . . . . . . . . . . . . . . . . . . . . . . . . . . . . . . . . . . . . . . . . . . . . . . . . . . . . . . . . . . . . . . . . . . . . . . . . . . . . . . . . . 3,069 2,926Deferred income taxes (Note 13) . . . . . . . . . . . . . . . . . . . . . . . . . . . . . . . . . . . . . . . . . . . . . . . . . . . . . . . . . . . . . . . . . . . . . . . . . . . . . . . . . . . . . . . . . . . . . . . . . . . . . . . . . . . . . . . . . . . . 239 209Other non-current liabilities . . . . . . . . . . . . . . . . . . . . . . . . . . . . . . . . . . . . . . . . . . . . . . . . . . . . . . . . . . . . . . . . . . . . . . . . . . . . . . . . . . . . . . . . . . . . . . . . . . . . . . . . . . . . . . . . . . . . . . . . . . 853 750Commitments and contingencies (Note 20)Redeemable noncontrolling interests (Note 21) . . . . . . . . . . . . . . . . . . . . . . . . . . . . . . . . . . . . . . . . . . . . . . . . . . . . . . . . . . . . . . . . . . . . . . . . . . . . . . . . . . . . . . . . . . . . . . . . . . - 37Equity (Note 22):
Convertible perpetual preference shares, par value $.01; authorized, issued and outstanding:2016 and 2015 - 6,900,000 shares (liquidation preference $100 per share) . . . . . . . . . . . . . . . . . . . . . . . . . . . . . . . . . . . . . . . . . . . . . . . . . . . . . . . . . . 690 690
Common shares, par value $.01; authorized - 400,000,000 shares; issued and outstanding:2016 - 139,500,862 shares, 2015 - 142,483,467 shares . . . . . . . . . . . . . . . . . . . . . . . . . . . . . . . . . . . . . . . . . . . . . . . . . . . . . . . . . . . . . . . . . . . . . . . . . . . . . . . . . . . . 1 1
Additional paid-in capital . . . . . . . . . . . . . . . . . . . . . . . . . . . . . . . . . . . . . . . . . . . . . . . . . . . . . . . . . . . . . . . . . . . . . . . . . . . . . . . . . . . . . . . . . . . . . . . . . . . . . . . . . . . . . . . . . . . . . . . . . . . 5,143 5,105Retained earnings . . . . . . . . . . . . . . . . . . . . . . . . . . . . . . . . . . . . . . . . . . . . . . . . . . . . . . . . . . . . . . . . . . . . . . . . . . . . . . . . . . . . . . . . . . . . . . . . . . . . . . . . . . . . . . . . . . . . . . . . . . . . . . . . . . . . . 8,208 7,725Accumulated other comprehensive income (loss) (Note 22) . . . . . . . . . . . . . . . . . . . . . . . . . . . . . . . . . . . . . . . . . . . . . . . . . . . . . . . . . . . . . . . . . . . . . . . . . . . . . . . . (5,978) (6,360)Treasury shares, at cost - 2016 - 12,882,313 and 2015 - 9,586,083 shares, respectively . . . . . . . . . . . . . . . . . . . . . . . . . . . . . . . . . . . . . . . . . . . . (920) (720)
Total Bunge shareholders’ equity . . . . . . . . . . . . . . . . . . . . . . . . . . . . . . . . . . . . . . . . . . . . . . . . . . . . . . . . . . . . . . . . . . . . . . . . . . . . . . . . . . . . . . . . . . . . . . . . . . . . . . . . . . . . . . . . . 7,144 6,441Noncontrolling interests . . . . . . . . . . . . . . . . . . . . . . . . . . . . . . . . . . . . . . . . . . . . . . . . . . . . . . . . . . . . . . . . . . . . . . . . . . . . . . . . . . . . . . . . . . . . . . . . . . . . . . . . . . . . . . . . . . . . . . . . . . . . . 199 211
Total equity . . . . . . . . . . . . . . . . . . . . . . . . . . . . . . . . . . . . . . . . . . . . . . . . . . . . . . . . . . . . . . . . . . . . . . . . . . . . . . . . . . . . . . . . . . . . . . . . . . . . . . . . . . . . . . . . . . . . . . . . . . . . . . . . . . . . . . . . . . . . 7,343 6,652
Total liabilities and equity . . . . . . . . . . . . . . . . . . . . . . . . . . . . . . . . . . . . . . . . . . . . . . . . . . . . . . . . . . . . . . . . . . . . . . . . . . . . . . . . . . . . . . . . . . . . . . . . . . . . . . . . . . . . . . . . . . . . . . . . . . . $19,188 $17,914
The accompanying notes are an integral part of these consolidated financial statements.
2016 Bunge Annual Report F-5
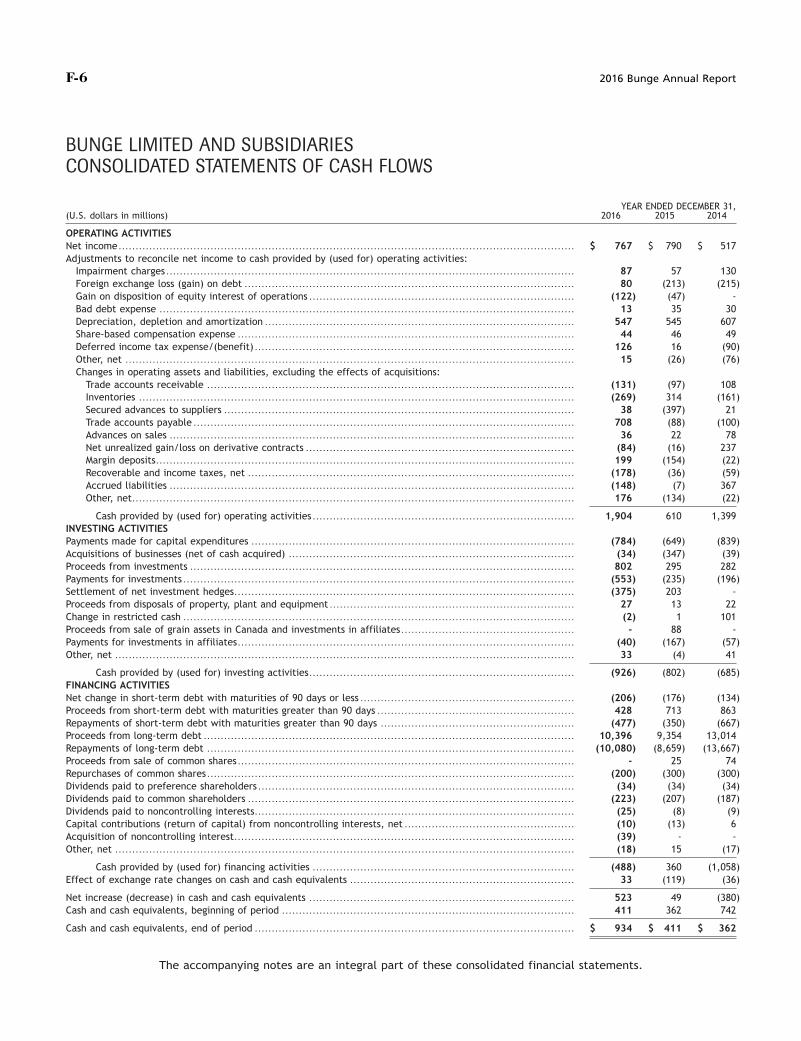
F-6
BUNGE LIMITED AND SUBSIDIARIESCONSOLIDATED STATEMENTS OF CASH FLOWS
YEAR ENDED DECEMBER 31,(U.S. dollars in millions) 2016 2015 2014
OPERATING ACTIVITIESNet income . . . . . . . . . . . . . . . . . . . . . . . . . . . . . . . . . . . . . . . . . . . . . . . . . . . . . . . . . . . . . . . . . . . . . . . . . . . . . . . . . . . . . . . . . . . . . . . . . . . . . . . . . . . . . . . . . . . . . . . . . . . . . . . . . . . . . . $ 767 $ 790 $ 517Adjustments to reconcile net income to cash provided by (used for) operating activities:
Impairment charges . . . . . . . . . . . . . . . . . . . . . . . . . . . . . . . . . . . . . . . . . . . . . . . . . . . . . . . . . . . . . . . . . . . . . . . . . . . . . . . . . . . . . . . . . . . . . . . . . . . . . . . . . . . . . . . . . . . . . . . . 87 57 130Foreign exchange loss (gain) on debt . . . . . . . . . . . . . . . . . . . . . . . . . . . . . . . . . . . . . . . . . . . . . . . . . . . . . . . . . . . . . . . . . . . . . . . . . . . . . . . . . . . . . . . . . . . . . . . . . 80 (213) (215)Gain on disposition of equity interest of operations . . . . . . . . . . . . . . . . . . . . . . . . . . . . . . . . . . . . . . . . . . . . . . . . . . . . . . . . . . . . . . . . . . . . . . . . . . . . . . (122) (47) -Bad debt expense . . . . . . . . . . . . . . . . . . . . . . . . . . . . . . . . . . . . . . . . . . . . . . . . . . . . . . . . . . . . . . . . . . . . . . . . . . . . . . . . . . . . . . . . . . . . . . . . . . . . . . . . . . . . . . . . . . . . . . . . . . 13 35 30Depreciation, depletion and amortization . . . . . . . . . . . . . . . . . . . . . . . . . . . . . . . . . . . . . . . . . . . . . . . . . . . . . . . . . . . . . . . . . . . . . . . . . . . . . . . . . . . . . . . . . . . 547 545 607Share-based compensation expense . . . . . . . . . . . . . . . . . . . . . . . . . . . . . . . . . . . . . . . . . . . . . . . . . . . . . . . . . . . . . . . . . . . . . . . . . . . . . . . . . . . . . . . . . . . . . . . . . . . 44 46 49Deferred income tax expense/(benefit) . . . . . . . . . . . . . . . . . . . . . . . . . . . . . . . . . . . . . . . . . . . . . . . . . . . . . . . . . . . . . . . . . . . . . . . . . . . . . . . . . . . . . . . . . . . . . . 126 16 (90)Other, net . . . . . . . . . . . . . . . . . . . . . . . . . . . . . . . . . . . . . . . . . . . . . . . . . . . . . . . . . . . . . . . . . . . . . . . . . . . . . . . . . . . . . . . . . . . . . . . . . . . . . . . . . . . . . . . . . . . . . . . . . . . . . . . . . . . . 15 (26) (76)Changes in operating assets and liabilities, excluding the effects of acquisitions:
Trade accounts receivable . . . . . . . . . . . . . . . . . . . . . . . . . . . . . . . . . . . . . . . . . . . . . . . . . . . . . . . . . . . . . . . . . . . . . . . . . . . . . . . . . . . . . . . . . . . . . . . . . . . . . . . . . . . . (131) (97) 108Inventories . . . . . . . . . . . . . . . . . . . . . . . . . . . . . . . . . . . . . . . . . . . . . . . . . . . . . . . . . . . . . . . . . . . . . . . . . . . . . . . . . . . . . . . . . . . . . . . . . . . . . . . . . . . . . . . . . . . . . . . . . . . . . . . . (269) 314 (161)Secured advances to suppliers . . . . . . . . . . . . . . . . . . . . . . . . . . . . . . . . . . . . . . . . . . . . . . . . . . . . . . . . . . . . . . . . . . . . . . . . . . . . . . . . . . . . . . . . . . . . . . . . . . . . . . . 38 (397) 21Trade accounts payable . . . . . . . . . . . . . . . . . . . . . . . . . . . . . . . . . . . . . . . . . . . . . . . . . . . . . . . . . . . . . . . . . . . . . . . . . . . . . . . . . . . . . . . . . . . . . . . . . . . . . . . . . . . . . . . . 708 (88) (100)Advances on sales . . . . . . . . . . . . . . . . . . . . . . . . . . . . . . . . . . . . . . . . . . . . . . . . . . . . . . . . . . . . . . . . . . . . . . . . . . . . . . . . . . . . . . . . . . . . . . . . . . . . . . . . . . . . . . . . . . . . . . . 36 22 78Net unrealized gain/loss on derivative contracts . . . . . . . . . . . . . . . . . . . . . . . . . . . . . . . . . . . . . . . . . . . . . . . . . . . . . . . . . . . . . . . . . . . . . . . . . . . . . . . (84) (16) 237Margin deposits . . . . . . . . . . . . . . . . . . . . . . . . . . . . . . . . . . . . . . . . . . . . . . . . . . . . . . . . . . . . . . . . . . . . . . . . . . . . . . . . . . . . . . . . . . . . . . . . . . . . . . . . . . . . . . . . . . . . . . . . . . . 199 (154) (22)Recoverable and income taxes, net . . . . . . . . . . . . . . . . . . . . . . . . . . . . . . . . . . . . . . . . . . . . . . . . . . . . . . . . . . . . . . . . . . . . . . . . . . . . . . . . . . . . . . . . . . . . . . . . (178) (36) (59)Accrued liabilities . . . . . . . . . . . . . . . . . . . . . . . . . . . . . . . . . . . . . . . . . . . . . . . . . . . . . . . . . . . . . . . . . . . . . . . . . . . . . . . . . . . . . . . . . . . . . . . . . . . . . . . . . . . . . . . . . . . . . . . (148) (7) 367Other, net . . . . . . . . . . . . . . . . . . . . . . . . . . . . . . . . . . . . . . . . . . . . . . . . . . . . . . . . . . . . . . . . . . . . . . . . . . . . . . . . . . . . . . . . . . . . . . . . . . . . . . . . . . . . . . . . . . . . . . . . . . . . . . . . . . 176 (134) (22)
Cash provided by (used for) operating activities . . . . . . . . . . . . . . . . . . . . . . . . . . . . . . . . . . . . . . . . . . . . . . . . . . . . . . . . . . . . . . . . . . . . . . . . . . . . . 1,904 610 1,399INVESTING ACTIVITIESPayments made for capital expenditures . . . . . . . . . . . . . . . . . . . . . . . . . . . . . . . . . . . . . . . . . . . . . . . . . . . . . . . . . . . . . . . . . . . . . . . . . . . . . . . . . . . . . . . . . . . . . . . (784) (649) (839)Acquisitions of businesses (net of cash acquired) . . . . . . . . . . . . . . . . . . . . . . . . . . . . . . . . . . . . . . . . . . . . . . . . . . . . . . . . . . . . . . . . . . . . . . . . . . . . . . . . . . . . (34) (347) (39)Proceeds from investments . . . . . . . . . . . . . . . . . . . . . . . . . . . . . . . . . . . . . . . . . . . . . . . . . . . . . . . . . . . . . . . . . . . . . . . . . . . . . . . . . . . . . . . . . . . . . . . . . . . . . . . . . . . . . . . . . 802 295 282Payments for investments . . . . . . . . . . . . . . . . . . . . . . . . . . . . . . . . . . . . . . . . . . . . . . . . . . . . . . . . . . . . . . . . . . . . . . . . . . . . . . . . . . . . . . . . . . . . . . . . . . . . . . . . . . . . . . . . . . . (553) (235) (196)Settlement of net investment hedges . . . . . . . . . . . . . . . . . . . . . . . . . . . . . . . . . . . . . . . . . . . . . . . . . . . . . . . . . . . . . . . . . . . . . . . . . . . . . . . . . . . . . . . . . . . . . . . . . . . . (375) 203 -Proceeds from disposals of property, plant and equipment . . . . . . . . . . . . . . . . . . . . . . . . . . . . . . . . . . . . . . . . . . . . . . . . . . . . . . . . . . . . . . . . . . . . . . . . 27 13 22Change in restricted cash . . . . . . . . . . . . . . . . . . . . . . . . . . . . . . . . . . . . . . . . . . . . . . . . . . . . . . . . . . . . . . . . . . . . . . . . . . . . . . . . . . . . . . . . . . . . . . . . . . . . . . . . . . . . . . . . . . . (2) 1 101Proceeds from sale of grain assets in Canada and investments in affiliates . . . . . . . . . . . . . . . . . . . . . . . . . . . . . . . . . . . . . . . . . . . . . . . . . . . - 88 -Payments for investments in affiliates . . . . . . . . . . . . . . . . . . . . . . . . . . . . . . . . . . . . . . . . . . . . . . . . . . . . . . . . . . . . . . . . . . . . . . . . . . . . . . . . . . . . . . . . . . . . . . . . . . . (40) (167) (57)Other, net . . . . . . . . . . . . . . . . . . . . . . . . . . . . . . . . . . . . . . . . . . . . . . . . . . . . . . . . . . . . . . . . . . . . . . . . . . . . . . . . . . . . . . . . . . . . . . . . . . . . . . . . . . . . . . . . . . . . . . . . . . . . . . . . . . . . . . . 33 (4) 41
Cash provided by (used for) investing activities . . . . . . . . . . . . . . . . . . . . . . . . . . . . . . . . . . . . . . . . . . . . . . . . . . . . . . . . . . . . . . . . . . . . . . . . . . . . . . (926) (802) (685)FINANCING ACTIVITIESNet change in short-term debt with maturities of 90 days or less . . . . . . . . . . . . . . . . . . . . . . . . . . . . . . . . . . . . . . . . . . . . . . . . . . . . . . . . . . . . . . . (206) (176) (134)Proceeds from short-term debt with maturities greater than 90 days . . . . . . . . . . . . . . . . . . . . . . . . . . . . . . . . . . . . . . . . . . . . . . . . . . . . . . . . . . 428 713 863Repayments of short-term debt with maturities greater than 90 days . . . . . . . . . . . . . . . . . . . . . . . . . . . . . . . . . . . . . . . . . . . . . . . . . . . . . . . . . (477) (350) (667)Proceeds from long-term debt . . . . . . . . . . . . . . . . . . . . . . . . . . . . . . . . . . . . . . . . . . . . . . . . . . . . . . . . . . . . . . . . . . . . . . . . . . . . . . . . . . . . . . . . . . . . . . . . . . . . . . . . . . . . . 10,396 9,354 13,014Repayments of long-term debt . . . . . . . . . . . . . . . . . . . . . . . . . . . . . . . . . . . . . . . . . . . . . . . . . . . . . . . . . . . . . . . . . . . . . . . . . . . . . . . . . . . . . . . . . . . . . . . . . . . . . . . . . . . . (10,080) (8,659) (13,667)Proceeds from sale of common shares . . . . . . . . . . . . . . . . . . . . . . . . . . . . . . . . . . . . . . . . . . . . . . . . . . . . . . . . . . . . . . . . . . . . . . . . . . . . . . . . . . . . . . . . . . . . . . . . . . . - 25 74Repurchases of common shares . . . . . . . . . . . . . . . . . . . . . . . . . . . . . . . . . . . . . . . . . . . . . . . . . . . . . . . . . . . . . . . . . . . . . . . . . . . . . . . . . . . . . . . . . . . . . . . . . . . . . . . . . . . . (200) (300) (300)Dividends paid to preference shareholders . . . . . . . . . . . . . . . . . . . . . . . . . . . . . . . . . . . . . . . . . . . . . . . . . . . . . . . . . . . . . . . . . . . . . . . . . . . . . . . . . . . . . . . . . . . . . (34) (34) (34)Dividends paid to common shareholders . . . . . . . . . . . . . . . . . . . . . . . . . . . . . . . . . . . . . . . . . . . . . . . . . . . . . . . . . . . . . . . . . . . . . . . . . . . . . . . . . . . . . . . . . . . . . . . . (223) (207) (187)Dividends paid to noncontrolling interests . . . . . . . . . . . . . . . . . . . . . . . . . . . . . . . . . . . . . . . . . . . . . . . . . . . . . . . . . . . . . . . . . . . . . . . . . . . . . . . . . . . . . . . . . . . . . . (25) (8) (9)Capital contributions (return of capital) from noncontrolling interests, net . . . . . . . . . . . . . . . . . . . . . . . . . . . . . . . . . . . . . . . . . . . . . . . . . . (10) (13) 6Acquisition of noncontrolling interest . . . . . . . . . . . . . . . . . . . . . . . . . . . . . . . . . . . . . . . . . . . . . . . . . . . . . . . . . . . . . . . . . . . . . . . . . . . . . . . . . . . . . . . . . . . . . . . . . . . . (39) - -Other, net . . . . . . . . . . . . . . . . . . . . . . . . . . . . . . . . . . . . . . . . . . . . . . . . . . . . . . . . . . . . . . . . . . . . . . . . . . . . . . . . . . . . . . . . . . . . . . . . . . . . . . . . . . . . . . . . . . . . . . . . . . . . . . . . . . . . . . . (18) 15 (17)
Cash provided by (used for) financing activities . . . . . . . . . . . . . . . . . . . . . . . . . . . . . . . . . . . . . . . . . . . . . . . . . . . . . . . . . . . . . . . . . . . . . . . . . . . . . (488) 360 (1,058)Effect of exchange rate changes on cash and cash equivalents . . . . . . . . . . . . . . . . . . . . . . . . . . . . . . . . . . . . . . . . . . . . . . . . . . . . . . . . . . . . . . . . . . 33 (119) (36)
Net increase (decrease) in cash and cash equivalents . . . . . . . . . . . . . . . . . . . . . . . . . . . . . . . . . . . . . . . . . . . . . . . . . . . . . . . . . . . . . . . . . . . . . . . . . . . . . . 523 49 (380)Cash and cash equivalents, beginning of period . . . . . . . . . . . . . . . . . . . . . . . . . . . . . . . . . . . . . . . . . . . . . . . . . . . . . . . . . . . . . . . . . . . . . . . . . . . . . . . . . . . . . . 411 362 742
Cash and cash equivalents, end of period . . . . . . . . . . . . . . . . . . . . . . . . . . . . . . . . . . . . . . . . . . . . . . . . . . . . . . . . . . . . . . . . . . . . . . . . . . . . . . . . . . . . . . . . . . . . . . $ 934 $ 411 $ 362
The accompanying notes are an integral part of these consolidated financial statements.
F-6 2016 Bunge Annual Report
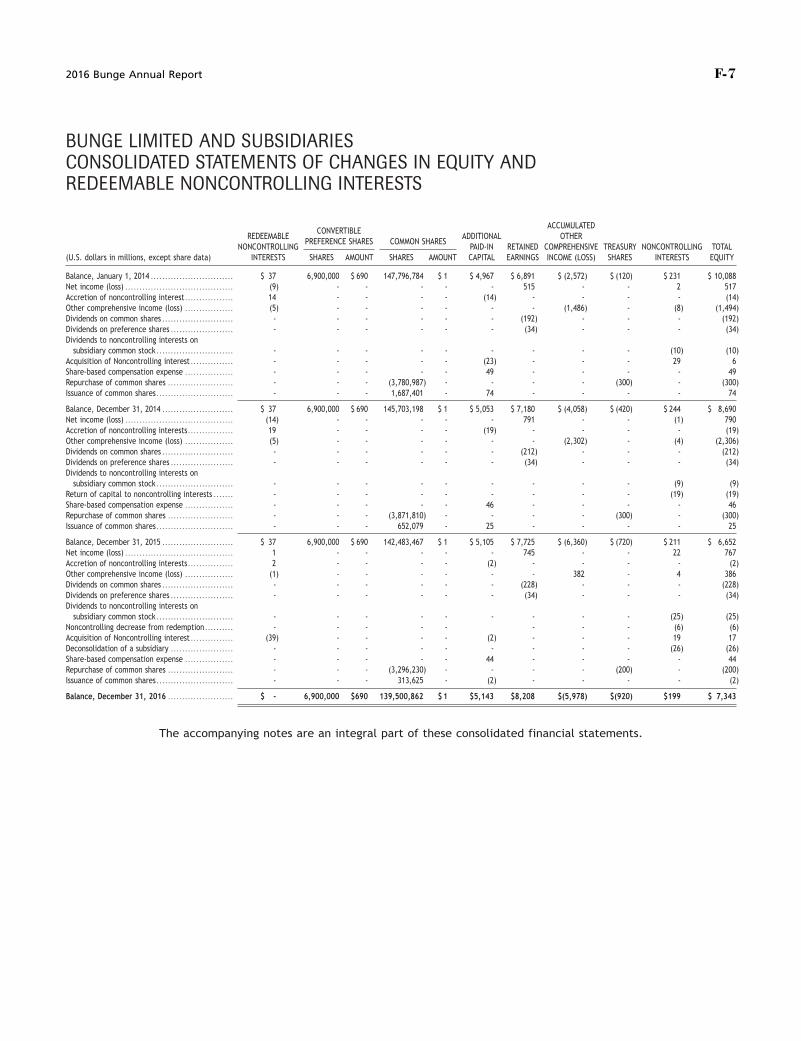
F-7
BUNGE LIMITED AND SUBSIDIARIESCONSOLIDATED STATEMENTS OF CHANGES IN EQUITY ANDREDEEMABLE NONCONTROLLING INTERESTS
ACCUMULATEDCONVERTIBLE
REDEEMABLE ADDITIONAL OTHERPREFERENCE SHARES COMMON SHARES
NONCONTROLLING PAID-IN RETAINED COMPREHENSIVE TREASURY NONCONTROLLING TOTAL(U.S. dollars in millions, except share data) INTERESTS SHARES AMOUNT SHARES AMOUNT CAPITAL EARNINGS INCOME (LOSS) SHARES INTERESTS EQUITY
Balance, January 1, 2014 . . . . . . . . . . . . . . . . . . . . . . . . . . . . . $ 37 6,900,000 $ 690 147,796,784 $ 1 $ 4,967 $ 6,891 $ (2,572) $ (120) $ 231 $ 10,088Net income (loss) . . . . . . . . . . . . . . . . . . . . . . . . . . . . . . . . . . . . . . (9) - - - - - 515 - - 2 517Accretion of noncontrolling interest . . . . . . . . . . . . . . . . . 14 - - - - (14) - - - - (14)Other comprehensive income (loss) . . . . . . . . . . . . . . . . . (5) - - - - - - (1,486) - (8) (1,494)Dividends on common shares . . . . . . . . . . . . . . . . . . . . . . . . . - - - - - - (192) - - - (192)Dividends on preference shares . . . . . . . . . . . . . . . . . . . . . . - - - - - - (34) - - - (34)Dividends to noncontrolling interests on
subsidiary common stock . . . . . . . . . . . . . . . . . . . . . . . . . . . - - - - - - - - - (10) (10)Acquisition of Noncontrolling interest . . . . . . . . . . . . . . . - - - - - (23) - - - 29 6Share-based compensation expense . . . . . . . . . . . . . . . . . - - - - - 49 - - - - 49Repurchase of common shares . . . . . . . . . . . . . . . . . . . . . . . - - - (3,780,987) - - - - (300) - (300)Issuance of common shares . . . . . . . . . . . . . . . . . . . . . . . . . . . - - - 1,687,401 - 74 - - - - 74
Balance, December 31, 2014 . . . . . . . . . . . . . . . . . . . . . . . . . $ 37 6,900,000 $ 690 145,703,198 $ 1 $ 5,053 $ 7,180 $ (4,058) $ (420) $ 244 $ 8,690Net income (loss) . . . . . . . . . . . . . . . . . . . . . . . . . . . . . . . . . . . . . . (14) - - - - - 791 - - (1) 790Accretion of noncontrolling interests . . . . . . . . . . . . . . . . 19 - - - - (19) - - - - (19)Other comprehensive income (loss) . . . . . . . . . . . . . . . . . (5) - - - - - - (2,302) - (4) (2,306)Dividends on common shares . . . . . . . . . . . . . . . . . . . . . . . . . - - - - - - (212) - - - (212)Dividends on preference shares . . . . . . . . . . . . . . . . . . . . . . - - - - - - (34) - - - (34)Dividends to noncontrolling interests on
subsidiary common stock . . . . . . . . . . . . . . . . . . . . . . . . . . . - - - - - - - - - (9) (9)Return of capital to noncontrolling interests . . . . . . . - - - - - - - - - (19) (19)Share-based compensation expense . . . . . . . . . . . . . . . . . - - - - - 46 - - - - 46Repurchase of common shares . . . . . . . . . . . . . . . . . . . . . . . - - - (3,871,810) - - - - (300) - (300)Issuance of common shares . . . . . . . . . . . . . . . . . . . . . . . . . . . - - - 652,079 - 25 - - - - 25
Balance, December 31, 2015 . . . . . . . . . . . . . . . . . . . . . . . . . $ 37 6,900,000 $ 690 142,483,467 $ 1 $ 5,105 $ 7,725 $ (6,360) $ (720) $ 211 $ 6,652Net income (loss) . . . . . . . . . . . . . . . . . . . . . . . . . . . . . . . . . . . . . . 1 - - - - - 745 - - 22 767Accretion of noncontrolling interests . . . . . . . . . . . . . . . . 2 - - - - (2) - - - - (2)Other comprehensive income (loss) . . . . . . . . . . . . . . . . . (1) - - - - - - 382 - 4 386Dividends on common shares . . . . . . . . . . . . . . . . . . . . . . . . . - - - - - - (228) - - - (228)Dividends on preference shares . . . . . . . . . . . . . . . . . . . . . . - - - - - - (34) - - - (34)Dividends to noncontrolling interests on
subsidiary common stock . . . . . . . . . . . . . . . . . . . . . . . . . . . - - - - - - - - - (25) (25)Noncontrolling decrease from redemption . . . . . . . . . . - - - - - - - - (6) (6)Acquisition of Noncontrolling interest . . . . . . . . . . . . . . . (39) - - - - (2) - - - 19 17Deconsolidation of a subsidiary . . . . . . . . . . . . . . . . . . . . . . - - - - - - - - - (26) (26)Share-based compensation expense . . . . . . . . . . . . . . . . . - - - - - 44 - - - - 44Repurchase of common shares . . . . . . . . . . . . . . . . . . . . . . . - - - (3,296,230) - - - - (200) - (200)Issuance of common shares . . . . . . . . . . . . . . . . . . . . . . . . . . . - - - 313,625 - (2) - - - - (2)
Balance, December 31, 2016 . . . . . . . . . . . . . . . . . . . . . . . $ - 6,900,000 $690 139,500,862 $ 1 $5,143 $8,208 $(5,978) $(920) $199 $ 7,343
The accompanying notes are an integral part of these consolidated financial statements.
2016 Bunge Annual Report F-7

F-8
of sugar through its global trading offices. In addition, the1. NATURE OF BUSINESS, BASIS OF PRESENTATION, ANDsegment includes investments in corn-based ethanol producersSIGNIFICANT ACCOUNTING POLICIESin the United States and Argentina.
Description of Business – Bunge Limited, a Bermuda holding Fertilizer – Bunge’s Fertilizer segment operates primarily as acompany, together with its consolidated subsidiaries and producer and blender of NPK (nitrogen, phosphate andvariable interest entities (‘‘VIEs’’) in which it is considered the potassium) fertilizer formulas, including phosphate-based liquidprimary beneficiary, through which its businesses are and solid nitrogen fertilizers through its operations in Argentinaconducted (collectively ‘‘Bunge’’), is an integrated, global to farmers and distributors in Argentina. This segment alsoAgribusiness and Food company. Bunge’s common shares includes the operations of fertilizer ports in Brazil andtrade on the New York Stock Exchange under the ticker symbol Argentina.‘‘BG.’’ Bunge operates in four principal business areas, whichinclude five reportable segments: Agribusiness, Edible Oil Basis of Presentation – The consolidated financial statementsProducts, Milling Products, Sugar and Bioenergy and Fertilizer. are prepared in conformity with accounting principles generally
accepted in the United States of America (‘‘U.S. GAAP’’).Agribusiness – Bunge’s Agribusiness segment is an integratedbusiness involved in the purchase, storage, transport, Discontinued Operations – In determining whether a disposalprocessing and sale of agricultural commodities and group should be presented as discontinued operations, Bungecommodity products. Bunge’s agribusiness operations and makes a determination of whether such a group beingassets are located in North America, South America, Europe disposed of comprises a component of the entity, or a group ofand Asia-Pacific with merchandising and distribution offices components of the entity, that represents a strategic shift thatthroughout the world. has, or will have, a major effect on the reporting entity’s
operations and financial results. If these determinations areBunge’s Agribusiness segment also participates in related made affirmatively, the results of operations of the group beingfinancial activities, such as offering trade structured finance, disposed of (as well as any gain or loss on the disposalwhich leverages its international trade flows, providing risk transaction) are aggregated for separate presentation apartmanagement services to customers by assisting them with from the continuing operations of the Company for all periodsmanaging price exposure to agricultural commodities, presented in the consolidated financial statements.proprietary trading of foreign exchange and other financialinstruments and developing private investment vehicles to Principles of Consolidation – The accompanying consolidatedinvest in businesses complementary to Bunge’s commodities financial statements include the accounts of Bunge, itsoperations. subsidiaries and VIEs in which Bunge is considered to be the
primary beneficiary, and as a result, include the assets,Edible Oil products – Bunge’s Edible Oil Products segment liabilities, revenues and expenses of all entities over whichproduces and sells edible oil products, such as packaged and Bunge exercises control. Equity investments in which Bungebulk oils, shortenings, margarine, mayonnaise and other has the ability to exercise significant influence but does notproducts derived from the vegetable oil refining process. control are accounted for by the equity method of accounting.Bunge’s edible oil products operations are located in North Investments in which Bunge does not exercise significantAmerica, South America, Europe and Asia-Pacific. influence are accounted for by the cost method of accounting.
Intercompany accounts and transactions are eliminated. BungeMilling products – Bunge’s Milling Products segment includesconsolidates VIEs in which it is considered to be the primarywheat, corn and rice milling businesses, which purchase wheat,beneficiary and reconsiders such conclusion at each reportingcorn and rice directly from farmers and dealers and processperiod. An enterprise is determined to be the primarythem into milled products for food processors, bakeries,beneficiary if it has a controlling financial interest underbrewers, snack food producers and other customers. Bunge’sU.S. GAAP, defined as (a) the power to direct the activities of awheat milling activities are primarily in Mexico and Brazil. CornVIE that most significantly impact the VIE’s business andand rice milling activities are in the United States and Mexico.(b) the obligation to absorb losses of or the right to receivebenefits from the VIE that could potentially be significant to theSugar and Bioenergy – Bunge’s Sugar and Bioenergy segmentVIE’s operations. Performance of that analysis requires theincludes its global sugar merchandising and distributionexercise of judgment.activities, sugar and ethanol production in Brazil, and ethanol
production investments. This segment is an integrated businessNoncontrolling interests in subsidiaries related to Bunge’sinvolved in the growing and harvesting of sugarcane from landownership interests of less than 100% are reported asowned or managed through agricultural partnershipnoncontrolling interests in the consolidated balance sheets. Theagreements and additional sourcing of sugarcane from thirdnoncontrolling ownership interests in Bunge’s earnings, net ofparties to be processed at its eight mills in Brazil to producetax, is reported as net (income) loss attributable tosugar, ethanol and electricity. The Sugar and Bioenergynoncontrolling interests in the consolidated statements ofsegment is also a merchandiser and distributor of sugar andincome.ethanol within Brazil and a global merchandiser and distributor
F-8 2016 Bunge Annual Report
BUNGE LIMITED AND SUBSIDIARIESNOTES TO THE CONSOLIDATED FINANCIAL STATEMENTS

F-9
amount below the outstanding historical balance or when1. NATURE OF BUSINESS, BASIS OF PRESENTATION, ANDBunge has determined that collection is unlikely.SIGNIFICANT ACCOUNTING POLICIES (Continued)Secured advances to suppliers bear interest at contractualReclassifications – Certain prior year amounts have beenrates which reflect current market interest rates at the time ofreclassified to conform to current year presentation.the transaction. There are no deferred fees or costs associatedwith these receivables. As a result, there are no imputedUse of Estimates – The preparation of consolidated financialinterest amounts to be amortized under the interest method.statements in conformity with U.S. GAAP requires theInterest income is calculated based on the terms of theapplication of accounting policies that often requireindividual agreements and is recognized on an accrual basis.management to make substantial judgment or estimation in
their application. These judgments and estimations mayBunge follows accounting guidance on the disclosure of thesignificantly affect reported amounts of assets and liabilitiescredit quality of financing receivables and the allowance forand disclosure of contingent assets and liabilities at the date ofcredit losses, which requires information to be disclosed atthe financial statements. They may also affect reporteddisaggregated levels, defined as portfolio segments andamounts of revenues and expenses. Actual results could differclasses.from those estimates.
Under this guidance, a class of receivables is consideredTranslation of Foreign Currency Financialimpaired, based on current information and events, if BungeStatements – Bunge’s reporting currency is the U.S. dollar.determines it probable that all amounts due under the originalThe functional currency of the majority of Bunge’s foreignterms of the receivable will not be collected. Recognition ofsubsidiaries is their local currency and, as such, amountsinterest income is suspended once the farmer defaults on theincluded in the consolidated statements of income,originally scheduled delivery of agricultural commodities as thecomprehensive income (loss), cash flows and changes incollection of future income is determined not to be probable.equity are translated using average exchange rates during eachNo additional interest income is accrued from the point ofperiod. Assets and liabilities are translated at period-enddefault until ultimate recovery, at which time amounts collectedexchange rates and resulting foreign exchange translationare credited first against the receivable and then to anyadjustments are recorded in the consolidated balance sheetsunrecognized interest income.as a component of accumulated other comprehensive income
(loss).Inventories – Readily marketable inventories (‘‘RMI’’) areagricultural commodity inventories, such as soybeans, soybeanForeign Currency Transactions – Monetary assets andmeal, soybean oil, corn and wheat that are readily convertibleliabilities denominated in currencies other than the functionalto cash because of their commodity characteristics, widelycurrency are remeasured into their respective functionalavailable markets and international pricing mechanisms. All ofcurrencies at exchange rates in effect at the balance sheetBunge’s RMI are valued at fair value. These agriculturaldate. The resulting exchange gain or loss is included incommodity inventories have quoted market prices in activeBunge’s consolidated statements of income as foreignmarkets, may be sold without significant further processingexchange gain (loss) unless the remeasurement gain or lossand have predictable and insignificant disposal costs. Changesrelates to an intercompany transaction that is of a long-termin the fair values of merchandisable agricultural commoditiesinvestment nature and for which settlement is not planned orinventories are recognized in earnings as a component of costanticipated in the foreseeable future. Gains or losses arisingof goods sold.from translation of such transactions are reported as a
component of accumulated other comprehensive income (loss)Inventories other than RMI are stated at the lower of cost orin Bunge’s consolidated balance sheets.market by inventory product class. Cost is determined usingprimarily the weighted-average cost method.Cash and Cash Equivalents – Cash and cash equivalents
include time deposits and readily marketable securities withDerivative Instruments and Hedging Activities – Bungeoriginal maturity dates of three months or less at the time ofenters into derivative instruments to manage its exposure toacquisition.movements associated with agricultural commodity prices,transportation costs, foreign currency exchange rates, interestTrade Accounts Receivable and Secured Advances torates and energy costs. Bunge’s use of these instruments isSuppliers – Trade accounts receivable and secured advancesgenerally intended to mitigate the exposure to market variablesto suppliers are stated at their historical carrying amounts net(see Note 14).of write-offs and allowances for uncollectible accounts. Bunge
establishes an allowance for uncollectible trade accountsGenerally, derivative instruments are recorded at fair value inreceivable and secured advances to farmers based on historicalother current assets or other current liabilities in Bunge’sexperience, farming economics and other market conditions asconsolidated balance sheets. Bunge assesses, both at thewell as specific customer collection issues. Uncollectibleinception of a hedge and on an ongoing basis, whether anyaccounts are written off when a settlement is reached for an
2016 Bunge Annual Report F-9
BUNGE LIMITED AND SUBSIDIARIESNOTES TO THE CONSOLIDATED FINANCIAL STATEMENTS

F-10
capacity or efficiency or improve the safety of an asset are1. NATURE OF BUSINESS, BASIS OF PRESENTATION, ANDcapitalized, while maintenance and repairs are expensed asSIGNIFICANT ACCOUNTING POLICIES (Continued)incurred. Costs related to legal obligations associated with thefuture retirement of capitalized assets are capitalized as part ofderivatives designated as hedges are highly effective inthe cost of the related asset. Bunge generally capitalizesoffsetting changes in the hedged items. The effective andeligible costs to acquire or develop internal-use software thatineffective portions of changes in fair values of derivativeare incurred during the application development stage. Interestinstruments designated as fair value hedges, along with thecosts on borrowings during construction/completion periods ofgains or losses on the related hedged items are recorded inmajor capital projects are also capitalized.earnings in the consolidated statements of income in the same
caption as the hedged items. The effective portion of changesIncluded in property, plant and equipment are biological assets,in fair values of derivative instruments that are designated asprimarily sugarcane, that are stated at cost less accumulatedcash flow hedges are recorded in accumulated otherdepletion. Depletion is calculated using the estimated units ofcomprehensive income (loss) and are reclassified to earningsproduction based on the remaining useful life of the growingwhen the hedged cash flows affect earnings or when thesugarcane. Depreciation is computed based on the straight-linehedge is no longer considered to be effective. The ineffectivemethod over the estimated useful lives of the assets.portion of cash flow hedges is recorded in earnings. In
addition, Bunge may designate certain derivative instruments Useful lives for property, plant and equipment are as follows:as net investment hedges to hedge the exposure associatedwith its equity investments in foreign operations. The effective
YEARSportions of changes in the fair values of net investmenthedges, which are evaluated based on forward rates, are Biological assets 5 – 7recorded as a component of accumulated other comprehensive Buildings 10 – 50income (loss) in the consolidated balance sheets and the Machinery and equipment 7 – 25ineffective portions of such derivative instruments are recorded Furniture, fixtures and other 3 – 20in foreign exchange gains (losses) in the consolidated Computer software 3 – 10statements of income.
Goodwill – Goodwill represents the cost in excess of the fairMarketable Securities and Other Short-Term value of net assets acquired in a business acquisition. GoodwillInvestments – Bunge classifies its marketable securities and is not amortized but is tested annually for impairment orshort-term investments as held-to-maturity and trading. between annual tests if events or circumstances indicateAvailable-for sale securities are reported at fair value with potential impairment. Bunge’s annual impairment testing isunrealized gains (losses) included in accumulated other generally performed during the fourth quarter of its fiscal year.comprehensive income (loss). Held-to-maturity securities andinvestments represent financial assets in which Bunge has the Goodwill is tested for impairment at the reporting unit level,intent and ability to hold to maturity. Trading securities are which has been determined to be the Company’s operatingbought and held principally for the purpose of selling them in segments or one level below the operating segments in certainthe near term and therefore held for only a short period of instances (see Note 7).time. Bunge values its marketable securities at fair value and
Impairment of Property, Plant and Equipment and Finitemonitors its held-to-maturity investments for impairmentLived Intangible Assets – Finite lived intangible assetsperiodically, and recognizes an impairment charge when theinclude primarily trademarks, customer lists and port facilitydecline in fair value of an investment is judged to be otherusage rights and are amortized on a straight-line basis overthan temporary.their contractual or legal lives (see Note 8) or their estimated
Recoverable Taxes – Recoverable taxes include value-added useful lives where such lives are not determined by law ortaxes paid upon the acquisition of raw materials and taxable contract.services and other transactional taxes, which can be recovered
Bunge reviews its property, plant and equipment and finite-in cash or as compensation against income taxes or otherlived intangible assets for impairment whenever events ortaxes owed by Bunge, primarily in Brazil and Europe. Thesechanges in circumstances indicate that carrying amounts mayrecoverable tax payments are included in other current assetsnot be recoverable. Bunge bases its evaluation of recoverabilityor other non-current assets based on their expected realization.on such indicators as the nature, future economic benefits andIn cases where Bunge determines that recovery is doubtful,geographic locations of the assets, historical or futurerecoverable taxes are reduced by allowances for the estimatedprofitability measures and other external market conditions. Ifunrecoverable amounts.these indicators result in the expected non-recoverability of the
Property, Plant and Equipment, Net – Property, plant and carrying amount of an asset or asset group, Bunge evaluatesequipment, net is stated at cost less accumulated depreciation potential impairment using undiscounted estimated future cashand depletion. Major improvements that extend the life, flows. If such undiscounted future cash flows during the
F-10 2016 Bunge Annual Report
BUNGE LIMITED AND SUBSIDIARIESNOTES TO THE CONSOLIDATED FINANCIAL STATEMENTS

F-11
Bunge operates. Investment tax credits are recorded in income1. NATURE OF BUSINESS, BASIS OF PRESENTATION, ANDtax expense in the period in which such credits are granted.SIGNIFICANT ACCOUNTING POLICIES (Continued)Revenue Recognition – Sales of agricultural commodities,
asset’s remaining useful life are below its carrying value, a loss fertilizers and other products are recognized when persuasiveis recognized for the shortfall, measured by the present value evidence of an arrangement exists, the price is determinable,of the estimated future cash flows or by third-party appraisals. the product has been delivered, title to the product and risk ofBunge records impairments related to property, plant and loss transfer to the customer, which is dependent on theequipment and finite-lived intangible assets used in the agreed upon sales terms with the customer and whenprocessing of its products in cost of goods sold in its collection of the sale price is reasonably assured. Sales termsconsolidated statements of income. Any impairment of provide for passage of title either at the time and point ofmarketing or brand assets is recognized in selling, general and shipment or at the time and point of delivery of the productadministrative expenses in the consolidated statements of being sold. Net sales consist of gross sales less discountsincome (see Note 9). related to promotional programs and sales taxes. Interest
income on secured advances to suppliers is included in netProperty, plant and equipment and other finite-lived intangiblesales due to its operational nature (see Note 5). Shipping andassets to be sold or otherwise disposed of are reported at thehandling charges billed to customers are included in net saleslower of carrying amount or fair value less cost to sell.and related costs are included in cost of goods sold.
Impairment of Investments in Affiliates – Bunge reviews itsResearch and Development – Research and developmentinvestments annually or when an event or circumstancescosts are expensed as incurred. Research and developmentindicate that a potential decline in value may be other thanexpenses were $17 million, $16 million and $20 million for thetemporary. Bunge considers various factors in determiningyears ended December 31, 2016, 2015 and 2014, respectively.whether to recognize an impairment charge, including the
length of time that the fair value of the investment is expected New Accounting Pronouncements – In November 2016, theto be below its carrying value, the financial condition, operating Financial Accounting Standards Board (‘‘FASB’’) issuedperformance and near-term prospects of the affiliate and Accounting Standards Update (‘‘ASU’’) 2016-18, Statement ofBunge’s intent and ability to hold the investment for a period Cash Flows (Topic 230), Restricted Cash (a consensus of theof time sufficient to allow for recovery of the fair value. Emerging Issues Task Force). Similar to ASU 2016-15 asImpairment charges for investments in affiliates are included described below, this update attempts to reduce diversity inwithin selling, general and administrative expenses (see Note 9 practice and provides guidance on the presentation ofand 10). restricted cash or restricted cash equivalents in the statement
of cash flows. The guidance will be effective for fiscal yearsShare-Based Compensation – Bunge maintains equitybeginning after December 15, 2017, including interim periodsincentive plans for its employees and non-employee directorswithin those fiscal years. Early adoption is permitted. Bunge is(see Note 24). Bunge accounts for share-based compensationevaluating the impact of this guidance on its consolidatedbased on the grant date fair value. Share-based compensationfinancial statements.expense is recognized on a straight-line basis over the
requisite service period. In October 2016, the FASB issued ASU 2016-17, Consolidation(Topic 810), Interests Held through Related Parties That AreIncome Taxes – Income tax expenses and benefits areunder Common Control, which provides that a single decisionrecognized based on the tax laws and regulations in themaker is not required to consider indirect interests heldjurisdictions in which Bunge’s subsidiaries operate. Underthrough related parties that are under common control with theBermuda law, Bunge is not required to pay taxes in Bermudadecision maker to be equivalents of direct interests in theiron either income or capital gains. The provision for incomeentity. The new guidance will be effective for fiscal yearstaxes includes income taxes currently payable and deferredbeginning after December 15, 2016, including interim periodsincome taxes arising as a result of temporary differenceswithin those fiscal years. Early adoption is permitted. Thebetween the carrying amounts of existing assets and liabilitiesadoption of this standard is not expected to have a materialin Bunge’s financial statements and their respective tax bases.impact on Bunge’s consolidated financial statements.Deferred tax assets are reduced by valuation allowances if
current evidence does not suggest that the deferred tax assetIn October 2016, the FASB issued ASU 2016-16, Income Taxeswill be realized. Accrued interest and penalties related to(Topic 740), Intra-Entity Transfers of Assets Other Than Inventory,unrecognized tax benefits are recognized in income taxwhich eliminates an exception in the current guidance(expense) benefit in the consolidated statements of incomeprohibiting a reporting entity to recognize income taxes(see Note 13).consequences of an intra-entity transfer of an asset other thaninventory, such as transfers of intellectual property andThe calculation of tax liabilities involves management’sproperty, plant, and equipment, until the asset has been sold tojudgments concerning uncertainties in the application ofan outside party. The new guidance does not include newcomplex tax regulations in the many jurisdictions in which
2016 Bunge Annual Report F-11
BUNGE LIMITED AND SUBSIDIARIESNOTES TO THE CONSOLIDATED FINANCIAL STATEMENTS

F-12
obligation to make payments with the exception of those1. NATURE OF BUSINESS, BASIS OF PRESENTATION, ANDleases with a term of 12 months or less. The new provisionsSIGNIFICANT ACCOUNTING POLICIES (Continued)will be effective for fiscal years beginning after December 15,2018, including interim periods within those fiscal years. Earlydisclosure requirements; however, existing disclosureadoption is permitted. Bunge is evaluating the expected impactrequirements might be applicable when accounting for theof this standard on its consolidated financial statements.current and deferred income taxes for an intra-entity transfer.
ASU 2016-16 will be effective for fiscal years beginning afterIn January 2016, the FASB issued ASU 2016-01, FinancialDecember 15, 2017, including interim periods within thoseInstruments – Overall (Subtopic 825-10): Recognition andfiscal years. Early adoption is permitted. Bunge is evaluatingMeasurement of Financial Assets and Financial Liabilities, whichthe impact of this standard on its consolidated financialamends the guidance relating to the classification andstatements.measurement of financial instruments. Changes to the currentguidance primarily affect the accounting for equity investments,In August 2016, the FASB issued ASU 2016-15, Statement offinancial liabilities under the fair value option, and theCash Flows (Topic 230), Classification of Certain Cash Receiptspresentation and disclosure requirements for financialand Cash Payments (a consensus of the Emerging Issues Taskinstruments. The new standard is effective for fiscal years,Force). This update attempts to reduce diversity in practice byincluding interim periods within those fiscal years, beginningproviding guidance on the classification of certain cashafter December 15, 2017. Early adoption is not permitted exceptreceipts and payments in the statement of cash flows. The newfor certain provisions. Bunge is evaluating the expected impactstandard is effective for Bunge for fiscal years beginning afterof this standard on its consolidated financial statements.December 15, 2017, including interim periods within those
fiscal years. Early adoption is permitted. Bunge is evaluatingIn May 2014, the FASB amended ASC (Topic 605) Revenuethe impact of this standard on its consolidated financialRecognition and created ASC (Topic 606) Revenue fromstatements.Contracts with Customers. The core principle of the guidance isthat an entity should recognize revenue to depict the transferIn June 2016, the FASB issued ASU 2016-13, Financialof promised goods or services to customers in an amount thatInstruments – Credit Losses (Topic 326), which introduces areflects the consideration to which the entity expects to benew accounting model, referred to as the current expectedentitled in exchange for those goods or services. The initialcredit losses (CECL) model, for estimating credit losses oneffective date is for interim and annual periods beginning on orcertain financial instruments and expands the disclosureafter December 15, 2016. However, in August 2015, the FASBrequirements for estimating such credit losses. Under the newissued an amendment effectively deferring the implementationmodel, an entity is required to estimate the credit lossesdate for all entities by one year but also permitting companiesexpected over the life of an exposure (or pool of exposures).to early adopt the guidance as of the original effective date,The guidance also amends the current impairment model forbut not before January 1, 2017. During 2016, the FASB issueddebt securities classified as available-for-sale securities. Theadditional implementation guidance and practical expedients innew guidance will be effective for fiscal years beginning afterASU 2016-08 Revenue from Contracts with Customers (TopicDecember 15, 2019, including interim periods within those606), Principal versus Agent Considerations (Reporting Revenuefiscal years. Early adoption is permitted. Bunge is evaluatingGross versus Net), ASU 2016-10 Revenue from Contracts withthe impact of this standard on its consolidated financialCustomers (Topic 606), Identifying Performance Obligations andstatements.Licensing, ASU 2016-12 Revenue from Contracts with Customers(Topic 606), Narrow-Scope Improvements and PracticalIn March 2016, the FASB issued ASU 2016-09, Compensation –Expedients, and ASU 2016-20 Technical Corrections andStock Compensation (Topic 718), Improvements to EmployeeImprovements to Topic 606, Revenue from Contracts withShare-Based Payment Accounting. This update identifies areasCustomers, to improve the guidance. The new requirementsfor simplification involving several aspects of accounting formay be implemented either retrospectively for all prior periodsshare-based payment transactions, including the income taxpresented (i.e., the full retrospective approach), orconsequences, classification of awards as either equity orretrospectively with a cumulative-effect adjustment at the dateliabilities, an option to recognize gross stock compensationof initial application (i.e., the modified retrospective approach).expense with actual forfeitures recognized as they occur, asThe Company expects to adopt the standard under thewell as certain classifications on the statement of cash flows.modified retrospective approach upon its effective date with aThe new standard is effective for fiscal years, and interimcumulative-effect adjustment to opening retained earnings. Theperiods within those fiscal years, beginning after December 15,Company has substantially completed its adoption assessment2016. The adoption of this standard is not expected to have aand does not expect a material measurement impact on thematerial impact on Bunge’s consolidated financial statements.Company’s results of operations, financial position or cash
In February 2016, the FASB issued ASU 2016-02, Leases (Topic flows. The adoption of the new guidance will require expanded842). Under the new provisions, all lessees will report on the disclosure which the Company is still evaluating.balance sheet a right-of-use asset and a liability for the
F-12 2016 Bunge Annual Report
BUNGE LIMITED AND SUBSIDIARIESNOTES TO THE CONSOLIDATED FINANCIAL STATEMENTS

F-13
1. NATURE OF BUSINESS, BASIS OF PRESENTATION, AND 2. BUSINESS ACQUISITIONS AND DISPOSTIONSSIGNIFICANT ACCOUNTING POLICIES (Continued)
Acquisitions
Recently Adopted Accounting Pronouncements – InOn October 4, 2016, Bunge acquired a 62.8% equity stake inNovember 2015, the FASB issued ASU 2015-17, Income TaxesWalter Rau Neusser Ol und Fett Aktiengesellschaft (‘‘Walter(Topic 740), Balance Sheet Classification of Deferred Taxes. TheRau Neusser’’), a vegetable oil blends producer for large-scaleamendments in this update require that deferred tax liabilitiescommercial customers based in Germany. Bunge paidand assets be classified as noncurrent in a classified balanceapproximately $33 million for its controlling interest in Waltersheet. The update is effective for fiscal years beginning afterRau Neusser and has been consolidated in Bunge’s financialDecember 15, 2016 on a prospective or retrospective basis,statements.with earlier application permitted. Bunge early adopted this
ASU on a prospective basis effective April 1, 2016 and the On August 30, 2016, Bunge announced it had reached anadoption did not have a material impact on Bunge’s agreement to acquire a controlling interest in Grupoconsolidated financial statements. Minsa S.A.B. de C.V. (‘‘Minsa’’), a leading corn flour producer
in North America. The transaction is expected to close in theIn April 2015, the FASB issued ASU 2015-03, Interest—first half of 2017, subject to certain closing conditions,Imputation of Interest (Subtopic 835-30), Simplifying theincluding the resolution of pending litigation brought by aPresentation of Debt Issuance Costs. The amendments in thisformer shareholder of the parent company of Minsaupdate require debt issuance costs related to a recognizedchallenging the proposed acquisition. As part of thedebt liability to be presented in the balance sheet as a directtransaction, Bunge will acquire control of four mills in Mexicodeduction from the carrying amount of the related debt liability,and two mills in the United States. The purchase price isconsistent with debt discounts, instead of being presented asexpected to be approximately $311 million, subject to workingan asset. Bunge adopted this ASU upon its effective date ofcapital and other adjustments.January 1, 2016 and the adoption did not have a material
impact on Bunge’s consolidated financial statements. On February 28, 2017, Bunge and Cargill, Inc. closed on theacquisition of two oilseed processing plants and operations inIn February 2015, the FASB issued ASU 2015-02, Consolidationthe Netherlands and France pursuant to an agreement on(Topic 810), Amendments to the Consolidation Analysis. TheAugust 5, 2016. Bunge paid a total purchase price ofstandard makes targeted amendments to the currentapproximately $225 million, plus working capital and otherconsolidation guidance and ends the deferral granted toadjustments of approximately $120 million. Results ofinvestment companies from applying the VIE guidance andoperations for this acquisition will be included in Bunge’srequires companies to reevaluate all legal entities underconsolidated financial statements from the date of acquisition.revised consolidation guidance. The revised consolidation rules
provide guidance for evaluating: i) limited partnerships and In October 2015, Bunge Alimentos S.A., an indirect whollysimilar entities for consolidation, ii) how decision maker or owned subsidiary of Bunge, closed on the acquisition of 100%service provider fees affect the consolidation analysis, iii) how ownership interest in Moinho Pacifico, a Brazilian wheat millinterests held by related parties affect the consolidation and port terminal in Santos, Brazil. Bunge paid approximatelyanalysis and iv) the consolidation analysis required for certain 1,087 million Brazilian reais (approximately $282 million). Theinvestment funds. The standard was effective for interim and final allocation of the purchase price based on the fair valuesannual reporting periods beginning after December 15, 2015 of assets and liabilities acquired resulted in $98 million inand Bunge adopted ASU 2015-02 upon its effective date of property, plant and equipment, $10 million in inventory,January 1, 2016 using a modified retrospective approach. As a $9 million in other net assets and liabilities and $97 million ofresult of the initial application of ASU 2015-02, Bunge finite-lived intangible assets. The transaction also resulted indeconsolidated a Brazilian grain terminal and the remainder of $68 million of goodwill allocated to Bunge’s milling operationsits previously consolidated private equity and other investment in Brazil.funds. There was no cumulative effect to retained earnings asa result of the deconsolidation of these entities since there was In October 2015, Bunge acquired Whole Harvest Foodsno difference between the net amounts subtracted from (‘‘WHF’’) for $27 million, including $25 million in cash andBunge’s financial statements and the retained interest in those $2 million in a working capital adjustment. The purchase priceentities. allocation resulted in $4 million in property, plant and
equipment, $2 million in inventory and $15 million of intangibleassets. The transaction also resulted in $6 million of goodwillallocated to Bunge’s edible oils operations in the United States.WHF refines expeller pressed soybean, canola, and cottonseedoil to produce extended life oil that is chemical solvent, trans
2016 Bunge Annual Report F-13
BUNGE LIMITED AND SUBSIDIARIESNOTES TO THE CONSOLIDATED FINANCIAL STATEMENTS

F-14
die cut pellets made of a variety of starches which are then2. BUSINESS ACQUISITIONS AND DISPOSTIONSexpanded through popping, baking or frying in the production(Continued)of certain lower fat snacks. HHI consists of one facility in thestate of Illinois, United States.fat and cholesterol free. WHF has operations in North Carolina
and a packaging/distribution center in Nevada within theUnited States. Dispositions
In June 2015, Bunge entered into a transaction to acquire the On November 30, 2016, Bunge closed on the disposition of a80% majority interest in a biodiesel entity operating a plant in 50% ownership interest in its Terfron port terminal TerminalSpain where Bunge had, prior to this transaction, a 20% Fronteira Norte Logistica S.A. (‘‘TFN’’) in Brazil to Amaggiinterest accounted for under the equity method in its Exportacao E Importacao Ltda. for a total consideration in cashAgribusiness segment. The purchase price of the majority of approximately $145 million, which resulted in a gain ofinterest was $7 million, net of cash acquired including existing $90 million. As a result of this transaction Bunge will accountloans and other receivables totaling $3 million owed to Bunge for the TFN joint venture as an equity method investment.by the entity were extinguished as part of the transaction. The
On November 30, 2016, Bunge and Wilmar Internationalpreliminary purchase price of $7 million was allocated primarilyLimited (‘‘Wilmar’’) completed the formation of a joint ventureto property, plant and equipment and $2 million to goodwill.in Vietnam in which Wilmar will invest into Bunge’s crush
In April 2015, Bunge and Saudi Agricultural and Livestock operations in Vietnam, creating a three-party joint venture withInvestment Company (‘‘SALIC’’), formed a Canadian entity, G3. Bunge and Wilmar as equal 45% shareholders and QuangBunge had a 51% ownership interest in G3. Bunge accounts Dung, a leading soybean meal distributor in Vietnam, retainingfor G3 under the equity method of accounting as the its existing 10% stake in the operations. Bunge receivedownership interest does not provide Bunge with a controlling $33 million cash in consideration for its 45% share of interestfinancial interest due to certain contractual restrictions. In July in Bunge’s crush operations. This transaction resulted in a gain2015, G3 closed on the acquisition of an approximate 61% of $30 million. As a result of this transaction Bunge willownership interest in G3 Canada Limited, formerly the account for the joint venture as an equity method investment.Canadian Wheat Board (‘‘CWB’’) for $368 million Canadian
On February 1, 2016, SALIC Canada Limited (‘‘SALIC Canada’’)dollars (approximately $266 million, as of December 31, 2015).converted two non-interest bearing convertible promissoryThe remaining interest was acquired by the CWB Farmersnotes issued to SALIC by G3 of $106 million into 148,323,000Equity Trust. In order to fund the acquisition amount and futurecommon shares of G3, increasing SALIC Canada’s ownershipcash flow requirements, Bunge contributed capital to G3 ofpercentage in G3 from 49% to 65% and reducing Bunge$130 million and SALIC contributed capital in the amount ofCanada’s ownership in G3 from 51% to 35%. On the same day,$126 million and $115 million in the form of convertible debt.Bunge Canada and SALIC Canada transferred all of theirSimultaneously, the CWB acquired certain assets of Bunge’scommon shares of G3 to G3 Global Holdings Limitedgrain business in Canada for $88 million, which includesPartnership in exchange for additional Class A limitedBunge’s export facility and grain elevators in Quebec forpartnership units in G3 Global Holdings Limited Partnership. As$54 million plus certain working capital of $34 million. Thea result, as of February 1, 2016, G3 Global Holdings Limitedconsolidated statement of income for the year endedPartnership became the holder of all of the issued andDecember 31, 2015 includes a pre-tax gain of $47 million onoutstanding common shares in G3. On March 30, 2016, Bungethe sale of the grain assets in Canada. In February 2016, SALICCanada, under the G3 Global Holdings Shareholderscompleted the conversion of debt to equity under theAgreement, exercised a contractual put right and sold 10% ofpromissory notes granted in favor of G3, thus reducing Bunge’sits common shares to SALIC Canada in exchange forownership interest from 51% to 35%. Additionally, Bunge has$37 million of cash so that Bunge Canada now holds 25%exercised its right under a put option and sold an additionalownership of G3 Global Holdings Limited Partnership and10% ownership interest in G3 to SALIC for cash, which furtherSALIC Canada holds 75% ownership.reduced Bunge’s ownership interest to 25%.
In March 2015, Bunge acquired the assets of Heartland 3. TRADE STRUCTURED FINANCE PROGRAMHarvest, Inc. (‘‘HHI’’) for $47 million, including $40 million incash and cash settlement of an existing third-party loan to HHI Bunge engages in various trade structured finance activities toof $7 million. The purchase price allocation resulted in leverage the value of its trade flows across its operating$18 million in property, plant and equipment, $2 million in regions. For the years ended December 31, 2016 and 2015, netinventory and $18 million of finite-lived intangible assets. The return from these activities, were $57 million and $66 million,transaction also resulted in $9 million of goodwill allocated to respectively, and were included as a reduction of cost of goodsBunge’s milling operations in the United State. HHI produces sold in the accompanying consolidated statements of income.
F-14 2016 Bunge Annual Report
BUNGE LIMITED AND SUBSIDIARIESNOTES TO THE CONSOLIDATED FINANCIAL STATEMENTS

F-15
the programs are included in operating activities in the3. TRADE STRUCTURED FINANCE PROGRAM (Continued)consolidated statements of cash flows.
These activities include programs under which Bunge generallyobtains U.S. dollar-denominated letters of credit (‘‘LCs’’) (each 4. INVENTORIESbased on an underlying commodity trade flow) from financialinstitutions and time deposits denominated in either the local
Inventories by segment are presented below. RMI arecurrency of the financial institutions counterparties or in U.S.agricultural commodity inventories, such as soybeans, soybeandollars, as well as foreign exchange forward contracts, all ofmeal, soybean oil, corn and wheat, carried at fair valuewhich are subject to legally enforceable set-off agreements.because of their commodity characteristics, widely availableThe LCs and foreign exchange contracts are presented withinmarkets and international pricing mechanisms. All otherthe line item letter of credit obligations under trade structuredinventories are carried at lower of cost or market.finance program on the consolidated balance sheets as of
December 31, 2016 and December 31, 2015.DECEMBER 31,
(US$ in millions) 2016 2015The table below summarizes the assets and liabilities includedin the condensed consolidated balance sheets and the Agribusiness(1) $3,741 $3,533associated fair value amounts at December 31, 2016 and Edible Oil Products(2) 404 356December 31, 2015, related to the program. The fair values Milling Products 167 164approximated the carrying amount of the related financial Sugar and Bioenergy(3) 406 350instruments. Fertilizer 55 63
Total $4,773 $4,466DECEMBER 31,(US$ in millions) 2016 2015
(1) Includes RMI of $3,593 million and $3,393 million at December 31, 2016 and 2015,respectively. Of these amounts $2,523 million and $2,513 million can be attributable toCurrent assets:merchandising activities at December 31, 2016 and 2015, respectively.Carrying value of time deposits $ 64 $325
(2) Includes RMI of bulk soybean and canola oil in the aggregate amount of $123 millionFair value (Level 2 measurement) of time deposits $ 64 $325and $110 million at December 31, 2016 and 2015, respectively.
Non-current assets:(3) Includes sugar RMI, which can be attributable to Bunge’s trading and merchandising
Carrying value of time deposits $464 $ - business of $139 million and $163 million at December 31, 2016 and 2015, respectively.
Fair value (Level 2 measurement) of time deposits $464 $ -5. OTHER CURRENT ASSETSCurrent liabilities:
Carrying value of letters of credit obligations and foreignOther current assets consist of the following:exchange contracts $528 $325
Fair value (Level 2 measurement) of letters of credit DECEMBER 31,obligations $528 $323 (US$ in millions) 2016 2015
Fair value (Level 2 measurement) of foreign exchangeUnrealized gains on derivative contracts, at fair value $1,327 $1,456forward contracts-(gains) losses - 2Prepaid commodity purchase contracts(1) 273 287
Total fair value (Level 2 measurement) of letters of Secured advances to suppliers, net(2) 601 521credit obligations and foreign exchange contracts $528 $325 Recoverable taxes, net 467 364
Margin deposits 251 467As of December 31, 2016 and 2015, time deposits, LCs, and Marketable securities, at fair value and otherforeign exchange contracts of $5,732 million and $3,394 million, short-term investments 94 234respectively, were presented net on the consolidated balance Deferred purchase price receivable, at fair value(3) 87 79sheets as the criteria of ASC 210-20, Offsetting, had been met. Prepaid expenses 148 132At December 31, 2016 and 2015, time deposits, including those Other 397 359presented on a net basis, carried weighted-average interest Total $3,645 $3,899rates of 2.36% and 2.21%, respectively. During the years endedDecember 31, 2016, 2015 and 2014, total net proceeds from
(1) Prepaid commodity purchase contracts represent advance payments against contractsissuances of LCs were $7,191 million, $5,563 million and for future delivery of specified quantities of agricultural commodities.$7,058 million, respectively. These cash inflows are offset by the
(2) Bunge provides cash advances to suppliers, primarily Brazilian farmers of soybeansrelated cash outflows resulting from placement of the timeand sugarcane, to finance a portion of the suppliers’ production costs. Bunge does notdeposits and repayment of the LCs. All cash flows related tobear any of the costs or operational risks associated with the related growing crops. The
2016 Bunge Annual Report F-15
BUNGE LIMITED AND SUBSIDIARIESNOTES TO THE CONSOLIDATED FINANCIAL STATEMENTS
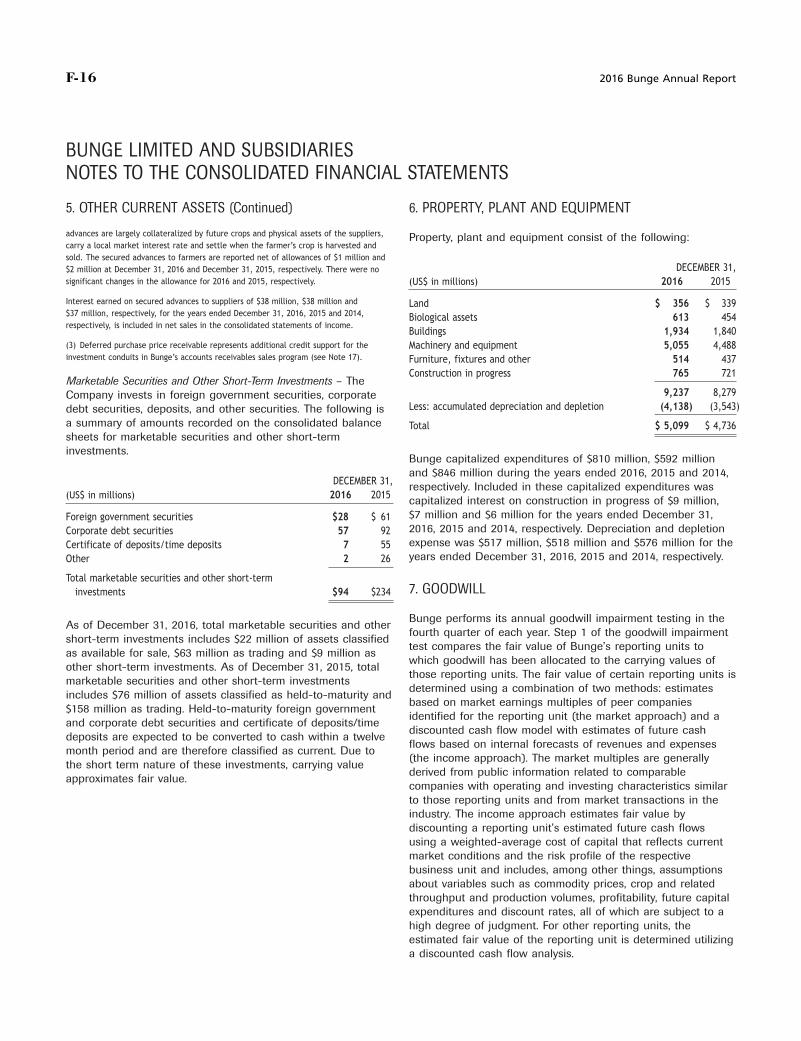
F-16
5. OTHER CURRENT ASSETS (Continued) 6. PROPERTY, PLANT AND EQUIPMENT
advances are largely collateralized by future crops and physical assets of the suppliers, Property, plant and equipment consist of the following:carry a local market interest rate and settle when the farmer’s crop is harvested andsold. The secured advances to farmers are reported net of allowances of $1 million and
DECEMBER 31,$2 million at December 31, 2016 and December 31, 2015, respectively. There were nosignificant changes in the allowance for 2016 and 2015, respectively. (US$ in millions) 2016 2015
Interest earned on secured advances to suppliers of $38 million, $38 million and Land $ 356 $ 339$37 million, respectively, for the years ended December 31, 2016, 2015 and 2014, Biological assets 613 454respectively, is included in net sales in the consolidated statements of income.
Buildings 1,934 1,840(3) Deferred purchase price receivable represents additional credit support for the Machinery and equipment 5,055 4,488investment conduits in Bunge’s accounts receivables sales program (see Note 17). Furniture, fixtures and other 514 437
Construction in progress 765 721Marketable Securities and Other Short-Term Investments – The
9,237 8,279Company invests in foreign government securities, corporateLess: accumulated depreciation and depletion (4,138) (3,543)debt securities, deposits, and other securities. The following is
a summary of amounts recorded on the consolidated balance Total $ 5,099 $ 4,736sheets for marketable securities and other short-terminvestments.
Bunge capitalized expenditures of $810 million, $592 millionand $846 million during the years ended 2016, 2015 and 2014,
DECEMBER 31, respectively. Included in these capitalized expenditures was(US$ in millions) 2016 2015 capitalized interest on construction in progress of $9 million,
$7 million and $6 million for the years ended December 31,Foreign government securities $28 $ 612016, 2015 and 2014, respectively. Depreciation and depletionCorporate debt securities 57 92expense was $517 million, $518 million and $576 million for theCertificate of deposits/time deposits 7 55years ended December 31, 2016, 2015 and 2014, respectively.Other 2 26
Total marketable securities and other short-term7. GOODWILLinvestments $94 $234
Bunge performs its annual goodwill impairment testing in theAs of December 31, 2016, total marketable securities and otherfourth quarter of each year. Step 1 of the goodwill impairmentshort-term investments includes $22 million of assets classifiedtest compares the fair value of Bunge’s reporting units toas available for sale, $63 million as trading and $9 million aswhich goodwill has been allocated to the carrying values ofother short-term investments. As of December 31, 2015, totalthose reporting units. The fair value of certain reporting units ismarketable securities and other short-term investmentsdetermined using a combination of two methods: estimatesincludes $76 million of assets classified as held-to-maturity andbased on market earnings multiples of peer companies$158 million as trading. Held-to-maturity foreign governmentidentified for the reporting unit (the market approach) and aand corporate debt securities and certificate of deposits/timediscounted cash flow model with estimates of future cashdeposits are expected to be converted to cash within a twelveflows based on internal forecasts of revenues and expensesmonth period and are therefore classified as current. Due to(the income approach). The market multiples are generallythe short term nature of these investments, carrying valuederived from public information related to comparableapproximates fair value.companies with operating and investing characteristics similarto those reporting units and from market transactions in theindustry. The income approach estimates fair value bydiscounting a reporting unit’s estimated future cash flowsusing a weighted-average cost of capital that reflects currentmarket conditions and the risk profile of the respectivebusiness unit and includes, among other things, assumptionsabout variables such as commodity prices, crop and relatedthroughput and production volumes, profitability, future capitalexpenditures and discount rates, all of which are subject to ahigh degree of judgment. For other reporting units, theestimated fair value of the reporting unit is determined utilizinga discounted cash flow analysis.
F-16 2016 Bunge Annual Report
BUNGE LIMITED AND SUBSIDIARIESNOTES TO THE CONSOLIDATED FINANCIAL STATEMENTS
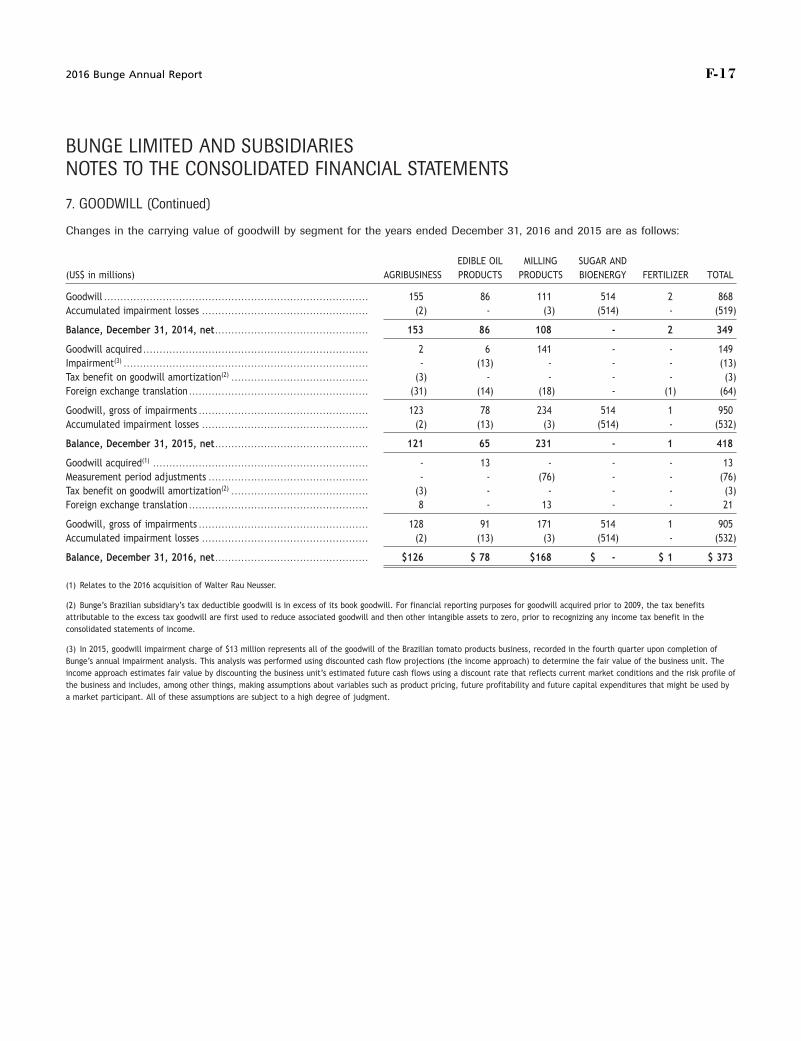
F-17
7. GOODWILL (Continued)
Changes in the carrying value of goodwill by segment for the years ended December 31, 2016 and 2015 are as follows:
EDIBLE OIL MILLING SUGAR AND(US$ in millions) AGRIBUSINESS PRODUCTS PRODUCTS BIOENERGY FERTILIZER TOTAL
Goodwill . . . . . . . . . . . . . . . . . . . . . . . . . . . . . . . . . . . . . . . . . . . . . . . . . . . . . . . . . . . . . . . . . . . . . . . . . . . . . . . . . 155 86 111 514 2 868Accumulated impairment losses . . . . . . . . . . . . . . . . . . . . . . . . . . . . . . . . . . . . . . . . . . . . . . . . . . . (2) - (3) (514) - (519)
Balance, December 31, 2014, net . . . . . . . . . . . . . . . . . . . . . . . . . . . . . . . . . . . . . . . . . . . . . . . 153 86 108 - 2 349
Goodwill acquired . . . . . . . . . . . . . . . . . . . . . . . . . . . . . . . . . . . . . . . . . . . . . . . . . . . . . . . . . . . . . . . . . . . . . 2 6 141 - - 149Impairment(3) . . . . . . . . . . . . . . . . . . . . . . . . . . . . . . . . . . . . . . . . . . . . . . . . . . . . . . . . . . . . . . . . . . . . . . . . . . . - (13) - - - (13)Tax benefit on goodwill amortization(2) . . . . . . . . . . . . . . . . . . . . . . . . . . . . . . . . . . . . . . . . . . (3) - - - - (3)Foreign exchange translation . . . . . . . . . . . . . . . . . . . . . . . . . . . . . . . . . . . . . . . . . . . . . . . . . . . . . . . (31) (14) (18) - (1) (64)
Goodwill, gross of impairments . . . . . . . . . . . . . . . . . . . . . . . . . . . . . . . . . . . . . . . . . . . . . . . . . . . . 123 78 234 514 1 950Accumulated impairment losses . . . . . . . . . . . . . . . . . . . . . . . . . . . . . . . . . . . . . . . . . . . . . . . . . . . (2) (13) (3) (514) - (532)
Balance, December 31, 2015, net . . . . . . . . . . . . . . . . . . . . . . . . . . . . . . . . . . . . . . . . . . . . . . . 121 65 231 - 1 418
Goodwill acquired(1) . . . . . . . . . . . . . . . . . . . . . . . . . . . . . . . . . . . . . . . . . . . . . . . . . . . . . . . . . . . . . . . . . . - 13 - - - 13Measurement period adjustments . . . . . . . . . . . . . . . . . . . . . . . . . . . . . . . . . . . . . . . . . . . . . . . . . - - (76) - - (76)Tax benefit on goodwill amortization(2) . . . . . . . . . . . . . . . . . . . . . . . . . . . . . . . . . . . . . . . . . . (3) - - - - (3)Foreign exchange translation . . . . . . . . . . . . . . . . . . . . . . . . . . . . . . . . . . . . . . . . . . . . . . . . . . . . . . . 8 - 13 - - 21
Goodwill, gross of impairments . . . . . . . . . . . . . . . . . . . . . . . . . . . . . . . . . . . . . . . . . . . . . . . . . . . . 128 91 171 514 1 905Accumulated impairment losses . . . . . . . . . . . . . . . . . . . . . . . . . . . . . . . . . . . . . . . . . . . . . . . . . . . (2) (13) (3) (514) - (532)
Balance, December 31, 2016, net . . . . . . . . . . . . . . . . . . . . . . . . . . . . . . . . . . . . . . . . . . . . . . . $126 $ 78 $168 $ - $ 1 $ 373
(1) Relates to the 2016 acquisition of Walter Rau Neusser.
(2) Bunge’s Brazilian subsidiary’s tax deductible goodwill is in excess of its book goodwill. For financial reporting purposes for goodwill acquired prior to 2009, the tax benefitsattributable to the excess tax goodwill are first used to reduce associated goodwill and then other intangible assets to zero, prior to recognizing any income tax benefit in theconsolidated statements of income.
(3) In 2015, goodwill impairment charge of $13 million represents all of the goodwill of the Brazilian tomato products business, recorded in the fourth quarter upon completion ofBunge’s annual impairment analysis. This analysis was performed using discounted cash flow projections (the income approach) to determine the fair value of the business unit. Theincome approach estimates fair value by discounting the business unit’s estimated future cash flows using a discount rate that reflects current market conditions and the risk profile ofthe business and includes, among other things, making assumptions about variables such as product pricing, future profitability and future capital expenditures that might be used bya market participant. All of these assumptions are subject to a high degree of judgment.
2016 Bunge Annual Report F-17
BUNGE LIMITED AND SUBSIDIARIESNOTES TO THE CONSOLIDATED FINANCIAL STATEMENTS
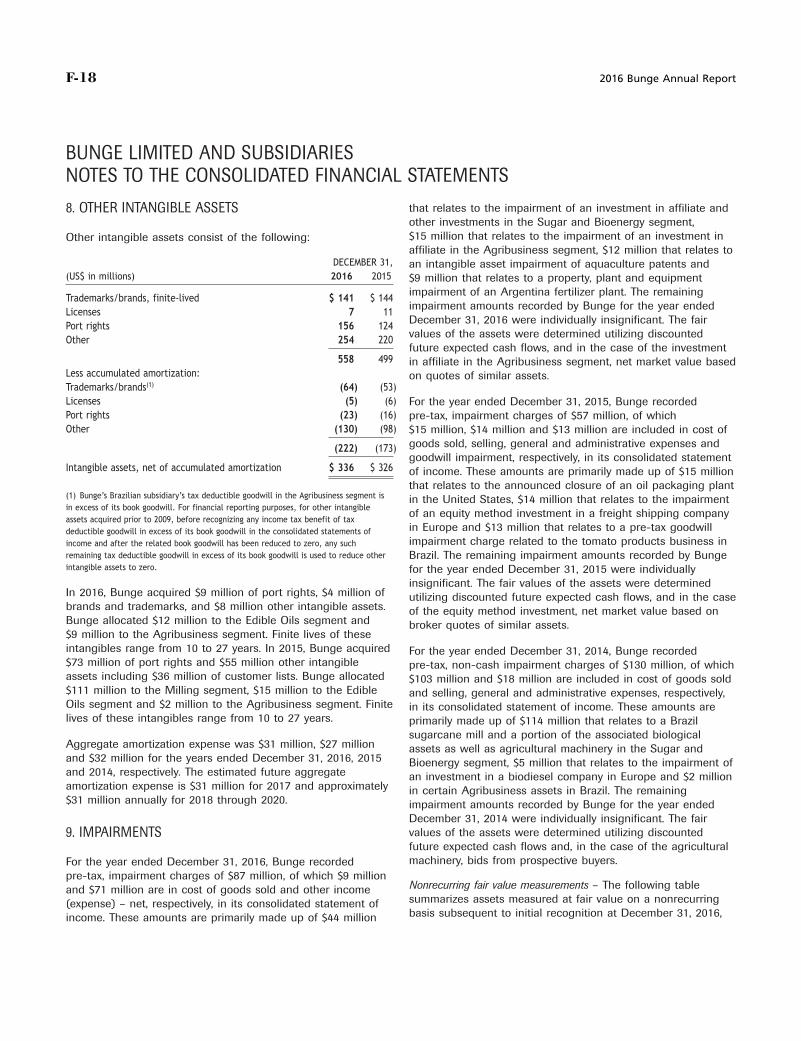
F-18
that relates to the impairment of an investment in affiliate and8. OTHER INTANGIBLE ASSETSother investments in the Sugar and Bioenergy segment,$15 million that relates to the impairment of an investment inOther intangible assets consist of the following:affiliate in the Agribusiness segment, $12 million that relates to
DECEMBER 31, an intangible asset impairment of aquaculture patents and(US$ in millions) 2016 2015 $9 million that relates to a property, plant and equipment
impairment of an Argentina fertilizer plant. The remainingTrademarks/brands, finite-lived $ 141 $ 144impairment amounts recorded by Bunge for the year endedLicenses 7 11December 31, 2016 were individually insignificant. The fairPort rights 156 124values of the assets were determined utilizing discountedOther 254 220future expected cash flows, and in the case of the investment
558 499 in affiliate in the Agribusiness segment, net market value basedLess accumulated amortization: on quotes of similar assets.Trademarks/brands(1) (64) (53)Licenses (5) (6) For the year ended December 31, 2015, Bunge recordedPort rights (23) (16) pre-tax, impairment charges of $57 million, of whichOther (130) (98) $15 million, $14 million and $13 million are included in cost of
goods sold, selling, general and administrative expenses and(222) (173)goodwill impairment, respectively, in its consolidated statement
Intangible assets, net of accumulated amortization $ 336 $ 326 of income. These amounts are primarily made up of $15 millionthat relates to the announced closure of an oil packaging plant
(1) Bunge’s Brazilian subsidiary’s tax deductible goodwill in the Agribusiness segment is in the United States, $14 million that relates to the impairmentin excess of its book goodwill. For financial reporting purposes, for other intangible of an equity method investment in a freight shipping companyassets acquired prior to 2009, before recognizing any income tax benefit of tax
in Europe and $13 million that relates to a pre-tax goodwilldeductible goodwill in excess of its book goodwill in the consolidated statements ofimpairment charge related to the tomato products business inincome and after the related book goodwill has been reduced to zero, any such
remaining tax deductible goodwill in excess of its book goodwill is used to reduce other Brazil. The remaining impairment amounts recorded by Bungeintangible assets to zero. for the year ended December 31, 2015 were individually
insignificant. The fair values of the assets were determinedIn 2016, Bunge acquired $9 million of port rights, $4 million of utilizing discounted future expected cash flows, and in the casebrands and trademarks, and $8 million other intangible assets. of the equity method investment, net market value based onBunge allocated $12 million to the Edible Oils segment and broker quotes of similar assets.$9 million to the Agribusiness segment. Finite lives of theseintangibles range from 10 to 27 years. In 2015, Bunge acquired For the year ended December 31, 2014, Bunge recorded$73 million of port rights and $55 million other intangible pre-tax, non-cash impairment charges of $130 million, of whichassets including $36 million of customer lists. Bunge allocated $103 million and $18 million are included in cost of goods sold$111 million to the Milling segment, $15 million to the Edible and selling, general and administrative expenses, respectively,Oils segment and $2 million to the Agribusiness segment. Finite in its consolidated statement of income. These amounts arelives of these intangibles range from 10 to 27 years. primarily made up of $114 million that relates to a Brazil
sugarcane mill and a portion of the associated biologicalAggregate amortization expense was $31 million, $27 million assets as well as agricultural machinery in the Sugar andand $32 million for the years ended December 31, 2016, 2015 Bioenergy segment, $5 million that relates to the impairment ofand 2014, respectively. The estimated future aggregate an investment in a biodiesel company in Europe and $2 millionamortization expense is $31 million for 2017 and approximately in certain Agribusiness assets in Brazil. The remaining$31 million annually for 2018 through 2020. impairment amounts recorded by Bunge for the year ended
December 31, 2014 were individually insignificant. The fairvalues of the assets were determined utilizing discounted9. IMPAIRMENTSfuture expected cash flows and, in the case of the agriculturalmachinery, bids from prospective buyers.For the year ended December 31, 2016, Bunge recorded
pre-tax, impairment charges of $87 million, of which $9 millionNonrecurring fair value measurements – The following tableand $71 million are in cost of goods sold and other incomesummarizes assets measured at fair value on a nonrecurring(expense) – net, respectively, in its consolidated statement ofbasis subsequent to initial recognition at December 31, 2016,income. These amounts are primarily made up of $44 million
F-18 2016 Bunge Annual Report
BUNGE LIMITED AND SUBSIDIARIESNOTES TO THE CONSOLIDATED FINANCIAL STATEMENTS
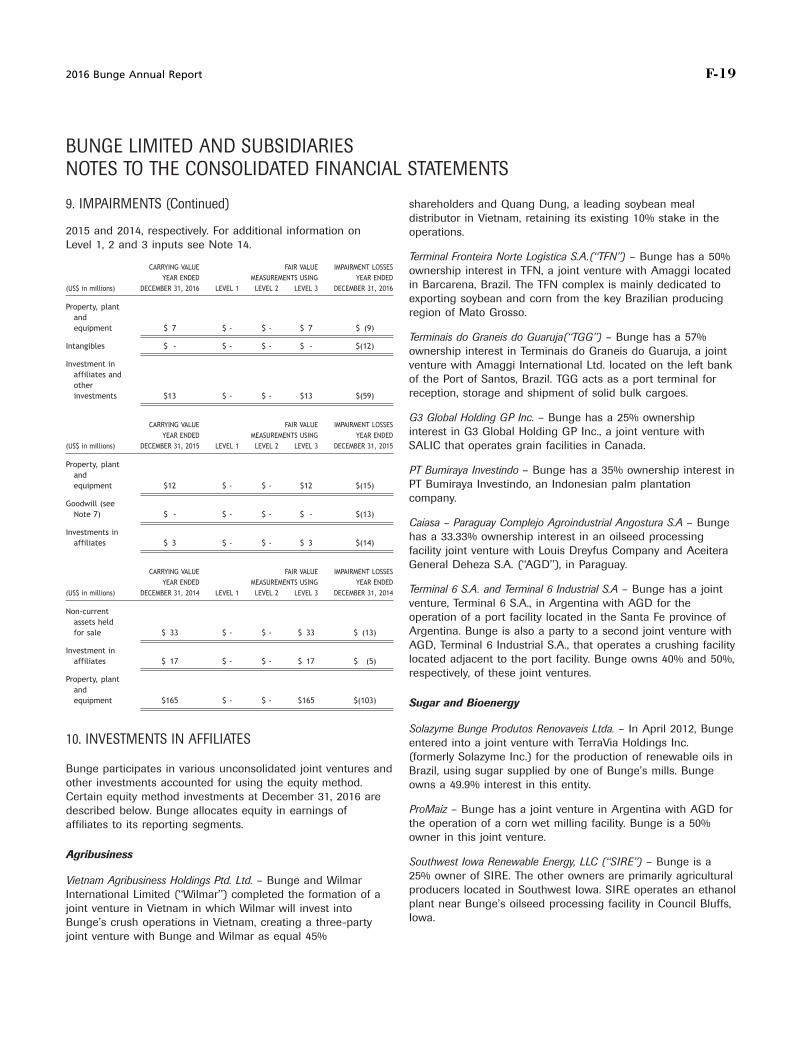
F-19
shareholders and Quang Dung, a leading soybean meal9. IMPAIRMENTS (Continued)distributor in Vietnam, retaining its existing 10% stake in the
2015 and 2014, respectively. For additional information on operations.Level 1, 2 and 3 inputs see Note 14.
Terminal Fronteira Norte Logıstica S.A.(‘‘TFN’’) – Bunge has a 50%CARRYING VALUE IMPAIRMENT LOSSESFAIR VALUE ownership interest in TFN, a joint venture with Amaggi located
YEAR ENDED YEAR ENDEDMEASUREMENTS USINGin Barcarena, Brazil. The TFN complex is mainly dedicated to(US$ in millions) DECEMBER 31, 2016 LEVEL 1 LEVEL 2 LEVEL 3 DECEMBER 31, 2016
exporting soybean and corn from the key Brazilian producingProperty, plant region of Mato Grosso.and
equipment $ 7 $ - $ - $ 7 $ (9)Terminais do Graneis do Guaruja(‘‘TGG’’) – Bunge has a 57%
Intangibles $ - $ - $ - $ - $(12) ownership interest in Terminais do Graneis do Guaruja, a jointInvestment in venture with Amaggi International Ltd. located on the left bank
affiliates and of the Port of Santos, Brazil. TGG acts as a port terminal forother
reception, storage and shipment of solid bulk cargoes.investments $13 $ - $ - $13 $(59)
G3 Global Holding GP Inc. – Bunge has a 25% ownershipCARRYING VALUE IMPAIRMENT LOSSESFAIR VALUE
interest in G3 Global Holding GP Inc., a joint venture withYEAR ENDED YEAR ENDEDMEASUREMENTS USING
(US$ in millions) DECEMBER 31, 2015 LEVEL 1 LEVEL 2 LEVEL 3 DECEMBER 31, 2015 SALIC that operates grain facilities in Canada.
Property, plantPT Bumiraya Investindo – Bunge has a 35% ownership interest inandPT Bumiraya Investindo, an Indonesian palm plantationequipment $12 $ - $ - $12 $(15)
company.Goodwill (see
Note 7) $ - $ - $ - $ - $(13)Caiasa – Paraguay Complejo Agroindustrial Angostura S.A – Bunge
Investments in has a 33.33% ownership interest in an oilseed processingaffiliates $ 3 $ - $ - $ 3 $(14)
facility joint venture with Louis Dreyfus Company and AceiteraGeneral Deheza S.A. (‘‘AGD’’), in Paraguay.
CARRYING VALUE IMPAIRMENT LOSSESFAIR VALUE
YEAR ENDED YEAR ENDEDMEASUREMENTS USINGTerminal 6 S.A. and Terminal 6 Industrial S.A – Bunge has a joint(US$ in millions) DECEMBER 31, 2014 LEVEL 1 LEVEL 2 LEVEL 3 DECEMBER 31, 2014
venture, Terminal 6 S.A., in Argentina with AGD for theNon-current operation of a port facility located in the Santa Fe province ofassets held
Argentina. Bunge is also a party to a second joint venture withfor sale $ 33 $ - $ - $ 33 $ (13)
AGD, Terminal 6 Industrial S.A., that operates a crushing facilityInvestment in
located adjacent to the port facility. Bunge owns 40% and 50%,affiliates $ 17 $ - $ - $ 17 $ (5)
respectively, of these joint ventures.Property, plant
andequipment $165 $ - $ - $165 $(103) Sugar and Bioenergy
Solazyme Bunge Produtos Renovaveis Ltda. – In April 2012, Bunge10. INVESTMENTS IN AFFILIATES entered into a joint venture with TerraVia Holdings Inc.
(formerly Solazyme Inc.) for the production of renewable oils inBunge participates in various unconsolidated joint ventures and Brazil, using sugar supplied by one of Bunge’s mills. Bungeother investments accounted for using the equity method. owns a 49.9% interest in this entity.Certain equity method investments at December 31, 2016 are
ProMaiz – Bunge has a joint venture in Argentina with AGD fordescribed below. Bunge allocates equity in earnings ofthe operation of a corn wet milling facility. Bunge is a 50%affiliates to its reporting segments.owner in this joint venture.
AgribusinessSouthwest Iowa Renewable Energy, LLC (‘‘SIRE’’) – Bunge is a25% owner of SIRE. The other owners are primarily agriculturalVietnam Agribusiness Holdings Ptd. Ltd. – Bunge and Wilmarproducers located in Southwest Iowa. SIRE operates an ethanolInternational Limited (‘‘Wilmar’’) completed the formation of aplant near Bunge’s oilseed processing facility in Council Bluffs,joint venture in Vietnam in which Wilmar will invest intoIowa.Bunge’s crush operations in Vietnam, creating a three-party
joint venture with Bunge and Wilmar as equal 45%
2016 Bunge Annual Report F-19
BUNGE LIMITED AND SUBSIDIARIESNOTES TO THE CONSOLIDATED FINANCIAL STATEMENTS
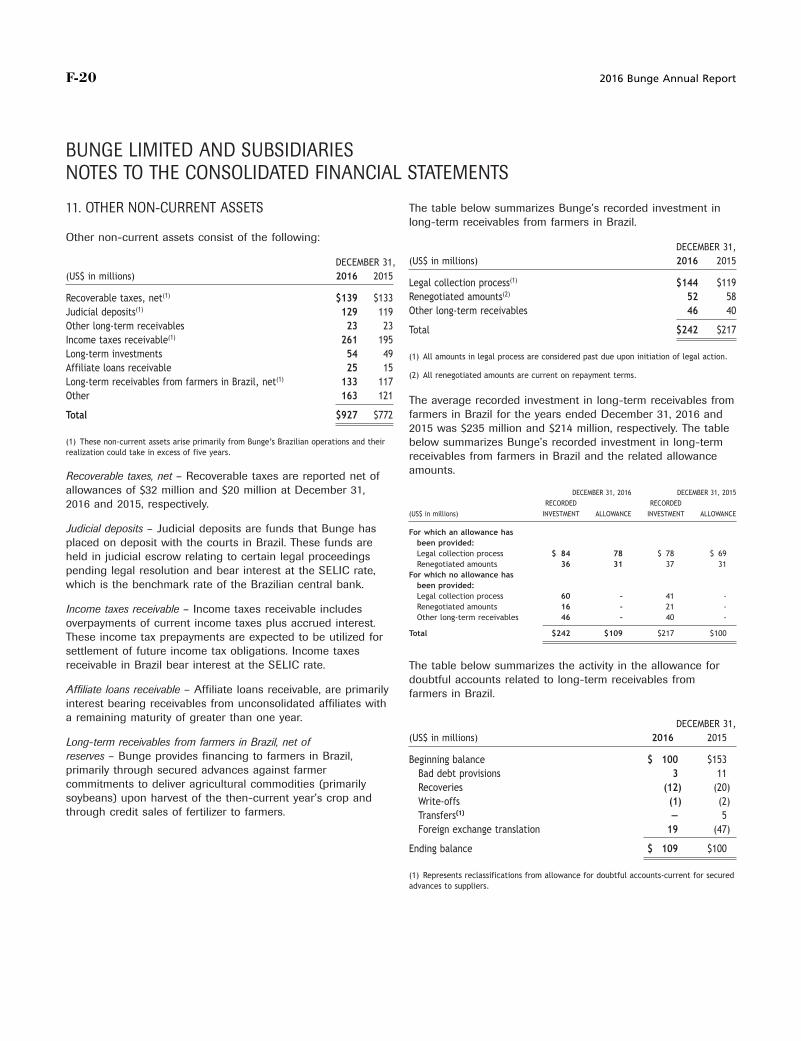
F-20
The table below summarizes Bunge’s recorded investment in11. OTHER NON-CURRENT ASSETSlong-term receivables from farmers in Brazil.
Other non-current assets consist of the following:DECEMBER 31,
(US$ in millions) 2016 2015DECEMBER 31,(US$ in millions) 2016 2015
Legal collection process(1) $144 $119Renegotiated amounts(2) 52 58Recoverable taxes, net(1) $139 $133Other long-term receivables 46 40Judicial deposits(1) 129 119
Other long-term receivables 23 23 Total $242 $217Income taxes receivable(1) 261 195Long-term investments 54 49 (1) All amounts in legal process are considered past due upon initiation of legal action.Affiliate loans receivable 25 15
(2) All renegotiated amounts are current on repayment terms.Long-term receivables from farmers in Brazil, net(1) 133 117Other 163 121 The average recorded investment in long-term receivables from
farmers in Brazil for the years ended December 31, 2016 andTotal $927 $7722015 was $235 million and $214 million, respectively. The table
(1) These non-current assets arise primarily from Bunge’s Brazilian operations and their below summarizes Bunge’s recorded investment in long-termrealization could take in excess of five years. receivables from farmers in Brazil and the related allowance
amounts.Recoverable taxes, net – Recoverable taxes are reported net ofallowances of $32 million and $20 million at December 31, DECEMBER 31, 2016 DECEMBER 31, 2015
RECORDED RECORDED2016 and 2015, respectively.(US$ in millions) INVESTMENT ALLOWANCE INVESTMENT ALLOWANCE
Judicial deposits – Judicial deposits are funds that Bunge has For which an allowance hasbeen provided:placed on deposit with the courts in Brazil. These funds areLegal collection process $ 84 78 $ 78 $ 69held in judicial escrow relating to certain legal proceedingsRenegotiated amounts 36 31 37 31
pending legal resolution and bear interest at the SELIC rate, For which no allowance haswhich is the benchmark rate of the Brazilian central bank. been provided:
Legal collection process 60 - 41 -Renegotiated amounts 16 - 21 -Income taxes receivable – Income taxes receivable includesOther long-term receivables 46 - 40 -overpayments of current income taxes plus accrued interest.
Total $242 $109 $217 $100These income tax prepayments are expected to be utilized forsettlement of future income tax obligations. Income taxesreceivable in Brazil bear interest at the SELIC rate. The table below summarizes the activity in the allowance for
doubtful accounts related to long-term receivables fromAffiliate loans receivable – Affiliate loans receivable, are primarily farmers in Brazil.interest bearing receivables from unconsolidated affiliates witha remaining maturity of greater than one year.
DECEMBER 31,(US$ in millions) 2016 2015Long-term receivables from farmers in Brazil, net of
reserves – Bunge provides financing to farmers in Brazil, Beginning balance $ 100 $153primarily through secured advances against farmer Bad debt provisions 3 11commitments to deliver agricultural commodities (primarily Recoveries (12) (20)soybeans) upon harvest of the then-current year’s crop and Write-offs (1) (2)through credit sales of fertilizer to farmers. Transfers(1) — 5
Foreign exchange translation 19 (47)
Ending balance $ 109 $100
(1) Represents reclassifications from allowance for doubtful accounts-current for securedadvances to suppliers.
F-20 2016 Bunge Annual Report
BUNGE LIMITED AND SUBSIDIARIESNOTES TO THE CONSOLIDATED FINANCIAL STATEMENTS

F-21
The components of the income tax expense (benefit) are:12. OTHER CURRENT LIABILITIES
Other current liabilities consist of the following: YEAR ENDED DECEMBER 31,(US$ in millions) 2016 2015 2014
Current:DECEMBER 31, United States $ (76) $ 35 $ 93
(US$ in millions) 2016 2015 Non-United States 170 245 246
Accrued liabilities $ 548 $ 688 94 280 339Unrealized losses on derivative contracts at fair value 1,203 1,471
Deferred:Advances on sales 395 371
United States 38 36 20Other 330 233
Non-United States 88 (20) (110)Total $2,476 $2,763
126 16 (90)
Total $220 $296 $24913. INCOME TAXES
Reconciliation of the income tax expense (benefit) if computedBunge operates globally and is subject to the tax laws and at the U.S. Federal income tax rate to Bunge’s reported incomeregulations of numerous tax jurisdictions and authorities, as tax expense (benefit) is as follows:well as tax agreements and treaties among these jurisdictions.Bunge’s tax provision is impacted by, among other factors,
YEAR ENDED DECEMBER 31,changes in tax laws, regulations, agreements and treaties,
(US$ in millions) 2016 2015 2014currency exchange rates and Bunge’s profitability in eachtaxing jurisdiction. Income from operations before income tax $996 $1,051 $734
Income tax rate 35% 35% 35%Bunge has elected to use the U.S. federal income tax rate to
Income tax expense at the U.S. Federal tax rate 349 368 257reconcile the actual provision for income taxes.Adjustments to derive effective tax rate:
Foreign earnings taxed at different statutoryThe components of income from operations before income taxrates (68) (16) (37)are as follows:
Valuation allowances (44) 44 112Fiscal incentives(1) (34) (41) (41)
YEAR ENDED DECEMBER 31,Foreign exchange on monetary items 5 (5) (24)
(US$ in millions) 2016 2015 2014Tax rate changes 4 1 4
United States $102 $ 207 $315 Non-deductible expenses 3 16 38Non-United States 894 844 419 Uncertain tax positions 89 (14) 6
Deferred balance adjustments - (8) 25Total $996 $1,051 $734Equity distributions - (64) (32)Foreign income taxed in Brazil - - (93)Tax credits (89) - -Other 5 15 34
Income tax (benefit) expense $220 $ 296 $249
(1) Fiscal incentives predominantly relate to investment incentives in Brazil that areexempt from Brazilian income tax.
2016 Bunge Annual Report F-21
BUNGE LIMITED AND SUBSIDIARIESNOTES TO THE CONSOLIDATED FINANCIAL STATEMENTS
F-22
The remaining tax loss carryforwards expire at various periods13. INCOME TAXES (Continued)beginning in 2016 through the year 2033.
The primary components of the deferred tax assets andIncome Tax Valuation Allowances. Bunge records valuationliabilities and the related valuation allowances are as follows:allowances when current evidence does not suggest that someportion or all of its deferred tax assets will be realized. TheDECEMBER 31,ultimate realization of deferred tax assets depends primarily on(US$ in millions) 2016 2015Bunge’s ability to generate sufficient timely future income of
Deferred income tax assets:(1) the appropriate character in the appropriate taxing jurisdiction.Net operating loss carryforwards $ 944 $ 923Employee benefits 158 89 As of December 31, 2016 and 2015, Bunge has recordedTax credit carryforwards 10 8 valuation allowances of $839 million and $798 million,Inventories 18 - respectively. The net increase of $41 million results primarilyIntangibles 9 20 from cumulative translation adjustments for Brazil offset by theAccrued expenses and other 231 378 release of valuation allowances from sugar mills in Brazil.
Total deferred tax assets 1,370 1,418 Unrecognized Tax Benefits. ASC Topic 740 requires applying aLess valuation allowances (839) (798) ‘‘more likely than not’’ threshold to the recognition andDeferred tax assets, net of valuation allowance 531 620 de-recognition of tax benefits. Accordingly, Bunge recognizes
the amount of tax benefit that has a greater than 50 percentDeferred income tax liabilities:(1)
likelihood of being ultimately realized upon settlement. AtProperty, plant and equipment 200 211December 31, 2016 and 2015, respectively, Bunge had recordedUndistributed earnings of affiliates 13 11unrecognized tax benefits of $81 million and $63 million inInvestments 33 38other non-current liabilities and $49 million and $1 million inInventories - 4current liabilities in its consolidated balance sheets. During
Total deferred tax liabilities 246 264 2016, 2015 and 2014, respectively, Bunge recognized$10 million, $1million and $16 million of interest and penaltyNet deferred tax assets $ 285 $ 356charges in income tax (expense) benefit in the consolidatedstatements of income. At December 31, 2016 and 2015,(1) Bunge has changed its presentation of the composition of deferred tax assets and
liabilities to a net approach, where a net deferred tax asset or liability is disclosed for respectively, Bunge had included accrued interest andeach primary component of the deferred tax assets and liabilities. The change in penalties of $36 million and $26 million within the related taxpresentation did not impact the consolidated balance sheet presentation of deferred tax liability line in the consolidated balance sheets. A reconciliationassets and liabilities. of the beginning and ending amount of unrecognized tax
benefits follows:Bunge has provided a deferred tax liability totaling $13 millionand $11 million as of December 31, 2016 and 2015, respectively
(US$ in millions) 2016 2015 2014for unremitted earnings that are not considered to bepermanently reinvested. As of December 31, 2016, Bunge has Balance at January 1, $ 51 $ 72 $151determined it has unremitted earnings that are considered to Additions based on tax positions related to thebe indefinitely reinvested of approximately $1,120 million and current year 9 6 9accordingly, no provision for income taxes has been made. If Additions based on acquisitions 2 10 -these earnings were distributed in the form of dividends or Additions based on tax positions related to priorotherwise, Bunge would be subject to income taxes either in years 374 1 16the form of withholding taxes or income taxes to the recipient; Reductions for tax positions of prior years - (14) (12)however, it is not practicable to estimate the amount of taxes Settlement or clarification from tax authorities (1) (6) (79)that would be payable upon remittance of these earnings. Expiration of statute of limitations (9) (5) (1)
Foreign currency translation (17) (13) (12)At December 31, 2016, Bunge’s net operating loss
Balance at December 31, $409 $ 51 $ 72carryforwards totaled $3,350 million, of which $2,709 millionhave no expiration, including loss carryforwards of$1,705 million in Brazil. While loss carryforwards in Brazil can The majority of the additions based on tax positions related tobe carried forward indefinitely, annual utilization is limited to prior years relates to three events recognized during 2016.30% of taxable income calculated on an entity by entity basis During the second quarter of 2016, one of Bunge’s Europeanas Brazil tax law does not provide for a consolidated return subsidiaries amended a tax position for the 2010-2015 taxconcept. As a result, realization of these carryforwards may years as a result of the receipt of a tax ruling, and filed refundtake in excess of five years. claims. However, given the unique factual circumstances and
F-22 2016 Bunge Annual Report
BUNGE LIMITED AND SUBSIDIARIESNOTES TO THE CONSOLIDATED FINANCIAL STATEMENTS

F-23
Management, in consultation with external legal advisors,13. INCOME TAXES (Continued)believes that it is more likely than not that Bunge will prevail
the uncertain state of the applicable tax regulations, Bunge has on the proposed assessments (with exception of unrecognizedrecorded an unrecognized tax benefit of $240 million as of tax benefit discussed above) in Brazil and Argentina andDecember 31, 2016. In addition, the Company recorded intends to vigorously defend its position against theseadditional unrecognized tax benefits of $30 million and assessments.$26 million for tax positions in Asia in the first and fourth
Bunge made cash income tax payments, net of refundsquarters of 2016.received, of $144 million, $271 million and $303 million during
Except for a $24 million unrecognized tax benefit for temporary the years ended December 31, 2016, 2015, and 2014,differences, substantially all of the unrecognized tax benefits respectively.balance, if recognized, would affect Bunge’s effective tax rate.A significant portion of the unrecognized tax benefits, if 14. FINANCIAL INSTRUMENTS AND FAIR VALUErecognized, would result in additional deferred tax assets that
MEASUREMENTSwould be assessed for recoverability. It is anticipated thatapproximately $213 million of the unrecognized tax benefits, if
Bunge’s various financial instruments include certainrecognized, would be fully offset by a valuation allowance as itcomponents of working capital such as cash and cashis more likely than not that Bunge would not realize a taxequivalents, trade accounts receivable and trade accountsbenefit from the deferred tax assets.payable. Additionally, Bunge uses short and long-term debt tofund operating requirements. Cash and cash equivalents, tradeBunge believes that it is reasonably possible that approximatelyaccounts receivable, trade accounts payable and short-term$50 million of its unrecognized tax benefits may be recognizeddebt are stated at their carrying value, which is a reasonableby the end of 2017 as a result of a lapse of the statute ofestimate of fair value. See Note 3 for trade structured financelimitations or settlement with the tax authorities.program, Note 17 for deferred purchase price receivable
Bunge, through its subsidiaries, files income tax returns in the related to sales of trade receivables, Note 11 for long-termUnited States (federal and various states) and non-United receivables from farmers in Brazil, net and other long-termStates jurisdictions. The table below reflects the tax years for investments, Note 16 for long-term debt, Note 9 for otherwhich Bunge is subject to income tax examinations by tax non-recurring fair value measurements and Note 18 forauthorities: employee benefit plans. Bunge’s financial instruments also
include derivative instruments and marketable securities, whichare stated at fair value.OPEN TAX YEARS
Fair value is the expected price that would be received for anNorth America 2009 - 2016asset or paid to transfer a liability (an exit price) in theSouth America 2010 - 2016principal or most advantageous market for the asset or liabilityEurope 2004 - 2016in an orderly transaction between market participants on theAsia-Pacific 2003 - 2016measurement date. Bunge determines the fair values of itsreadily marketable inventories, derivatives, and certain otherAs of December 31, 2016, Bunge’s Brazilian subsidiaries haveassets based on the fair value hierarchy, which requires anreceived income tax and penalty assessments through 2012 ofentity to maximize the use of observable inputs and minimizeapproximately 4,453 million Brazilian reais (approximatelythe use of unobservable inputs when measuring fair value.$1,366 million), plus applicable interest on the outstandingObservable inputs are inputs based on market data obtainedamount. Bunge has recorded unrecognized tax benefits relatedfrom sources independent of Bunge that reflect theto these assessments of 23 million Brazilian reaisassumptions market participants would use in pricing the asset(approximately $7 million) as of December 31, 2016.or liability. Unobservable inputs are inputs that are developed
In addition, as of December 31, 2016, Bunge’s Argentine based on the best information available in circumstances thatsubsidiary had received income tax assessments relating to 2006 reflect Bunge’s own assumptions based on market data and onthrough 2009 of approximately 1,275 million Argentine pesos assumptions that market participants would use in pricing the(approximately $80 million), plus applicable interest on the asset or liability. The fair value standard describes three levelsoutstanding amount of approximately 3,327 million Argentine within its hierarchy that may be used to measure fair value.pesos (approximately $209 million). Bunge anticipates that thetax authorities will examine subsequent fiscal years, although nonotice has been rendered to Bunge’s Argentine subsidiary.
2016 Bunge Annual Report F-23
BUNGE LIMITED AND SUBSIDIARIESNOTES TO THE CONSOLIDATED FINANCIAL STATEMENTS
F-24
Level 3: Unobservable inputs that are supported by little or no14. FINANCIAL INSTRUMENTS AND FAIR VALUEmarket activity and that are a significant component of the fairMEASUREMENTS (Continued)value of the assets or liabilities. In evaluating the significanceof fair value inputs, Bunge gives consideration to items thatLevel 1: Quoted prices (unadjusted) in active markets forindividually or when aggregated with other inputs, generallyidentical assets or liabilities. Level 1 assets and liabilitiesrepresent more than 10% of the fair value of the assets orinclude exchange traded derivative contracts.liabilities. For such identified inputs, judgments are requiredwhen evaluating both quantitative and qualitative factors in theLevel 2: Observable inputs, including Level 1 prices (adjusted),determination of significance for purposes of fair value levelquoted prices for similar assets or liabilities, quoted prices inclassification and disclosure. Level 3 assets and liabilitiesmarkets that are less active than traded exchanges and otherinclude assets and liabilities whose value is determined usinginputs that are observable or can be corroborated byproprietary pricing models, discounted cash flowobservable market data for substantially the full term of themethodologies or similar techniques; as well as, assets andassets or liabilities. Level 2 assets and liabilities include readilyliabilities for which the determination of fair value requiresmarketable inventories and over-the-counter (‘‘OTC’’)significant management judgment or estimation. Bungecommodity purchase and sale contracts and other OTCbelieves a change in these inputs would not result in aderivatives whose value is determined using pricing modelssignificant change in the fair values.with inputs that are generally based on exchange traded
prices, adjusted for location specific inputs that are primarilyobservable in the market or can be derived principally from orcorroborated by observable market data.
F-24 2016 Bunge Annual Report
BUNGE LIMITED AND SUBSIDIARIESNOTES TO THE CONSOLIDATED FINANCIAL STATEMENTS
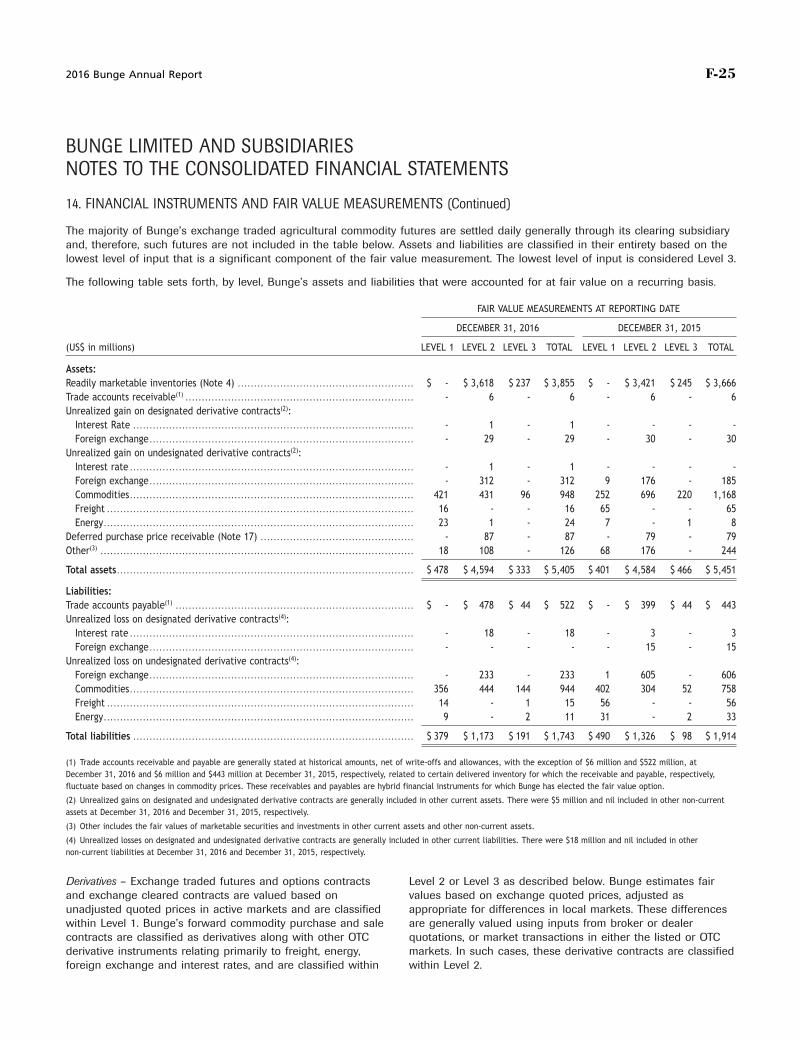
F-25
14. FINANCIAL INSTRUMENTS AND FAIR VALUE MEASUREMENTS (Continued)
The majority of Bunge’s exchange traded agricultural commodity futures are settled daily generally through its clearing subsidiaryand, therefore, such futures are not included in the table below. Assets and liabilities are classified in their entirety based on thelowest level of input that is a significant component of the fair value measurement. The lowest level of input is considered Level 3.
The following table sets forth, by level, Bunge’s assets and liabilities that were accounted for at fair value on a recurring basis.
FAIR VALUE MEASUREMENTS AT REPORTING DATE
DECEMBER 31, 2016 DECEMBER 31, 2015
(US$ in millions) LEVEL 1 LEVEL 2 LEVEL 3 TOTAL LEVEL 1 LEVEL 2 LEVEL 3 TOTAL
Assets:Readily marketable inventories (Note 4) . . . . . . . . . . . . . . . . . . . . . . . . . . . . . . . . . . . . . . . . . . . . . . . . . . . . . . $ - $ 3,618 $ 237 $ 3,855 $ - $ 3,421 $ 245 $ 3,666Trade accounts receivable(1) . . . . . . . . . . . . . . . . . . . . . . . . . . . . . . . . . . . . . . . . . . . . . . . . . . . . . . . . . . . . . . . . . . . . . . - 6 - 6 - 6 - 6Unrealized gain on designated derivative contracts(2):
Interest Rate . . . . . . . . . . . . . . . . . . . . . . . . . . . . . . . . . . . . . . . . . . . . . . . . . . . . . . . . . . . . . . . . . . . . . . . . . . . . . . . . . . . . . . - 1 - 1 - - - -Foreign exchange . . . . . . . . . . . . . . . . . . . . . . . . . . . . . . . . . . . . . . . . . . . . . . . . . . . . . . . . . . . . . . . . . . . . . . . . . . . . . . . . . - 29 - 29 - 30 - 30
Unrealized gain on undesignated derivative contracts(2):Interest rate . . . . . . . . . . . . . . . . . . . . . . . . . . . . . . . . . . . . . . . . . . . . . . . . . . . . . . . . . . . . . . . . . . . . . . . . . . . . . . . . . . . . . . . - 1 - 1 - - - -Foreign exchange . . . . . . . . . . . . . . . . . . . . . . . . . . . . . . . . . . . . . . . . . . . . . . . . . . . . . . . . . . . . . . . . . . . . . . . . . . . . . . . . . - 312 - 312 9 176 - 185Commodities . . . . . . . . . . . . . . . . . . . . . . . . . . . . . . . . . . . . . . . . . . . . . . . . . . . . . . . . . . . . . . . . . . . . . . . . . . . . . . . . . . . . . . . 421 431 96 948 252 696 220 1,168Freight . . . . . . . . . . . . . . . . . . . . . . . . . . . . . . . . . . . . . . . . . . . . . . . . . . . . . . . . . . . . . . . . . . . . . . . . . . . . . . . . . . . . . . . . . . . . . . 16 - - 16 65 - - 65Energy . . . . . . . . . . . . . . . . . . . . . . . . . . . . . . . . . . . . . . . . . . . . . . . . . . . . . . . . . . . . . . . . . . . . . . . . . . . . . . . . . . . . . . . . . . . . . . . 23 1 - 24 7 - 1 8
Deferred purchase price receivable (Note 17) . . . . . . . . . . . . . . . . . . . . . . . . . . . . . . . . . . . . . . . . . . . . . . . - 87 - 87 - 79 - 79Other(3) . . . . . . . . . . . . . . . . . . . . . . . . . . . . . . . . . . . . . . . . . . . . . . . . . . . . . . . . . . . . . . . . . . . . . . . . . . . . . . . . . . . . . . . . . . . . . . . . 18 108 - 126 68 176 - 244
Total assets . . . . . . . . . . . . . . . . . . . . . . . . . . . . . . . . . . . . . . . . . . . . . . . . . . . . . . . . . . . . . . . . . . . . . . . . . . . . . . . . . . . . . . . . . . . $ 478 $ 4,594 $ 333 $ 5,405 $ 401 $ 4,584 $ 466 $ 5,451
Liabilities:Trade accounts payable(1) . . . . . . . . . . . . . . . . . . . . . . . . . . . . . . . . . . . . . . . . . . . . . . . . . . . . . . . . . . . . . . . . . . . . . . . . . $ - $ 478 $ 44 $ 522 $ - $ 399 $ 44 $ 443Unrealized loss on designated derivative contracts(4):
Interest rate . . . . . . . . . . . . . . . . . . . . . . . . . . . . . . . . . . . . . . . . . . . . . . . . . . . . . . . . . . . . . . . . . . . . . . . . . . . . . . . . . . . . . . . - 18 - 18 - 3 - 3Foreign exchange . . . . . . . . . . . . . . . . . . . . . . . . . . . . . . . . . . . . . . . . . . . . . . . . . . . . . . . . . . . . . . . . . . . . . . . . . . . . . . . . . - - - - - 15 - 15
Unrealized loss on undesignated derivative contracts(4):Foreign exchange . . . . . . . . . . . . . . . . . . . . . . . . . . . . . . . . . . . . . . . . . . . . . . . . . . . . . . . . . . . . . . . . . . . . . . . . . . . . . . . . . - 233 - 233 1 605 - 606Commodities . . . . . . . . . . . . . . . . . . . . . . . . . . . . . . . . . . . . . . . . . . . . . . . . . . . . . . . . . . . . . . . . . . . . . . . . . . . . . . . . . . . . . . . 356 444 144 944 402 304 52 758Freight . . . . . . . . . . . . . . . . . . . . . . . . . . . . . . . . . . . . . . . . . . . . . . . . . . . . . . . . . . . . . . . . . . . . . . . . . . . . . . . . . . . . . . . . . . . . . . 14 - 1 15 56 - - 56Energy . . . . . . . . . . . . . . . . . . . . . . . . . . . . . . . . . . . . . . . . . . . . . . . . . . . . . . . . . . . . . . . . . . . . . . . . . . . . . . . . . . . . . . . . . . . . . . . 9 - 2 11 31 - 2 33
Total liabilities . . . . . . . . . . . . . . . . . . . . . . . . . . . . . . . . . . . . . . . . . . . . . . . . . . . . . . . . . . . . . . . . . . . . . . . . . . . . . . . . . . . . . . $ 379 $ 1,173 $ 191 $ 1,743 $ 490 $ 1,326 $ 98 $ 1,914
(1) Trade accounts receivable and payable are generally stated at historical amounts, net of write-offs and allowances, with the exception of $6 million and $522 million, atDecember 31, 2016 and $6 million and $443 million at December 31, 2015, respectively, related to certain delivered inventory for which the receivable and payable, respectively,fluctuate based on changes in commodity prices. These receivables and payables are hybrid financial instruments for which Bunge has elected the fair value option.
(2) Unrealized gains on designated and undesignated derivative contracts are generally included in other current assets. There were $5 million and nil included in other non-currentassets at December 31, 2016 and December 31, 2015, respectively.
(3) Other includes the fair values of marketable securities and investments in other current assets and other non-current assets.
(4) Unrealized losses on designated and undesignated derivative contracts are generally included in other current liabilities. There were $18 million and nil included in othernon-current liabilities at December 31, 2016 and December 31, 2015, respectively.
Derivatives – Exchange traded futures and options contracts Level 2 or Level 3 as described below. Bunge estimates fairand exchange cleared contracts are valued based on values based on exchange quoted prices, adjusted asunadjusted quoted prices in active markets and are classified appropriate for differences in local markets. These differenceswithin Level 1. Bunge’s forward commodity purchase and sale are generally valued using inputs from broker or dealercontracts are classified as derivatives along with other OTC quotations, or market transactions in either the listed or OTCderivative instruments relating primarily to freight, energy, markets. In such cases, these derivative contracts are classifiedforeign exchange and interest rates, and are classified within within Level 2.
2016 Bunge Annual Report F-25
BUNGE LIMITED AND SUBSIDIARIESNOTES TO THE CONSOLIDATED FINANCIAL STATEMENTS

F-26
unrealized gains and losses on derivative contracts and RMI at14. FINANCIAL INSTRUMENTS AND FAIR VALUEfair value in the consolidated balance sheets and consolidatedMEASUREMENTS (Continued)statements of income could differ.
OTC derivative contracts include swaps, options and structuredLevel 3 Measurements – Transfers in and/or out of Level 3transactions that are valued at fair value generally determinedrepresent existing assets or liabilities that were eitherusing quantitative models that require the use of multiplepreviously categorized as a higher level for which the inputs tomarket inputs including quoted prices for similar assets orthe model became unobservable or assets and liabilities thatliabilities in active markets, quoted prices for identical orwere previously classified as Level 3 for which the lowestsimilar assets or liabilities in markets which are not highlysignificant input became observable during the period. Bunge’sactive, other observable inputs relevant to the asset or liability,policy regarding the timing of transfers between levels is toand market inputs corroborated by correlation or other means.record the transfers at the beginning of the reporting period.These valuation models include inputs such as interest rates,
prices and indices to generate continuous yield or pricing Level 3 Derivatives – Level 3 derivative instruments utilize bothcurves and volatility factors. Where observable inputs are market observable and unobservable inputs within the fairavailable for substantially the full term of the asset or liability, value measurements. These inputs include commodity prices,the instrument is categorized in Level 2. Certain OTC price volatility, interest rates, volumes and locations. In addition,derivatives trade in less active markets with less availability of with the exception of the exchange cleared instruments, Bungepricing information and certain structured transactions can is exposed to loss in the event of the non-performance byrequire internally developed model inputs that might not be counterparties on OTC derivative instruments and forwardobservable in or corroborated by the market. When purchase and sale contracts. Adjustments are made to fairunobservable inputs have a significant impact on the values on occasions when non-performance risk is determinedmeasurement of fair value, the instrument is categorized in to represent a significant input in Bunge’s fair valueLevel 3. determination. These adjustments are based on Bunge’s
estimate of the potential loss in the event of counterpartyExchange traded or cleared derivative contracts are classifiednon-performance. Bunge did not have significant adjustmentsin Level 1, thus transfers of assets and liabilities into and/orrelated to non-performance by counterparties at December 31,out of Level 1 occur infrequently. Transfers into Level 1 would2016 and 2015, respectively.generally only be expected to occur when an exchange cleared
derivative contract historically valued using a valuation model Level 3 Readily marketable inventories and other – The significantas the result of a lack of observable inputs becomes unobservable inputs resulting in Level 3 classification for RMI,sufficiently observable, resulting in the valuation price being physically settled forward purchase and sale contracts, andessentially the exchange traded price. There were no significant trade accounts receivable and payable, net, relate to certaintransfers into or out of Level 1 during the periods presented. management estimations regarding costs of transportation and
other local market or location-related adjustments, primarilyReadily marketable inventories – RMI reported at fair value are
freight related adjustments in the interior of Brazil and the lackvalued based on commodity futures exchange quotations,of market corroborated information in Canada. In bothbroker or dealer quotations, or market transactions in eithersituations, Bunge uses proprietary information such aslisted or OTC markets with appropriate adjustments forpurchase and sale contracts and contracted prices for freight,differences in local markets where Bunge’s inventories arepremiums and discounts to value its contracts. Movements inlocated. In such cases, the inventory is classified within Level 2.the price of these unobservable inputs alone would not have aCertain inventories may utilize significant unobservable datamaterial effect on Bunge’s financial statements as theserelated to local market adjustments to determine fair value. Incontracts do not typically exceed one future crop cycle.such cases, the inventory is classified as Level 3.
The tables below present reconciliations for assets andIf Bunge used different methods or factors to determine fairliabilities measured at fair value on a recurring basis usingvalues, amounts reported as unrealized gains and losses onsignificant unobservable inputs (Level 3) during the yearsderivative contracts and RMI at fair value in the consolidatedended December 31, 2016 and 2015. These instruments werebalance sheets and consolidated statements of income couldvalued using pricing models that management believes reflectdiffer. Additionally, if market conditions change subsequent to
the reporting date, amounts reported in future periods as
F-26 2016 Bunge Annual Report
BUNGE LIMITED AND SUBSIDIARIESNOTES TO THE CONSOLIDATED FINANCIAL STATEMENTS
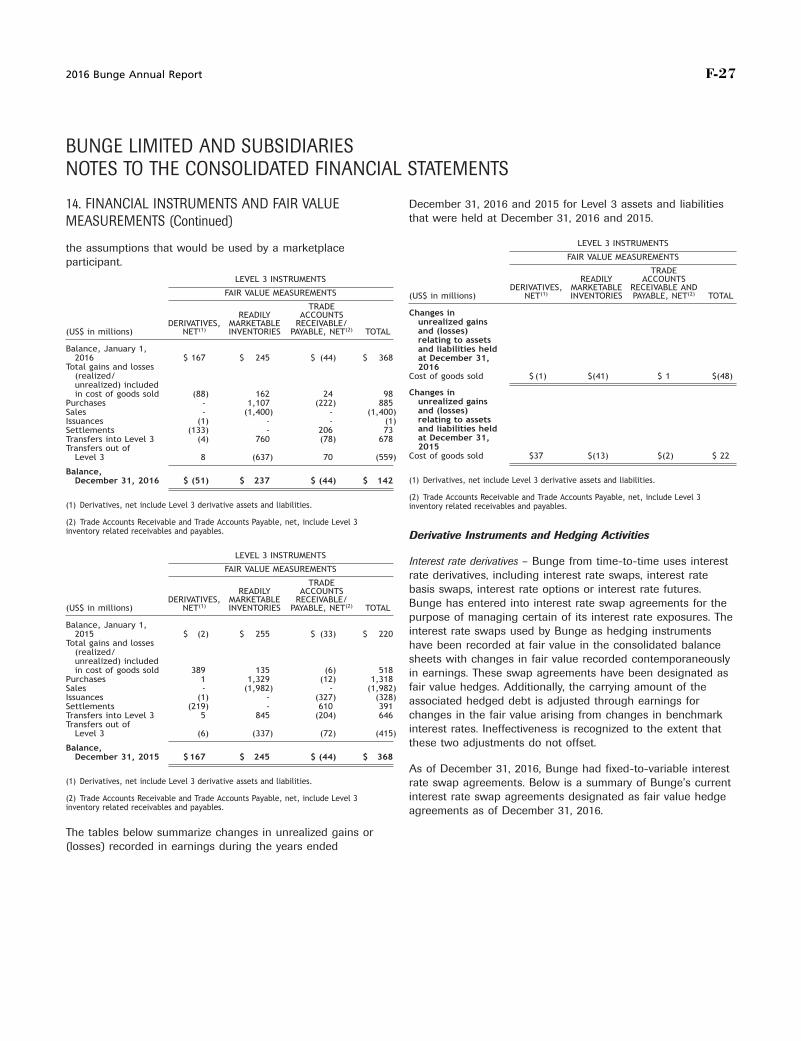
F-27
December 31, 2016 and 2015 for Level 3 assets and liabilities14. FINANCIAL INSTRUMENTS AND FAIR VALUEthat were held at December 31, 2016 and 2015.MEASUREMENTS (Continued)
LEVEL 3 INSTRUMENTSthe assumptions that would be used by a marketplaceFAIR VALUE MEASUREMENTSparticipant.
TRADEREADILY ACCOUNTSLEVEL 3 INSTRUMENTS
DERIVATIVES, MARKETABLE RECEIVABLE ANDFAIR VALUE MEASUREMENTS (US$ in millions) NET(1) INVENTORIES PAYABLE, NET(2) TOTAL
TRADEChanges inREADILY ACCOUNTS
unrealized gainsDERIVATIVES, MARKETABLE RECEIVABLE/and (losses)(US$ in millions) NET(1) INVENTORIES PAYABLE, NET(2) TOTALrelating to assets
Balance, January 1, and liabilities held2016 $ 167 $ 245 $ (44) $ 368 at December 31,
Total gains and losses 2016(realized/ Cost of goods sold $ (1) $(41) $ 1 $(48)unrealized) included
Changes inin cost of goods sold (88) 162 24 98unrealized gainsPurchases - 1,107 (222) 885and (losses)Sales - (1,400) - (1,400)relating to assetsIssuances (1) - - (1)and liabilities heldSettlements (133) - 206 73at December 31,Transfers into Level 3 (4) 760 (78) 6782015Transfers out of
Cost of goods sold $37 $(13) $(2) $ 22Level 3 8 (637) 70 (559)
Balance,(1) Derivatives, net include Level 3 derivative assets and liabilities.December 31, 2016 $ (51) $ 237 $ (44) $ 142
(2) Trade Accounts Receivable and Trade Accounts Payable, net, include Level 3(1) Derivatives, net include Level 3 derivative assets and liabilities. inventory related receivables and payables.
(2) Trade Accounts Receivable and Trade Accounts Payable, net, include Level 3inventory related receivables and payables. Derivative Instruments and Hedging Activities
LEVEL 3 INSTRUMENTSInterest rate derivatives – Bunge from time-to-time uses interest
FAIR VALUE MEASUREMENTSrate derivatives, including interest rate swaps, interest rate
TRADEbasis swaps, interest rate options or interest rate futures.READILY ACCOUNTS
DERIVATIVES, MARKETABLE RECEIVABLE/ Bunge has entered into interest rate swap agreements for the(US$ in millions) NET(1) INVENTORIES PAYABLE, NET(2) TOTALpurpose of managing certain of its interest rate exposures. The
Balance, January 1,interest rate swaps used by Bunge as hedging instruments2015 $ (2) $ 255 $ (33) $ 220
Total gains and losses have been recorded at fair value in the consolidated balance(realized/
sheets with changes in fair value recorded contemporaneouslyunrealized) includedin cost of goods sold 389 135 (6) 518 in earnings. These swap agreements have been designated as
Purchases 1 1,329 (12) 1,318fair value hedges. Additionally, the carrying amount of theSales - (1,982) - (1,982)
Issuances (1) - (327) (328) associated hedged debt is adjusted through earnings forSettlements (219) - 610 391Transfers into Level 3 5 845 (204) 646 changes in the fair value arising from changes in benchmarkTransfers out of interest rates. Ineffectiveness is recognized to the extent thatLevel 3 (6) (337) (72) (415)
these two adjustments do not offset.Balance,December 31, 2015 $167 $ 245 $ (44) $ 368
As of December 31, 2016, Bunge had fixed-to-variable interest(1) Derivatives, net include Level 3 derivative assets and liabilities. rate swap agreements. Below is a summary of Bunge’s current
interest rate swap agreements designated as fair value hedge(2) Trade Accounts Receivable and Trade Accounts Payable, net, include Level 3inventory related receivables and payables. agreements as of December 31, 2016.
The tables below summarize changes in unrealized gains or(losses) recorded in earnings during the years ended
2016 Bunge Annual Report F-27
BUNGE LIMITED AND SUBSIDIARIESNOTES TO THE CONSOLIDATED FINANCIAL STATEMENTS
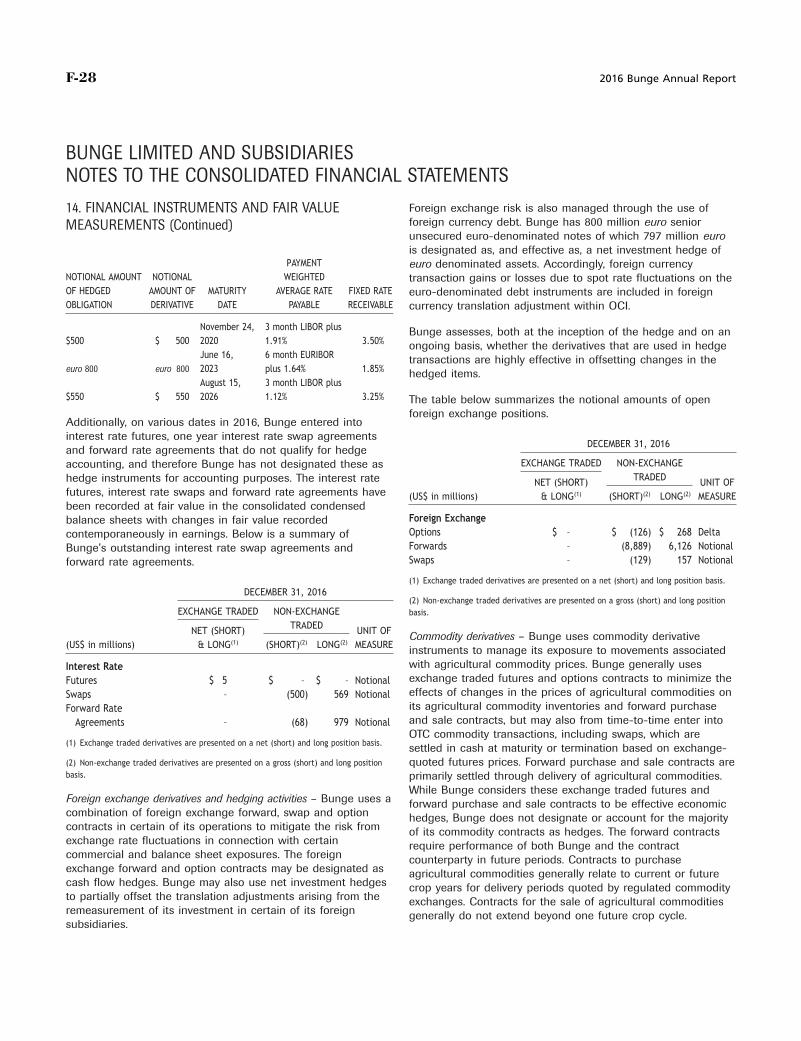
F-28
Foreign exchange risk is also managed through the use of14. FINANCIAL INSTRUMENTS AND FAIR VALUEforeign currency debt. Bunge has 800 million euro seniorMEASUREMENTS (Continued)unsecured euro-denominated notes of which 797 million eurois designated as, and effective as, a net investment hedge of
PAYMENT euro denominated assets. Accordingly, foreign currencyNOTIONAL AMOUNT NOTIONAL WEIGHTED transaction gains or losses due to spot rate fluctuations on theOF HEDGED AMOUNT OF MATURITY AVERAGE RATE FIXED RATE euro-denominated debt instruments are included in foreignOBLIGATION DERIVATIVE DATE PAYABLE RECEIVABLE currency translation adjustment within OCI.
November 24, 3 month LIBOR plus Bunge assesses, both at the inception of the hedge and on an$500 $ 500 2020 1.91% 3.50% ongoing basis, whether the derivatives that are used in hedge
June 16, 6 month EURIBOR transactions are highly effective in offsetting changes in theeuro 800 euro 800 2023 plus 1.64% 1.85% hedged items.
August 15, 3 month LIBOR plus$550 $ 550 2026 1.12% 3.25% The table below summarizes the notional amounts of open
foreign exchange positions.Additionally, on various dates in 2016, Bunge entered intointerest rate futures, one year interest rate swap agreements
DECEMBER 31, 2016and forward rate agreements that do not qualify for hedgeEXCHANGE TRADED NON-EXCHANGEaccounting, and therefore Bunge has not designated these as
TRADEDhedge instruments for accounting purposes. The interest rate NET (SHORT) UNIT OFfutures, interest rate swaps and forward rate agreements have (US$ in millions) & LONG(1) (SHORT)(2) LONG(2) MEASUREbeen recorded at fair value in the consolidated condensed
Foreign Exchangebalance sheets with changes in fair value recordedOptions $ – $ (126) $ 268 Deltacontemporaneously in earnings. Below is a summary ofForwards – (8,889) 6,126 NotionalBunge’s outstanding interest rate swap agreements andSwaps – (129) 157 Notionalforward rate agreements.
(1) Exchange traded derivatives are presented on a net (short) and long position basis.DECEMBER 31, 2016
(2) Non-exchange traded derivatives are presented on a gross (short) and long positionEXCHANGE TRADED NON-EXCHANGE basis.
TRADEDNET (SHORT) UNIT OF Commodity derivatives – Bunge uses commodity derivative(US$ in millions) & LONG(1) (SHORT)(2) LONG(2) MEASURE instruments to manage its exposure to movements associated
with agricultural commodity prices. Bunge generally usesInterest Rateexchange traded futures and options contracts to minimize theFutures $ 5 $ – $ – Notionaleffects of changes in the prices of agricultural commodities onSwaps – (500) 569 Notionalits agricultural commodity inventories and forward purchaseForward Rateand sale contracts, but may also from time-to-time enter intoAgreements – (68) 979 NotionalOTC commodity transactions, including swaps, which are
(1) Exchange traded derivatives are presented on a net (short) and long position basis. settled in cash at maturity or termination based on exchange-(2) Non-exchange traded derivatives are presented on a gross (short) and long position quoted futures prices. Forward purchase and sale contracts arebasis. primarily settled through delivery of agricultural commodities.
While Bunge considers these exchange traded futures andForeign exchange derivatives and hedging activities – Bunge uses a forward purchase and sale contracts to be effective economiccombination of foreign exchange forward, swap and option hedges, Bunge does not designate or account for the majoritycontracts in certain of its operations to mitigate the risk from of its commodity contracts as hedges. The forward contractsexchange rate fluctuations in connection with certain require performance of both Bunge and the contractcommercial and balance sheet exposures. The foreign counterparty in future periods. Contracts to purchaseexchange forward and option contracts may be designated as agricultural commodities generally relate to current or futurecash flow hedges. Bunge may also use net investment hedges crop years for delivery periods quoted by regulated commodityto partially offset the translation adjustments arising from the exchanges. Contracts for the sale of agricultural commoditiesremeasurement of its investment in certain of its foreign generally do not extend beyond one future crop cycle.subsidiaries.
F-28 2016 Bunge Annual Report
BUNGE LIMITED AND SUBSIDIARIESNOTES TO THE CONSOLIDATED FINANCIAL STATEMENTS

F-29
The table below summarizes the open energy positions.14. FINANCIAL INSTRUMENTS AND FAIR VALUEMEASUREMENTS (Continued)
DECEMBER 31, 2016The table below summarizes the volumes of open agricultural EXCHANGEcommodities derivative positions. TRADED NON-EXCHANGE
CLEAREDNET (SHORT) UNIT OFDECEMBER 31, 2016& LONG(1) (SHORT)(2) LONG(2) MEASURE(3)
EXCHANGE TRADED NON-EXCHANGENatural Gas(3)
TRADEDNET (SHORT) UNIT OF Futures 3,930,000 – – MMBtus& LONG(1) (SHORT)(2) LONG(2) MEASURE Swaps – – 1,351,351 MMBtus
Energy - OtherAgriculturalFutures 1,777 – – Metric TonsCommoditiesForwards – – 6,048,869 Metric TonsFutures (6,914,908) – – Metric TonsSwaps 215,100 – – Metric TonsOptions (334,494) – – Metric TonsOptions (1,285) – – Metric TonsForwards – (35,672,883) 25,960,476 Metric Tons
Swaps – (3,326,874) 1,442,144 Metric Tons (1) Exchange traded and cleared derivatives are presented on a net (short) and longposition basis.(1) Exchange traded derivatives are presented on a net (short) and long position basis.
(2) Non-exchange cleared derivatives are presented on a gross (short) and long position(2) Non-exchange traded derivatives are presented on a gross (short) and long positionbasis.basis.
(3) Million British Thermal Units (‘‘MMBtus’’) are standard units of measurement used toOcean freight derivatives – Bunge uses derivative instruments denote an amount of electricity and natural gas, respectively.referred to as freight forward agreements (FFAs) and FFAoptions to hedge portions of its current and anticipated ocean The Effect of Financial Instruments on the Consolidatedfreight costs. Changes in the fair values of ocean freight Statements of Incomederivatives that are not designated as hedges are recorded inearnings. There were no designated hedges at December 31, The table below summarizes the effect of derivative2016 and 2015, respectively. instruments that are designated as fair value hedges and also
derivative instruments that are undesignated on theThe table below summarizes the open ocean freight positions. consolidated statements of income for the years ended
December 31, 2016 and 2015.DECEMBER 31, 2016
GAIN OR (LOSS)EXCHANGE CLEARED NON-EXCHANGERECOGNIZED IN
CLEARED INCOME ONNET (SHORT) UNIT OFDERIVATIVE& LONG(1) (SHORT)(2) LONG(2) MEASURE
INSTRUMENTS
Ocean Freight DECEMBER 31,
FFA (3,165) – – Hire Days (US$ in millions) Location 2016 2015FFA Options (467) – – Hire Days
DesignatedDerivative(1) Exchange cleared derivatives are presented on a net (short) and long position basis.Contracts:
Interest Rate Interest income/Interest expense $ 5 $ –(2) Non-exchange cleared derivatives are presented on a gross (short) and long positionbasis. Total $ 5 $ –
UndesignatedEnergy derivatives – Bunge uses energy derivative instrumentsDerivative
for various purposes including to manage its exposure to Contracts:volatility in energy costs. Bunge’s operations use energy, Interest Rate Interest income/Interest expense $ (4) $ –
Interest Rate Other income (expense) - net – (2)including electricity, natural gas, coal, and fuel oil, includingForeign Exchange Foreign exchange gains (losses) 267 (302)bunker fuel. Foreign Exchange Cost of goods sold 772 (620)Commodities Cost of goods sold (618) 1,062Freight Cost of goods sold 8 6Energy Cost of goods sold 19 (25)
Total $ 444 $ 119
2016 Bunge Annual Report F-29
BUNGE LIMITED AND SUBSIDIARIESNOTES TO THE CONSOLIDATED FINANCIAL STATEMENTS

F-30
14. FINANCIAL INSTRUMENTS AND FAIR VALUE MEASUREMENTS (Continued)
The table below summarizes the effect of financial instruments that are designated and qualify as cash flow and net investmenthedges on the consolidated statement of income.
YEAR ENDED DECEMBER 31, 2016
GAIN ORGAIN OR (LOSS) RECLASSIFIED
(LOSS)FROM ACCUMULATED OCI GAIN OR (LOSS) RECOGNIZED IN
RECOGNIZED ININTO INCOME(1) INCOME ON DERIVATIVES
NOTIONAL ACCUMULATED(US$ in millions) AMOUNT OCI(1) LOCATION AMOUNT LOCATION AMOUNT(2)
Cash Flow Hedge:Foreign Exchange(3) . . . . . . . . . . . . . . . . . . . . . . . . . . . . . . . $ 181 $ 48 Foreign exchange gains Foreign exchange gains
(losses) $ 16 (losses) $ –
Total . . . . . . . . . . . . . . . . . . . . . . . . . . . . . . . . . . . . . . . . . . . . . . . . . . . . $181 $ 48 $16 $ –
Net Investment Hedge:Foreign Currency denominated debt(4) . . . . . . . $ 881 $ 41 Foreign currency Foreign currency
denominated debt $ – denominated debt $ –Foreign Exchange(3) . . . . . . . . . . . . . . . . . . . . . . . . . . . . . . . $ – $ (394) Foreign exchange gains Foreign exchange gains
(losses) $ – (losses) $ –
Total . . . . . . . . . . . . . . . . . . . . . . . . . . . . . . . . . . . . . . . . . . . . . . . . . . . . $881 $(353) $ – $ –
(1) The gain (loss) recognized relates to the effective portion of the hedging relationship. At December 31, 2016, Bunge expects to reclassify into income in the next 12 months$44 million of after-tax loss related to its foreign exchange cash flow hedges and nil for net investment hedges.
(2) There was no gain or loss recognized in income relating to the ineffective portion of the hedging relationships or relating to amounts excluded from the assessment of hedgeeffectiveness.
(3) The foreign exchange contracts mature at various dates through January 2018.
(4) The euro loans mature in 2023.
The table below summarizes the effect of financial instruments that are designated and qualify as cash flow hedges on thecondensed consolidated statement of income for the year ended December 31, 2015.
YEAR ENDED DECEMBER 31, 2015
GAIN ORGAIN OR (LOSS) RECLASSIFIED(LOSS)
FROM ACCUMULATED OCI GAIN OR (LOSS) RECOGNIZED INRECOGNIZED ININTO INCOME(1) INCOME ON DERIVATIVESNOTIONAL ACCUMULATED
(US$ in millions) AMOUNT OCI(1) LOCATION AMOUNT LOCATION AMOUNT(2)
Cash Flow Hedge:Foreign Exchange(3) . . . . . . . . . . . . . . . . . . . . . . . . . . . . . . . $ 238 $ 76 Foreign exchange gains Foreign exchange gains
(losses) $ (76) (losses) $-
Total . . . . . . . . . . . . . . . . . . . . . . . . . . . . . . . . . . . . . . . . . . . . . . . . . . . . $ 238 $ 76 $ (76) $-
Net Investment Hedge:Foreign Exchange(3) . . . . . . . . . . . . . . . . . . . . . . . . . . . . . . . $ 1,878 $ 223 Foreign exchange gains Foreign exchange gains
(losses) $ - (losses) $-
Total . . . . . . . . . . . . . . . . . . . . . . . . . . . . . . . . . . . . . . . . . . . . . . . . . . . . $1,878 $223 $ - $-
(1) The gain or (loss) recognized relates to the effective portion of the hedging relationship. At December 31, 2015, Bunge expected to reclassify into income in the next 12 monthsapproximately $76 million of after-tax gains (losses) related to its foreign exchange cash flow hedges and nil for net investment hedges.
(2) There was no gain or loss recognized in income relating to the ineffective portion of the hedging relationships or to amounts excluded from the assessment of hedge effectiveness.
(3) The foreign exchange contracts matured at various dates through November 2020.
F-30 2016 Bunge Annual Report
BUNGE LIMITED AND SUBSIDIARIESNOTES TO THE CONSOLIDATED FINANCIAL STATEMENTS
F-31
15. SHORT-TERM DEBT AND CREDIT FACILITIES 16. LONG-TERM DEBT AND CREDIT FACILITIES
Bunge’s short-term borrowings are typically sourced from Long-term debt obligations are summarized below.various banking institutions and the U.S. commercial paper
DECEMBER 31,market. Bunge also borrows from time to time in local(US$ in millions) 2016 2015currencies in various foreign jurisdictions. Interest expense
includes facility commitment fees, amortization of deferred Revolving credit facilities $ - $ 752financing costs and charges on certain lending transactions, Term loan due 2019 – three-month Yen LIBOR plusincluding certain intercompany loans and foreign currency 0.75% (Tranche A) 243 237conversions in Brazil. The weighted-average interest rate on Term loan due 2019 – fixed Yen interest rate of 0.96%short-term borrowings at December 31, 2016 and 2015 was (Tranche B) 51 508.69% and 4.92%, respectively. Term loan due 2019 – three-month LIBOR plus 1.30%
(Tranche C) 85 854.10% Senior Notes due 2016 - 500DECEMBER 31,5.90% Senior Notes due 2017 250 250(US$ in millions) 2016 20153.20% Senior Notes due 2017 600 600
Lines of credit: 8.50% Senior Notes due 2019 600 600Secured, variable interest rate of 2.33% $ - $ 25 3.50% Senior Notes due 2020 497 497Unsecured, variable interest rates from 1.27% to 32.00%(1) 257 623 1.85% Senior Notes due 2023 – Euro 843 -
3.25% Senior Notes due 2026 694 -Total short-term debt $257 $648Consolidated investment fund debt(1) - 53Other 144 171
(1) Includes $148 million and $137 million of local currency borrowings in certain Centraland Eastern European, South American, South African and Asia-Pacific countries at a Subtotal 4,007 3,795weighted-average interest rate of 13.63% and 15.54% as of December 31, 2016 and 2015, Less: Current portion of long-term debt (938) (869)respectively.
Total long-term debt $3,069 $2,926
Bunge’s commercial paper program is supported by an(1) There is no consolidated investment fund debt as of December 31, 2016. Bungeidentical amount of committed back up bank credit lines (the elected to account for $53 million at fair value as of December 31, 2015.
‘‘Liquidity Facility’’) provided by banks that are rated at leastA-1 by Standard & Poor’s Financial Services and P-1 by The fair values of long-term debt, including current portion, atMoody’s Investors Service. On November 20, 2014, Bunge December 31, 2016 and 2015 $4,163 million and $3,940 million,entered into an unsecured $600 million five-year Liquidity respectively, are calculated based on interest rates currentlyFacility with certain lenders party thereto. The Liquidity Facility available on comparable maturities to companies with creditreplaced the then existing $600 million five-year liquidity facility, standing similar to that of Bunge. The carrying amounts anddated as of November 17, 2011. The cost of borrowing under fair values of long-term debt are as follows:the Liquidity Facility would typically be higher than the cost ofissuing under Bunge’s commercial paper program. At DECEMBER 31, 2016 DECEMBER 31, 2015December 31, 2016 and December 31, 2015, there were no FAIR FAIR FAIR FAIRborrowings outstanding under the commercial paper program CARRYING VALUE VALUE CARRYING VALUE VALUE
(US$ in millions) VALUE (LEVEL 2) (LEVEL 3) VALUE (LEVEL 2) (LEVEL 3)and no borrowings under the Liquidity Facility.
Long-term debt,In addition to the committed facilities discussed above, fromincluding
time-to-time, Bunge Limited and/or its financing subsidiaries current portion $4,007 $4,163 $ - $3,795 $3,887 $53enter into uncommitted bilateral short-term credit lines asnecessary based on its financing requirements. At
On August 15, 2016, Bunge completed the sale of $700 millionDecember 31, 2016 and 2015, nil and nil were outstandingaggregate principal amount of 3.25% senior notes dueunder these bilateral short-term credit lines, respectively. LoansAugust 15, 2026. The unsecured senior notes were issued byunder such credit lines are non-callable by the respectiveBunge’s 100% owned finance subsidiary, Bunge Limitedlenders. In addition, Bunge’s operating companies hadFinance Corp., and are fully and unconditionally guaranteed by$257 million in short-term borrowings outstanding from localBunge. The offering was made pursuant to a registrationbank lines of credit at December 31, 2016 to support workingstatement filed with the U.S. Securities and Exchangecapital requirements.Commission. The net proceeds of $695 million were used forgeneral corporate purposes, including, but not limited to, the
2016 Bunge Annual Report F-31
BUNGE LIMITED AND SUBSIDIARIESNOTES TO THE CONSOLIDATED FINANCIAL STATEMENTS
F-32
(1) Excludes changes in long-term debt attributable to fair value hedge accounting of16. LONG-TERM DEBT AND CREDIT FACILITIES$17 million.
(Continued)Bunge’s credit facilities and certain senior notes require it to
repayment of outstanding indebtedness, which includes comply with specified financial covenants related to minimumindebtedness under revolving credit facilities. net worth, minimum current ratio, a maximum debt to
capitalization ratio and limitations on secured indebtedness.On June 24, 2016, Bunge completed the refinancing on a Bunge was in compliance with these covenants at$200 million three-year committed unsecured bilateral revolving December 31, 2016.credit facility, to mature on June 24, 2019. A further$500 million of unsecured bilateral revolving credit facilities During the years ended December 31, 2016, 2015 and 2014,were refinanced on September 23, 2016 to mature on Bunge paid interest, net of interest capitalized, of $234 million,September 23, 2019. Borrowings under these facilities bear $227 million and $223 million, respectively.interest at LIBOR plus a margin, which will vary from 0.65% to1.40% per annum based on the credit ratings on its senior
17. TRADE RECEIVABLES SECURITIZATION PROGRAMlong-term unsecured debt. Amounts under the Facilities thatremain undrawn are subject to a commitment fee payable at a
Bunge and certain of its subsidiaries participate in a traderate ranging from 0.20% to 0.25%.receivables securitization program (‘‘Program’’) with a financialinstitution, as administrative agent, and certain commercialOn June 16, 2016, Bunge completed the sale of 600 millionpaper conduit purchasers and committed purchaserseuro (approximately $670 million) aggregate principal amount(collectively, the Purchasers) that provides for funding of up toof 1.85% senior notes due June 16, 2023 (‘‘Notes’’).$700 million against receivables sold into the Program. TheAdditionally, on November 17, 2016 Bunge completed the saleProgram is designed to enhance Bunge’s financial flexibility byof 200 million euro (approximately $214 million) of the Notesproviding an additional source of liquidity for its operations. Inbringing the aggregate principal amount to 800 million euro.connection with the Program, certain of Bunge’s U.S. andThe Notes were issued by Bunge’s 100% owned financenon-U.S. subsidiaries that originate trade receivables may sellsubsidiary, Bunge Finance Europe B.V., and are fully andeligible receivables in their entirety on a revolving basis to aunconditionally guaranteed by Bunge. The offering was madeconsolidated bankruptcy remote special purpose entity, Bungepursuant to a registration statement filed with the U.S.Securitization B.V. (‘‘BSBV’’) formed under the laws of TheSecurities and Exchange Commission. The aggregated netNetherlands. BSBV in turn sells such purchased tradeproceeds of 802 million euro (approximately $887 million) werereceivables to the administrative agent (acting on behalf of theused for general corporate purposes, including, but not limitedPurchasers) pursuant to a receivables transfer agreement. Into the repayment of outstanding indebtedness, which includesconnection with these sales of accounts receivable, Bungeindebtedness under revolving credit facilities.receives a portion of the proceeds up front and an additionalamount upon the collection of the underlying receivables,At December 31, 2016, Bunge had $5,015 million of unusedwhich is expected to be generally between 10% and 15% ofand available borrowing capacity under its committedthe aggregate amount of receivables sold through the Program.long-term credit facilities with a number of lending institutions.
Koninklijke Bunge B.V., a wholly owned subsidiary of Bunge,Certain land, property, equipment and investments inacts as master servicer, responsible for servicing and collectingconsolidated subsidiaries having a net carrying value ofthe accounts receivable for the Program. The Programapproximately $63 million at December 31, 2016 have beenterminates on May 26, 2021. The trade receivables sold undermortgaged or otherwise collateralized against long-term debt ofthe program are subject to specified eligibility criteria, including$41 million at December 31, 2016.eligible currencies, and country and obligor concentration
Principal Maturities – Principal maturities of long-term debt at limits.December 31, 2016 are as follows:
The table below summarizes the cash flows and discounts of(US$ in millions) Bunge’s trade receivables associated with the Program.
2017 $ 9382018 142019 9922020 5112021 18Thereafter 1,551
Total(1) $4,024
F-32 2016 Bunge Annual Report
BUNGE LIMITED AND SUBSIDIARIESNOTES TO THE CONSOLIDATED FINANCIAL STATEMENTS
F-33
Delinquencies and credit losses on trade receivables sold17. TRADE RECEIVABLES SECURITIZATION PROGRAMunder the Program during the years ended December 31, 2016(Continued)and 2015 were insignificant. Bunge has reflected all cash flowsunder the Program as operating cash flows in the consolidatedServicing fees under the Program were not significant in anystatements of cash flows for the years ended December 31,period.2016, 2015 and 2014.
DECEMBER 31,(US$ in millions) 2016 2015 18. EMPLOYEE BENEFIT PLANSReceivables sold which were derecognized on Bunge
balance sheet $ 628 $ 524 Certain U.S., Canadian, European and Brazilian basedsubsidiaries of Bunge sponsor non-contributory defined benefitProceeds received in cash related to transfer ofpension plans covering substantially all employees of thereceivables $9,197 $10,396subsidiaries. The plans provide benefits based primarily on
Cash collections from customers on receivables participants’ salary and length of service. The funding policiespreviously sold $9,176 $10,542 for Bunge’s defined benefit pension plans are determined in
Gross receivables sold $9,405 $10,601 accordance with statutory funding requirements. The mostsignificant defined benefit plan is in the United States. The U.S.funding policy requires at least those amounts required by the
DECEMBER 31,Pension Protection Act of 2006. Assets of the plans consist(US$ in millions) 2016 2015 2014primarily of equity and fixed income investments.
Discounts related to gross receivables soldincluded in SG&A $6 $5 $7 Certain United States and Brazil based subsidiaries of Bunge
have benefit plans to provide certain postretirement healthcarebenefits to eligible retired employees of those subsidiaries. TheDECEMBER 31,plans require minimum retiree contributions and define the(US$ in millions) 2016 2015maximum amount the subsidiaries will be obligated to pay
Deferred purchase price included in other current assets $87 $79 under the plans. Bunge’s policy is to fund these costs as theybecome payable.
Bunge’s risk of loss following the sale of the trade receivablesPlan Amendments and Transfers In and Out – There were nois limited to the deferred purchase price (‘‘DPP’’), and issignificant amendments, settlements or transfers into or out ofincluded in other current assets in the consolidated balanceBunge’s employee benefit plans during the years endedsheets (see Note 5). The DPP will be repaid in cash asDecember 31, 2016 or 2015.receivables are collected, generally within 30 days.
2016 Bunge Annual Report F-33
BUNGE LIMITED AND SUBSIDIARIESNOTES TO THE CONSOLIDATED FINANCIAL STATEMENTS
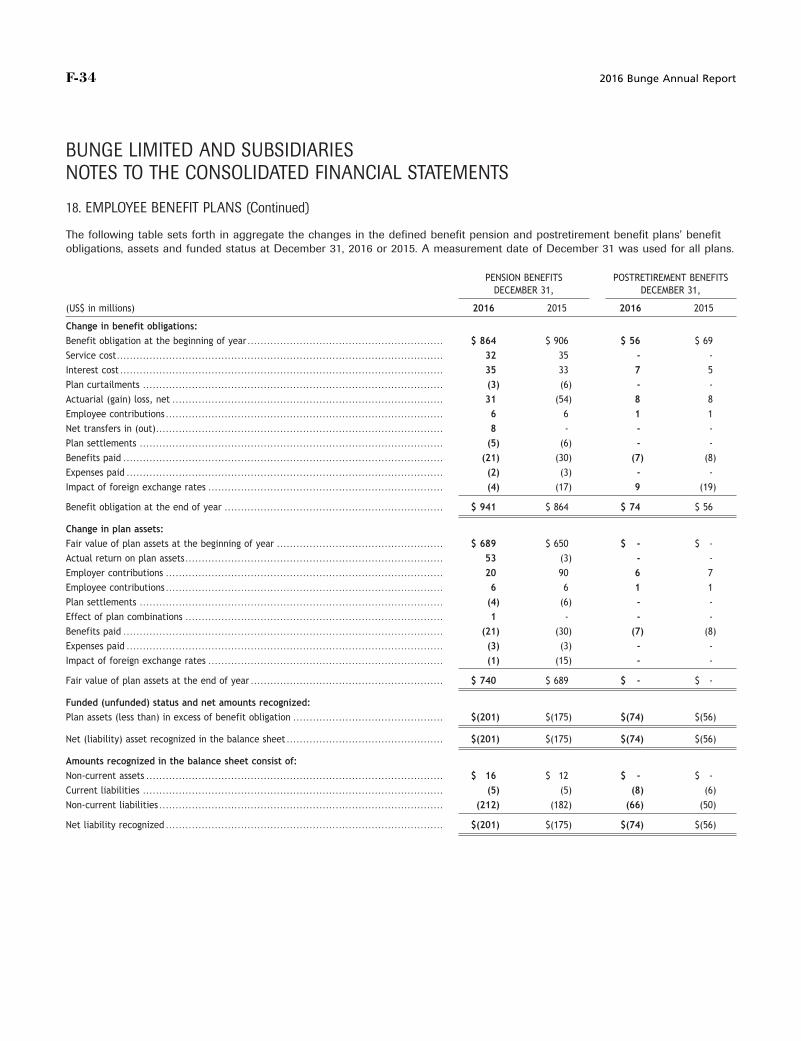
F-34
18. EMPLOYEE BENEFIT PLANS (Continued)
The following table sets forth in aggregate the changes in the defined benefit pension and postretirement benefit plans’ benefitobligations, assets and funded status at December 31, 2016 or 2015. A measurement date of December 31 was used for all plans.
PENSION BENEFITS POSTRETIREMENT BENEFITSDECEMBER 31, DECEMBER 31,
(US$ in millions) 2016 2015 2016 2015
Change in benefit obligations:
Benefit obligation at the beginning of year . . . . . . . . . . . . . . . . . . . . . . . . . . . . . . . . . . . . . . . . . . . . . . . . . . . . . . . . . . . . $ 864 $ 906 $ 56 $ 69
Service cost . . . . . . . . . . . . . . . . . . . . . . . . . . . . . . . . . . . . . . . . . . . . . . . . . . . . . . . . . . . . . . . . . . . . . . . . . . . . . . . . . . . . . . . . . . . . . . . . . . . . 32 35 - -
Interest cost . . . . . . . . . . . . . . . . . . . . . . . . . . . . . . . . . . . . . . . . . . . . . . . . . . . . . . . . . . . . . . . . . . . . . . . . . . . . . . . . . . . . . . . . . . . . . . . . . . . 35 33 7 5
Plan curtailments . . . . . . . . . . . . . . . . . . . . . . . . . . . . . . . . . . . . . . . . . . . . . . . . . . . . . . . . . . . . . . . . . . . . . . . . . . . . . . . . . . . . . . . . . . . . (3) (6) - -
Actuarial (gain) loss, net . . . . . . . . . . . . . . . . . . . . . . . . . . . . . . . . . . . . . . . . . . . . . . . . . . . . . . . . . . . . . . . . . . . . . . . . . . . . . . . . . . . 31 (54) 8 8
Employee contributions . . . . . . . . . . . . . . . . . . . . . . . . . . . . . . . . . . . . . . . . . . . . . . . . . . . . . . . . . . . . . . . . . . . . . . . . . . . . . . . . . . . . . 6 6 1 1
Net transfers in (out) . . . . . . . . . . . . . . . . . . . . . . . . . . . . . . . . . . . . . . . . . . . . . . . . . . . . . . . . . . . . . . . . . . . . . . . . . . . . . . . . . . . . . . . . 8 - - -
Plan settlements . . . . . . . . . . . . . . . . . . . . . . . . . . . . . . . . . . . . . . . . . . . . . . . . . . . . . . . . . . . . . . . . . . . . . . . . . . . . . . . . . . . . . . . . . . . . . (5) (6) - -
Benefits paid . . . . . . . . . . . . . . . . . . . . . . . . . . . . . . . . . . . . . . . . . . . . . . . . . . . . . . . . . . . . . . . . . . . . . . . . . . . . . . . . . . . . . . . . . . . . . . . . . . (21) (30) (7) (8)
Expenses paid . . . . . . . . . . . . . . . . . . . . . . . . . . . . . . . . . . . . . . . . . . . . . . . . . . . . . . . . . . . . . . . . . . . . . . . . . . . . . . . . . . . . . . . . . . . . . . . . . (2) (3) - -
Impact of foreign exchange rates . . . . . . . . . . . . . . . . . . . . . . . . . . . . . . . . . . . . . . . . . . . . . . . . . . . . . . . . . . . . . . . . . . . . . . . . (4) (17) 9 (19)
Benefit obligation at the end of year . . . . . . . . . . . . . . . . . . . . . . . . . . . . . . . . . . . . . . . . . . . . . . . . . . . . . . . . . . . . . . . . . . . $ 941 $ 864 $ 74 $ 56
Change in plan assets:
Fair value of plan assets at the beginning of year . . . . . . . . . . . . . . . . . . . . . . . . . . . . . . . . . . . . . . . . . . . . . . . . . . . $ 689 $ 650 $ - $ -
Actual return on plan assets . . . . . . . . . . . . . . . . . . . . . . . . . . . . . . . . . . . . . . . . . . . . . . . . . . . . . . . . . . . . . . . . . . . . . . . . . . . . . . . 53 (3) - -
Employer contributions . . . . . . . . . . . . . . . . . . . . . . . . . . . . . . . . . . . . . . . . . . . . . . . . . . . . . . . . . . . . . . . . . . . . . . . . . . . . . . . . . . . . . 20 90 6 7
Employee contributions . . . . . . . . . . . . . . . . . . . . . . . . . . . . . . . . . . . . . . . . . . . . . . . . . . . . . . . . . . . . . . . . . . . . . . . . . . . . . . . . . . . . . 6 6 1 1
Plan settlements . . . . . . . . . . . . . . . . . . . . . . . . . . . . . . . . . . . . . . . . . . . . . . . . . . . . . . . . . . . . . . . . . . . . . . . . . . . . . . . . . . . . . . . . . . . . . (4) (6) - -
Effect of plan combinations . . . . . . . . . . . . . . . . . . . . . . . . . . . . . . . . . . . . . . . . . . . . . . . . . . . . . . . . . . . . . . . . . . . . . . . . . . . . . . . 1 - - -
Benefits paid . . . . . . . . . . . . . . . . . . . . . . . . . . . . . . . . . . . . . . . . . . . . . . . . . . . . . . . . . . . . . . . . . . . . . . . . . . . . . . . . . . . . . . . . . . . . . . . . . . (21) (30) (7) (8)
Expenses paid . . . . . . . . . . . . . . . . . . . . . . . . . . . . . . . . . . . . . . . . . . . . . . . . . . . . . . . . . . . . . . . . . . . . . . . . . . . . . . . . . . . . . . . . . . . . . . . . . (3) (3) - -
Impact of foreign exchange rates . . . . . . . . . . . . . . . . . . . . . . . . . . . . . . . . . . . . . . . . . . . . . . . . . . . . . . . . . . . . . . . . . . . . . . . . (1) (15) - -
Fair value of plan assets at the end of year . . . . . . . . . . . . . . . . . . . . . . . . . . . . . . . . . . . . . . . . . . . . . . . . . . . . . . . . . . . $ 740 $ 689 $ - $ -
Funded (unfunded) status and net amounts recognized:
Plan assets (less than) in excess of benefit obligation . . . . . . . . . . . . . . . . . . . . . . . . . . . . . . . . . . . . . . . . . . . . . . $(201) $(175) $(74) $(56)
Net (liability) asset recognized in the balance sheet . . . . . . . . . . . . . . . . . . . . . . . . . . . . . . . . . . . . . . . . . . . . . . . . $(201) $(175) $(74) $(56)
Amounts recognized in the balance sheet consist of:
Non-current assets . . . . . . . . . . . . . . . . . . . . . . . . . . . . . . . . . . . . . . . . . . . . . . . . . . . . . . . . . . . . . . . . . . . . . . . . . . . . . . . . . . . . . . . . . . . $ 16 $ 12 $ - $ -
Current liabilities . . . . . . . . . . . . . . . . . . . . . . . . . . . . . . . . . . . . . . . . . . . . . . . . . . . . . . . . . . . . . . . . . . . . . . . . . . . . . . . . . . . . . . . . . . . . (5) (5) (8) (6)
Non-current liabilities . . . . . . . . . . . . . . . . . . . . . . . . . . . . . . . . . . . . . . . . . . . . . . . . . . . . . . . . . . . . . . . . . . . . . . . . . . . . . . . . . . . . . . . (212) (182) (66) (50)
Net liability recognized . . . . . . . . . . . . . . . . . . . . . . . . . . . . . . . . . . . . . . . . . . . . . . . . . . . . . . . . . . . . . . . . . . . . . . . . . . . . . . . . . . . . . $(201) $(175) $(74) $(56)
F-34 2016 Bunge Annual Report
BUNGE LIMITED AND SUBSIDIARIESNOTES TO THE CONSOLIDATED FINANCIAL STATEMENTS
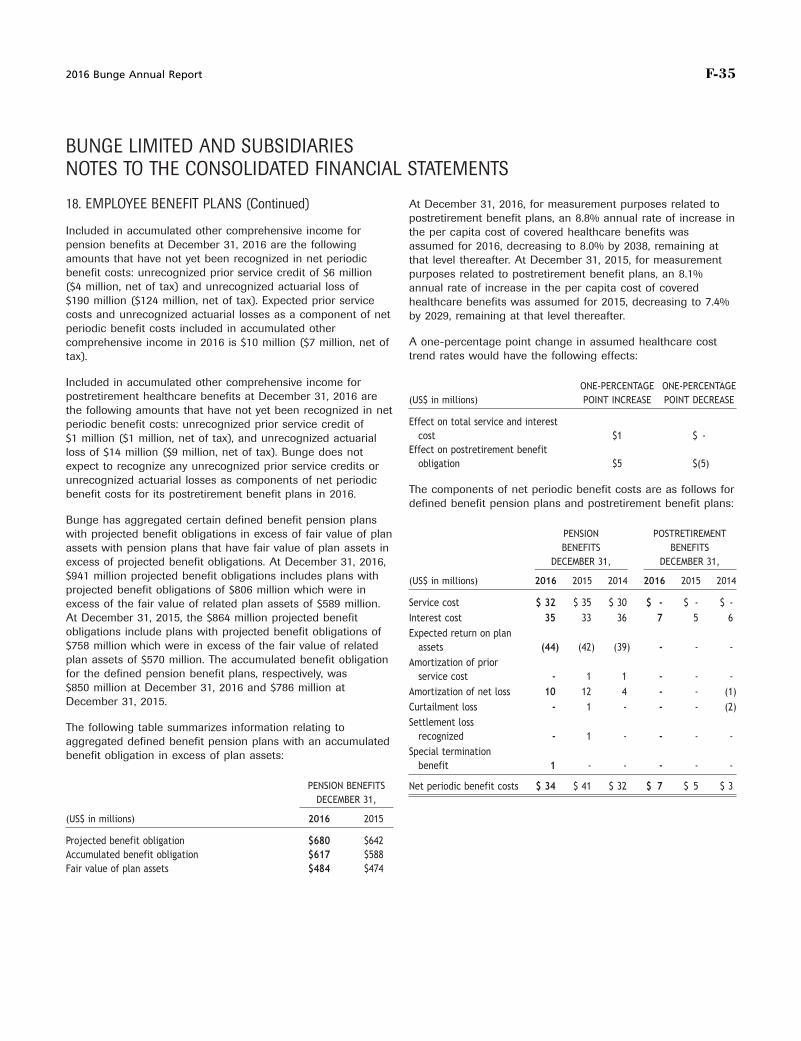
F-35
At December 31, 2016, for measurement purposes related to18. EMPLOYEE BENEFIT PLANS (Continued)postretirement benefit plans, an 8.8% annual rate of increase in
Included in accumulated other comprehensive income for the per capita cost of covered healthcare benefits waspension benefits at December 31, 2016 are the following assumed for 2016, decreasing to 8.0% by 2038, remaining atamounts that have not yet been recognized in net periodic that level thereafter. At December 31, 2015, for measurementbenefit costs: unrecognized prior service credit of $6 million purposes related to postretirement benefit plans, an 8.1%($4 million, net of tax) and unrecognized actuarial loss of annual rate of increase in the per capita cost of covered$190 million ($124 million, net of tax). Expected prior service healthcare benefits was assumed for 2015, decreasing to 7.4%costs and unrecognized actuarial losses as a component of net by 2029, remaining at that level thereafter.periodic benefit costs included in accumulated other
A one-percentage point change in assumed healthcare costcomprehensive income in 2016 is $10 million ($7 million, net oftrend rates would have the following effects:tax).
Included in accumulated other comprehensive income for ONE-PERCENTAGE ONE-PERCENTAGEpostretirement healthcare benefits at December 31, 2016 are (US$ in millions) POINT INCREASE POINT DECREASEthe following amounts that have not yet been recognized in net
Effect on total service and interestperiodic benefit costs: unrecognized prior service credit ofcost $1 $ -$1 million ($1 million, net of tax), and unrecognized actuarial
Effect on postretirement benefitloss of $14 million ($9 million, net of tax). Bunge does notobligation $5 $(5)expect to recognize any unrecognized prior service credits or
unrecognized actuarial losses as components of net periodicThe components of net periodic benefit costs are as follows forbenefit costs for its postretirement benefit plans in 2016.defined benefit pension plans and postretirement benefit plans:
Bunge has aggregated certain defined benefit pension plansPENSION POSTRETIREMENTwith projected benefit obligations in excess of fair value of planBENEFITS BENEFITSassets with pension plans that have fair value of plan assets in
DECEMBER 31, DECEMBER 31,excess of projected benefit obligations. At December 31, 2016,$941 million projected benefit obligations includes plans with (US$ in millions) 2016 2015 2014 2016 2015 2014projected benefit obligations of $806 million which were in
Service cost $ 32 $ 35 $ 30 $ - $ - $ -excess of the fair value of related plan assets of $589 million.At December 31, 2015, the $864 million projected benefit Interest cost 35 33 36 7 5 6obligations include plans with projected benefit obligations of Expected return on plan$758 million which were in excess of the fair value of related assets (44) (42) (39) - - -plan assets of $570 million. The accumulated benefit obligation Amortization of priorfor the defined pension benefit plans, respectively, was service cost - 1 1 - - -$850 million at December 31, 2016 and $786 million at Amortization of net loss 10 12 4 - - (1)December 31, 2015. Curtailment loss - 1 - - - (2)
Settlement lossThe following table summarizes information relating torecognized - 1 - - - -aggregated defined benefit pension plans with an accumulated
Special terminationbenefit obligation in excess of plan assets:benefit 1 - - - - -
PENSION BENEFITS Net periodic benefit costs $ 34 $ 41 $ 32 $ 7 $ 5 $ 3DECEMBER 31,
(US$ in millions) 2016 2015
Projected benefit obligation $680 $642Accumulated benefit obligation $617 $588Fair value of plan assets $484 $474
2016 Bunge Annual Report F-35
BUNGE LIMITED AND SUBSIDIARIESNOTES TO THE CONSOLIDATED FINANCIAL STATEMENTS
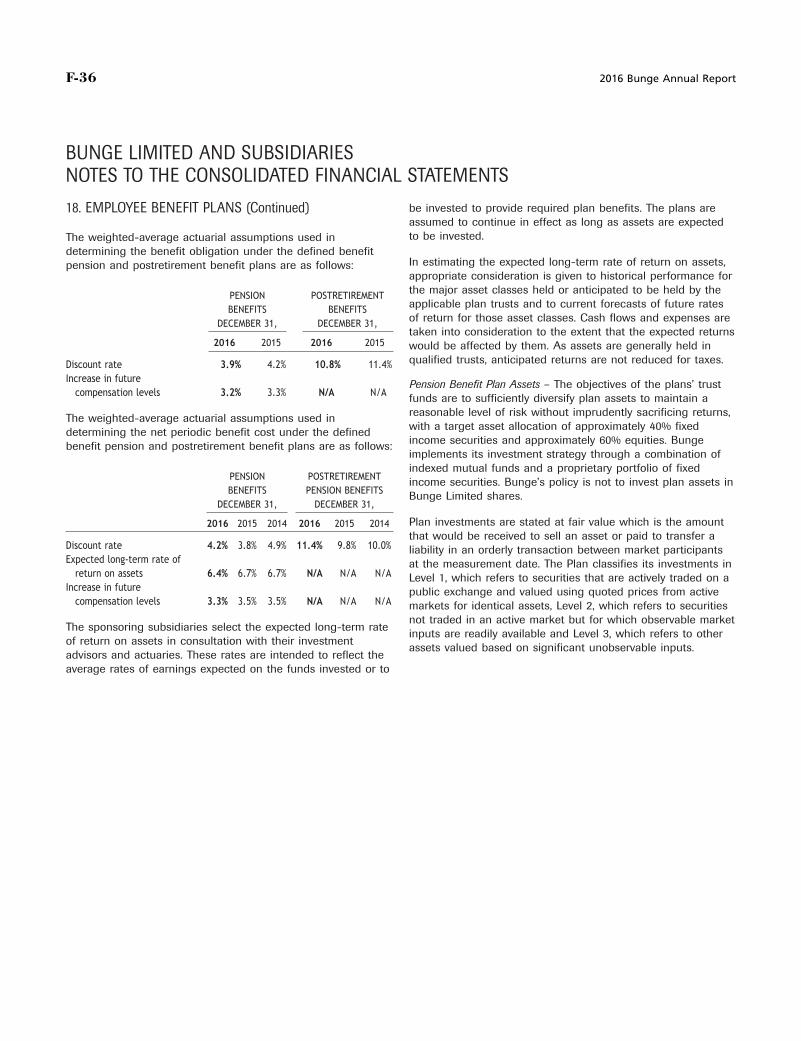
F-36
be invested to provide required plan benefits. The plans are18. EMPLOYEE BENEFIT PLANS (Continued)assumed to continue in effect as long as assets are expectedto be invested.The weighted-average actuarial assumptions used in
determining the benefit obligation under the defined benefitIn estimating the expected long-term rate of return on assets,pension and postretirement benefit plans are as follows:appropriate consideration is given to historical performance forthe major asset classes held or anticipated to be held by thePENSION POSTRETIREMENTapplicable plan trusts and to current forecasts of future ratesBENEFITS BENEFITSof return for those asset classes. Cash flows and expenses areDECEMBER 31, DECEMBER 31,taken into consideration to the extent that the expected returns
2016 2015 2016 2015 would be affected by them. As assets are generally held inqualified trusts, anticipated returns are not reduced for taxes.Discount rate 3.9% 4.2% 10.8% 11.4%
Increase in future Pension Benefit Plan Assets – The objectives of the plans’ trustcompensation levels 3.2% 3.3% N/A N/A funds are to sufficiently diversify plan assets to maintain a
reasonable level of risk without imprudently sacrificing returns,The weighted-average actuarial assumptions used inwith a target asset allocation of approximately 40% fixeddetermining the net periodic benefit cost under the definedincome securities and approximately 60% equities. Bungebenefit pension and postretirement benefit plans are as follows:implements its investment strategy through a combination ofindexed mutual funds and a proprietary portfolio of fixed
PENSION POSTRETIREMENT income securities. Bunge’s policy is not to invest plan assets inBENEFITS PENSION BENEFITS Bunge Limited shares.
DECEMBER 31, DECEMBER 31,
Plan investments are stated at fair value which is the amount2016 2015 2014 2016 2015 2014that would be received to sell an asset or paid to transfer a
Discount rate 4.2% 3.8% 4.9% 11.4% 9.8% 10.0% liability in an orderly transaction between market participantsExpected long-term rate of at the measurement date. The Plan classifies its investments in
return on assets 6.4% 6.7% 6.7% N/A N/A N/A Level 1, which refers to securities that are actively traded on aIncrease in future public exchange and valued using quoted prices from active
compensation levels 3.3% 3.5% 3.5% N/A N/A N/A markets for identical assets, Level 2, which refers to securitiesnot traded in an active market but for which observable market
The sponsoring subsidiaries select the expected long-term rate inputs are readily available and Level 3, which refers to otherof return on assets in consultation with their investment assets valued based on significant unobservable inputs.advisors and actuaries. These rates are intended to reflect theaverage rates of earnings expected on the funds invested or to
F-36 2016 Bunge Annual Report
BUNGE LIMITED AND SUBSIDIARIESNOTES TO THE CONSOLIDATED FINANCIAL STATEMENTS
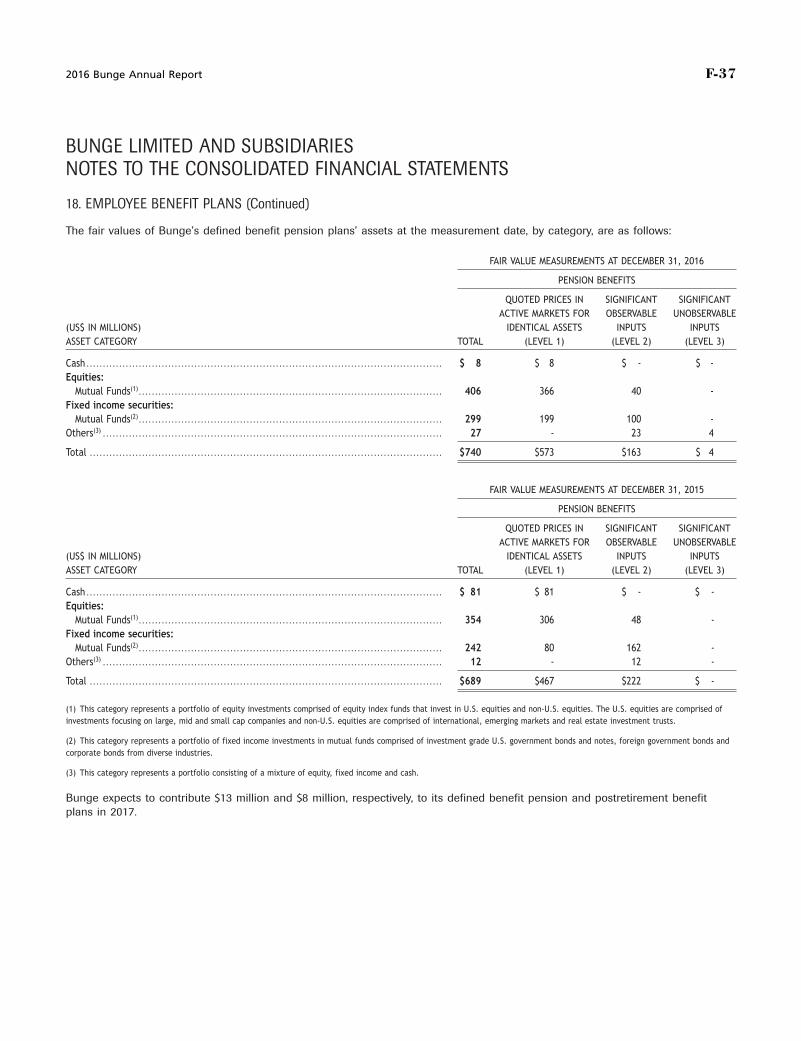
F-37
18. EMPLOYEE BENEFIT PLANS (Continued)
The fair values of Bunge’s defined benefit pension plans’ assets at the measurement date, by category, are as follows:
FAIR VALUE MEASUREMENTS AT DECEMBER 31, 2016
PENSION BENEFITS
QUOTED PRICES IN SIGNIFICANT SIGNIFICANTACTIVE MARKETS FOR OBSERVABLE UNOBSERVABLE
(US$ IN MILLIONS) IDENTICAL ASSETS INPUTS INPUTSASSET CATEGORY TOTAL (LEVEL 1) (LEVEL 2) (LEVEL 3)
Cash . . . . . . . . . . . . . . . . . . . . . . . . . . . . . . . . . . . . . . . . . . . . . . . . . . . . . . . . . . . . . . . . . . . . . . . . . . . . . . . . . . . . . . . . . . . . . . . . . . . . . . . . . . . . . $ 8 $ 8 $ - $ -Equities:
Mutual Funds(1) . . . . . . . . . . . . . . . . . . . . . . . . . . . . . . . . . . . . . . . . . . . . . . . . . . . . . . . . . . . . . . . . . . . . . . . . . . . . . . . . . . . . . . . . . . . . . 406 366 40 -Fixed income securities:
Mutual Funds(2) . . . . . . . . . . . . . . . . . . . . . . . . . . . . . . . . . . . . . . . . . . . . . . . . . . . . . . . . . . . . . . . . . . . . . . . . . . . . . . . . . . . . . . . . . . . . . 299 199 100 -Others(3) . . . . . . . . . . . . . . . . . . . . . . . . . . . . . . . . . . . . . . . . . . . . . . . . . . . . . . . . . . . . . . . . . . . . . . . . . . . . . . . . . . . . . . . . . . . . . . . . . . . . . . . . 27 - 23 4
Total . . . . . . . . . . . . . . . . . . . . . . . . . . . . . . . . . . . . . . . . . . . . . . . . . . . . . . . . . . . . . . . . . . . . . . . . . . . . . . . . . . . . . . . . . . . . . . . . . . . . . . . . . . . . $740 $573 $163 $ 4
FAIR VALUE MEASUREMENTS AT DECEMBER 31, 2015
PENSION BENEFITS
QUOTED PRICES IN SIGNIFICANT SIGNIFICANTACTIVE MARKETS FOR OBSERVABLE UNOBSERVABLE
(US$ IN MILLIONS) IDENTICAL ASSETS INPUTS INPUTSASSET CATEGORY TOTAL (LEVEL 1) (LEVEL 2) (LEVEL 3)
Cash . . . . . . . . . . . . . . . . . . . . . . . . . . . . . . . . . . . . . . . . . . . . . . . . . . . . . . . . . . . . . . . . . . . . . . . . . . . . . . . . . . . . . . . . . . . . . . . . . . . . . . . . . . . . . $ 81 $ 81 $ - $ -Equities:
Mutual Funds(1) . . . . . . . . . . . . . . . . . . . . . . . . . . . . . . . . . . . . . . . . . . . . . . . . . . . . . . . . . . . . . . . . . . . . . . . . . . . . . . . . . . . . . . . . . . . . . 354 306 48 -Fixed income securities:
Mutual Funds(2) . . . . . . . . . . . . . . . . . . . . . . . . . . . . . . . . . . . . . . . . . . . . . . . . . . . . . . . . . . . . . . . . . . . . . . . . . . . . . . . . . . . . . . . . . . . . . 242 80 162 -Others(3) . . . . . . . . . . . . . . . . . . . . . . . . . . . . . . . . . . . . . . . . . . . . . . . . . . . . . . . . . . . . . . . . . . . . . . . . . . . . . . . . . . . . . . . . . . . . . . . . . . . . . . . . 12 - 12 -
Total . . . . . . . . . . . . . . . . . . . . . . . . . . . . . . . . . . . . . . . . . . . . . . . . . . . . . . . . . . . . . . . . . . . . . . . . . . . . . . . . . . . . . . . . . . . . . . . . . . . . . . . . . . . . $689 $467 $222 $ -
(1) This category represents a portfolio of equity investments comprised of equity index funds that invest in U.S. equities and non-U.S. equities. The U.S. equities are comprised ofinvestments focusing on large, mid and small cap companies and non-U.S. equities are comprised of international, emerging markets and real estate investment trusts.
(2) This category represents a portfolio of fixed income investments in mutual funds comprised of investment grade U.S. government bonds and notes, foreign government bonds andcorporate bonds from diverse industries.
(3) This category represents a portfolio consisting of a mixture of equity, fixed income and cash.
Bunge expects to contribute $13 million and $8 million, respectively, to its defined benefit pension and postretirement benefitplans in 2017.
2016 Bunge Annual Report F-37
BUNGE LIMITED AND SUBSIDIARIESNOTES TO THE CONSOLIDATED FINANCIAL STATEMENTS
F-38
2014, respectively. At December 31, 2016 and 2015, Bunge had18. EMPLOYEE BENEFIT PLANS (Continued)approximately $33 million and $16 million of receivables fromthese ventures included in trade accounts receivable in theThe following benefit payments, which reflect future service asconsolidated balance sheets as of those dates. In addition, atappropriate, are expected to be paid related to defined benefitDecember 31, 2016 and 2015, Bunge had approximatelypension and postretirement benefit plans:$46 million and $25 million of payables to these venturesincluded in trade accounts payable in the consolidated balancePENSION POSTRETIREMENTsheets as of those dates.(US$ in millions) BENEFIT PAYMENTS BENEFIT PAYMENTS
2017 . . . . . . . . . . . . . . . . . . . . . . . . . . . . . . . . . . . . $ 42 $ 8 In addition, Bunge provided services during the years ended2018 . . . . . . . . . . . . . . . . . . . . . . . . . . . . . . . . . . . . 42 8 December 31, 2016, 2015 and 2014, to its unconsolidated2019 . . . . . . . . . . . . . . . . . . . . . . . . . . . . . . . . . . . . 44 8 ventures totaling $103 million, $106 million and $111 million,2020 . . . . . . . . . . . . . . . . . . . . . . . . . . . . . . . . . . . . 46 7 respectively, for services including primarily tolling and2021 . . . . . . . . . . . . . . . . . . . . . . . . . . . . . . . . . . . . 48 7 administrative support. Bunge believes all of these transaction2022 and onwards . . . . . . . . . . . . . . . . . . . 270 30 values are similar to those that would be conducted with third
parties.Employee Defined Contribution Plans – Bunge also makescontributions to qualified defined contribution plans for eligible
20. COMMITMENTS AND CONTINGENCIESemployees. Contributions to these plans amounted to$11 million, $11 million and $12 million during the years ended
Bunge is party to a large number of claims and lawsuits,December 31, 2016, 2015 and 2014, respectively.primarily non-income tax and labor claims in Brazil andnon-income tax claims in Argentina, arising in the normal
19. RELATED PARTY TRANSACTIONS course of business. The ability to predict the ultimate outcomeof such matters involves judgments, estimates and inherent
Notes receivable – Bunge holds a note receivable from uncertainties. Bunge records liabilities related to its generalNavegacoes Unidas Tapajos S.A., a 50% equity method claims and lawsuits when the exposure item becomes probableinvestment in Brazil, having a carrying value of $20 million at and can be reasonably estimated. Bunge management doesDecember 31, 2016, which matures in June 2019, with interest not expect these matters to have a material adverse effect onbased on CDI, the average one-day interbank deposit rate in Bunge’s financial condition, results of operations or liquidity.Brazil. However, these matters are subject to inherent uncertainties
and there exists the remote possibility of an adverse impact onBunge holds a note receivable from Solazyme Bunge Bunge’s position in the period the uncertainties are resolvedRenewable Oils Cooperatief U.A., a 49.9% equity method whereby the settlement of the identified contingencies couldinvestment in Brazil, having a carrying value of $10 million at exceed the amount of provisions included in the consolidatedDecember 31, 2016, which matures in April 2017, with an balance sheets. Included in other non-current liabilities atinterest rate of 11.05%. December 31, 2016 and 2015 are the following amounts related
to these matters:In addition, Bunge held notes receivables from other relatedparties totaling $6 million at December 31, 2016, and 2015,
DECEMBER 31,respectively.(US$ in millions) 2016 2015
Notes payable – Bunge holds a note payable with its jointNon-income tax claims $170 $ 163venture Bunge SCF Grain LLC with a carrying value ofLabor claims 82 75$18 million at December 31, 2016. This note matures onCivil and other claims 98 78March 31, 2019 with an interest rate based on LIBOR and isTotal $350 $ 316included in other long-term liabilities in Bunge’s consolidated
balance sheet.Non-income Tax claims – These tax claims relate principally to
Other – Bunge purchased soybeans and other commodity claims against Bunge’s Brazilian subsidiaries, primarily valueproducts and received port services from certain of its added tax claims (ICMS, IPI, PIS/COFINS). The determinationunconsolidated ventures, totaling $1,054 million, $757 million of the manner in which various Brazilian federal, state andand $746 million for the years ended December 31, 2016, 2015 municipal taxes apply to the operations of Bunge is subject toand 2014, respectively. Bunge also sold soybeans and other varying interpretations arising from the complex nature ofcommodity products and provided port services to certain of its Brazilian tax law. In addition to the matter discussed below,unconsolidated ventures, totaling $326 million, $351 million and Bunge monitors other potential claims in Brazil regarding these$345 million for the years ended December 31, 2016, 2015 and
F-38 2016 Bunge Annual Report
BUNGE LIMITED AND SUBSIDIARIESNOTES TO THE CONSOLIDATED FINANCIAL STATEMENTS
F-39
issued assessments relating to years 2004 through the first20. COMMITMENTS AND CONTINGENCIES (Continued)quarter of 2011. As of December 31, 2016, the cumulative
value-added taxes. In particular, Bunge monitors the Brazilian claims for 2004 through 2011 were approximately 510 millionfederal and state governments’ responses to recent Brazilian Brazilian reais (approximately $156 million), plus applicableSupreme Court decisions invalidating on constitutional grounds interest and penalties on the outstanding amount. As ofcertain ICMS incentives and benefits granted by various states. December 31, 2015, the claims for 2004 through 2010 wereWhile Bunge was not a recipient of any of the incentives and approximately 500 million Brazilian reais (approximatelybenefits that were the subject of these Supreme Court $154 million as of December 31, 2016), plus applicable interestdecisions, it has received other similar tax incentives and and penalties on the outstanding amount. Management, inbenefits, which are being challenged before the Supreme consultation with external legal advisors, has establishedCourt. Bunge has not received any tax assessment from the appropriate reserves for potential exposures.states that granted these incentives or benefits related to their
Since 2010, the Argentine tax authorities have been conductingvalidity and, based on the Company’s evaluation of this mattera review of income and other taxes paid by exporters andas required by U.S. GAAP, no liability has been recorded in theprocessors of cereals and other agricultural commodities in theconsolidated financial statements.country. In that regard, the Company has been subject to a
On February 13, 2015, Brazil’s Supreme Federal Court ruled in a number of assessments, proceedings and claims related to itsleading case that certain state ICMS tax credits for staple activities. In 2011, Bunge’s subsidiary in Argentina paidfoods (including soy oil, margarine, mayonnaise and wheat $112 million of accrued export tax obligations under protestflours) are unconstitutional. Bunge, like other companies in the and preserved its rights with respect to such payment. In 2012,Brazilian food industry, is involved in several administrative and the Argentine tax authorities further assessed interest on thesejudicial disputes with Brazilian states regarding these tax payments, which as of December 31, 2016, totaledcredits. While the leading case does not involve Bunge and approximately $234 million. In 2012, the Argentine governmenteach case is unique in facts and circumstances and applicable suspended Bunge’s Argentine subsidiary from a registry ofstate law, the ruling has general precedent authority on lower grain traders. While the suspension has not had a materialcourt cases. Based on management’s review of the ruling adverse effect on Bunge’s business in Argentina, these actions(without considering the future success of any potential have resulted in additional administrative requirements andclarification or modulation of the ruling) and its general increased logistical costs on domestic grain shipments withinapplication to Bunge’s pending cases, management recorded a Argentina. Bunge is challenging these actions in the Argentineliability of 468 million Brazilian reais (approximately $144 million courts.and $120 million as of December 31, 2016 and 2015,
Labor claims – The labor claims are principally claims againstrespectively), plus applicable interest. During the fourth quarterBunge’s Brazilian subsidiaries. The labor claims primarily relateof 2016, Bunge settled a portion of its outstanding liabilities into dismissals, severance, health and safety, salary adjustmentsamnesty programs in certain Brazilian states. As ofand supplementary retirement benefits.December 31, 2016, the accrued liability was 418 million
Brazilian reais (approximately $128 million), plus applicableCivil and other claims – The civil and other claims relate tointerest.various disputes with third parties, including suppliers andcustomers.As of December 31, 2016, the Brazilian state authorities have
concluded examinations of the ICMS tax returns from 1990 toDuring the first quarter of 2016, Bunge received a notice fromthe present and have issued approximately 1,300 assessmentsthe Brazilian Administrative Council for Economic Defensetotaling approximately 797 million Brazilian reais (approximatelyinitiating an administrative proceeding against its Brazilian$245 million as of December 31, 2016), plus applicable interestsubsidiary and two of its employees, certain of its formerand penalties on the outstanding amount. As of December 31,employees, several other companies in the Brazilian wheat2015, the claims were approximately 740 million Brazilian reaismilling industry and others for alleged anticompetitive activities(approximately $228 million), plus applicable interest andin the north and northeast of Brazil. Bunge is defendingpenalties on the outstanding amount. Management intends toagainst this action; however, the proceedings are at an earlycontinue to vigorously defend against its pending state cases.stage and Bunge cannot, at this time, reasonably predict theManagement, in consultation with external legal advisors, hasultimate outcome of the proceedings or sanctions, if any, whichestablished appropriate reserves for potential exposures.may be imposed.
As of December 31, 2016 the Brazilian authorities haveconcluded examinations of the PIS COFINS tax returns and
2016 Bunge Annual Report F-39
BUNGE LIMITED AND SUBSIDIARIESNOTES TO THE CONSOLIDATED FINANCIAL STATEMENTS
F-40
agreements generally range from two months to approximately20. COMMITMENTS AND CONTINGENCIES (Continued)seven years, in the case of ocean freight vessels, depending on
Guarantees – Bunge has issued or was a party to the following market conditions, and five to nine years in the case of railroadguarantees at December 31, 2016: services. Future minimum payment obligations due under these
agreements are as follows:MAXIMUM
POTENTIAL FUTURE OCEAN FREIGHT RAILROAD MINIMUM PAYMENT(US$ in millions) PAYMENTS (US$ in millions) VESSELS SERVICES OBLIGATIONS
Unconsolidated affiliates guarantee(1)(2) $ 99 2017 $114 $ 43 $157Residual value guarantee(3) 222 2018 and 2019 112 68 180
2020 and 2021 91 68 159Total $3212022 and thereafter 53 102 155
(1) Bunge issued guarantees to certain financial institutions related to debt of certain of Total $370 $281 $651its unconsolidated joint ventures. The terms of the guarantees are equal to the terms ofthe related financings which have maturity dates in 2017 through 2022. There are no
Actual amounts paid under these contracts may differ due torecourse provisions or collateral that would enable Bunge to recover any amounts paidunder these guarantees. At December 31, 2016, Bunge recorded no obligation related to the variable components of these agreements and the amountthese guarantees. of income earned on the sales of excess capacity. The
agreements for the freight service on railroad lines require a(2) Bunge issued guarantees to certain third parties related to performance of itsminimum monthly payment regardless of the actual level ofunconsolidated joint ventures. There are no recourse provisions or collateral that would
enable Bunge to recover any amounts paid under these guarantees. At December 31, freight services used by Bunge. The costs of Bunge’s freight2016, Bunge recorded no obligation related to these guarantees. supply agreements are typically passed through to the
customers as a component of the prices charged for its(3) Bunge issued guarantees to certain financial institutions which are party to certainproducts.operating lease arrangements for railcars and barges. These guarantees provide for a
minimum residual value to be received by the lessor at conclusion of the lease term.These leases expire at various dates from 2018 through 2021. At December 31, 2016, Also in the ordinary course of business, Bunge enters into reletBunge’s recorded obligation related to these guarantees was $4 million. agreements related to ocean freight vessels. Such relet
agreements are similar to sub-leases. Bunge receivedBunge Limited has provided a Guaranty to the Director of the approximately $60 million during the year ended December 31,Illinois Department of Agriculture as Trustee for Bunge North 2016 and expects to receive payments of approximatelyAmerica, Inc. (‘‘BNA’’), an indirect wholly-owned subsidiary, $10 million in 2017 under such relet agreements.which guarantees all amounts due and owing by BNA, to grainproducers and/or depositors in the State of Illinois who have Commitments – At December 31, 2016, Bunge haddelivered commodities to BNA’s Illinois facilities. approximately $16 million of purchase commitments related to
its inventories, $109 million of power supply contracts andIn addition, Bunge Limited has provided full and unconditional $72 million of contractual commitments related to constructionparent level guarantees of the outstanding indebtedness under in progress.certain credit facilities entered into and senior notes issued by,its subsidiaries. At December 31, 2016, Bunge’s consolidated
21. REDEEMABLE NONCONTROLLING INTERESTSbalance sheet includes debt with a carrying amount of$4,035 million related to these guarantees. This debt includes
In July 2012, Bunge and Nutre Farming B.V. entered into a jointthe senior notes issued by three of Bunge’s 100% ownedventure agreement whereby Bunge acquired a 55% interest infinance subsidiaries, Bunge Limited Finance Corp., Bungea newly formed oilseed processing venture in its agribusinessFinance Europe B.V. and Bunge N.A. Finance L.P. There aresegment in Eastern Europe. Bunge consolidates the venture inlargely no restrictions on the ability of Bunge Limited Financeits consolidated financial statements. In conjunction with theCorp., Bunge Finance Europe B.V. and Bunge N.A. Finance L.P.formation of the venture, Bunge entered into an agreement toor any other Bunge subsidiary to transfer funds to Bungeacquire the remaining 45% interest at either Bunge’s or theLimited.noncontrolling interest holder’s option in the future. Theexercise date and price of the option were reasonablyFreight Supply Agreements – In the ordinary course of business,determinable. As a result, Bunge had classified theBunge enters into time charter agreements for the use ofnoncontrolling interest as redeemable noncontrolling interest inocean freight vessels and freight service on railroad lines forits consolidated balance sheet as of December 31, 2012.the purpose of transporting agricultural commodities. InDuring the second quarter of 2016, Bunge exercised its calladdition, Bunge sells the right to use these ocean freightoption for the remaining 45% interest in the joint venture forvessels when excess freight capacity is available. These
F-40 2016 Bunge Annual Report
BUNGE LIMITED AND SUBSIDIARIESNOTES TO THE CONSOLIDATED FINANCIAL STATEMENTS
F-41
Bunge Limited’s common shares exceeded certain specified21. REDEEMABLE NONCONTROLLING INTERESTSthresholds, each convertible preference share is convertible at(Continued)any time at the holder’s option into approximately 1.1507common shares based on a conversion price of $86.9010 perapproximately $39 million. The transaction has concluded inconvertible preference share, subject in each case to certainSeptember 2016.specified anti-dilution adjustments (which represents 7,939,830Bunge Limited common shares at December 31, 2016).22. EQUITYAt any time on or after December 1, 2011, if the closing market
Share Repurchase Program – In May 2015, Bunge established a price of Bunge’s common shares equals or exceeds 130% ofnew program for the repurchase of up to $500 million of the conversion price of the convertible preference shares, forBunge’s issued and outstanding common shares. The program 20 trading days within any period of 30 consecutive tradinghas no expiration date. Bunge did not repurchase any common days (including the last trading day of such period), Bungeshares during the fourth quarter ended December 31, 2016. may elect to cause all outstanding convertible preferenceBunge repurchased 3,296,230 common shares for the nine shares to be automatically converted into the number ofmonths ended September 30, 2016 under this program for common shares that are issuable at the conversion price. The$200 million. Total repurchases under the program from its convertible preference shares are not redeemable by Bunge atinception in May 2015 through December 31, 2016 were any time.4,707,440 shares for $300 million. Bunge completed theprevious program of $975 million during the first quarter of The convertible preference shares accrue dividends at an2015 with the repurchase of 2,460,600 common shares for annual rate of 4.875%. Dividends are cumulative from the date$200 million. of issuance and are payable, quarterly in arrears, on each
March 1, June 1, September 1 and December 1, commencingCumulative Convertible Perpetual Preference Shares – Bunge has on March 1, 2007, when, as and if declared by Bunge’s Board6,900,000, 4.875% cumulative convertible perpetual preference of Directors. The dividends may be paid in cash, commonshares (convertible preference shares), par value $0.01 shares or a combination thereof. Accumulated but unpaidoutstanding at December 31, 2016. Each convertible preference dividends on the convertible preference shares will not bearshare has an initial liquidation preference of $100 per share interest. In each of the years ended December 31, 2016, 2015plus accumulated unpaid dividends up to a maximum of an and 2014, Bunge recorded $34 million of dividends on itsadditional $25 per share. As a result of adjustments made to convertible preference shares.the initial conversion price because cash dividends paid on
2016 Bunge Annual Report F-41
BUNGE LIMITED AND SUBSIDIARIESNOTES TO THE CONSOLIDATED FINANCIAL STATEMENTS

F-42
22. EQUITY (Continued)
Accumulated Other Comprehensive Income (Loss) Attributable to Bunge – The following table summarizes the balances of relatedafter-tax components of accumulated other comprehensive income (loss) attributable to Bunge:
PENSIONFOREIGN DEFERRED AND OTHER UNREALIZED ACCUMULATED
EXCHANGE GAINS (LOSSES) POSTRETIREMENT GAINS (LOSSES) OTHERTRANSLATION ON HEDGING LIABILITY ON COMPREHENSIVE
(US$ in millions) ADJUSTMENT(1) ACTIVITIES ADJUSTMENTS INVESTMENTS INCOME (LOSS)
Balance January 1, 2014 $ (2,486) $ (22) (69) 5 (2,572)Other comprehensive income (loss) before reclassifications (1,411) 21 (90) (2) (1,482)Amount reclassified from accumulated other comprehensive
income - (9) 5 - (4)
Net-current period other comprehensive income (loss) (1,411) 12 (85) (2) (1,486)
Balance, December 31, 2014 (3,897) $ (10) (154) 3 (4,058)Other comprehensive income (loss) before reclassifications (2,546) 147 7 - (2,392)Amount reclassified from accumulated other comprehensive
income (loss) - 77 13 - 90
Net-current period other comprehensive income (loss) (2,546) 224 20 - (2,302)
Balance, December 31, 2015 (6,443) $ 214 (134) 3 (6,360)Other comprehensive income (loss) before reclassifications 709 (305) (11) - 393Amount reclassified from accumulated other comprehensive
income (loss) - (11) - - (11)
Net-current period other comprehensive income (loss) 709 (316) (11) - 382
Balance, December 31, 2016 $(5,734) $(102) $(145) $ 3 $(5,978)
(1) Bunge has significant operating subsidiaries in Brazil, Argentina, North America, Europe and Asia-Pacific. The functional currency of Bunge’s subsidiaries is the local currency. Theassets and liabilities of these subsidiaries are translated into U.S. dollars from local currency at month-end exchange rates, and the resulting foreign exchange translation gains(losses) are recorded in the consolidated balance sheets as a component of accumulated other comprehensive income (loss).
and notes, if dilutive. The number of additional shares is23. EARNINGS PER COMMON SHAREcalculated by assuming that outstanding stock options, exceptthose which are not dilutive, were exercised and that theBasic earnings per share is computed by dividing net incomeproceeds from such exercises were used to acquire commonavailable to Bunge common shareholders by the weighted-shares at the average market price during the reporting period.average number of common shares outstanding, excluding anyIn addition, Bunge accounts for the effects of convertibledilutive effects of stock options, restricted stock unit awards,securities and convertible notes, using the if-converted method.convertible preference shares and convertible notes during theUnder this method, the convertible securities and convertiblereporting period. Diluted earnings per share is computednotes are assumed to be converted and the related dividend orsimilar to basic earnings per share, except that the weighted-interest expense, net of tax, is added back to earnings, ifaverage number of common shares outstanding is increased todilutive.include additional shares from the assumed exercise of stock
options, restricted stock unit awards and convertible securities
F-42 2016 Bunge Annual Report
BUNGE LIMITED AND SUBSIDIARIESNOTES TO THE CONSOLIDATED FINANCIAL STATEMENTS
F-43
transaction concluded in September 2016. Accretion for the respective periods includes23. EARNINGS PER COMMON SHARE (Continued)the effect of losses incurred by the operations for the years ended December 31, 2016,2015 and 2014, respectively.The following table sets forth the computation of basic and
diluted earnings per common share: (2) The weighted-average common shares outstanding-diluted excludes approximately4 million, 3 million and 2 million stock options and contingently issuable restricted stock
(US$ in millions, except for YEAR ENDED DECEMBER 31, units, which were not dilutive and not included in the computation of earnings per shareshare data) 2016 2015 2014 for the years ended December 31, 2016, 2015 and 2014, respectively.
Income from continuing (3) Weighted-average common share outstanding-diluted for the year endedoperations $ 776 $ 755 $ 485 December 31, 2014 excludes approximately 8 million weighted-average common shares
Net (income) loss attributable that are issuable upon conversion of the convertible preference shares that were notto noncontrolling interests (22) 1 (2) dilutive and not included in the weighted-average number of common shares
outstanding.Income (loss) from continuingoperations attributable toBunge 754 756 483 24. SHARE-BASED COMPENSATION
Other redeemableobligations(1) (2) (19) (14) For the years ended December 31, 2016, 2015 and 2014, Bunge
Convertible preference share recognized in additional paid-in capital approximatelydividends (34) (34) (34)$44 million, $46 million and $49 million, respectively, of totalIncome (loss) fromcompensation expense for awards classified as equity awardsdiscontinued operations, net
of tax (9) 35 32 related to its stock option and restricted stock unit awards inadditional paid-in capital.Net income (loss) available to
Bunge common shareholders $ 709 $ 738 $ 467In 2016, Bunge granted equity awards under the 2016 Equity
Weighted-average number of Incentive Plan (the ‘‘2016 EIP’’) and 2009 Equity Incentive Plancommon shares(the ‘‘2009 EIP’’), both shareholder approved plans. Under theoutstanding:2016 EIP and 2009 EIP, the Compensation Committee ofBasic 139,845,124 143,671,546 146,209,508
Effect of dilutive shares: Bunge’s Board of Directors may grant equity based awards to— stock options and awards(2) 441,521 749,031 1,021,270 officers, employees, consultants and independent contractors in— convertible preference the form of stock options, restricted stock units (performance
shares(3) 7,939,830 7,818,390 - based or time-vested) or other equity based awards. The 2016Diluted 148,226,475 152,238,967 147,230,778 EIP replaced the 2009 EIP, under which, beginning May 26,
2016, no further awards may be granted. Shares issued underBasic earnings per commonthe Plan may consist, in whole or in part, of authorized andshare:
Net income (loss) from unissued Shares, treasury Shares or Shares reacquired by thecontinuing operations $ 5.13 $ 4.90 $ 2.98 Company in any manner, or a combination thereof.
Net income (loss) fromdiscontinued operations (0.06) 0.24 0.22 (i) Stock Option Awards – Options to purchase Bunge Limited
Net income (loss) to Bunge common shares are granted with an exercise price equal to thecommon shareholders - grant date fair market value of Bunge common stock, vest overbasic $ 5.07 $ 5.14 $ 3.20 service periods that generally range from one to three years,
and expire 10 years from the date of grant. Vesting may beDiluted earnings per commonshare: accelerated in certain circumstances as provided in the plans
Net income (loss) from or associated Award Agreements. Grant date fair value iscontinuing operations $ 5.07 $ 4.84 $ 2.96 recognized as compensation expense on a straight-line basis
Net income (loss) fromfor option grants beginning in 2006 and for options granteddiscontinued operations (0.06) 0.23 0.21prior to 2006, compensation expense is recognized on an
Net income (loss) to Bunge accelerated basis over the vesting period of each grant.common shareholders -diluted $ 5.01 $ 5.07 $ 3.17 (ii) Restricted Stock Units – Restricted stock units (‘‘RSUs’’) give
recipients the right to receive shares of Bunge common stock(1) Accretion of redeemable noncontrolling interest of $2 million, $19 million and
upon the lapse of related restrictions determined by the$14 million for the years ended December 31, 2016, 2015 and 2014, respectively, relatesCompensation Committee. Restrictions on RSUs may be basedto a non-fair value variable put arrangement whereby the noncontrolling interest holderon continued service by the recipient through the designatedmay have required Bunge to purchase the remaining shares of an oilseed processing
operation in Central and Eastern Europe. As further discussed in Note 21 Redeemable term and/or based on the achievement of certain performanceNoncontrolling Interest, during the second quarter of 2016 Bunge exercised its call option targets. These targets may be financial or market-based, andwith Prio for their 45% interest in the joint venture for approximately $39 million. The the number of units actually earned varies based on the level
2016 Bunge Annual Report F-43
BUNGE LIMITED AND SUBSIDIARIESNOTES TO THE CONSOLIDATED FINANCIAL STATEMENTS

F-44
shares is a weighted average of historical volatility calculated24. SHARE-BASED COMPENSATION (Continued)using the daily closing price of Bunge’s shares up to the grant
of achievement of predefined goals. Compensation expense in date and implied volatilities on open option contracts onrecognized on a straight-line bases over the vesting period for Bunge’s stock as of the grant date. Bunge uses historicalrestricted stock units. RSUs vest in various increments and at employee exercise behavior for valuation purposes. Thevarious dates, generally over periods ranging from one to three expected option term of granted options represents the periodyears. Vesting may be accelerated under certain circumstances of time that the granted options are expected to beas defined in the plans or associated Award Agreements. RSUs outstanding based on historical experience and givingare generally settled in shares of Bunge common stock upon consideration for the contractual terms, vesting periods andsatisfaction of the applicable vesting terms. Where share expectations of future employee behavior. The risk-free interestsettlement may be prohibited under local law, RSUs are settled rate is based on U.S. Treasury zero-coupon bonds with a termin cash. At the time of settlement, a participant holding a equal to the expected option term of the respective grants andvested restricted stock unit will also be entitled to receive grant dates.corresponding accrued dividend equivalent share payments.
DECEMBER 31,Bunge has also established the Bunge Limited 2007 ASSUMPTIONS: 2016 2015 2014Non-Employee Directors’ Equity Incentive Plan (the ‘‘2007
Expected option term (in years) 5.67 5.87 6.02Directors’ Plan’’), a shareholder approved plan. Under the 2007Expected dividend yield 3.04% 1.67% 1.51%Directors’ Plan, the Compensation Committee may grant equityExpected volatility 26.06% 27.47% 40.91%based awards to non-employee directors of Bunge Limited.Risk-free interest rate 1.41% 1.73% 1.84%Awards may consist of restricted stock, restricted stock units,
deferred restricted stock units and non-statutory stock options.A summary of option activity under the plans for the yearThe 2007 Directors’ Plan replaced the Non-Employee Directorsended December 31, 2016 is presented below:Equity Incentive Plan, under which no further awards may be
granted.WEIGHTED-
(i) Stock Option Awards – Options to purchase Bunge Limited WEIGHTED- AVERAGEcommon shares were historically granted with an exercise price AVERAGE REMAINING AGGREGATEequal to the grant date fair market value of Bunge Limited EXERCISE CONTRACTUAL INTRINSICcommon stock. Options were set to expire ten years after the OPTIONS SHARES PRICE TERM (YEARS) VALUEdate of grant and generally vested and became exercisable on
Outstanding atthe third anniversary of the grant date. Bunge no longer makesJanuary 1, 2016 4,795,671 $ 75.64grants of options under the 2007 Directors’ Plan and there are
Granted 1,586,400 $ 50.18no longer any options outstanding under the plan.Exercised (78,189) $ 57.77
(ii) Restricted Stock Units – Restricted stock units granted to Forfeited or expired (354,063) $ 72.30non-employee directors generally vest on the first anniversary Outstanding atof the grant date, provided the director continues to serve on December 31, 2016 5,949,819 $69.35 6.26 $45the Board until such date, and are settled in Bunge Limited
Exercisable atcommon stock. RSUs granted as part of our Chairman’sDecember 31, 2016 3,635,613 $75.19 4.67 $10supplemental annual retainer have historically vested on
December 31 of the year of grant. At the time of settlement, aparticipant holding a vested restricted stock unit or deferred The weighted-average grant date fair value of options grantedrestricted stock unit is also entitled to receive corresponding during the years ended December 31, 2016, 2015 and 2014accrued dividend equivalent share payments. was $8.86, $19.36 and $28.25, respectively. The total intrinsic
value of options exercised during the years endedThe fair value of each stock option granted under any of December 31, 2016, 2015 and 2014 was approximatelyBunge’s equity incentive plans is estimated on the grant date $1 million, $11 million and $34 million, respectively. The excessusing the Black Scholes Merton option pricing model. tax benefit classified as a financing cash flow was notAssumptions for the prior three years are noted in the significant for any of the periods presented.following table. The expected volatility of Bunge’s common
F-44 2016 Bunge Annual Report
BUNGE LIMITED AND SUBSIDIARIESNOTES TO THE CONSOLIDATED FINANCIAL STATEMENTS
F-45
24. SHARE-BASED COMPENSATION (Continued) 25. LEASE COMMITMENTS
At December 31, 2016, $17 million of total unrecognized Bunge routinely leases storage facilities, transportationcompensation cost related to non-vested stock options granted equipment and office facilities under operating leases. Futureunder the equity incentive plan is expected to be recognized minimum lease payments by year and in the aggregate underover the next two years. non-cancelable operating leases with initial or remaining terms
of one year or more at December 31, 2016 are as follows:A summary of activity under Bunge’s restricted stock unit plansfor the year ended December 31, 2016 is presented below. MINIMUM
LEASEWEIGHTED- (US$ in millions) PAYMENTSAVERAGE
2017 $152GRANT-DATE2018 115RESTRICTED STOCK UNITS SHARES FAIR VALUE2019 99
Restricted stock units at January 1, 2016 1,160,628 $79.16 2020 72Granted 866,790 51.42 2021 59Vested/issued(2) (317,586) 75.43 Thereafter 171Forfeited/cancelled(2) (165,567) 75.43
Total $668Restricted stock units at December 31, 2016(1) 1,544,265 $64.85
Net rent expense under non-cancelable operating leases is as(1) Includes accrued unvested dividends, which are payable in Bunge’s common shares
follows:upon vesting of underlying restricted stock units.
(2) During the year ended December 31, 2016, Bunge issued 235,204 common shares, netYEAR ENDED
of common shares withheld to cover taxes, including related common shares representingDECEMBER 31,accrued dividends, with a weighted-average fair value of $57.91 per share. During the
(US$ in millions) 2016 2015 2014year ended December 31, 2016, 82,520 performance-based restricted stock units vested.During the year ended December 31, 2016, Bunge canceled approximately 135,948 shares
Rent expense $213 $182 $259related to performance-based restricted stock unit awards that did not vest due toSublease income (9) (6) (22)non-achievement of performance targets and performance-based restricted stock unit
awards that were withheld to cover payment of employee related taxes. Net rent expense $204 $176 $237
The fair value of RSU and performance-based awards isIn addition, Bunge enters into agricultural partnershipdetermined based on the market value of the Company’sagreements for the production of sugarcane. These agreementsshares on the grant date. The weighted-average grant date fairhave an average remaining life of four years and covervalue of restricted stock units granted during the years endedapproximately 211,017 hectares of land under cultivation.December 31, 2016, 2015 and 2014 was $51.42, $81.97 andAmounts owed under these agreements are dependent on$79.26, respectively.several variables including the quantity of sugarcane produced
At December 31, 2016, there was approximately $42 million of per hectare, the total recoverable sugar (‘‘ATR’’) per ton oftotal unrecognized compensation cost related to restricted sugarcane produced and the price for each kilogram of ATR asstock units share-based compensation arrangements under the determined by Consecana, the Sao Paulo state sugarcane,equity incentive plans, which is expected to be recognized over sugar and ethanol council. During the years endedthe next two years. The total fair value of restricted stock units December 31, 2016, 2015 and 2014, Bunge made paymentsvested during the year ended December 31, 2016 was related to these agreements of $154 million, $125 million andapproximately $18 million. $162 million, respectively. Of these amounts $89 million,
$75 million and $95 million, respectively, were payments forCommon Shares Reserved for Share-Based Awards – The 2007 advances on future production and $65 million, $50 million andDirectors’ Plan, the 2009 EIP and the 2016 EIP provide that $67 million, respectively, were included in cost of goods sold in600,000, 10,000,000 and 5,800,000 common shares, respectively, the consolidated statements of income for the years endedare to be reserved for grants of stock options, restricted stock December 31, 2016, 2015 and 2014, respectively.units and other awards under the plans. At December 31, 2016,113,732 and 5,766,487 common shares were available for future
26. SEGMENT INFORMATIONgrants under the 2007 Directors’ Plan and the 2016 EIP,respectively. Upon approval of the 2016 EIP, no shares were
Bunge has five reportable segments – Agribusiness, Edible Oilavailable for future grant under the 2009 EIP.Products, Milling Products, Sugar and Bioenergy, and
2016 Bunge Annual Report F-45
BUNGE LIMITED AND SUBSIDIARIESNOTES TO THE CONSOLIDATED FINANCIAL STATEMENTS

F-46
investments and related activities. Following the classification26. SEGMENT INFORMATION (Continued)of the Brazilian fertilizer distribution and North American
Fertilizer – which are organized based upon similar economic fertilizer businesses as discontinued operations, the activities ofcharacteristics and are similar in nature of products and the Fertilizer segment include its port operations in Brazil andservices offered, the nature of production processes and the Argentina and its blending and retail operations in Argentina.type and class of customer and distribution methods. The
The ‘‘Discontinued Operations & Unallocated’’ column in theAgribusiness segment is characterized by both inputs andfollowing table contains the reconciliation between the totalsoutputs being agricultural commodities and thus high volumefor reportable segments and Bunge consolidated totals, whichand low margin. The Edible Oil Products segment involves theconsist primarily of amounts attributable to discontinuedprocessing, production and marketing of products derived fromoperations, corporate items not allocated to the operatingvegetable oils. The Milling Products segment involves thesegments and inter-segment eliminations. Transfers betweenprocessing, production and marketing of products derivedthe segments are generally valued at market. The segmentprimarily from wheat and corn. The Sugar and Bioenergyrevenues generated from these transfers are shown in thesegment involves sugarcane growing and milling in Brazil,following table as ‘‘Inter-segment revenues.’’sugar merchandising in various countries, as well as
sugarcane-based ethanol production and corn-based ethanol
F-46 2016 Bunge Annual Report
BUNGE LIMITED AND SUBSIDIARIESNOTES TO THE CONSOLIDATED FINANCIAL STATEMENTS
F-47
26. SEGMENT INFORMATION (Continued)
EDIBLE DISCONTINUEDOIL MILLING SUGAR AND OPERATIONS &
(US$ in millions) AGRIBUSINESS PRODUCTS PRODUCTS BIOENERGY FERTILIZER UNALLOCATED(1) TOTAL
2016Net sales to external customers . . . . . . . . . . . . . . . . . . . . . . . . . . . . . . . . . . . . . . . . $30,061 $6,859 $1,647 $3,709 $403 $ - $42,679Inter-segment revenues . . . . . . . . . . . . . . . . . . . . . . . . . . . . . . . . . . . . . . . . . . . . . . . . . . . 3,867 115 9 13 - (4,004) -Foreign exchange gains (losses) . . . . . . . . . . . . . . . . . . . . . . . . . . . . . . . . . . . . . . . . . (7) (1) (7) 9 (2) - (8)Noncontrolling interests(1) . . . . . . . . . . . . . . . . . . . . . . . . . . . . . . . . . . . . . . . . . . . . . . . . (21) (13) - - (2) 14 (22)Other income (expense) – net . . . . . . . . . . . . . . . . . . . . . . . . . . . . . . . . . . . . . . . . . . . 24 7 (4) (16) 1 - 12Segment EBIT(3) . . . . . . . . . . . . . . . . . . . . . . . . . . . . . . . . . . . . . . . . . . . . . . . . . . . . . . . . . . . . . 875 112 131 (4) 29 - 1,143Discontinued operations(2) . . . . . . . . . . . . . . . . . . . . . . . . . . . . . . . . . . . . . . . . . . . . . . . . - - - - - (9) (9)Depreciation, depletion and amortization . . . . . . . . . . . . . . . . . . . . . . . . . . . . (236) (94) (62) (143) (12) - (547)Investments in affiliates . . . . . . . . . . . . . . . . . . . . . . . . . . . . . . . . . . . . . . . . . . . . . . . . . . 325 - - 48 - - 373Total assets . . . . . . . . . . . . . . . . . . . . . . . . . . . . . . . . . . . . . . . . . . . . . . . . . . . . . . . . . . . . . . . . . . 12,159 2,329 1,444 2,754 318 184 19,188Capital expenditures . . . . . . . . . . . . . . . . . . . . . . . . . . . . . . . . . . . . . . . . . . . . . . . . . . . . . . . 421 108 75 131 16 33 784
2015Net sales to external customers . . . . . . . . . . . . . . . . . . . . . . . . . . . . . . . . . . . . . . . . $ 31,267 $ 6,698 $ 1,609 $ 3,495 $ 386 $ - $ 43,455Inter-segment revenues . . . . . . . . . . . . . . . . . . . . . . . . . . . . . . . . . . . . . . . . . . . . . . . . . . . 3,499 178 37 12 - (3,726) -Foreign exchange gains (losses) . . . . . . . . . . . . . . . . . . . . . . . . . . . . . . . . . . . . . . . . . 67 - (8) (68) 1 - (8)Noncontrolling interests(1) . . . . . . . . . . . . . . . . . . . . . . . . . . . . . . . . . . . . . . . . . . . . . . . . (9) (8) - - (1) 19 1Other income (expense) – net . . . . . . . . . . . . . . . . . . . . . . . . . . . . . . . . . . . . . . . . . . . (3) 4 (3) (15) (1) - (18)Segment EBIT(4) . . . . . . . . . . . . . . . . . . . . . . . . . . . . . . . . . . . . . . . . . . . . . . . . . . . . . . . . . . . . . 1,108 59 103 (27) 5 - 1,248Discontinued operations(2) . . . . . . . . . . . . . . . . . . . . . . . . . . . . . . . . . . . . . . . . . . . . . . . . - - - - - 35 35Depreciation, depletion and amortization . . . . . . . . . . . . . . . . . . . . . . . . . . . . (234) (90) (46) (160) (15) - (545)Investments in affiliates . . . . . . . . . . . . . . . . . . . . . . . . . . . . . . . . . . . . . . . . . . . . . . . . . . 249 - - 80 - - 329Total assets . . . . . . . . . . . . . . . . . . . . . . . . . . . . . . . . . . . . . . . . . . . . . . . . . . . . . . . . . . . . . . . . . . 11,832 1,963 1,343 2,318 299 159 17,914Capital expenditures . . . . . . . . . . . . . . . . . . . . . . . . . . . . . . . . . . . . . . . . . . . . . . . . . . . . . . . 359 63 60 125 17 25 649
2014Net sales to external customers . . . . . . . . . . . . . . . . . . . . . . . . . . . . . . . . . . . . . . . . $ 42,109 $ 7,972 $ 2,064 $ 4,542 $ 474 $ - $ 57,161Inter-segment revenues . . . . . . . . . . . . . . . . . . . . . . . . . . . . . . . . . . . . . . . . . . . . . . . . . . . 3,510 161 88 - - (3,759) -Foreign exchange gains (losses) . . . . . . . . . . . . . . . . . . . . . . . . . . . . . . . . . . . . . . . . . 39 (4) (8) 19 1 - 47Noncontrolling interests(1) . . . . . . . . . . . . . . . . . . . . . . . . . . . . . . . . . . . . . . . . . . . . . . . . (23) (9) - (1) (5) 36 (2)Other income (expense) – net . . . . . . . . . . . . . . . . . . . . . . . . . . . . . . . . . . . . . . . . . . . 8 5 (4) 10 (2) - 17Segment EBIT . . . . . . . . . . . . . . . . . . . . . . . . . . . . . . . . . . . . . . . . . . . . . . . . . . . . . . . . . . . . . . . . 890 58 131 (168) 45 - 956Discontinued operations(2) . . . . . . . . . . . . . . . . . . . . . . . . . . . . . . . . . . . . . . . . . . . . . . . . - - - - - 32 32Depreciation, depletion and amortization . . . . . . . . . . . . . . . . . . . . . . . . . . . . (240) (96) (47) (208) (16) - (607)Investments in affiliates . . . . . . . . . . . . . . . . . . . . . . . . . . . . . . . . . . . . . . . . . . . . . . . . . . 178 - - 116 - - 294Total assets . . . . . . . . . . . . . . . . . . . . . . . . . . . . . . . . . . . . . . . . . . . . . . . . . . . . . . . . . . . . . . . . . . 14,268 2,235 1,174 3,143 356 249 21,425Capital expenditures . . . . . . . . . . . . . . . . . . . . . . . . . . . . . . . . . . . . . . . . . . . . . . . . . . . . . . . 411 95 103 193 16 21 839
(1) Includes the noncontrolling interests’ share of interest and tax to reconcile to consolidated noncontrolling interests.
(2) Represents net income (loss) from discontinued operations.
(3) 2016 EBIT includes $122 million of gains related to disposition of equity interest in operations in Agribusiness, recorded in other income (expense)-net. In addition, Bunge recordedpre-tax impairment charges of $71 million and $9 million in other income (expense)-net and cost of goods sold, respectively. Of these pre-tax impairment charges, $44 million wasallocated to Sugar and Bioenergy, $27 million to Agribusiness and $9 million to Fertilizer.
(4) 2015 EBIT includes a $47 million gain on the sale of assets in Agribusiness. In addition, Bunge recorded pre-tax impairment charges of $57 million, of which $15 million, $14 millionand $13 million are included in cost of goods sold, selling, general and administrative expenses and goodwill impairment, respectively. Of these pre-tax impairment charges,$14 million was allocated to Agribusiness and $28 million to Edible Oil Products.
Total segment earnings before interest and taxes (‘‘EBIT’’) is an performance of its segments without regard to its financingoperating performance measure used by Bunge’s management methods or capital structure. In addition, EBIT is a financialto evaluate segment operating activities. Bunge’s management measure that is widely used by analysts and investors inbelieves total segment EBIT is a useful measure of operating Bunge’s industries.profitability, since the measure allows for an evaluation of the
2016 Bunge Annual Report F-47
BUNGE LIMITED AND SUBSIDIARIESNOTES TO THE CONSOLIDATED FINANCIAL STATEMENTS

F-48
Geographic area information for net sales to external26. SEGMENT INFORMATION (Continued)customers, determined based on the location of the subsidiary
A reconciliation of total segment EBIT to net income making the sale, and long-lived assets follows:attributable to Bunge follows:
YEAR ENDED DECEMBER 31,YEAR ENDED DECEMBER 31, (US$ in millions) 2016 2015 2014
(US$ in millions) 2016 2015 2014Net sales to external customers:
Total segment EBIT from continuing Europe $14,238 $14,346 $18,234operations $1,143 $1,248 $ 956 United States 10,239 10,256 12,199
Interest income 51 43 87 Asia-Pacific 7,843 8,680 10,932Interest expense (234) (258) (347) Brazil 6,604 6,117 10,422Income tax (expense) benefit (220) (296) (249) Argentina 1,406 1,490 1,857Income (loss) from discontinued Canada 1,120 1,245 1,784
operations, net of tax (9) 35 32 Rest of world 1,229 1,321 1,733Noncontrolling interests’ share of interest
Total $42,679 $43,455 $57,161and tax 14 19 36
Net income attributable to Bunge $ 745 $ 791 $ 515YEAR ENDED DECEMBER 31,
(US$ in millions) 2016 2015 2014Net sales by product group to external customers were as
Long-lived assets(1):follows:Brazil $2,452 $2,086 $2,711United States 1,249 1,130 1,022YEAR ENDED DECEMBER 31,Europe 1,107 1,074 1,181(US$ in millions) 2016 2015 2014Asia-Pacific 505 558 572
Agricultural Commodity Products $30,061 $ 31,267 $ 42,109 Canada 378 400 347Edible Oil Products 6,859 6,698 7,972 Argentina 189 204 257Wheat Milling Products 1,079 1,054 1,462 Rest of world 320 377 480Corn Milling Products 568 555 602
Total $6,200 $5,829 $6,570Sugar and Bioenergy Products 3,709 3,495 4,542Fertilizer Products 403 386 474
(1) Long-lived assets include property, plant and equipment, net, goodwill and otherTotal $42,679 $ 43,455 $ 57,161 intangible assets, net, investments in affiliates and non-current assets held for sale.
F-48 2016 Bunge Annual Report
BUNGE LIMITED AND SUBSIDIARIESNOTES TO THE CONSOLIDATED FINANCIAL STATEMENTS
F-49
27. QUARTERLY FINANCIAL INFORMATION (UNAUDITED)
QUARTER
(US$ in millions, except per share data) FIRST SECOND THIRD FOURTH YEAR END
2016Net sales . . . . . . . . . . . . . . . . . . . . . . . . . . . . . . . . . . . . . . . . . . . . . . . . . . . . . . . . . . . . . . . . . . . . . . . . . . . . . . . . . . . . . . . . . . . . $ 8,916 $ 10,541 $ 11,423 $ 11,799 $ 42,679Gross profit . . . . . . . . . . . . . . . . . . . . . . . . . . . . . . . . . . . . . . . . . . . . . . . . . . . . . . . . . . . . . . . . . . . . . . . . . . . . . . . . . . . . . . . . 620 530 556 704 2,410Income (loss) from discontinued operations, net of tax . . . . . . . . . . . . . . . . . . . . . . . . . . . . . . . . . (9) (4) 5 (1) (9)Net income (loss) . . . . . . . . . . . . . . . . . . . . . . . . . . . . . . . . . . . . . . . . . . . . . . . . . . . . . . . . . . . . . . . . . . . . . . . . . . . . . . . . . 232 120 130 285 767Net income (loss) attributable to Bunge . . . . . . . . . . . . . . . . . . . . . . . . . . . . . . . . . . . . . . . . . . . . . . . . . . . . 235 121 118 271 745Earnings per common share – basic(1)
Net income (loss) . . . . . . . . . . . . . . . . . . . . . . . . . . . . . . . . . . . . . . . . . . . . . . . . . . . . . . . . . . . . . . . . . . . . . . . . . . . . . . . . . $ 1.64 $ 0.86 $ 0.93 $ 2.04 $ 5.48
Net income (loss) from continuing operations . . . . . . . . . . . . . . . . . . . . . . . . . . . . . . . . . . . . . . . . . . . . . $ 1.64 $ 0.81 $ 0.80 $ 1.89 $ 5.13Net income (loss) from discontinued operations . . . . . . . . . . . . . . . . . . . . . . . . . . . . . . . . . . . . . . . . . . (0.07) (0.03) 0.03 (0.01) (0.06)
Net income (loss) to Bunge common shareholders . . . . . . . . . . . . . . . . . . . . . . . . . . . . . . . . . . . . . . . . $ 1.57 $ 0.78 $ 0.83 $ 1.88 $ 5.07
Earnings per common share – diluted(1)
Net income (loss) . . . . . . . . . . . . . . . . . . . . . . . . . . . . . . . . . . . . . . . . . . . . . . . . . . . . . . . . . . . . . . . . . . . . . . . . . . . . . . . . . $ $1.55 $ 0.86 $ 0.93 $ 1.92 $ 5.17
Net income (loss) from continuing operations . . . . . . . . . . . . . . . . . . . . . . . . . . . . . . . . . . . . . . . . . . . . . $ 1.60 $ 0.81 $ 0.79 $ 1.83 $ 5.07Net income (loss) from discontinued operations . . . . . . . . . . . . . . . . . . . . . . . . . . . . . . . . . . . . . . . . . . (0.06) (0.03) 0.04 (0.01) (0.06)
Net income (loss) to Bunge common shareholders . . . . . . . . . . . . . . . . . . . . . . . . . . . . . . . . . . . . . . . . $ 1.54 $ 0.78 $ 0.83 $ 1.82 $ 5.01
Weighted-average number of shares:Weighted-average number of shares outstanding – basic . . . . . . . . . . . . . . . . . . . . . . . . . . . . . . . . 141,062,415 139,406,634 139,444,320 139,475,593 139,845,124Weighted-average number of shares outstanding – diluted . . . . . . . . . . . . . . . . . . . . . . . . . . . . . 149,213,091 139,764,877 139,927,845 148,078,492 148,226,475Market price:
High . . . . . . . . . . . . . . . . . . . . . . . . . . . . . . . . . . . . . . . . . . . . . . . . . . . . . . . . . . . . . . . . . . . . . . . . . . . . . . . . . . . . . . . . . . . . . . . $ 66.82 $ 67.77 $ 66.21 $ 73.61Low . . . . . . . . . . . . . . . . . . . . . . . . . . . . . . . . . . . . . . . . . . . . . . . . . . . . . . . . . . . . . . . . . . . . . . . . . . . . . . . . . . . . . . . . . . . . . . . . $ 47.79 $ 55.62 $ 57.76 $ 58.64
2015Net sales . . . . . . . . . . . . . . . . . . . . . . . . . . . . . . . . . . . . . . . . . . . . . . . . . . . . . . . . . . . . . . . . . . . . . . . . . . . . . . . . . . . . . . . . . . . . $ 10,806 $ 10,782 $ 10,762 $ 11,105 $ 43,455Gross profit . . . . . . . . . . . . . . . . . . . . . . . . . . . . . . . . . . . . . . . . . . . . . . . . . . . . . . . . . . . . . . . . . . . . . . . . . . . . . . . . . . . . . . . . 710 535 745 703 2,693Income (loss) from discontinued operations, net of tax . . . . . . . . . . . . . . . . . . . . . . . . . . . . . . . . . 14 1 21 (1) 35Net income (loss) . . . . . . . . . . . . . . . . . . . . . . . . . . . . . . . . . . . . . . . . . . . . . . . . . . . . . . . . . . . . . . . . . . . . . . . . . . . . . . . . . 260 93 234 203 790Net income (loss) attributable to Bunge . . . . . . . . . . . . . . . . . . . . . . . . . . . . . . . . . . . . . . . . . . . . . . . . . . . . 263 86 239 203 791Earnings per common share – basic(1)
Net income (loss) . . . . . . . . . . . . . . . . . . . . . . . . . . . . . . . . . . . . . . . . . . . . . . . . . . . . . . . . . . . . . . . . . . . . . . . . . . . . . . . . . $ 1.79 $ 0.65 $ 1.63 $ 1.42 $ 5.50
Net income (loss) from continuing operations . . . . . . . . . . . . . . . . . . . . . . . . . . . . . . . . . . . . . . . . . . . . . $ 1.61 $ 0.50 $ 1.45 $ 1.33 $ 4.90Net income (loss) from discontinued operations . . . . . . . . . . . . . . . . . . . . . . . . . . . . . . . . . . . . . . . . . . 0.10 0.01 0.14 (0.01) 0.24
Net income (loss) to Bunge common shareholders . . . . . . . . . . . . . . . . . . . . . . . . . . . . . . . . . . . . . . . . $ 1.71 $ 0.51 $ 1.59 $ 1.32 $ 5.14
Earnings per common share – diluted(1)
Net income (loss) . . . . . . . . . . . . . . . . . . . . . . . . . . . . . . . . . . . . . . . . . . . . . . . . . . . . . . . . . . . . . . . . . . . . . . . . . . . . . . . . . $ 1.69 $ 0.64 $ 1.54 $ 1.35 $ 5.19
Net income (loss) from continuing operations . . . . . . . . . . . . . . . . . . . . . . . . . . . . . . . . . . . . . . . . . . . . . $ 1.58 $ 0.50 $ 1.42 $ 1.31 $ 4.84Net income (loss) from discontinued operations . . . . . . . . . . . . . . . . . . . . . . . . . . . . . . . . . . . . . . . . . . 0.09 - 0.14 (0.01) 0.23
Net income (loss) to Bunge common shareholders . . . . . . . . . . . . . . . . . . . . . . . . . . . . . . . . . . . . . . . . $ 1.67 $ 0.50 $ 1.56 $ 1.30 $ 5.07
Weighted-average number of shares:Weighted-average number of shares outstanding – basic . . . . . . . . . . . . . . . . . . . . . . . . . . . . . . . . 145,164,587 143,726,689 143,361,057 142,466,906 143,671,546Weighted-average number of shares outstanding – diluted . . . . . . . . . . . . . . . . . . . . . . . . . . . . . 153,817,713 144,626,753 151,794,399 150,744,716 152,238,967Market price:
High . . . . . . . . . . . . . . . . . . . . . . . . . . . . . . . . . . . . . . . . . . . . . . . . . . . . . . . . . . . . . . . . . . . . . . . . . . . . . . . . . . . . . . . . . . . . . . . $ 92.31 $ 92.85 $ 89.86 $ 79.41Low . . . . . . . . . . . . . . . . . . . . . . . . . . . . . . . . . . . . . . . . . . . . . . . . . . . . . . . . . . . . . . . . . . . . . . . . . . . . . . . . . . . . . . . . . . . . . . . . $ 78.50 $ 83.16 $ 68.94 $ 61.81
(1) Earnings per share to Bunge common shareholders for both basic and diluted is computed independently for each period presented. As a result, the sum of the quarterly earningsper share for the years ended December 31, 2016 and 2015 does not equal the total computed for the year.
2016 Bunge Annual Report F-49
BUNGE LIMITED AND SUBSIDIARIESNOTES TO THE CONSOLIDATED FINANCIAL STATEMENTS

(This page has been left blank intentionally.)
S-1
SIGNATURESPursuant to the requirements of Section 13 or 15(d) of the Securities Exchange Act of 1934, the Registrant has duly caused thisreport to be signed on its behalf by the undersigned, thereunto duly authorized.
BUNGE LIMITED
Dated: February 28, 2017 By: /s/ THOMAS M. BOEHLERT
Thomas M. BoehlertChief Financial Officer
Pursuant to the requirements of the Securities Exchange Act of 1934, this report has been signed below by the following personson behalf of the Registrant and in the capacities and on the dates indicated.
February 28, 2017 By: /s/ SOREN SCHRODER
Soren SchroderChief Executive Officer
February 28, 2017 By: /s/ THOMAS M. BOEHLERT
Thomas BoehlertChief Financial Officer
February 28, 2017 By: /s/ J. MATT SIMMONS, JR.
J. Matt Simmons, Jr.Controller and Principal Accounting Officer
February 28, 2017 By: /s/ ERNEST G. BACHRACH
Ernest G. BachrachDirector
February 28, 2017 By: /s/ ENRIQUE H. BOILINI
Enrique H. BoiliniDirector
February 28, 2017 By: /s/ CAROL M. BROWNER
Carol M. BrownerDirector
February 28, 2017 By: /s/ PAUL CORNET DE WAYS-RUART
Paul Cornet De Ways-RuartDirector
February 28, 2017 By: /s/ WILLIAM ENGELS
William EngelsDirector
2016 Bunge Annual Report S-1

S-2
February 28, 2017 By: /s/ ANDREW FERRIER
Andrew FerrierDirector
February 28, 2017 By: /s/ ANDREAS FIBIG
Andreas FibigDirector
February 28, 2017 By: /s/ KATHLEEN W. HYLE
Kathleen W. HyleDirector
February 28, 2017 By: /s/ L. PATRICK LUPO
L. Patrick LupoDirector and Chairman of the Board of Directors
February 28, 2017 By: /s/ JOHN E. MCGLADE
John E. McGladeDirector
S-2 2016 Bunge Annual Report
(This page has been left blank intentionally.)

(This page has been left blank intentionally.)

26MAR200813571231
Shareholder InformationCORPORATE OFFICEBunge Limited50 Main StreetWhite Plains, NY 10606U.S.A.914-684-2800
CONTACT INFORMATIONCorporate and Investor Relations914-684-3476
BOARD OF DIRECTORSL. Patrick Lupo, ChairmanErnest G. BachrachEnrique H. BoiliniCarol M. BrownerPaul Cornet de Ways-RuartWilliam EngelsAndrew FerrierAndreas FibigKathleen HyleJohn E. McGladeSoren Schroder, CEO Bunge Limited
SHAREHOLDER WEBSITEwww.computershare.com/investor
INVESTOR INFORMATIONCopies of the company’s annual report, filedwith the Securities and Exchange Commission(SEC) on Form 10-K, and other SEC filings canbe obtained free of charge on our website atwww.bunge.com or by contacting our InvestorRelations department.
STOCK LISTINGNew York Stock ExchangeTicker Symbol: BG
TRANSFER AGENTComputershare, Inc.480 Washington BoulevardJersey City, NJ 07310-1900U.S.A.
U.S. Shareholders Toll-Free800-851-9677
Shareholders Outside the U.S.201-680-6578
TDD for Hearing-ImpairedU.S. Shareholders800-231-5469
TDD for Hearing-ImpairedShareholders Outside the U.S.201-680-6610
ANNUAL MEETINGThe annual meeting will be held onMay 25, 2017, at 10:00 a.m. at the Sofitel Hotel,45 West 44th Street, New York, NY 10036, U.S.A. See the proxy statement for additional information.
INDEPENDENT AUDITORSDeloitte & Touche LLP
www.bunge.com

www.bunge.com
50 Main StreetWhite Plains, NY 10606U.S.A.