Embed Size (px)
Citation preview

Brian Ray*
University of Ottawa
April 2021
________________________________________________________
* Brian Ray is an Associate Professor, Geography, Environment and Geomatics at the
University of Ottawa
Many Versions of Work in Ottawa-
Gatineau’s Labour Market: A profile of
immigrant workers and their economic
status in a post-industrial city
Research Report

2
Executive Summary
This report profiles the immigrant population residing in the Ottawa-Gatineau metropolitan
area, with an emphasis on the labour market involvement and employment earnings of women
and men who have settled recently in Canada. Information from the 2016 Canadian census
highlights the complexity of the immigrant population and its economic activities. The Ottawa-
Gatineau metropolitan area is unusual in several ways – the division of the region between two
provinces; an almost complete absence of manufacturing; high median employment earnings;
and the federal government as the region’s largest industry. This report is a point-in-time
snapshot of immigrants’ socio-economic and employment status in an urban economy
dominated by services with unique employment challenges created by the federal government.
The social and cultural diversity of immigrant population in the Ottawa-Gatineau region has
grown; consequently, different characteristics of the immigrant population are considered
including admission class, time since permanent residence attainment, language heritage,
birthplace, educational attainment, and visible minority status). It is important to recognized
from the outset that Ottawa-Gatineau’s immigrant population is highly educated. Over half of
recent immigrants age 25-54 have a university-level degree (56.2%) compared to 39.1% of
Canadian-born individuals in the same age group. In this study, the Canadian-born population
constitutes a benchmark group. The analysis focuses on full-time and full-year workers
between the ages of 25 and 54 and is largely restricted to individuals who attained permanent
residence status between 2000 and the first five months of 2016. Very recent immigrants who
have been permanent residents for five years or less are distinguished where possible.
Important differences between residents in Ottawa and Gatineau are discussed.
The report has two large sections. The first describes the demographic and social characteristics
of the immigrant population living in Ottawa-Gatineau, with an emphasis on recent immigrants.
The second section shifts to examine labour force integration and earnings among relatively
3
recent immigrants, as well as more well-established individuals who have lived in Canada for
decades.
In Ottawa’s labour market, there is considerable variation between groups of immigrants, as
well as between women and men. The major findings are:
• Labour force participation is strong for all admission classes, although it is lower among
refugees and their rate of unemployment is higher.
• The region’s largest industrial sector is public administration and employment in the
federal government constitutes the vast majority of all jobs in the sector. Among
Canadian-born individuals aged 25-54, 18.3% work in the federal civil service compared
to 10.1% of recent immigrants and 3.5% of the newest arrivals (2011 to 2014).
• Employment earnings emphasize differences in work status between immigrants with
equivalent qualifications. The median employment earnings of those who arrived
between 2011 to 2014 is only $50,263 compared to $65,673 for Canadian-born workers.
Among economic immigrants who have held permanent residence since at least 2001,
their median income is $64,845 – less than $1,000 behind that of their Canadian-born
counterparts. The earnings of refugees are considerably lower and lag those of other
groups even as length of residence in Canada increases.
• Regardless of arrival class, an earnings gap exists between immigrant women and men.
The same is true among Canadian-born workers. While for the most part, the earnings
gap is in favor of Canadian-born individuals, as length of residence increases the
earnings of men who arrived through the economic admission class begin to eclipse
those of Canadian-born men. The same is not true for women.
• Considerable variation in earnings exists between visible minority groups. Consistently,
Chinese and South Asian immigrants have higher earnings than their Black and Arab
counterparts. White immigrant men lead other ethno-racial groups in employment
earnings.

4
Many relatively recent immigrants in Ottawa-Gatineau achieve considerable success in finding
well-paid opportunities. There is inequality between groups and between women and men in
terms of earning gaps even when equivalent educational attainments are controlled. The gaps
point to inequality of opportunity, and raise the spectre of hiring and workplace discrimination.

5
Introduction
In recent decades, the Ottawa-Gatineau metropolitan area has become an important hub for
immigrant settlement in Canada. The reasons why immigrants are attracted to Ottawa-
Gatineau are numerous and complicated, but the metropolitan area enjoys a prosperous
economy, a high standard of living, and housing that is more affordable relative to Canada’s
largest cities like Toronto and Vancouver. Ottawa-Gatineau also has a large high-tech sector
that during the 1990s attracted a large number of highly educated immigrants during a period
of considerable expansion and prosperity. Relative to the rest of Canada, the metropolitan area
also disproportionately experienced the post-2000 high-tech bubble burst. Evidence suggests
that immigrants, and most especially men, working in this sector experienced the information
technology downturn more acutely than other groups (Picot and Hou 2009). The metropolitan
area, therefore, is a compelling case study for understanding the employment trajectories and
income changes over time among highly educated individuals that immigration policy
deliberately sought to attract to places where engineering and information technology were a
growing portion of the economy.
Ottawa-Gatineau is also notable for other qualities of its economy and labour force compared
to other Canadian cities – there is almost no manufacturing activity. As such, the city is an
extreme example of a post-industrial economy in which the vast majority of employment is in
the service sector (Andrew, Ray and Chiasson 2011). One of the most important reasons to
focus on Ottawa-Gatineau is its service-based economy; as such, it may highlight some of the
challenges and opportunities that immigrants in other cities will face as employment in those
places move away from goods production. Ottawa-Gatineau also leads many other large
Canadian cities in median employment earnings, although it tends not to have as many

6
extremely wealthy households as found in other cities.1 In addition, the region’s largest
employer is the federal government, which largely limits civil service employment opportunities
to Canadian citizens. Consequently, most immigrants must find initial employment
opportunities beyond the city’s largest employer – a circumstance that would be roughly
equivalent to the exclusion of newcomers from employment in the largest industrial sector in
any other large city.
This report is a point-in-time snapshot of immigrants’ socio-economic and employment status
in Ottawa-Gatineau. It presents an analysis of data from the 2016 census and as such captures
a time before the arrival of large numbers of Syrian refugees, as well as the economic recession
brought about by the COVID-19 pandemic. Nevertheless, the data do provide important
insights about the successes had and challenges faced by a highly diverse immigrant
community in an urban economy dominated by services. The fundamental structure of the
Ottawa-Gatineau economy has not changed because of the COVID-19 pandemic, although
some sectors have been more strongly affected than have others. Finally, the social, cultural
and linguistic diversity of immigrant groups will remain largely unchanged after the pandemic
has passed into history. In order to assess future challenges, it is important to appreciate how
ethno-racial status and gender construct several versions of economic integration for
immigrants living today in Ottawa-Gatineau in the present.
Apart from the importance of service employment, Ottawa-Gatineau is a divided jurisdiction
between Ontario and Québec. The division of the metropolitan area is consequential in a
myriad of ways, and several are discussed and analyzed by Gilbert et al. (2014). The division of
1 In terms of median household earnings (total), data from the 2016 census places Ottawa-Gatineau in sixth position behind Calgary, Edmonton, Oshawa, Regina and Saskatoon. The high incomes in the western cities reflect a period of significant economic expansion and prosperity in resource extraction industries. For example, in the four western cities incomes increased between 22.7% (Calgary) and 37% (Saskatoon) in the 2005 to 2015 time-period. In Ottawa-Gatineau, incomes rose only by 4.3%. (Statistics Canada, 2016. Income Highlight Tables, 2016 Census).

7
the Ottawa-Gatineau is legal and formal, but as Gilbert et al. (2014) reveal, people organize
everyday activities and their perceptions of opportunities or challenges in one place or the
other in ways that reveal that the border is more than just a jurisdictional framework. Three of
the most important aspects of the division with respect to immigration and employment are:
• Québec plays a more active role in immigrant recruitment and settlement services than
does Ontario (Charette 2021);
• Labour laws are different in the two provinces and these differences are especially
important with respect to trades, apprenticeships and regulated professions. This is
especially important with respect to the ease with which individuals can take advantage
of employment opportunities on one jurisdiction or the other. Moreover, the process to
attain certification in a particular trade or profession is not the same in both provinces
Türegün 2017; Adams 2016; Germain 2013); and
• In Québec, the Canadian-born children of immigrants enrolled in the public education
system are required to attend French-language schools (Gilbert et al., 2014).
It is also important to recognize that Ottawa (ON) is also almost three times the size of
Gatineau (QC) and the economic focal point of the region. The vast majority of federal
government employment is located in Ottawa, the downtown core with an array of offices and
services is largely concentrated in Ottawa, and the region’s growing high-technology sector is
primarily found in Kanata, which is located in Ottawa’s western suburbs. The current
configuration of Ottawa and Gatineau is a consequence of municipal amalgamations during the
early 2000s, although the Québec portion of the region includes a number of independent
municipalities beyond Gatineau. The City of Ottawa is almost contiguous with the geographic
extent of the Ontario portion of the metropolitan area. Layering on to the municipal division is
a linguistic divide – the vast majority of Francophones reside in the Québec portion of the
region and Anglophones largely live in Ottawa (Ray and Gilbert 2020). The newcomer
population is also overwhelmingly concentrated in Ottawa – approximately 86% of all

8
immigrants reside in Ottawa (compared to 72% of the Canadian-born population). An ever-
growing proportion of new immigrants, however, opt to live in Gatineau – among immigrants
who have held permanent residence status for less than five years, 20.4% lived in Gatineau in
2016 compared to 15.2% who arrived ten years earlier.
With respect to employment and socio-economic status overall, this study emphasizes that
there is not just one ‘immigration’ experience in Ottawa-Gatineau. When considering
immigrants and their socio-economic position in this region, it is important to recognize from
the outset that immigration class, time since permanent residence attainment2, age, gender,
education and visible minority status (among other factors) influence outcomes. Consequently,
this analysis presents data about socio-economic status in a disaggregated manner in order to
capture some of the important variation that exists within the immigrant population. A large
body of research draws attention to the very different occupational and income outcomes in
the labour market for women and men (Pelletier, Patterson and Moyser 2019; Conference
Board of Canada 2013; Block and Galabuzi 2011; Cool 2010; McCall 2001). The reasons for
gender inequality are complex (Eswaran 2014) and most especially so in immigrant
communities in which gender roles and norms vary considerably (Frank and Hou 2015).
Consequently, the analysis highlights gender differences with respect to key aspects of human
capital, labour market characteristics and employment income. Where differences are not
substantively different between women and men, such as with respect to age, the analysis
focuses on the immigrant population in total.
2 Due to changes in immigration regulations since the early 2000s, an increasing number of immigrants live in Canada for a period of time before attaining permanent residence status. International students are a prime example. Therefore, the report refers to when immigrants attained permanent residence status instead of time of arrival in Canada.

9
Methodological Notes
Data from the 2016 Census of Canada are the primary source for this analysis. A series of cross-
tabulations of social, economic and demographic variables organized at the scale of the
Ottawa-Gatineau Census Metropolitan Area (CMA) and the Québec and Ontario provincial
components of the metropolitan area are at the core the analysis constitute the core of the
analysis.3 The analysis focuses on individuals aged 25 to 54. The data also adopt a long
residence period to identify “recent immigrants,” individuals who attained permanent
residence status after 1999. Such a long residence period has been selected to maintain a
sufficient number of respondents in particular categories to facilitate a meaningful analysis.
When possible and feasible, very recent immigrants (i.e., individuals who have been permanent
residents for five years or less) are discussed. There is some variation in the permanent
residence periods identified, largely because of variation in the specification of categories in
the original tabulations. Finally, it is important to bear in mind that income reports earnings for
2015 and only for people who work full time and full year. The analysis does not report
earnings for individuals working part-time or only part of the year to maintain consistency in
comparisons between groups. There is no reason to anticipate that the proportion of
individuals working less than full-time will be consistent between across all immigrant and
gender groups. In order for individuals who work full time and full year to report 2015 earnings,
it is crucial that they live in Canada for at least one year. Consequently, for earnings analyses,
the most recent year of permanent residence attainment is 2014.
All tables are available in Appendix A and most provide information for the CMA and the
Québec and Ontario sectors of the metropolitan region. For the most part, the report focuses
3 For detailed description of the 2016 census data tables, see: https://www12.statcan.gc.ca/census-recensement/2016/dp-pd/dt-td/More-eng.cfm Statistics Canada predetermines the variables and categories for each variable, which can limit the ability to use identical categories for every characteristic examined.

10
on metropolitan trends but the reader has the possibility to examine the unique circumstances
of each portion of the region. For some characteristics, the differences between women and
men are also not dramatically different. In these instances, the report does not distinguish each
gender but the data are available in the appendix.4
There is tremendous variation in employment status by age as older people with more
experience in the labour market generally have higher incomes and better occupational status.
Moreover, young individuals (aged 15 to 24 and younger) often move in and out of the labour
market, alternating full-time work and study or combining part-time work with their studies.
Consequently, to the extent afforded by the data, this analysis focuses on individuals aged 25
to 54 in order to control for some of the variation in labour market attachment. In addition, a
sizable proportion of new immigrants, and especially visible minorities residing in Ottawa-
Gatineau, are young adults (i.e., 25-54). Older adults (55 and over) are not included in the
analysis because their incomes are relatively high and they are overwhelmingly white and from
European origins. Given their age and ethno-racial background, older adults tend to be doubly
advantaged in the labour market relative to younger adult groups in which visible minorities
make up a much larger share of the group. Due to the relative good fortune of the older adult
groups, their inclusion would mask some of the challenges faced by younger visible minority
immigrants who are more likely to face discrimination in the labour market (Pendakur and
Pendakur 2011).
Finally, where appropriate and meaningful, the Canadian-born population is used as a
comparison group. A preoccupation of research about immigrant integration in a new society is
the relative position of newcomers, be they recently settled or long established, to the native-
born population with respect to labour market participation, industry of employment,
occupations and earnings. The report begins by describing the demographic and social
4 The tables are in the order that sequence by which each characteristic is discussed.

11
characteristics of the immigrant population and then shifts to consider the characteristics of
labour force integration among immigrants living in Ottawa-Gatineau. To understand the
labour market status of newcomers in part relies on an appreciation of the variation in their
demographic and social characteristics.
Key Social and Demographic Characteristics of the Immigrant Population
In 2016, out of the total Ottawa-Gatineau population of slightly more than 1.3 million people,
approximately 255,800 were permanent residents5 and another 17,200 were non-permanent
or temporary residents. Immigrants constitute 19.7% of the metropolitan population overall,
and 22.6% and 11.0% of the population in the Ontario and Québec portions of the region
respectively.6 Non-permanent residents constitute less than 2% of Ottawa’s population and
less than 1% of Gatineau residents. Underlying these numerical counts is significant diversity in
immigrants’ socio-economic and employment characteristics.
Permanent Residence Attainment and Age
A sizable portion of Ottawa-Gatineau’s foreign-born population is comprised of recent arrivals –
approximately 36% of immigrants have held permanent residence in Canada for less than 15
years and 10.5% for less than five years (Figure 1 and Table 1).
5 In this report, the terms “immigrants” and “newcomers” refer to foreign-born individuals who hold permanent residence status in Canada. A relatively small number of individuals are non-permanent residents admitted to Canada under the auspices of a number of different temporary residence programs; consequently, permanent residents are not considered in this study. 6 To ease the reading of this report, from this point onwards, “Gatineau” refers to the Québec portion of the metropolitan area. A number of municipalities comprise the Québec portion of the metropolitan area, but Gatineau is where the largest share of the total population lives (83%). The municipality of Gatineau is also where the vast majority (93.8%) of immigrants reside in the Québec sector of the CMA.

12
Under existing immigration policy, independent adult applicants benefit in the selection
process if they are relatively young. Consequently, immigrants who obtained permanent
residence in Canada recently are also likely to be young adults (Table 2). In Ottawa-Gatineau,
young adults (25 to 44 years old) constitute a sizable proportion of the total immigrant
population – 30.7% (Figure 2). Only 25.5% of the Canadian-born population is in this young
adult category. Immigrants to Canada are overwhelmingly adults when they arrive, which
means that the Canadian-born population is comprised of a larger proportion of children and
smaller proportion of adults over the age of 65. In short, the foreign-born population has an
older age profile than the Canadian-born largely because selection policies favour the working-
age and few children arrive as immigrants.
Figure 1: Period of Permanent Residence Attainment, Immigrants (25-54), Ottawa-Gatineau Census Metropolitan Area, 2016

13
Figure 2: Age Groups of the Immigrant Population, Ottawa-Gatineau 2016
Canadian immigration policy’s bias toward young adults is especially evident when recent new
arrivals are considered. Immigrants who have been permanent residents for less than 15 years
have a different age profile than all immigrants and the Canadian-born population (Figure 3).
Among recent immigrants, 44.6% are 25 to 44 years old and they constitute an important pool
of workers, many of whom are in the early stages of career building. Few recent immigrants are
under 15 years old and a very small proportion are 65 years of age or older. In many ways,
distinguished by their youth, recent immigrants in Ottawa-Gatineau are an important pool of
newly trained talent.
Figure 3: Age Structure of Recent Immigrants (2001-14), Ottawa-Gatineau Metropolitan Area, 2016

14
Immigrants by Admission Category
One of the many ways in which diversity is manifest among the foreign-born population in
Ottawa-Gatineau is in terms of the programs by which individuals gain entry to Canada.
Although immigration is a shared responsibility under the Constitution between the federal
government and provinces, the federal government sets the broad parameters for obtaining
permanent resident status. There are three principal avenues by which applicants may attain
permanent residence: the “economic” stream, whereby an application is evaluated largely on
the basis of the human capital characteristics of the principal applicant; the “sponsorship”
stream in which an applicant is sponsored by a close family member who is a permanent
resident or citizen; and the “refugee” stream in which individuals who are recognized as
refugees are selected for permanent residence in Canada. The refugee stream includes
individuals who are recognized as bona fide refugees by an international organization (e.g., the
United Nations), as well as individuals who make a successful asylum claim in Canada.
With regard to immigrants living in Ottawa-Gatineau and who attained permanent residence
after 1979, by far the largest share were in the economic class (46.2%) (Figure 4a and Table 3)7.
These individuals include principal applicants, as well as an applicant’s immediate family. The
next largest share are individuals sponsored by family members (28.7%), followed by refugees
(24%). Considering only the most recent arrivals (2011-2016), the proportions are remarkably
consistent relative to the foreign-born population overall (Figure 4b). Compared to the country
as a whole, the proportion of economic migrants living in Ottawa-Gatineau is lower, while the
proportion of refugees is higher. In 2016, among recent immigrants living anywhere in Canada,
60.3% arrived via the economic stream and only 11.6% were refugees. To some extent, the
7 At the time of the 2016 census, Statistics Canada was only able to identify the admission class of individuals who arrived in Canada after 1979.
15
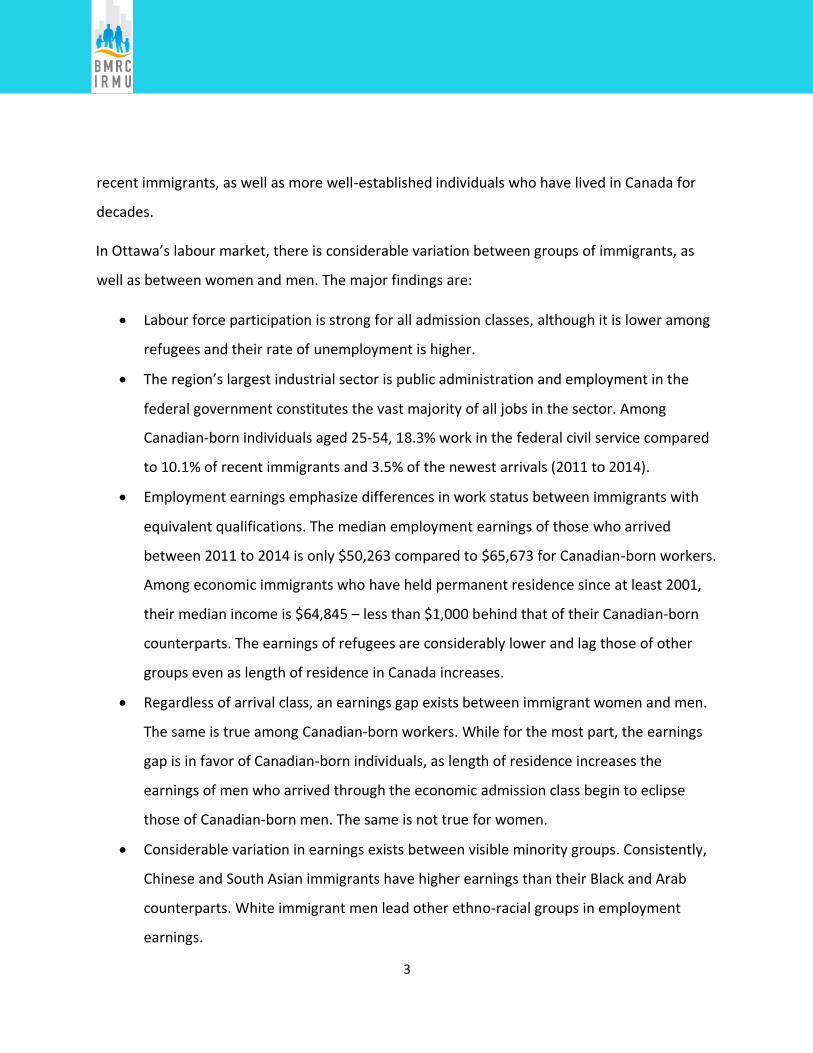
higher number of refugees in Ottawa-Gatineau reflects the fact that many large urban areas
have social services intended to help refugees settle successfully.
Figure 4a: Admission Category of Immigrants since 1980, Ottawa-Gatineau 2016
Figure 4b: Admission Category of Recent Immigrants (2011-14), Ottawa-Gatineau 2016
Since 1980, the proportion of immigrants in each of the admission categories has changed
(Figure 5). Most notably, the proportion of economic class immigrants rose by approximately
10% after 2001, although more recently the proportion has declined slightly (48%) from a high
of 51.8% in 2001 to 2005. The refugee stream has also seen important changes – the

16
proportion of immigrants entering under this program declined from a high of 29% in the 1980s
to stabilize at approximately 21% in recent decades. In contrast to the other two major
categories, the proportion of immigrants achieving permanent residence through family
reunification has remained quite stable since 1980 (approximately 30%).
Figure 5: Immigrants by Admission Category, 1980 to 2016, Ottawa-Gatineau CMA
Immigrants by Visible Minority Status and Place of Birth
To capture the social complexity of Ottawa-Gatineau’s immigrant population is challenging as
individuals have participated in many types of migration and collectively represent an array of
linguistic, cultural, religious and ethnic identities. The foreign-born category includes individuals
who have been in Canada for decades and who arrived during a period when immigration
policy largely excluded non-Europeans, as well as young recent arrivals from all parts of the
world. Highly indicative of the changing qualities of immigration to Ottawa is the growing
absolute and relative size of the visible minority population (Figure 6 and Table 4). Only 21.6%
of the entire Ottawa- Gatineau population self-identifies as a visible minority, as does less than
0.0%
10.0%
20.0%
30.0%
40.0%
50.0%
60.0%
1980 to1990
1991 to2000
2001 to2010
2001 to2005
2006 to2010
2011 to2016
Economic immigrants Immigrants sponsored by family
Refugees Other immigrants
17
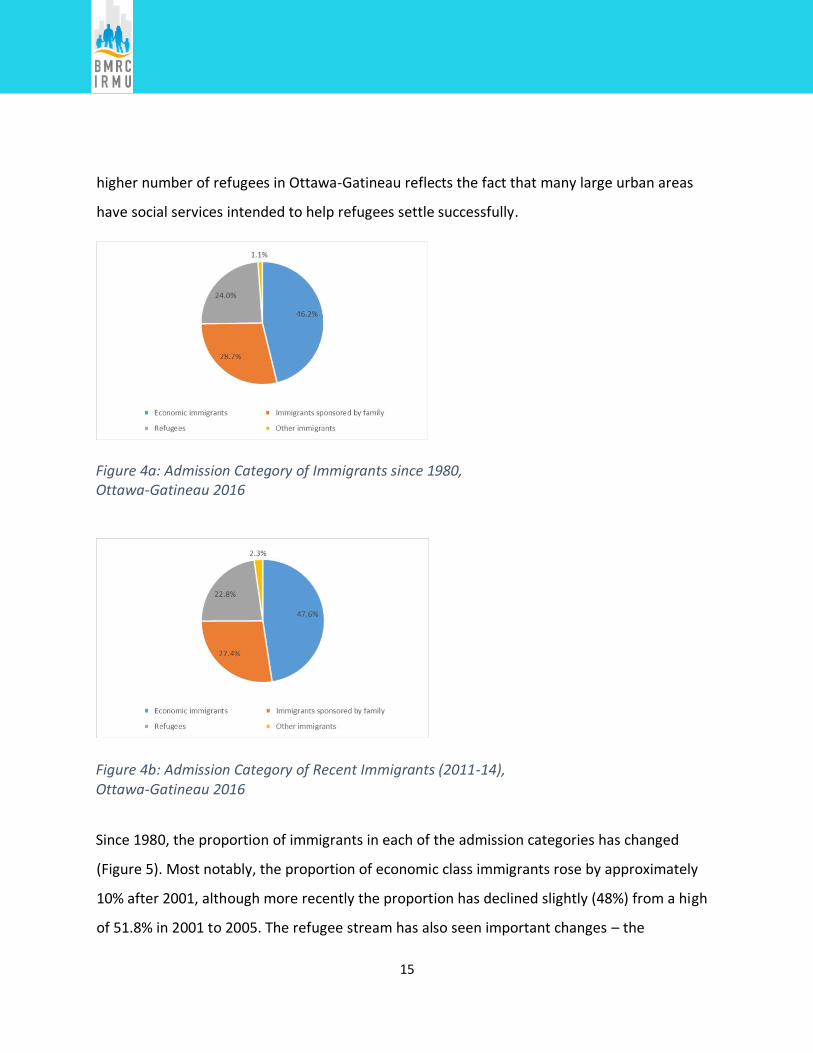
10% of the Canadian-born. However, among immigrants the proportion is much higher: 65.8%
all immigrants and 80.6% of recent arrivals (2001-2016) are visible minorities. Importantly, the
proportional representation of visible minorities in Ottawa (25%) is more than double that of
Gatineau (11.6%), and represents an important social difference between the two parts of the
metropolitan area (Table 4). The largest visible minority groups among recent newcomers are
Black, Arab, South Asian and Chinese, although the proportions in Ottawa and Gatineau are
quite different. For example, Blacks comprise 48.1% of recent immigrants in Ottawa but only
26.4% in Gatineau (Table 4).
Figure 6: Visible Minority Population by Period of Immigration, Ottawa-Gatineau CMA, 2016
Ottawa-Gatineau’s foreign-born population has settled in the region from many different parts
of the world. Until the early 1990s, newcomers were overwhelmingly from European countries
of origin but in recent decades, the origin countries of migrants have diversified markedly (Ray
and Gilbert 2020). Considering newcomers who have been in Canada for 15 years or less, the
vast majority were born in Asia and Africa (Figure 7 and Table 5). Asia is a vast geographic area
of tremendous ethnic and cultural diversity; however, the majority of recent immigrants from
Asia living in Ottawa-Gatineau originated in four countries: China, India, the Philippines and
Lebanon. Over the last 20 years, the number of African immigrants has also grown steadily,
18
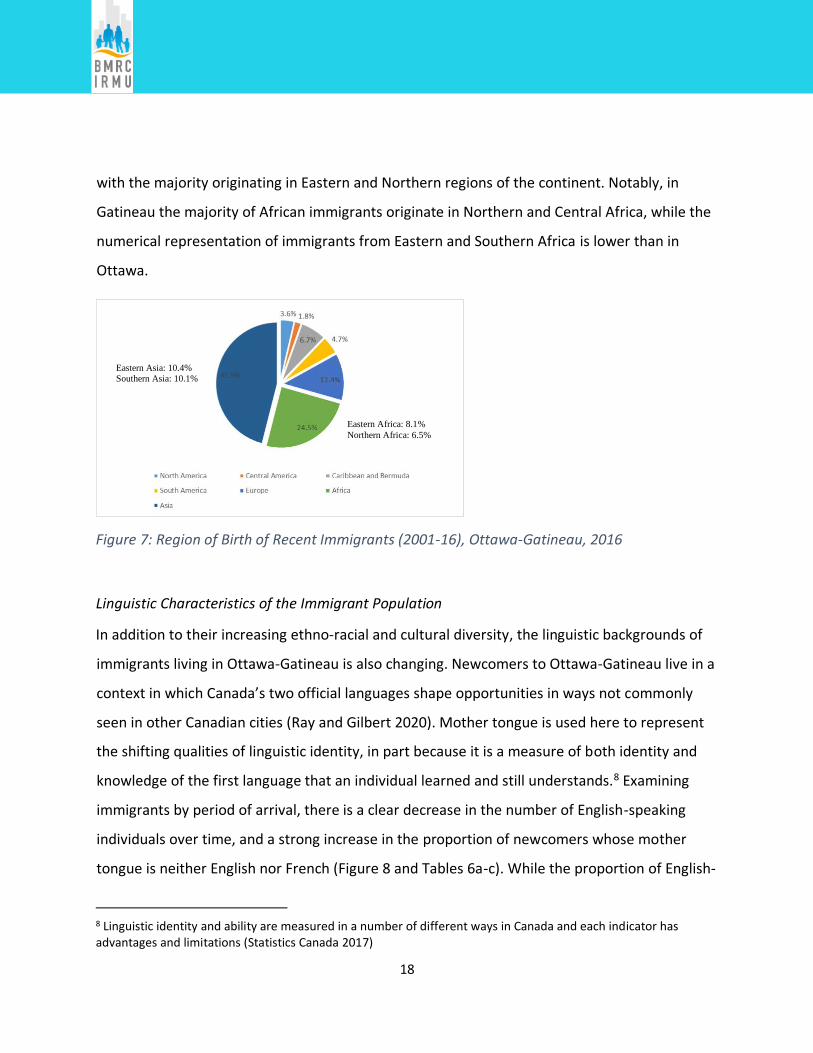
with the majority originating in Eastern and Northern regions of the continent. Notably, in
Gatineau the majority of African immigrants originate in Northern and Central Africa, while the
numerical representation of immigrants from Eastern and Southern Africa is lower than in
Ottawa.
Figure 7: Region of Birth of Recent Immigrants (2001-16), Ottawa-Gatineau, 2016
Linguistic Characteristics of the Immigrant Population
In addition to their increasing ethno-racial and cultural diversity, the linguistic backgrounds of
immigrants living in Ottawa-Gatineau is also changing. Newcomers to Ottawa-Gatineau live in a
context in which Canada’s two official languages shape opportunities in ways not commonly
seen in other Canadian cities (Ray and Gilbert 2020). Mother tongue is used here to represent
the shifting qualities of linguistic identity, in part because it is a measure of both identity and
knowledge of the first language that an individual learned and still understands.8 Examining
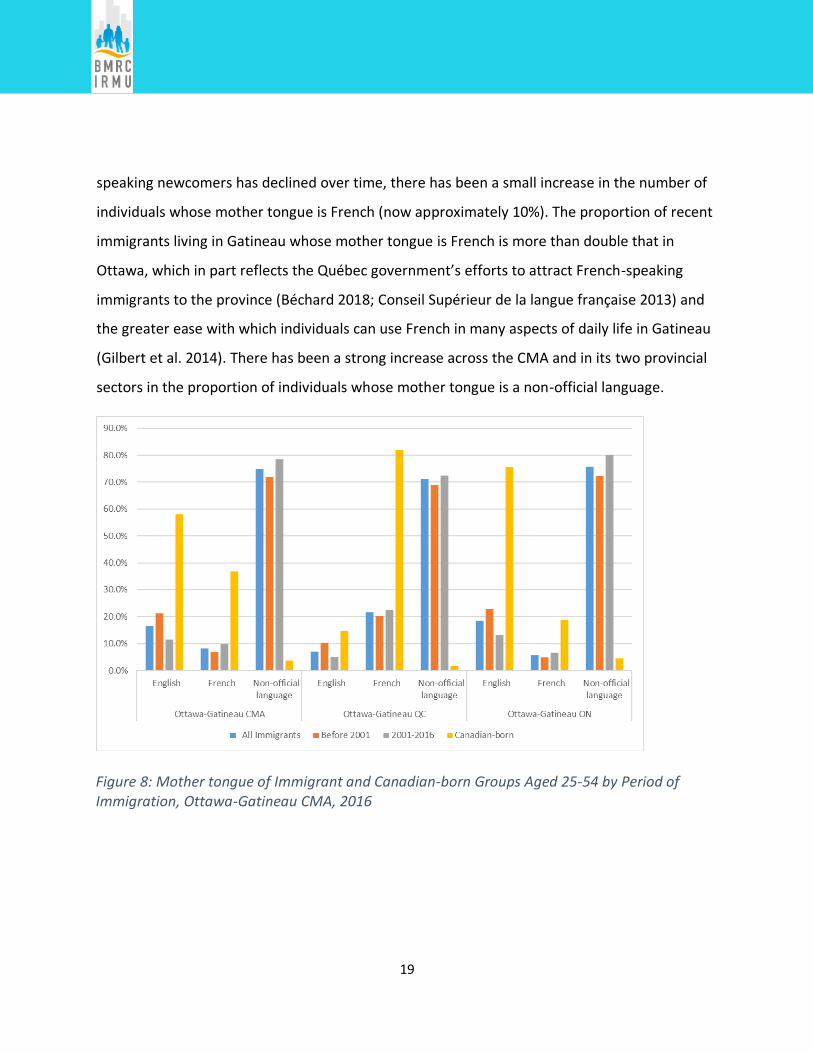
immigrants by period of arrival, there is a clear decrease in the number of English-speaking
individuals over time, and a strong increase in the proportion of newcomers whose mother
tongue is neither English nor French (Figure 8 and Tables 6a-c). While the proportion of English-
8 Linguistic identity and ability are measured in a number of different ways in Canada and each indicator has advantages and limitations (Statistics Canada 2017)
Eastern Asia: 10.4%
Southern Asia: 10.1%
Eastern Africa: 8.1%
Northern Africa: 6.5%
19
speaking newcomers has declined over time, there has been a small increase in the number of
individuals whose mother tongue is French (now approximately 10%). The proportion of recent
immigrants living in Gatineau whose mother tongue is French is more than double that in
Ottawa, which in part reflects the Québec government’s efforts to attract French-speaking
immigrants to the province (Béchard 2018; Conseil Supérieur de la langue française 2013) and
the greater ease with which individuals can use French in many aspects of daily life in Gatineau
(Gilbert et al. 2014). There has been a strong increase across the CMA and in its two provincial
sectors in the proportion of individuals whose mother tongue is a non-official language.
Figure 8: Mother tongue of Immigrant and Canadian-born Groups Aged 25-54 by Period of Immigration, Ottawa-Gatineau CMA, 2016
20
Educational Characteristics of the Immigrants
Ottawa-Gatineau’s immigrants also bring considerable educational capital to the region. In
terms of highest level of educational attainment, the recent immigrant population (2001-14) in
the prime labour force years (25-54) is more highly educated than both the immigrant
population overall and the Canadian-born population (Figure 9). Over half of recent immigrants
in this age category have a university-level degree (56.2%) compared to 39.1% of Canadian-
born individuals. The educational profile of women and men is almost identical, with a slightly
smaller proportion of women who attained permanent residence after 2000 having a university
degree relative to men (Table 7a-c). The most striking differences in educational attainment are
relative to individuals born in Canada. A considerably higher proportion of Canadian-born
individuals have a college, CEGEP or apprentice-level education than immigrants overall. The
relatively large proportion of the total immigrant population that has no educational diploma
or degree is also striking (14.2%), especially when compared to the Canadian-born population.
However, changes in selection criteria under provisions of the Immigration and Refugee
Protection Act (2001), which gives greater weight to educational attainment and other human
capital characteristics in applicant selection than was true under earlier immigration acts, has
effectively shifted the educational attainment characteristics of recent immigrants. Among
immigrants who achieved permanent status between 2001 and 2014, the proportion of
working age adults over the age of 25 with no high school level certificate or diploma is quite
low (less than 8.5%) and those with a university degree is substantially greater (Table 7a).

21
Figure 9: Highest educational attainment of recent (2001 - 2014) Immigrants and Canadian-born, Ottawa-Gatineau 2016
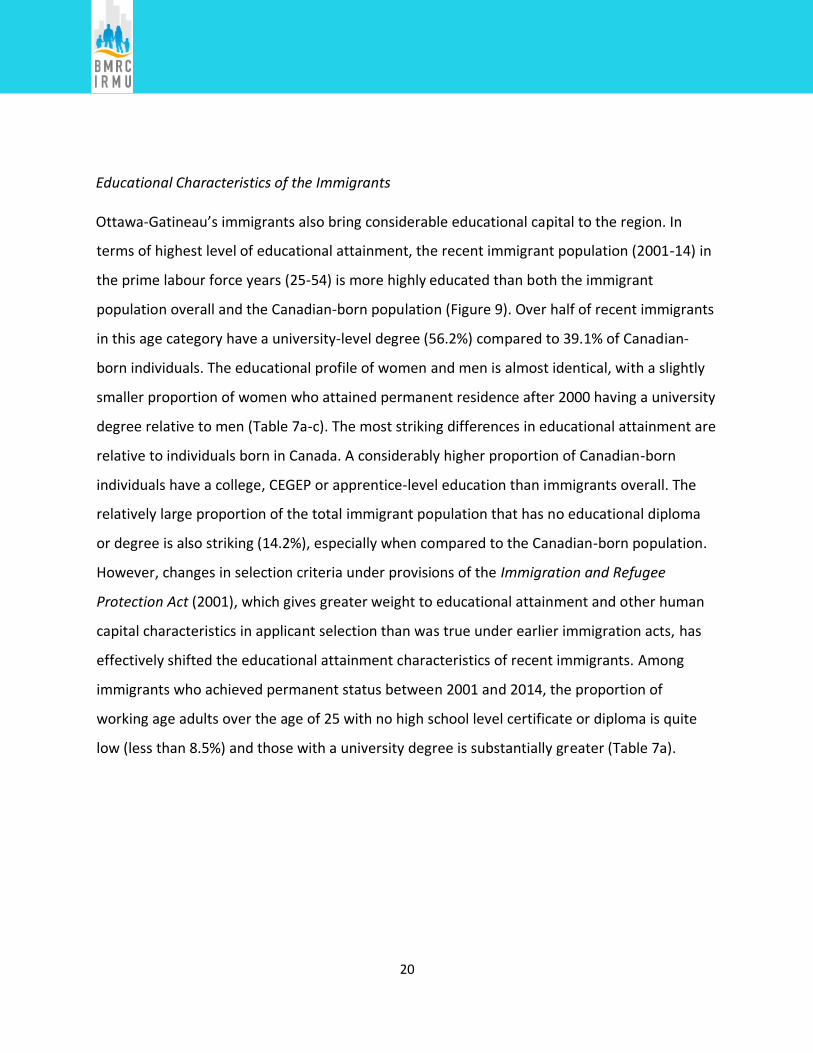
Looking beyond educational attainment to post-secondary fields of study, important
differences between immigrants and the Canadian-born population and between women and
men are evident (Figure 10 and Tables 8a-c). A far greater proportion of the foreign-born
population received training in STEM fields (i.e., Science, Technology, Engineering and
Mathematics): 25.3% compared to 14.3% of the Canadian-born (see Picot and Hou 2018 for a
detailed discussion comparing immigrant and Canadian-born education in STEM disciplines).9
9 In all groups, the largest proportion of individuals with some post-secondary training studied in Business, Humanities and Arts, Social and Behavioural Sciences, Legal Professions, Health Care, Education, and Trades, services, natural resources and conservation (i.e., BHASE (non-STEM)).
22
Figure 10: Field of Study of Immigrant and Canadian-born Individuals (25-54) holding Post-Secondary Certificate, Diploma or Degree by Gender, Ottawa-Gatineau CMA, 2016
Women are considerably less likely than men to have been educated in one of the STEM fields
(Table 8a-c). Among recent immigrants, only 15.1% of women have a STEM degree or diploma
compared to 35.2% of men. Nevertheless, a larger proportion of recent immigrant women than
Canadian-born women (8.4%) has STEM educational credentials. Clearly, immigrant women,
whether long established or recent, lead their Canadian-born counterparts in STEM training.
The “BHASE” group of disciplines is considerably more heterogeneous than the STEM group,
with specializations spanning from the humanities and social sciences to health and legal
professions. Approximately half of Canadian-born men and 70% of Canadian-born women were
trained in one of these fields; in contrast, the proportions of immigrant men and women are
lower. Given the heterogeneity of this group of disciplines, it is more meaningful to compare
training in specific fields within the BHASE group (Table 8a-c). To illustrate, consider the four
leading fields of specialization among women and men in this group. A higher proportion of
recent immigrants aged 25-54 than their Canadian-born counterparts specialize in business and
administration and health care, whereas a higher proportion of Canadian-born individuals

23
specialized in trades, services and natural resources and conservation, and the social and
behavioural sciences. The most striking difference between the foreign-born and the Canadian-
born groups is in the trades, services, natural resources and conservation category where the
proportion of Canadian-born individuals is almost double that of recent immigrants aged 25-54.
It is also notable that double the proportion of recent immigrant men (5.9%) than Canadian-
born men (2.5%) is trained in health care and recent immigrant women (10.5%) also lead their
Canadian-born counterparts (7.4%) in terms of health care training.
The foreign-born population living in Ottawa-Gatineau is complex, heterogeneous and difficult
to characterize succinctly. Importantly, it is a population that has grown substantially over the
last several decades and has become more diverse in terms of ethno-racial background and
human capital characteristics. The next section moves away from a broad overview of the
demographic, social and cultural characteristics of immigrants to examine their involvement in
the local labour market. More specifically, immigrant labour market participation,
unemployment rates, industries and occupations of employment, and income are the focus of
attention for individuals aged 25 to 54.
Employment Status, Industry, Occupations and Earnings
Labour Market Involvement
Labour force participation rates are strong for all classes of immigrants, with individuals in the
economic class leading those in other classes (Figure 11 and Table 9). This is not surprising
given that economic immigrants are selected based on human capital characteristics, including
prior work experience. The unemployment rate of this group is also low relative to immigrants

24
from other admission categories.10 The “principal applicants” in the class also have slightly
better labour force participation and unemployment rates relative to “secondary applicants”,
whose admission to Canada is largely determined by the human characteristics of the principal
applicant. In contrast, refugees have much lower rates of labour force activity. The labour force
participation rate of refugees is 67.1% compared to 86.2% for economic immigrants, and their
unemployment rate is substantially higher (14.6%) relative to the other groups. The reasons for
refugees’ lower rate of labour force participation are numerous, but the trauma of forced
displacement, language proficiency, lack of credentials, lack of Canadian experience, absence of
social ties with people who are not co-ethnics, and time out of the labour market seem to have
an important affect (Bevelander and Pendakur 2012). For all admission classes, the
employment rate11 is lower than the labour force participation rate but it is notable that the
employment rate for refugees is the lowest relative to all other groups (57.4%). This suggests
that a substantial portion of refugee adults between 25 to 54 years of age do not participate in
the labour force at all and points to the particularly daunting settlement challenges faced by
refugees in Canadian cities. It is true that, the most recent arrivals in all groups (2001 to 2016),
have the lowest rates of labour force participation and highest rates of unemployment (Table
9), but this set of circumstances is magnified among refugees.
10 The unemployment rate for a particular group is the number of people who are active members of the labour force but are unemployment. The rate is expressed as a percentage for the group. 11 The employment rate for a particular group is the number of employed persons in that group expressed as a percentage of the total population in the group.

25
Figure 11: Employment Status of Recent Immigrants (2001-16) by Admission Class, Ottawa-Gatineau CMA, 2016.
There are important differences in employment characteristics between women and men in
each admission class. Among recent immigrants (2001 – 2016) aged 25 to 54, the labour force
participation rate for women in approximately 10 percent lower for women than men (Figure
12). As an illustration, the labour force participation rate among women who are principal
applicants in the economic class is 79.5% in Ottawa-Gatineau compared to 94.5% for men
(Table 10). At the same time, unemployment among women is also slightly higher (10.8%
compared to 8.4%). This pattern remains consistent across the admission classes and points to
somewhat greater challenges for women than men in finding employment. The rate of refugee
unemployment is particularly high – 16.9% among recent women and 13.6% of men aged 25 to
54.

26
Figure 12: Employment Characteristics of Recent Immigrant Women and Men (aged 25 to 54) by Admission Class, Ottawa-Gatineau CMA, 2016
Industrial Sectors of Employment for Immigrants
There are important differences in the industrial sectors of employment between immigrants
and the Canadian-born population in Ottawa-Gatineau. This in part is a function of the federal
government’s hiring restrictions based on citizenship.12 In contrast to other major Canadian
cities, the manufacturing sector in Ottawa-Gatineau is quite small and relatively few
individuals, whether Canadian-born or immigrants, find employment in this sector (less than 3%
of individuals aged 25-54). In Ottawa-Gatineau, a sizable share of all immigrants, including
recent arrivals, find employment in the health care and social assistance sector (approximately
16%) and professional, scientific and technical services (11%) (Figure 13 and Tables 11).
Notably, a larger proportion of immigrants find employment in these two sectors than does the
12 Under the provisions of the Public Service Employment Act (2003), hiring preference is given to Canadian citizens over permanent residents for externally posted positions in the Canadian public service. See: https://laws-lois.justice.gc.ca/eng/acts/p-33.01/FullText.html
27
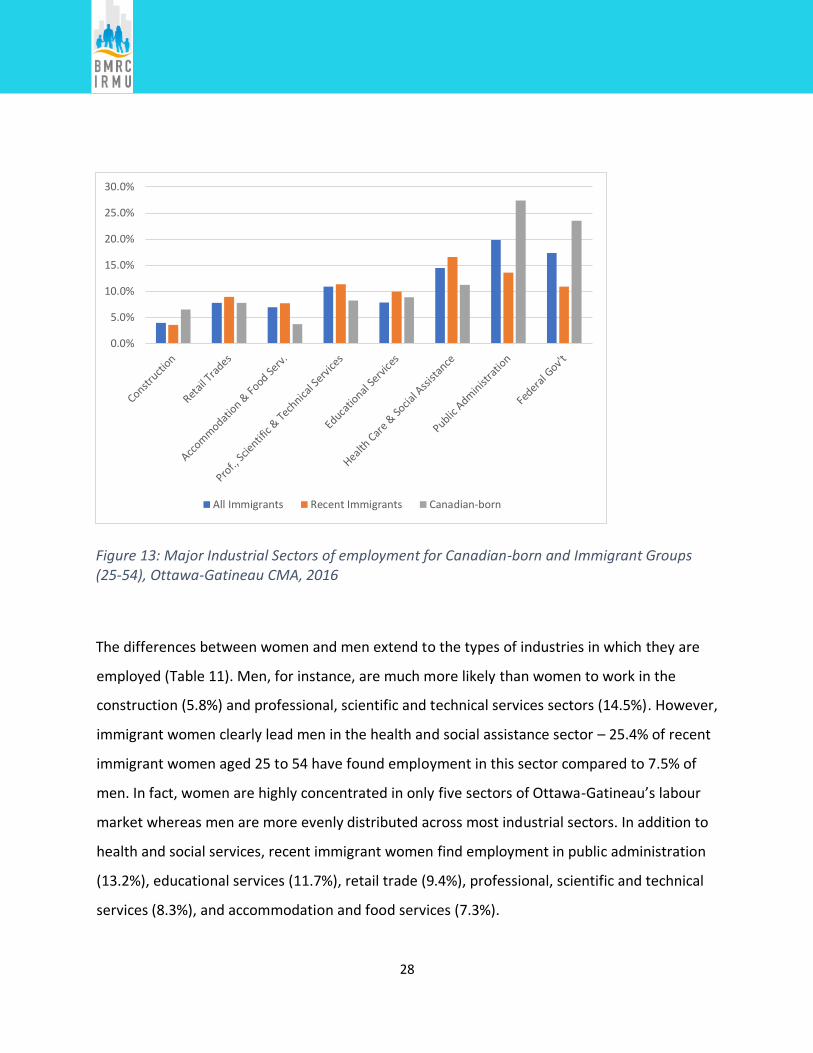
Canadian-born population. The same is also true in retail trades and the accommodation and
food services sectors. The region’s largest sector of employment is public administration and
employment in the federal government constitutes the vast majority of all jobs in the sector.
Among Canadian-born individuals aged 25-54, 18.3% work in the federal civil service compared
to 10.1% of recent immigrants and 3.5% of the newest arrivals (2011 to 2014). In fact,
considering the entire immigrant population between the ages of 25 to 54, only 15.4% works
for the region’s largest employer. Hiring rules within the federal government largely limit
employment to Canadian citizens, thereby excluding most newcomers from employment in this
sector for at least their first three years of permanent residence. This means that Ottawa-
Gatineau’s labour market is somewhat exceptional compared to other Canadian cities, as
newcomers are essentially not eligible for employment in the region’s largest sector.
Consequently, there is an over-representation of immigrants relative to the Canadian-born in
other sectors of the local economy, many of which are far less well paid and stable than the
federal civil service.
28
Figure 13: Major Industrial Sectors of employment for Canadian-born and Immigrant Groups (25-54), Ottawa-Gatineau CMA, 2016
The differences between women and men extend to the types of industries in which they are
employed (Table 11). Men, for instance, are much more likely than women to work in the
construction (5.8%) and professional, scientific and technical services sectors (14.5%). However,
immigrant women clearly lead men in the health and social assistance sector – 25.4% of recent
immigrant women aged 25 to 54 have found employment in this sector compared to 7.5% of
men. In fact, women are highly concentrated in only five sectors of Ottawa-Gatineau’s labour
market whereas men are more evenly distributed across most industrial sectors. In addition to
health and social services, recent immigrant women find employment in public administration
(13.2%), educational services (11.7%), retail trade (9.4%), professional, scientific and technical
services (8.3%), and accommodation and food services (7.3%).
0.0%
5.0%
10.0%
15.0%
20.0%
25.0%
30.0%
All Immigrants Recent Immigrants Canadian-born

29
The industrial sectors in which immigrants and Canadian-born individuals work provide a good
indication of local labour market segmentation (Ellis et al., 2007; Waldinger and Lichter 2003).
The strong presence of recent immigrants in some sectors such as health care and their
absence in others is one indicator of complex process giving rise to labour market segmentation
labour force complexity. Likewise, the predominance of women over men in particular
industries and vice-versa, as well as the greater proportion of immigrants in some industrial
sectors as their residence in Canada increases, challenges and limits generalization about
immigrants ‘labour force status.
Occupation of Immigrants
The representation of immigrants across industrial sectors highlight two critical points about
employment in Ottawa-Gatineau. First, the federal civil service, the largest industrial sector in
the metropolitan region, employs a small number of immigrants and provides almost no
opportunities to individuals who are new permanent residents. Secondly, it emphasizes the
degree to which low- and high-skill service-based industries provide the lion’s share of
opportunities for newcomers. In Ottawa-Gatineau’s post-industrial economy, some immigrants
quite quickly move into a variety of producer services industries that generally demand a high
degree of education and skill, while many others work in consumer services even if they have
resided in Canada for a long time. This analysis, however, does not shed light on the kind of
work that individuals perform. For instance, an individual in health care could be working as a
doctor or an orderly or an administrator.13
13 Available microdata for the analysis of occupational status at the census metropolitan level is quite limited; consequently, occupational attainment cannot be discussed in detail. Analysis presented here is limited to immigrants disaggregated by time of permanent residence attainment and the Canadian-born population. Analysis disaggregated by age and gender at the census metropolitan level is not possible given data limitations. This discussion of occupational attainment therefore includes all individuals aged 15 and over who are active in the labour market. Nevertheless, for the immigrant population the analysis has been refined to incorporate period of residence, which is an indirect indicator of age.
30
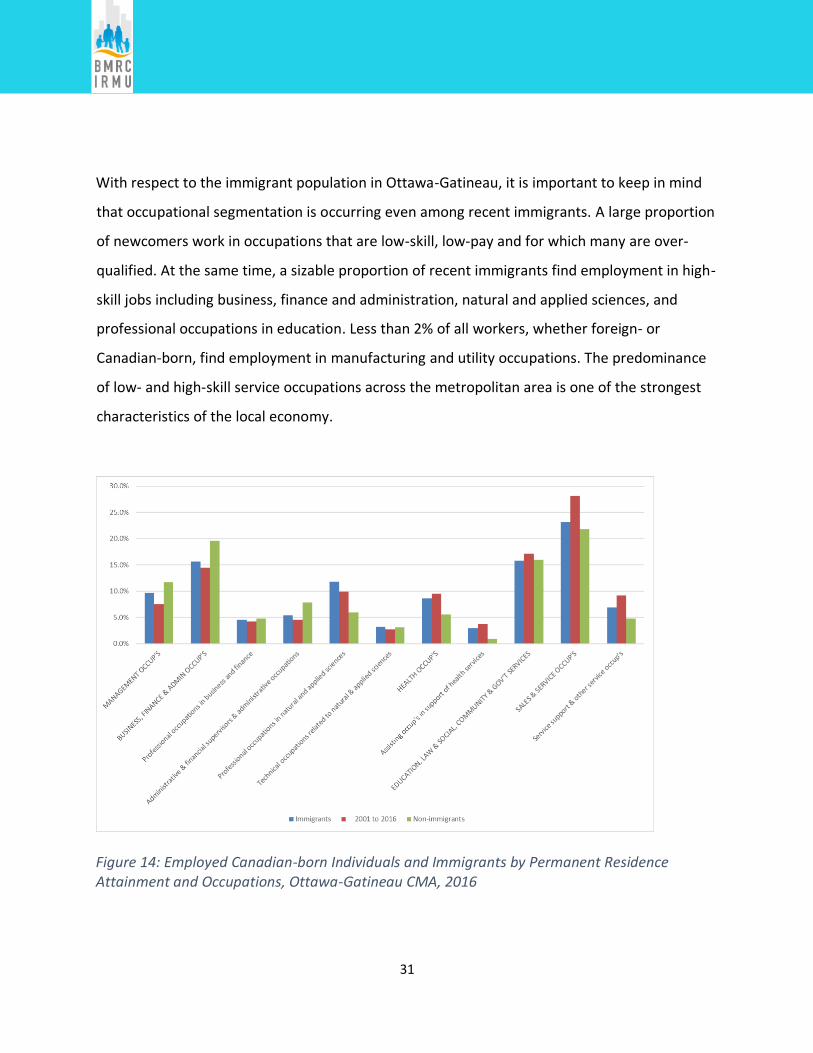
Figure 14 does point to quite different occupational characteristics between immigrants and
the Canadian-born population in Ottawa-Gatineau. The predominance of Canadian-born
individuals (19.6%) in business, finance and administration occupations relative to recent
immigrants (14.5%) is striking, as is the strong presence of recent immigrants in other
occupations such as health care (9.5%) sales and service (28.2%) (Tables 12 a-c). In health care,
recent immigrants are more likely to work in assisting occupations (3.8%) than their Canadian-
born counterparts (1.4%), and given the gender differences found among people working in the
health sector, this work is probably dominated by women (Table 13a). It should also be noted
that a very large share of immigrants who have lived in Canada for five years or less work in
sales and service occupations – 33.4%. Within this occupational category, recent immigrants
predominate in occupations with relatively low-skill requirements and wages; namely, service
support occupations, which include cleaners, kitchen helpers and laundry workers.
It is important not to lose sight of the fact that many immigrants work in high-skill occupations;
again, highlighting a segmentation of the immigrant workforce by both industry and occupation
(Tables 12 a-c). For instance, a slightly greater proportion of immigrants, whether recently
settled or long established, than Canadian-born individuals work in natural and applied sciences
professional occupations: only 6% of Canadian-born individuals compared to 11.8% of all
immigrants and 9.9% of recent arrivals (Table 13). In general, these jobs require university-level
training and credentials. There is another set of non-professional or “technical” occupations
related to natural and applied sciences that employ a slightly smaller proportion of immigrants
than Canadian-born workers. In these occupations, the required skill level is somewhat lower.
The reasons for these differences in the employment of immigrants and Canadian-born
individuals between these two occupational classes in the natural and applied sciences
certainly merits investigation, as does the degree to which women and men are present in
these two important occupational classes of Ottawa-Gatineau’s post-industrial economy.
31
With respect to the immigrant population in Ottawa-Gatineau, it is important to keep in mind
that occupational segmentation is occurring even among recent immigrants. A large proportion
of newcomers work in occupations that are low-skill, low-pay and for which many are over-
qualified. At the same time, a sizable proportion of recent immigrants find employment in high-
skill jobs including business, finance and administration, natural and applied sciences, and
professional occupations in education. Less than 2% of all workers, whether foreign- or
Canadian-born, find employment in manufacturing and utility occupations. The predominance
of low- and high-skill service occupations across the metropolitan area is one of the strongest
characteristics of the local economy.
Figure 14: Employed Canadian-born Individuals and Immigrants by Permanent Residence Attainment and Occupations, Ottawa-Gatineau CMA, 2016

32
Employment Income Earnings of Immigrants: Admission Class, Period of Arrival, Level of Education and Visible Minority Status
Given diversity in educational attainment, industrial sector of employment, occupations and
period of arrival, immigrants’ earnings are also expected to vary. There are several ways to
represent the range of employment income outcomes; however, this overview examines data
for immigrants based on length of residence since landing14 in Canada and a range of other
characteristics such as education and visible minority status. The analysis uses median
employment income for individuals aged 25-54 who were employed full time and full year
during 2014.15
Examining the employment earnings of all workers, two trends are immediately apparent:
there is considerable variation across the admission classes and economic immigrants’ earnings
exceed those of the Canadian-born (Figure 15 and Table 13). It does take time, however, for
economic immigrants to attain high incomes. The median employment earnings of those who
arrived between 2011 to 2014 is only $50,263 compared to $65,673 for Canadian-born
workers. Nevertheless, among economic immigrants who have held permanent residence since
at least 2001, their median income is $64,845 – less than $1,000 behind that of their Canadian-
born counterparts. The incomes of refugees and individuals sponsored by relatives are virtually
identical when period of arrival is not considered. However, among individuals who settled
after 2001, there is a considerable earnings gap between the two groups, with refugees faring
less well. For example, among individuals sponsored by family members, and who achieved
permanent residence between 2001 and 2010, median earnings exceed those of refugees by
14 Immigrants land when they obtain permanent residence. 15 Statistics Canada calculates median employment income values based on predetermined period of arrival intervals; hence, it is not possible to create a median value for the 2001 to 2014 time period of permanent residence as had been done in earlier portions of this report. Consequently, data are reported for two time periods (2001 to 2010 and 2011 to 2014), as well as for the entire immigrant population regardless of when permanent residence was attained.
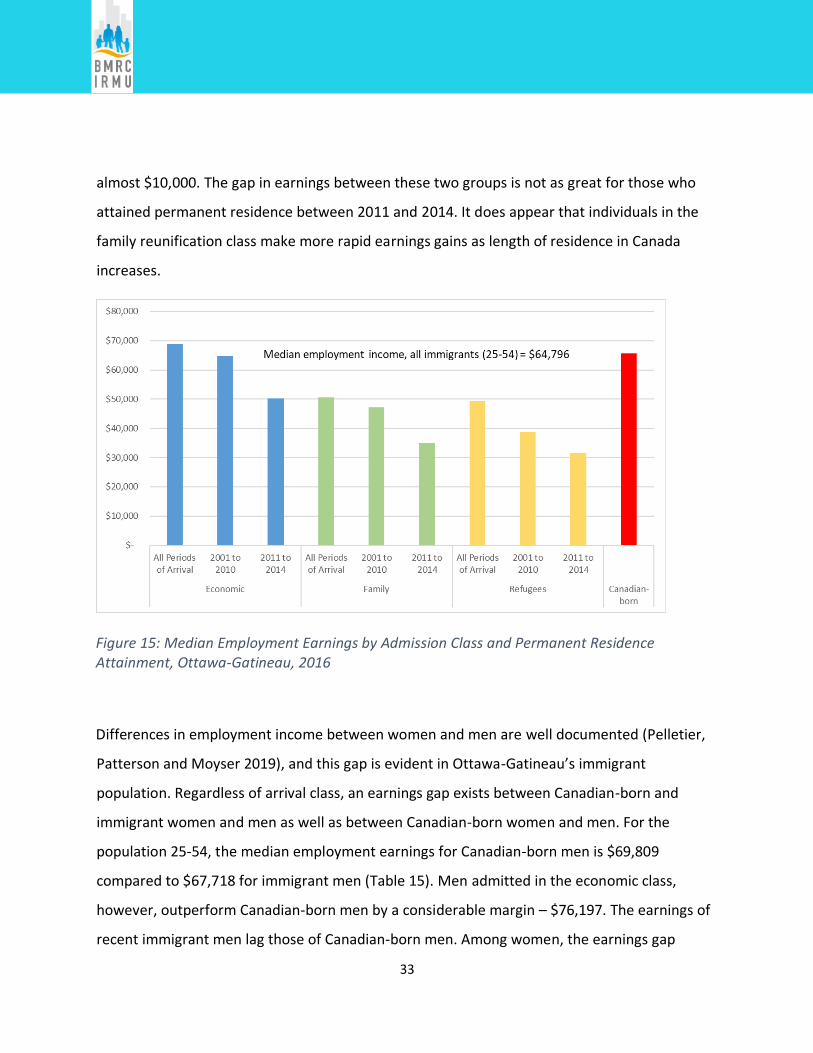
33
almost $10,000. The gap in earnings between these two groups is not as great for those who
attained permanent residence between 2011 and 2014. It does appear that individuals in the
family reunification class make more rapid earnings gains as length of residence in Canada
increases.
Figure 15: Median Employment Earnings by Admission Class and Permanent Residence Attainment, Ottawa-Gatineau, 2016
Differences in employment income between women and men are well documented (Pelletier,
Patterson and Moyser 2019), and this gap is evident in Ottawa-Gatineau’s immigrant
population. Regardless of arrival class, an earnings gap exists between Canadian-born and
immigrant women and men as well as between Canadian-born women and men. For the
population 25-54, the median employment earnings for Canadian-born men is $69,809
compared to $67,718 for immigrant men (Table 15). Men admitted in the economic class,
however, outperform Canadian-born men by a considerable margin – $76,197. The earnings of
recent immigrant men lag those of Canadian-born men. Among women, the earnings gap

34
between all immigrants and the Canadian-born population is somewhat wider: the median
employment income for immigrant women aged 25-54 is $55,237 compared to $61,876 for
their Canadian-born counterparts. The gap grows as period of residence nears the present –
the median earnings of women who arrived between 2011 and 2014 was only $37,888. The
same pattern of employment earnings seen for men by arrival class is also evident for women –
economic class women have a considerable earnings advantage of more than $10,000 over
women in the family and refugee classes (Table 13). Unlike men, however, the median
employment earnings of women admitted through the economic class do not exceed those of
Canadian-born women. Among women aged 25 to 54, median earnings for the Canadian-born
are $61,876 compared to $59,572 for all economic class immigrant women.
It is clear that there is a significant earnings gap between immigrant men and women, even
though differences in educational attainment are small. Examining all immigrants aged 25 to 54
regardless of admission class, men who arrived between 2001 and 2010 earned $62,806
compared to $55,237 for women (Table 13). The difference was even more extreme among
economic class migrants where the median income for men exceeded that for women by
approximately $19,000. In the other admission classes, the difference in earnings was less
extreme and almost non-existent among refugees. For those aged 25 to 54 who attained
permanent residence between 2001 and 2010, refugee women had a slight earnings advantage
over men ($38,997 versus $38,669), but their incomes lag well behind those of newcomers in
other admission classes. It appears that refugees work in some of the least well paid jobs and
that there is little difference in the wages paid to women and men.
Gender differences in employment income attainment are equally evident when considering
education levels and period of residence attainment (Figure 16). Among individuals aged 25-54
who worked full time, full year four trends are immediately apparent from the data: 1.
Employment income increases for women and men as level of education increases, regardless
of when permanent residence was attained; 2. Income increases the longer immigrants have

35
resided permanently in Canada; 3. Considerable income disparity exists between women and
men, although it is generally less extreme among individuals with lower educational
attainment; and 4. The Canadian-born population has a substantial earnings advantage over
immigrants, although this does tend to diminish as immigrants’ period of residence in Canada
increases.
Employment income is substantially lower for individuals with relatively low levels of education
compared to other immigrants who have been in Canada for a similar period of time (Figure 16
and Table 14). For example, among male immigrants aged 25-54 who achieved permanent
residence status between 2011 and 2014, individuals with only a secondary (high school)
diploma earned a median income of $32,392. In contrast, those with college credentials or a
university diploma/degree had median incomes of $43,683 and $63,574 respectively. The one
exception to this trend is among men and women with an apprentice or trades diploma who
have only held permanent residence for three years or less – this group earned less than their
counterparts with a secondary diploma. The trend, however, is short-lived among men who
hold an apprentice or trades qualification as their earnings exceed those of men with a
secondary diploma as length of time from achieving permanent residence increases.16 The
same trend, however, is not evident among women.
16 The median income of women holding apprentice and trades qualifications must be treated with caution as the values reflect the incomes of a relatively small number of individuals.

36
Figure 16: Changes in Employment Income Attainment over Time for Immigrants Aged 25-54 by Gender, Ottawa-Gatineau CMA, 2016
In general, among women and men with equivalent qualifications, incomes generally increase
over time. For example, among women with a college or CEGEP diploma, employment income
increases from $33,080 among those who have most recently attained permanent residence to
$47,912 among women who are established the longest (Figure 16). Among individuals with a
university degree, incomes generally plateau after the year 2001 for both men and women –
there is very little difference in employment income between individuals in the two earliest
permanent residence periods.
Whether examining women and men by period of residence attainment or comparing
Canadian-born women and men, it is clear that men hold a distinct earnings advantage over
women in virtually every side-by-side comparison (Figure 16). The earnings differential
between immigrant women and men aged 25 to 54 in the same education classes does tend to
diminish over time; nevertheless, an overall gap persists. The gap is least significant between
37
women and men with a secondary diploma, especially among individuals who have been long-
time residents. The earnings gap does decline over time for women and men with a university
degree, but a difference of just over $10,000 remains for individuals who have been resident in
Canada the longest. This gap is not unique to immigrants, as an important earnings gap exists
between Canadian-born women and men in each education class, although again it is less
marked among those with a secondary diploma (less than $4,000). A gap of approximately
$13,000 exists between Canadian-born men and women with a college degree or a university
degree.
Finally, for each level of educational attainment except a university degree, a strong earnings
gap is evident between Canadian-born and immigrants aged 25-54, regardless of time since
permanent residence or gender (Figure 16). Comparing individuals with equivalent education
levels, Canadian-born individuals have a distinct advantage over immigrants whether they are
recent or long-term residents. This is especially true for those with secondary school,
apprenticeship and trades, or college qualifications. The earnings gap between Canadian-born
women and men with a university degree and immigrants is much narrower relative to the
other education groups, especially among individuals who have been permanent residents for
at least 14 years or more. In fact, the median earnings of immigrant women who attained
permanent status between 1981 and 1990 slightly exceed those of Canadian-born women,
while the earnings of men are similar among those who attained permanent residence status
before 2001.
The earnings gaps between women and men, immigrants and Canadian-born individuals, and
different immigrant groups based on length of residence since landing in Canada suggest
considerable heterogeneity in the circumstances of newcomers that can produce different
outcomes. Nevertheless, the variation between groups persists even when educational
attainment is controlled. Employment earnings, however, also vary considerably between
visible minority and white immigrants, as well as between different visible minority groups, for

38
the population aged 25-54 working full time and full year (Figure 17 and Table 15).17 In Ottawa-
Gatineau, non-visible (i.e., white) immigrants have a distinct earnings advantage over visible
minority immigrants. For example, the median earnings of visible minority men lag those of
white men by approximately $20,000. Among women, the gap is somewhat less extreme –
approximately $14,000. The earnings of both groups overall are lower in Gatineau compared to
Ottawa. Among immigrants living in Gatineau, the largest gap in earnings between visible
minority and white immigrants is among women (~$13,000). The gap between men is also
much lower in Gatineau relative to the metropolitan area (~$12,000). In contrast, immigrants
living in Ottawa have the higher median incomes and the earnings gap between visible minority
and white immigrant men is substantial -- $23,676.
Figure 17: Employment Income of Individuals (25-54) Employed Full Time, Full Year by Visible Minority Status and Gender, Ottawa-Gatineau CMA and Component Sectors, 2016
17 In this analysis, time since permanent residence is not controlled. However, individuals are all within the same age bracket and there is no reason to anticipate that a markedly larger proportion of white immigrants have resided longer in Canada than visible minority immigrants.

39
There is also considerable variation within the visible minority population with respect to
employment earnings. Considering only individuals aged 25 to 54 in full time, full year
employment, and setting aside educational attainment for the moment, Chinese immigrants
lead all other groups in employment earnings ($59,765) and their earnings exceed those of the
white immigrant population ($54,479). Other immigrant groups, however, do not fare nearly as
well. Among Black immigrants, employment earnings are only $33,234, and the Arab
population fares the least well ($30,674).18
It might be reasonable to attribute the differences in employment earnings between visible
minority groups to differences in educational attainment. However, results change little when
level of education is controlled (Table 16). For instance, among individuals with a secondary
school diploma, the earnings of Chinese and South Asian immigrants exceed those of Black and
Arab immigrants (Figure 18a). The differences between groups are not extreme, most
especially among women. More striking is the much higher earnings of white immigrants with a
secondary school diploma – a $14,000 difference between white and all visible minority
immigrants. The differences in earnings between visible minority groups are more extreme
among individuals with a university degree (Figure 18b). Employment earnings of Chinese men
and women exceed those of their counterparts in every other group. To illustrate, median
earnings among Chinese immigrant men is $82,336 compared to $49,844 for Black men. The
earnings difference among women is not as extreme. Chinese women’s median earning value is
$64,782 compared to $42,776 for Black women. Regardless of level of education and gender, a
consistent gap in earnings exists between Ottawa-Gatineau’s four largest visible minority
groups: Chinese and South Asian immigrants have much higher earnings relative to their Black
and Arab counterparts.
18 See Table 17 for detailed employment earnings for men and women (total) and aged 25 to 54 by educational attainment.

40
Figure 18a: Secondary (High School) Diploma Figure 18b: University Degree
Figure 18: Median Employment Income of Immigrant Visible Minority Individuals (Aged 25-54) by Educational Attainment and Gender, Ottawa-Gatineau CMA, 2016
The differences in earnings could be attributed to people with a similar level of education being
trained to take employment in different parts of the labour force. This may well be the case;
nevertheless, the patterns of earned income differences between groups remain when type of
education is considered. Examining immigrants with a university degree who were trained in
one of the STEM fields, the pattern of inequality between visible minority groups remains
(Figure 19 and Table 17).19 Examining this very specific group of individuals aged 25 to 54, white
immigrant men lead all other groups of immigrants in median employment earnings ($94,977).
Chinese ($87,028) and South Asian ($81,542) men also have relatively high incomes, but the
earnings of Arab and Black men are substantially lower (approximately $56,000). Among
women, Chinese and white women switch positions as Chinese women have the highest
earned income ($74,504) and Black women trained in a STEM field earn the least ($42,519). In
each visible minority group, the median earnings of men exceed those of women, although the
greatest earning gap is found between white immigrant men and women – men earn almost
19 To place these findings in a larger context, Picot and Hou (2018) argue that immigrants trained in STEM disciplines earn markedly less than their Canadian-born counterparts. This inequity persists among individuals educated in STEM and working in STEM occupations relative to similar Canadian-born workers. Immigrant workers in STEM occupations only partially caught up to the earnings of Canadian-born individuals.
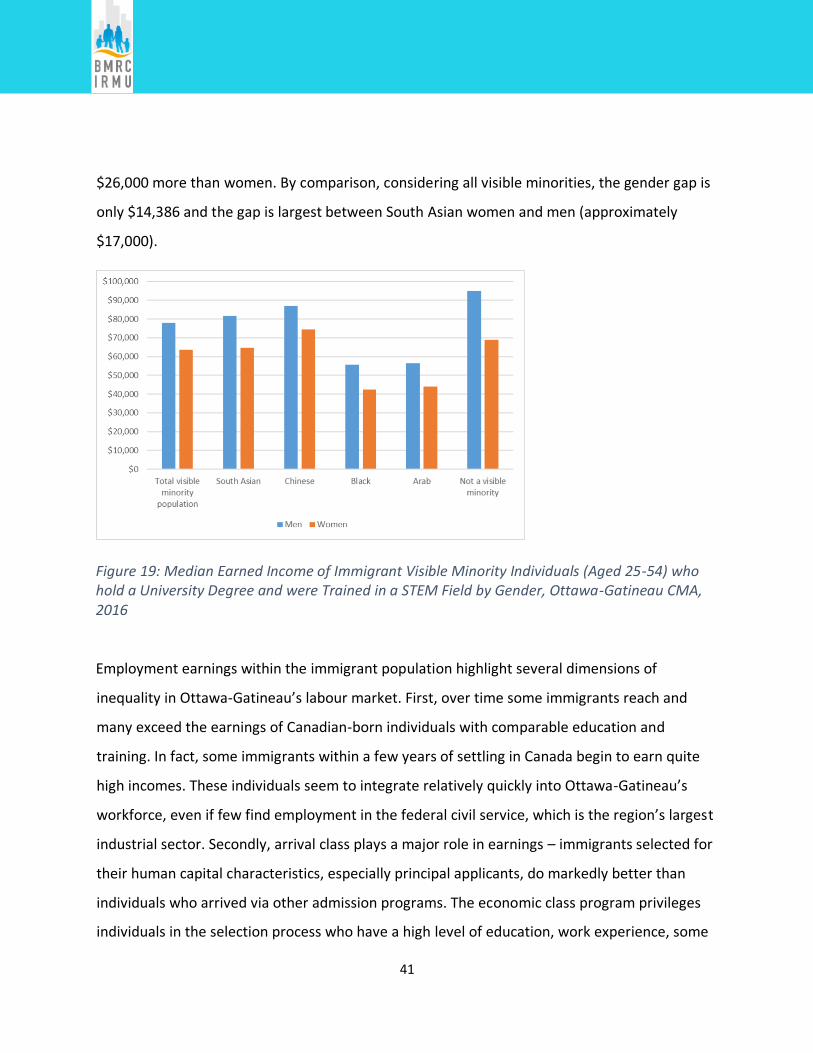
41
$26,000 more than women. By comparison, considering all visible minorities, the gender gap is
only $14,386 and the gap is largest between South Asian women and men (approximately
$17,000).
Figure 19: Median Earned Income of Immigrant Visible Minority Individuals (Aged 25-54) who hold a University Degree and were Trained in a STEM Field by Gender, Ottawa-Gatineau CMA, 2016
Employment earnings within the immigrant population highlight several dimensions of
inequality in Ottawa-Gatineau’s labour market. First, over time some immigrants reach and
many exceed the earnings of Canadian-born individuals with comparable education and
training. In fact, some immigrants within a few years of settling in Canada begin to earn quite
high incomes. These individuals seem to integrate relatively quickly into Ottawa-Gatineau’s
workforce, even if few find employment in the federal civil service, which is the region’s largest
industrial sector. Secondly, arrival class plays a major role in earnings – immigrants selected for
their human capital characteristics, especially principal applicants, do markedly better than
individuals who arrived via other admission programs. The economic class program privileges
individuals in the selection process who have a high level of education, work experience, some
42
degree of language proficiency in either English or French, and who are relatively young.
Consequently, economic class immigrants have many advantages and are more able to take
advantage of employment opportunities in Ottawa’s post-industrial economy. Thirdly, positive
earnings outcomes for some immigrants contrast with others’ low earnings, especially for Black
and Arab immigrants, even when factors such as education are controlled. Finally, in virtually all
dimensions of comparison, women’s earnings are not as high as those of men. The persistence
of gender inequality, whether examined by admission class, educational attainment, field of
training or visible minority status, highlights the pervasiveness of lower wages for women
across industrial sectors in Ottawa-Gatineau.
Summary
Ottawa-Gatineau has witnessed significant changes in the size and composition of its foreign-
born population since the early 1990s. Once a metropolitan area that attracted primarily
European immigrants, and was characterized by a French-English cultural and linguistic divide
that relegated language groups to being an afterthought (Ray and Gilbert 2020), Ottawa-
Gatineau is becoming home to people with many different cultures, ethnicities, religions and
languages. The region remains divided in many ways, not the least of which is the provincial
boundary that creates different opportunities for newcomers living in Gatineau and Ottawa
(Gilbert et al., 2014). At the same time, the metropolitan region has become exemplary of a
post-industrial economy, led by public administration, with a sizable high-technology sector
prone to boom and bust cycles, and an array of other producer and consumer services
(Andrews, Ray and Chiasson 2011). It is in this complex social and economic environment that
newcomers build lives; for many, finding employment is a crucial part of this building process.
This report has had three primary objectives. First, the qualities and characteristics of
immigrants working full time in Ottawa-Gatineau, especially those who have been in Canada
for a short time period, are described. Employed immigrants are diverse in many respects –

43
from educational attainment to admission class to ethno-racial status; hence, generalizations
about immigrants can be highly problematic. Secondly, the labour force characteristics of
immigrants working full time, including industry of employment, occupation and labour force
earnings, are outlined. There is again considerable diversity across the immigrant population,
with immigrants who entered Canada through the economic admission program doing much
better relative to other groups. Immigrants who have a relatively high level of education often
have relatively high earnings, but by no means is this trend uniform across all groups. Some
immigrants, notably Arabs and Blacks who have strong educational credentials, do not match
the earnings achievements of other groups. Immigrants overall are under-represented in public
administration, but they are over-represented in other large industrial sectors such as the
professional, technical and scientific services that are so crucial to many high-technology
businesses. The strong over-representation of immigrant women, especially recent arrivals, in
health care is also difficult to ignore. Moreover, women consistently lag behind men in
earnings. In fact, the low earnings of women regardless of educational credentials, admission
category or ethno-racial status is one of this study’s most consistent findings. Finally, the study
has highlighted some of the cleavages in earnings among immigrants living across the region.
Individuals living in Gatineau generally have lower earnings relative to their counterparts in
Ottawa that may be due to variations in the industrial sectors of employment and occupations
between residents of the two sectors of the metropolitan region. Although the differences
between the two parts of the region have not been analyzed in detail, the data are made
available for researchers who intend to compare the socio-economic status of immigrants in
Ottawa and Gatineau (see Appendix).
This study is a descriptive analysis of the labour force status of immigrants living in Ottawa-
Gatineau. The emphasis has been on individuals working full time and full year in order to
facilitate meaningful comparisons between groups, as well as between women and men. Most
certainly, individuals working part-time deserve equal consideration. Again, to enable

44
reasonable comparison, attention has focused on individuals aged 25 to 54. Younger and older
workers are important groups to consider in subsequent analyses, as is their role in part-time
employment. Due to the limitations of existing data, it was not possible to examine directly the
kinds of occupations filled by immigrants in particular industrial sectors. This is an important
direction for future research, especially to compare earnings between ethno-racial groups, as
well as between women and men (Bazinet 2021). The research would also benefit from a more
detailed analysis of immigrant employment status by language competence. Given that many
jobs within the federal civil service demand French-English bilingualism and that other sectors
also have bilingualism requirements (e.g., health care), the multiple ways in which facility in
French and/or English influences labour market integration merits detailed analysis.20 The
linguistic complexity of Ottawa-Gatineau is well known, but the ways in which immigrants
navigate obligations to not only speak but also write and read one or both of Canada’s official
languages in order to advance in employment deserves greater scrutiny.
The research presented here is a snapshot in time and predates events such as the large-scale
arrival of Syrian refugees and the Covid-19 crisis. As important as these factors are the
underlying structure of the region’s economy, with its opportunities and constrains, will remain
when economic life returns to something approaching a pre-pandemic “normal”. The inequities
highlighted in this report most likely will also remain, and perhaps will become more extreme,
in the years following the current crisis. The economic crisis and aftermath produced by the
information technology bust in 2000 certain affected a large number of relatively new
immigrants in Ottawa-Gatineau for years (Picot and Hou 2009). The findings highlight strong
economic integration among some newcomers, as well as inequality and inequity between
immigrants and the Canadian-born and between immigrant men and women. Reasons for
industrial and occupational segmentation, as well as income inequality, between immigrant
20 The census surveys language use and knowledge in a number of ways, but none of these indicators directly measure people’s comfort or facility in writing or reading one of Canada’s official languages
45
women and men are numerous and merit significant research attention to understand the
intersections of labour market hiring practices, discrimination and gender roles (Frank and Hou
2015). It is also difficult to ignore the inequalities that exist between racialized minority
immigrant communities in Ottawa-Gatineau, even when factors such as education, age and
gender are considered. Black and Arab immigrants appear to face significant hurdles in Ottawa-
Gatineau’s labour market and the reasons for their lower earnings compared to other groups
merit attention. Finally, the weak labour force status of refugees, even after years of
settlement in Canada, must not be ignored. This is especially true in Ottawa-Gatineau where
refugees comprise a large component of the foreign-born population. A better understanding
of workers’ motivations and aspirations, discriminatory practices, and the ways that employers
make decisions about who to employ are crucial steps in subsequent studies of immigrant
integration and resilience in Ottawa-Gatineau’s post-industrial economy.
46
References
Adams, T.L. 2016. When ‘citizenship Is Indispensable to the Practice of a Profession’: Citizenship Requirements for Entry to Practise Professions in Canada. Journal of Historical Sociology 29(4), 550–577.
Andrew, C., Ray, B., & Chiasson, G. (2011). Ottawa-Gatineau: Capital Formation. In L. S. Bourne, T. Hutton, R. G. Shearmur & J. Simmons (Eds.), Canadian Urban Regions: Trajectories of Growth and Change (pp. 202-235). Don Mills, ON: Oxford University Press.
Basinet, R. (2021). Language, Gender, and Work: Investigating Women's Employment Outcomes in Ottawa-Gatineau's Federal Public Service. Master's of Arts, University of Ottawa, Ottawa.
Béchard, J. (2018). Immigration: The Canada-Quebec Accord. Ottawa, Legal and Social Affairs Division, Parliamentary Information and Research Service.
Bevelander, P., & Pendakur, R. (2012). The Labour Market Integration of Refugee and Family Reunion Immigrants: A Comparison of Outcomes in Canada and Sweden. Bonn: Institute for the Study of Labor (Forschungsinstitut zur Zukunft der Arbeit).
Block, S. and Galabuzi, G.-E. (2011). Canada's Colour Coded Labour Market. Toronto, Canadian Centre for Policy Alternatives & The Wellesley Institute: 20.
Charette, A. (2021). Les structures de gouvernance de l’immigration et de l’intégration des immigrants au Québec. Toronto: Building Migrant Resilience in Cities, York University.
Conference Board of Canada (2013). Gender Income Gap. DOI: http://www.conferenceboard.ca/hcp/details/society/gender-income-gap.aspx#top
Conseil Supérieur de la langue française (2013). Redynamiser la politique linguistique du
Québec: avis à la ministre responsable de la Charte de la langue française. Montréal :
Conseil supérieur de la langue française.
Cool, J. (2010). Wage Gap Between Women and Men. Background Paper. Ottawa, Library of
Parliament: 14.
Ellis, M., Wright, R., and Parks, V. 2007. Geography and the immigrant division of labor.
Economic Geography, 83(3), 255-81.
Eswaran, M. (2014). Why Gender Matters in Economics. Princeton: Princeton University Press.
Frank, K. and Feng, H. (2015). Beyond culture: source country female labour force participation
and the earnings of immigrant women. Work, employment and society, 30(3), 410-35.

47
Germain, D. (2013). Le parcours de réorientation professionnelle d’immigrantes hautement
qualifiées à Montréal: une étude exploratoire. Montréal: Université de Montréal, Faculté
des arts et des sciences, École de relations industrielles.
Gilbert, A., Veronis, L., Brosseau, M., & Ray, B. (2014). La frontière au quotidien : expériences
minoritaires à Ottawa-Gatineau. Ottawa: Presses de l'Université d'Ottawa.
McCall, L. (2001). Complex Inequality: Gender, Class, and Race in the New Economy. New York,
Routledge.
Pelletier, R., Patterson, M., and Moyser, M. (2019). The gender wage gap in Canada: 1998 to
2018. (75-004-M – 2019004). Ottawa: Statistics Canada.
Pendakur, K. and Pendakur, R. (2011). Color by numbers: Minority earnings in Canada 1995-
2005. Journal of International Migration and Integration, 12(3), 305-29.
Picot, G. and Hou, F. (2018). Immigrant STEM Workers in the Canadian economy: Skill utilization
and earnings. Canadian Public Policy, 44(1), S113-S124.
Picot, G. and Hou, F. (2009) Immigrant characteristics, the IT Bust, and their effect on entry
earnings of immigrants. Ottawa: Statistics Canada.
Ray, B. and Gilbert, A. (2020). Language continuities and ruptures in Ottawa-Gatineau, Canada. In S. Brunn and Kehrein, R. (eds.), Handbook of the Changing World Language Map (pp. 1489-1508). Cham, CH: Springer.
Statistics Canada (2016). Income Highlight Tables, 2016 Census. https://www12.statcan.gc.ca/census-recensement/2016/dp-pd/hlt-fst/inc-rev/Table.cfm?Lang=Eng&T=102&PR=0&D1=1&RPP=25&SR=1&S=104&O=D
Statistics Canada (2017). English, French and official language minorities in Canada (98-200-X2016011). Ottawa: Statistics Canada.
Türegün, A. (2017). Ideas and Interests Embedded in the Making of Ontario’s Fair Access to Regulated Professions Act, 2006. Journal of International Migration and Integration, 18(2), 405–418.
Waldinger, R. and Lichter, M.I. (2003). How the other half works: Immigration and the social organization of labor. London, England: University of California Press.

48
Acknowledgements
I would like to acknowledge with gratitude the work of Younes Talouka, my research assistant who worked diligently on the early stages of this on this project. I have also benefitted from the generous suggestions made by members of the BMRC-IRMU knowledge mobilization committee and most especially my colleague Valerie Preston.

33
Appendix A: Tables
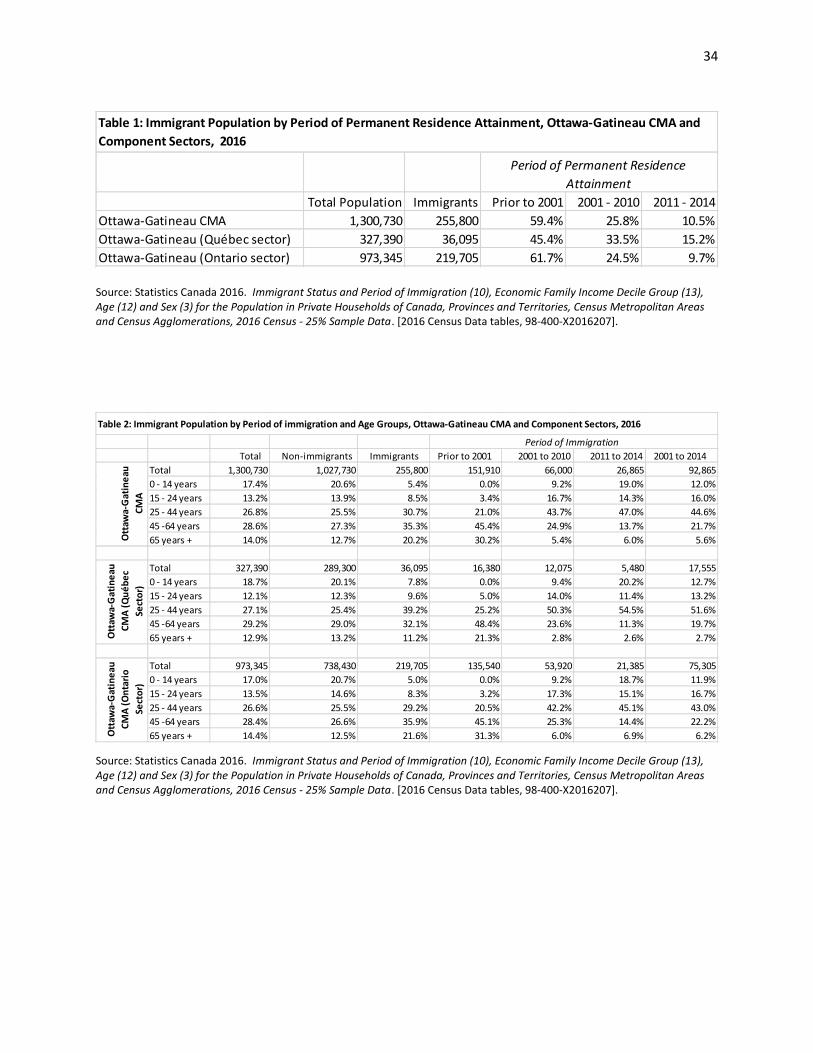
34
Source: Statistics Canada 2016. Immigrant Status and Period of Immigration (10), Economic Family Income Decile Group (13), Age (12) and Sex (3) for the Population in Private Households of Canada, Provinces and Territories, Census Metropolitan Areas and Census Agglomerations, 2016 Census - 25% Sample Data. [2016 Census Data tables, 98-400-X2016207].
Source: Statistics Canada 2016. Immigrant Status and Period of Immigration (10), Economic Family Income Decile Group (13), Age (12) and Sex (3) for the Population in Private Households of Canada, Provinces and Territories, Census Metropolitan Areas and Census Agglomerations, 2016 Census - 25% Sample Data. [2016 Census Data tables, 98-400-X2016207].
Total Population Immigrants Prior to 2001 2001 - 2010 2011 - 2014Ottawa-Gatineau CMA 1,300,730 255,800 59.4% 25.8% 10.5%Ottawa-Gatineau (Québec sector) 327,390 36,095 45.4% 33.5% 15.2%Ottawa-Gatineau (Ontario sector) 973,345 219,705 61.7% 24.5% 9.7%
Period of Permanent Residence Attainment
Table 1: Immigrant Population by Period of Permanent Residence Attainment, Ottawa-Gatineau CMA and Component Sectors, 2016
Total Non-immigrants Immigrants Prior to 2001 2001 to 2010 2011 to 2014 2001 to 2014Total 1,300,730 1,027,730 255,800 151,910 66,000 26,865 92,8650 - 14 years 17.4% 20.6% 5.4% 0.0% 9.2% 19.0% 12.0%15 - 24 years 13.2% 13.9% 8.5% 3.4% 16.7% 14.3% 16.0%25 - 44 years 26.8% 25.5% 30.7% 21.0% 43.7% 47.0% 44.6%45 -64 years 28.6% 27.3% 35.3% 45.4% 24.9% 13.7% 21.7%65 years + 14.0% 12.7% 20.2% 30.2% 5.4% 6.0% 5.6%
Total 327,390 289,300 36,095 16,380 12,075 5,480 17,5550 - 14 years 18.7% 20.1% 7.8% 0.0% 9.4% 20.2% 12.7%15 - 24 years 12.1% 12.3% 9.6% 5.0% 14.0% 11.4% 13.2%25 - 44 years 27.1% 25.4% 39.2% 25.2% 50.3% 54.5% 51.6%45 -64 years 29.2% 29.0% 32.1% 48.4% 23.6% 11.3% 19.7%65 years + 12.9% 13.2% 11.2% 21.3% 2.8% 2.6% 2.7%
Total 973,345 738,430 219,705 135,540 53,920 21,385 75,3050 - 14 years 17.0% 20.7% 5.0% 0.0% 9.2% 18.7% 11.9%15 - 24 years 13.5% 14.6% 8.3% 3.2% 17.3% 15.1% 16.7%25 - 44 years 26.6% 25.5% 29.2% 20.5% 42.2% 45.1% 43.0%45 -64 years 28.4% 26.6% 35.9% 45.1% 25.3% 14.4% 22.2%65 years + 14.4% 12.5% 21.6% 31.3% 6.0% 6.9% 6.2%
Period of Immigration
Table 2: Immigrant Population by Period of immigration and Age Groups, Ottawa-Gatineau CMA and Component Sectors, 2016
Ott
awa-
Gat
inea
u CM
A
Ott
awa-
Gat
inea
u CM
A (Q
uébe
c Se
ctor
)
Ott
awa-
Gat
inea
u CM
A (O
ntar
io
Sect
or)
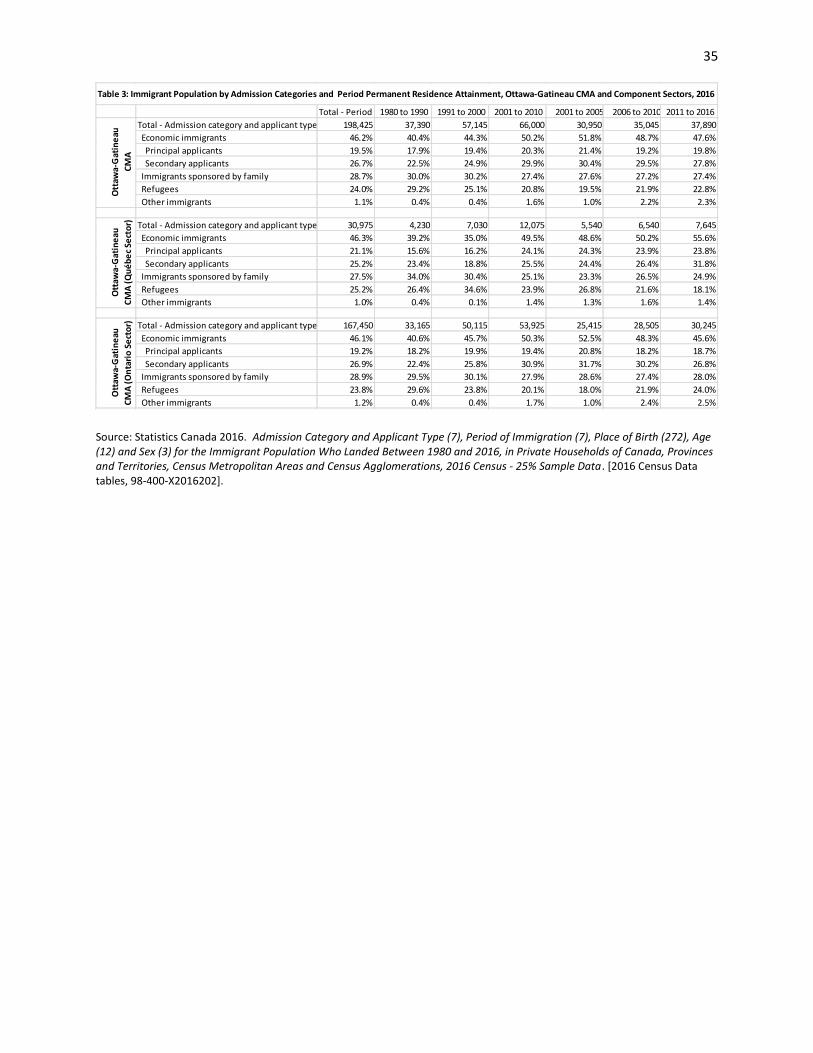
35
Source: Statistics Canada 2016. Admission Category and Applicant Type (7), Period of Immigration (7), Place of Birth (272), Age (12) and Sex (3) for the Immigrant Population Who Landed Between 1980 and 2016, in Private Households of Canada, Provinces and Territories, Census Metropolitan Areas and Census Agglomerations, 2016 Census - 25% Sample Data. [2016 Census Data tables, 98-400-X2016202].
Total - Period of immigration 1980 to 1990 1991 to 2000 2001 to 2010 2001 to 2005 2006 to 2010 2011 to 2016Total - Admission category and applicant type 198,425 37,390 57,145 66,000 30,950 35,045 37,890 Economic immigrants 46.2% 40.4% 44.3% 50.2% 51.8% 48.7% 47.6% Principal applicants 19.5% 17.9% 19.4% 20.3% 21.4% 19.2% 19.8% Secondary applicants 26.7% 22.5% 24.9% 29.9% 30.4% 29.5% 27.8% Immigrants sponsored by family 28.7% 30.0% 30.2% 27.4% 27.6% 27.2% 27.4% Refugees 24.0% 29.2% 25.1% 20.8% 19.5% 21.9% 22.8% Other immigrants 1.1% 0.4% 0.4% 1.6% 1.0% 2.2% 2.3%
Total - Admission category and applicant type 30,975 4,230 7,030 12,075 5,540 6,540 7,645 Economic immigrants 46.3% 39.2% 35.0% 49.5% 48.6% 50.2% 55.6% Principal applicants 21.1% 15.6% 16.2% 24.1% 24.3% 23.9% 23.8% Secondary applicants 25.2% 23.4% 18.8% 25.5% 24.4% 26.4% 31.8% Immigrants sponsored by family 27.5% 34.0% 30.4% 25.1% 23.3% 26.5% 24.9% Refugees 25.2% 26.4% 34.6% 23.9% 26.8% 21.6% 18.1% Other immigrants 1.0% 0.4% 0.1% 1.4% 1.3% 1.6% 1.4%
Total - Admission category and applicant type 167,450 33,165 50,115 53,925 25,415 28,505 30,245 Economic immigrants 46.1% 40.6% 45.7% 50.3% 52.5% 48.3% 45.6% Principal applicants 19.2% 18.2% 19.9% 19.4% 20.8% 18.2% 18.7% Secondary applicants 26.9% 22.4% 25.8% 30.9% 31.7% 30.2% 26.8% Immigrants sponsored by family 28.9% 29.5% 30.1% 27.9% 28.6% 27.4% 28.0% Refugees 23.8% 29.6% 23.8% 20.1% 18.0% 21.9% 24.0% Other immigrants 1.2% 0.4% 0.4% 1.7% 1.0% 2.4% 2.5%
Table 3: Immigrant Population by Admission Categories and Period Permanent Residence Attainment, Ottawa-Gatineau CMA and Component Sectors, 2016
Ott
awa-
Gat
inea
u CM
AO
ttaw
a-G
atin
eau
CMA
(Qué
bec S
ecto
r)O
ttaw
a-G
atin
eau
CMA
(Ont
ario
Sec
tor)
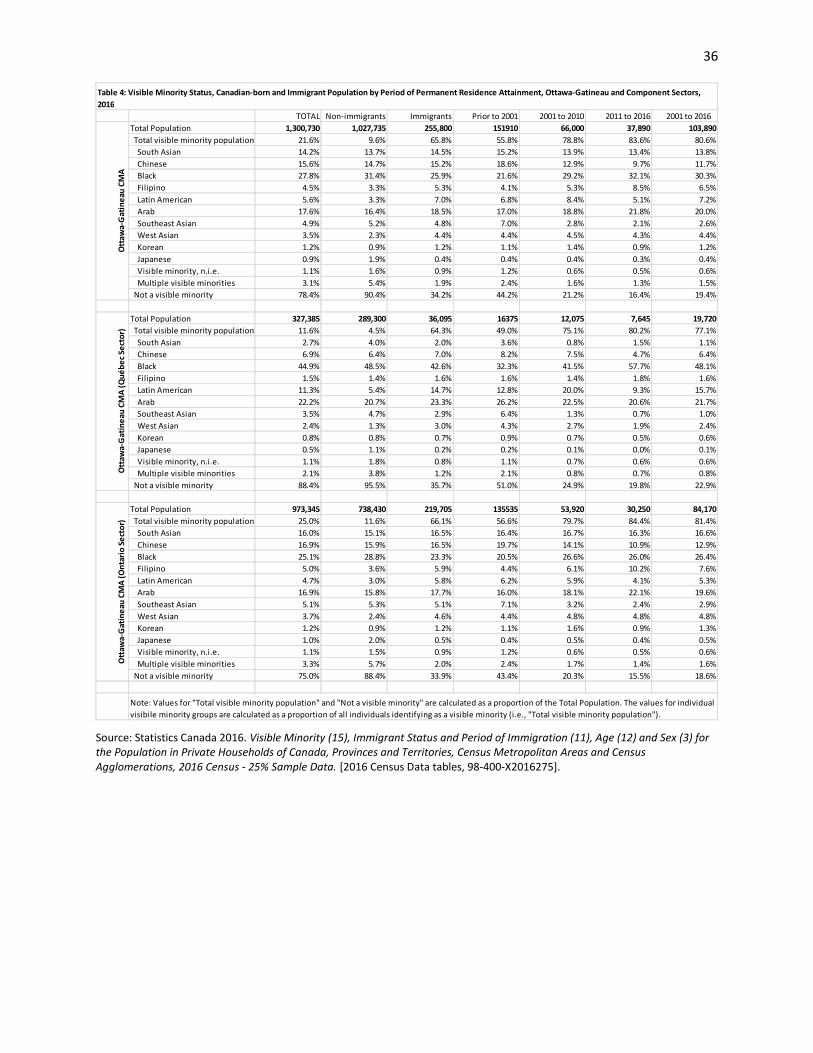
36
Source: Statistics Canada 2016. Visible Minority (15), Immigrant Status and Period of Immigration (11), Age (12) and Sex (3) for the Population in Private Households of Canada, Provinces and Territories, Census Metropolitan Areas and Census Agglomerations, 2016 Census - 25% Sample Data. [2016 Census Data tables, 98-400-X2016275].
TOTAL Non-immigrants Immigrants Prior to 2001 2001 to 2010 2011 to 2016 2001 to 2016Total Population 1,300,730 1,027,735 255,800 151910 66,000 37,890 103,890 Total visible minority population 21.6% 9.6% 65.8% 55.8% 78.8% 83.6% 80.6% South Asian 14.2% 13.7% 14.5% 15.2% 13.9% 13.4% 13.8% Chinese 15.6% 14.7% 15.2% 18.6% 12.9% 9.7% 11.7% Black 27.8% 31.4% 25.9% 21.6% 29.2% 32.1% 30.3% Filipino 4.5% 3.3% 5.3% 4.1% 5.3% 8.5% 6.5% Latin American 5.6% 3.3% 7.0% 6.8% 8.4% 5.1% 7.2% Arab 17.6% 16.4% 18.5% 17.0% 18.8% 21.8% 20.0% Southeast Asian 4.9% 5.2% 4.8% 7.0% 2.8% 2.1% 2.6% West Asian 3.5% 2.3% 4.4% 4.4% 4.5% 4.3% 4.4% Korean 1.2% 0.9% 1.2% 1.1% 1.4% 0.9% 1.2% Japanese 0.9% 1.9% 0.4% 0.4% 0.4% 0.3% 0.4% Visible minority, n.i.e. 1.1% 1.6% 0.9% 1.2% 0.6% 0.5% 0.6% Multiple visible minorities 3.1% 5.4% 1.9% 2.4% 1.6% 1.3% 1.5% Not a visible minority 78.4% 90.4% 34.2% 44.2% 21.2% 16.4% 19.4%
Total Population 327,385 289,300 36,095 16375 12,075 7,645 19,720 Total visible minority population 11.6% 4.5% 64.3% 49.0% 75.1% 80.2% 77.1% South Asian 2.7% 4.0% 2.0% 3.6% 0.8% 1.5% 1.1% Chinese 6.9% 6.4% 7.0% 8.2% 7.5% 4.7% 6.4% Black 44.9% 48.5% 42.6% 32.3% 41.5% 57.7% 48.1% Filipino 1.5% 1.4% 1.6% 1.6% 1.4% 1.8% 1.6% Latin American 11.3% 5.4% 14.7% 12.8% 20.0% 9.3% 15.7% Arab 22.2% 20.7% 23.3% 26.2% 22.5% 20.6% 21.7% Southeast Asian 3.5% 4.7% 2.9% 6.4% 1.3% 0.7% 1.0% West Asian 2.4% 1.3% 3.0% 4.3% 2.7% 1.9% 2.4% Korean 0.8% 0.8% 0.7% 0.9% 0.7% 0.5% 0.6% Japanese 0.5% 1.1% 0.2% 0.2% 0.1% 0.0% 0.1% Visible minority, n.i.e. 1.1% 1.8% 0.8% 1.1% 0.7% 0.6% 0.6% Multiple visible minorities 2.1% 3.8% 1.2% 2.1% 0.8% 0.7% 0.8% Not a visible minority 88.4% 95.5% 35.7% 51.0% 24.9% 19.8% 22.9%
Total Population 973,345 738,430 219,705 135535 53,920 30,250 84,170 Total visible minority population 25.0% 11.6% 66.1% 56.6% 79.7% 84.4% 81.4% South Asian 16.0% 15.1% 16.5% 16.4% 16.7% 16.3% 16.6% Chinese 16.9% 15.9% 16.5% 19.7% 14.1% 10.9% 12.9% Black 25.1% 28.8% 23.3% 20.5% 26.6% 26.0% 26.4% Filipino 5.0% 3.6% 5.9% 4.4% 6.1% 10.2% 7.6% Latin American 4.7% 3.0% 5.8% 6.2% 5.9% 4.1% 5.3% Arab 16.9% 15.8% 17.7% 16.0% 18.1% 22.1% 19.6% Southeast Asian 5.1% 5.3% 5.1% 7.1% 3.2% 2.4% 2.9% West Asian 3.7% 2.4% 4.6% 4.4% 4.8% 4.8% 4.8% Korean 1.2% 0.9% 1.2% 1.1% 1.6% 0.9% 1.3% Japanese 1.0% 2.0% 0.5% 0.4% 0.5% 0.4% 0.5% Visible minority, n.i.e. 1.1% 1.5% 0.9% 1.2% 0.6% 0.5% 0.6% Multiple visible minorities 3.3% 5.7% 2.0% 2.4% 1.7% 1.4% 1.6% Not a visible minority 75.0% 88.4% 33.9% 43.4% 20.3% 15.5% 18.6%
Table 4: Visible Minority Status, Canadian-born and Immigrant Population by Period of Permanent Residence Attainment, Ottawa-Gatineau and Component Sectors, 2016
Note: Values for "Total visible minority population" and "Not a visible minority" are calculated as a proportion of the Total Population. The values for individual visibile minority groups are calculated as a proportion of all individuals identifying as a visible minority (i.e., "Total visible minority population").
Ott
awa-
Gat
inea
u CM
AO
ttaw
a-G
atin
eau
CMA
(Qué
bec S
ecto
r)O
ttaw
a-G
atin
eau
CMA
(Ont
ario
Sec
tor)
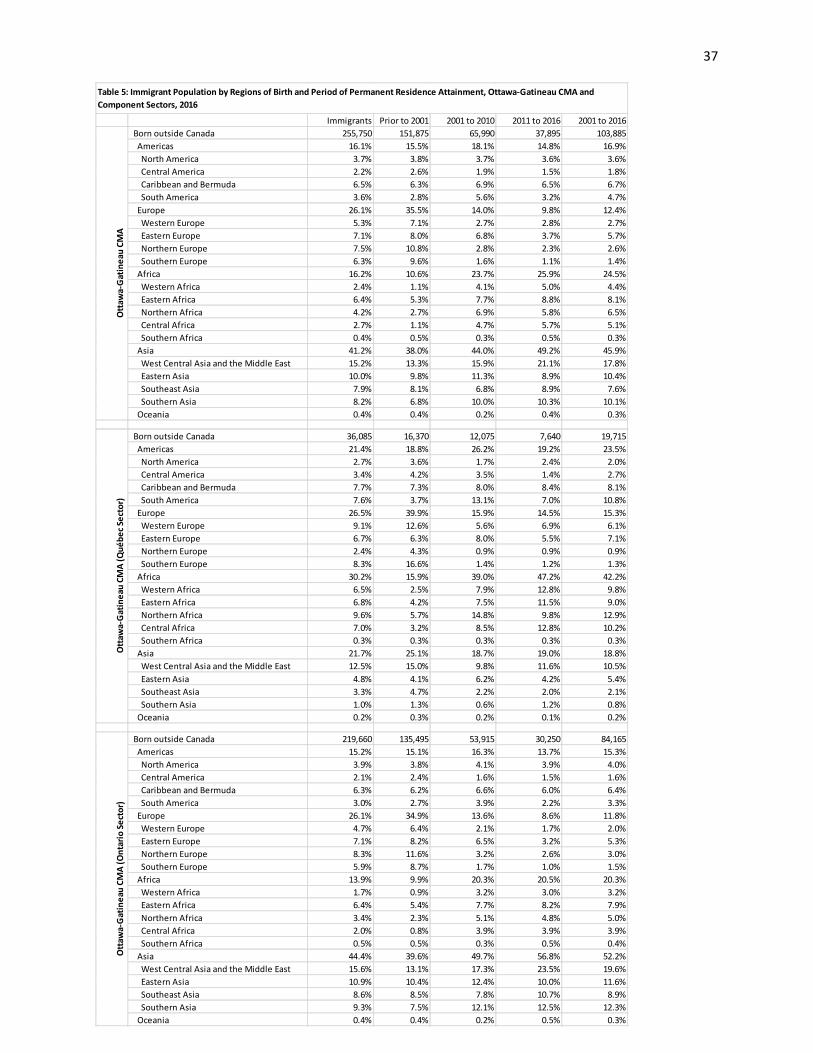
37
Immigrants Prior to 2001 2001 to 2010 2011 to 2016 2001 to 2016 Born outside Canada 255,750 151,875 65,990 37,895 103,885 Americas 16.1% 15.5% 18.1% 14.8% 16.9% North America 3.7% 3.8% 3.7% 3.6% 3.6% Central America 2.2% 2.6% 1.9% 1.5% 1.8% Caribbean and Bermuda 6.5% 6.3% 6.9% 6.5% 6.7% South America 3.6% 2.8% 5.6% 3.2% 4.7% Europe 26.1% 35.5% 14.0% 9.8% 12.4% Western Europe 5.3% 7.1% 2.7% 2.8% 2.7% Eastern Europe 7.1% 8.0% 6.8% 3.7% 5.7% Northern Europe 7.5% 10.8% 2.8% 2.3% 2.6% Southern Europe 6.3% 9.6% 1.6% 1.1% 1.4% Africa 16.2% 10.6% 23.7% 25.9% 24.5% Western Africa 2.4% 1.1% 4.1% 5.0% 4.4% Eastern Africa 6.4% 5.3% 7.7% 8.8% 8.1% Northern Africa 4.2% 2.7% 6.9% 5.8% 6.5% Central Africa 2.7% 1.1% 4.7% 5.7% 5.1% Southern Africa 0.4% 0.5% 0.3% 0.5% 0.3% Asia 41.2% 38.0% 44.0% 49.2% 45.9% West Central Asia and the Middle East 15.2% 13.3% 15.9% 21.1% 17.8% Eastern Asia 10.0% 9.8% 11.3% 8.9% 10.4% Southeast Asia 7.9% 8.1% 6.8% 8.9% 7.6% Southern Asia 8.2% 6.8% 10.0% 10.3% 10.1% Oceania 0.4% 0.4% 0.2% 0.4% 0.3%
Born outside Canada 36,085 16,370 12,075 7,640 19,715 Americas 21.4% 18.8% 26.2% 19.2% 23.5% North America 2.7% 3.6% 1.7% 2.4% 2.0% Central America 3.4% 4.2% 3.5% 1.4% 2.7% Caribbean and Bermuda 7.7% 7.3% 8.0% 8.4% 8.1% South America 7.6% 3.7% 13.1% 7.0% 10.8% Europe 26.5% 39.9% 15.9% 14.5% 15.3% Western Europe 9.1% 12.6% 5.6% 6.9% 6.1% Eastern Europe 6.7% 6.3% 8.0% 5.5% 7.1% Northern Europe 2.4% 4.3% 0.9% 0.9% 0.9% Southern Europe 8.3% 16.6% 1.4% 1.2% 1.3% Africa 30.2% 15.9% 39.0% 47.2% 42.2% Western Africa 6.5% 2.5% 7.9% 12.8% 9.8% Eastern Africa 6.8% 4.2% 7.5% 11.5% 9.0% Northern Africa 9.6% 5.7% 14.8% 9.8% 12.9% Central Africa 7.0% 3.2% 8.5% 12.8% 10.2% Southern Africa 0.3% 0.3% 0.3% 0.3% 0.3% Asia 21.7% 25.1% 18.7% 19.0% 18.8% West Central Asia and the Middle East 12.5% 15.0% 9.8% 11.6% 10.5% Eastern Asia 4.8% 4.1% 6.2% 4.2% 5.4% Southeast Asia 3.3% 4.7% 2.2% 2.0% 2.1% Southern Asia 1.0% 1.3% 0.6% 1.2% 0.8% Oceania 0.2% 0.3% 0.2% 0.1% 0.2%
Born outside Canada 219,660 135,495 53,915 30,250 84,165 Americas 15.2% 15.1% 16.3% 13.7% 15.3% North America 3.9% 3.8% 4.1% 3.9% 4.0% Central America 2.1% 2.4% 1.6% 1.5% 1.6% Caribbean and Bermuda 6.3% 6.2% 6.6% 6.0% 6.4% South America 3.0% 2.7% 3.9% 2.2% 3.3% Europe 26.1% 34.9% 13.6% 8.6% 11.8% Western Europe 4.7% 6.4% 2.1% 1.7% 2.0% Eastern Europe 7.1% 8.2% 6.5% 3.2% 5.3% Northern Europe 8.3% 11.6% 3.2% 2.6% 3.0% Southern Europe 5.9% 8.7% 1.7% 1.0% 1.5% Africa 13.9% 9.9% 20.3% 20.5% 20.3% Western Africa 1.7% 0.9% 3.2% 3.0% 3.2% Eastern Africa 6.4% 5.4% 7.7% 8.2% 7.9% Northern Africa 3.4% 2.3% 5.1% 4.8% 5.0% Central Africa 2.0% 0.8% 3.9% 3.9% 3.9% Southern Africa 0.5% 0.5% 0.3% 0.5% 0.4% Asia 44.4% 39.6% 49.7% 56.8% 52.2% West Central Asia and the Middle East 15.6% 13.1% 17.3% 23.5% 19.6% Eastern Asia 10.9% 10.4% 12.4% 10.0% 11.6% Southeast Asia 8.6% 8.5% 7.8% 10.7% 8.9% Southern Asia 9.3% 7.5% 12.1% 12.5% 12.3% Oceania 0.4% 0.4% 0.2% 0.5% 0.3%
Table 5: Immigrant Population by Regions of Birth and Period of Permanent Residence Attainment, Ottawa-Gatineau CMA and Component Sectors, 2016
Ott
awa-
Gat
inea
u CM
AO
ttaw
a-G
atin
eau
CMA
(Qué
bec S
ecto
r)O
ttaw
a-G
atin
eau
CMA
(Ont
ario
Sec
tor)

38 Source: Statistics Canada 2016. Citizenship (5), Place of Birth (272), Immigrant Status and Period of Immigration (11), Age (12) and Sex (3) for the Population in Private Households of Canada, Provinces and Territories, Census Metropolitan Areas and Census Agglomerations, 2016 Census - 25% Sample Data. [2016 Census Data tables, 98-400-X2016184].
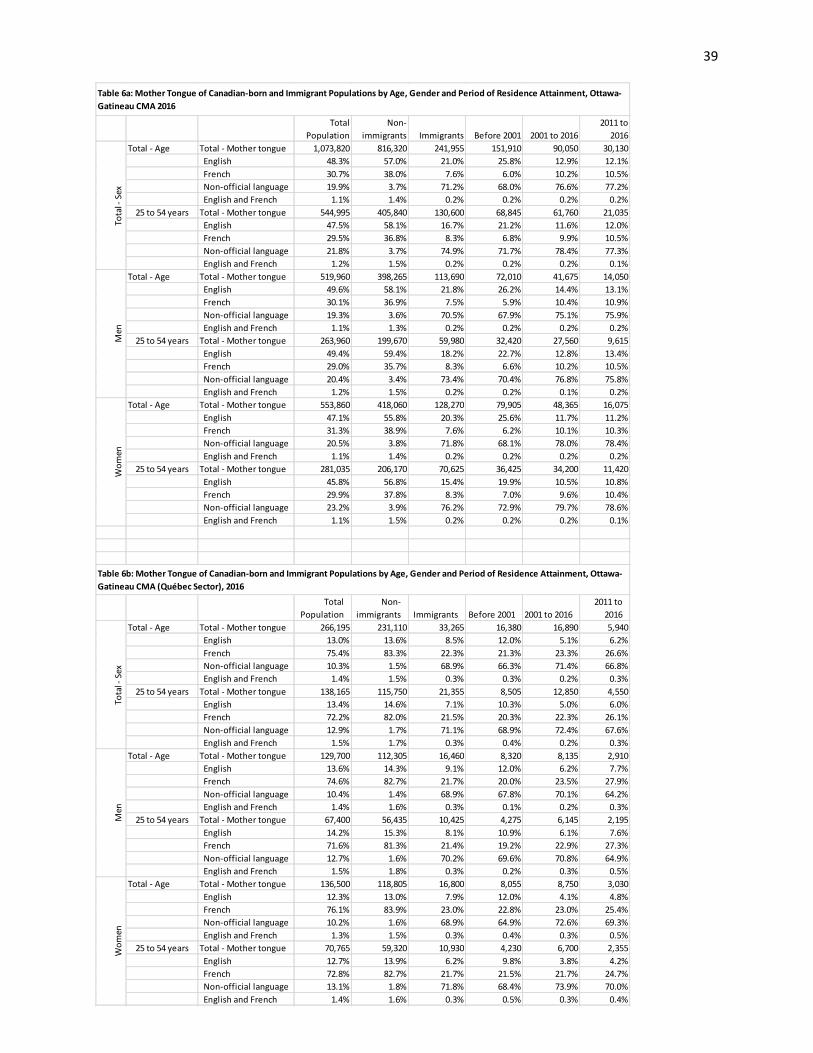
39
Total Population
Non-immigrants Immigrants Before 2001 2001 to 2016
2011 to 2016
Total - Age Total - Mother tongue 1,073,820 816,320 241,955 151,910 90,050 30,130 English 48.3% 57.0% 21.0% 25.8% 12.9% 12.1% French 30.7% 38.0% 7.6% 6.0% 10.2% 10.5% Non-official language 19.9% 3.7% 71.2% 68.0% 76.6% 77.2% English and French 1.1% 1.4% 0.2% 0.2% 0.2% 0.2%
25 to 54 years Total - Mother tongue 544,995 405,840 130,600 68,845 61,760 21,035 English 47.5% 58.1% 16.7% 21.2% 11.6% 12.0% French 29.5% 36.8% 8.3% 6.8% 9.9% 10.5% Non-official language 21.8% 3.7% 74.9% 71.7% 78.4% 77.3% English and French 1.2% 1.5% 0.2% 0.2% 0.2% 0.1%
Total - Age Total - Mother tongue 519,960 398,265 113,690 72,010 41,675 14,050 English 49.6% 58.1% 21.8% 26.2% 14.4% 13.1% French 30.1% 36.9% 7.5% 5.9% 10.4% 10.9% Non-official language 19.3% 3.6% 70.5% 67.9% 75.1% 75.9% English and French 1.1% 1.3% 0.2% 0.2% 0.2% 0.2%
25 to 54 years Total - Mother tongue 263,960 199,670 59,980 32,420 27,560 9,615 English 49.4% 59.4% 18.2% 22.7% 12.8% 13.4% French 29.0% 35.7% 8.3% 6.6% 10.2% 10.5% Non-official language 20.4% 3.4% 73.4% 70.4% 76.8% 75.8% English and French 1.2% 1.5% 0.2% 0.2% 0.1% 0.2%
Total - Age Total - Mother tongue 553,860 418,060 128,270 79,905 48,365 16,075 English 47.1% 55.8% 20.3% 25.6% 11.7% 11.2% French 31.3% 38.9% 7.6% 6.2% 10.1% 10.3% Non-official language 20.5% 3.8% 71.8% 68.1% 78.0% 78.4% English and French 1.1% 1.4% 0.2% 0.2% 0.2% 0.2%
25 to 54 years Total - Mother tongue 281,035 206,170 70,625 36,425 34,200 11,420 English 45.8% 56.8% 15.4% 19.9% 10.5% 10.8% French 29.9% 37.8% 8.3% 7.0% 9.6% 10.4% Non-official language 23.2% 3.9% 76.2% 72.9% 79.7% 78.6% English and French 1.1% 1.5% 0.2% 0.2% 0.2% 0.1%
Total Population
Non-immigrants
Immigrants Before 2001 2001 to 2016
2011 to 2016
Total - Age Total - Mother tongue 266,195 231,110 33,265 16,380 16,890 5,940 English 13.0% 13.6% 8.5% 12.0% 5.1% 6.2% French 75.4% 83.3% 22.3% 21.3% 23.3% 26.6% Non-official language 10.3% 1.5% 68.9% 66.3% 71.4% 66.8% English and French 1.4% 1.5% 0.3% 0.3% 0.2% 0.3%
25 to 54 years Total - Mother tongue 138,165 115,750 21,355 8,505 12,850 4,550 English 13.4% 14.6% 7.1% 10.3% 5.0% 6.0% French 72.2% 82.0% 21.5% 20.3% 22.3% 26.1% Non-official language 12.9% 1.7% 71.1% 68.9% 72.4% 67.6% English and French 1.5% 1.7% 0.3% 0.4% 0.2% 0.3%
Total - Age Total - Mother tongue 129,700 112,305 16,460 8,320 8,135 2,910 English 13.6% 14.3% 9.1% 12.0% 6.2% 7.7% French 74.6% 82.7% 21.7% 20.0% 23.5% 27.9% Non-official language 10.4% 1.4% 68.9% 67.8% 70.1% 64.2% English and French 1.4% 1.6% 0.3% 0.1% 0.2% 0.3%
25 to 54 years Total - Mother tongue 67,400 56,435 10,425 4,275 6,145 2,195 English 14.2% 15.3% 8.1% 10.9% 6.1% 7.6% French 71.6% 81.3% 21.4% 19.2% 22.9% 27.3% Non-official language 12.7% 1.6% 70.2% 69.6% 70.8% 64.9% English and French 1.5% 1.8% 0.3% 0.2% 0.3% 0.5%
Total - Age Total - Mother tongue 136,500 118,805 16,800 8,055 8,750 3,030 English 12.3% 13.0% 7.9% 12.0% 4.1% 4.8% French 76.1% 83.9% 23.0% 22.8% 23.0% 25.4% Non-official language 10.2% 1.6% 68.9% 64.9% 72.6% 69.3% English and French 1.3% 1.5% 0.3% 0.4% 0.3% 0.5%
25 to 54 years Total - Mother tongue 70,765 59,320 10,930 4,230 6,700 2,355 English 12.7% 13.9% 6.2% 9.8% 3.8% 4.2% French 72.8% 82.7% 21.7% 21.5% 21.7% 24.7% Non-official language 13.1% 1.8% 71.8% 68.4% 73.9% 70.0% English and French 1.4% 1.6% 0.3% 0.5% 0.3% 0.4%
Table 6a: Mother Tongue of Canadian-born and Immigrant Populations by Age, Gender and Period of Residence Attainment, Ottawa-Gatineau CMA 2016W
omen
Table 6b: Mother Tongue of Canadian-born and Immigrant Populations by Age, Gender and Period of Residence Attainment, Ottawa-Gatineau CMA (Québec Sector), 2016
Tota
l - S
exM
enW
omen
Tota
l - S
exM
en

40
Source: Statistics Canada 2016. Mother Tongue (10), Income Statistics (17), Highest Certificate, Diploma or Degree (15), Immigrant Status and Period of Immigration (10), Work Activity During the Reference Year (4A) and Sex and Age (15) for the Population Aged 15 Years and Over in Private Households of Canada, Provinces and Territories, Census Metropolitan Areas and Census Agglomerations, 2016 Census - 25% Sample Data. [2016 Census Data tables, 98-400-X2016199].
Total Population
Non-immigrants
Immigrants Before 2001 2001 to 2016
2011 to 2016
Total - Age Total - Mother tongue 807,620 585,210 208,695 135,535 73,160 24,190 English 59.9% 74.1% 23.0% 27.5% 14.7% 13.5% French 16.0% 20.0% 5.2% 4.2% 7.2% 6.6% Non-official language 23.1% 4.6% 71.6% 68.2% 77.9% 79.8% English and French 1.0% 1.3% 0.2% 0.2% 0.2% 0.1%
25 to 54 years Total - Mother tongue 406,830 290,090 109,245 60,340 48,910 16,485 English 59.1% 75.4% 18.5% 22.8% 13.3% 13.7% French 15.0% 18.7% 5.7% 4.9% 6.6% 6.2% Non-official language 24.9% 4.4% 75.7% 72.1% 79.9% 80.0% English and French 1.0% 1.4% 0.2% 0.2% 0.1% 0.1%
Total - Age Total - Mother tongue 390,260 285,960 97,235 63,695 33,540 11,145 English 61.6% 75.3% 24.0% 28.0% 16.3% 14.6% French 15.3% 19.0% 5.1% 4.0% 7.2% 6.4% Non-official language 22.2% 4.5% 70.7% 67.9% 76.3% 78.9% English and French 0.9% 1.2% 0.2% 0.1% 0.2% 0.1%
25 to 54 years Total - Mother tongue 196,555 143,235 49,555 28,140 21,410 7,420 English 61.5% 76.8% 20.3% 24.5% 14.8% 15.2% French 14.4% 17.7% 5.5% 4.7% 6.6% 5.6% Non-official language 23.1% 4.2% 74.0% 70.6% 78.5% 79.0% English and French 1.0% 1.4% 0.2% 0.2% 0.1% 0.1%
Total - Age Total - Mother tongue 417,365 299,260 111,465 71,840 39,625 13,050 English 58.4% 72.8% 22.2% 27.1% 13.4% 12.6% French 16.6% 21.0% 5.3% 4.3% 7.2% 6.7% Non-official language 23.9% 4.7% 72.3% 68.4% 79.2% 80.5% English and French 1.0% 1.4% 0.2% 0.2% 0.2% 0.1%
25 to 54 years Total - Mother tongue 210,270 146,850 59,695 32,195 27,495 9,065 English 56.9% 74.1% 17.0% 21.2% 12.1% 12.5% French 15.5% 19.7% 5.8% 5.1% 6.6% 6.7% Non-official language 26.5% 4.7% 77.0% 73.5% 81.1% 80.7% English and French 1.1% 1.5% 0.2% 0.2% 0.1% 0.0%
Tota
l - S
exM
enW
omen
Table 6c: Mother Tongue of Canadian-born and Immigrant Populations by Age, Gender and Period of Residence Attainment, Ottawa-Gatineau CMA (Ontario Sector), 2016

41
Total - Age 15 to 24
years 25 to 34
years 35 to 44
years 45 to 54
years 55 to 64
years65 years &
overTotal - Highest certificate, diploma or degree 1,073,820 171,150 173,360 174,645 196,985 175,175 182,505 No certificate, diploma or degree 14.2% 32.0% 7.0% 6.1% 8.1% 11.5% 21.3% Secondary (high) school diploma 23.9% 40.5% 18.0% 15.4% 20.0% 25.5% 24.9% Apprenticeship or trades certificate or diploma 6.5% 2.7% 7.0% 6.8% 7.6% 7.3% 7.4% College, CEGEP or other non-university certificate 19.8% 11.8% 22.5% 23.4% 23.8% 21.3% 15.6% University certificate or diploma below bachelor 2.2% 0.9% 1.6% 2.2% 2.5% 2.7% 3.2% University diploma or degree, bachelor or above 33.4% 12.1% 43.9% 46.2% 38.1% 31.7% 27.5% Bachelor's degree 20.7% 10.9% 29.3% 27.7% 23.0% 18.5% 14.5% Univer. certificate, diploma or degree above bachelor 12.7% 1.2% 14.6% 18.5% 15.1% 13.2% 13.0%Total - Highest certificate, diploma or degree 816,320 143,215 135,205 126,880 143,760 136,620 130,645 No certificate, diploma or degree 14.5% 33.1% 7.1% 6.0% 8.0% 11.3% 20.7% Secondary (high) school diploma 25.2% 39.3% 18.6% 16.2% 21.6% 27.2% 27.3% Apprenticeship or trades certificate or diploma 6.9% 3.0% 7.9% 7.4% 8.4% 7.6% 7.5% College, CEGEP or other non-university certificate 21.0% 12.4% 24.3% 25.7% 25.8% 22.2% 16.1% University certificate or diploma below bachelor 1.9% 0.7% 1.3% 1.7% 2.1% 2.6% 3.3% University diploma or degree, bachelor or above 30.4% 11.5% 40.8% 43.1% 34.1% 29.1% 25.2% Bachelor's degree 20.2% 10.5% 28.4% 27.6% 22.6% 18.2% 14.5% Univer. certificate, diploma or degree above bachelor 10.2% 1.0% 12.3% 15.5% 11.5% 10.9% 10.7%Total - Highest certificate, diploma or degree 241,955 21,635 32,690 45,715 52,195 38,175 51,540 No certificate, diploma or degree 13.4% 30.3% 7.1% 6.3% 8.3% 12.3% 22.8% Secondary (high) school diploma 19.2% 44.8% 16.7% 13.2% 15.3% 19.1% 19.0% Apprenticeship or trades certificate or diploma 5.3% 1.5% 4.0% 5.2% 5.3% 6.2% 7.2% College, CEGEP or other non-university certificate 16.4% 9.1% 17.3% 17.3% 18.6% 18.3% 14.5% University certificate or diploma below bachelor 3.1% 1.4% 2.7% 3.7% 3.7% 3.1% 3.1% University diploma or degree, bachelor or above 42.6% 12.9% 52.2% 54.2% 48.8% 41.1% 33.4% Bachelor's degree 22.1% 11.6% 32.0% 28.1% 24.0% 19.6% 14.8% Univer. certificate, diploma or degree above bachelor 20.5% 1.3% 20.2% 26.1% 24.8% 21.5% 18.7%Total - Highest certificate, diploma or degree 151,915 5,090 12,570 19,320 36,960 32,065 45,910 No certificate, diploma or degree 12.7% 13.9% 4.9% 5.7% 8.3% 11.6% 22.0% Secondary (high) school diploma 19.4% 51.0% 18.3% 16.5% 16.7% 20.0% 19.3% Apprenticeship or trades certificate or diploma 5.8% 1.0% 3.6% 5.1% 5.2% 6.3% 7.5% College, CEGEP or other non-university certificate 18.5% 11.3% 21.1% 22.7% 20.3% 19.4% 14.8% University certificate or diploma below bachelor 2.8% 1.4% 2.3% 2.4% 3.1% 2.7% 3.0% University diploma or degree, bachelor or above 40.7% 21.5% 49.8% 47.6% 46.3% 40.0% 33.5% Bachelor's degree 21.1% 19.2% 33.5% 28.5% 23.5% 19.4% 14.2% Univer. certificate, diploma or degree above bachelor 19.6% 2.3% 16.3% 19.1% 22.9% 20.6% 19.4%Total - Highest certificate, diploma or degree 81,665 14,880 17,265 24,195 14,500 5,660 5,170 No certificate, diploma or degree 14.2% 35.1% 8.4% 6.2% 7.8% 14.5% 28.9% Secondary (high) school diploma 18.8% 43.6% 16.7% 10.7% 11.5% 14.5% 17.5% Apprenticeship or trades certificate or diploma 4.5% 1.5% 4.4% 5.2% 5.4% 5.7% 5.0% College, CEGEP or other non-university certificate 13.1% 8.5% 15.9% 13.6% 14.5% 12.0% 12.0% University certificate or diploma below bachelor 3.7% 1.2% 2.9% 4.5% 5.2% 4.8% 3.9% University diploma or degree, bachelor or above 45.8% 10.0% 51.7% 59.8% 55.6% 48.7% 32.7% Bachelor's degree 23.7% 9.2% 30.5% 27.9% 25.5% 21.5% 19.5% Univer. certificate, diploma or degree above bachelor 22.1% 0.8% 21.1% 31.8% 30.0% 27.1% 13.2%Total - Highest certificate, diploma or degree 21,750 3,840 6,495 6,125 2,610 1,080 1,600 No certificate, diploma or degree 16.3% 43.6% 8.4% 7.3% 9.4% 22.2% 25.3% Secondary (high) school diploma 19.1% 39.7% 14.9% 12.3% 15.5% 21.8% 16.3% Apprenticeship or trades certificate or diploma 4.2% 1.3% 4.1% 5.6% 5.7% 4.6% 3.8% College, CEGEP or other non-university certificate 12.3% 7.7% 12.6% 13.5% 14.6% 13.0% 13.8% University certificate or diploma below bachelor 3.7% 0.9% 3.5% 5.0% 5.4% 2.3% 4.7% University diploma or degree, bachelor or above 44.3% 7.0% 56.5% 56.3% 49.2% 36.6% 36.3% Bachelor's degree 23.4% 6.3% 31.2% 26.0% 23.9% 16.2% 25.9% Univer. certificate, diploma or degree above bachelor 21.0% 0.8% 25.3% 30.1% 25.1% 20.4% 10.6%
Table 7a: Highest Level of Educational Attainment, Canadian-born and Immigrant populations by Age & Period Residence Attainment, Ottawa-Gatineau CMA, 2016
Tota
l pop
ulat
ion
Non
-imm
igra
nts
Imm
igra
nts
Prio
r to
2001
200
1 to
201
4 2
011
to 2
014

42
Total - Age 15 to 24
years 25 to 34
years 35 to 44
years 45 to 54
years 55 to 64
years65 years &
overTotal - Highest certificate, diploma or degree 266,200 39,650 42,725 45,905 49,535 46,165 42,220 No certificate, diploma or degree 19.5% 35.8% 12.6% 9.9% 13.0% 17.5% 31.4% Secondary (high) school diploma 22.5% 32.5% 17.4% 14.6% 20.3% 26.4% 25.1% Apprenticeship or trades certificate or diploma 13.1% 7.3% 16.6% 14.9% 15.3% 12.8% 10.8% College, CEGEP or other non-university certificate 18.2% 17.3% 20.4% 20.2% 21.1% 17.4% 12.2% University certificate or diploma below bachelor 2.9% 0.9% 2.2% 2.9% 3.3% 3.9% 4.1% University diploma or degree, bachelor or above 23.8% 6.2% 30.8% 37.6% 27.2% 22.1% 16.4% Bachelor's degree 15.1% 5.6% 21.0% 22.7% 16.9% 13.3% 9.4% Univer. certificate, diploma or degree above bachelor 8.7% 0.5% 9.8% 14.8% 10.3% 8.7% 7.0%Total - Highest certificate, diploma or degree 231,110 35,470 36,270 37,285 42,200 41,735 38,155 No certificate, diploma or degree 20.4% 36.3% 13.6% 10.9% 13.7% 17.6% 31.7% Secondary (high) school diploma 23.3% 31.7% 17.4% 15.7% 21.3% 27.5% 26.0% Apprenticeship or trades certificate or diploma 13.7% 7.8% 18.3% 16.3% 16.1% 12.8% 10.7% College, CEGEP or other non-university certificate 18.5% 17.4% 21.0% 21.1% 21.6% 17.6% 12.2% University certificate or diploma below bachelor 2.8% 0.9% 2.0% 2.4% 3.0% 3.8% 4.2% University diploma or degree, bachelor or above 21.4% 6.0% 27.7% 33.6% 24.3% 20.7% 15.1% Bachelor's degree 14.2% 5.5% 19.6% 21.7% 16.1% 12.9% 9.2% Univer. certificate, diploma or degree above bachelor 7.2% 0.5% 8.1% 11.9% 8.2% 7.7% 6.0%Total - Highest certificate, diploma or degree 33,265 3,470 5,795 8,370 7,190 4,400 4,030 No certificate, diploma or degree 13.9% 35.7% 7.2% 5.4% 8.6% 16.6% 28.7% Secondary (high) school diploma 16.6% 37.2% 17.7% 9.9% 14.4% 15.6% 16.7% Apprenticeship or trades certificate or diploma 9.1% 3.3% 6.8% 9.1% 11.0% 12.2% 11.0% College, CEGEP or other non-university certificate 16.2% 16.1% 16.9% 16.2% 17.8% 15.7% 12.5% University certificate or diploma below bachelor 3.9% 1.0% 3.5% 5.1% 4.5% 4.4% 2.9% University diploma or degree, bachelor or above 40.3% 6.9% 47.7% 54.4% 43.7% 35.6% 28.0% Bachelor's degree 20.9% 6.3% 28.8% 27.2% 21.3% 17.4% 12.0% Univer. certificate, diploma or degree above bachelor 19.4% 0.6% 18.8% 27.2% 22.4% 18.2% 16.1%Total - Highest certificate, diploma or degree 16,375 815 1,760 2,370 4,370 3,560 3,500 No certificate, diploma or degree 14.9% 20.9% 8.5% 6.1% 9.5% 16.3% 28.0% Secondary (high) school diploma 17.4% 40.5% 20.2% 13.7% 15.3% 16.4% 16.9% Apprenticeship or trades certificate or diploma 10.6% 2.5% 5.7% 10.5% 11.4% 12.8% 10.9% College, CEGEP or other non-university certificate 18.6% 24.5% 22.4% 23.6% 19.8% 16.6% 12.7% University certificate or diploma below bachelor 3.5% 1.8% 2.8% 4.2% 4.3% 3.8% 3.0% University diploma or degree, bachelor or above 35.0% 10.4% 41.2% 41.6% 39.5% 34.1% 28.4% Bachelor's degree 18.7% 9.2% 28.1% 24.9% 20.4% 16.6% 12.1% Univer. certificate, diploma or degree above bachelor 16.3% 1.2% 12.8% 16.9% 19.3% 17.4% 16.0%Total - Highest certificate, diploma or degree 15,320 2,320 3,505 5,560 2,670 795 470 No certificate, diploma or degree 12.3% 40.5% 6.4% 4.8% 7.1% 17.6% 30.9% Secondary (high) school diploma 15.6% 36.6% 16.8% 8.1% 12.2% 11.3% 20.2% Apprenticeship or trades certificate or diploma 8.2% 3.7% 8.0% 8.6% 10.3% 10.1% 11.7% College, CEGEP or other non-university certificate 14.2% 14.2% 15.5% 13.4% 15.4% 12.6% 8.5% University certificate or diploma below bachelor 4.0% 0.4% 3.9% 5.2% 4.5% 5.7% 4.3% University diploma or degree, bachelor or above 45.6% 4.7% 49.2% 59.8% 50.7% 42.1% 27.7% Bachelor's degree 22.9% 4.3% 28.7% 28.3% 23.0% 20.8% 11.7% Univer. certificate, diploma or degree above bachelor 22.6% 0.4% 20.5% 31.7% 27.5% 21.4% 14.9%Total - Highest certificate, diploma or degree 4,370 625 1,415 1,575 440 180 135 No certificate, diploma or degree 14.4% 49.6% 6.0% 6.3% 11.4% 22.2% 37.0% Secondary (high) school diploma 15.4% 33.6% 13.4% 10.8% 19.3% 8.3% 7.4% Apprenticeship or trades certificate or diploma 7.2% 1.6% 6.4% 9.2% 12.5% 5.6% 0.0% College, CEGEP or other non-university certificate 12.9% 8.8% 12.4% 13.7% 15.9% 13.9% 14.8% University certificate or diploma below bachelor 5.0% 1.6% 6.4% 6.0% 5.7% 0.0% 0.0% University diploma or degree, bachelor or above 45.1% 4.8% 55.5% 54.0% 35.2% 47.2% 44.4% Bachelor's degree 23.2% 4.8% 29.3% 27.9% 14.8% 19.4% 18.5% Univer. certificate, diploma or degree above bachelor 21.9% 0.0% 26.5% 26.3% 20.5% 27.8% 18.5%
Table 7b: Highest Level of Educational Attainment, Canadian-born and Immigrant populations by Age & Period Residence Attainment, Ottawa-Gatineau CMA (Québec Sector), 2016
Tota
l pop
ulat
ion
Non
-imm
igra
nts
Imm
igra
nts
Prio
r to
2001
200
1 to
201
4 2
011
to 2
014

43
Note: Equivalent tables disaggregated by gender available from author.
Source: Statistics Canada 2016. Immigrant Status and Period of Immigration (10), Employment Income Statistics (7), STEM and BHASE (non-STEM) Groupings, Major Field of Study - Classification of Instructional Programs (CIP) 2016 (36), Highest Certificate, Diploma or Degree (9), Work Activity During the Reference Year (3), Age (10) and Sex (3) for the Population Aged 15 Years and Over in Private Households of Canada, Provinces and Territories and Census Metropolitan Areas, 2016 Census - 25% Sample Data. [2016 Census Data tables, 98-400-X2016273].
Total - Age 15 to 24
years 25 to 34
years 35 to 44
years 45 to 54
years 55 to 64
years65 years &
overTotal - Highest certificate, diploma or degree 807,620 131,500 130,640 128,745 147,450 129,010 140,280 No certificate, diploma or degree 12.5% 30.9% 5.2% 4.7% 6.4% 9.4% 18.3% Secondary (high) school diploma 24.4% 42.9% 18.2% 15.7% 19.9% 25.1% 24.9% Apprenticeship or trades certificate or diploma 4.3% 1.4% 3.8% 3.9% 5.0% 5.3% 6.4% College, CEGEP or other non-university certificate 20.4% 10.2% 23.2% 24.5% 24.7% 22.7% 16.7% University certificate or diploma below bachelor 2.0% 0.8% 1.4% 2.0% 2.3% 2.2% 3.0% University diploma or degree, bachelor or above 36.5% 13.8% 48.2% 49.3% 41.7% 35.2% 30.9% Bachelor's degree 22.5% 12.5% 32.0% 29.5% 25.0% 20.4% 16.1% Univer. certificate, diploma or degree above bachelor 14.0% 1.3% 16.2% 19.8% 16.7% 14.8% 14.8%Total - Highest certificate, diploma or degree 585,210 107,750 98,930 89,590 101,565 94,885 92,490 No certificate, diploma or degree 12.2% 32.1% 4.8% 3.9% 5.6% 8.6% 16.1% Secondary (high) school diploma 26.0% 41.8% 19.0% 16.4% 21.8% 27.1% 27.8% Apprenticeship or trades certificate or diploma 4.3% 1.5% 4.1% 3.7% 5.3% 5.3% 6.1% College, CEGEP or other non-university certificate 22.0% 10.7% 25.5% 27.6% 27.5% 24.2% 17.7% University certificate or diploma below bachelor 1.6% 0.7% 1.1% 1.4% 1.7% 2.0% 2.9% University diploma or degree, bachelor or above 33.9% 13.3% 45.6% 47.0% 38.2% 32.8% 29.3% Bachelor's degree 22.5% 12.1% 31.7% 30.1% 25.3% 20.5% 16.7% Univer. certificate, diploma or degree above bachelor 11.4% 1.1% 13.9% 16.9% 12.9% 12.3% 12.7%Total - Highest certificate, diploma or degree 208,690 18,165 26,900 37,340 45,005 33,775 47,510 No certificate, diploma or degree 13.4% 29.3% 7.0% 6.5% 8.2% 11.7% 22.3% Secondary (high) school diploma 19.6% 46.3% 16.5% 14.0% 15.5% 19.6% 19.2% Apprenticeship or trades certificate or diploma 4.7% 1.1% 3.3% 4.3% 4.5% 5.4% 6.8% College, CEGEP or other non-university certificate 16.5% 7.8% 17.4% 17.6% 18.7% 18.6% 14.7% University certificate or diploma below bachelor 3.0% 1.4% 2.5% 3.4% 3.6% 2.9% 3.1% University diploma or degree, bachelor or above 43.0% 14.1% 53.2% 54.2% 49.6% 41.8% 33.9% Bachelor's degree 22.3% 12.7% 32.7% 28.3% 24.4% 19.9% 15.0% Univer. certificate, diploma or degree above bachelor 20.7% 1.4% 20.5% 25.9% 25.2% 21.9% 18.9%Total - Highest certificate, diploma or degree 135,535 4,275 10,800 16,955 32,585 28,505 42,420 No certificate, diploma or degree 12.5% 12.5% 4.3% 5.7% 8.1% 11.0% 21.5% Secondary (high) school diploma 19.7% 53.0% 18.1% 16.8% 16.9% 20.5% 19.4% Apprenticeship or trades certificate or diploma 5.3% 0.7% 3.2% 4.3% 4.4% 5.4% 7.2% College, CEGEP or other non-university certificate 18.5% 8.9% 20.9% 22.6% 20.4% 19.8% 14.9% University certificate or diploma below bachelor 2.7% 1.4% 2.2% 2.1% 2.9% 2.6% 3.0% University diploma or degree, bachelor or above 41.4% 23.5% 51.3% 48.4% 47.3% 40.7% 33.9% Bachelor's degree 21.4% 21.2% 34.5% 29.0% 23.9% 19.7% 14.3% Univer. certificate, diploma or degree above bachelor 20.0% 2.3% 16.9% 19.4% 23.4% 21.0% 19.6%Total - Highest certificate, diploma or degree 66,350 12,560 13,760 18,640 11,830 4,870 4,695 No certificate, diploma or degree 14.6% 34.1% 8.9% 6.6% 7.9% 13.8% 29.0% Secondary (high) school diploma 19.5% 44.9% 16.6% 11.5% 11.3% 14.9% 17.4% Apprenticeship or trades certificate or diploma 3.6% 1.2% 3.6% 4.2% 4.3% 5.0% 4.5% College, CEGEP or other non-university certificate 12.9% 7.5% 16.0% 13.7% 14.3% 11.9% 12.2% University certificate or diploma below bachelor 3.6% 1.4% 2.6% 4.3% 5.3% 4.5% 3.8% University diploma or degree, bachelor or above 45.8% 11.0% 52.3% 59.7% 56.7% 49.8% 33.2% Bachelor's degree 23.9% 10.1% 31.0% 27.9% 26.0% 21.6% 20.3% Univer. certificate, diploma or degree above bachelor 22.0% 0.9% 21.3% 31.9% 30.6% 28.1% 12.8%Total - Highest certificate, diploma or degree 17,380 3,220 5,080 4,555 2,170 905 1,465 No certificate, diploma or degree 16.8% 42.4% 9.1% 7.7% 9.0% 21.5% 24.9% Secondary (high) school diploma 20.0% 40.8% 15.4% 12.8% 14.7% 24.3% 17.1% Apprenticeship or trades certificate or diploma 3.5% 1.2% 3.4% 4.5% 4.1% 4.4% 4.1% College, CEGEP or other non-university certificate 12.2% 7.5% 12.7% 13.4% 14.5% 12.7% 13.0% University certificate or diploma below bachelor 3.4% 0.8% 2.8% 4.7% 5.3% 2.8% 5.1% University diploma or degree, bachelor or above 44.1% 7.5% 56.7% 57.0% 51.8% 34.3% 35.5% Bachelor's degree 23.4% 6.5% 31.8% 25.6% 25.6% 15.5% 26.3% Univer. certificate, diploma or degree above bachelor 20.7% 0.9% 25.0% 31.5% 26.0% 18.2% 9.6%
Table 7c: Highest Level of Educational Attainment, Canadian-born and Immigrant populations by Age & Period Residence Attainment, Ottawa-Gatineau CMA (Ontario Sector), 2016
Prio
r to
2001
200
1 to
201
4 2
011
to 2
014
Tota
l pop
ulat
ion
Non
-imm
igra
nts
Imm
igra
nts
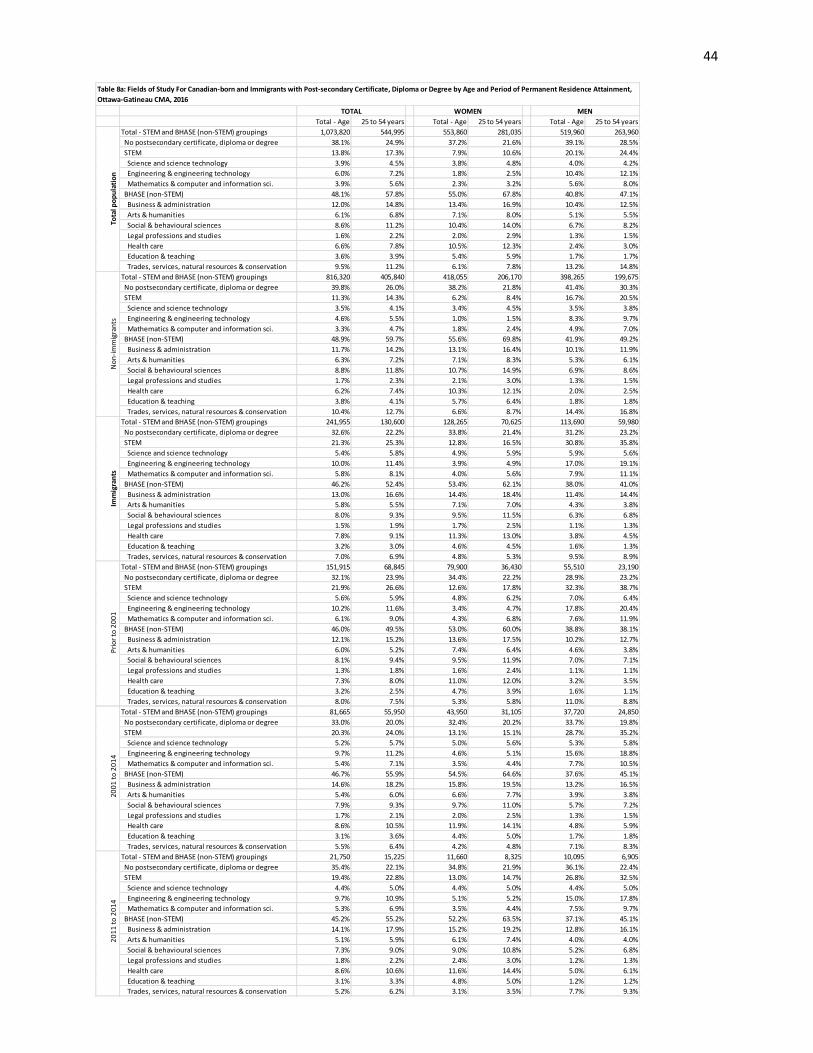
44
Total - Age 25 to 54 years Total - Age 25 to 54 years Total - Age 25 to 54 yearsTotal - STEM and BHASE (non-STEM) groupings 1,073,820 544,995 553,860 281,035 519,960 263,960 No postsecondary certificate, diploma or degree 38.1% 24.9% 37.2% 21.6% 39.1% 28.5% STEM 13.8% 17.3% 7.9% 10.6% 20.1% 24.4% Science and science technology 3.9% 4.5% 3.8% 4.8% 4.0% 4.2% Engineering & engineering technology 6.0% 7.2% 1.8% 2.5% 10.4% 12.1% Mathematics & computer and information sci. 3.9% 5.6% 2.3% 3.2% 5.6% 8.0% BHASE (non-STEM) 48.1% 57.8% 55.0% 67.8% 40.8% 47.1% Business & administration 12.0% 14.8% 13.4% 16.9% 10.4% 12.5% Arts & humanities 6.1% 6.8% 7.1% 8.0% 5.1% 5.5% Social & behavioural sciences 8.6% 11.2% 10.4% 14.0% 6.7% 8.2% Legal professions and studies 1.6% 2.2% 2.0% 2.9% 1.3% 1.5% Health care 6.6% 7.8% 10.5% 12.3% 2.4% 3.0% Education & teaching 3.6% 3.9% 5.4% 5.9% 1.7% 1.7% Trades, services, natural resources & conservation 9.5% 11.2% 6.1% 7.8% 13.2% 14.8%Total - STEM and BHASE (non-STEM) groupings 816,320 405,840 418,055 206,170 398,265 199,675 No postsecondary certificate, diploma or degree 39.8% 26.0% 38.2% 21.8% 41.4% 30.3% STEM 11.3% 14.3% 6.2% 8.4% 16.7% 20.5% Science and science technology 3.5% 4.1% 3.4% 4.5% 3.5% 3.8% Engineering & engineering technology 4.6% 5.5% 1.0% 1.5% 8.3% 9.7% Mathematics & computer and information sci. 3.3% 4.7% 1.8% 2.4% 4.9% 7.0% BHASE (non-STEM) 48.9% 59.7% 55.6% 69.8% 41.9% 49.2% Business & administration 11.7% 14.2% 13.1% 16.4% 10.1% 11.9% Arts & humanities 6.3% 7.2% 7.1% 8.3% 5.3% 6.1% Social & behavioural sciences 8.8% 11.8% 10.7% 14.9% 6.9% 8.6% Legal professions and studies 1.7% 2.3% 2.1% 3.0% 1.3% 1.5% Health care 6.2% 7.4% 10.3% 12.1% 2.0% 2.5% Education & teaching 3.8% 4.1% 5.7% 6.4% 1.8% 1.8% Trades, services, natural resources & conservation 10.4% 12.7% 6.6% 8.7% 14.4% 16.8%Total - STEM and BHASE (non-STEM) groupings 241,955 130,600 128,265 70,625 113,690 59,980 No postsecondary certificate, diploma or degree 32.6% 22.2% 33.8% 21.4% 31.2% 23.2% STEM 21.3% 25.3% 12.8% 16.5% 30.8% 35.8% Science and science technology 5.4% 5.8% 4.9% 5.9% 5.9% 5.6% Engineering & engineering technology 10.0% 11.4% 3.9% 4.9% 17.0% 19.1% Mathematics & computer and information sci. 5.8% 8.1% 4.0% 5.6% 7.9% 11.1% BHASE (non-STEM) 46.2% 52.4% 53.4% 62.1% 38.0% 41.0% Business & administration 13.0% 16.6% 14.4% 18.4% 11.4% 14.4% Arts & humanities 5.8% 5.5% 7.1% 7.0% 4.3% 3.8% Social & behavioural sciences 8.0% 9.3% 9.5% 11.5% 6.3% 6.8% Legal professions and studies 1.5% 1.9% 1.7% 2.5% 1.1% 1.3% Health care 7.8% 9.1% 11.3% 13.0% 3.8% 4.5% Education & teaching 3.2% 3.0% 4.6% 4.5% 1.6% 1.3% Trades, services, natural resources & conservation 7.0% 6.9% 4.8% 5.3% 9.5% 8.9%Total - STEM and BHASE (non-STEM) groupings 151,915 68,845 79,900 36,430 55,510 23,190 No postsecondary certificate, diploma or degree 32.1% 23.9% 34.4% 22.2% 28.9% 23.2% STEM 21.9% 26.6% 12.6% 17.8% 32.3% 38.7% Science and science technology 5.6% 5.9% 4.8% 6.2% 7.0% 6.4% Engineering & engineering technology 10.2% 11.6% 3.4% 4.7% 17.8% 20.4% Mathematics & computer and information sci. 6.1% 9.0% 4.3% 6.8% 7.6% 11.9% BHASE (non-STEM) 46.0% 49.5% 53.0% 60.0% 38.8% 38.1% Business & administration 12.1% 15.2% 13.6% 17.5% 10.2% 12.7% Arts & humanities 6.0% 5.2% 7.4% 6.4% 4.6% 3.8% Social & behavioural sciences 8.1% 9.4% 9.5% 11.9% 7.0% 7.1% Legal professions and studies 1.3% 1.8% 1.6% 2.4% 1.1% 1.1% Health care 7.3% 8.0% 11.0% 12.0% 3.2% 3.5% Education & teaching 3.2% 2.5% 4.7% 3.9% 1.6% 1.1% Trades, services, natural resources & conservation 8.0% 7.5% 5.3% 5.8% 11.0% 8.8%Total - STEM and BHASE (non-STEM) groupings 81,665 55,950 43,950 31,105 37,720 24,850 No postsecondary certificate, diploma or degree 33.0% 20.0% 32.4% 20.2% 33.7% 19.8% STEM 20.3% 24.0% 13.1% 15.1% 28.7% 35.2% Science and science technology 5.2% 5.7% 5.0% 5.6% 5.3% 5.8% Engineering & engineering technology 9.7% 11.2% 4.6% 5.1% 15.6% 18.8% Mathematics & computer and information sci. 5.4% 7.1% 3.5% 4.4% 7.7% 10.5% BHASE (non-STEM) 46.7% 55.9% 54.5% 64.6% 37.6% 45.1% Business & administration 14.6% 18.2% 15.8% 19.5% 13.2% 16.5% Arts & humanities 5.4% 6.0% 6.6% 7.7% 3.9% 3.8% Social & behavioural sciences 7.9% 9.3% 9.7% 11.0% 5.7% 7.2% Legal professions and studies 1.7% 2.1% 2.0% 2.5% 1.3% 1.5% Health care 8.6% 10.5% 11.9% 14.1% 4.8% 5.9% Education & teaching 3.1% 3.6% 4.4% 5.0% 1.7% 1.8% Trades, services, natural resources & conservation 5.5% 6.4% 4.2% 4.8% 7.1% 8.3%Total - STEM and BHASE (non-STEM) groupings 21,750 15,225 11,660 8,325 10,095 6,905 No postsecondary certificate, diploma or degree 35.4% 22.1% 34.8% 21.9% 36.1% 22.4% STEM 19.4% 22.8% 13.0% 14.7% 26.8% 32.5% Science and science technology 4.4% 5.0% 4.4% 5.0% 4.4% 5.0% Engineering & engineering technology 9.7% 10.9% 5.1% 5.2% 15.0% 17.8% Mathematics & computer and information sci. 5.3% 6.9% 3.5% 4.4% 7.5% 9.7% BHASE (non-STEM) 45.2% 55.2% 52.2% 63.5% 37.1% 45.1% Business & administration 14.1% 17.9% 15.2% 19.2% 12.8% 16.1% Arts & humanities 5.1% 5.9% 6.1% 7.4% 4.0% 4.0% Social & behavioural sciences 7.3% 9.0% 9.0% 10.8% 5.2% 6.8% Legal professions and studies 1.8% 2.2% 2.4% 3.0% 1.2% 1.3% Health care 8.6% 10.6% 11.6% 14.4% 5.0% 6.1% Education & teaching 3.1% 3.3% 4.8% 5.0% 1.2% 1.2% Trades, services, natural resources & conservation 5.2% 6.2% 3.1% 3.5% 7.7% 9.3%
Table 8a: Fields of Study For Canadian-born and Immigrants with Post-secondary Certificate, Diploma or Degree by Age and Period of Permanent Residence Attainment, Ottawa-Gatineau CMA, 2016
TOTAL WOMEN MEN20
01 to
201
420
11 to
201
4To
tal p
opul
atio
nN
on-im
mig
rant
sIm
mig
rant
sPr
ior t
o 20
01

45
Total - Age 25 to 54 years Total - Age 25 to 54 years Total - Age 25 to 54 yearsTotal - STEM and BHASE (non-STEM) groupings 266,200 138,165 136,500 70,765 129,700 67,400 No postsecondary certificate, diploma or degree 42.0% 29.3% 40.7% 25.7% 43.3% 33.2% STEM 9.3% 11.8% 4.9% 6.5% 13.9% 17.4% Science and science technology 2.7% 3.1% 2.3% 3.0% 3.0% 3.2% Engineering & engineering technology 3.6% 4.5% 0.9% 1.2% 6.5% 7.9% Mathematics & computer and information sci. 3.0% 4.2% 1.7% 2.3% 4.4% 6.3% BHASE (non-STEM) 48.7% 58.9% 54.4% 67.9% 42.8% 49.5% Business & administration 13.3% 16.7% 16.4% 21.0% 10.0% 12.3% Arts & humanities 5.4% 5.6% 6.1% 6.5% 4.6% 4.6% Social & behavioural sciences 6.5% 8.6% 8.0% 11.1% 4.9% 5.9% Legal professions and studies 1.2% 1.6% 1.5% 2.1% 0.9% 1.0% Health care 5.8% 7.2% 9.5% 11.6% 2.0% 2.6% Education & teaching 4.1% 4.3% 6.0% 6.5% 2.1% 2.0% Trades, services, natural resources & conservation 12.5% 14.9% 6.9% 9.0% 18.3% 21.1%Total - STEM and BHASE (non-STEM) groupings 231,110 115,755 118,800 59,315 112,305 56,435 No postsecondary certificate, diploma or degree 43.6% 31.0% 42.1% 26.9% 45.3% 35.3% STEM 8.3% 10.5% 4.2% 5.5% 12.7% 15.8% Science and science technology 2.4% 2.7% 2.1% 2.6% 2.8% 2.8% Engineering & engineering technology 3.2% 3.9% 0.6% 0.9% 5.8% 7.0% Mathematics & computer and information sci. 2.8% 3.9% 1.5% 2.0% 4.1% 5.9% BHASE (non-STEM) 48.0% 58.5% 53.7% 67.5% 42.1% 48.9% Business & administration 12.6% 15.6% 16.0% 20.3% 9.0% 10.7% Arts & humanities 5.3% 5.7% 6.0% 6.6% 4.6% 4.7% Social & behavioural sciences 6.1% 8.3% 7.7% 10.9% 4.5% 5.5% Legal professions and studies 1.1% 1.4% 1.4% 1.9% 0.8% 0.9% Health care 5.6% 6.9% 9.3% 11.4% 1.7% 2.2% Education & teaching 4.2% 4.4% 6.1% 6.8% 2.1% 2.0% Trades, services, natural resources & conservation 13.0% 16.1% 7.2% 9.6% 19.2% 22.9%Total - STEM and BHASE (non-STEM) groupings 33,265 21,350 16,800 10,930 16,460 10,425 No postsecondary certificate, diploma or degree 30.5% 20.5% 30.8% 19.3% 30.2% 21.8% STEM 15.7% 18.2% 9.5% 11.3% 22.1% 25.5% Science and science technology 4.3% 4.8% 4.1% 4.9% 4.5% 4.8% Engineering & engineering technology 6.7% 7.7% 2.6% 3.1% 10.9% 12.5% Mathematics & computer and information sci. 4.7% 5.7% 2.7% 3.2% 6.7% 8.2% BHASE (non-STEM) 53.8% 61.3% 59.7% 69.4% 47.8% 52.8% Business & administration 18.0% 22.7% 19.4% 24.6% 16.6% 20.8% Arts & humanities 5.5% 4.9% 6.6% 6.0% 4.4% 3.7% Social & behavioural sciences 8.9% 10.1% 10.5% 12.1% 7.3% 8.0% Legal professions and studies 2.0% 2.5% 2.5% 3.4% 1.5% 1.5% Health care 7.0% 8.4% 10.4% 12.4% 3.6% 4.4% Education & teaching 3.6% 3.8% 5.0% 5.3% 2.2% 2.2% Trades, services, natural resources & conservation 8.8% 8.8% 5.3% 5.6% 12.4% 12.2%Total - STEM and BHASE (non-STEM) groupings 16,375 8,505 2,650 2,830 8,315 4,280 No postsecondary certificate, diploma or degree 32.3% 24.2% 14.7% 18.7% 31.6% 26.8% STEM 15.3% 17.8% 17.5% 14.7% 21.3% 23.6% Science and science technology 4.5% 5.3% 7.7% 6.4% 4.9% 5.3% Engineering & engineering technology 6.2% 6.6% 4.0% 3.4% 10.0% 10.2% Mathematics & computer and information sci. 4.7% 6.0% 5.3% 4.8% 6.5% 8.3% BHASE (non-STEM) 52.4% 58.0% 67.9% 66.4% 47.3% 49.5% Business & administration 15.8% 20.8% 25.1% 23.7% 14.4% 18.6% Arts & humanities 6.5% 5.4% 4.0% 5.7% 5.4% 4.8% Social & behavioural sciences 8.4% 9.3% 14.7% 12.7% 7.0% 6.9% Legal professions and studies 1.7% 2.3% 2.8% 2.7% 1.4% 1.3% Health care 6.3% 7.5% 11.7% 11.5% 2.6% 2.9% Education & teaching 3.4% 2.6% 1.7% 3.4% 1.8% 0.9% Trades, services, natural resources & conservation 10.4% 10.2% 8.1% 6.9% 14.4% 13.8%Total - STEM and BHASE (non-STEM) groupings 15,320 11,735 7,940 6,125 7,380 5,610 No postsecondary certificate, diploma or degree 28.0% 17.4% 27.8% 17.1% 28.2% 17.8% STEM 16.1% 18.4% 9.9% 11.0% 22.7% 26.3% Science and science technology 4.1% 4.5% 4.3% 4.8% 3.9% 4.2% Engineering & engineering technology 7.2% 8.4% 2.8% 3.1% 11.9% 14.1% Mathematics & computer and information sci. 4.8% 5.5% 2.7% 3.0% 7.0% 8.3% BHASE (non-STEM) 55.9% 64.2% 62.3% 72.0% 49.1% 55.7% Business & administration 20.2% 24.2% 21.7% 25.9% 18.6% 22.3% Arts & humanities 4.8% 4.8% 5.8% 6.4% 3.5% 3.2% Social & behavioural sciences 9.5% 10.7% 11.1% 12.3% 7.7% 9.0% Legal professions and studies 2.2% 2.4% 2.8% 3.3% 1.4% 1.6% Health care 8.0% 9.3% 11.1% 12.7% 4.7% 5.6% Education & teaching 4.0% 4.7% 5.3% 6.2% 2.6% 2.9% Trades, services, natural resources & conservation 7.4% 8.1% 4.8% 5.4% 10.4% 11.0%Total - STEM and BHASE (non-STEM) groupings 4,370 3,435 2,225 1,780 2,150 1,655 No postsecondary certificate, diploma or degree 29.9% 19.7% 28.1% 18.3% 31.6% 21.5% STEM 14.8% 16.4% 9.4% 9.6% 20.5% 23.9% Science and science technology 4.0% 4.4% 4.3% 4.5% 3.5% 4.2% Engineering & engineering technology 5.9% 6.7% 2.5% 2.0% 9.5% 11.8% Mathematics & computer and information sci. 4.9% 5.4% 2.5% 2.8% 7.4% 8.2% BHASE (non-STEM) 55.4% 63.9% 62.5% 72.5% 47.7% 54.4% Business & administration 20.7% 24.6% 24.3% 28.9% 17.2% 19.9% Arts & humanities 4.7% 5.1% 5.4% 6.5% 3.7% 3.9% Social & behavioural sciences 9.2% 10.3% 11.2% 12.1% 7.0% 8.5% Legal professions and studies 2.6% 2.9% 3.1% 3.7% 2.1% 2.1% Health care 7.9% 9.5% 10.8% 12.9% 5.1% 5.7% Education & teaching 3.4% 3.9% 4.9% 5.6% 1.6% 1.8% Trades, services, natural resources & conservation 6.8% 7.7% 2.9% 3.1% 10.9% 12.4%
2011
to 2
014
Tota
l pop
ulat
ion
Non
-imm
igra
nts
Imm
igra
nts
Prio
r to
2001
2001
to 2
014
Table 8b: Fields of Study For Canadian-born and Immigrants with Post-secondary Certificate, Diploma or Degree by Age and Period of Permanent Residence Attainment, Ottawa-Gatineau CMA, (Québec Sector), 2016
TOTAL WOMEN MEN

46
Source: Statistics Canada 2016. Immigrant Status and Period of Immigration (10), Employment Income Statistics (7), STEM and BHASE (non-STEM) Groupings, Major Field of Study - Classification of Instructional Programs (CIP) 2016 (36), Highest Certificate, Diploma or Degree (9), Work Activity During the Reference Year (3), Age (10) and Sex (3) for the Population Aged 15 Years and Over in Private Households of Canada, Provinces and Territories and Census Metropolitan Areas, 2016 Census - 25% Sample Data. [2016 Census Data tables, 98-400-X2016273].
Total - Age 25 to 54 years Total - Age 25 to 54 years Total - Age 25 to 54 yearsTotal - STEM and BHASE (non-STEM) groupings 807620 406830 417,365 210,270 390,260 196,560 No postsecondary certificate, diploma or degree 36.8% 23.5% 36.0% 20.3% 37.7% 26.9% STEM 15.3% 19.1% 8.8% 12.0% 22.1% 26.8% Science and science technology 4.3% 5.0% 4.2% 5.5% 4.4% 4.6% Engineering & engineering technology 6.7% 8.1% 2.1% 2.9% 11.8% 13.6% Mathematics & computer and information sci. 4.2% 6.0% 2.5% 3.6% 6.0% 8.6% BHASE (non-STEM) 47.9% 57.4% 55.1% 67.8% 40.1% 46.3% Business & administration 11.5% 14.1% 12.4% 15.6% 10.5% 12.6% Arts & humanities 6.4% 7.2% 7.5% 8.5% 5.2% 5.9% Social & behavioural sciences 9.3% 12.1% 11.2% 15.0% 7.4% 8.9% Legal professions and studies 1.8% 2.4% 2.1% 3.1% 1.4% 1.6% Health care 6.8% 8.0% 10.8% 12.6% 2.6% 3.1% Education & teaching 3.5% 3.7% 5.3% 5.7% 1.6% 1.6% Trades, services, natural resources & conservation 8.6% 9.9% 5.9% 7.3% 11.5% 12.7%Total - STEM and BHASE (non-STEM) groupings 585210 290090 299,255 146,855 285,960 143,235 No postsecondary certificate, diploma or degree 38.2% 24.0% 36.7% 19.7% 39.8% 28.3% STEM 12.5% 15.8% 7.0% 9.5% 18.3% 22.3% Science and science technology 3.9% 4.7% 3.9% 5.2% 3.8% 4.1% Engineering & engineering technology 5.2% 6.2% 1.2% 1.8% 9.3% 10.7% Mathematics & computer and information sci. 3.5% 4.9% 1.9% 2.5% 5.2% 7.5% BHASE (non-STEM) 49.2% 60.2% 56.3% 70.8% 41.8% 49.3% Business & administration 11.3% 13.6% 12.0% 14.8% 10.6% 12.4% Arts & humanities 6.6% 7.8% 7.6% 9.0% 5.6% 6.6% Social & behavioural sciences 9.9% 13.2% 11.9% 16.5% 7.8% 9.8% Legal professions and studies 1.9% 2.6% 2.3% 3.5% 1.5% 1.7% Health care 6.5% 7.6% 10.6% 12.4% 2.1% 2.6% Education & teaching 3.7% 4.0% 5.6% 6.2% 1.7% 1.8% Trades, services, natural resources & conservation 9.3% 11.3% 6.3% 8.3% 12.5% 14.4%Total - STEM and BHASE (non-STEM) groupings 208690 109250 111,465 59,695 97,230 49,550 No postsecondary certificate, diploma or degree 32.9% 22.6% 34.2% 21.8% 31.4% 23.5% STEM 22.1% 26.7% 13.3% 17.4% 32.3% 37.9% Science and science technology 5.6% 5.9% 5.0% 6.1% 6.2% 5.8% Engineering & engineering technology 10.6% 12.2% 4.1% 5.3% 18.0% 20.5% Mathematics & computer and information sci. 6.0% 8.6% 4.2% 6.1% 8.1% 11.7% BHASE (non-STEM) 45.0% 50.7% 52.5% 60.8% 36.3% 38.6% Business & administration 12.2% 15.4% 13.7% 17.3% 10.5% 13.0% Arts & humanities 5.8% 5.7% 7.1% 7.2% 4.3% 3.8% Social & behavioural sciences 7.8% 9.2% 9.4% 11.4% 6.1% 6.6% Legal professions and studies 1.4% 1.8% 1.6% 2.3% 1.1% 1.3% Health care 7.9% 9.2% 11.4% 13.1% 3.8% 4.6% Education & teaching 3.1% 2.9% 4.5% 4.3% 1.5% 1.2% Trades, services, natural resources & conservation 6.8% 6.5% 4.8% 5.2% 9.0% 8.2%Total - STEM and BHASE (non-STEM) groupings 135535 60335 71,845 32,205 63,695 28,140 No postsecondary certificate, diploma or degree 32.1% 23.9% 34.5% 22.4% 29.4% 25.5% STEM 22.7% 27.8% 13.0% 18.6% 33.5% 38.4% Science and science technology 5.7% 6.0% 4.9% 6.4% 6.6% 5.6% Engineering & engineering technology 10.7% 12.3% 3.6% 5.0% 18.7% 20.7% Mathematics & computer and information sci. 6.2% 9.5% 4.5% 7.2% 8.2% 12.1% BHASE (non-STEM) 45.2% 48.4% 52.4% 59.1% 37.1% 36.1% Business & administration 11.6% 14.4% 13.2% 16.8% 9.8% 11.6% Arts & humanities 6.0% 5.2% 7.3% 6.5% 4.5% 3.7% Social & behavioural sciences 8.1% 9.4% 9.4% 11.9% 6.5% 6.6% Legal professions and studies 1.3% 1.8% 1.5% 2.3% 1.0% 1.1% Health care 7.5% 8.0% 11.1% 12.0% 3.4% 3.5% Education & teaching 3.1% 2.5% 4.6% 3.9% 1.5% 0.9% Trades, services, natural resources & conservation 7.7% 7.1% 5.2% 5.7% 10.5% 8.7%Total - STEM and BHASE (non-STEM) groupings 66350 44220 36,010 24,975 30,340 19,240 No postsecondary certificate, diploma or degree 34.2% 20.7% 33.4% 21.0% 35.1% 20.3% STEM 21.3% 25.5% 13.8% 16.2% 30.1% 37.7% Science and science technology 5.4% 6.0% 5.2% 5.8% 5.7% 6.3% Engineering & engineering technology 10.3% 12.0% 5.0% 5.6% 16.6% 20.2% Mathematics & computer and information sci. 5.6% 7.6% 3.7% 4.8% 7.9% 11.2% BHASE (non-STEM) 44.6% 53.8% 52.8% 62.8% 34.8% 42.0% Business & administration 13.3% 16.5% 14.5% 17.9% 11.8% 14.8% Arts & humanities 5.5% 6.3% 6.8% 8.1% 4.0% 4.1% Social & behavioural sciences 7.5% 9.0% 9.4% 10.7% 5.3% 6.7% Legal professions and studies 1.5% 2.0% 1.8% 2.3% 1.2% 1.5% Health care 8.7% 10.8% 12.0% 14.5% 4.8% 6.0% Education & teaching 2.9% 3.3% 4.2% 4.7% 1.4% 1.5% Trades, services, natural resources & conservation 5.1% 5.9% 4.1% 4.6% 6.3% 7.5%Total - STEM and BHASE (non-STEM) groupings 17380 11795 9,435 6,545 7,945 5,250 No postsecondary certificate, diploma or degree 36.8% 22.8% 36.4% 22.9% 37.3% 22.7% STEM 20.6% 24.6% 13.9% 16.1% 28.5% 35.1% Science and science technology 4.5% 5.1% 4.4% 5.0% 4.5% 5.2% Engineering & engineering technology 10.6% 12.2% 5.7% 6.1% 16.6% 19.7% Mathematics & computer and information sci. 5.5% 7.2% 3.8% 5.0% 7.5% 10.2% BHASE (non-STEM) 42.7% 52.6% 49.8% 61.0% 34.2% 42.1% Business & administration 12.4% 15.9% 13.1% 16.7% 11.6% 15.0% Arts & humanities 5.3% 6.1% 6.3% 7.7% 4.0% 4.2% Social & behavioural sciences 6.8% 8.7% 8.5% 10.5% 4.7% 6.4% Legal professions and studies 1.6% 2.0% 2.2% 2.8% 0.9% 1.0% Health care 8.7% 11.0% 11.8% 14.8% 5.0% 6.2% Education & teaching 3.0% 3.1% 4.7% 4.8% 1.1% 1.0% Trades, services, natural resources & conservation 4.9% 5.8% 3.2% 3.7% 6.9% 8.3%
2001
to 2
014
2011
to 2
014
Table 8c: Fields of Study For Canadian-born and Immigrants with Post-secondary Certificate, Diploma or Degree by Age and Period of Permanent Residence Attainment, Ottawa-Gatineau CMA, (Ontario Sector), 2016
TOTAL WOMEN MENTo
tal p
opul
atio
nN
on-im
mig
rant
sIm
mig
rant
sPr
ior t
o 20
01

47
Source: Admission Category and Applicant Type (7), Labour Force Status (8), Period of Immigration (7), Highest Certificate, Diploma or Degree (7), Location of Study (5), Age (13A) and Sex (3) for the Population Aged 15 Years and Over that Immigrated between 1980 and 2016, Living in Private Households of Canada, Provinces and Territories, Census Metropolitan Areas and Census Agglomerations, 2016 Census - 25% Sample Data. [2016 Census Data tables, 98-400-X2016204].
Participation rate
Employment rate
Unemployment rate
Participation rate
Employment rate
Unemployment rate
Participation rate
Employment rate
Unemployment rate
Total - Age Total - Admission category 72.2 65.8 8.9 77.4 69.4 10.3 71.3 65.1 8.7 Economic immigrants 78.2 71.5 8.6 81.2 72.9 10.3 77.6 71.2 8.2 Principal applicants 85.3 80.2 6 87.7 79.9 8.8 84.7 80.2 5.4 Secondary applicants 72.2 64.1 11.1 74.3 65.3 12.1 71.8 64 11 Immigrants sponsored by family 67.5 61.9 8.2 74.5 67.4 9.5 66.2 61 8 Refugees 67.2 60.1 10.5 74 66.1 10.7 65.8 59 10.4
25 to 54 years Total - Admission category 83.8 77.3 7.7 86.3 78.5 9.0 83.3 77.1 7.4 Economic immigrants 87.9 81.7 7.1 88.7 80.9 8.9 87.7 81.8 6.7 Principal applicants 92.1 86.5 6.0 91.5 83.7 8.6 92.2 87.3 5.3 Secondary applicants 83.9 76.9 8.3 85.2 77.4 9.1 83.6 76.9 8.1 Immigrants sponsored by family 82.4 76.1 7.6 83.9 76.0 9.3 82.1 76.1 7.3 Refugees 77.2 70.0 9.2 83.9 76.8 8.7 75.8 68.7 9.3
Total - Age Total - Admission category 78.2 74.5 4.8 80.8 75.7 6.3 74.4 69.8 6.2 Economic immigrants 78.6 75.5 3.9 82.4 77.9 5.5 78.6 74.0 5.8 Principal applicants 72.2 69.6 3.5 82.5 78.1 4.7 79.3 76.4 3.8 Secondary applicants 82.3 78.9 4.1 81.9 77.3 5.8 77.9 72.2 7.3 Immigrants sponsored by family 77.8 73.7 5.2 78.4 73.2 6.8 70.0 65.7 6.1 Refugees 78.3 74.1 5.5 81.8 75.9 7.1 72.6 67.6 6.9
25 to 54 years Total - Admission category 87.3 82.5 5.5 91.2 86.5 5.2 86.7 81.9 5.5 Economic immigrants 90.2 85.8 4.7 92.7 89.1 4.1 89.8 85.4 4.8 Principal applicants 93.0 89.9 3.3 95.6 90.2 5.1 92.7 89.9 3.0 Secondary applicants 88.4 83.5 5.6 91.3 88.9 3.2 88.1 82.8 5.9 Immigrants sponsored by family 86.5 81.4 5.8 90.4 84.5 6.5 85.8 80.9 5.8 Refugees 84.1 78.9 6.2 90.3 85.7 4.6 83.0 77.8 6.3
Total - Age Total - Admission category 69.2 60.9 12.0 80.6 70.5 12.7 67.8 59.9 11.8 Economic immigrants 77.4 68.7 11.2 89.6 80.7 10.1 76.6 68.3 10.8 Principal applicants 90.0 83.2 7.5 69.4 57.7 16.8 90.1 84.0 6.8 Secondary applicants 66.1 55.7 15.7 71.4 62.8 11.9 65.4 55.3 15.5 Immigrants sponsored by family 63.6 56.8 10.6 66.4 56.6 15.0 62.0 55.5 10.4 Refugees 57.9 48.2 16.8 75.5 57.1 24.3 55.8 46.1 17.3
25 to 54 years Total - Admission category 80.5 72.5 9.9 83.9 72.4 13.6 80.6 73.4 8.9 Economic immigrants 86.2 78.5 8.9 89.2 79.0 11.3 86.3 79.5 8.0 Principal applicants 91.6 85.0 7.2 75.0 61.2 18.1 91.8 85.7 6.6 Secondary applicants 78.5 69.4 11.8 74.2 64.2 13.8 79.6 71.8 9.9 Immigrants sponsored by family 78.2 70.8 9.5 68.1 57.5 15.5 79.3 73.0 8.1 Refugees 67.1 57.4 14.6 84.0 56.0 28.6 66.3 56.8 14.3
Total - Age Total - Admission category 62.5 52.2 16.6 66.9 52.4 21.8 66.9 52.4 21.8 Economic immigrants 74.3 63.4 14.7 75.8 60.5 20.1 75.8 60.5 20.1 Principal applicants 87.9 78.4 10.8 83.8 70.1 16.3 83.8 70.1 16.3 Secondary applicants 58.8 46.3 21.4 64.8 47.2 27.2 64.8 47.2 27.2 Immigrants sponsored by family 57 47.7 16.2 63.2 50.3 20.4 63.2 50.3 20.4 Refugees 43.7 32.6 25.3 44.7 31.7 29.2 44.7 31.7 29.2
25 to 54 years Total - Admission category 73.7 62.9 14.6 75.6 60.9 19.6 75.6 60.9 19.6 Economic immigrants 81.2 70.4 13.4 80.7 65.9 18.1 80.7 65.9 18.1 Principal applicants 88.3 79.1 10.5 84.2 71.8 15.0 84.2 71.8 15.0 Secondary applicants 68.6 55.0 20.1 73.9 54.9 25.0 73.9 54.9 25.0 Immigrants sponsored by family 72.8 62.3 14.5 73.6 59.1 20.9 73.6 59.1 20.9 Refugees 50.8 39.8 21.6 55.0 43.2 23.0 55.0 43.2 23.0
Tota
l - P
erio
d of
imm
igra
tion
1981
to 2
000
2001
to 2
016
201
1 to
201
6Ottawa-Gatineau CMA Ottawa-Gatineau CMA (Québec sector) Ottawa-Gatineau CMA (Ontario sector)
Table 9: Labour Force Characteristics of Immigrant Population by Admission Category and Period of Arrival, Ottawa-Gatineau CMA and Components, 2016
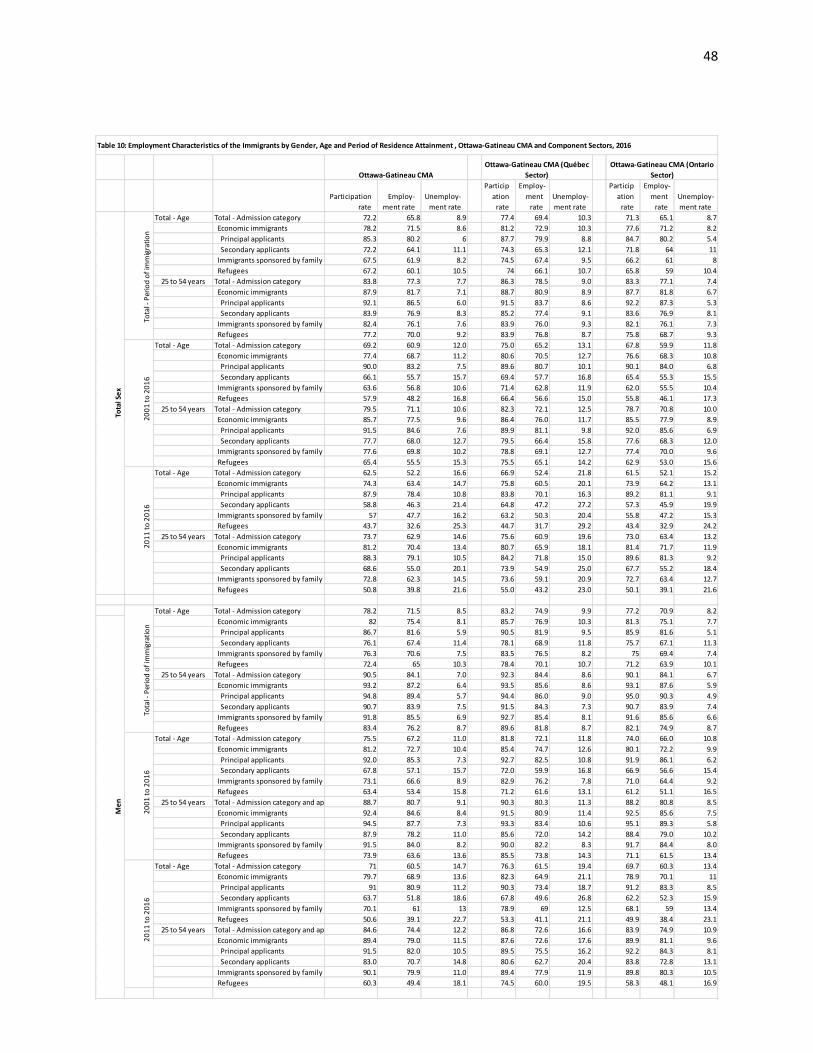
48
Participation rate
Employ- ment rate
Unemploy- ment rate
Participation
rate
Employ- ment
rateUnemploy- ment rate
Participation
rate
Employ- ment
rateUnemploy- ment rate
Total - Age Total - Admission category 72.2 65.8 8.9 77.4 69.4 10.3 71.3 65.1 8.7 Economic immigrants 78.2 71.5 8.6 81.2 72.9 10.3 77.6 71.2 8.2 Principal applicants 85.3 80.2 6 87.7 79.9 8.8 84.7 80.2 5.4 Secondary applicants 72.2 64.1 11.1 74.3 65.3 12.1 71.8 64 11 Immigrants sponsored by family 67.5 61.9 8.2 74.5 67.4 9.5 66.2 61 8 Refugees 67.2 60.1 10.5 74 66.1 10.7 65.8 59 10.4
25 to 54 years Total - Admission category 83.8 77.3 7.7 86.3 78.5 9.0 83.3 77.1 7.4 Economic immigrants 87.9 81.7 7.1 88.7 80.9 8.9 87.7 81.8 6.7 Principal applicants 92.1 86.5 6.0 91.5 83.7 8.6 92.2 87.3 5.3 Secondary applicants 83.9 76.9 8.3 85.2 77.4 9.1 83.6 76.9 8.1 Immigrants sponsored by family 82.4 76.1 7.6 83.9 76.0 9.3 82.1 76.1 7.3 Refugees 77.2 70.0 9.2 83.9 76.8 8.7 75.8 68.7 9.3
Total - Age Total - Admission category 69.2 60.9 12.0 75.0 65.2 13.1 67.8 59.9 11.8 Economic immigrants 77.4 68.7 11.2 80.6 70.5 12.7 76.6 68.3 10.8 Principal applicants 90.0 83.2 7.5 89.6 80.7 10.1 90.1 84.0 6.8 Secondary applicants 66.1 55.7 15.7 69.4 57.7 16.8 65.4 55.3 15.5 Immigrants sponsored by family 63.6 56.8 10.6 71.4 62.8 11.9 62.0 55.5 10.4 Refugees 57.9 48.2 16.8 66.4 56.6 15.0 55.8 46.1 17.3
25 to 54 years Total - Admission category 79.5 71.1 10.6 82.3 72.1 12.5 78.7 70.8 10.0 Economic immigrants 85.7 77.5 9.6 86.4 76.0 11.7 85.5 77.9 8.9 Principal applicants 91.5 84.6 7.6 89.9 81.1 9.8 92.0 85.6 6.9 Secondary applicants 77.7 68.0 12.7 79.5 66.4 15.8 77.6 68.3 12.0 Immigrants sponsored by family 77.6 69.8 10.2 78.8 69.1 12.7 77.4 70.0 9.6 Refugees 65.4 55.5 15.3 75.5 65.1 14.2 62.9 53.0 15.6
Total - Age Total - Admission category 62.5 52.2 16.6 66.9 52.4 21.8 61.5 52.1 15.2 Economic immigrants 74.3 63.4 14.7 75.8 60.5 20.1 73.9 64.2 13.1 Principal applicants 87.9 78.4 10.8 83.8 70.1 16.3 89.2 81.1 9.1 Secondary applicants 58.8 46.3 21.4 64.8 47.2 27.2 57.3 45.9 19.9 Immigrants sponsored by family 57 47.7 16.2 63.2 50.3 20.4 55.8 47.2 15.3 Refugees 43.7 32.6 25.3 44.7 31.7 29.2 43.4 32.9 24.2
25 to 54 years Total - Admission category 73.7 62.9 14.6 75.6 60.9 19.6 73.0 63.4 13.2 Economic immigrants 81.2 70.4 13.4 80.7 65.9 18.1 81.4 71.7 11.9 Principal applicants 88.3 79.1 10.5 84.2 71.8 15.0 89.6 81.3 9.2 Secondary applicants 68.6 55.0 20.1 73.9 54.9 25.0 67.7 55.2 18.4 Immigrants sponsored by family 72.8 62.3 14.5 73.6 59.1 20.9 72.7 63.4 12.7 Refugees 50.8 39.8 21.6 55.0 43.2 23.0 50.1 39.1 21.6
Total - Age Total - Admission category 78.2 71.5 8.5 83.2 74.9 9.9 77.2 70.9 8.2 Economic immigrants 82 75.4 8.1 85.7 76.9 10.3 81.3 75.1 7.7 Principal applicants 86.7 81.6 5.9 90.5 81.9 9.5 85.9 81.6 5.1 Secondary applicants 76.1 67.4 11.4 78.1 68.9 11.8 75.7 67.1 11.3 Immigrants sponsored by family 76.3 70.6 7.5 83.5 76.5 8.2 75 69.4 7.4 Refugees 72.4 65 10.3 78.4 70.1 10.7 71.2 63.9 10.1
25 to 54 years Total - Admission category 90.5 84.1 7.0 92.3 84.4 8.6 90.1 84.1 6.7 Economic immigrants 93.2 87.2 6.4 93.5 85.6 8.6 93.1 87.6 5.9 Principal applicants 94.8 89.4 5.7 94.4 86.0 9.0 95.0 90.3 4.9 Secondary applicants 90.7 83.9 7.5 91.5 84.3 7.3 90.7 83.9 7.4 Immigrants sponsored by family 91.8 85.5 6.9 92.7 85.4 8.1 91.6 85.6 6.6 Refugees 83.4 76.2 8.7 89.6 81.8 8.7 82.1 74.9 8.7
Total - Age Total - Admission category 75.5 67.2 11.0 81.8 72.1 11.8 74.0 66.0 10.8 Economic immigrants 81.2 72.7 10.4 85.4 74.7 12.6 80.1 72.2 9.9 Principal applicants 92.0 85.3 7.3 92.7 82.5 10.8 91.9 86.1 6.2 Secondary applicants 67.8 57.1 15.7 72.0 59.9 16.8 66.9 56.6 15.4 Immigrants sponsored by family 73.1 66.6 8.9 82.9 76.2 7.8 71.0 64.4 9.2 Refugees 63.4 53.4 15.8 71.2 61.6 13.1 61.2 51.1 16.5
25 to 54 years Total - Admission category and applicant type88.7 80.7 9.1 90.3 80.3 11.3 88.2 80.8 8.5 Economic immigrants 92.4 84.6 8.4 91.5 80.9 11.4 92.5 85.6 7.5 Principal applicants 94.5 87.7 7.3 93.3 83.4 10.6 95.1 89.3 5.8 Secondary applicants 87.9 78.2 11.0 85.6 72.0 14.2 88.4 79.0 10.2 Immigrants sponsored by family 91.5 84.0 8.2 90.0 82.2 8.3 91.7 84.4 8.0 Refugees 73.9 63.6 13.6 85.5 73.8 14.3 71.1 61.5 13.4
Total - Age Total - Admission category 71 60.5 14.7 76.3 61.5 19.4 69.7 60.3 13.4 Economic immigrants 79.7 68.9 13.6 82.3 64.9 21.1 78.9 70.1 11 Principal applicants 91 80.9 11.2 90.3 73.4 18.7 91.2 83.3 8.5 Secondary applicants 63.7 51.8 18.6 67.8 49.6 26.8 62.2 52.3 15.9 Immigrants sponsored by family 70.1 61 13 78.9 69 12.5 68.1 59 13.4 Refugees 50.6 39.1 22.7 53.3 41.1 21.1 49.9 38.4 23.1
25 to 54 years Total - Admission category and applicant type84.6 74.4 12.2 86.8 72.6 16.6 83.9 74.9 10.9 Economic immigrants 89.4 79.0 11.5 87.6 72.6 17.6 89.9 81.1 9.6 Principal applicants 91.5 82.0 10.5 89.5 75.5 16.2 92.2 84.3 8.1 Secondary applicants 83.0 70.7 14.8 80.6 62.7 20.4 83.8 72.8 13.1 Immigrants sponsored by family 90.1 79.9 11.0 89.4 77.9 11.9 89.8 80.3 10.5 Refugees 60.3 49.4 18.1 74.5 60.0 19.5 58.3 48.1 16.9
Tota
l Sex
Men
Tota
l - P
erio
d of
imm
igra
tion
200
1 to
201
6 2
011
to 2
016
Tota
l - P
erio
d of
imm
igra
tion
200
1 to
201
6 2
011
to 2
016
Ottawa-Gatineau CMAOttawa-Gatineau CMA (Québec
Sector)Ottawa-Gatineau CMA (Ontario
Sector)
Table 10: Employment Characteristics of the Immigrants by Gender, Age and Period of Residence Attainment , Ottawa-Gatineau CMA and Component Sectors, 2016

49
Source: Admission Category and Applicant Type (7), Labour Force Status (8), Period of Immigration (7), Highest Certificate, Diploma or Degree (7), Location of Study (5), Age (13A) and Sex (3) for the Population Aged 15 Years and Over that Immigrated between 1980 and 2016, Living in Private Households of Canada, Provinces and Territories, Census Metropolitan Areas and Census Agglomerations, 2016 Census - 25% Sample Data. [2016 Census Data tables, 98-400-X2016204].
Participation rate
Employ- ment rate
Unemploy- ment rate
Participation
rate
Employ- ment
rateUnemploy- ment rate
Participation
rate
Employ- ment
rateUnemploy- ment rate
Total - Age Total - Admission category 67.1 60.8 9.4 71.7 64.1 10.6 66.3 60.2 9.1 Economic immigrants 74.2 67.5 9 76.2 68.4 10.3 73.9 67.4 8.8 Principal applicants 83 77.8 6.2 83.2 76.8 7.5 82.9 78 5.9 Secondary applicants 69.5 61.9 10.9 71.3 62.6 12.3 69.2 61.8 10.7 Immigrants sponsored by family 61.7 56.3 8.7 68 61 10.5 60.6 55.5 8.4 Refugees 62.1 55.5 10.7 69.2 61.7 10.6 60.8 54.3 10.7
25 to 54 years Total - Admission category 78.1 71.6 8.3 80.4 72.9 9.3 77.7 71.4 8.1 Economic immigrants 82.8 76.3 7.8 83.7 76.1 9.1 82.7 76.4 7.6 Principal applicants 88.0 82.4 6.4 86.8 80.1 8.0 88.3 82.9 6.1 Secondary applicants 79.4 72.4 8.8 80.9 72.7 10.3 79.2 72.4 8.6 Immigrants sponsored by family 76.4 70.1 8.2 77.5 69.5 10.7 76.1 70.2 7.8 Refugees 71.4 64.5 9.7 78.0 71.5 8.4 70.1 63.1 10.0
Total - Age Total - Admission category 63.8 55.4 13.1 68.8 58.8 14.5 62.7 54.7 12.7 Economic immigrants 73.6 64.6 12.1 75.4 66.0 12.5 73.1 64.3 11.9 Principal applicants 87.0 80.2 7.9 85.3 77.5 9.1 87.5 80.9 7.6 Secondary applicants 64.8 54.6 15.7 67.3 56.1 16.6 64.3 54.3 15.6 Immigrants sponsored by family 57.4 50.5 12.0 63.6 53.8 15.4 56.1 49.8 11.3 Refugees 53.3 43.8 17.8 61.7 51.1 17.2 51.3 42.1 18.1
25 to 54 years Total - Admission category 72.4 63.7 12.0 75.5 65.1 13.7 71.6 63.3 11.5 Economic immigrants 79.5 70.9 10.8 80.6 71.0 11.8 79.2 71.0 10.5 Principal applicants 87.4 80.2 8.2 85.0 77.6 8.8 88.4 81.1 8.1 Secondary applicants 71.9 61.9 13.8 76.0 63.2 15.8 70.9 61.6 13.3 Immigrants sponsored by family 69.6 61.4 11.7 71.9 60.5 15.5 69.2 61.8 10.9 Refugees 59.1 49.1 16.9 68.5 58.0 15.3 56.7 47.0 17.4
Total - Age Total - Admission category 55.2 44.9 18.5 58.1 43.7 24.7 54.5 45.2 17 Economic immigrants 69.1 57.9 16 68.6 56.1 18.3 69.1 58.5 15.3 Principal applicants 84 75.2 10.4 75.3 65.8 12.6 86.6 78.3 9.8 Secondary applicants 55.2 41.9 23.8 61.6 45.2 26.7 53.7 41.2 23.3 Immigrants sponsored by family 47.3 38.1 19.6 51.5 36.5 28.2 46.4 38.3 17.4 Refugees 37.8 27.1 28.2 35.5 19.4 45.5 38.2 28.3 26
25 to 54 years Total - Admission category 64.5 53.3 17.3 65.7 50.4 23.3 64.3 54.1 15.7 Economic immigrants 73.8 62.2 15.5 73.5 59.3 18.8 73.8 63.2 14.4 Principal applicants 84.2 75.1 10.7 76.7 67.3 13.9 86.5 77.8 10.3 Secondary applicants 60.7 46.1 24.0 68.6 49.2 27.2 58.1 45.1 22.8 Immigrants sponsored by family 60.2 49.2 18.0 61.3 43.0 29.9 60.0 51.1 15.1 Refugees 43.4 31.7 27.0 39.3 28.6 36.4 43.9 32.8 25.8
Tota
l - P
erio
d of
imm
igra
tion
200
1 to
201
6 2
011
to 2
016
Wom
en
Table 10 (cont'd): Employment Characteristics of the Immigrants by Gender, Age and Period of Residence Attainment , Ottawa-Gatineau CMA and Component Sectors, 2016Ottawa-Gatineau CMA Ottawa-Gatineau CMA (Québec Ottawa-Gatineau CMA (Ontario

50
Total Popul-ation
Non-immigrants Immigrants
2001 to 2014
2011 to 2014
Total Popul-ation
Non-immigrants Immigrants
2001 to 2014
2011 to 2014
Total Popul-ation
Non-immigrants Immigrants
2001 to 2014
2011 to 2014
Total Industry 711,740 556,900 147,815 53,685 12,695 177,935 154,565 22,460 11,035 2,740 533,800 402,330 125,360 42,645 9,955 11 Agriculture, forestry, fishing and hunting 0.5% 0.6% 0.3% 0.3% 0.4% 0.6% 0.6% 0.4% 0.4% 0.4% 0.5% 0.6% 0.3% 0.3% 0.4% 21 Mining, quarrying, and oil and gas extraction 0.1% 0.1% 0.1% 0.1% 0.2% 0.2% 0.2% 0.0% 0.0% 0.0% 0.1% 0.1% 0.1% 0.1% 0.2% 22 Utilities 0.3% 0.4% 0.2% 0.2% 0.2% 0.5% 0.6% 0.2% 0.2% 0.0% 0.3% 0.3% 0.2% 0.2% 0.3% 23 Construction 5.5% 6.1% 3.5% 3.3% 3.6% 7.6% 8.1% 4.4% 4.3% 5.1% 4.8% 5.3% 3.3% 3.0% 3.2% 31-33 Manufacturing 3.2% 3.0% 3.8% 3.2% 4.2% 3.2% 3.3% 2.5% 2.5% 3.8% 3.2% 2.9% 4.0% 3.4% 4.3% 41 Wholesale trade 2.2% 2.2% 2.3% 2.2% 2.6% 1.6% 1.6% 1.5% 1.5% 2.2% 2.4% 2.4% 2.4% 2.4% 2.7% 44-45 Retail trade 10.7% 11.1% 9.1% 11.1% 12.8% 11.1% 11.4% 8.8% 9.4% 13.3% 10.6% 11.0% 9.2% 11.5% 12.7% 48-49 Transportation and warehousing 3.0% 2.8% 3.7% 2.9% 2.3% 3.0% 2.9% 3.7% 2.9% 2.7% 3.0% 2.8% 3.7% 2.9% 2.2% 51 Information and cultural industries 2.5% 2.5% 2.5% 2.3% 2.2% 1.9% 2.0% 1.6% 1.5% 1.1% 2.7% 2.7% 2.6% 2.5% 2.5% 52 Finance and insurance 3.1% 3.0% 3.4% 3.8% 3.7% 2.4% 2.3% 3.6% 4.3% 4.4% 3.3% 3.3% 3.3% 3.6% 3.6% 53 Real estate and rental and leasing 1.6% 1.6% 1.4% 1.2% 0.8% 1.2% 1.3% 1.1% 1.1% 1.1% 1.7% 1.8% 1.5% 1.2% 0.8% 54 Professional, scientific and technical services 8.5% 7.9% 10.4% 10.1% 10.6% 4.7% 4.5% 5.8% 5.8% 6.9% 9.7% 9.2% 11.2% 11.2% 11.5% 55 Management of companies and enterprises 0.1% 0.1% 0.0% 0.0% 0.0% 0.0% 0.0% 0.0% 0.0% 0.0% 0.1% 0.1% 0.0% 0.0% 0.1% 56 Administrative and support, waste management and remediation services 4.4% 4.2% 5.2% 6.2% 7.6% 4.8% 4.5% 6.4% 6.6% 7.3% 4.3% 4.0% 5.0% 6.1% 7.7% 61 Educational services 8.4% 8.4% 8.1% 9.9% 9.9% 8.3% 8.2% 8.7% 10.6% 10.2% 8.4% 8.5% 8.0% 9.7% 9.8% 62 Health care and social assistance 11.1% 10.3% 13.9% 15.5% 15.6% 11.4% 10.8% 15.1% 17.8% 16.4% 10.9% 10.1% 13.7% 14.9% 15.4% 71 Arts, entertainment and recreation 2.1% 2.4% 1.2% 1.2% 1.1% 2.5% 2.6% 1.6% 1.4% 1.5% 2.0% 2.3% 1.1% 1.1% 1.0% 72 Accommodation and food services 6.6% 6.1% 8.0% 9.8% 12.7% 6.6% 6.2% 9.0% 9.1% 11.7% 6.5% 6.0% 7.8% 9.9% 13.0% 81 Other services (except public administration) 4.1% 3.9% 4.7% 4.4% 4.3% 4.1% 4.0% 4.7% 4.1% 3.8% 4.1% 3.8% 4.7% 4.5% 4.4% 91 Public administration 22.1% 23.4% 18.3% 12.4% 5.2% 24.3% 24.9% 21.0% 16.8% 8.0% 21.4% 22.8% 17.8% 11.3% 4.4% 911 Federal government public administration 18.7% 19.7% 15.8% 9.9% 3.3% 20.6% 21.1% 17.9% 13.3% 4.7% 18.1% 19.1% 15.5% 9.1% 3.0%Total Industry 463,580 355,700 103,005 42,825 10,600 118,515 100,745 17,155 9,430 2,485 345,070 254,950 85,850 33,395 8,115 11 Agriculture, forestry, fishing and hunting 0.4% 0.4% 0.3% 0.3% 0.4% 0.5% 0.5% 0.4% 0.5% 0.4% 0.3% 0.4% 0.3% 0.3% 0.4% 21 Mining, quarrying, and oil and gas extraction 0.1% 0.1% 0.1% 0.1% 0.2% 0.2% 0.2% 0.0% 0.0% 0.0% 0.1% 0.1% 0.1% 0.1% 0.2% 22 Utilities 0.4% 0.4% 0.2% 0.2% 0.3% 0.6% 0.7% 0.2% 0.2% 0.0% 0.3% 0.3% 0.2% 0.2% 0.3% 23 Construction 5.8% 6.5% 3.4% 3.4% 3.9% 8.2% 8.8% 4.5% 4.3% 5.6% 5.0% 5.6% 3.2% 3.2% 3.3% 31-33 Manufacturing 3.3% 3.1% 3.9% 3.6% 4.5% 3.2% 3.3% 2.7% 2.7% 4.2% 3.4% 3.1% 4.2% 3.8% 4.6% 41 Wholesale trade 2.4% 2.4% 2.5% 2.4% 2.7% 1.6% 1.6% 1.5% 1.6% 2.2% 2.7% 2.7% 2.7% 2.6% 2.8% 44-45 Retail trade 7.8% 7.8% 7.8% 8.9% 11.6% 7.9% 7.9% 7.5% 7.9% 13.3% 7.8% 7.8% 7.8% 9.2% 11.2% 48-49 Transportation and warehousing 3.0% 2.8% 3.6% 3.0% 2.5% 3.0% 2.9% 3.6% 3.0% 3.0% 2.9% 2.7% 3.6% 3.0% 2.4% 51 Information and cultural industries 2.7% 2.7% 2.7% 2.4% 2.3% 2.1% 2.1% 1.7% 1.6% 1.0% 3.0% 2.9% 2.9% 2.6% 2.6% 52 Finance and insurance 3.4% 3.3% 3.8% 4.2% 4.1% 2.6% 2.4% 3.9% 4.6% 4.6% 3.7% 3.7% 3.8% 4.1% 3.9% 53 Real estate and rental and leasing 1.4% 1.5% 1.3% 1.2% 0.8% 1.1% 1.1% 1.1% 1.2% 1.0% 1.5% 1.6% 1.3% 1.2% 0.8% 54 Professional, scientific and technical services 8.9% 8.2% 10.9% 11.3% 11.7% 4.8% 4.6% 5.9% 6.3% 7.4% 10.3% 9.7% 11.9% 12.8% 12.9% 55 Management of companies and enterprises 0.1% 0.1% 0.1% 0.0% 0.1% 0.0% 0.0% 0.0% 0.0% 0.0% 0.1% 0.1% 0.1% 0.0% 0.0% 56 Administrative and support, waste management and remediation services 4.1% 3.9% 4.9% 5.8% 6.9% 4.4% 4.1% 6.1% 6.4% 6.2% 4.0% 3.8% 4.6% 5.7% 7.2% 61 Educational services 8.7% 8.9% 7.8% 9.9% 10.4% 8.9% 8.9% 9.0% 11.1% 10.7% 8.6% 8.9% 7.6% 9.6% 10.3% 62 Health care and social assistance 11.9% 11.2% 14.5% 16.6% 16.2% 12.4% 11.8% 16.2% 18.5% 16.7% 11.8% 11.0% 14.2% 16.0% 16.1% 71 Arts, entertainment and recreation 1.5% 1.7% 0.9% 0.9% 1.0% 1.9% 2.1% 1.1% 1.0% 1.4% 1.4% 1.6% 0.8% 0.8% 0.9% 72 Accommodation and food services 4.5% 3.7% 7.0% 7.7% 10.4% 4.3% 3.7% 7.3% 6.9% 10.3% 4.6% 3.7% 6.9% 7.9% 10.4% 81 Other services (except public administration) 4.0% 3.8% 4.6% 4.5% 4.3% 3.9% 3.8% 4.5% 4.1% 3.6% 4.0% 3.8% 4.6% 4.6% 4.5% 91 Public administration 25.5% 27.4% 19.8% 13.6% 5.7% 28.4% 29.5% 22.8% 18.2% 8.2% 24.5% 26.5% 19.3% 12.2% 4.9% 911 Federal government public administration 21.9% 23.5% 17.3% 10.9% 3.7% 24.4% 25.4% 19.6% 14.6% 5.0% 21.1% 22.8% 16.9% 9.9% 3.5%Total Industry 358,525 280,310 74,415 26,860 6,675 89,785 77,480 11,820 5,780 1,525 268,740 202,835 62,595 21,075 5,145 11 Agriculture, forestry, fishing and hunting 0.7% 0.8% 0.4% 0.4% 0.4% 0.9% 0.9% 0.5% 0.5% 0.7% 0.6% 0.7% 0.4% 0.4% 0.4% 21 Mining, quarrying, and oil and gas extraction 0.2% 0.2% 0.1% 0.2% 0.3% 0.3% 0.3% 0.0% 0.0% 0.0% 0.2% 0.2% 0.2% 0.2% 0.3% 22 Utilities 0.5% 0.6% 0.2% 0.2% 0.3% 0.8% 0.9% 0.3% 0.3% 0.7% 0.4% 0.5% 0.2% 0.3% 0.3% 23 Construction 9.7% 10.7% 6.0% 5.6% 6.2% 13.8% 14.8% 7.8% 7.6% 9.2% 8.3% 9.2% 5.7% 5.0% 5.3% 31-33 Manufacturing 4.6% 4.5% 5.0% 4.5% 5.7% 5.1% 5.4% 3.6% 3.5% 5.6% 4.5% 4.2% 5.2% 4.8% 5.9% 41 Wholesale trade 3.2% 3.2% 3.2% 3.2% 3.9% 2.5% 2.5% 2.4% 2.4% 3.3% 3.5% 3.5% 3.3% 3.4% 4.0% 44-45 Retail trade 10.8% 11.3% 8.7% 10.5% 12.7% 11.2% 11.7% 8.1% 8.3% 10.8% 10.6% 11.1% 8.9% 11.1% 13.2% 48-49 Transportation and warehousing 4.4% 4.0% 6.0% 4.7% 3.8% 4.6% 4.5% 6.0% 4.7% 4.6% 4.3% 3.9% 6.0% 4.7% 3.7% 51 Information and cultural industries 3.0% 2.9% 3.3% 3.1% 2.9% 2.2% 2.2% 2.3% 2.1% 1.6% 3.3% 3.2% 3.5% 3.4% 3.3% 52 Finance and insurance 2.7% 2.6% 3.1% 3.7% 3.2% 2.0% 1.7% 3.6% 4.4% 3.9% 2.9% 2.9% 3.0% 3.6% 3.1% 53 Real estate and rental and leasing 1.8% 1.8% 1.6% 1.5% 1.2% 1.6% 1.6% 1.4% 1.5% 0.7% 1.8% 1.9% 1.7% 1.5% 1.3% 54 Professional, scientific and technical services 10.0% 9.1% 13.0% 12.7% 13.0% 5.2% 4.9% 7.2% 7.6% 9.5% 11.6% 10.7% 14.2% 14.1% 14.0% 55 Management of companies and enterprises 0.0% 0.0% 0.0% 0.0% 0.0% 0.0% 0.0% 0.0% 0.0% 0.0% 0.1% 0.1% 0.0% 0.0% 0.0% 56 Administrative and support, waste management and remediation services 5.4% 5.3% 5.7% 7.2% 8.8% 6.2% 6.0% 7.6% 8.2% 9.2% 5.1% 5.0% 5.3% 6.9% 8.7% 61 Educational services 5.5% 5.2% 6.4% 8.4% 8.4% 5.3% 4.9% 7.5% 8.8% 7.2% 5.6% 5.3% 6.2% 8.2% 8.6% 62 Health care and social assistance 4.5% 4.0% 6.1% 7.1% 7.3% 4.4% 4.0% 7.0% 8.4% 8.2% 4.5% 4.1% 5.9% 6.7% 6.9% 71 Arts, entertainment and recreation 2.1% 2.4% 1.2% 1.2% 1.1% 2.5% 2.6% 1.6% 1.5% 2.0% 2.0% 2.3% 1.1% 1.2% 0.9% 72 Accommodation and food services 6.3% 5.6% 8.3% 9.9% 13.0% 6.0% 5.4% 9.4% 9.5% 13.4% 6.3% 5.7% 8.1% 10.0% 12.8% 81 Other services (except public administration) 3.3% 3.2% 3.6% 3.2% 2.8% 3.4% 3.3% 3.6% 3.4% 3.3% 3.3% 3.1% 3.6% 3.1% 2.6% 91 Public administration 21.4% 22.5% 18.1% 12.7% 5.1% 22.0% 22.4% 20.1% 17.2% 7.2% 21.2% 22.5% 17.7% 11.4% 4.5% 911 Federal government public administration 17.5% 18.3% 15.4% 10.1% 3.5% 17.6% 17.8% 17.0% 13.5% 5.2% 17.5% 18.5% 15.1% 9.2% 3.0%Total Industry 230,790 177,435 50,695 21,170 5,570 58,990 49,725 8,930 4,960 1,375 171,800 127,710 41,770 16,220 4,200 11 Agriculture, forestry, fishing and hunting 0.5% 0.5% 0.3% 0.4% 0.4% 0.7% 0.8% 0.4% 0.6% 0.7% 0.4% 0.4% 0.3% 0.4% 0.4% 21 Mining, quarrying, and oil and gas extraction 0.2% 0.2% 0.1% 0.1% 0.3% 0.3% 0.4% 0.0% 0.0% 0.0% 0.2% 0.2% 0.2% 0.2% 0.4% 22 Utilities 0.6% 0.7% 0.3% 0.3% 0.4% 1.0% 1.1% 0.3% 0.4% 0.7% 0.4% 0.5% 0.2% 0.3% 0.5% 23 Construction 10.3% 11.6% 5.9% 5.8% 6.6% 15.0% 16.3% 7.9% 7.9% 9.8% 8.6% 9.7% 5.4% 5.2% 5.6% 31-33 Manufacturing 4.9% 4.8% 5.3% 5.0% 6.3% 5.4% 5.7% 3.9% 3.6% 5.8% 4.8% 4.5% 5.6% 5.4% 6.4% 41 Wholesale trade 3.5% 3.5% 3.5% 3.5% 4.1% 2.5% 2.5% 2.3% 2.6% 3.6% 3.9% 3.9% 3.8% 3.7% 4.2% 44-45 Retail trade 8.3% 8.5% 7.6% 8.5% 10.9% 8.4% 8.7% 7.3% 7.0% 10.9% 8.3% 8.4% 7.7% 8.9% 11.0% 48-49 Transportation and warehousing 4.3% 3.9% 5.8% 4.9% 4.2% 4.7% 4.5% 5.8% 4.8% 5.1% 4.2% 3.7% 5.9% 4.9% 4.0% 51 Information and cultural industries 3.4% 3.3% 3.8% 3.3% 2.9% 2.4% 2.4% 2.3% 2.2% 1.5% 3.8% 3.6% 4.1% 3.6% 3.3% 52 Finance and insurance 3.1% 3.0% 3.5% 4.2% 3.6% 2.1% 1.8% 4.0% 4.6% 4.0% 3.4% 3.4% 3.4% 4.0% 3.3% 53 Real estate and rental and leasing 1.6% 1.6% 1.5% 1.5% 1.1% 1.4% 1.4% 1.4% 1.8% 1.1% 1.7% 1.7% 1.5% 1.4% 1.2% 54 Professional, scientific and technical services 10.6% 9.5% 13.8% 14.5% 14.6% 5.4% 5.0% 7.5% 8.2% 9.8% 12.3% 11.3% 15.1% 16.4% 16.2% 55 Management of companies and enterprises 0.0% 0.1% 0.0% 0.0% 0.0% 0.0% 0.0% 0.0% 0.0% 0.0% 0.1% 0.1% 0.0% 0.1% 0.0% 56 Administrative and support, waste management and remediation services 5.0% 4.9% 5.3% 6.6% 8.1% 5.8% 5.5% 7.0% 7.8% 7.3% 4.7% 4.6% 4.9% 6.2% 8.5% 61 Educational services 5.4% 5.1% 5.9% 8.2% 8.6% 5.4% 4.9% 7.6% 9.0% 7.6% 5.4% 5.2% 5.5% 7.9% 8.9% 62 Health care and social assistance 4.6% 4.2% 6.1% 7.5% 7.3% 4.5% 4.0% 7.1% 8.6% 8.0% 4.6% 4.2% 5.9% 7.2% 7.0% 71 Arts, entertainment and recreation 1.5% 1.6% 0.8% 0.8% 1.1% 1.9% 2.1% 1.2% 1.0% 2.2% 1.3% 1.5% 0.8% 0.7% 0.8% 72 Accommodation and food services 4.6% 3.8% 7.5% 8.0% 10.9% 4.1% 3.3% 8.2% 7.8% 12.0% 4.8% 3.9% 7.3% 8.2% 10.6% 81 Other services (except public administration) 3.1% 3.0% 3.3% 2.9% 3.1% 3.1% 3.0% 3.5% 3.2% 3.6% 3.1% 3.0% 3.3% 2.9% 3.0% 91 Public administration 24.6% 26.3% 19.5% 14.0% 5.6% 25.8% 26.6% 22.0% 19.1% 7.3% 24.2% 26.2% 19.0% 12.5% 5.0% 911 Federal government public administration 20.4% 21.8% 16.6% 11.3% 3.9% 21.1% 21.6% 18.7% 15.1% 5.5% 20.2% 21.9% 16.1% 10.1% 3.5%
Ottawa-Gatineau CMA (Québec Sector) Ottawa-Gatineau CMA (Ontario Sector)
Table 11: Industrial Sector of Employment by Gender, Age and Period of Residence Attainment, Ottawa-Gatineau CMA, 2016
Tota
l - S
exM
en
Tota
l - A
geOttawa-Gatineau CMA
25
to 5
4 ye
ars
Tota
l - A
ge 2
5 to
54
year
s

51
Source: Statistics Canada 2016. Industry - North American Industry Classification System (NAICS) 2012 (425), Employment Income Statistics (3), Highest Certificate, Diploma or Degree (7), Immigrant Status and Period of Immigration (10), Work Activity During the Reference Year (4), Age (5A) and Sex (3) for the Population Aged 15 Years and Over Who Worked in 2015 and Reported Employment Income in 2015, in Private Households. [2016 Census Table 98-400-X2016358].
Total Popul-ation
Non-immigrants Immigrants
2001 to 2014
2011 to 2014
Total Popul-ation
Non-immigrants Immigrants
2001 to 2014
2011 to 2014
Total Popul-ation
Non-immigrants Immigrants
2001 to 2014
2011 to 2014
Total Industry 353,210 276,585 73,405 26,825 6,025 88,150 77,090 10,640 5,260 1,215 265,055 199,495 62,765 21,565 4,805 11 Agriculture, forestry, fishing and hunting 0.4% 0.4% 0.3% 0.2% 0.2% 0.3% 0.3% 0.3% 0.3% 0.0% 0.4% 0.4% 0.3% 0.2% 0.3% 21 Mining, quarrying, and oil and gas extraction 0.0% 0.0% 0.0% 0.0% 0.0% 0.0% 0.0% 0.0% 0.0% 0.0% 0.0% 0.0% 0.0% 0.0% 0.0% 22 Utilities 0.2% 0.2% 0.1% 0.1% 0.2% 0.2% 0.2% 0.1% 0.0% 0.0% 0.1% 0.1% 0.1% 0.1% 0.2% 23 Construction 1.3% 1.4% 0.9% 0.9% 0.7% 1.3% 1.4% 0.7% 0.7% 0.8% 1.3% 1.4% 1.0% 1.0% 0.7% 31-33 Manufacturing 1.7% 1.5% 2.5% 2.0% 2.5% 1.2% 1.2% 1.3% 1.2% 1.6% 1.9% 1.6% 2.7% 2.2% 2.7% 41 Wholesale trade 1.2% 1.1% 1.3% 1.2% 1.2% 0.7% 0.8% 0.6% 0.6% 0.8% 1.3% 1.3% 1.5% 1.4% 1.2% 44-45 Retail trade 10.7% 10.9% 9.5% 11.6% 12.9% 11.0% 11.1% 9.5% 10.6% 16.5% 10.6% 10.9% 9.5% 11.9% 12.2% 48-49 Transportation and warehousing 1.5% 1.5% 1.4% 1.0% 0.5% 1.3% 1.3% 1.1% 0.8% 0.0% 1.6% 1.6% 1.4% 1.1% 0.5% 51 Information and cultural industries 2.0% 2.1% 1.6% 1.4% 1.5% 1.7% 1.8% 0.9% 1.0% 0.8% 2.1% 2.2% 1.7% 1.6% 1.8% 52 Finance and insurance 3.4% 3.4% 3.7% 3.8% 4.4% 2.9% 2.8% 3.5% 4.2% 5.3% 3.6% 3.6% 3.7% 3.7% 4.1% 53 Real estate and rental and leasing 1.4% 1.5% 1.3% 0.9% 0.5% 0.9% 0.9% 0.8% 0.7% 1.6% 1.6% 1.7% 1.3% 0.9% 0.3% 54 Professional, scientific and technical services 6.9% 6.7% 7.7% 7.5% 7.9% 4.1% 4.1% 4.1% 3.6% 4.1% 7.9% 7.7% 8.3% 8.4% 8.8% 55 Management of companies and enterprises 0.1% 0.1% 0.1% 0.0% 0.0% 0.0% 0.0% 0.0% 0.0% 0.0% 0.1% 0.1% 0.1% 0.0% 0.2% 56 Administrative and support, waste management and remediation services 3.4% 3.0% 4.7% 5.3% 6.2% 3.3% 3.0% 5.0% 4.8% 4.9% 3.4% 3.0% 4.6% 5.4% 6.6% 61 Educational services 11.3% 11.7% 9.9% 11.5% 11.6% 11.4% 11.5% 10.1% 12.5% 14.0% 11.3% 11.7% 9.8% 11.2% 11.1% 62 Health care and social assistance 17.7% 16.7% 21.9% 23.9% 24.9% 18.5% 17.7% 24.2% 27.9% 26.3% 17.5% 16.3% 21.5% 22.9% 24.5% 71 Arts, entertainment and recreation 2.1% 2.4% 1.2% 1.2% 1.1% 2.4% 2.6% 1.5% 1.4% 0.8% 2.0% 2.4% 1.1% 1.1% 1.0% 72 Accommodation and food services 6.9% 6.5% 7.6% 9.6% 12.4% 7.2% 7.0% 8.6% 8.5% 9.5% 6.8% 6.4% 7.5% 9.9% 13.2% 81 Other services (except public administration) 4.9% 4.5% 5.8% 5.7% 5.9% 4.8% 4.6% 5.8% 5.0% 4.5% 4.9% 4.5% 5.8% 5.8% 6.2% 91 Public administration 22.9% 24.2% 18.5% 12.1% 5.3% 26.7% 27.4% 21.9% 16.3% 9.1% 21.6% 23.0% 17.9% 11.1% 4.3% 911 Federal government public administration 19.9% 21.0% 16.3% 9.7% 3.2% 23.6% 24.4% 18.9% 12.9% 4.1% 18.7% 19.8% 15.9% 9.0% 2.9%Total Industry 232,795 178,270 52,310 21,650 5,030 59,525 51,020 8,225 4,475 1,110 173,270 127,245 44,080 17,185 3,920 11 Agriculture, forestry, fishing and hunting 0.3% 0.3% 0.2% 0.3% 0.4% 0.3% 0.2% 0.4% 0.3% 0.0% 0.3% 0.3% 0.2% 0.2% 0.4% 21 Mining, quarrying, and oil and gas extraction 0.0% 0.0% 0.0% 0.0% 0.0% 0.0% 0.0% 0.0% 0.0% 0.0% 0.0% 0.0% 0.0% 0.0% 0.0% 22 Utilities 0.2% 0.2% 0.1% 0.1% 0.0% 0.2% 0.3% 0.1% 0.0% 0.0% 0.2% 0.2% 0.1% 0.1% 0.0% 23 Construction 1.4% 1.5% 1.0% 1.1% 0.7% 1.4% 1.6% 0.8% 0.6% 0.0% 1.3% 1.5% 1.0% 1.2% 0.9% 31-33 Manufacturing 1.7% 1.5% 2.6% 2.2% 2.6% 1.1% 1.0% 1.3% 1.5% 1.8% 2.0% 1.7% 2.8% 2.4% 2.7% 41 Wholesale trade 1.3% 1.3% 1.5% 1.3% 1.3% 0.7% 0.8% 0.6% 0.7% 0.9% 1.5% 1.5% 1.6% 1.5% 1.4% 44-45 Retail trade 7.4% 7.2% 7.9% 9.4% 12.4% 7.3% 7.1% 7.8% 8.7% 16.2% 7.4% 7.2% 8.0% 9.5% 11.2% 48-49 Transportation and warehousing 1.6% 1.6% 1.5% 1.2% 0.6% 1.4% 1.4% 1.2% 0.9% 0.9% 1.7% 1.7% 1.5% 1.3% 0.6% 51 Information and cultural industries 2.0% 2.1% 1.7% 1.5% 1.6% 1.7% 1.9% 1.0% 0.9% 0.0% 2.1% 2.2% 1.8% 1.6% 1.9% 52 Finance and insurance 3.8% 3.7% 4.1% 4.2% 4.7% 3.0% 2.9% 3.8% 4.2% 5.0% 4.1% 4.1% 4.2% 4.2% 4.6% 53 Real estate and rental and leasing 1.3% 1.4% 1.0% 0.9% 0.5% 0.8% 0.9% 0.7% 0.7% 1.4% 1.4% 1.6% 1.1% 0.9% 0.4% 54 Professional, scientific and technical services 7.2% 7.0% 8.1% 8.3% 8.4% 4.2% 4.1% 4.3% 4.1% 4.5% 8.3% 8.1% 8.8% 9.4% 9.4% 55 Management of companies and enterprises 0.1% 0.1% 0.1% 0.0% 0.2% 0.0% 0.0% 0.0% 0.0% 0.0% 0.1% 0.1% 0.1% 0.1% 0.3% 56 Administrative and support, waste management and remediation services 3.3% 2.9% 4.5% 5.1% 5.7% 3.1% 2.8% 5.0% 4.8% 4.5% 3.3% 2.9% 4.4% 5.2% 6.0% 61 Educational services 12.0% 12.6% 9.8% 11.7% 12.4% 12.4% 12.7% 10.6% 13.3% 14.4% 11.8% 12.6% 9.6% 11.2% 11.7% 62 Health care and social assistance 19.2% 18.3% 22.6% 25.4% 26.1% 20.3% 19.3% 25.9% 29.3% 27.0% 18.9% 17.8% 22.0% 24.4% 25.9% 71 Arts, entertainment and recreation 1.6% 1.8% 1.0% 0.9% 0.9% 1.9% 2.0% 1.1% 1.1% 0.9% 1.5% 1.7% 0.9% 0.9% 1.0% 72 Accommodation and food services 4.4% 3.7% 6.5% 7.3% 9.8% 4.5% 4.1% 6.2% 5.9% 8.1% 4.4% 3.5% 6.5% 7.7% 10.3% 81 Other services (except public administration) 4.9% 4.5% 5.8% 6.0% 5.7% 4.7% 4.6% 5.5% 5.1% 4.1% 4.9% 4.5% 5.8% 6.2% 6.3% 91 Public administration 26.3% 28.4% 20.2% 13.2% 6.0% 30.9% 32.2% 23.6% 17.4% 9.5% 24.7% 26.9% 19.5% 12.0% 5.0% 911 Federal government public administration 23.4% 25.2% 18.0% 10.6% 3.6% 27.8% 29.1% 20.6% 13.9% 4.5% 21.9% 23.6% 17.5% 9.8% 3.4%
Wom
en
Table 11 (cont'd): Industrial Sector of Employment by Gender, Age and Period of Residence Attainment, Ottawa-Gatineau CMA, 2016Ottawa-Gatineau CMA Ottawa-Gatineau CMA (Québec Sector) Ottawa-Gatineau CMA (Ontario Sector)
Tota
l - A
ge 2
5 to
54
year
s
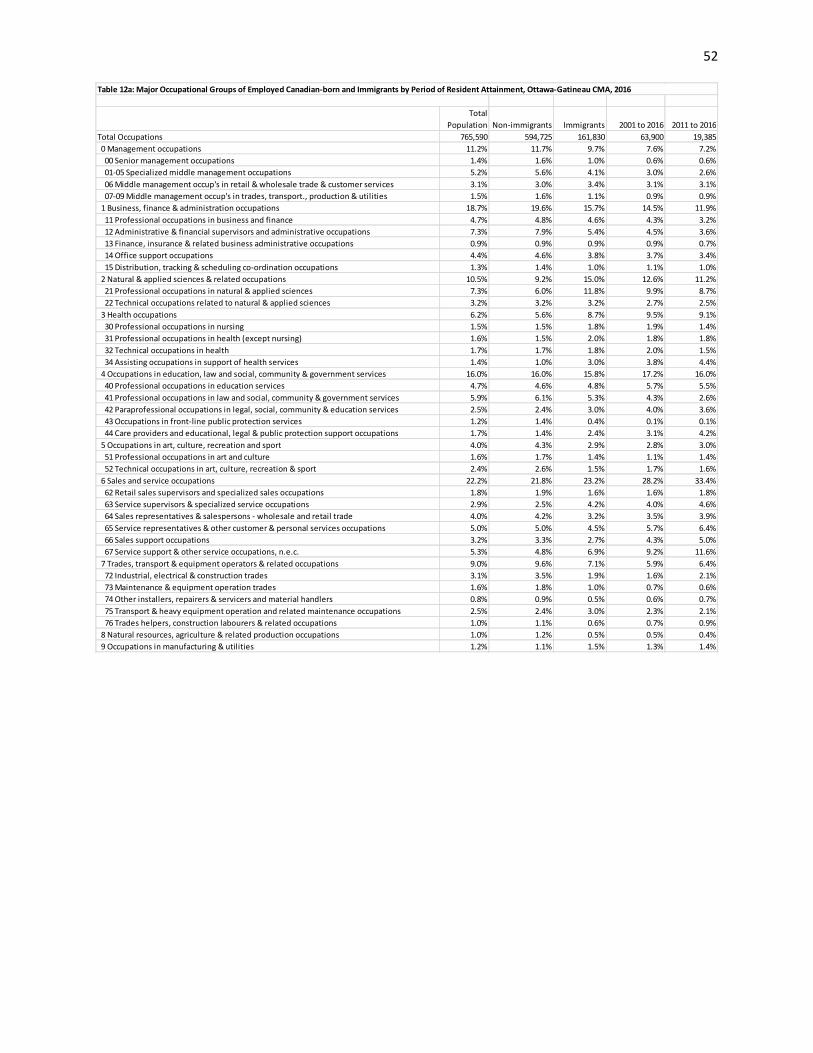
52
Total Population Non-immigrants Immigrants 2001 to 2016 2011 to 2016
Total Occupations 765,590 594,725 161,830 63,900 19,385 0 Management occupations 11.2% 11.7% 9.7% 7.6% 7.2% 00 Senior management occupations 1.4% 1.6% 1.0% 0.6% 0.6% 01-05 Specialized middle management occupations 5.2% 5.6% 4.1% 3.0% 2.6% 06 Middle management occup's in retail & wholesale trade & customer services 3.1% 3.0% 3.4% 3.1% 3.1% 07-09 Middle management occup's in trades, transport., production & utilities 1.5% 1.6% 1.1% 0.9% 0.9% 1 Business, finance & administration occupations 18.7% 19.6% 15.7% 14.5% 11.9% 11 Professional occupations in business and finance 4.7% 4.8% 4.6% 4.3% 3.2% 12 Administrative & financial supervisors and administrative occupations 7.3% 7.9% 5.4% 4.5% 3.6% 13 Finance, insurance & related business administrative occupations 0.9% 0.9% 0.9% 0.9% 0.7% 14 Office support occupations 4.4% 4.6% 3.8% 3.7% 3.4% 15 Distribution, tracking & scheduling co-ordination occupations 1.3% 1.4% 1.0% 1.1% 1.0% 2 Natural & applied sciences & related occupations 10.5% 9.2% 15.0% 12.6% 11.2% 21 Professional occupations in natural & applied sciences 7.3% 6.0% 11.8% 9.9% 8.7% 22 Technical occupations related to natural & applied sciences 3.2% 3.2% 3.2% 2.7% 2.5% 3 Health occupations 6.2% 5.6% 8.7% 9.5% 9.1% 30 Professional occupations in nursing 1.5% 1.5% 1.8% 1.9% 1.4% 31 Professional occupations in health (except nursing) 1.6% 1.5% 2.0% 1.8% 1.8% 32 Technical occupations in health 1.7% 1.7% 1.8% 2.0% 1.5% 34 Assisting occupations in support of health services 1.4% 1.0% 3.0% 3.8% 4.4% 4 Occupations in education, law and social, community & government services 16.0% 16.0% 15.8% 17.2% 16.0% 40 Professional occupations in education services 4.7% 4.6% 4.8% 5.7% 5.5% 41 Professional occupations in law and social, community & government services 5.9% 6.1% 5.3% 4.3% 2.6% 42 Paraprofessional occupations in legal, social, community & education services 2.5% 2.4% 3.0% 4.0% 3.6% 43 Occupations in front-line public protection services 1.2% 1.4% 0.4% 0.1% 0.1% 44 Care providers and educational, legal & public protection support occupations 1.7% 1.4% 2.4% 3.1% 4.2% 5 Occupations in art, culture, recreation and sport 4.0% 4.3% 2.9% 2.8% 3.0% 51 Professional occupations in art and culture 1.6% 1.7% 1.4% 1.1% 1.4% 52 Technical occupations in art, culture, recreation & sport 2.4% 2.6% 1.5% 1.7% 1.6% 6 Sales and service occupations 22.2% 21.8% 23.2% 28.2% 33.4% 62 Retail sales supervisors and specialized sales occupations 1.8% 1.9% 1.6% 1.6% 1.8% 63 Service supervisors & specialized service occupations 2.9% 2.5% 4.2% 4.0% 4.6% 64 Sales representatives & salespersons - wholesale and retail trade 4.0% 4.2% 3.2% 3.5% 3.9% 65 Service representatives & other customer & personal services occupations 5.0% 5.0% 4.5% 5.7% 6.4% 66 Sales support occupations 3.2% 3.3% 2.7% 4.3% 5.0% 67 Service support & other service occupations, n.e.c. 5.3% 4.8% 6.9% 9.2% 11.6% 7 Trades, transport & equipment operators & related occupations 9.0% 9.6% 7.1% 5.9% 6.4% 72 Industrial, electrical & construction trades 3.1% 3.5% 1.9% 1.6% 2.1% 73 Maintenance & equipment operation trades 1.6% 1.8% 1.0% 0.7% 0.6% 74 Other installers, repairers & servicers and material handlers 0.8% 0.9% 0.5% 0.6% 0.7% 75 Transport & heavy equipment operation and related maintenance occupations 2.5% 2.4% 3.0% 2.3% 2.1% 76 Trades helpers, construction labourers & related occupations 1.0% 1.1% 0.6% 0.7% 0.9% 8 Natural resources, agriculture & related production occupations 1.0% 1.2% 0.5% 0.5% 0.4% 9 Occupations in manufacturing & utilities 1.2% 1.1% 1.5% 1.3% 1.4%
Table 12a: Major Occupational Groups of Employed Canadian-born and Immigrants by Period of Resident Attainment, Ottawa-Gatineau CMA, 2016

53
Total Population Non-immigrants Immigrants 2001 to 2016 2011 to 2016
Total Occupations 190,560 164,710 24,680 12,920 4,015 0 Management occupations 10.0% 10.1% 9.1% 7.7% 7.5% 00 Senior management occupations 1.3% 1.4% 0.7% 0.5% 0.5% 01-05 Specialized middle management occupations 4.3% 4.5% 3.3% 2.9% 2.4% 06 Middle management occupations in retail and wholesale trade and customer services 2.9% 2.7% 4.0% 3.4% 3.7% 07-09 Middle management occupations in trades, transportation, production and utilities 1.5% 1.5% 1.1% 1.0% 1.0% 1 Business, finance and administration occupations 20.0% 20.3% 18.2% 18.0% 15.6% 11 Professional occupations in business and finance 4.6% 4.5% 5.1% 4.8% 3.1% 12 Administrative and financial supervisors and administrative occupations 8.6% 8.9% 6.9% 6.5% 5.7% 13 Finance, insurance and related business administrative occupations 0.9% 0.8% 1.1% 1.4% 0.7% 14 Office support occupations 4.5% 4.6% 4.0% 4.2% 4.5% 15 Distribution, tracking and scheduling co-ordination occupations 1.5% 1.5% 1.1% 1.2% 1.5% 2 Natural and applied sciences and related occupations 7.0% 6.6% 9.4% 8.7% 7.7% 21 Professional occupations in natural and applied sciences 4.2% 3.8% 6.7% 6.2% 5.5% 22 Technical occupations related to natural and applied sciences 2.8% 2.8% 2.7% 2.6% 2.2% 3 Health occupations 5.8% 5.5% 7.8% 8.5% 7.8% 30 Professional occupations in nursing 1.4% 1.3% 2.1% 2.6% 2.1% 31 Professional occupations in health (except nursing) 1.1% 1.1% 1.1% 1.0% 0.5% 32 Technical occupations in health 1.8% 1.8% 1.6% 1.7% 1.6% 34 Assisting occupations in support of health services 1.4% 1.2% 2.9% 3.3% 3.7% 4 Occupations in education, law and social, community and government services 15.3% 14.8% 18.1% 20.2% 17.9% 40 Professional occupations in education services 4.6% 4.4% 5.6% 6.7% 5.7% 41 Professional occupations in law and social, community and government services 4.9% 4.8% 5.4% 4.3% 3.4% 42 Paraprofessional occupations in legal, social, community and education services 3.5% 3.2% 5.2% 7.0% 6.2% 43 Occupations in front-line public protection services 1.1% 1.2% 0.2% 0.2% 0.2% 44 Care providers and educational, legal and public protection support occupations 1.2% 1.2% 1.7% 2.1% 2.4% 5 Occupations in art, culture, recreation and sport 3.5% 3.6% 2.8% 2.4% 2.4% 51 Professional occupations in art and culture 1.5% 1.6% 1.4% 0.9% 1.0% 52 Technical occupations in art, culture, recreation and sport 2.0% 2.1% 1.4% 1.6% 1.5% 6 Sales and service occupations 23.5% 23.2% 24.6% 25.4% 31.3% 62 Retail sales supervisors and specialized sales occupations 1.4% 1.4% 1.4% 1.5% 2.4% 63 Service supervisors and specialized service occupations 3.2% 3.0% 4.8% 3.8% 4.5% 64 Sales representatives and salespersons - wholesale and retail trade 3.7% 3.8% 2.9% 2.7% 3.4% 65 Service representatives and other customer and personal services occupations 5.5% 5.4% 5.5% 6.0% 7.2% 66 Sales support occupations 3.9% 4.0% 3.0% 3.8% 4.6% 67 Service support and other service occupations, n.e.c. 5.9% 5.7% 7.0% 7.5% 9.2% 7 Trades, transport and equipment operators and related occupations 12.4% 13.0% 8.2% 6.9% 7.7% 72 Industrial, electrical and construction trades 4.7% 5.1% 2.4% 2.3% 3.1% 73 Maintenance and equipment operation trades 2.1% 2.2% 1.1% 0.7% 0.4% 74 Other installers, repairers and servicers and material handlers 0.9% 1.0% 0.6% 0.9% 1.2% 75 Transport and heavy equipment operation and related maintenance occupations 3.1% 3.1% 3.3% 2.3% 1.9% 76 Trades helpers, construction labourers and related occupations 1.5% 1.7% 0.8% 0.7% 1.1% 8 Natural resources, agriculture and related production occupations 1.0% 1.1% 0.5% 0.5% 0.4% 9 Occupations in manufacturing and utilities 1.5% 1.6% 1.3% 1.5% 1.6%
Table 12b: Major Occupational Groups of Employed Canadian-born and Immigrants by Period of Resident Attainment, Ottawa-Gatineau CMA (Québec Sector), 2016
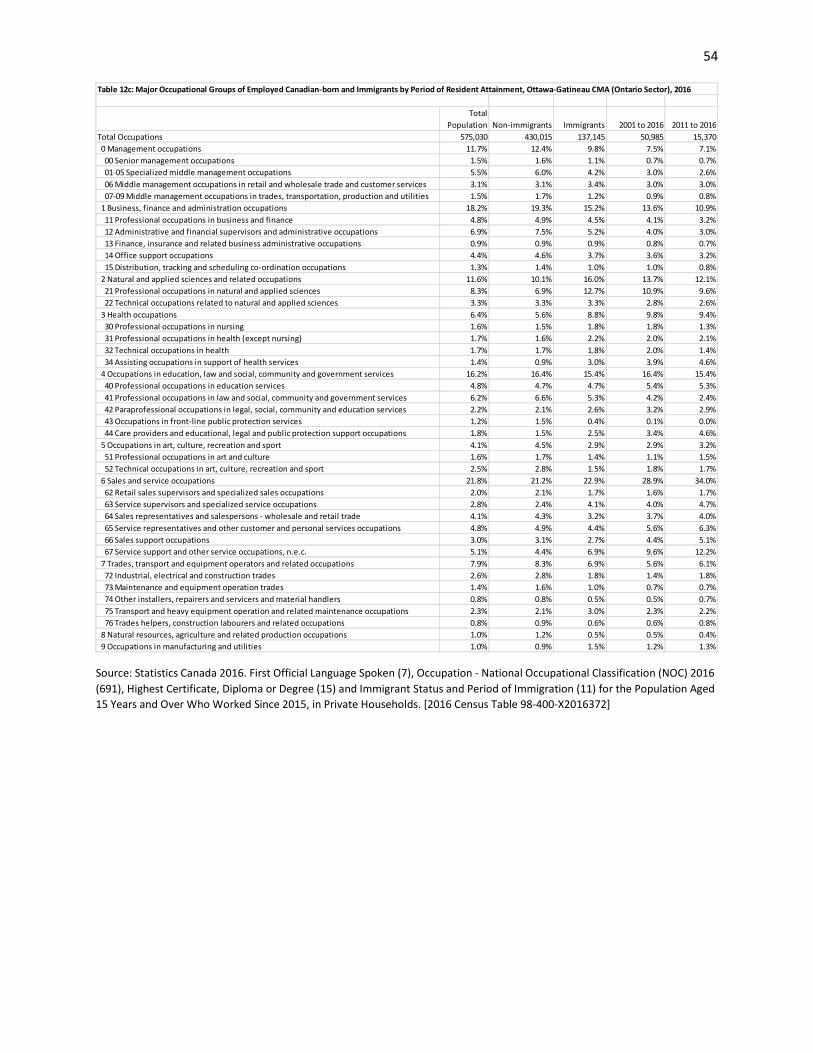
54
Source: Statistics Canada 2016. First Official Language Spoken (7), Occupation - National Occupational Classification (NOC) 2016 (691), Highest Certificate, Diploma or Degree (15) and Immigrant Status and Period of Immigration (11) for the Population Aged 15 Years and Over Who Worked Since 2015, in Private Households. [2016 Census Table 98-400-X2016372]
Total Population Non-immigrants Immigrants 2001 to 2016 2011 to 2016
Total Occupations 575,030 430,015 137,145 50,985 15,370 0 Management occupations 11.7% 12.4% 9.8% 7.5% 7.1% 00 Senior management occupations 1.5% 1.6% 1.1% 0.7% 0.7% 01-05 Specialized middle management occupations 5.5% 6.0% 4.2% 3.0% 2.6% 06 Middle management occupations in retail and wholesale trade and customer services 3.1% 3.1% 3.4% 3.0% 3.0% 07-09 Middle management occupations in trades, transportation, production and utilities 1.5% 1.7% 1.2% 0.9% 0.8% 1 Business, finance and administration occupations 18.2% 19.3% 15.2% 13.6% 10.9% 11 Professional occupations in business and finance 4.8% 4.9% 4.5% 4.1% 3.2% 12 Administrative and financial supervisors and administrative occupations 6.9% 7.5% 5.2% 4.0% 3.0% 13 Finance, insurance and related business administrative occupations 0.9% 0.9% 0.9% 0.8% 0.7% 14 Office support occupations 4.4% 4.6% 3.7% 3.6% 3.2% 15 Distribution, tracking and scheduling co-ordination occupations 1.3% 1.4% 1.0% 1.0% 0.8% 2 Natural and applied sciences and related occupations 11.6% 10.1% 16.0% 13.7% 12.1% 21 Professional occupations in natural and applied sciences 8.3% 6.9% 12.7% 10.9% 9.6% 22 Technical occupations related to natural and applied sciences 3.3% 3.3% 3.3% 2.8% 2.6% 3 Health occupations 6.4% 5.6% 8.8% 9.8% 9.4% 30 Professional occupations in nursing 1.6% 1.5% 1.8% 1.8% 1.3% 31 Professional occupations in health (except nursing) 1.7% 1.6% 2.2% 2.0% 2.1% 32 Technical occupations in health 1.7% 1.7% 1.8% 2.0% 1.4% 34 Assisting occupations in support of health services 1.4% 0.9% 3.0% 3.9% 4.6% 4 Occupations in education, law and social, community and government services 16.2% 16.4% 15.4% 16.4% 15.4% 40 Professional occupations in education services 4.8% 4.7% 4.7% 5.4% 5.3% 41 Professional occupations in law and social, community and government services 6.2% 6.6% 5.3% 4.2% 2.4% 42 Paraprofessional occupations in legal, social, community and education services 2.2% 2.1% 2.6% 3.2% 2.9% 43 Occupations in front-line public protection services 1.2% 1.5% 0.4% 0.1% 0.0% 44 Care providers and educational, legal and public protection support occupations 1.8% 1.5% 2.5% 3.4% 4.6% 5 Occupations in art, culture, recreation and sport 4.1% 4.5% 2.9% 2.9% 3.2% 51 Professional occupations in art and culture 1.6% 1.7% 1.4% 1.1% 1.5% 52 Technical occupations in art, culture, recreation and sport 2.5% 2.8% 1.5% 1.8% 1.7% 6 Sales and service occupations 21.8% 21.2% 22.9% 28.9% 34.0% 62 Retail sales supervisors and specialized sales occupations 2.0% 2.1% 1.7% 1.6% 1.7% 63 Service supervisors and specialized service occupations 2.8% 2.4% 4.1% 4.0% 4.7% 64 Sales representatives and salespersons - wholesale and retail trade 4.1% 4.3% 3.2% 3.7% 4.0% 65 Service representatives and other customer and personal services occupations 4.8% 4.9% 4.4% 5.6% 6.3% 66 Sales support occupations 3.0% 3.1% 2.7% 4.4% 5.1% 67 Service support and other service occupations, n.e.c. 5.1% 4.4% 6.9% 9.6% 12.2% 7 Trades, transport and equipment operators and related occupations 7.9% 8.3% 6.9% 5.6% 6.1% 72 Industrial, electrical and construction trades 2.6% 2.8% 1.8% 1.4% 1.8% 73 Maintenance and equipment operation trades 1.4% 1.6% 1.0% 0.7% 0.7% 74 Other installers, repairers and servicers and material handlers 0.8% 0.8% 0.5% 0.5% 0.7% 75 Transport and heavy equipment operation and related maintenance occupations 2.3% 2.1% 3.0% 2.3% 2.2% 76 Trades helpers, construction labourers and related occupations 0.8% 0.9% 0.6% 0.6% 0.8% 8 Natural resources, agriculture and related production occupations 1.0% 1.2% 0.5% 0.5% 0.4% 9 Occupations in manufacturing and utilities 1.0% 0.9% 1.5% 1.2% 1.3%
Table 12c: Major Occupational Groups of Employed Canadian-born and Immigrants by Period of Resident Attainment, Ottawa-Gatineau CMA (Ontario Sector), 2016

55
Total Population
Median employment
income (2015) for full-year full-time
workersTotal
Population
Median employment
income (2015) for full-year full-time
workersTotal
Population
Median employment
income (2015) for full-year full-time
workersAdmission Class Total Population 1,073,820 $62,792 266,195 $56,494 807,620 $65,140
Non-immigrants 816,320 $63,431 231,110 $57,242 585,215 $66,286 Immigrants 241,960 $59,598 33,260 $50,894 208,695 $61,534 2001 to 2010 59,915 $52,942 10,950 $49,470 48,970 $53,953 2011 to 2014 21,755 $39,862 4,370 $35,972 17,380 $42,772
Economic immigrants Total - Immigrant status and period of immigration84,480 $67,282 12,610 $54,765 71,870 $69,411 Non-immigrants 0 $0 0 $0 0 $0 Immigrants 84,480 $67,282 12,605 $54,765 71,870 $69,411 2001 to 2010 29,980 $62,728 5,340 $55,813 24,640 $65,121 2011 to 2014 10,445 $49,143 2,420 $38,372 8,025 $54,084
Family sponsored Total - Immigrant status and period of immigration54,570 $50,092 8,065 $48,727 46,505 $50,477 Non-immigrants 0 $0 0 $0 0 $0 Immigrants 54,570 $50,092 8,070 $48,727 46,500 $50,477 2001 to 2010 16,725 $45,690 2,780 $42,531 13,940 $46,770 2011 to 2014 7,075 $33,529 1,310 $31,978 5,770 $33,743
Refugees Total - Immigrant status and period of immigration43,505 $47,370 7,210 $44,274 36,295 $47,986 Non-immigrants 0 $0 0 $0 0 $0 Immigrants 43,505 $47,370 7,210 $44,274 36,295 $47,986 2001 to 2010 12,225 $37,074 2,665 $38,854 9,560 $36,047 2011 to 2014 3,825 $30,099 580 $28,750 3,240 $31,362
Admission Class Total - Immigrant status and period of immigration544,990 $64,796 138,165 $59,179 406,830 $67,537 Non-immigrants 405,840 $65,673 115,750 $59,641 290,090 $68,605 Immigrants 130,605 $60,990 21,350 $51,863 109,245 $63,518 2001 to 2010 40,725 $54,914 8,300 $50,746 32,425 $56,842 2011 to 2014 15,230 $42,183 3,430 $36,379 11,795 $45,708
Economic immigrants Total - Immigrant status and period of immigration56,325 $68,948 9,615 $55,801 46,710 $71,128 Non-immigrants 0 $0 0 $0 0 $0 Immigrants 56,325 $68,948 9,615 $55,801 46,710 $71,128 2001 to 2010 20,865 $64,845 4,200 $56,405 16,660 $67,657 2011 to 2014 8,215 $50,263 2,085 $38,830 6,130 $55,852
Family sponsored Total - Immigrant status and period of immigration35,405 $50,577 5,765 $47,969 29,645 $51,237 Non-immigrants 0 $0 0 $0 0 $0 Immigrants 35,405 $50,577 5,765 $47,969 29,640 $51,237 2001 to 2010 11,885 $47,206 2,205 $42,434 9,685 $48,793 2011 to 2014 4,435 $35,077 975 $32,684 3,460 $35,493
Refugees Total - Immigrant status and period of immigration26,960 $49,333 4,600 $46,466 22,355 $49,928 Non-immigrants 0 $0 0 $0 0 $0 Immigrants 26,960 $49,333 4,605 $46,466 22,355 $49,928 2001 to 2010 7,440 $38,807 1,780 $42,116 5,665 $37,712 2011 to 2014 2,325 $31,626 345 $27,667 1,980 $34,204
Admission Class Total - Immigrant status and period of immigration519,960 $67,303 129,700 $59,188 390,260 $70,402 Non-immigrants 398,260 $67,632 112,305 $59,842 285,955 $70,835 Immigrants 113,685 $66,348 16,460 $53,303 97,230 $69,550 2001 to 2010 27,630 $59,538 5,230 $52,826 22,400 $63,268 2011 to 2014 10,095 $44,843 2,145 $36,440 7,950 $49,135
Economic immigrants Total - Immigrant status and period of immigration42,435 $75,640 6,670 $57,386 35,760 $79,140 Non-immigrants 0 $0 0 $0 0 $0 Immigrants 42,435 $75,640 6,675 $57,386 35,760 $79,140 2001 to 2010 15,405 $70,467 2,790 $58,659 12,620 $73,873 2011 to 2014 5,140 $61,194 1,230 $39,764 3,915 $66,546
Family sponsored Total - Immigrant status and period of immigration21,545 $52,831 3,365 $50,069 18,185 $53,394 Non-immigrants 0 $0 0 $0 0 $0 Immigrants 21,545 $52,831 3,365 $50,069 18,180 $53,394 2001 to 2010 6,260 $48,766 1,075 $45,471 5,185 $49,327 2011 to 2014 3,055 $33,608 570 $29,791 2,485 $33,938
Refugees Total - Immigrant status and period of immigration21,265 $48,521 3,750 $46,725 17,515 $48,776 Non-immigrants 0 $0 0 $0 0 $0 Immigrants 21,265 $48,521 3,750 $46,725 17,510 $48,776 2001 to 2010 5,565 $37,670 1,290 $43,639 4,280 $35,796 2011 to 2014 1,725 $29,968 320 $28,675 1,405 $30,945
Admission Class Total - Immigrant status and period of immigration263,960 $69,393 67,400 $61,604 196,555 $72,424 Non-immigrants 199,670 $69,809 56,435 $62,765 143,235 $72,972 Immigrants 59,980 $67,718 10,425 $54,453 49,550 $70,919 2001 to 2010 17,945 $62,806 3,955 $54,392 13,990 $66,102 2011 to 2014 6,905 $46,459 1,655 $36,496 5,250 $51,745
Economic immigrants Total - Immigrant status and period of immigration27,750 $76,197 5,060 $58,454 22,685 $79,998 Non-immigrants 0 $0 0 $0 0 $0 Immigrants 27,750 $76,197 5,065 $58,454 22,685 $79,998 2001 to 2010 10,300 $72,495 2,235 $59,556 8,065 $76,854 2011 to 2014 3,860 $62,147 1,025 $39,920 2,840 $68,230
Family sponsored Total - Immigrant status and period of immigration13,760 $53,402 2,400 $49,510 11,360 $54,858 Non-immigrants 0 $0 0 $0 0 $0 Immigrants 13,760 $53,402 2,400 $49,510 11,360 $54,858 2001 to 2010 4,135 $50,723 830 $43,980 3,300 $53,358 2011 to 2014 1,945 $34,637 445 $29,791 1,495 $35,372
Refugees Total - Immigrant status and period of immigration12,860 $50,711 2,305 $50,026 10,555 $50,904 Non-immigrants 0 $0 0 $0 0 $0 Immigrants 12,865 $50,711 2,305 $50,026 10,560 $50,904 2001 to 2010 3,305 $38,669 830 $47,322 2,470 $36,874 2011 to 2014 980 $32,018 165 $25,976 810 $34,051
Table 13: Median Employment Income of Immigrants by Gender, Admission Class and Period of Permanent Residence Attainment, Ottawa-Gatineau CMA and Sectors, 2016
Tota
l Sex
Men
Ottawa-Gatineau CMAOttawa-Gatineau CMA
(Québec sector)Ottawa-Gatineau CMA (Ontario
sector)To
tal A
ge
25
to 5
4 ye
ars
Tota
l Age
25 to
54
year
s

56
Source: Statistics Canada 2016. Admission Category and Applicant Type (47), Selected Income Characteristics (92), Immigrant Status and Period of Immigration (10A), Age (10B) and Sex (3) for the Population in Private Households of Canada, Provinces and Territories and Census Metropolitan Areas, 2016 Census - 25% Sample Data. [2016 Census Table 98-400-X2016367]
Total Population
Median employment
income (2015) for full-year full-time
workersTotal
Population
Median employment
income (2015) for full-year full-time
workersTotal
Population
Median employment
income (2015) for full-year full-time
workersAdmission Class Total - Immigrant status and period of immigration553,860 $58,965 136,495 $54,284 417,365 $60,342
Non-immigrants 418,060 $59,687 118,805 $55,003 299,255 $62,046 Immigrants 128,270 $54,115 16,805 $48,646 111,465 $54,988 2001 to 2010 32,290 $47,391 5,715 $43,817 26,575 $48,281 2011 to 2014 11,660 $36,152 2,225 $33,984 9,440 $36,743
Economic immigrants Total - Immigrant status and period of immigration42,040 $57,543 5,930 $50,805 36,115 $58,493 Non-immigrants 0 $0 0 $0 0 $0 Immigrants 42,045 $57,543 5,930 $50,805 36,110 $58,493 2001 to 2010 14,575 $53,002 2,555 $50,852 12,025 $53,556 2011 to 2014 5,305 $38,687 1,190 $35,911 4,110 $39,048
Family sponsored Total - Immigrant status and period of immigration33,025 $48,392 4,705 $46,747 28,320 $48,588 Non-immigrants 0 $0 0 $0 0 $0 Immigrants 33,025 $48,392 4,705 $46,747 28,325 $48,588 2001 to 2010 10,465 $43,179 1,705 $38,016 8,760 $44,267 2011 to 2014 4,020 $33,175 740 $37,928 3,285 $33,155
Refugees Total - Immigrant status and period of immigration22,240 $45,657 3,460 $39,677 18,785 $46,706 Non-immigrants 0 $0 0 $0 0 $0 Immigrants 22,240 $45,657 3,460 $39,677 18,780 $46,706 2001 to 2010 6,660 $36,041 1,375 $35,290 5,280 $36,946 2011 to 2014 2,095 $31,108 265 $0 1,835 $31,383
Admission Class Total - Immigrant status and period of immigration281,035 $60,574 70,765 $56,491 210,270 $62,512 Non-immigrants 206,170 $61,876 59,315 $57,402 146,855 $63,932 Immigrants 70,625 $55,237 10,925 $49,265 59,695 $56,656 2001 to 2010 22,775 $48,630 4,350 $44,945 18,435 $49,424 2011 to 2014 8,325 $37,888 1,780 $34,496 6,545 $38,710
Economic immigrants Total - Immigrant status and period of immigration28,575 $59,572 4,550 $51,482 24,030 $60,970 Non-immigrants 0 $0 0 $0 0 $0 Immigrants 28,575 $59,572 4,550 $51,482 24,025 $60,970 2001 to 2010 10,565 $53,513 1,965 $51,071 8,595 $54,376 2011 to 2014 4,355 $38,973 1,065 $35,911 3,295 $39,626
Family sponsored Total - Immigrant status and period of immigration21,645 $48,441 3,355 $46,906 18,285 $48,784 Non-immigrants 0 $0 0 $0 0 $0 Immigrants 21,640 $48,441 3,360 $46,906 18,285 $48,784 2001 to 2010 7,750 $44,314 1,375 $40,950 6,380 $45,457 2011 to 2014 2,485 $37,658 525 $38,057 1,960 $36,223
Refugees Total - Immigrant status and period of immigration14,100 $47,578 2,300 $40,670 11,800 $48,505 Non-immigrants 0 $0 0 $0 0 $0 Immigrants 14,100 $47,578 2,295 $40,670 11,800 $48,505 2001 to 2010 4,145 $38,997 950 $35,426 3,195 $39,872 2011 to 2014 1,355 $31,409 180 $0 1,175 $37,199
Table 13 (cont'd): Median Employment Income of Immigrants by Gender, Admission Class and Period of Permanent Residence Attainment, Ottawa-Gatineau CMA and Sectors, 2016
Ottawa-Gatineau CMAOttawa-Gatineau CMA
(Québec sector)Ottawa-Gatineau CMA (Ontario
sector)
Wom
en
Tota
l Age
25 to
54
year
s

57
Individuals with
employment Income
Median employment
income
Individuals with
employment Income
Median employment
income
Individuals with
employment Income
Median employment
incomeTotal - Highest certificate, diploma or degreeTotal Population 393,295 $62,792 94,625 $56,494 298,670 $65,140
Non-immigrants 314,910 $63,431 83,910 $57,242 230,995 $66,286 Immigrants 76,545 $59,598 10,520 $50,894 66,030 $61,534 1981 to 1990 14,640 $59,375 1,710 $52,887 12,925 $60,175 1991 to 2000 23,525 $63,113 2,880 $55,861 20,645 $64,206 2001 to 2010 18,440 $52,942 3,525 $49,470 14,915 $53,953 2011 to 2014 4,465 $39,862 895 $35,972 3,570 $42,772
No certificate, diploma or degree Total Population 20,495 $35,515 9,150 $33,946 11,350 $37,396
Non-immigrants 16,560 $37,143 8,480 $34,225 8,080 $40,554 Immigrants 3,875 $29,504 655 $28,787 3,220 $29,581 1981 to 1990 1,040 $30,588 170 $32,769 875 $30,452 1991 to 2000 970 $27,946 140 $23,849 835 $28,735 2001 to 2010 715 $26,984 120 $26,987 600 $26,983 2011 to 2014 235 $25,121 80 $27,383 155 $24,168
Secondary (high) school diploma Total Population 73,150 $48,022 17,620 $47,527 55,535 $48,138
Non-immigrants 62,475 $49,578 16,345 $48,564 46,135 $49,915 Immigrants 10,460 $38,711 1,250 $36,918 9,210 $38,901 1981 to 1990 2,465 $40,744 210 $40,210 2,250 $40,820 1991 to 2000 2,915 $36,243 385 $32,592 2,525 $36,470 2001 to 2010 1,875 $33,461 320 $34,887 1,560 $33,299 2011 to 2014 545 $29,702 80 $25,540 465 $29,955
Apprenticeship/trades certificate Total Population 25,750 $47,948 13,280 $44,413 12,470 $52,399
Non-immigrants 22,265 $49,527 12,275 $45,037 9,990 $55,297 Immigrants 3,420 $40,033 985 $37,754 2,430 $41,303 1981 to 1990 745 $44,207 175 $44,200 570 $44,215 1991 to 2000 860 $37,639 210 $39,414 650 $36,181 2001 to 2010 840 $36,256 325 $32,146 520 $37,614 2011 to 2014 195 $25,014 85 $23,850 115 $25,911
College, CEGEP or other non-university certificate Total Population 94,065 $57,882 20,330 $57,538 73,740 $57,987
Non-immigrants 80,135 $59,234 18,590 $58,464 61,545 $59,443 Immigrants 13,605 $50,418 1,710 $46,869 11,890 $50,911 1981 to 1990 3,325 $53,125 320 $48,978 3,005 $53,700 1991 to 2000 3,915 $49,371 545 $48,815 3,365 $49,696 2001 to 2010 2,435 $39,603 445 $41,578 1,995 $39,275 2011 to 2014 550 $37,476 95 $28,104 460 $38,755
University cert. at bachelor level or above Total Population 171,500 $82,173 31,250 $76,139 140,250 $83,979
Non-immigrants 127,445 $83,723 25,670 $78,067 101,770 $85,890 Immigrants 42,925 $78,303 5,470 $64,260 37,455 $80,744 1981 to 1990 6,670 $84,329 745 $78,054 5,925 $85,209 1991 to 2000 14,185 $81,290 1,495 $73,483 12,690 $81,825 2001 to 2010 11,935 $65,475 2,165 $58,049 9,765 $68,379 2011 to 2014 2,765 $53,273 520 $43,221 2,245 $56,997
Total - Highest certificate, diploma or degreeTotal Population 300,380 $64,796 73,215 $59,179 227,160 $67,537 Non-immigrants 241,045 $65,673 64,500 $59,641 176,545 $68,605 Immigrants 57,795 $60,990 8,550 $51,863 49,240 $63,518 1981 to 1990 9,815 $60,725 1,205 $53,394 8,610 $62,193 1991 to 2000 18,960 $65,039 2,350 $58,524 16,605 $66,601 2001 to 2010 16,470 $54,914 3,230 $50,746 13,240 $56,842 2011 to 2014 4,150 $42,183 870 $36,379 3,275 $45,708
No certificate, diploma or degree Total Population 12,415 $36,350 5,775 $35,491 6,635 $37,462
Non-immigrants 9,940 $38,304 5,315 $36,187 4,625 $41,215 Immigrants 2,430 $29,113 450 $28,769 1,980 $29,133 1981 to 1990 615 $30,645 115 $33,001 500 $30,523 1991 to 2000 715 $27,353 95 $25,257 620 $28,001 2001 to 2010 595 $27,047 100 $26,969 490 $27,072 2011 to 2014 195 $26,096 75 $27,576 115 $25,362
Secondary (high) school diploma Total Population 49,405 $50,349 12,270 $50,470 37,135 $50,296
Non-immigrants 42,180 $52,318 11,295 $51,554 30,890 $52,624 Immigrants 7,060 $38,977 955 $37,107 6,110 $39,184 1981 to 1990 1,625 $41,591 140 $41,639 1,485 $41,568 1991 to 2000 2,260 $37,743 310 $32,566 1,945 $38,428 2001 to 2010 1,545 $35,211 275 $36,956 1,270 $35,068 2011 to 2014 450 $31,631 80 $25,540 375 $32,026
Apprenticeship/trades certificate Total Population 18,865 $49,787 10,195 $46,441 8,670 $54,367
Non-immigrants 16,480 $51,562 9,470 $47,406 7,010 $58,038 Immigrants 2,335 $39,423 720 $37,994 1,610 $40,892 1981 to 1990 475 $44,867 95 $45,007 375 $44,807 1991 to 2000 665 $38,609 160 $42,938 505 $37,826 2001 to 2010 705 $36,548 275 $31,909 425 $38,424 2011 to 2014 185 $25,036 80 $23,850 100 $25,935
College, CEGEP or other non-university certificate Total Population 72,925 $58,971 16,175 $59,113 56,750 $58,939
Non-immigrants 62,710 $60,171 14,790 $59,554 47,920 $60,334 Immigrants 9,970 $50,595 1,365 $46,874 8,600 $51,006 1981 to 1990 2,310 $53,349 245 $45,442 2,065 $54,266 1991 to 2000 3,230 $51,064 465 $49,440 2,770 $51,160 2001 to 2010 2,100 $40,658 380 $42,473 1,715 $40,147 2011 to 2014 495 $38,755 85 $28,104 415 $40,129
University cert. at bachelor level or above Total Population 140,580 $81,471 26,480 $75,646 114,105 $83,063
Non-immigrants 105,310 $82,861 21,675 $77,613 83,640 $84,982 Immigrants 34,270 $77,484 4,710 $64,034 29,560 $79,841 1981 to 1990 4,530 $84,179 550 $75,598 3,980 $85,306 1991 to 2000 11,550 $81,521 1,235 $75,650 10,320 $82,125 2001 to 2010 10,980 $67,092 2,055 $58,428 8,920 $69,882 2011 to 2014 2,655 $54,176 505 $43,475 2,150 $58,189
Table 14: Median Employment Income by Educational Attainment, Period of Residence Attainment and Gender for Immigrants and Canadian-born Population Aged 25-54, Ottawa-Gatineau and Component Sectors, 2016.
Tota
l Sex
Ottawa-Gatineau CMAOttawa-Gatineau CMA
(Québec Sector)Ottawa-Gatineau CMA
(Ontario Sector)To
tal -
Age
25
to 5
4 ye
ars

58
Individuals with
employment Income
Median employment
income
Individuals with
employment Income
Median employment
income
Individuals with
employment Income
Median employment
incomeTotal - Highest certificate, diploma or degreeTotal Population 210,770 $67,303 49,460 $59,188 161,305 $70,402
Non-immigrants 167,635 $67,632 43,390 $59,842 124,240 $70,835 Immigrants 42,085 $66,348 5,965 $53,303 36,120 $69,550 1981 to 1990 8,060 $63,792 1,035 $51,968 7,020 $66,176 1991 to 2000 12,565 $70,603 1,570 $59,413 10,995 $72,400 2001 to 2010 10,210 $59,538 1,965 $52,826 8,250 $63,268 2011 to 2014 2,750 $44,843 560 $36,440 2,185 $49,135
No certificate, diploma or degree Total Population 13,490 $38,124 6,090 $36,621 7,395 $39,542
Non-immigrants 11,100 $39,559 5,635 $37,159 5,465 $42,892 Immigrants 2,355 $30,350 450 $29,201 1,910 $30,589 1981 to 1990 670 $32,513 130 $32,911 540 $31,391 1991 to 2000 560 $29,218 100 $19,983 460 $30,695 2001 to 2010 440 $28,878 75 $26,981 365 $28,901 2011 to 2014 150 $27,298 60 $27,606 90 $25,362
Secondary (high) school diploma Total Population 41,820 $49,075 9,490 $49,069 32,330 $49,077
Non-immigrants 35,710 $50,757 8,725 $50,003 26,985 $51,049 Immigrants 6,010 $39,784 755 $36,028 5,255 $40,007 1981 to 1990 1,425 $41,976 155 $40,223 1,275 $42,537 1991 to 2000 1,675 $36,554 225 $31,371 1,450 $37,052 2001 to 2010 1,135 $37,066 185 $39,916 950 $36,923 2011 to 2014 370 $31,688 65 $27,014 310 $32,012
Apprenticeship/trades certificate Total Population 16,935 $54,376 7,820 $50,475 9,120 $59,170
Non-immigrants 14,805 $55,991 7,260 $51,404 7,545 $61,483 Immigrants 2,090 $44,039 555 $38,171 1,535 $46,001 1981 to 1990 475 $44,350 110 $42,706 370 $44,931 1991 to 2000 450 $40,021 90 $52,328 365 $38,975 2001 to 2010 470 $40,983 175 $34,766 300 $45,197 2011 to 2014 145 $25,980 60 $25,313 90 $26,130
College, CEGEP or other non-university certificate Total Population 48,450 $64,738 10,300 $63,762 38,145 $64,978
Non-immigrants 41,670 $66,214 9,330 $64,958 32,340 $66,707 Immigrants 6,630 $54,647 955 $52,439 5,670 $55,231 1981 to 1990 1,645 $58,529 185 $52,844 1,460 $59,931 1991 to 2000 1,735 $53,135 275 $55,357 1,470 $53,064 2001 to 2010 1,155 $41,362 225 $45,043 930 $41,066 2011 to 2014 320 $40,175 75 $29,680 250 $44,966
University cert. at bachelor level or above Total Population 86,270 $90,270 14,460 $82,061 71,805 $92,043
Non-immigrants 61,585 $92,184 11,380 $85,732 50,210 $93,976 Immigrants 23,990 $85,303 3,025 $67,140 20,965 $88,317 1981 to 1990 3,660 $90,706 415 $82,256 3,245 $93,325 1991 to 2000 7,855 $90,054 825 $77,479 7,035 $91,373 2001 to 2010 6,680 $73,102 1,220 $61,116 5,455 $76,982 2011 to 2014 1,670 $62,805 285 $44,903 1,385 $66,972
Total - Highest certificate, diploma or degreeTotal Population 158,835 $69,393 37,565 $61,604 121,270 $72,424 Non-immigrants 126,560 $69,809 32,695 $62,765 93,860 $72,972 Immigrants 31,385 $67,718 4,780 $54,453 26,605 $70,919 1981 to 1990 5,420 $63,965 710 $53,213 4,705 $66,472 1991 to 2000 9,915 $72,297 1,275 $61,398 8,645 $73,701 2001 to 2010 9,020 $62,806 1,800 $54,392 7,215 $66,102 2011 to 2014 2,590 $46,459 545 $36,496 2,045 $51,745
No certificate, diploma or degree Total Population 8,370 $39,033 3,950 $38,226 4,420 $39,844
Non-immigrants 6,860 $40,967 3,640 $38,973 3,220 $44,159 Immigrants 1,490 $30,240 305 $28,778 1,180 $30,431 1981 to 1990 435 $31,341 85 $33,507 345 $30,657 1991 to 2000 395 $27,674 65 $18,007 330 $29,850 2001 to 2010 355 $28,971 70 $26,972 295 $29,000 2011 to 2014 130 $27,330 55 $27,606 70 $25,410
Secondary (high) school diploma Total Population 28,990 $52,202 6,645 $52,058 22,345 $52,287
Non-immigrants 24,785 $53,905 6,065 $53,653 18,720 $53,993 Immigrants 4,125 $40,522 570 $39,847 3,550 $40,808 1981 to 1990 975 $43,332 105 $41,637 875 $43,422 1991 to 2000 1,290 $38,745 180 $29,895 1,115 $39,459 2001 to 2010 915 $38,510 160 $41,840 750 $38,058 2011 to 2014 320 $32,392 60 $27,014 260 $32,863
Apprenticeship/trades certificate Total Population 12,190 $56,281 5,930 $52,309 6,265 $60,743
Non-immigrants 10,740 $58,111 5,510 $53,785 5,235 $63,474 Immigrants 1,410 $43,689 420 $37,993 995 $46,203 1981 to 1990 315 $45,798 70 $47,437 250 $45,721 1991 to 2000 350 $42,819 70 $52,311 280 $41,472 2001 to 2010 410 $41,828 165 $36,771 245 $47,749 2011 to 2014 140 $26,187 60 $25,313 80 $26,208
College, CEGEP or other non-university certificate Total Population 37,455 $65,923 8,120 $65,096 29,340 $66,181
Non-immigrants 32,520 $67,386 7,385 $66,108 25,135 $67,787 Immigrants 4,825 $55,507 720 $52,900 4,110 $56,146 1981 to 1990 1,170 $59,581 135 $52,749 1,035 $60,270 1991 to 2000 1,445 $54,232 225 $56,639 1,225 $54,157 2001 to 2010 950 $42,868 185 $49,944 765 $42,563 2011 to 2014 295 $43,683 60 $29,680 235 $45,442
University cert. at bachelor level or above Total Population 69,010 $88,899 11,920 $81,534 57,085 $90,817
Non-immigrants 49,635 $91,167 9,285 $85,377 40,355 $92,643 Immigrants 18,745 $83,841 2,590 $66,539 16,155 $87,198 1981 to 1990 2,405 $88,895 295 $73,600 2,110 $91,326 1991 to 2000 6,230 $90,042 690 $78,190 5,540 $91,498 2001 to 2010 6,110 $74,413 1,155 $62,185 4,955 $78,278 2011 to 2014 1,610 $63,574 280 $44,960 1,330 $68,400
Table 14 (cont'd): Median Employment Income by Educational Attainment, Period of Residence Attainment and Gender for Immigrants and Canadian-born Population Aged 25-54, Ottawa-Gatineau and Component Sectors, 2016.
Men
Ottawa-Gatineau CMA Ottawa-Gatineau CMA Ottawa-Gatineau CMA
Tota
l - A
ge
25 to
54
year
s

59
Source: Statistics Canada 2016. Immigrant Status and Period of Immigration (10), Employment Income Statistics (7), STEM and BHASE (non-STEM) Groupings, Major Field of Study - Classification of Instructional Programs (CIP) 2016 (36), Highest Certificate, Diploma or Degree (9), Work Activity During the Reference Year (3), Age (10) and Sex (3) for the Population Aged 15 Years and Over in Private Households of Canada, Provinces and Territories and Census Metropolitan Areas, 2016 Census - 25% Sample Data. [2016 Census Table 98-400-X2016273].
Individuals with
employment Income
Median employment
income
Individuals with
employment Income
Median employment
income
Individuals with
employment Income
Median employment
incomeTotal - Highest certificate, diploma or degreeTotal Population 182,530 $58,965 45,165 $54,284 137,365 $60,342
Non-immigrants 147,270 $59,687 40,520 $55,003 106,755 $62,046 Immigrants 34,460 $54,115 4,555 $48,646 29,905 $54,988 1981 to 1990 6,580 $55,738 670 $54,621 5,910 $55,808 1991 to 2000 10,960 $56,277 1,310 $50,080 9,650 $56,992 2001 to 2010 8,230 $47,391 1,560 $43,817 6,670 $48,281 2011 to 2014 1,715 $36,152 335 $33,984 1,380 $36,743
No certificate, diploma or degree Total Population 7,005 $30,562 3,050 $28,401 3,955 $32,691
Non-immigrants 5,460 $31,867 2,840 $28,389 2,620 $36,123 Immigrants 1,515 $27,733 210 $28,632 1,315 $27,652 1981 to 1990 370 $29,556 40 $31,670 330 $29,520 1991 to 2000 410 $26,683 40 $27,101 370 $26,159 2001 to 2010 275 $25,511 40 $28,548 230 $25,296 2011 to 2014 85 $21,703 25 $0 60 $23,837
Secondary (high) school diploma Total Population 31,330 $46,486 8,125 $46,112 23,200 $46,679
Non-immigrants 26,770 $48,390 7,620 $46,573 19,145 $48,970 Immigrants 4,450 $37,655 495 $37,027 3,960 $37,902 1981 to 1990 1,040 $38,309 55 $31,227 980 $38,313 1991 to 2000 1,235 $35,583 165 $37,406 1,075 $35,465 2001 to 2010 740 $29,871 135 $31,295 610 $29,690 2011 to 2014 180 $25,159 25 $0 155 $25,354
Apprenticeship/trades certificate Total Population 8,810 $38,494 5,460 $38,421 3,350 $38,707
Non-immigrants 7,460 $38,891 5,015 $38,540 2,445 $39,596 Immigrants 1,325 $35,430 430 $36,618 895 $35,271 1981 to 1990 265 $42,258 65 $44,886 195 $41,305 1991 to 2000 405 $35,344 125 $37,675 285 $34,948 2001 to 2010 370 $29,362 150 $27,809 220 $30,154 2011 to 2014 45 $23,382 20 $0 25 $0
College, CEGEP or other non-university certificate Total Population 45,620 $52,397 10,025 $51,911 35,590 $52,527
Non-immigrants 38,460 $53,609 9,260 $52,942 29,205 $53,803 Immigrants 6,985 $47,112 760 $42,647 6,220 $47,684 1981 to 1990 1,680 $49,373 135 $41,676 1,545 $49,749 1991 to 2000 2,170 $46,668 275 $43,790 1,900 $47,065 2001 to 2010 1,280 $37,355 215 $40,635 1,065 $37,175 2011 to 2014 230 $31,434 15 $0 210 $31,695
University cert. at bachelor level or above Total Population 85,230 $75,987 16,785 $72,744 68,440 $77,311
Non-immigrants 65,860 $77,843 14,295 $74,401 51,565 $79,395 Immigrants 18,935 $69,260 2,445 $60,148 16,485 $70,396 1981 to 1990 3,010 $76,948 330 $74,686 2,685 $77,133 1991 to 2000 6,330 $72,604 670 $69,961 5,660 $73,442 2001 to 2010 5,255 $57,665 945 $53,111 4,315 $58,810 2011 to 2014 1,095 $43,965 235 $40,069 860 $45,820
Total - Highest certificate, diploma or degreeTotal Population 141,550 $60,574 35,650 $56,491 105,900 $62,512 Non-immigrants 114,485 $61,876 31,795 $57,402 82,690 $63,932 Immigrants 26,410 $55,237 3,770 $49,265 22,635 $56,656 1981 to 1990 4,395 $58,478 495 $54,650 3,900 $58,882 1991 to 2000 9,035 $58,535 1,075 $55,085 7,960 $59,113 2001 to 2010 7,450 $48,630 1,430 $44,945 6,025 $49,424 2011 to 2014 1,555 $37,888 325 $34,496 1,230 $38,710
No certificate, diploma or degree Total Population 4,040 $30,958 1,825 $29,062 2,220 $32,781
Non-immigrants 3,085 $32,808 1,675 $29,084 1,410 $36,266 Immigrants 940 $27,111 145 $28,663 795 $26,974 1981 to 1990 180 $29,933 25 $0 155 $30,430 1991 to 2000 325 $27,070 35 $27,080 290 $27,066 2001 to 2010 240 $25,699 35 $26,363 205 $25,611 2011 to 2014 65 $24,192 20 $0 45 $25,146
Secondary (high) school diploma Total Population 20,420 $48,171 5,625 $49,020 14,795 $47,905
Non-immigrants 17,395 $50,129 5,230 $49,722 12,165 $50,323 Immigrants 2,935 $37,071 385 $34,115 2,555 $37,397 1981 to 1990 650 $39,354 35 $44,803 615 $39,351 1991 to 2000 965 $36,045 130 $36,969 835 $35,930 2001 to 2010 640 $30,159 120 $31,885 520 $30,012 2011 to 2014 135 $25,452 20 $0 115 $26,795
Apprenticeship/trades certificate Total Population 6,675 $39,260 4,265 $39,346 2,405 $38,868
Non-immigrants 5,735 $39,750 3,955 $39,408 1,775 $41,162 Immigrants 920 $34,148 300 $38,402 615 $33,857 1981 to 1990 160 $40,117 30 $44,860 125 $38,915 1991 to 2000 310 $34,743 90 $38,529 225 $34,158 2001 to 2010 290 $29,178 115 $27,891 175 $29,705 2011 to 2014 40 $23,302 20 $0 15 $0
College, CEGEP or other non-university certificate Total Population 35,470 $53,080 8,060 $53,357 27,410 $52,975
Non-immigrants 30,195 $54,360 7,405 $54,404 22,785 $54,348 Immigrants 5,140 $45,894 645 $42,169 4,495 $46,594 1981 to 1990 1,140 $47,912 110 $41,438 1,030 $48,651 1991 to 2000 1,785 $47,081 240 $43,435 1,540 $47,652 2001 to 2010 1,150 $38,906 195 $41,145 960 $38,396 2011 to 2014 195 $33,080 15 $0 180 $37,217
University cert. at bachelor level or above Total Population 71,570 $75,852 14,555 $72,496 57,020 $77,233
Non-immigrants 55,675 $77,572 12,395 $74,216 43,280 $79,171 Immigrants 15,525 $69,362 2,125 $60,009 13,405 $70,536 1981 to 1990 2,125 $78,362 255 $75,966 1,865 $79,068 1991 to 2000 5,325 $75,077 545 $71,589 4,780 $75,345 2001 to 2010 4,870 $58,355 900 $53,022 3,965 $59,965 2011 to 2014 1,050 $45,171 230 $40,105 815 $46,919
Table 14 (cont'd): Median Employment Income by Educational Attainment, Period of Residence Attainment and Gender for Immigrants and Canadian-born Population Aged 25-54, Ottawa-Gatineau and Component Sectors, 2016.
Wom
en
Tota
l - A
ge
25 to
54
year
s
Ottawa-Gatineau CMA Ottawa-Gatineau CMA Ottawa-Gatineau CMA

60
Source: Statistics Canada 2016. Visible Minority (15), Employment Income Statistics (7), STEM and BHASE (non-STEM) Groupings, Major Field of Study - Classification of Instructional Programs (CIP) 2016 (16), Highest Certificate, Diploma or Degree (9), Immigrant Status (4A), Age (10) and Sex (3) for the Population Aged 15 Years and Over in Private Households of Canada, Provinces and Territories and Census Metropolitan Areas, 2016 Census - 25% Sample Data. [2016 Census Table 98-400-X2016277].
Individuals with employment
income
Median employment
income
Individuals with
employment
Median employment
income
Individuals with
employment
Median employment
income Total Total 764,160 $40,553 191,275 $37,813 572,890 $41,677
Total visible minority pop. 141,365 $30,063 19,025 $26,866 122,340 $30,733 Not a visible minority 622,800 $43,144 172,250 $39,075 450,555 $45,076
Non-immigrants Total 602,785 $41,869 167,320 $38,828 435,470 $43,419 Total visible minority pop. 33,575 $21,092 3,630 $22,759 29,945 $20,700 Not a visible minority 569,215 $42,995 163,690 $39,127 405,520 $44,950
Immigrants Total 161,375 $35,879 23,950 $31,088 137,420 $37,007 Total visible minority pop. 107,785 $32,400 15,395 $27,724 92,395 $33,393 Not a visible minority 53,585 $44,746 8,555 $38,351 45,030 $46,138
Total Total 476,220 $53,033 122,295 $48,911 353,925 $54,694 Total visible minority pop. 95,040 $40,317 14,070 $33,593 80,970 $41,659 Not a visible minority 381,185 $55,743 108,225 $50,589 272,955 $58,267
Non-immigrants Total 368,215 $55,655 104,495 $50,898 263,720 $57,972 Total visible minority pop. 17,790 $52,000 2,075 $47,926 15,720 $52,763 Not a visible minority 350,430 $55,844 102,425 $50,959 248,000 $58,334
Immigrants Total 108,005 $42,247 17,800 $35,224 90,205 $43,945 Total visible minority pop. 77,245 $37,858 12,000 $31,195 65,245 $39,381 Not a visible minority 30,755 $54,479 5,805 $44,102 24,955 $57,517
Total Total 384,620 $45,167 96,575 $40,349 288,035 $47,067 Total visible minority pop. 70,125 $33,862 9,865 $30,339 60,265 $34,658 Not a visible minority 314,490 $47,858 86,715 $41,600 227,775 $50,689
Non-immigrants Total 303,615 $46,204 84,085 $41,224 219,530 $48,367 Total visible minority pop. 16,720 $21,497 1,840 $22,673 14,875 $21,186 Not a visible minority 286,900 $47,535 82,240 $41,638 204,655 $50,242
Immigrants Total 81,000 $41,348 12,495 $34,752 68,505 $42,890 Total visible minority pop. 53,410 $37,085 8,020 $31,568 45,390 $38,297 Not a visible minority 27,590 $51,477 4,475 $41,042 23,120 $54,449
Total Total 235,475 $58,796 60,480 $52,094 174,995 $61,640 Total visible minority pop. 46,275 $46,199 7,320 $36,896 38,950 $48,399 Not a visible minority 189,200 $61,365 53,155 $54,099 136,045 $64,902
Non-immigrants Total 182,775 $60,756 51,325 $54,180 131,445 $63,969 Total visible minority pop. 8,780 $53,452 1,085 $42,101 7,695 $54,511 Not a visible minority 173,990 $61,146 50,240 $54,326 123,750 $64,533
Immigrants Total 52,700 $49,750 9,150 $39,305 43,550 $52,674 Total visible minority pop. 37,490 $44,328 6,235 $35,933 31,255 $46,636 Not a visible minority 15,210 $64,496 2,915 $47,718 12,300 $70,312
Total Total 379,545 $36,724 94,695 $35,326 284,850 $37,325 Total visible minority pop. 71,235 $27,265 9,160 $24,097 62,075 $27,924 Not a visible minority 308,310 $39,264 85,535 $36,809 222,780 $40,380
Non-immigrants Total 299,170 $38,399 83,235 $36,631 215,940 $39,238 Total visible minority pop. 16,855 $20,594 1,785 $23,664 15,070 $20,312 Not a visible minority 282,320 $39,293 81,450 $36,884 200,870 $40,447
Immigrants Total 80,375 $31,455 11,455 $27,752 68,915 $32,320 Total visible minority pop. 54,380 $28,855 7,370 $24,183 47,010 $29,758 Not a visible minority 25,995 $39,024 4,085 $35,890 21,905 $39,832
Total Total 240,745 $48,030 61,815 $45,469 178,930 $48,890 Total visible minority pop. 48,760 $35,555 6,750 $29,705 42,015 $36,493 Not a visible minority 191,980 $50,879 55,070 $47,382 136,915 $52,436
Non-immigrants Total 185,445 $51,163 53,165 $47,848 132,280 $52,703 Total visible minority pop. 9,005 $50,240 985 $51,405 8,025 $50,113 Not a visible minority 176,435 $51,200 52,180 $47,732 124,255 $52,826
Immigrants Total 55,300 $36,386 8,655 $31,199 46,650 $37,559 Total visible minority pop. 39,755 $32,948 5,760 $27,273 33,990 $34,147 Not a visible minority 15,550 $46,708 2,890 $40,376 12,660 $48,470
Table 16: Employment Income of Employed Individuals (Aged 25-54) by Visible Minority Status and Gender, Ottawa-Gatineau CMA and Component Sectors, 2016To
tal
25
to 5
4 ye
ars
Tota
l 2
5 to
54
year
sOttawa-Gatineau CMA
(Ontario sector)
Tota
l - S
exM
enW
omen
Ottawa-Gatineau CMAOttawa-Gatineau CMA
(Québec sector)
Tota
l 2
5 to
54
year
s
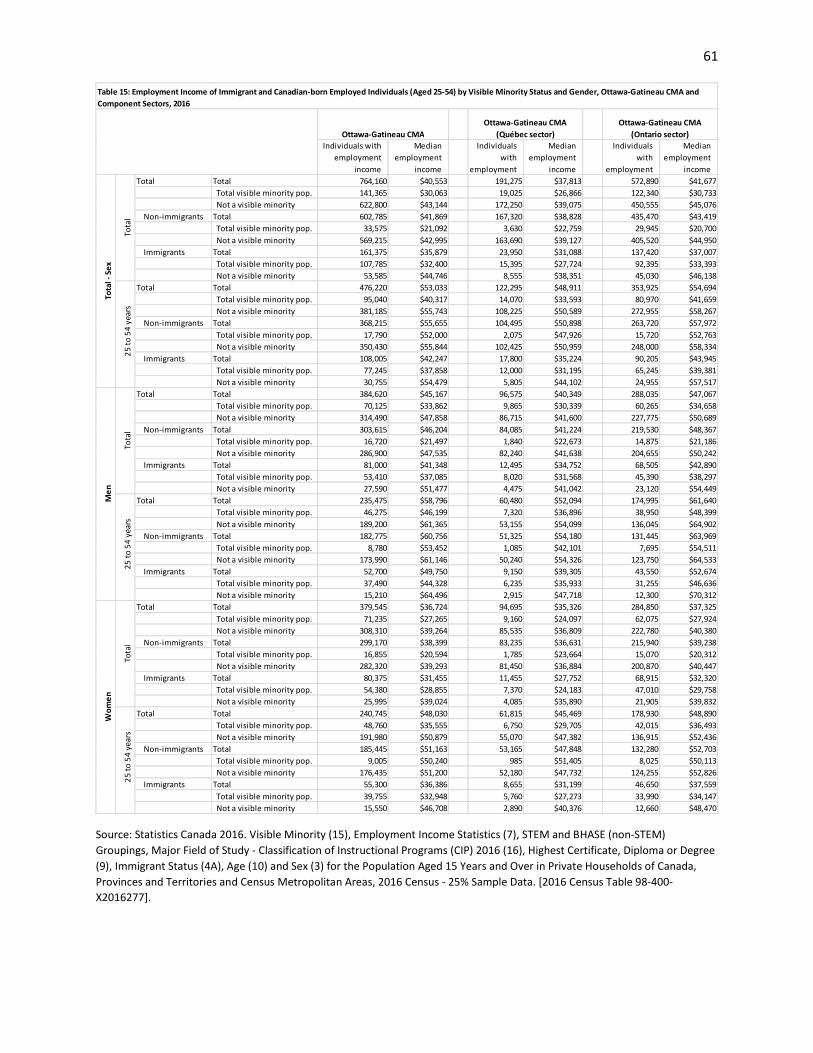
61
Source: Statistics Canada 2016. Visible Minority (15), Employment Income Statistics (7), STEM and BHASE (non-STEM) Groupings, Major Field of Study - Classification of Instructional Programs (CIP) 2016 (16), Highest Certificate, Diploma or Degree (9), Immigrant Status (4A), Age (10) and Sex (3) for the Population Aged 15 Years and Over in Private Households of Canada, Provinces and Territories and Census Metropolitan Areas, 2016 Census - 25% Sample Data. [2016 Census Table 98-400-X2016277].
Individuals with employment
income
Median employment
income
Individuals with
employment
Median employment
income
Individuals with
employment
Median employment
income Total Total 764,160 $40,553 191,275 $37,813 572,890 $41,677
Total visible minority pop. 141,365 $30,063 19,025 $26,866 122,340 $30,733 Not a visible minority 622,800 $43,144 172,250 $39,075 450,555 $45,076
Non-immigrants Total 602,785 $41,869 167,320 $38,828 435,470 $43,419 Total visible minority pop. 33,575 $21,092 3,630 $22,759 29,945 $20,700 Not a visible minority 569,215 $42,995 163,690 $39,127 405,520 $44,950
Immigrants Total 161,375 $35,879 23,950 $31,088 137,420 $37,007 Total visible minority pop. 107,785 $32,400 15,395 $27,724 92,395 $33,393 Not a visible minority 53,585 $44,746 8,555 $38,351 45,030 $46,138
Total Total 476,220 $53,033 122,295 $48,911 353,925 $54,694 Total visible minority pop. 95,040 $40,317 14,070 $33,593 80,970 $41,659 Not a visible minority 381,185 $55,743 108,225 $50,589 272,955 $58,267
Non-immigrants Total 368,215 $55,655 104,495 $50,898 263,720 $57,972 Total visible minority pop. 17,790 $52,000 2,075 $47,926 15,720 $52,763 Not a visible minority 350,430 $55,844 102,425 $50,959 248,000 $58,334
Immigrants Total 108,005 $42,247 17,800 $35,224 90,205 $43,945 Total visible minority pop. 77,245 $37,858 12,000 $31,195 65,245 $39,381 Not a visible minority 30,755 $54,479 5,805 $44,102 24,955 $57,517
Total Total 384,620 $45,167 96,575 $40,349 288,035 $47,067 Total visible minority pop. 70,125 $33,862 9,865 $30,339 60,265 $34,658 Not a visible minority 314,490 $47,858 86,715 $41,600 227,775 $50,689
Non-immigrants Total 303,615 $46,204 84,085 $41,224 219,530 $48,367 Total visible minority pop. 16,720 $21,497 1,840 $22,673 14,875 $21,186 Not a visible minority 286,900 $47,535 82,240 $41,638 204,655 $50,242
Immigrants Total 81,000 $41,348 12,495 $34,752 68,505 $42,890 Total visible minority pop. 53,410 $37,085 8,020 $31,568 45,390 $38,297 Not a visible minority 27,590 $51,477 4,475 $41,042 23,120 $54,449
Total Total 235,475 $58,796 60,480 $52,094 174,995 $61,640 Total visible minority pop. 46,275 $46,199 7,320 $36,896 38,950 $48,399 Not a visible minority 189,200 $61,365 53,155 $54,099 136,045 $64,902
Non-immigrants Total 182,775 $60,756 51,325 $54,180 131,445 $63,969 Total visible minority pop. 8,780 $53,452 1,085 $42,101 7,695 $54,511 Not a visible minority 173,990 $61,146 50,240 $54,326 123,750 $64,533
Immigrants Total 52,700 $49,750 9,150 $39,305 43,550 $52,674 Total visible minority pop. 37,490 $44,328 6,235 $35,933 31,255 $46,636 Not a visible minority 15,210 $64,496 2,915 $47,718 12,300 $70,312
Total Total 379,545 $36,724 94,695 $35,326 284,850 $37,325 Total visible minority pop. 71,235 $27,265 9,160 $24,097 62,075 $27,924 Not a visible minority 308,310 $39,264 85,535 $36,809 222,780 $40,380
Non-immigrants Total 299,170 $38,399 83,235 $36,631 215,940 $39,238 Total visible minority pop. 16,855 $20,594 1,785 $23,664 15,070 $20,312 Not a visible minority 282,320 $39,293 81,450 $36,884 200,870 $40,447
Immigrants Total 80,375 $31,455 11,455 $27,752 68,915 $32,320 Total visible minority pop. 54,380 $28,855 7,370 $24,183 47,010 $29,758 Not a visible minority 25,995 $39,024 4,085 $35,890 21,905 $39,832
Total Total 240,745 $48,030 61,815 $45,469 178,930 $48,890 Total visible minority pop. 48,760 $35,555 6,750 $29,705 42,015 $36,493 Not a visible minority 191,980 $50,879 55,070 $47,382 136,915 $52,436
Non-immigrants Total 185,445 $51,163 53,165 $47,848 132,280 $52,703 Total visible minority pop. 9,005 $50,240 985 $51,405 8,025 $50,113 Not a visible minority 176,435 $51,200 52,180 $47,732 124,255 $52,826
Immigrants Total 55,300 $36,386 8,655 $31,199 46,650 $37,559 Total visible minority pop. 39,755 $32,948 5,760 $27,273 33,990 $34,147 Not a visible minority 15,550 $46,708 2,890 $40,376 12,660 $48,470
Wom
en
Ottawa-Gatineau CMAOttawa-Gatineau CMA
(Québec sector)To
tal
25
to 5
4 ye
ars
25
to 5
4 ye
ars
Ottawa-Gatineau CMA (Ontario sector)
Tota
l - S
exM
en
Table 15: Employment Income of Immigrant and Canadian-born Employed Individuals (Aged 25-54) by Visible Minority Status and Gender, Ottawa-Gatineau CMA and Component Sectors, 2016
Tota
l 2
5 to
54
year
sTo
tal

62
Source: Statistics Canada 2016. Visible Minority (15), Employment Income Statistics (7), STEM and BHASE (non-STEM) Groupings, Major Field of Study - Classification of Instructional Programs (CIP) 2016 (16), Highest Certificate, Diploma or Degree (9), Immigrant Status (4A), Age (10) and Sex (3) for the Population Aged 15 Years and Over in Private Households of Canada, Provinces and Territories and Census Metropolitan Areas, 2016 Census - 25% Sample Data. [2016 Census Table 98-400-X2016277].
Individuals with employ.
Income
Median employment
inc.
Individuals with employ.
Income
Median employment
inc.
Individuals with employ.
Income
Median employment
inc.Total Total population 108,005 $42,247 17,800 $35,224 90,205 $43,945
Total visible minority pop. 77,245 $37,858 12,000 $31,195 65,245 $39,381 South Asian 11,085 $47,414 210 $25,284 10,875 $47,915 Chinese 11,770 $59,765 725 $37,143 11,045 $62,069 Black 20,050 $33,234 5,300 $31,156 14,755 $34,157 Arab 12,195 $30,674 2,755 $28,676 9,430 $31,543 Not a visible minority 30,755 $54,479 5,805 $44,102 24,955 $57,517
Secondary (high) school diploma Total population 15,060 $28,189 2,240 $27,086 12,815 $28,608 Total visible minority pop. 11,115 $25,557 1,445 $24,367 9,670 $25,885 South Asian 1,160 $25,303 45 $21,954 1,115 $25,724 Chinese 895 $25,832 65 $15,518 835 $26,521 Black 3,410 $24,448 620 $23,045 2,790 $24,963 Arab 1,680 $20,430 335 $23,024 1,345 $20,261 Not a visible minority 3,945 $37,919 800 $32,903 3,145 $39,418
College, CEGEP or other non-university certificate Total population 19,905 $37,772 3,055 $33,220 16,840 $38,734
Total visible minority pop. 14,130 $34,592 2,035 $30,052 12,100 $35,652 South Asian 1,435 $42,008 40 $28,784 1,395 $42,244 Chinese 1,095 $35,364 55 $19,158 1,040 $36,127 Black 5,010 $33,932 930 $28,823 4,080 $35,818 Arab 2,115 $29,991 460 $31,145 1,655 $28,925 Not a visible minority 5,770 $44,729 1,020 $40,350 4,745 $45,567
University cert. at bachelor level or above Total population 58,375 $59,319 9,060 $47,089 49,310 $62,605
Total visible minority pop. 40,650 $54,207 6,175 $42,104 34,475 $57,354 South Asian 7,625 $59,197 105 $30,931 7,520 $59,547 Chinese 8,850 $73,704 550 $42,207 8,305 $75,438 Black 7,985 $46,879 2,735 $42,270 5,245 $49,679 Arab 6,230 $45,783 1,380 $37,126 4,850 $47,314 Not a visible minority 17,725 $71,042 2,885 $57,545 14,840 $74,816
Total Total population 52,700 $49,750 9,150 $39,305 43,550 $52,674 Total visible minority pop. 37,490 $44,328 6,235 $35,933 31,255 $46,636 South Asian 5,820 $61,133 115 $25,330 5,700 $62,934 Chinese 5,390 $73,957 340 $36,814 5,050 $76,501 Black 9,210 $36,477 2,730 $36,813 6,475 $36,374 Arab 7,245 $35,858 1,630 $33,808 5,615 $36,889 Not a visible minority 15,210 $64,496 2,915 $47,718 12,300 $70,312
Secondary (high) school diploma Total population 7,970 $31,817 1,185 $30,478 6,785 $32,091 Total visible minority pop. 5,875 $28,709 780 $26,455 5,095 $29,010 South Asian 590 $33,983 30 $0 565 $34,587 Chinese 405 $29,893 35 $0 375 $30,378 Black 1,895 $27,082 385 $26,547 1,510 $27,799 Arab 1,030 $22,632 165 $24,912 870 $22,396 Not a visible minority 2,095 $42,709 405 $35,055 1,690 $44,100
College, CEGEP or other non-university certificate Total population 8,375 $44,375 1,425 $37,395 6,955 $45,873
Total visible minority pop. 5,825 $40,531 955 $34,254 4,870 $42,089 South Asian 665 $52,886 20 $0 645 $52,880 Chinese 315 $45,277 25 $0 295 $45,792 Black 1,780 $34,542 390 $31,662 1,395 $36,785 Arab 1,140 $37,753 265 $38,264 875 $37,627 Not a visible minority 2,550 $53,851 465 $42,358 2,085 $56,000
University cert. at bachelor level or above Total population 28,930 $71,370 4,720 $52,394 24,215 $76,535
Total visible minority pop. 20,335 $65,565 3,330 $47,286 17,005 $70,482 South Asian 4,130 $74,188 50 $36,405 4,085 $74,700 Chinese 4,305 $82,336 260 $40,235 4,050 $85,126 Black 4,015 $49,844 1,530 $46,640 2,485 $51,710 Arab 3,690 $51,713 850 $44,332 2,845 $56,358 Not a visible minority 8,595 $83,950 1,385 $63,798 7,205 $88,297
Total Total population 55,300 $36,386 8,655 $31,199 46,650 $37,559 Total visible minority pop. 39,755 $32,948 5,760 $27,273 33,990 $34,147 South Asian 5,270 $34,329 95 $25,107 5,175 $34,550 Chinese 6,380 $50,034 385 $38,043 5,995 $51,006 Black 10,840 $30,580 2,565 $26,218 8,280 $32,101 Arab 4,945 $25,672 1,130 $24,711 3,815 $26,309 Not a visible minority 15,550 $46,708 2,890 $40,376 12,660 $48,470
Secondary (high) school diploma Total population 7,090 $25,053 1,060 $24,621 6,030 $25,080 Total visible minority pop. 5,240 $22,947 665 $21,393 4,570 $23,148 South Asian 570 $20,249 15 $0 555 $19,010 Chinese 495 $23,463 35 $27,119 460 $23,224 Black 1,515 $20,947 230 $18,194 1,285 $21,751 Arab 650 $17,973 170 $22,934 480 $17,910 Not a visible minority 1,850 $32,866 395 $30,498 1,455 $33,597
College, CEGEP or other non-university certificate Total population 11,530 $33,745 1,635 $30,210 9,890 $34,389
Total visible minority pop. 8,310 $31,408 1,080 $26,316 7,230 $32,166 South Asian 770 $32,062 25 $0 750 $32,616 Chinese 775 $31,700 25 $0 740 $33,102 Black 3,230 $33,328 545 $26,945 2,690 $35,332 Arab 975 $24,495 195 $28,287 780 $21,574 Not a visible minority 3,215 $39,723 560 $38,634 2,665 $40,015
University cert. at bachelor level or above Total population 29,440 $49,549 4,340 $40,907 25,095 $51,007
Total visible minority pop. 20,310 $45,258 2,850 $35,524 17,465 $47,081 South Asian 3,495 $42,843 60 $30,909 3,435 $43,050 Chinese 4,540 $64,782 290 $43,240 4,255 $65,840 Black 3,970 $42,766 1,205 $32,333 2,765 $47,010 Arab 2,535 $37,266 535 $30,246 2,000 $40,039 Not a visible minority 9,135 $58,911 1,500 $50,857 7,630 $60,614
Table16: Median Employment Income of Visible Minority Groups by Gender and Educational Attainment, Aged 25 to 54, Ottawa-Gatineau CMA & Component Sectors, 2016
Ottawa-Gatineau CMAOttawa-Gatineau CMA
(Québec Sector)Ottawa-Gatineau CMA
(Ontario Sector)To
tal
Men
Wom
en
25 to
54
Tota
l Age
25 to
54

63
Source: Statistics Canada 2016. Visible Minority (15), Employment Income Statistics (7), STEM and BHASE (non-STEM) Groupings, Major Field of Study - Classification of Instructional Programs (CIP) 2016 (16), Highest Certificate, Diploma or Degree (9), Immigrant Status (4A), Age (10) and Sex (3) for the Population Aged 15 Years and Over in Private Households of Canada, Provinces and Territories and Census Metropolitan Areas, 2016 Census - 25% Sample Data. [2016 Census Table 98-400-X2016277].
Individuals with employ.
Income
Median employment
inc.
Individuals with employ.
Income
Median employment
inc.
Individuals with employ.
Income
Median employment
inc. Non-immigrants Total Total 54,720 $78,709 11,565 $73,021 43,160 $80,501
Total visible minority pop. 3,560 $68,820 245 $63,440 3,315 $70,009 South Asian 725 $73,710 35 $69,298 690 $73,810 Chinese 1,065 $74,909 20 $0 1,045 $74,997 Black 545 $62,723 90 $64,741 460 $60,464 Arab 370 $57,964 45 $64,384 325 $57,844 Not a visible minority 51,165 $79,463 11,320 $73,414 39,845 $81,108
University degree at bachelor level or above Total 31,565 $87,108 4,895 $84,479 26,670 $87,526
Total visible minority pop. 2,650 $73,567 160 $58,459 2,490 $74,378 South Asian 605 $77,969 25 $0 575 $79,365 Chinese 905 $76,367 10 $0 895 $76,381 Black 255 $74,833 35 $66,943 220 $79,955 Arab 210 $57,894 35 $57,070 175 $57,911 Not a visible minority 28,915 $88,405 4,735 $85,294 24,180 $89,186
Immigrants Total Total 29,160 $69,986 3,370 $50,078 25,790 $72,870 Total visible minority pop. 20,810 $65,180 2,275 $43,343 18,540 $68,478 South Asian 4,025 $73,491 45 $58,984 3,980 $73,850 Chinese 5,680 $81,020 280 $40,957 5,405 $81,294 Black 2,815 $47,210 785 $40,093 2,025 $49,502 Arab 3,165 $48,220 605 $43,736 2,560 $48,744 Not a visible minority 8,345 $79,986 1,095 $63,879 7,250 $82,472
University degree at bachelor level or above Total 22,995 $76,525 2,485 $53,658 20,510 $78,942
Total visible minority pop. 16,445 $72,698 1,705 $50,004 14,740 $75,378 South Asian 3,490 $76,379 30 $0 3,460 $76,781 Chinese 5,275 $81,460 265 $43,238 5,010 $82,462 Black 1,775 $53,083 560 $50,414 1,220 $55,181 Arab 2,460 $52,272 470 $44,225 1,990 $56,333 Not a visible minority 6,555 $85,541 780 $69,269 5,770 $87,948
Non-immigrants Total Total 38,655 $81,694 8,445 $75,453 30,210 $83,833 Total visible minority pop. 2,290 $70,180 145 $64,311 2,140 $71,215 South Asian 465 $75,837 10 $0 450 $75,852 Chinese 675 $75,258 15 $0 660 $75,277 Black 365 $59,539 70 $67,018 300 $58,395 Arab 255 $58,040 20 $0 235 $56,249 Not a visible minority 36,365 $82,177 8,300 $75,634 28,065 $84,865
University degree at bachelor level or above Total 20,335 $94,728 3,195 $91,337 17,135 $95,169
Total visible minority pop. 1,570 $76,230 80 $64,363 1,490 $77,586 South Asian 370 $79,840 10 $0 360 $80,211 Chinese 560 $77,739 10 $0 550 $77,760 Black 135 $79,271 30 $68,942 110 $94,021 Arab 110 $57,952 10 $0 100 $52,201 Not a visible minority 18,765 $95,831 3,120 $92,341 15,650 $96,336
Immigrants Total Total 19,555 $75,053 2,385 $51,756 17,170 $78,458 Total visible minority pop. 13,860 $69,305 1,635 $44,766 12,225 $73,219 South Asian 2,770 $78,633 30 $0 2,745 $78,889 Chinese 3,390 $86,336 165 $40,185 3,230 $87,761 Black 2,030 $49,117 590 $40,345 1,440 $52,455 Arab 2,355 $51,572 460 $47,379 1,905 $52,966 Not a visible minority 5,695 $86,358 750 $68,888 4,945 $89,874
University degree at bachelor level or above Total 15,180 $81,704 1,720 $55,161 13,455 $84,930
Total visible minority pop. 10,850 $77,881 1,190 $50,079 9,665 $81,079 South Asian 2,395 $81,542 10 $0 2,380 $81,709 Chinese 3,220 $87,028 165 $40,185 3,060 $88,294 Black 1,290 $55,781 415 $50,972 875 $59,222 Arab 1,795 $56,472 345 $46,378 1,450 $64,114 Not a visible minority 4,325 $94,977 530 $70,666 3,795 $97,304
Non-immigrants Total Total 16,065 $69,275 3,120 $64,358 12,950 $70,675 Total visible minority pop. 1,270 $67,608 100 $58,558 1,170 $68,746 South Asian 260 $70,386 20 $0 240 $70,550 Chinese 390 $74,104 10 $0 390 $74,191 Black 175 $67,453 15 $0 160 $70,690 Arab 110 $57,756 20 $0 90 $64,319 Not a visible minority 14,795 $69,452 3,015 $64,518 11,780 $71,221
University degree at bachelor level or above Total 11,235 $75,177 1,700 $73,843 9,535 $75,545
Total visible minority pop. 1,085 $68,738 80 $57,078 1,000 $70,216 South Asian 230 $73,565 15 $0 215 $73,536 Chinese 345 $74,218 0 $0 345 $74,218 Black 115 $71,786 0 $0 110 $74,437 Arab 95 $57,780 25 $0 75 $64,339 Not a visible minority 10,155 $76,140 1,615 $74,699 8,530 $76,448
Immigrants Total Total 9,605 $59,537 985 $45,604 8,615 $61,662 Total visible minority pop. 6,950 $57,700 635 $42,036 6,310 $59,768 South Asian 1,250 $62,955 20 $0 1,235 $63,384 Chinese 2,285 $72,441 115 $43,241 2,175 $73,366 Black 785 $41,743 195 $39,441 590 $41,987 Arab 810 $36,362 150 $29,487 660 $43,338 Not a visible minority 2,655 $65,123 350 $48,770 2,305 $67,802
University degree at bachelor level or above Total 7,820 $65,031 765 $51,253 7,050 $67,157
Total visible minority pop. 5,590 $63,495 510 $49,530 5,080 $65,098 South Asian 1,090 $64,739 15 $0 1,075 $64,899 Chinese 2,055 $74,504 105 $45,304 1,950 $75,465 Black 480 $42,519 140 $50,123 345 $42,030 Arab 665 $44,123 130 $44,154 540 $43,995 Not a visible minority 2,225 $68,994 250 $53,204 1,970 $70,045
Men
Wom
en
25
to 5
4 ye
ars
25
to 5
4 ye
ars
25
to 5
4 ye
ars
Ottawa-Gatineau CMAOttawa-Gatineau CMA
(Québec Sector)Ottawa-Gatineau CMA
(Ontario Sector)
Table 17: Median Employment Income of Visible Minority Groups, Individuals with a University Degree in a STEM Discipline by Gender, Aged 25 to 54, Ottawa-Gatineau CMA & Component Sectors, 2016
Tota
l - S
ex