Embed Size (px)
Citation preview

WaTEM / SEDEM version 2006
Manual
B. Notebaert, B. Vaes, G. Verstraeten en G. Govers
Programming: K. Van Oost, A. Van Rompaey, G. Verstraeten, B. Notebaert & B. Vaes
K.U. Leuven, Physical and Regional Geography Research Group
2006

1 Table of contents 1 Table of contents ..................................................................................................................... 2
2 Disclaimer ............................................................................................................................... 4
3 Referring ................................................................................................................................. 4
4 Introduction ............................................................................................................................. 4
5 Previous WaTEM / SEDEM versions..................................................................................... 4
5.1 Sedem 1.3 ........................................................................................................................ 5
5.2 WaTEM / SEDEM 2004 ................................................................................................. 5
5.3 WaTEM / SEDEM for metals ......................................................................................... 5
5.4 WaTEM / SEDEM 2005 ................................................................................................. 5
6 The algorithms ........................................................................................................................ 6
6.1 Water erosion .................................................................................................................. 6
6.1.1 R-factor or rain erosivity factor .................................................................................. 6
6.1.2 K-factor or soil erodibility factor ................................................................................ 6
6.1.3 LS-factor or topographical factor ................................................................................ 7
6.1.4 C-factor or crop erosivity factor ................................................................................. 8
6.1.5 P-factor or soil control factor ...................................................................................... 8
6.2 Sediment transport .......................................................................................................... 8
6.3 Tillage erosion ................................................................................................................ 9
7 Installation............................................................................................................................. 11
8 Data input .............................................................................................................................. 11
8.1 Introduction ................................................................................................................... 11
8.2 GIS layers...................................................................................................................... 11
8.3 Marking your study area and raster files....................................................................... 11
8.4 The menu and tool bar .................................................................................................. 12
8.5 Using WaTEM / SEDEM ............................................................................................. 13
8.5.1 Input 1 ....................................................................................................................... 13
8.5.2 Input 2 ....................................................................................................................... 13
8.5.2.1 Sedem 1.3 .......................................................................................................... 13
8.5.2.2 WaTEM / SEDEM ............................................................................................ 13
8.5.3 Input 3 ....................................................................................................................... 14
8.5.3.1 Sedem 1.3 .......................................................................................................... 14
8.5.3.2 WaTEM / SEDEM ............................................................................................ 15
8.5.4 Extra options ............................................................................................................. 15
8.5.5 Tab sheets metals and nutrients ................................................................................ 17
8.5.6 Calculate ................................................................................................................... 17
9 Output ................................................................................................................................... 18
9.1 Tab sheets Results and Results Metals ......................................................................... 18
9.2 Output maps .................................................................................................................. 18
9.3 Other files...................................................................................................................... 19
10 Use on windows 7 ................................................................................................................. 20
11 Frequently Asked Questions ................................................................................................. 21
12 Articles and used versions .................................................................................................... 23
12.1 Version history .............................................................................................................. 23
12.2 Publication list .............................................................................................................. 24

Bibliography ................................................................................................................................. 30
2 Disclaimer The authors and the Physical and Regional Geography Research Group accept no responsibility
and excludes all liability whatsoever in respect of any person's use or reliance on the
WaTEM/SEDEM model and/or the WaTEM/SEDEM help documentation.
3 Referring When using WaTEM/SEDEM please refer to:
* Van Oost K, Govers G, & Desmet PJJ, 2000. Evaluating the effects of changes in landscape structure on soil erosion by water and tillage. Landscape Ecology 15, 577-589. * Van Rompaey A, Verstraeten G, Van Oost K, Govers G & Poesen J, 2001. Modelling mean annual sediment yield using a distributed approach. Earth Surface Processes and Landforms 26 (11), 1221-1236. * Verstraeten G, Van Oost K, Van Rompaey A, Poesen J & Govers G, 2002. Evaluating an integrated approach to catchment management to reduce soil loss and sediment pollution through modelling. Soil Use and Management, 18, 386-394.
4 Introduction This manual is written for use of WaTEM / SEDEM version 2006. This guide will help you in using the program and give more insight on the various aspects of the calculation procedure. WaTEM/SEDEM version 2006 is actually a combination of the different WaTEM/SEDEM versions which were produced at the Physical and Regional Geography Research Group of the KU Leuven. In a first paragraph these different version are shortly described. Next, the used algorithms and their influence on the model are explained. The following paragraph explains the use of the model and how users can adapt the different factors. This is followed by a description of the different model output. The final chapter contains a FAQ. It’s very important that, before using this program, you have read and understood the chapters about data input and data output. For common problems we recommend that you read the FAQ first.
5 Previous WaTEM / SEDEM versions Currently, there are 4 versions available:
• Sedem 1.3
• WaTEM / SEDEM 2004
• WaTEM / SEDEM for metals
• WaTEM / SEDEM 2005
By default, WaTEM / SEDEM 2005 is selected because this is the latest version available. In the next few paragraphs we will briefly review these versions and their main differences.
5.1 Sedem 1.3
SEDEM stands for Sediment Delivery model (Van Rompay et al. 2001). It includes single flow, proportional transport capacity (Tc) calculations.
5.2 WaTEM / SEDEM 2004
This version is based on WaTEM (Water and Tillage Erosion Model, Van Oost et al. 2000) and SEDEM and in turn is the main program where all the following versions are derived from. This version calculates water and tillage erosion, including sediment delivery to rivers, using multiple flow proportional Tc calculations.
5.3 WaTEM / SEDEM for metals
The original WaTEM / SEDEM 2004 version is expanded with an extra module that will modulate how metals and phosphorus, together with the sedimentary deposit, will be eroded en transported. WaTEM/SEDEM for metals has four modules: the first two calculate the water-erosion according to RUSLE, and the simultaneous metal erosion. A third module calculates the sediment routing towards rivers and the deposition of sediment. The fourth routes the metals with the sediment and takes into account an enrichment factor when there is deposition.
The program will calculate the amount of inflow, outflow and amount of sediment and metals per pixel. This is done for all the pixels until the sediment and metal reaches a river. Finally the program calculates how much of each metal will end up in a certain river segment.
5.4 WaTEM / SEDEM 2005
This is basically the same version as WaTEM / SEDEM for metals, but includes multiple flow, non-proportional Tc calculations (Tc in function of S & A).

6 The algorithms We will give insight in the various factors needed for calculations, and how they are implemented in the program.
6.1 Water erosion
The WATEM / SEDEM model was created at the Laboratory for Experimental Geomorphology (K.U. Leuven, Belgium). Within the WaTEM / SEDEM model, soil loss is based on the RUSLE-model (Revised Universal Soil Loss Equation; Renard et al., 1997):
(1)
Where:
• A: average amount of soil loss caused by gully erosion (tons / ha.year)
• R: rain erosivity factor (MJ.mm / ha.year)
• K: soil erodibility factor (tons h / MJ.mm)
• LS: topographical slope and length factor
• C: crop erosivity factor
• P: erosion control factor These parameters will be discussed in the following paragraphs.
6.1.1 R-factor or rain erosivity factor
The R-factor represents the long term value of rain erosivity on a yearly basis. For small area’s (a few km²) we assume that R is uniform for the whole study area so you can use only one value for R. For larger areas, spatial variability in rainfall erosivity may be more important, however. If this is the case, this can be compensated by multiplying a rainfall erosivity map with the soil erodibility map (K-factor) and use this map as input for the K-factor. The value of R then needs to be 1.
6.1.2 K-factor or soil erodibility factor
The K-factor is dependant on several factors like texture, organic matter content and moistness. Mostly, only the texture is used for K-factor calculations because of the lack of data. Van Rompay et al. (2000) calculated the K-factor for Flanders by means of texture classes of soil erosion maps using the formula (Declercq en Poesen 1992):
(2) Where Dg = geometrical mean particle diameter (mm) (Shirazi en Boersma 1984):
(3) Other formulas for the K-factor are available in literature (e.g. Wischmeier et al. 1971, Declercq en Poesen 1992, Foster 2005).
( )[ ]5.0**ln 1)( −+∑=iii ddf
emmDg

The K-factor has large temporal variations, so the values always represent a long term average (Verstraeten et al. 2001).
6.1.3 LS-factor or topographical factor
This factor is a representation of spatial variability of soil erosion caused by topography. The L-factor is the measure for slope length. The S-factor is proportional to the local slope. WaTEM/SEDEM (unlike RUSLE) works with a 2D approach of the topographical factor. The algorithm (Desmet en Govers 1996) uses a DEM (Digital Elevation Model) and a parcel map and was adjusted by Takken et al. (2001) so that tillage direction is taken into account. The location of roads is also included: water on a road will always follow that road to the lowest point. Both topographical parameters are derived from a DEM (Verstraeten et al. 2001). The L-factor within LS stands for the total upslope slope length of a pixel and is a way of dealing with water runoff. The parcel trap efficiency or PTEF value refers to the way that for each land use class the pixel's own contribution to the upstream contributing area is reduced. For instance, if for forest pixels, a value of 75 per cent is given, every pixel of 20 by 20 meter will only contribute 100 m² to the downstream pixel, instead of 400 m². In fact, this means that for a whole forest or pasture, less runoff will be simulated thereby decreasing downstream LS values, and thus, erosion rates. Total upstream contributing area from upstream the forest will be delivered entirely through the forest to another land use class. Values for PTEF can be chosen for cropland, pasture and forest separately. Alternatively, a whole PTEF map can be given as well. The parcel connectivity refers to the way the total upstream contributing area is reduced at a parcel border. Two categories of field boundaries are acknowledged: the transition from any type of land use to cropland and the transition from any type of land use to forest or pasture. If, for instance, the value 'to forest/pasture' equals 75 per cent, and the total contributing area of the pixel upstream the forest border is 300 ha, the contributing area of the first pixel in the forest will only by 75 ha. In this way, forests or pastures also trap runoff from upstream, thereby again reducing downstream LS and erosion rates. Several LS algorithms are incorporated in WaTEM/SEDEM:
1. Wischmeier and Smith (1978): (4)
2. McCool et al. (1987, 1989), also used in RUSLE (1993): S(i,j) = 10.8 * sin q i,j + 0.03 if cot Øi,j < 9% S(i,j) = 16.8 * sin q i,j - 0.5 if cot Øi,j > 9% If the slope length is less than 4 meter:
(5)
3. Govers (1991):
R
RSLR
C
n
i
ii∑== 1
(6)
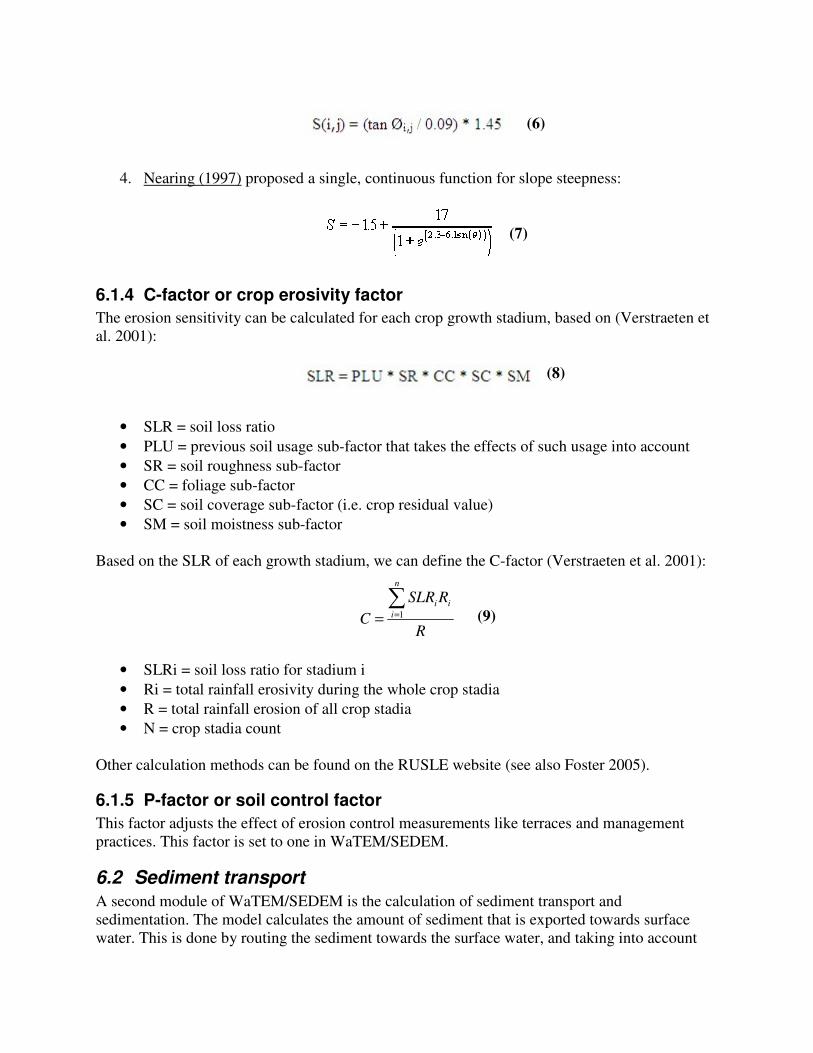
4. Nearing (1997) proposed a single, continuous function for slope steepness:
(7)
6.1.4 C-factor or crop erosivity factor
The erosion sensitivity can be calculated for each crop growth stadium, based on (Verstraeten et al. 2001): (8)
• SLR = soil loss ratio
• PLU = previous soil usage sub-factor that takes the effects of such usage into account
• SR = soil roughness sub-factor
• CC = foliage sub-factor
• SC = soil coverage sub-factor (i.e. crop residual value)
• SM = soil moistness sub-factor Based on the SLR of each growth stadium, we can define the C-factor (Verstraeten et al. 2001):
(9)
• SLRi = soil loss ratio for stadium i
• Ri = total rainfall erosivity during the whole crop stadia
• R = total rainfall erosion of all crop stadia
• N = crop stadia count Other calculation methods can be found on the RUSLE website (see also Foster 2005).
6.1.5 P-factor or soil control factor
This factor adjusts the effect of erosion control measurements like terraces and management practices. This factor is set to one in WaTEM/SEDEM.
6.2 Sediment transport
A second module of WaTEM/SEDEM is the calculation of sediment transport and sedimentation. The model calculates the amount of sediment that is exported towards surface water. This is done by routing the sediment towards the surface water, and taking into account
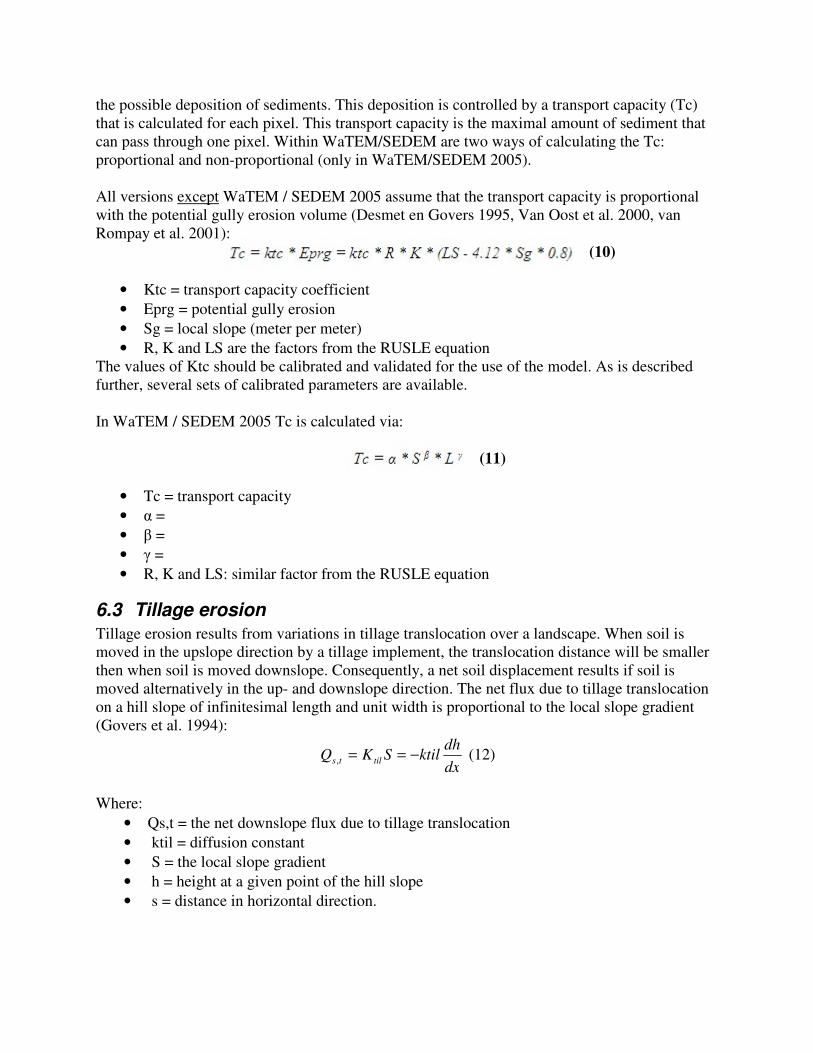
the possible deposition of sediments. This deposition is controlled by a transport capacity (Tc) that is calculated for each pixel. This transport capacity is the maximal amount of sediment that can pass through one pixel. Within WaTEM/SEDEM are two ways of calculating the Tc: proportional and non-proportional (only in WaTEM/SEDEM 2005). All versions except WaTEM / SEDEM 2005 assume that the transport capacity is proportional with the potential gully erosion volume (Desmet en Govers 1995, Van Oost et al. 2000, van Rompay et al. 2001):
(10)
• Ktc = transport capacity coefficient
• Eprg = potential gully erosion
• Sg = local slope (meter per meter)
• R, K and LS are the factors from the RUSLE equation The values of Ktc should be calibrated and validated for the use of the model. As is described further, several sets of calibrated parameters are available. In WaTEM / SEDEM 2005 Tc is calculated via:
(11)
• Tc = transport capacity
• α =
• β =
• γ =
• R, K and LS: similar factor from the RUSLE equation
6.3 Tillage erosion
Tillage erosion results from variations in tillage translocation over a landscape. When soil is moved in the upslope direction by a tillage implement, the translocation distance will be smaller then when soil is moved downslope. Consequently, a net soil displacement results if soil is moved alternatively in the up- and downslope direction. The net flux due to tillage translocation on a hill slope of infinitesimal length and unit width is proportional to the local slope gradient (Govers et al. 1994):
dx
dhktilSKQ tilts −==, (12)
Where:
• Qs,t = the net downslope flux due to tillage translocation
• ktil = diffusion constant
• S = the local slope gradient
• h = height at a given point of the hill slope
• s = distance in horizontal direction.

Thus, tillage may be modelled as a diffusion process. Equation (12) implies that tillage erosion is controlled by the change in slope gradient, not by the slope gradient itself, so that erosion takes place on convexities while soil accumulation occurs in concavities. The intensity of the process is controlled by the value of a single constant, ktil (the diffusion constant) which need to be given by the user. The model assumes that all sediment translocation occurs in the direction of the steepest slope. At present, the effect of more complex tillage patterns like slantwise ploughing or unidirectional tillage operations can not be simulated. Values for ktil are determined for various agricultural implements and may be used to simulate the effects of tillage erosion. The user can define the tillage transport coefficient for each tillage implementation or for a set of tillage operations. In the latter case, the tillage transport coefficient will be the sum of the coefficients of each individual operation.

7 Installation WaTEM/SEDEM comes with two files:
• Watemsedem.exe: main executable
• Watemsedem.ini: parameter file The .ini file should be placed under c:/windows for Windows XP users. Users of other windows versions should determine in which folder .ini files are stored (mostly c:/windows or c:/windowsNT). The .exe file can be saved on any place on the hard disk. Note for windows 7 users:
First test indicate that watem/sedem is running fine on windows 7, but the initialization file (watemsedem.ini) is not read properly. An additional comment is placed at the end of this manual explaining how to proceed.
8 Data input
8.1 Introduction
In this part we will guide you through the different input boxes and menus of WaTEM / SEDEM. It’s important that your files have the right data type, and that you follow the instructions in this manual very closely. Because there are several older versions integrated into WaTEM / SEDEM, it’s very likely that you don’t need to fill in all the boxes that are visible on your screen, but doing so will not directly affect calculations or final results.
8.2 GIS layers
WaTEM / SEDEM requires the input of various constants as well as several GIS-layers. This program uses Idrisi32 raster data (developed at Clark Labs, MA, USA). There are some conditions that must be met before starting:
• All the GIS-layers must cover the exact same area (identical rows and columns).
• All the maps also must have the same resolution, which must be mentioned in the metadata (.rdc file) of the Idrisi-raster file. It’s of critical importance to know that WaTEM / SEDEM is calibrated for a resolution of 20 by 20 meters. If you want to use different resolutions you will have to re-calibrate and re-validate the transport capacity (Van Rompay et al. (2001). Using different resolutions may also cause problems with the scale dependency of the LS calculations (see 6.1.3).
• The data type used in the GIS-layers has to be real, (or floating point) except for the parcel map, river map, K-factor, Ptef file and tillage direction file which must be integer.
8.3 Marking your study area and raster files
Study areas must be defined as topographical catchments to keep the error along the margin as low as possible. You can mark your study area by giving all the pixels outside the area a value of 0 (zero) in your parcel map.

Also make sure that the borders of your study area aren’t too close to the borders of your DEM raster image. Otherwise there will be errors in sedimentary export calculations. For most surfaces it suffices to keep 10-20 pixels distance between the two borders.
8.4 The menu and tool bar
In the toolbar, at the top of your screen, there’re several buttons you can use:
• Creates a new project
• Opens an existing project. By clicking on the little arrow you will get a list of the last 3 used projects
• Saves your current project. If you created a new project the program will ask for a name. Always save your project prior to calculations !
• For inserting a river routing file
• Used for creating a parcel map based on satellite images
• Enables calculate water erosion
• Enables calculate tillage erosion
• This will start your calculations. It is important to save your project before you start calculating !
• Provides help. This will lead you to our user manual on our webpage
• Push this button to exit the program
Table 1
In the menu bar you will have the following options:
• File o New Project o Open Project o Save o Save As… o List with the last 3 opened projects o Exit
• Options o Advanced User o Create Parcel map o River Routing
• Calculate o Start Calculations o Calculate water erosion
• Help o WaTEM / SEDEM Help o About
8.5 Using WaTEM / SEDEM
In the following paragraphs we will give an overview of the input and output tabs of WaTEM / SEDEM.
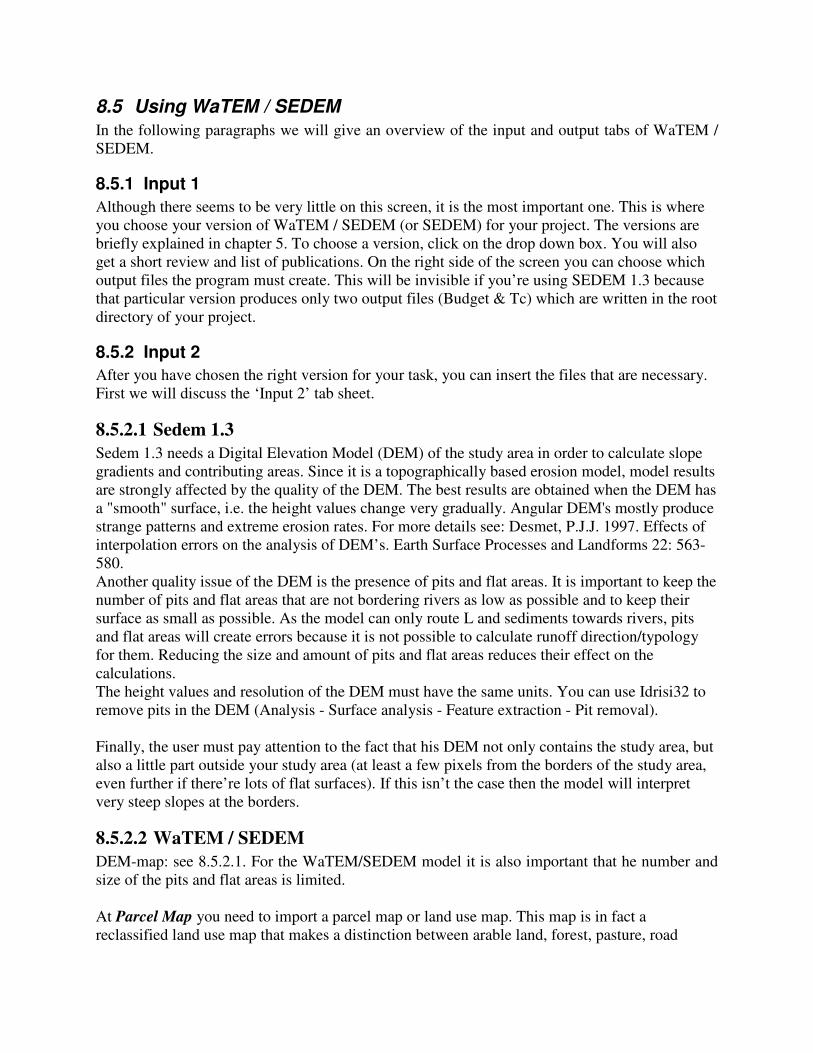
8.5.1 Input 1
Although there seems to be very little on this screen, it is the most important one. This is where you choose your version of WaTEM / SEDEM (or SEDEM) for your project. The versions are briefly explained in chapter 5. To choose a version, click on the drop down box. You will also get a short review and list of publications. On the right side of the screen you can choose which output files the program must create. This will be invisible if you’re using SEDEM 1.3 because that particular version produces only two output files (Budget & Tc) which are written in the root directory of your project.
8.5.2 Input 2
After you have chosen the right version for your task, you can insert the files that are necessary. First we will discuss the ‘Input 2’ tab sheet.
8.5.2.1 Sedem 1.3
Sedem 1.3 needs a Digital Elevation Model (DEM) of the study area in order to calculate slope gradients and contributing areas. Since it is a topographically based erosion model, model results are strongly affected by the quality of the DEM. The best results are obtained when the DEM has a "smooth" surface, i.e. the height values change very gradually. Angular DEM's mostly produce strange patterns and extreme erosion rates. For more details see: Desmet, P.J.J. 1997. Effects of interpolation errors on the analysis of DEM’s. Earth Surface Processes and Landforms 22: 563-580. Another quality issue of the DEM is the presence of pits and flat areas. It is important to keep the number of pits and flat areas that are not bordering rivers as low as possible and to keep their surface as small as possible. As the model can only route L and sediments towards rivers, pits and flat areas will create errors because it is not possible to calculate runoff direction/typology for them. Reducing the size and amount of pits and flat areas reduces their effect on the calculations. The height values and resolution of the DEM must have the same units. You can use Idrisi32 to remove pits in the DEM (Analysis - Surface analysis - Feature extraction - Pit removal). Finally, the user must pay attention to the fact that his DEM not only contains the study area, but also a little part outside your study area (at least a few pixels from the borders of the study area, even further if there’re lots of flat surfaces). If this isn’t the case then the model will interpret very steep slopes at the borders.
8.5.2.2 WaTEM / SEDEM
DEM-map: see 8.5.2.1. For the WaTEM/SEDEM model it is also important that he number and size of the pits and flat areas is limited. At Parcel Map you need to import a parcel map or land use map. This map is in fact a reclassified land use map that makes a distinction between arable land, forest, pasture, road
infrastructure and build-up areas, and rivers. Each of these land use categories has a different identifier:
• -2: road infrastructure and built-up area
• -1: rivers
• 0: outside the study area
• 1-n: fields under agriculture; the maximum number (n) indicates the number of fields. This value should be lower than 10 000
• 10 000: forest
• 20 000: pasture Each field thus has its own identifier. This makes it possible to incorporate the effect of field borders on runoff direction, runoff interception and sediment deposition. You have the opportunity to let WaTEM / SEDEM create a parcel map for you by clicking on
the button. You will then be presented with a form where you must enter all the necessary files (Satellite (DEM), Arable land, Forests, Pasture, Roads, Rivers and Catchment Area) and push “Create”. When the parcel map is created the program will ask for a filename. It is best to save this file in the same directory as all the other files you will be using. At River Routing you can provide an optional rivers file. If you leave this blank than the model will treat all rivers as one unit i.e. all sediment that reaches a river is summed. If not, then the program will calculate sediment export for different river segments. If you want to use a rivers
file you will also need to give an extra text (*.rou) file by clicking the button, just right of river routing. This file indicates the linkage between every river segment that has a different value on the river map, thereby representing the river topology. The river topology can be created with a vector-GIS program like ArcView. It is very important that the Idrisi identifiers in the raster image and the .txt file correspond with each other and that they start from 1, going up to the maximum number of arcs.
8.5.3 Input 3
Similar to the Input 2 tab, you will have slightly different layout depending on which version you choose. The only common files for all versions are the C-factor and Ponds files.
8.5.3.1 Sedem 1.3
The crop factor map displays the crop erosion factor of the RUSLE (C-factor) which is a parameter ranging from 0 (indicating no erosion is taking place under this crop) to 1 (i.e. the erosion compared to fallow conditions). The user has two options here: provide a separate C-factor map indicating the C-value for each individual pixel, or mean C-values for the main land use classes, i.e. cropland, forest and pasture. Sedem 1.3 also needs a ‘Landuse’ and a ‘RKLS’ map. The ‘landuse’ map (derived from satellite images e.g. Landsat TM) can be used and should follow the same classifications as the final parcel map although there will normally only be 1 identifier for all the arable land. This land use map is generally less accurate then the raster maps derived from vector data. If this isn’t the case,
the land use map can also be used as the parcel map directly, however, only when the land use map is limited to the study area, leaving the pixels outside this area with a value of 0. The Ponds map indicates the location of retention ponds and pools in the study area. The identifier of each pond should equal the sediment trap efficiency (%) of the pond. This is the percentage of the incoming sediment that is deposited within the pond or pool.
8.5.3.2 WaTEM / SEDEM
Crop factor: see 8.5.3.1 The Soil Erodibility Factor displays the soil erodibility factor of the RUSLE (K-factor) expressed in kg m-2 h MJ-1 mm-1. Soil erodibility can be calculated from the USLE nomograph or using empirical equations predicting the K-factor from the geometric mean particle diameter and organic matter content. For this factor you also can use a map, or one value for the whole study area. At the Ptef: Parcel input boxes you also have the opportunity to use a map or fixed values. With the latter you can use different values for arable land, forests and pasture. This factor’s values represent how much a given pixel contributes to water transport, compared with a referential base (plain arable land). If the value is zero than it means that this pixel contributes the same amount as the referential base. With a value of 75 it means the pixel contributes 75% less than the referential base. Standard values are zero for arable land and 75 for both forest and pasture. With the Parcel connectivity boxes one can give values for connectivity towards arable land parcels and both forest and pasture parcels. This connectivity represents to what extent water transport is stopped at the parcel border. Default values for parcel connectivity vary between 0 and 100. Ponds: see 8.5.3.1
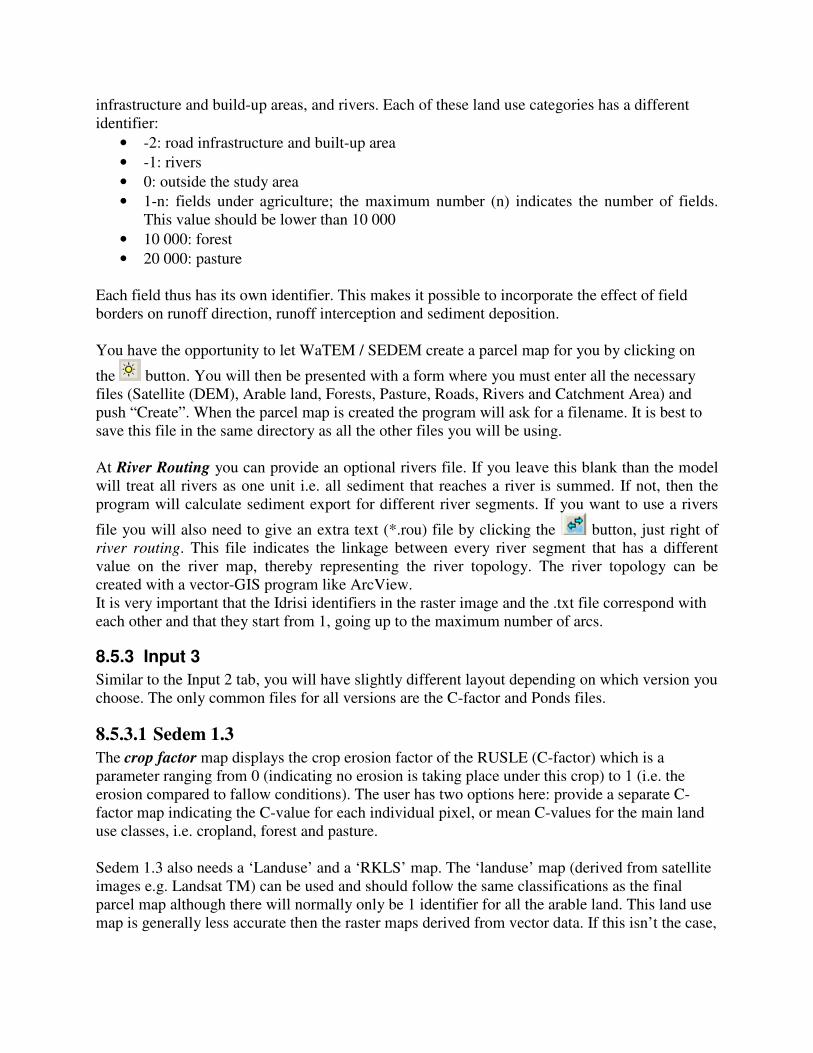
8.5.4 Extra options
To view the “Extra Options” you will have to check “Advanced user” in the Options menu first. This tab is only of use for WaTEM / SEDEM – versions. For now, these options are still visible when using Sedem 1.3, but none of the values are used in those calculations.
Picture 1
At the “Extra Options” tab you can first chose which LS algorithm you want to use (choice between Wischmeier Smith, McCool, Govers en Nearing). You can also select the nearing slope length exponent (Wischmeier Smith or McCool). If you want more information about LS, see paragraph 6.1.3. The option “calculate metal erosion1” can be checked if you want to calculate metal erosion. At output units you can select whether the output files are written in ton/ha or in height difference (mm) on the resulting map s. This option doesn’t affect metal erosion calculations or the measurement used on the maps.
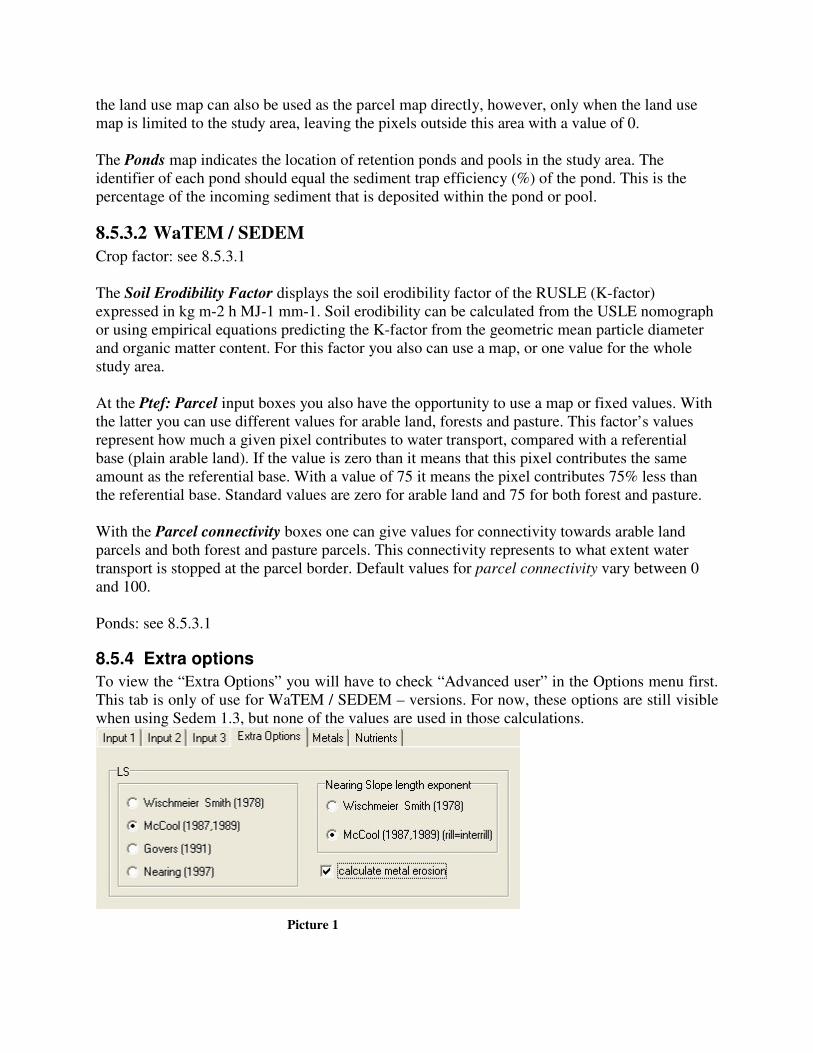
Picture 2
In the group box “Water” (Picture 2) we see an input box for the RUSLE rainfall erosivity parameter (R-factor). This needs to be given in MJ mm m-2 h-1, what means that the R-factor used in RUSLE needs to be divided by 10.000 (e.g. 870 becomes 0.087). The transport capacity is the maximum sediment mass that can be transported by the overland flow. If the sediment production is higher than this transport capacity, sediment will be deposited. Thus, the higher the transport capacity coefficient, the more sediment can be transported downslope. If you’re using a different grid resolution or you have changed the values for Ptef en parcel connectivity, than you need to re-calibrate and re-validate the model. In WaTEM / SEDEM, a threshold C-factor value needs to be given to indicate for which areas the high kTc needs to be used. This threshold is set at 0.1. Roads are given a very high kTc such that no sediment deposition is modelled on road surfaces. WaTEM / SEDEM 2005:
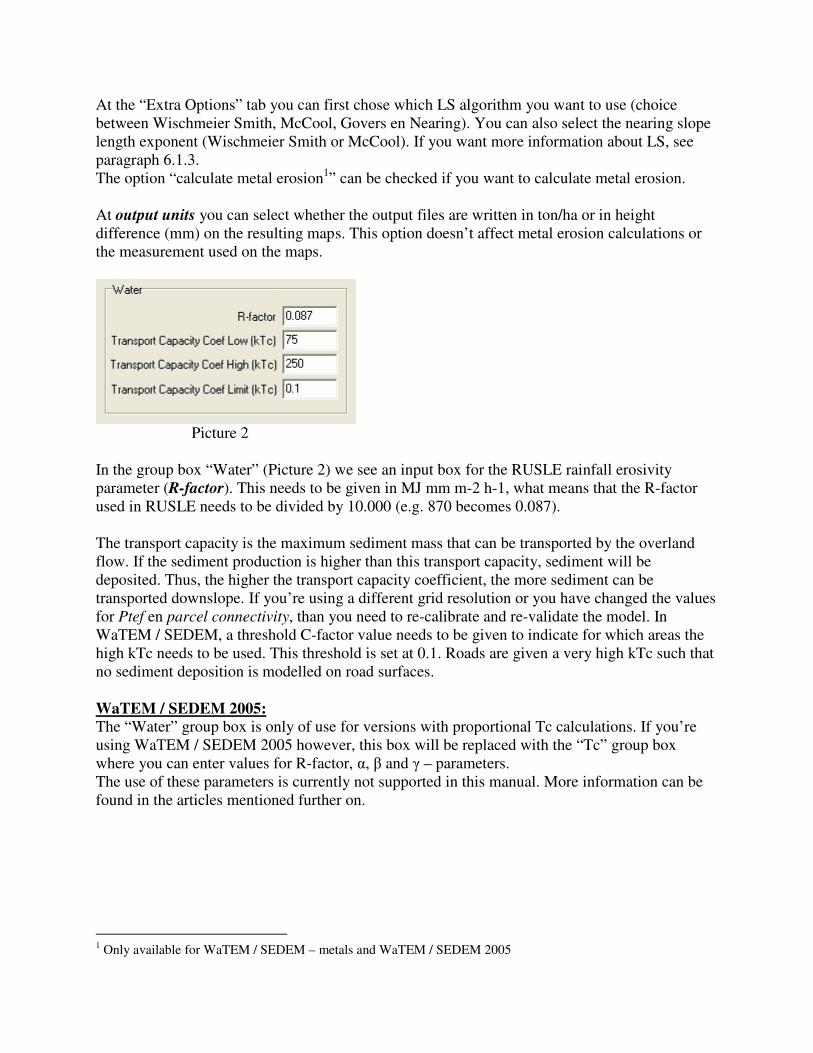
The “Water” group box is only of use for versions with proportional Tc calculations. If you’re using WaTEM / SEDEM 2005 however, this box will be replaced with the “Tc” group box where you can enter values for R-factor, α, β and γ – parameters. The use of these parameters is currently not supported in this manual. More information can be found in the articles mentioned further on.
1 Only available for WaTEM / SEDEM – metals and WaTEM / SEDEM 2005
Picture 3
8.5.5 Tab sheets metals and nutrients
These tabs are only used in WaTEM / SEDEM for metals & WaTEM / SEDEM 2005. Normally this tab is invisible, so you have to click on the “calculate metal erosion” checkbox, located on the Input 3 tab, first. On these tabs you can insert maps or values for 8 metals (Ar, Cd, Cs, Cu, Zn, Pb, Ni, Hg) and 1 nutrient (P). All values should be expressed in mg metal per kg dry soil, except for phosphorus, that should be expressed as mg phosphorus per 100 g dry soil. There’s also the possibility to give an enrichment value. This value expresses the enrichment of the metal concentration of the deposits according to the metal concentration of the sediment in transport before deposition occurs, e.g.: if the concentration of a metal in the sediment in transport just before deposition is 10g per kg soil, and an enrichment factor of 0.8 is used, than the concentration of that metal in the deposits will be 8g per kg soil. Typically the enrichment-value will be less then one.
8.5.6 Calculate
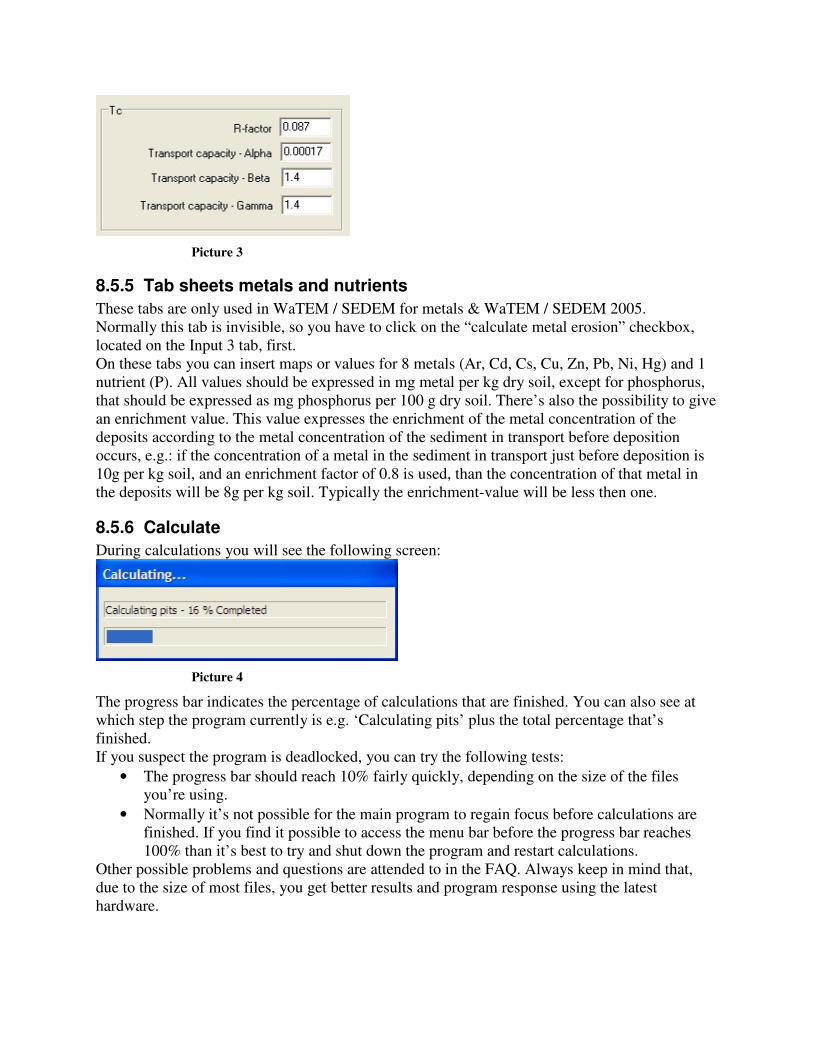
During calculations you will see the following screen:
Picture 4
The progress bar indicates the percentage of calculations that are finished. You can also see at which step the program currently is e.g. ‘Calculating pits’ plus the total percentage that’s finished. If you suspect the program is deadlocked, you can try the following tests:
• The progress bar should reach 10% fairly quickly, depending on the size of the files you’re using.
• Normally it’s not possible for the main program to regain focus before calculations are finished. If you find it possible to access the menu bar before the progress bar reaches 100% than it’s best to try and shut down the program and restart calculations.
Other possible problems and questions are attended to in the FAQ. Always keep in mind that, due to the size of most files, you get better results and program response using the latest hardware.
9 Output
9.1 Tab sheets Results and Results Metals
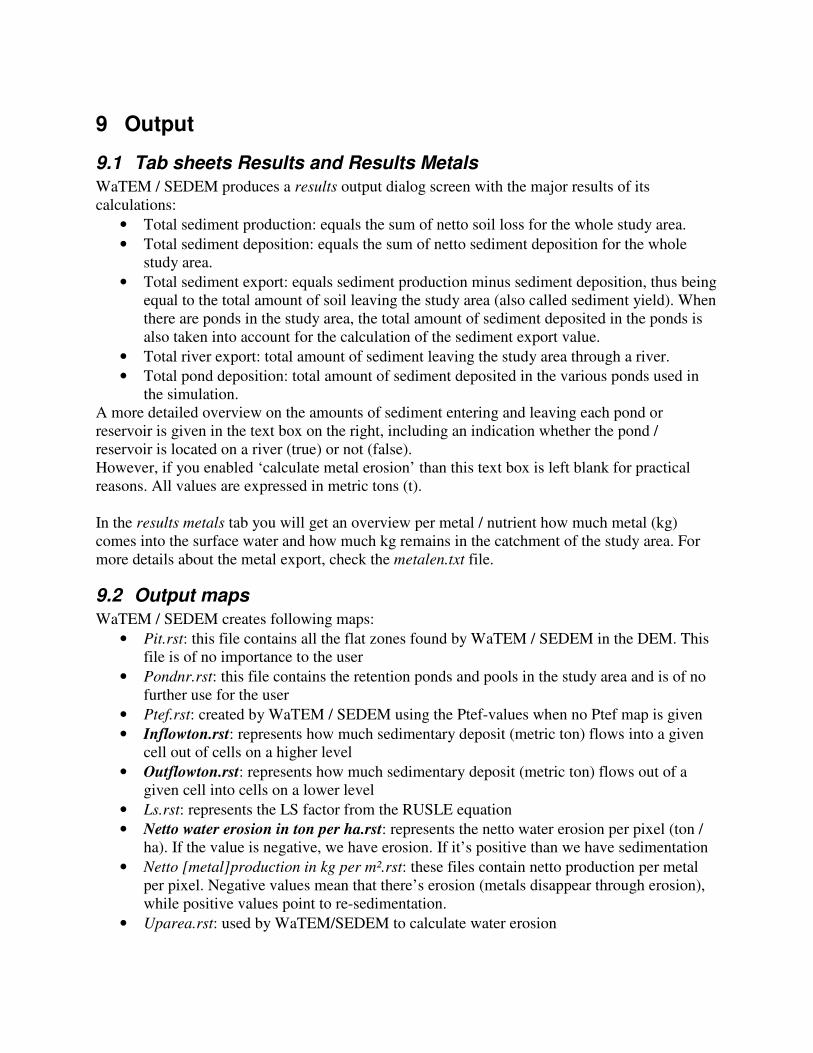
WaTEM / SEDEM produces a results output dialog screen with the major results of its calculations:
• Total sediment production: equals the sum of netto soil loss for the whole study area.
• Total sediment deposition: equals the sum of netto sediment deposition for the whole study area.
• Total sediment export: equals sediment production minus sediment deposition, thus being equal to the total amount of soil leaving the study area (also called sediment yield). When there are ponds in the study area, the total amount of sediment deposited in the ponds is also taken into account for the calculation of the sediment export value.
• Total river export: total amount of sediment leaving the study area through a river.
• Total pond deposition: total amount of sediment deposited in the various ponds used in the simulation.
A more detailed overview on the amounts of sediment entering and leaving each pond or reservoir is given in the text box on the right, including an indication whether the pond / reservoir is located on a river (true) or not (false). However, if you enabled ‘calculate metal erosion’ than this text box is left blank for practical reasons. All values are expressed in metric tons (t). In the results metals tab you will get an overview per metal / nutrient how much metal (kg) comes into the surface water and how much kg remains in the catchment of the study area. For more details about the metal export, check the metalen.txt file.
9.2 Output maps
WaTEM / SEDEM creates following maps:
• Pit.rst: this file contains all the flat zones found by WaTEM / SEDEM in the DEM. This file is of no importance to the user
• Pondnr.rst: this file contains the retention ponds and pools in the study area and is of no further use for the user
• Ptef.rst: created by WaTEM / SEDEM using the Ptef-values when no Ptef map is given
• Inflowton.rst: represents how much sedimentary deposit (metric ton) flows into a given cell out of cells on a higher level
• Outflowton.rst: represents how much sedimentary deposit (metric ton) flows out of a given cell into cells on a lower level
• Ls.rst: represents the LS factor from the RUSLE equation
• Netto water erosion in ton per ha.rst: represents the netto water erosion per pixel (ton / ha). If the value is negative, we have erosion. If it’s positive than we have sedimentation
• Netto [metal]production in kg per m².rst: these files contain netto production per metal per pixel. Negative values mean that there’s erosion (metals disappear through erosion), while positive values point to re-sedimentation.
• Uparea.rst: used by WaTEM/SEDEM to calculate water erosion

• Inflow[metal].rst: these files contain per metal data on how much metal sedimentation flows into a given cell out of cells on a higher level. Unit is metric kg
• Outflow[metal].rst: these files contain per metal data on how much metal sedimentation flows out of a given cell into cells on a lower level. Unit is metric kg
9.3 Other files
WaTEM / SEDEM creates following text files:
• Pitdat.txt: contains data about pits (flat area’s in DEM), is of no use to the user
• Ponddat.txt: contains pond and pool data: o ID: number of pond, assigned by WaTEM/SEDEM o Outrow en Outcol: exit of the pond indicated by row and column number where
(1,1) is the upper left corner o Inrow en Incol: coordinates of the highest cell in the pond o Number: amount of cells occupied by the pond in the raster o Pond TEF: efficiency of the pond as indicated by the user through the Input 3 tab o River: position of pond inside a river or not
• Tmp.txt: used by WaTEM/SEDEM for calculations
• Pond sediment deposition.txt: contains pond sediment data: o ID: idem ponddat.txt o Pond PTEF: efficiency of the pond o input ton: amount of sediment flowing in the pond (ton) o output ton: amount of sediment flowing out the pond (ton) o deposition ton: amount of sediment deposited in pond o on river: pond on river or not o deposition of metal / nutrient
• projectriversediment.txt: contains info on several river segments: o Riverid: number of river segment, provided by the user in the river routing file o NextRiverid o Hillslope sediment input: amount of erosion that effectively enters the segment o Sediment input upstream river: indicative amount of sediment (ton) that enters the
segment, coming from higher segments o Sediment output river: indicative amount of sediment flowing out to the next
segment o [metal] inflow: amount per metal (kg) flowing into the segment through soil
erosion o [metal] riverinput: indicative amount per metal (kg) entering the segment from
upper segments o [metal] outflow: indicative amount per metal (kg) exiting the segment to lower
segments
• Metalen.txt: contains detailed values about metal exportation, and per metal the following info:
o [metal] river export: amount (kg) of metal that ends up in the surface water in the study area
o [metal]-export outside rivers: amount of metal that leaves the study area without entering the surface water

10 Use on windows 7
10.1 Problems using windows 7
Watem/sedem fails to properly read the ini file under windows 7, even when it is run as an administrator or in a compatibility mode. As a result, the different used program parameters will not be read properly, including some background calculation parameters, and the model will fail to calculate or will make some errors (typically the erosion is zero). This can be avoided by using an existing inifile at the start of your project.
10.2 Work-around
Instead of beginning with a new project, Windows 7 users should open an existing project (ini file) when starting to use W/S. Steps to create a watem/sedem project under windows 7:
1. Save a watemsedem.ini file in the same folder where your data are. A standard ini file (watemsedem.ini) is included in the download of watem/sedem, but you can also use any other ini file created by watem/sedem.
2. Choose file>open project and select your watemsedem.ini file in your data folder
3. You will see that the different filenames for the maps are already filled in in
watem/sedem, as well as other values. This are however standard filenames which require to be corrected to your personal file names. Change the different filenames and provided values in watem/sedem to the files you want to use, and do the same for the other parameter values.
4. Chose file>save as and save your project using a new .ini filename. This file is best saved under the same folder as your datafiles (see other parts of this manual).
5. Run the watem/sedem erosion calculations.

11 Frequently Asked Questions
Q: After pressing the calculate button nothing seems to happen, or my results are totally
wrong
A: This has probably to do with the ‘Regional and Language Options’ on your system. It is important that the following requirements are met:
• Decimal symbol: . (period)
• Digit grouping symbol: , (comma) If not, it’s very likely that WaTEM / SEDEM will misinterpret the entered data.
Q: The ‘extra options’ tab is invisible !
A: Make sure you selected ‘Advanced user’ in the options menu.
Q: The metals and nutrients tab sheets aren’t visible
A: First you must select the right WaTEM / SEDEM version on the ‘Input 1’ tab. Only WaTEM / SEDEM - Metals & WaTEM / SEDEM 2005 support metal erosion calculations. After that you can check the ‘calculate metal erosion’ checkbox on the extra options tab.
Q: The program locks at 0%
A: This could be caused by wrong regional and language settings of your Windows installation (see question 1), or something has gone wrong in your .ini – files. Those files are used to load default variable data into WaTEM / SEDEM and to save your project. Here you have two possibilities:
1. WaTEM / SEDEM has just been installed and never worked before. During installation of WaTEM / SEDEM you should have a file called watemsedem.ini. This file needs to be placed in your Windows-directory. The default path is something like c:\windows or c:\windowsnt. If this file already exists, try replacing it with a new(er) version. Don’t forget: always make back-ups before replacing .ini-files.
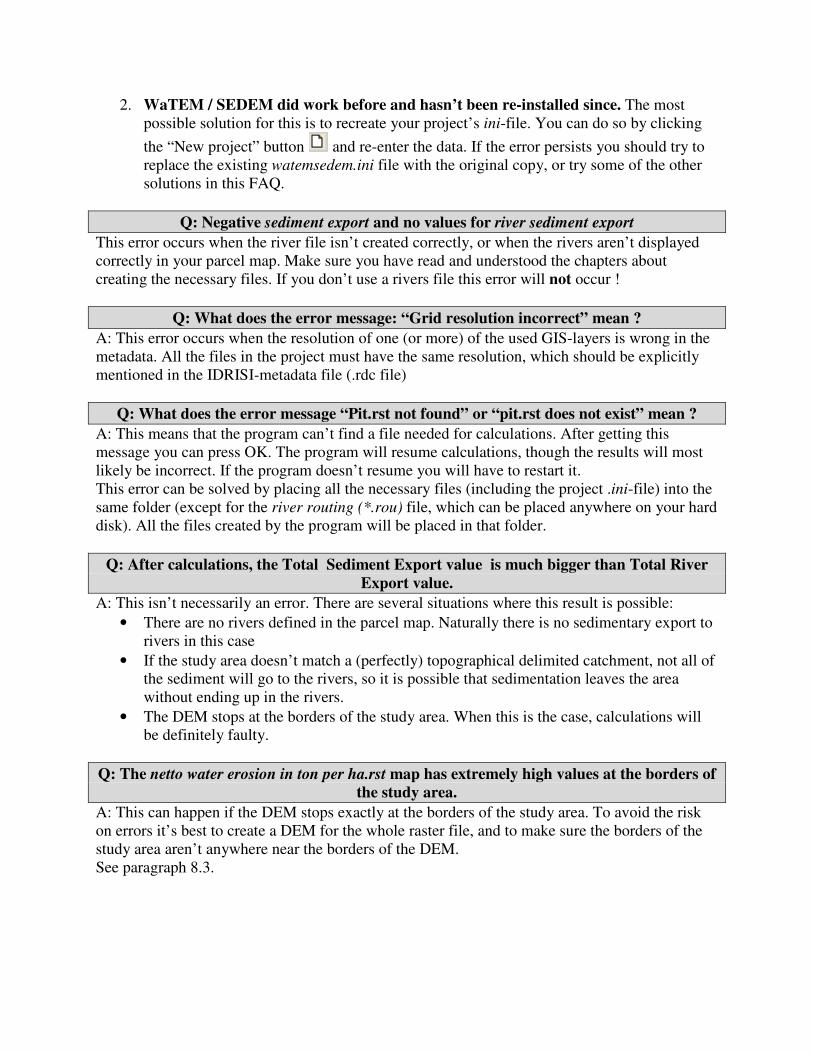
2. WaTEM / SEDEM did work before and hasn’t been re-installed since. The most possible solution for this is to recreate your project’s ini-file. You can do so by clicking
the “New project” button and re-enter the data. If the error persists you should try to replace the existing watemsedem.ini file with the original copy, or try some of the other solutions in this FAQ.
Q: Negative sediment export and no values for river sediment export
This error occurs when the river file isn’t created correctly, or when the rivers aren’t displayed correctly in your parcel map. Make sure you have read and understood the chapters about creating the necessary files. If you don’t use a rivers file this error will not occur !
Q: What does the error message: “Grid resolution incorrect” mean ?
A: This error occurs when the resolution of one (or more) of the used GIS-layers is wrong in the metadata. All the files in the project must have the same resolution, which should be explicitly mentioned in the IDRISI-metadata file (.rdc file)
Q: What does the error message “Pit.rst not found” or “pit.rst does not exist” mean ?
A: This means that the program can’t find a file needed for calculations. After getting this message you can press OK. The program will resume calculations, though the results will most likely be incorrect. If the program doesn’t resume you will have to restart it. This error can be solved by placing all the necessary files (including the project .ini-file) into the same folder (except for the river routing (*.rou) file, which can be placed anywhere on your hard disk). All the files created by the program will be placed in that folder.
Q: After calculations, the Total Sediment Export value is much bigger than Total River
Export value.
A: This isn’t necessarily an error. There are several situations where this result is possible:
• There are no rivers defined in the parcel map. Naturally there is no sedimentary export to rivers in this case
• If the study area doesn’t match a (perfectly) topographical delimited catchment, not all of the sediment will go to the rivers, so it is possible that sedimentation leaves the area without ending up in the rivers.
• The DEM stops at the borders of the study area. When this is the case, calculations will be definitely faulty.
Q: The netto water erosion in ton per ha.rst map has extremely high values at the borders of
the study area.
A: This can happen if the DEM stops exactly at the borders of the study area. To avoid the risk on errors it’s best to create a DEM for the whole raster file, and to make sure the borders of the study area aren’t anywhere near the borders of the DEM. See paragraph 8.3.

12 Articles and used versions
12.1 Version history
The SEDEM model used single flow in combination with proportional Ktc factor calculation. It was created by A. Van Rompaey. WaTEM/SEDEM is based on both the SEDEM and WATEM models, and was first programmed by K. Van Oost. WATEM/SEDEM uses multiple flow and proportional Ktc calculations. The original code was several times corrected and adapted, resulting in multiple versions, of which the main version are mentioned in the above scheme. Following main versions were used for publications:
• WATEM/SEDEM v2: the original WATEM/SEDEM version; code K. Van Oost.
• EROMAT: slight adaptations according to WATEM/SEDEM V2 but some errors were removed and the model was re-calibrated; code G. Verstraeten.
• WATEM/SEDEM V 18 August 2004: version based on WATEM/SEDEM V2 and SEDEM but a lot of errors were removed; code G. Verstraeten.

• WATEM/SEDEM METALS: based on WATEM SEDEM V 18 August 2004. Errors in the interface were corrected and the code was made more memory efficient with the removal of redundant variables and calculations. A component was added to calculate the erosion, transport, sedimentation and export of heavy metals. But the main procedures were not changed: this version generates the same results for sediment erosion and delivery as the version of 18 August 2004; code B. Notebaert.
WaTEM/SEDEM V2005 uses also multiple flow, but unlike the other version the Ktc calculation is based on A and S. This is the only difference according to the version of 18 August 2004. the code was written by G. Verstraeten.
12.2 Publication list
Model Version: Original SEDEM
Model structure: single flow and proportional Ktc Calibration: based on SY from 21 catchments in the Belgian Loess belt, optimised towards Model Efficiency Parameters: KTCA = 70m, KTCF = 42m Input data:
• Belgian “DEM NGI Niveau 2”, resolution 20m
• Landuse: classified LANDSAT Vlaanderen 1996 (OC-GIS Vlaanderen)
• R-factor: 670 MJ.mm.h-1.ha-1.y-1
• C-factor: 0.37 for cropland
• K-factor: based on texture from Belgian soil map Papers:
• Van Rompaey, A., Verstraeten, Van Oost, K., G., Govers, G., Poesen, J., 2001. Modelling mean annual sediment yield using a distributed approach. Earth Surface Processes and Landforms, 26(11): 1221-1236.
• Van Rompaey, A., Govers, G., Puttemans, C. 2002. Modelling land use changes and their impact on soil erosion and sediment supply to rivers. Earth Surface Processes and Landforms, 27(5): 481-494.
Model version: WATEM-SEDEM V2 (code Kristof Van Oost)
Model structure: Multiple flow and proportional Ktc Calibration: based on 6 catchments in Bohemia, optimised towards model efficiency Parameters: KTCA = 50m, KTCF = 20m Input data:
• DEM Czech Rep, res 50m
• Landuse: Classified LANDSAT
• R-factor: 600 MJ.mm.h-1.ha-1.y-1
• C-fac: 0.37 for cropland
• K-fac: texture Czech soil map Papers:

• Van Rompaey, A., Krasa, J., Dostal, T., Govers, G., 2003. Modelling sediment supply to rivers and reservoirs in Eastern Europe during and after the collectivisation period, Hydrobiologia, 494(1): 169-176
• Krasa, J., Dostal, T., Van Rompaey, A., Vaska, J., Vrana, K., in press. Reservoir sedimentation in the Czech Republic, Catena.
• Van Rompaey, A., Krasa, J., Dostal, T., in press Modelling the impact of land cover changes in the Czech Republic on sediment delivery. Land Use Policy.
Model version: WATEM-SEDEM V2 (code Kristof Van Oost)
Model structure: Multiple flow and proportional Ktc Calibration: based on SSY in 40 catchments in Italy, optimised towards ME Parameters: KTCA = 50m, KTCF = 20m Input data:
• DEM Italy, res 75m
• Landuse: CORINE1990
• R-factor: rainfall erosivity map
• C-factor: function of NDVI
• K-factor: Texture Italian soil map Papers:
• Van Rompaey, A., Bazzoffi, P., Jones, R., Montanarella, L., 2005. Modelling sediment yields in Italian catchments, Geomorphology, 65: 157-169.
Model version: WATEM-SEDEM V2 (code Kristof Van Oost)
Model structure: Multiple flow and proportional Ktc Calibration: based on ten-year measurements in one catchment, optimised towards ME Parameters: KTCA = 0.25m, KTCF = 0.11m Input Parameters:
• DEM: local DEM Kali, resolution 10m
• Landuse: topographic maps
• R-factor: derived from daily rainfall records
• C-factor: 0.36 for cropland
• K-factor: derived from geologic maps Papers:
• Jordan, G., Van Rompaey, A., Szilassi, P., Mannaerts, C., Woldai, T., 2005. Historical landuse change and their impact on sediment fluxes in the Balaton basin (Hungary). Agriculture, Ecosystems and Environment, 108: 119-133.
• Szilassi, P., Jordan, G., Van Rompaey, A., Gabor, C., in press. Impacts of historical land use changes on erosion and soil properties in the Kali basin at lake Balaton, Hungary. Catena.
Model version: WATEM-SEDEM V2 (code Kristof Van Oost)
Model structure: Multiple flow and proportional Ktc Calibration: SEDEM paper – 21 cathments in Flanders (Verstraeten en Poesen, 2001)

Parameters: KTCA = 75m, KTCF = 42m (values are actually only applicable on single flow algorithms) Input data:
• DEM NGI Niv. 2, res 20m
• landuse: classified LANDSAT Vlaanderen 1996 (OC-GIS),
• R-factor: 670 MJ.mm.h-1.ha-1.y-1
• C-factor: based on landuse (Verstraeten et al 2000); avarage for cropland = 0.37
• K-factor: based on texture Belgian soil map Papers:
• Verstraeten, G., Van Oost, K., Van Rompaey, A., Poesen, J. & Govers, G., 2001. Integraal land- en waterbeheer in landelijke gebieden met het oog op het beperken van bodemverlies en modderoverlast (proefproject gemeente Gingelom). Rapport in opdracht van het Ministerie van de Vlaamse Gemeenschap, afdeling Land, 64 pp.
• Verstraeten, G., Van Rompaey, A., Poesen, J. & Govers, G., 2001. Solving the off-ste impacts of soil erosion by an integrated environmental watershed management ? In: Ascough, J.C. & Flanagan, D.C. (Eds.) Soil Erosion for the 21th Century, Proceedings of the International Symposium, Honolulu, Hawaii, 3-5 January, 2001, American Society for Agricultural Engineers, St.-Joseph, Michigan, USA: 645-648.
• Verstraeten, G., Van Oost, K., Van Rompaey, A., Poesen, J. & Govers, G., 2002 Evaluating an integrated approach to catchment management to reduce soil loss and sediment pollution through modelling. Soil Use and Management, 18: 386-394.
• Lewis, L., Verstraeten, G. & Zhu, H. 2005. RUSLE applied in a GIS framework: calculating the LS factor and deriving homogeneous patches for estimating soil loss for fields and catchments. IJGIS, 19: 809-829.
Model version: WATEM-SEDEM V2 (code Kristof Van Oost)
Model structure: Multiple flow and proportional Ktc Calibration: based on export from 7 small catchments in Jonkershoek, South-Afrika Parameters: KTC normal vegetation = 0.77m, KTC after burning = 3m Input data:
• DEM 20m resolution based on contours 1:10.000 maps
• Landuse: areal photos, topographic maps, field mapping
• R-factor: 3700 MJ.mm.h-1.ha-1.y-1
• C-factor: based on Dissmeyer & Foster (1980)
• K-factor: based on organic matter and texture according to Williams (1995) Papers:
• Van Rompaey, A., Verstraeten, G., Van Oost, K., Rozanov, A., Govers, G. & Poesen, J., 2001. Modelling sediment transport in the Jonkershoek catchment. Part 1: Model calibration and validation. In: Cartographic modelling of land degradation, Proceedings of the Workshop held in Ghent (September 2001) in the framework of the Bilateral Co-operation between Flanders and South-Africa: 75-89.
• Verstraeten, G., Van Rompaey, A., Van Oost, K., Rozanov, A., Poesen, J. & Govers, G., 2001. Modelling sediment transport in the Jonkershoek catchment. Part 2: Evaluating the impact of possible land use changes on sediment delivery to the Eerste Rivier and the Jonkershoek reservoir. In: Cartographic modelling of land degradation, Proceedings of
the Workshop held in Ghent (September 2001) in the framework of the Bilateral Co-operation between Flanders and South-Africa: 91-99.
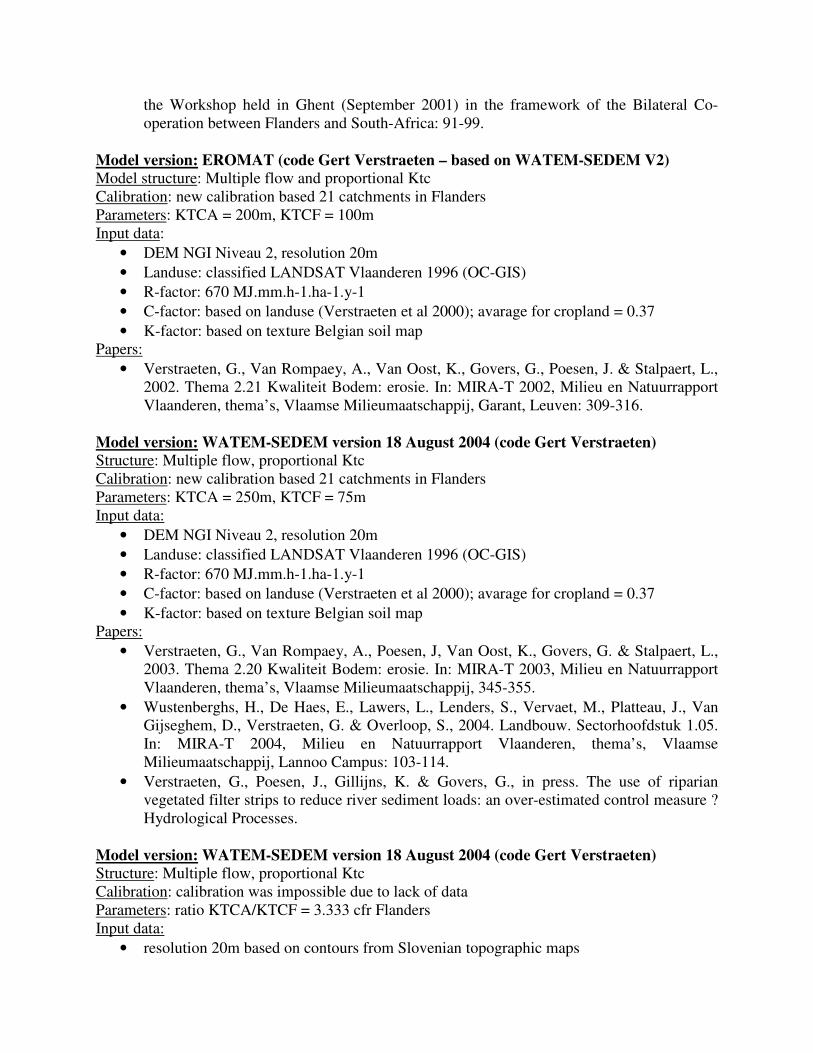
Model version: EROMAT (code Gert Verstraeten – based on WATEM-SEDEM V2)
Model structure: Multiple flow and proportional Ktc Calibration: new calibration based 21 catchments in Flanders Parameters: KTCA = 200m, KTCF = 100m Input data:
• DEM NGI Niveau 2, resolution 20m
• Landuse: classified LANDSAT Vlaanderen 1996 (OC-GIS)
• R-factor: 670 MJ.mm.h-1.ha-1.y-1
• C-factor: based on landuse (Verstraeten et al 2000); avarage for cropland = 0.37
• K-factor: based on texture Belgian soil map
Papers:
• Verstraeten, G., Van Rompaey, A., Van Oost, K., Govers, G., Poesen, J. & Stalpaert, L., 2002. Thema 2.21 Kwaliteit Bodem: erosie. In: MIRA-T 2002, Milieu en Natuurrapport Vlaanderen, thema’s, Vlaamse Milieumaatschappij, Garant, Leuven: 309-316.
Model version: WATEM-SEDEM version 18 August 2004 (code Gert Verstraeten)
Structure: Multiple flow, proportional Ktc Calibration: new calibration based 21 catchments in Flanders Parameters: KTCA = 250m, KTCF = 75m Input data:
• DEM NGI Niveau 2, resolution 20m
• Landuse: classified LANDSAT Vlaanderen 1996 (OC-GIS)
• R-factor: 670 MJ.mm.h-1.ha-1.y-1
• C-factor: based on landuse (Verstraeten et al 2000); avarage for cropland = 0.37
• K-factor: based on texture Belgian soil map
Papers:
• Verstraeten, G., Van Rompaey, A., Poesen, J, Van Oost, K., Govers, G. & Stalpaert, L., 2003. Thema 2.20 Kwaliteit Bodem: erosie. In: MIRA-T 2003, Milieu en Natuurrapport Vlaanderen, thema’s, Vlaamse Milieumaatschappij, 345-355.
• Wustenberghs, H., De Haes, E., Lawers, L., Lenders, S., Vervaet, M., Platteau, J., Van Gijseghem, D., Verstraeten, G. & Overloop, S., 2004. Landbouw. Sectorhoofdstuk 1.05. In: MIRA-T 2004, Milieu en Natuurrapport Vlaanderen, thema’s, Vlaamse Milieumaatschappij, Lannoo Campus: 103-114.
• Verstraeten, G., Poesen, J., Gillijns, K. & Govers, G., in press. The use of riparian vegetated filter strips to reduce river sediment loads: an over-estimated control measure ? Hydrological Processes.
Model version: WATEM-SEDEM version 18 August 2004 (code Gert Verstraeten)
Structure: Multiple flow, proportional Ktc Calibration: calibration was impossible due to lack of data Parameters: ratio KTCA/KTCF = 3.333 cfr Flanders Input data:
• resolution 20m based on contours from Slovenian topographic maps

• Landuse: luchtfoto’s (1954, 1975, 1985, 1994) en veldkartering met GPS in 2002
• R-factor: 3000 MJ.mm.h-1.ha-1.y-1
• C-factor: based on landuse
• K-fac: based on Slovenian soil map and soil samples for which the texture was determined
Papers:
• Keesstra, S.D., van Dam, O., Verstraeten, G., van Huissteden, J. & Houtman, M.C. Changing sediment generation due to natural reforestation in the Dragonja catchment, SW Slovenia. Submitted to Catena.
Model version: WATEM-SEDEM version 18 August 2004 (code Gert Verstraeten)
Structure: Multiple flow, proportional Ktc Calibratie: nieuw uitgevoerd – stroomgebieden Vlaanderen (Verstraeten en Poesen, 2001) alsook modelresultaten met NGI-DEM voor grote bekkens in Vlaanderen Parameters: KTCA = 27m, KTCF = 8m Input data:
• DEM: SRTM 100 m resolution
• Landuse: Corine Land Cover Map 1990, 100 m resolution
• R-factor: 870 MJ.mm.h-1.ha-1.y-1
• C-factor: average 0.37 for cropland
• K-factor: based on Europena texturemap, calculation of K same as for Belgian soilmap calculations
Papers:
• Verstraeten, G. Regional scale modeling of hillslope sediment delivery with SRTM elevation data. Submitted to Geomorphology.
Model version: WATEM-SEDEM v 2005 (code Gert Verstraeten)
Structure: Multiple flow, Ktc function of S and A Calibration: catchments Canberra (Verstraeten et al, subm J of Hydrology) Parameters: calibration for three types of landuse: “The ktc-values with the highest ME-values are 0.00001 , 0.0001 and 0.0002 for good, moderate and poorly vegetated surfaces, respectively.“ Input data:
• DEM: resolution 20m; based on contours on australian topographic maps
• Landuse: classified multi-temporal LANDSAT images
• R-factor: varies between 700 and 5000 MJ.mm.h-1.ha-1.y-1
• C-factor: depends on landuse
• K-factor: based on texture of the soil map Papers:
• Verstraeten, G., Prosser, I.P. & Fogarty, P. Predicting the spatial patterns of hillslope sediment delivery to river channels in the Murrumbidgee catchment, Australia. Submitted to Journal of Hydrology.

• Verstraeten, G., Prosser, IP. Modelling the impact of land use change and farm dam construction on sediment delivery to rivers at the regional scale. Submitted to Geomorphology.
Model version: WATEM-SEDEM Metals (code Bastiaan Notebaert)
Model structure: Multiple flow and proportional Ktc Calibration: based on ten-year measurements in one catchment, optimised towards RRMSE Parameters: KTCA = 0.90m, KTCF = 0.40m Input data:
• DEM: DEM Balaton, resolution 50m
• Landuse: Classified LANDSAT
• R-factor: derived from monthly rainfall records
• C-factor: 0.36 for cropland
• K-factor: derived from geologic maps Papers:
• Van Dessel, W., Jordan, G., Poelmans, L., Van Rompaey, A. in prep. Predicting land cover changes in the Lake Balaton catchment (Hungary)
Model-version: WATEM-SEDEM Metals (code Bastiaan Notebaert)
Structure: Multiple flow, Proportional Ktc Calibration: based on SY in 3 catchments (optimised towards RMSE) Parameters: KTCA = 5m, KTCF = 1.5m Input data:
• DEM: local DEM resolution 50m
• Landuse: Classified LANDSAT
• R-factor: derived from monthly rainfall records
• C-factor: 0.36for cropland
• K-factor: local soil map Papers:
• Van Dessel, W., Jordan, G., Bats, M. Van Rompaey, A. in prep. Land use scenarios for minimizing export of heavy metals in the Resck mining area, Hungary.
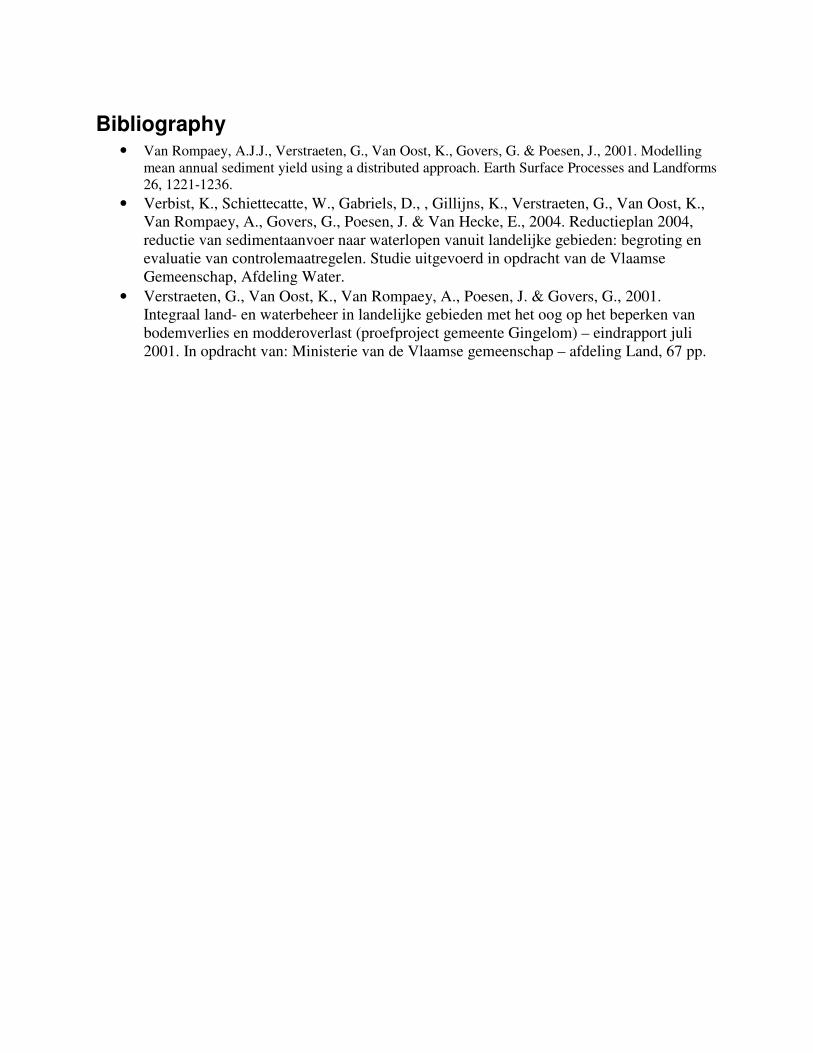
Bibliography • Van Rompaey, A.J.J., Verstraeten, G., Van Oost, K., Govers, G. & Poesen, J., 2001. Modelling
mean annual sediment yield using a distributed approach. Earth Surface Processes and Landforms 26, 1221-1236.
• Verbist, K., Schiettecatte, W., Gabriels, D., , Gillijns, K., Verstraeten, G., Van Oost, K., Van Rompaey, A., Govers, G., Poesen, J. & Van Hecke, E., 2004. Reductieplan 2004, reductie van sedimentaanvoer naar waterlopen vanuit landelijke gebieden: begroting en evaluatie van controlemaatregelen. Studie uitgevoerd in opdracht van de Vlaamse Gemeenschap, Afdeling Water.
• Verstraeten, G., Van Oost, K., Van Rompaey, A., Poesen, J. & Govers, G., 2001. Integraal land- en waterbeheer in landelijke gebieden met het oog op het beperken van bodemverlies en modderoverlast (proefproject gemeente Gingelom) – eindrapport juli 2001. In opdracht van: Ministerie van de Vlaamse gemeenschap – afdeling Land, 67 pp.