Embed Size (px)
Citation preview

HAMEL, Instruments
MANUAL
Oscilloscope
HM 1507-2
B BooocoGQH EES
BEER EERE

St.130798-HUb/goRR
General information regarding the CE marking .......... 2
General Information ...............:csssccssstsecseersseseessssnsesssesen 4 SVMMDOIS fas. ea sicuteenets gaxcsseneyetacericceteatseavnnsredeton ise eae 4 USerOF Tt NaNnGle sii wccticcecovetauuduseiiersccecoesenevasienes 4 SATS Ss ssie ccpaeetixsczens ec duies easesiapeeieinvatscavearncsseaousmianees 4 VG testa ee ia Me tata ncteen earns nay ieneae rete 5 WALTAMY oo. cccceccccecesececcseaeeseesssecseeeeeessecsseasrereneesseeses 5 MaINtOM ANCE: ts ccscibie es ccleetsisctuaues feasssdcsavegeds Henitessnreadncnees 5 Protective Switch-Off ......0..0. cece ceceenseceesseessseeeeeeens 5 POWET SUPDIY 0.0... cceescesesesscesscesecsseseececssscstesteeseeeeeses 5
Type of signal voltage ...........ccccssssssesseeresssessseseetsseeeesaes 6 Amplitude Measurement .........:ccccccsccscsseeseessecesseeeenaes 6 Total value of input voltage ....... eee ceecereeeneres 7 Time M@aSureMent .........ccccccsecseeersecstsesseecsesetssesseanes 7 Connection of Test Signal... cc eseseseseeseeeeeees 8
Controls and Readout ............cccccssssseeessessseessesseesenensesees 9
MG AW isssseccec cissecgerets vase casks sasiateeavieias stunsancaaneaniansansusbepedeeavae 24
FirSt TIM@ Operation .........cccecccececseeesseeessesseesneeeeens 24 Mace Rotation TR w.csec secede ceieeesteiwncdlia aiteaessisen: 25 Probe compensation and USE ..............cccceceeseeeeeeees 25 AdjUStMent at TKHZ ...... cece ceccecceteeeesssececsssesseeseeeeees 25 Adjustment at 1MHZ .0......cc cc cccccccceeseececnesenseeeeeeens 25
Operating modes of the vertical amplifiers in Yt MOdEe ...........ccccsscccsssesssserenssseestsessseeses 26
KEY “OPOMATION(: css-encddssenencvessarticscivessevttv edie awn taceert 26 Phase comparison with Lissajous figures ................ 26 Phase difference measurement IN DUAL mode (Yt) ...... ee cececcecsssceensseessseessseenseeeeees 27 Phase difference measurement in DUAL mode ....... 27 Measurement of an amplitude modulation ..........0..0...ccccccceesesseeseesseeseeeees 27
Triggering and time base ............cccssscsssseresssseesseeeeeenes 28 Normal TriQQering .......:cccccccesscscsecsseessecesseecseeseesseeeenes 28 PN SIO DG ices xdileced ene iets end net aptss castes ini aes 28 TFIQQEr COUPLING .........ceeeccecccessececssccssecececsseecesesecseeeeeees 29 Triggering of Video SignalS ..........cccccccscssecseestecsteeeeees 29 Line / Mains trigg@ring (~) ..........ccccccceeeccsseessseseneeeees 29 Alternate triggering ............cccccccccsccceseceecesseeussesesseeeeeees 30 External triggering ...........:ccccecccccsscccsseceesssecssseeesaeeeees 30 TrIQQer INGICATOL oo... ee ceeceeesseceseeceeesssceretesecseeeeaees 30 HOLD OFF-time adjustment .........0...ccceeeceeeeeeeees 30 B time base (2nd time base) / Triggering after Delay 0.0.0... cece ccecseseeceeseeeseenteeeaes 31
AUTO: SED sisissicigecsti cas setersidsiacecsiesossiteiddedssanisaausiannatstieesees 31
SAVE /RECALL. wiscsesascccsssscssciss secaseosiassisooioes saxatavsieaseaaniaasaay 32
Component Tester (analog Mode) ...............s:cssseeeseess 32 GOMOMAl eins ssi cscececcaasade cdscaceavtavsersiacccosaiet seta diewe. weaspeeca: 32 Using the Component Tester ..........cccccccceereesseeteeeeees 32 TOStAPLOCE GUC ii ect sees es veutiny beset fall caees Staateneaeaas acveene 32 Test Pattern Displays ..............cccccccecesseeecssseessseeensneaees 32 Testing RESIStOI‘S ............cccecececeeececessceseeseceseeeeeseesenaees 32 Testing Capacitors and Inductors .............ccccceceeeees 32 Testing SEMICONGUCTOIS 0.0.0.2... ceeeecececeeeeseeesesseeeees 33 Testing DiOd@S ooo... ccccecescccsccceesceeeersecseecsnnucuess 33 TASTING TANSISTOTS .......iccccececcssscccesssseeeceesessesereesensens 33 In-Circuit TeSts .....cccccccccccessceesesceessseeecsseesseeeeseasees 33
STOrAGe MOE i. cscsccsecccssecssssneaciccaincesvedeconssnsosasccusssawesaeeses 34 Signal recording MOdES ..........ccceseeseeesseesscenssenseeeenees 34 Vertical reSolution ...........ccccccccccssceessceeecsseecsecessseaees 34 Horizontal reSolution ......0. cc eececccccesscceesceesseseeseaeeees 35
Subject to change without notice
Table of contents
Oscilloscope
HM 1507-2
Maximum signal frequency in storage mode............ Alias signal display .............:::::ceececcceeeeeeeeeeeeeeeeneeeeeeenes Operating modes of the vertical amplifiers ...............
Cathode Ray Tube: Brightness and Focus, Linearity, Raster Distortion .............ccceeeseeeeeeeeees
AStigMmatiSM CHECK ........:cceccceeeceseecececetteeeeeneseeteeeanes Symmetry and Drift of the Vertical Amplifier ............ Calibration of the Vertical Amplifier .....00... eee Transmission Performance of the Vertical Amplifier ..........ccceeeceeereceneceteereneeee Operating Modes: CH.//Il, DUAL, ADD, CHOP, INVERT and X-Y Operation .........cceeeeees Triggering CHECKS .0.......eeecceeeenreeeeeeeeetneeeeeneeenneeetenss TIM @: DAS 6 wicce snes sschds esagscntadercte ees cated stavicceve rene debecbend Hold Off time ........ cc ceccccceeceessseeeeeeeeeeeeeeecenareentererennes CoMponent TeSter .........ccccesececeeeeeeeeeeeeeerenteeseneeeeeneeees TACE AlIGMIMO Nts. be ctaseveigeesds ssnecraatcasasicvennaeceestwezates
Service IMStructions ..........::cccccssereeseeeesseeeesseeensceeeesees GONGl Al ceeicesdec.neiciaeseseacnevestebiansoaia awatuetvatsedease extecacaveoes: Instrument Case Removal ...........::cccseceesereeeesteeeenteeees Operating Voltages ...........:ceceeeseeeneeeeeeeeeeeeeneetteeerteeee Astigmatism COntrol ........:ccccececeeceeeeeestserseesspenseeerses WGGEr TACESMOND sicicneccs 2 setesnsreriesamtnte asmaressu dein dee Trouble-Shooting the InStrUMeENt ........ eee eee AdjUStMeNts .............2:eee certs sinus aieeisaee rig macaroni
RS232 Interface - Remote Control ..........cccssscsscceereses SATE. cipe.ezss teshaah a tel eee esteaneteatteceaies cram ieteanee OP OF ALON sccise costecsyccastets on deanesosceteessesd aes ryee eemnte nets Baud-Rate Setting ............cccccceeeeseeeseceeceneeesesteeeeeneneees Data COMMUNICATION .0........ ccc cc ccetee eee eeeeeeeeeeeneneeeees
Front Panel HM1507-2 .........ccccccccscsrscsstsssersereneseserssesens

DECLARATION DE CONFORMITE Instruments C E DECLARATION OF CONFORMITY HAPiIeE oe
Herstellers HAMEG GmbH Angewendete harmonisierte Normen / Harmonized standards applied / Normes
Manufacturer Kelsterbacherstrafe 15-19 harmonisées utilisées Fabricant D - 60528 Frankfurt Sicherheit / Safety / Sécurité
EN 61010-1: 1993 / IEC (CEI) 1010-1: 1990 A 1: 1992 / VDE 0411: 1994 Bezeichnung / Product name / Designation: Uberspannungskategorie / Overvoltage category / Catégorie de surtension: Il
. . : i Hution: 2 Oszilloskop/Oscilloscope/Oscilloscope Verschmutzungsgrad / Degree of pollution / Degré de pollution
Elaktromagnetische Vertraglichkeit / Electromagnetic compatibility Typ / Type / Type: HM1507-2 Compatibilité électromagnétique
mit / with / avec: - EN 50082-2: 1995 / VDE 0839 T82-2 ENV 50140: 1993 / IEC (CEI) 1004-4-3: 1995 / VDE 0847 T3
Optionen / Options / Options: HO79-6 ENV 50141: 1993 / IEC (CEI) 1000-4-6 / VDE 0843 / 6 EN 61000-4-2: 1995 / IEC {CEI} 1000-4-2: 1995 / VDE 0847 T4-2
mit den folgenden Bestimmungen / with applicable regulations / avec les Prifscharfe / Level / Niveau = 2 directives suivantes
EN 61000-4-4: 1995 / IEC (CEI) 1000-4-4: 1995 / VDE 0847 T4-4:
EMV Richtlinie 89/336/EWG erganzt durch 91/263/EWG, 92/31/EWG Prifscharfe / Level / Niveau = 3 EMC Directive 89/336/EEC amended by 91/263/EWG, $2/31/EEC Directive EMC 89/336/CEE amendée par 91/263/EWG, 92/31/CEE EN 50081-1: 1992 / EN 55011: 1991 / CISPR11: 1991 / VDE0875 T11: 1992
Gruppe / group / groupe = 1, Klasse / Class / Classe = B
Niederspannungsrichtlinie 73/23/EWG erganzt durch 93/68/EWG Low-Voltage Equipment Directive 73/23/EEC amended by 93/68/EEC Datum /Date /Date Unterschrift / Signature /Signatur
Directive des equipements basse tension 73/23/CEE amendée par 93/68/CEE 23.04.1998 nA q /
De J. ike)
Technical Manager/Directeur Technique
General information regarding the CE marking
HAMEG instruments fulfill the regulations of the EMC directive. The conformity test made by HAMEG is based on the actual generic- and product standards. in cases where different limit values are applicable, HAMEG
applies the severer standard. For emission the limits for residential, commercial and light industry are applied.
Regarding the immunity (susceptibility) the limits for industrial environment have been used.
The measuring- and data lines of the instrument have much influence on emmission and immunity and therefore on meeting the acceptance limits. For different applications the lines and/or cables used may be different. For
measurement operation the following hints and conditions regarding emission and immunity should be observed:
1. Data cables
For the connection between instruments resp. their interfaces and external devices, (computer, printer etc.)
sufficiently screened cables must be used. Without a special instruction in the manual for a reduced cable
length, the maximum cable length of a dataline must be less than 3 meters long. If an interface has several
connectors only one connector must have a connection to a cable.
Basically interconnections must have a double screening. For IEEE-bus purposes the double screened cables HZ72S and HZ72L from HAMEG are suitable.
2. Signal cables
Basically test leads for signal interconnection between test point and instrument should be as short as possible.
Without instruction in the manual for a shorter length, signal lines must be less than 3 meters long.
Signal lines must screened (coaxial cable - RG58/U). A proper ground connection is required. In combination with
signal generators double screened cables (RG223/U, RG214/U) must be used.
3. Influence on measuring instruments.
Under the presence of strong high frequency electric or magnetic fields, even with careful setup of the measuring
equipment an influence of such signals is unavoidable.
This will not cause damage or put the instrument out of operation. Small deviations of the measuring value
(reading) exceeding the instruments specifications may result from such conditions in individual cases.
HAMEG GmbH
| Subject to change without notice

The 150 MHz (200MS/s) Analog-/Digital-Oscilloscope HM1507-2
Autoset
Auto Cursor
Readout / Cursor
Save / Recall
2 Reference Memories
Dual Time Base
Component Tester
1kHz/1MHz Calibrator
RS232 Interface
Analog: M 2x DCto 150MHz, 2 x 1mV-50V/div @ Timebase A with Trig. DC to 250MHz
m@ Timebase B with 2™Trig. to 250MHz
@ Trig. DC to 250MHz, TV Sync. Separator @ 1kHz/1MHz Calibrator, CRT with 14kV
Specifications
Vertical Deflection
Operating modes: Channel | or Il separate
both Channels (alternated or chopped)
Chopper frequency: approx. 0.5MHz) Sum or Difference: from CH | and CH II Invert: CH! and CH Il
XY-Mode: via channel I (Y) and channel |I(X)
Frequency range: DC to 150MHz (-3dB) Risetime: <2.3ns
Overshoot: <1% Deflection coefficient: 14 calibrated positions
from ImV/div to 20V/div in 1-2-5 sequence,
variable 2.5:1 to min. 50V/div.
Accuracy in calibrated positions
ImV/div-2mV/div: —+5%(DC-10MHz(-3dB)) 5mV/div - 20V/div: +3% Input impedance: 1MQ II 15pF
Input coupling: DC-AC-GD (ground) Input voltage: max. 400V (DC + peak AC) Delay line: approx. 70ns
Triggering
Automatic (peak to peak): 20Hz-250MHz
(20.5div.) Normal! with level control: DC-250MHz
(20.5div.) Indicator for trigger action: LED Slope: positive or negative
Sources: Channel | or Il, line and external
ALT. Triggering: CH I/CH II (2 0.8div.) Coupling: AC (10 -250MHz)
Dc (0 - 250MHz) HF (50kHz - 250MHz) LF (0 - 1.5kHz) NR (Noise reject)0 - 50MHz (2 0.8div.)
Triggering time base B: normal with level
control and slope selection (0 - 250 MHz) External: 20.3V_, (0 - 250MHz) Active TV Sync. Separator: field & line, + /-
mama Subject to change without notice
Digital: Refresh, Single, Roll-, Envelope-, Average-,XY-Mode Max.Sampling Rate 200MS/s, Storage 2x2048x8 bit
Time Base A: 100s - 50ns/div., B: 20ms - 50ns/div. Pre Trigger 25-50-75-100%, Post Trigger 25-50-75%
Screen Refresh 180/s, Dot Join (linear)
Horizontal Deflection
Analog Time Base: Accuracy in calibr. position 3%; 1-2-5 sequence
A: 0.5s-50ns/div. B: 20ms-50ns/div.
Operating modes: Aor B, alternate A/B Variable: 2.5:1 up to 1.25s/div. X-MAG. x10 (5%) max. 5ns/div. Holdoff time: variable to approx. 10:1 Bandwidth X-amplifier: 0 -3MHz (-3dB) X-Y¥ phase shift: <3° below 220kHz
Digital Time Base: Accuracy: 3%; 1-2-5 sequence
A: 100s-0.5us/div. B: 20ms-0.5us/div. Operating modes: Aor B, alternate A/B X-MAG. x10 (+5%): 50ns/div.
Bandwidth X-Amplifier: © 0 —20MHz (-3dB) X-Y phase shift: <3° below 20MHz
Input X-amplifier: via Channel II Sensitivity: see CH II
Digital Storage
Operatingmodes: Refresh, Roll, Single, XY Average (2 to 512 waveforms), Envelope
Dot Join function: automatically
Acquisition (real time) 8 bit flash A/D max. 200MS/s Display refresh rate: max. 180/s Memory & display: 2k x 8bit per channel Reference memory: 2 waveforms 2k x 8bit Saved in: (EEPROM). Resolution (samples/div.): X 200/div.
Y 25 /div. XY 25x 25/div.
Pre-/Post Trigger: 25,50,75, 100, -25,-50,-75%
Operation / Control
Manual: front panel switches Auto Set: signal related automatic
parameter selection
Save & Recall: 9 user defined parameter settings
it gigi je mi I
i gpl
@):2 sl UL ' oot :
Readout & Cursor (analog/digital)
Display of parameter settings and other func- tions on the screen. Triggerpoint indication. Cur- sor measurement of AU, At or 1/At (frequency),
separate or in tracking mode. Readout intensity: separately adjustable.
Interface
PC remote control: built in RS232 interface Option: HO79-6 Multifunction-Interface
IEEE-Bus, RS232, and Centronics Output formats{/HO79-6): PCL, Post Script
HPGL, EPSON
Component Tester
Test voltage: max. 7Vrmgs (o/c).
Test current: max. 7MArms (s/c)
Test frequency: approx.50Hz
One test lead is grounded (Safety Earth)
General Information
CRT: D14-375GY, 8x10cm internal graticule Acceleration voltage: approx. 14kV Trace rotation: adjustable on front panel Calibrator: 0.2V +1%, = 1kKH2/1MHz (tr <4ns) Line voltage: 100-240V AC +10%, 50/60Hz Power consumption: approx. 42 Watt at 50Hz
Min./Max. ambient temperature: 0°C...+40°C Protective system: Safety class | (IEC1010-1) Weight: approx. 5.6kg (12.4lbs) Color: techno-brown Cabinet: W 285, H 125,D 380 mm Lockable tilt handle
Subject to change without notice 06/98
Accessories supplied: Operators Manual, 4 Disks, Line Cord, 2 Probes 10:1
3

General Information
General Information
This oscilloscope is easy to operate. The logical arrangement of the controls allows anyone to quickly become familiar with the operation of the instrument, however, experienced users are also advised to read through these instructions so that all functions are understood.
Immediately after unpacking, the instrument should be checked for mechanical damage and loose parts in the interior. If there is transport damage, the supplier must be informed immediately. The instrument must then not be put into operation.
Symbols
AN AN rh Protective ground (earth) terminal
Use of tilt handle
ATTENTION - refer to manual
Danger - High voltage
To view the screen from the best angle, there are three different positions (C, D, E) for setting up the instrument. If the instrument is set down on the floor after being carried, the
handle automatically remains in the upright carrying position (A). In order to place the instrument onto a horizontal surface, the handle should be turned to the upper side of the oscilloscope (C). For the D position (10° inclination), the handle should be turned to the opposite direction of the carrying position until it locks in place automatically underneath the instrument. For the E position (20° inclination), the handle should be pulled to release it from the D position and swing backwards until it locks once more. The handle may also be set to a position for horizontal carrying by turning it to the upper side to lock in the B position. At the same time, the instrument must be lifted, because otherwise the handle will jump back.
Safety
This instrument has been designed and tested in accordance with IEC Publication 1010-1 (overvoitage category tI, pollution degree 2), Safety requirements for electrical equipment for measurement, control, and laboratory use. The CENELEC regulations EN 61010-1 correspond to this standard. It has left the factory in a safe condition. This instruction manual contains important information and warnings which have to be followed by the user to ensure safe operation and to retain the oscilloscope in a safe condition.
The case, chassis and all measuring terminals are connected to the protective earth contact of the appliance inlet. The instrument operates according to Safety Class | (three-conductor power cord with protective earthing conductor and a plug with earthing contact).
The mains/line plug shall only be inserted in a socket outlet provided with a protective earth contact. The protective action must not be negated by the use of an extension cord without a protective conductor.
The mains/line plug must be inserted before connec- tions are made to measuring circuits.
The grounded accessible metal parts (case, sockets, jacks} and the mains/line supply contacts (line/live, neutral) of the instrument have been tested against insulation breakdown with 2200V DC.
Under certain conditions, 50Hz or 60Hz hum voltages can occur in the measuring circuit due to the interconnection with other mains/line powered equipment or instruments. This can be avoided by using an isolation transformer (Safety Class |I) between the mains/line outlet and the power plug of the device being investigated.
Most cathode-ray tubes develop X-rays.
However, the dose equivalent rate falls far below the maximum permissible value of 36pA/kg (0.5mR/h).
Whenever it is likely that protection has been impaired, the instrument shall be made inoperative and be secured against any unintended operation. The protection is likely to be impaired if, for example, the instrument
shows visible damage,
fails to perform the intended measurements, has been subjected to prolonged storage under unfavorable conditions (e.g. in the open or in moist environments), has been subject to severe transport stress (e.g. in poor packaging).
ee
Intended purpose and operating conditions
This instrument must be used only by qualified experts who are aware of the risks of electrical measurement.
The instrument is specified for operation in industry, light industry, commercial and residential environments.
Due to safety reasons the instrument must only be connected to a properly installed power outlet, containing a protective earth conductor. The protective earth connection must not be broken. The power plug must be inserted in the power outlet while any connection is made to the test device.
The instrument has been designed for indoor use. The permissible ambient temperature range during operation is +10°C (4+50°F) ... +40°C (+104°F). It may occasionally be subjected to temperatures between +10°C (+50°F) and -10°C (+14°F) without degrading its safety. The permissible ambient temperature range for storage or transportation is -40°C (-0°F) ... +70°C (+158°F). The maximum operating altitude is up to
2200m (non-operating 15000m). The maximum relative humidity is up to 80%. If condensed water exists in the instrument it should be acclimatized before switching on. In some cases (e.g. extremely cold oscilloscope) two hours should be allowed before the
Subject to change without notice

General Information
instrument is put into operation. The instrument should be kept in a clean and dry room and must not be operated in explosive, corrosive, dusty, or moist environments. The oscilloscope can be operated in any position, but the convection cooling must not be impaired. The ventilation holes may not be covered. For continuous operation the instrument should be used in the horizontal position, preferably tilted upwards, resting on the tilt handle.
The specifications stating tolerances are only valid if the instrument has warmed up for 30minutes at an ambient temperature between +15°C (+59°F) and +30°C (+86°F) Values without tolerances are typical for an average instrument.
EMC
This instrument conforms to the European standards regarding the electromagnetic compatibility. The applied standards are: Generic immunity standard EN50082-2:1995 (for industrial environment) Generic emission standard EN50081-1:1992 (for residential, commercial and light industry environment).
This means that the instrument has been tested to the highest standards.
Please note that under the influence of strong electromagnetic fields, such signals may be superimposed on the measured signals.
Under certain conditions this is unavoidable due to the instrument's high input sensitivity, high input impedance and bandwidth. Shielded measuring cables, shielding and earthing of the device under test may reduce or eliminate those effects.
Warranty
HAMEG warrants to its Customers that the products it manufactures and sells will be free from defects in materials and workmanship for a period of 2 years. This warranty shall not apply to any defect, failure or damage caused by improper use or inadequate maintenance and care. HAMEG shall not be obliged to provide service under this warranty to repair damage resulting from attempts by personnel other than HAMEG representatives to install, repair, service or modify these products.
In order to obtain service under this warranty, Customers must contact and notify the distributor who has sold the product. Each instrument is subjected to a quality test with 10 hour burn-in before leaving the production. Practically all early failures are detected by this method. In the case of shipments by post, rail or carrier it is recommended that the original packing is carefully preserved. Transport damages and damage due to gross negligence are not covered by the warranty.
In the case of a complaint, a label should be attached to the housing of the instrument which describes briefly the faults observed. If at the same time the name and telephone number (dialing code and telephone or direct number or department designation) is stated for possible queries, this helps towards speeding up the processing of warranty claims.
Maintenance
Various important properties of the oscilloscope should be carefully checked at certain intervals. Only in this way is it largely certain that all signals are displayed with the accuracy on which the technical data are based. The test methods described in the test plan of this manual can be performed without great expenditure on measuring instruments. However,
Subject to change without notice
purchase of the HAMEG scope tester HZ60, which despite its low price is highly suitable for tasks of this type, is very much recommended. The exterior of the oscilloscope should be cleaned regularly with a dusting brush. Dirt which is difficult to remove on the casing and handle, the plastic and aluminum parts, can be removed with a moistened cloth (99% water
+1% mild detergent). Spirit or washing benzene (petroleum ether) can be used to remove greasy dirt. The screen may be cleaned with water or washing benzene (but not with spirit (alcohol) or solvents), it must then be wiped with a dry clean lint-free cloth. Under no circumstances may the cleaning fluid get into the instrument. The use of other cleaning agents can attack the plastic and paint surfaces.
Protective Switch-Off
This instrument is equipped with a switch mode power supply. It has both overvoltage and overload protection, which will cause the switch mode supply to limit power consumption to a minimum. In this case a ticking noise may be heard.
Power supply
The oscilloscope operates on mains/line voltages between 100VAC and 240VAC. No means of switching to different input voltages has therefore been provided.
The power input fuses are externally accessible. The fuseholder is located above the 3-pole power connector. The power input fuses are externally accessible, if the rubber connector is removed. The fuseholder can be released by pressing its plastic retainers with the aid of a small screwdriver. The retainers are located on the right and left side of the holder and must be pressed towards the center. The fuse(s) can then be replaced and pressed in until locked on both sides.
Use of patched fuses or short-circuiting of the fuseholder is not permissible; HAMEG assumes no liability whatsoever for
any damage caused as a result, and all warranty claims become null and void.
Fuse type: Size 5x20mm; 0.8A, 250V AC fuse; must meet IEC specification 127, Sheet Ill (or DIN 41 662 or DIN 41 571, sheet 3). Time characteristic: time-lag Ls
A Attention! :
There is a fuse located inside the instrument within the switch mode power supply:
Size 5x20mm; 0. 8A, '250V AC Nise: must meet IEC specification 127, Sheet ill (or DIN 41 662
or DIN 41 571, sheet 3). Time characteristic: fast (F).
This fuse must not be replaced by the operator!

Type of signal voltage
Type of signal voltage
The following description of the HM1507-2 relates to the analog-oscilloscope mode. Please note “Storage Operati-
a” on.
The oscilloscope HM1507-2allows examination of DC voltages and most repetitive signals in the frequency range up to at least 150MHz (-3qB).
The vertical amplifiers have been designed for minimum overshoot and therefore permit a true signal display.
The display of sinusoidal signals within the bandwidth limits causes no problems, but an increasing error in measurement due to gain reduction must be taken into account when measuring high frequency signals. This error becomes noticeable at approx. 7OMHz. At approx. 110MHzthe reduction is approx. 10% and the real voltage value is 11% higher. The gain reduction error can not be defined exactly as the -3dB bandwidth of the amplifiers differ between 150MHz and 170MHz.
For sinewave signals the -6dB limit is approx. 220MHz.
When examining square or pulse type waveforms, attention must be paid to the harmonic content of such signals. The repetition frequency (fundamental frequency) of the signal must therefore be significantly smaller than the upper limit frequency of the vertical amplifier.
Displaying composite signals can be difficult, especially if they contain no repetitive higher amplitude content which can be used for triggering. This is the case with bursts, for instance. To obtain a well-triggered display in this case, the assistance of the variable holdoff function or the second time base may be required. Television video signals are relatively easy to trigger using the built-in TV-Sync-Separator (TV).
For optional operation as a DC or AC voltage amplifier, each vertical amplifier input is provided with a DC/AC switch. DC coupling shouid only be used with a series-connected attenuator probe or at very low frequencies or if the measurement of the DC voitage content of the signal is absolutely necessary.
When displaying very low frequency pulses, the flat tops may be sloping with AC coupling of the vertical amplifier (AC limit frequency approx. 1.6 Hz for 3dB). In this case, DC operation is preferred, provided the signal voltage is not superimposed on a too high DC level. Otherwise a capacitor of adequate capacitance must be connected to the input of the vertical amplifier with DC coupling. This capacitor must have a sufficiently high breakdown voltage rating. DC coupling is also recommended for the display of logic and pulse signals, especially if the pulse duty factor changes constantly. Otherwise the display will move upwards or downwards at each change. Pure direct voltages can only be measured with DC coupling.
The input coupling is selectable by the AC/DC pushbutton. The actual setting is displayed in the readout with the “ = “ symbol for DC- and the “ ~ ” symbol for AC coupling.
Amplitude Measurements
In general electrical engineering, alternating voltage data normally refers to effective values (rms = root-mean-square value). However, for signal magnitudes and voltage desi- gnations in oscilloscope measurements, the peak-to-peak voltage (Vpp} value is applied. The latter corresponds to the real potential difference between the most positive and most negative points of a signal waveform.
If a sinusoidal waveform, displayed on the oscilloscope screen, is to be converted into an effective (rms) vaiue, the resulting peak-to-peak value must be divided by 2xV2 = 2.83. Conversely, it should be observed that sinusoidal voltages indicated in Vrms (Veff) have 2.83 times the potential difference in Vpp.
The relationship between the different voltage magnitudes can be seen from the following figure.
Voltage values of a sine curve Vrms = effective value; Vp = simple peak or crest value; Vpp = peak-to-peak value; Vmom = momentary value.
The minimum signal voltage which must be applied to the Y input for a trace of 1div height is 1MVpp (+ 5%) when this deflection coefficient is displayed on the screen (readout) and the vernier is switched off (VAR-LED dark). However, smalier signals than this may also be displayed. The deflection coefficients are indicated in mV/div or V/div (peak-to-peak value).
The magnitude of the applied voltage is ascertained by multiplying the selected deflection coefficient by the vertical display height in div. If an attenuator probe x10 is used, a further multiplication by a factor of 10 is required to ascertain the correct voltage value.
For exact amplitude measurements, the variable control (VAR) must be set to its calibrated detent CAL position.
With the variable control activated the deflection sensitivity can be reduced up to a ratio of 2.5 to 1 (please note “controls and readout”). Therefore any intermediate value is possible within the 1-2-5 sequence of the attenuator(s).
With direct connection to the vertical input, signals up to 400Vpp may be displayed (attenuator set to 20V/ div, variable control to 2.5:1).
With the designations
H_ = display height in div, U_ = signal voltage in Vpp at the vertical input, D = deflection coefficient in V/div at attenuator switch,
the required value can be calculated from the two given quantities:
D= Cc Wl 9 <= x " vlc zc
However, these three values are not freely selectable.
They have to be within the following limits (trigger threshold, accuracy of reading):
H between 0.5 and 8div, if possible 3.2 to 8div, U between 0.5mVpp and 160Vpp, D between imV/div and 20V/div in 1-2-5 sequence.
a Subject to change without notice

Type of signal voltage
Examples: Set deflection coefficient D = 50mV/div 0.05V/div, observed display height H = 4.6div, required voltage U = 0.05x4.6 = 0.23Vpp.
Input voltage U = 5Vpp, set deflection coefficient D = 1V/div, required display height H = 5:1 = 5Sdiv.
Signal voltage U = 230Vrmsx 2 V2 = 651Vpp (voltage > 160Vpp, with probe 10:1: U = 65.1Vpp),
desired display height H = min. 3.2div, max. 8&div, max. deflection coefficient D = 65.1:3.2 = 20.3V/div, min. deflection coefficient D = 65.1:8 = 8.1V/div, adjusted deflection coefficient D = 10V/div.
The previous examples are related to the CRT graticule reading. The results can also be determined with the aid of the AV cursor measurement (please note “controls and readout”).
The input voltage must not exceed 400V, indepen- dent from the polarity.
If an AC voltage which is superimposed on a DC voltage is applied, the maximum peak value of both voltages must not exceed + or -400V. So for AC voltages with a mean value of zero volt the maximum peak to peak value is 800Vpp.
If attenuator probes with higher limits are used, the probes limits are valid only if the oscilloscope is set to DC input coupling.
If DC voltages are applied under AC input coupling conditions the oscilloscope maximum input voltage value remains 400V. The attenuator consists of a resistor in the probe and the 1MQ input resistor of the oscilloscope, which are disabled by the AC input coupling capacity when AC coupling is selected. This also applies to DC voltages with superimposed AC voltages. It also must be noted that due to the capacitive resistance of the AC input coupling capacitor, the attenuation ratio depends on the signal frequency. For sinewave signals with frequencies higher than 40Hz this influence is negligible.
With the above listed exceptions HAMEG 10:1 probes can be used for DC measurements up to 6OOV or AC voltages (with a mean value of zero volt) of 1200Vpp. The 100:1 probe HZ53 allows for 1200V DC or 2400Vpp for AC.
It should be noted that its AC peak value is derated at higher frequencies. If a normal x10 probe is used to measure high voltages there is the risk that the compensation trimmer bridging the attenuator series resistor will break down causing damage to the input of the oscilloscope. However, if for
example only the residual ripple of a high voltage is to be displayed on the oscilloscope, a normal x10 probe is sufficient. In this case, an appropriate high voltage capacitor (approx. 22- 68nF) must be connected in series with the input tip of the probe.
With ¥-POS. contro! (input coupling to GD) it is possible to use a horizontal graticule line as reference line for ground potential before the measurement. It can lie below or above the horizontal central line according to whether positive and/or negative deviations from the ground potential are to be measured.
Total value of input voltage
The dotted line shows a voltage alternating at zero volt level. If superimposed on a DC voltage, the addition of the positive peak and the DC voltage results in the max. voltage (DC + ACpeak).
Subject to change without notice
Voltage
DE + AC peak = 400Vanw.
Time Measurements
Asarule, most signals to be displayed are periodically repeating processes, also called periods. The number of periods per second is the repetition frequency. Depending on the time base setting (TIME/DIV.-knob) indicated by the readout, one or several signal periods or only a part of a period can be displayed. The time coefficients are stated in ms/div, ps/div or ns/div. The following examples are related to the CRT graticule reading. The results can also be determined with the aid of the At and 1/At cursor measurement (please note “
controls and readout”).
The duration of a signal period or a part of it is determined by multiplying the relevant time (horizontal distance in div) by the (calibrated) time coefficient displayed in the readout .
Uncalibrated, the time base speed can be reduced until a maximum factor of 2.5 is reached. Therefore any intermediate value is possible within the 1-2-5 sequence.
With the designations L_ = displayed wave length in div of one period, T = time in seconds for one period, F = recurrence frequency in Hz of the signal, Te = time coefficient in ms, us or ns/div and the relation F = 1/T, the following equations can be stated:
=[- =a ot Th ep Tey
1 re Fepq, bret, Tor
However, these four values are not freely selectable. They have to be within the following limits:
L_ between 0.2 and 10div, if possible 4 to 10div, T between 5ns and 5s, F between 0.5Hz and 100MHz,
Te between 5Ons/div and 500ms/div in 1-2-5 sequence (with X-MAG. (x10) inactive), and
Te between 5ns/div and 50ms/div in 1-2-5 sequence (with X-MAG. (x10) active).
Examples: Displayed wavelength L = 7div, set time coefficient Tc = 100ns/div,
required period T = 7x100x10-9 = 0.7us required rec. freq. F = 1:(0.7x10⁻⁶) = 1.428MHz.
Signal period T = 1s, set time coefficient Tc = 0.2s/div, required wavelength L = 1:0.2 = 5div.
Displayed ripple wavelength L = 1div, set time coefficient Tc = 10ms/div,

Type of signal voltage 2 A a
required ripple freq. F = 1:(1x10x10-3) = 100Hz. Tv-line frequency F = 15625Hz, set time coefficient Tc = 10us/div, required wavelength L = 1:(15625x10-5) = 6.4div.
Sine wavelength L = min. 4div, max. 10div, Frequency F = 1kHz, max. time coefficient Tc = 1:(4x10³) = 0.25ms/div, min. time coefficient Tc = 1:(10x103) = 0.1ms/div, set time coefficient Tc = 0.2ms/div, required wavelength L = 1:(103x0.2x10-3) = Sdiv.
Displayed wavelength L = 0.8div, set time coefficient Tc = 0.5us/div, pressed X-MAG. (x10) pushbutton: Tc = 0.05us/div, required rec. freq. F = 1:(0.8x0.05x10-6) = 25MHz,
required period T = 1:(25x106) = 40ns.
lf the time is relatively short as compared with the complete signal period, an expanded time scale should always be applied (X-MAG. (x10) active). In this case, the time interval of interest can be shifted to the screen center using the X-POS. control.
When investigating pulse or square waveforms, the critical feature is the risetime of the voltage step. To ensure that transients, ramp-offs, and bandwidth limits do not unduly influence the measuring accuracy, the risetime is generally measured between 10% and 90% of the vertical pulse height. For measurement, adjust the Y deflection coefficient using its variable function (uncalibrated) together with the Y-POS. control so that the pulse height is precisely aligned with the 0% and 100% lines of the internal graticule. The 10% and 90% points of the signal will now coincide with the 10% and 90% graticule lines. The risetime is given by the product of the horizontal distance in div between these two coincident points and the calibrated time coefficient setting. The fall time of a pulse can also be measured by using this method.
The following figure shows correct positioning of the oscilloscope trace for accurate risetime measurement.
100% 90%
10% 0
ttot
With a time coefficient of 5ns/div (X x10 magnification active),
the example shown in the above figure results in a total measured risetime of
trot = 1.6div x 5ns/div : 10 = 8ns
When very fast risetimes are being measured, the risetimes of the oscilloscope amplifier and of the attenuator probe has to be deducted from the measured time value. The risetime of the signal can be calculated using the following formula.
t=’ i - i a
In this ttot is the total measured risetime, tosc is the risetime of the oscilloscope amplifier (approx. 2.3ns), and tp the risetime of the probe (e.g. = 2ns). If ttot is greater than 34ns, then ttot
can be taken as the risetime of the pulse, and calculation is unnecessary.
Calculation of the example in the figure above results in a signal risetime
tr = V 82 - 2.32 - 22 = 7.4ns
The measurement of the rise or fall time is not limited to the trace dimensions shown in the above diagram. It is only particularly simple in this way. In principle it is possible to
measure in any display position and at any signal amplitude. It
is only important that the full height of the signa! edge of interest is visible in its full !ength at not too great steepness and
that the horizontal distance at 10% and 90% of the amplitude is measured. If the edge shows rounding or overshooting, the 100% should not be related to the peak values but to the mean pulse heights. Breaks or peaks (glitches) next to the edge are also not taken into account. With very severe transient distortions, the rise and fall time measurement has little meaning. For amplifiers with approximately constant group
delay (therefore good pulse transmission performance) the
following numerical relationship between rise time tr (in ns) and bandwidth B (in MHz) applies:
350 taal: @ B as
Connection of Test Signal
In most cases briefly depressing the AUTO SET causes a useful signal related instrument setting. The following explanations refer to special applications and/or signals, demanding a manual instrument setting. The description of the controls is explained in the section “controls and readout”.
Caution: When connecting unknown signals to the oscilloscope input, always use automatic triggering and set the input coupling switch to AC (readout). The attenuator should initially be set to 20V/div.
Sometimes the trace will disappear after an input signal has been applied. Then a higher deflection coefficient (lower input sensitivity) must be chosen until the vertical signal height is
only 3-8div. With a signal amplitude greater than 160Vpp and
the deflection coefficient(VOLTS/DIV.) in calibrated condition,
an attenuator probe must be inserted before the vertical input.
lf, after applying the signal, the trace is nearly blanked, the
period of the signal is probably substantially longer than the set
time deflection coefficient (TIME/DIV.}. It should be switched to an adequately larger time coefficient.
The signal to be displayed can be connected directly to the Y- input of the oscilloscope with a shielded test cable such as HZ32 or HZ34, or reduced through a x10 or x100 attenuator
probe. The use of test cables with high impedance circuits is
only recommended for relatively low frequencies (up to approx.
50kHz). For higher frequencies, the signal source must be of low impedance, i.e. matched to the characteristic resistance
of the cable (as a rule 509). Especially when transmitting
square and pulse signals, a resistor equal to the characteristic
impedance of the cable must also be connected across the
cable directly at the Y-input of the oscilloscope. When using a
50Q cable such as the HZ34, a 50Q through termination type
HZ22 is available from HAMEG. When transmitting square
signals with short rise times, transient phenomena on the
edges and top of the signal may become visible if the correct
termination is not used. A terminating resistance is sometimes
recommended with sine signals as well. Certain amplifiers,
generators or their attenuators maintain the nominal output
m= Subject to change without notice

Controls and readout
voltage independent of frequency only if their connection cable is terminated with the prescribed resistance. Here it must be noted that the terminating resistor HZ22 will only dissipate a maximum of 2Watts. This power is reached with 10Vrms or at 28.3Vpp with sine signal. If a x10 or x100 attenuator probe is used, no termination is necessary. In this case, the connecting cable is matched directly to the high impedance input of the oscilloscope. When using attenuators probes, even high internal impedance sources are only slightly loaded (approx. 10MQ. II 12pF or 100MQ II 5pF with HZ53). Therefore, if the voltage joss due to the attenuation of the probe can be compensated by a higher amplitude setting, the probe should always be used. The series impedance of the probe provides a certain amount of protection for the input of the vertical amplifier. Because of their separate manufacture, all attenuator probes are only partially compensated, therefore accurate compensation must be performed on the oscilloscope (see Probe compensation).
Standard attenuator probes on the oscilloscope normally reduce its bandwidth and increase the rise time. In all cases where the oscilloscope bandwidth must be fully utilized (e.g. for pulses with steep edges) we strongly advise using the probes HZ51 (x10) HZ52 (x10 HF) and HZ54 (x1 and x10). This can save the purchase of an oscilloscope with larger bandwidth.
The probes mentioned have a HF-calibration in addition to low frequency calibration adjustment. Thus a group delay correction to the upper limit frequency of the oscilloscope is possible with the aid of an 1MHz calibrator, e.g. HZ60.
In fact the bandwidth and rise time of the oscilloscope are not noticably changed with these probe types and the waveform reproduction fidelity can even be improved because the probe can be matched to the oscilloscopes individual pulse response.
If a x10 or x100 attenuator probe is used, DC input coupling must always be used at voltages above 400V. With AC coupling of low frequency signals, the attenuation is no longer independent of frequency, pulses can show pulse tilts. Direct voltages are suppressed but load the oscilloscope input coupling capacitor concerned. Its voltage rating is max. 400 V (DC + peak AC). DC input coupling is therefore of quite special importance with a x100 attenuation probe which usually has a voltage rating of max. 1200 V (DC + peak AC). A capacitor of corresponding capacitance and voltage rating may be connected in series with the attenuator probe input for blocking DC voltage (e.g. for hum voltage measurement).
With all attenuator probes, the maximum AC input voltage must be derated with frequency usually above 20kHz. Therefore the derating curve of the attenuator probe type concerned must be taken into account.
The selection of the ground point on the test object is important when displaying small signal voltages. It should always be as close as possible to the measuring point. If this is not done, serious signal distortion may result from spurious currents through the ground leads or chassis parts. The ground leads on attenuator probes are also particularly critical.
They should be as short and thick as possible. When the attenuator probe is connected to a BNC-socket, a BNC-adapter,
should be used. In this way ground and matching probiems are eliminated. Hum or interference appearing in the measuring circuit (especially when a small deflection coefficient is used) is possibly caused by multiple grounding because equalizing currents can flow in the shielding of the test cables (voltage drop between the protective conductor connections, caused
Subject to change without notice
by external equipment connected to the mains/line, e.g. signal generators with interference protection capacitors).
Controls and Readout
The following description assumes that the instrument is not set to “COMPONENT TESTER” mode.
If the instrument is switched on, all important settings are displayed in the readout. The LED’s located on the front panel assist operation and indicate additional information. Incorrect operation and the electrical end positions of control knobs are indicated by a warning beep.
Except for the power pushbutton (POWER), the calibrator frequency pushbutton (CAL. 1kHz/1MHz), the focus control (FOCUS) and the trace rotation control (TR) all other controls are electronically selected. All other functions and their settings can therefore be remote controlied and stored. Some controls are only operative in storage mode or have different functions in analog operation. See “STORAGE MODE ONLY”.
The front panel is subdivided into sections.
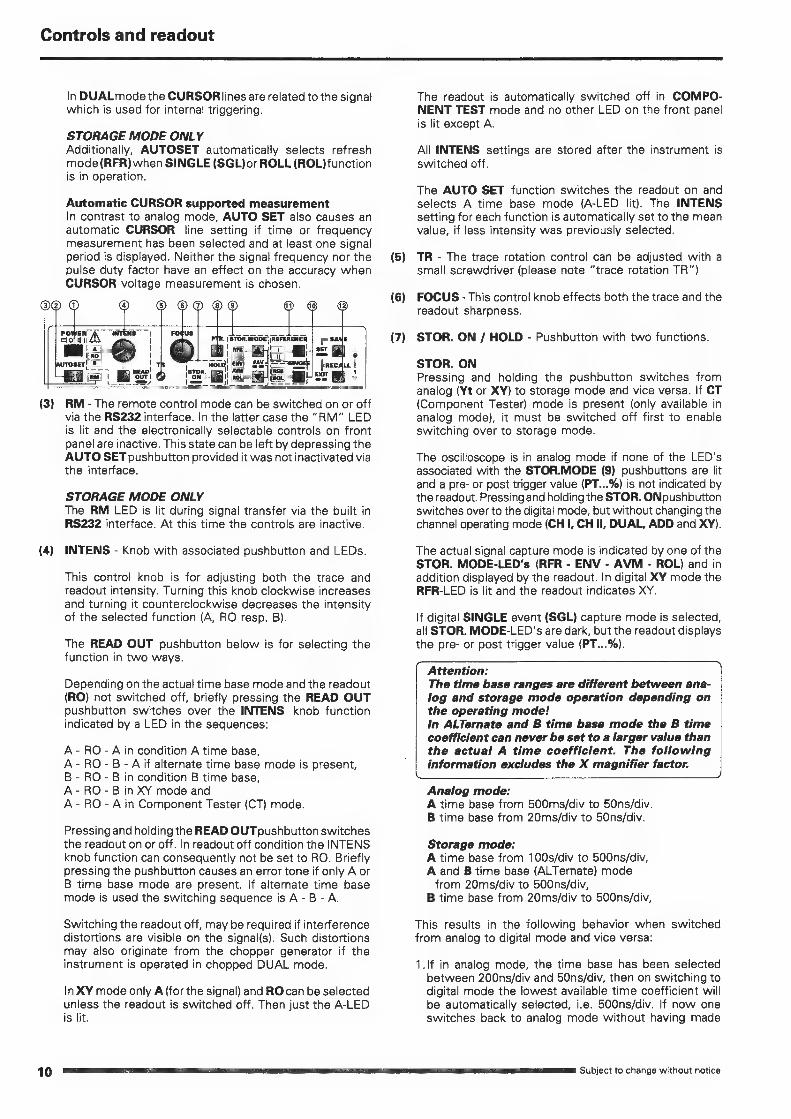
On the top, immediately to the right of the CRT screen, the following contrals and LED indicators are placed:
. (STOR MODE REFERENCE FF
(1) POWER - Pushbutton and symbols for ON (I) and OFF (O). After the oscilloscope is switched on, all LEDs lit and an automated instrument test is performed. During this time the HAMEG logo and the software version are displayed on the screen. After the internal test is completed succesfully, the overlay is switched off and the normal operation mode is present. Then the last used settings become activated and one LED indicates the ON condition.
Some mode functions can be modified (SETUP) and/or automated adjustment procedures (CALIBRATE) can be called if the “MAIN MENU” is present. To enter this menu the AUTO SET pushbutton must be pressed constantly when the HAMEG logo is displayed until “MAIN MENU” becomes visible. For further information please note “MENU”.
(2) AUTO SET - Briefly depressing this pushbutton results in an automatic signal related instrument setting (please note “AUTO SET”), if the signal frequency and height are suited for automatic triggering (AT). In Yt mode the actual channel operating conditions (CH I, CH IlorDUAL) remain unchanged, whereas the time base is automatically set to A time base mode.
In case of XY or CT (Component Tester) operation, the instrument is set to the last used Yt mode setting.
Automatic CURSOR supported voltage measurement if CURSOR voltage measurement is present, the CUR- SOR lines are automatically set to the positive and negative peak value of the signal. The accuracy of this function depends on the signal frequency and is also influenced by the signal's pulse duty factor. If the signal height is insufficient, the CURSOR lines do not change.
Controls and readout
(3)
(4)
In DUALmode the CURSORlines are related to the signal which is used for internal triggering.
STORAGE MODE ONLY Additionally, AUTOSET automatically selects refresh mode(RFR) when SINGLE (SGL) or ROLL (ROL)function is in operation.
Automatic CURSOR supported measurement In contrast to analog mode, AUTO SET also causes an automatic CURSOR line setting if time or frequency measurement has been selected and at least one signal period is displayed. Neither the signal frequency nor the pulse duty factor have an effect on the accuracy when CURSOR voltage measurement is chosen.
q
is er
RM - The remote control mode can be switched on or off via the RS232 interface. In the latter case the “RM” LED is lit and the electronically selectable controls on front panel are inactive. This state can be left by depressing the AUTO SET pushbutton provided it was not inactivated via the interface.
STORAGE MODE ONLY The RM LED is lit during signal transfer via the built in RS232 interface. At this time the controls are inactive.
INTENS - Knob with associated pushbutton and LEDs.
This control knob is for adjusting both the trace and readout intensity. Turning this knob clockwise increases and turning it counterclockwise decreases the intensity of the selected function (A, RO resp. B).
The READ OUT pushbutton below is for selecting the function in two ways.
Depending on the actual time base mode and the readout (RO) not switched off, briefly pressing the READ OUT pushbutton switches over the INTENS knob function indicated by a LED in the sequences:
A - RO - A in condition A time base, A- RO -B -A if alternate time base mode is present, B - RO -B in condition B time base, A - RO - B in XY mode and A- RO - Ain Component Tester (CT) mode.
Pressing and holding the READ OUTpushbutton switches the readout on or off. In readout off condition the INTENS knob function can consequently not be set to RO. Briefly pressing the pushbutton causes an error tone if only A or B time base mode are present. If alternate time base mode is used the switching sequence is A- B- A.
Switching the readout off, may be required if interference distortions are visible on the signal(s). Such distortions may also originate from the chopper generator if the instrument is operated in chopped DUAL mode.
In X¥ mode only A (for the signal) and ROcan be selected unless the readout is switched off. Then just the A-LED is lit.
(5)
(6)
(7)
The readout is automatically switched off in COMPO- NENT TEST mode and no other LED on the front panel is lit except A.
All INTENS settings are stored after the instrument is switched off.
The AUTO SET function switches the readout on and selects A time base mode (A-LED lit). The INTENS setting for each function is automatically set to the mean value, if less intensity was previously selected.
TR - The trace rotation control can be adjusted with a small screwdriver (please note “trace rotation TR”)
FOCUS - This contro! knob effects both the trace and the readout sharpness.
STOR. ON / HOLD - Pushbutton with two functions.
STOR. ON Pressing and holding the pushbutton switches from analog (Yt or XY) to storage mode and vice versa. If CT (Component Tester) mode is present (only available in analog mode), it must be switched off first to enable switching over to storage mode.
The oscilloscope is in analog mode if none of the LED’s associated with the STOR.MODE (9) pushbuttons are lit and a pre- or post trigger value (PT...%) is not indicated by the readout. Pressing and holding the STOR. ONpushbutton switches over to the digital mode, but without changing the channel operating mode (CH I, CH Il, DUAL, ADD and XY).
The actual signal capture mode is indicated by one of the STOR. MODE-LED’s (RFR - ENV - AVM - ROL) and in addition displayed by the readout. In digital X¥ mode the RFR-LED is lit and the readout indicates XY.
If digital SINGLE event (SGL) capture mode is selected, all STOR. MODE-LED's are dark, but the readout displays the pre- or post trigger value (PT...%).
Attention: The time base ranges are different between ana- log and storage mode operation depending on the operating mode! In ALTernate and B time base mode the B time coefficient can never be set to a larger value than the actual A time coefficient. The following information excludes the X magnifier factor.
Analog mode: A time base from 500ms/div to 50ns/div. B time base from 20ms/div to 50ns/div.
Storage mode: A time base from 100s/div to 500ns/div, A and B time base (ALTernate) mode from 20ms/div to 500ns/div,
B time base from 20ms/div to 500ns/div,
This results in the following behavior when switched from analog to digital mode and vice versa:
1.If in analog mode, the time base has been selected
between 200ns/div and 50ns/div, then on switching to digital mode the lowest available time coefficient will be automatically selected, i.e. 500ns/div. If now one switches back to analog mode without having made
Subject to change without notice

Subject to change without notice
any time base changes in the digital mode, then the last time base selected in the analog mode is again active (e.g. 200ns/div).
If on the other hand, the time base is changed after switching over to digital mode (e.g. to 2us/div). Then, when switched back to analog mode, the time base in analog mode will be set to the value selected in the digital mode (e.g. 2s/div).
2.If a time base between 100s/div and 1s/div has been set in the digital mode and the mode is switched to analog, then the time base in analog mode is automatically set to 500ms/div. The rest is as described before.
The X-MAG x10 setting remains unchanged when switched from analog to digital mode and vice versa.
STORAGE MODE ONLY If by pressing and holding the STOR. ON / HOLD pushbutton, the mode is switched to digital, then one of the associated LED’s lights up. Which one it is, depends on the last selected digital operation.
Exception
Switching over from analog SINGLE mode to digi- tal mode sets the instrument automatically to digital SINGLE mode.
For additional information regarding the digital mode, see section STORAGE OPERATION.
HOLD
STORAGE MODE ONLY Briefly pressing the STOR. ON / HOLD pushbutton switches over between protected and unprotected mode of the current memory contents.
The current contents of the memory are protected against overwriting when HLD (HOLD) instead of channel information (e.g. Y1... ) is displayed in the readout. This prevents a change in the Yt mode setting, but it is possible to select between DUAL (Yt) and XY display by pressing the DUAL (23) pushbutton if one of these modes was selected before activating HOLD.
If HOLD is switched off, one can observe how the existing memory contents are successively overwritten by new data especially with slow time base settings and refresh mode. Protecting the memory contents in the middle of a data acquisition process can result in an irregularity at the junction of old (right) and new data (left). This can be avoided by recording in single shot mode (SGL), even though the input signal is repetitive. At the end of a sweep, one can use HOLD io protect the contents against being overwritten by an unintentional actuation of RESET (RES).
The signal in each of the current memory can be shifted in the vertical direction (+/- 4div) with the corresponding Y- POS rotary knob when HOLD is operative.
The original trace position willbe lost when shifted vertically, but this can be found again. To this end the Y-POS knob in question must be rotated quickly. Once the original position is reached, the trace does not shift anymore although the knob is rotated further. Simultaneously a signal tone sounds. To shift the trace vertically again it will be required to stop rotating the knob for at least about 2 seconds.
Controls and readout
Attention! The dynamic range limits of the A/D converter may become visible if a Y-position shift is performed after storage. This can affect those signal parts which were originally above or below the screen.
POWER) dod
(8) PTR - Pushbutton for PRE- and POST Trigger selection.
This function is not available in analog mode.
The PRE TRIGGERfunction is used to capture signals that occur prior to a trigger event, making the prehistory visible. In contrast to this function, the POST TRIGGER is used to capture signals occurring after the trigger event, which could not be captured in "0%" pre trigger condition. Due to the dependence on trigger events, neither function is available in the trigger independent modes XY and ROLL.
The actual PRE- or POST TRIGGER value is displayed by the readout and changes, each time the PTR pushbutton is pressed, in the following sequence: PT0%, PT25%, PT50%, PT75%, PT100%, PT-75%, PT-50%, PT-25% and back to PT0%. The values refer to the X-axis (graticule) of the screen display (10% = 1div).
The following description assumes that the X magnifier (x10) is inactive and the signal display starts on the leftmost vertical graticule line. It is also assumed that a trigger mode (source, coupling) is chosen, in which the trigger point symbol! is displayed. In contrast to analog mode, using pre trigger the trigger point symbol can be shifted in X-direction.
PRE TRIGGER
0% PRE TRIGGER (readout "PT0%”) means that the signal display starts with the trigger event. The trigger point symbol indicates this position. If the X-POS. contro! is not in center position, an arrow pointing to the left may be displayed. Then the X-POS. (19) control must be turned clockwise until the arrow is no longer visible.
25% PRE TRIGGER (readout “PT25%”) is achieved after pressing the PTR pushbutton once. The signal display starts with 25% prehistory and the trigger point symbol is shifted 2.5 divisions to the right.
Each time thePTR pushbutton is pressed thePRE TRIGGER value increases by 25% until 100% is reached. If in 100% condition an arrow symbol is displayed in addition to the trigger point symbol, the X-POS. control should be turned ccw. to make the trigger point visible on the screen.
The duration of the prehistory is determined by multiplying the time coefficient by the pre trigger value (in divisions). E.g. 20ms/div x 7,5 div (= 75% pre trigger) = 150ms.
POST TRIGGER
In POST TRIGGER condition the trigger point is always to the left of the screen and therefore not visible. The trigger
11

Controls and readout
point symbol then only indicates the LEVEL setting. An additional arrow symbol which points to the left is displayed to indicate post trigger operation. In POST TRIGGER condition the arrow symbo! does not indicate a wrong X- POS. setting. A minus sign (-) placed in front of the percentage value, is displayed by the readout for POST TRIGGER mode indication.
Proceeding from 100% pre trigger, the instrument swit- ches over to 75% POST TRIGGER ("PT-75%”) after the PTR pushbutton is pressed. Then the trigger point is 7.5 div to the left of the trace start on the screen. This means that the signal capture starts 7.5 x time deflection coefficient after the trigger event occurred.
Every time the PTR pushbutton is pressed the POST TRIGGER value changes in 25% steps until PTR-25% is active. When the PTR pushbutton is pressed again, both post and pre trigger are switched off and the readout indicates ”"PTO%”.
Attention! In time base settings from 100s/div to 50ms/div the pre-
or post trigger is automatically switched off (”PT0%) if refresh (RFR), envelope (ENV) or average (AVM) mode is active. This is to avoid excessive waiting times.
If the pre- or post trigger function is required in combination with those time coefficients, SINGLE (SGL) mode opera- tion must be used.
D2 1 4 5 6) @ RC) Ww 10) 2
POWER) A INTENS qodi|
(9) STOR. MODE - Pushbuttons with associated LEDs.
A\ These functions are not available in analog mode.
If digital SINGLE (SGL) mode has not been chosen, one of the associated LEDs is lit. The signal capture and display mode can be selected by pressing one of the pushbuttons. The mode setting is indicated by one of the LEDs (RFR, ENV, AVM and ROL) and also displayed by the readout. The only exception is in X¥ storage mode. Then the RFR-LED is lit and the readout displays XY. No other signal capture and display mode can be chosen in XY mode.
The desired Yt signal capture mode can be selected by pressing the upper or lower STOR. MODE pushbutton.
The following description presumes that HOLD (HLD) is not activated and the trigger conditions are met.
(9) RFR - stands for refresh operation. In this mode, as in analog mode, periodically repeating signals can be captured and displayed.
The signal acquisition is started by triggering the digital time base. Then the previously captured and displayed signal will be overwritten with the current signal. This will be displayed until the digital time base is triggered again. This is in contrast to analog operation where the screen remains blank when the time base is not triggered.
In refresh mode, the signal acquisition can be effected with pre- or post triggering when a time base between
20ms/div and 500ns/div is selected. The pre triggering or post triggering will be automatically switched off (PT0%), with larger time coefficients (100s/div to 50ms/div) in order to avoid excessive waiting times. If it is required to measure with pre- or post trigger in this time base range, one should select single shot (SINGLE = SGL).
In XY digital mode the RFR-LED lights. It indicates a continuous, trigger independent signal acquisition. The trigger circuit is switched off.
(9) ENV - is the abbreviation for ENVELOPE operation.
In this mode the minimum and maximum values of the signal during several signal acquisitions will be determined and displayed. Except for this display, the ENVELOPE operation is identical to the refresh operation.
Changes in the signal are easier to measure and are more visible in ENVELOPE operation. This is valid not only for amplitude changes but also for frequency variations (Jitter).
The ENVELOPE evaluation begins anew when the SIN- GLE (10) pushbutton is pressed briefly, to actuate the RESET (RES) function.
Attention! The pre- or post trigger will be automatically switched off (PT0%) in the time base range from 100s/div to 50ms/div.
(9) AVM - indicates AVERAGE (mean value) mode. This operation is effective when the AVM-LED lights up and the readout displays AV... .
In this case also several signal acquisition scans are required; hence, it is similar to Refresh operation. The signal is averaged over the several acquisitions so that amplitude variations ( e.g. noise) and frequency variations (Jitter) are minimized or eliminated in the display.
The accuracy of the mean value evaluation increases as the number of signal acquisition scans used for evaluation is increased. One can select the number between 2 and 512. The selected setting is displayed in the readout. Of course, with increasing accuracy the time required for this also increases.
To select a different value briefly press both STOR. MODE pushbuttons simultaneously. The AV... display in the readout flashes indicating the setting mode. Now, the value can be changed by briefly pressing the upper or lower STOR. MODE pushbutton. The setting mode can be exited by again briefly pressing the two pushbuttons simultaneously. The setting mode will also be switched off automatically if none of the two pushbuttons is actuated during about 10 seconds.
The averaging begins anew after briefly pressing the SINGLE (10) pushbutton (RESET function).
Attention! The pre- or post trigger will be automatically switched off (PT0%) in the time base range from 100s/div to 50ms/div.
(9) ROL - indicates ROLL mode.
In ROLL mode the ROL-LED is lit and the readout displays “ROL”.
ees Subject to change without notice

Subject to change without notice
In this mode, the memory contents and thus also the signal display, are continuously updated. Because signal capture is untriggered, no idle states arise while waiting for a new trigger event to start signal capture. With each signal sampling the new value is shown on the right-hand edge of the screen, while the previously captured data are shifted to the left. The leftmost value is shifted out of the memory and lost.
The recording can be stopped at any time by selecting the HOLD (7) function.
ROLL mode can only be used with time coefficients from 100s/div to 50ms/div, as lower time coefficients (faster time base speeds) are impractical.
If the time base is set to values between 20ms/div and 500ns/div and ROLL mode is selected, the time base will
be automatically set to 50ms/div. The time deflection coefficient set previously before switching to ROLL mode will be internally stored (e.g. 20ms/div). If ROLL mode has been selected inadvertently and the TIME/DIV. knob has not been changed, the time base will be automatically set to the internally stored coefficient when switching from ROLL to AVERAGE mode.
POWER} NS dod
(10) SINGLE - Pushbutton with two functions and associated LEDs.
SINGLE Pressing and holding this pushbutton switches the SIN- GLE event capturing mode on or off. SINGLE mode is indicated by the associated SGL-LED.
SINGLE mode is available in digital as well as in analog mode and remains unchanged when switching over from analog to digital mode or vice versa. The main purpose of SINGLE is the capture of one time events, but it can also be used in combination with repetitive signals.
SINGLE mode automatically selects A time base mode and normal triggering (NM-LED lit). Otherwise the automatic trigger (AT) would occur without an input (trigger) signal.
If the trigger circuit is activated by RESET, one time base sweep (analog mode) or one complete data acquisition (digital mode) is performed after a suited signal caused triggering. Switching over to SINGLE in analog mode interrupts the time base sweep and blanks the beam.
Storage mode only Selecting SINGLE stops the current data acquisition. Until a new data acquisition is started, the memory content is displayed continuously.
In combination with Yt (time base) mode, SINGLE is indicated by the readout. It displays the actual pre- or post trigger value and "SGL” instead of “RFR”, “ENV”, "AV..." or "ROL". If X¥ mode is active the A time deflection coefficient is replaced by the sampling rate (e.g. 100MS/s) dispiay in the readout and additionally the trigger regarding information is switched off.
Controls and readout
Attention! If SINGLE mode is present in combination with DUAL mode, the minimum time coefficient is 2us/ div instead of 500ns/div. Similarly if X-MAG. x10 is operative, then 200ns/div replaces 50ns/div.
ANALOG MODE ONLY Selecting SINGLE mode switches the current sweep off and blanks the screen.
SINGLE mode is indicated by the lit SGL-LED and the readout displaying SGL next to the / (SLOPE) symbol.
RESET (RES) Briefly pressing the SINGLE pushbutton causes a RESET activating the trigger circuit if Yt mode is active. The result depends on the current signal capture mode.
STORAGE MODE ONLY a) In combination with SINGLE, briefly pressing the SINGLE pushbutton activates the RESET function. Then both LEDs (SGL and RES) are lit. Whether the RES-LED flashes once or is lit constantly, depends on:
1, the presence or absence of a trigger signal,
2. the selected time coefficient (time base) and 3. the pre- or post trigger setting.
After the RESET function is switched on, the signal acquisition will be effective at once if the HOLD function is not active. If the pre trigger function is active, the prehistory must elapse before the trigger event becomes effective. The signal capture terminates with the trigger event only with 100% pre trigger setting.
With all other pre trigger and post trigger settings, the signal acquisition is not complete when the trigger occurs and will only be terminated later. After termination the RES-LED extinguishes but the signal display remains. Briefly pressing the SINGLEpushbutton (RESET function) again restarts a new single event capture which then overwrites the previously recorded display.
Single events recorded in DUAL mode can also be displayed in the XY mode when switched over to XY operation.
XY mode Briefly pressing the SINGLE pushbutton (RESET function) causes one complete trigger independent signal recording. The RES-LED extinguishes after completion. Thereafter it is possible to switch over to DUAL mode to display the signals in Yt (time base) mode.
Attention! if time coefficients between 100s/div and 50ms/div are present the signal acquisition becomes visible at once as a ROLL display, but the signal acquisition has nothing to do with ROLL mode.
b) Briefly pressing the SINGLEpushbutton (RESETfunction) is also effective if (instead of SINGLE) ENVELOPE or AVERAGE mode is selected.
In both modes the evaluation / averaging begins anew.
ANALOG MODE ONLY Capturing single events can also be carried out in analog . Yt (time base) mode (e.g. photographing).
Controls and readout
Briefly pressing the SINGLE pushbutton activates the RES-LED in SINGLE mode. The next trigger event then unblanks the beam and causes one time base sweep.
Only in chopped DUAL mode can both channels be displayed during one time base sweep.
XY mode is not available in combination with SINGLE operation.
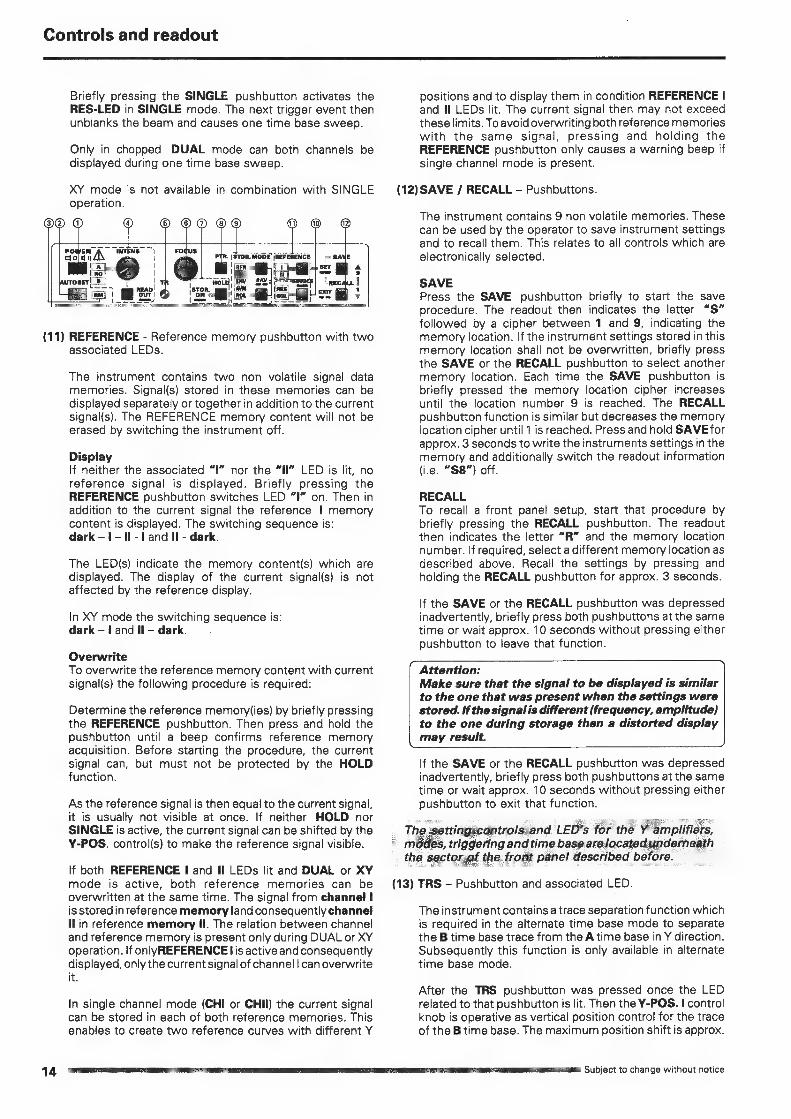
Foq¢us ne pa . [STOR MODE) |REFERENCR | j= SAME Hs i
(11) REFERENCE - Reference memory pushbutton with two associated LEDs.
The instrument contains two non volatile signal data memories. Signal(s) stored in these memories can be displayed separately or together in addition to the current signal(s). The REFERENCE memory content will not be erased by switching the instrument off.
Display If neither the associated “I” nor the “Il” LED is lit, no
reference signal is displayed. Briefly pressing the REFERENCE pushbutton switches LED “I” on. Then in addition to the current signal the reference | memory content is displayed. The switching sequence is: dark —1- Il - 1 and Il - dark.
The LED(s) indicate the memory content(s) which are displayed. The display of the current signal(s) is not affected by the reference display.
In XY mode the switching sequence is: dark — | and Il —- dark.
Overwrite To overwrite the reference memory content with current signal(s) the following procedure is required:
Determine the reference memory(ies) by briefly pressing the REFERENCE pushbutton. Then press and hold the pushbutton until a beep confirms reference memory acquisition. Before starting the procedure, the current signal can, but must not be protected by the HOLD function.
As the reference signal is then equal to the current signal, it is usually not visible at once. If neither HOLD nor
positions and to display them in condition REFERENCE | and Il LEDs lit. The current signal then may not exceed these limits. To avoid overwriting both reference memories with the same signal, pressing and holding the REFERENCE pushbutton only causes a warning beep if single channel mode is present.
(12) SAVE / RECALL - Pushbuttons.
The instrument contains 9 non volatile memories. These can be used by the operator to save instrument settings and to recall them. This relates to all controls which are electronically selected.
SAVE Press the SAVE pushbutton briefly to start the save procedure. The readout then indicates the letter “S” followed by a cipher between 1 and 9, indicating the memory location. If the instrument settings stored in this memory location shall not be overwritten, briefly press the SAVE or the RECALL pushbutton to select another memory location. Each time the SAVE pushbutton is briefly pressed the memory location cipher increases until the location number 9 is reached. The RECALL pushbutton function is similar but decreases the memory location cipher until 1 is reached. Press and hold SAVE for approx. 3 seconds to write the instruments settings in the memory and additionally switch the readout information (i.e. “S8”) off.
RECALL To recall a front panel setup, start that procedure by briefly pressing the RECALL pushbutton. The readout then indicates the letter “R” and the memory location number. If required, select a different memory location as described above. Recall the settings by pressing and holding the RECALL pushbutton for approx. 3 seconds.
If the SAVE or the RECALL pushbutton was depressed inadvertently, briefly press both pushbuttons at the same time or wait approx. 10 seconds without pressing either pushbutton to leave that function.
Attention: Make sure that the signal to be displayed is similar to the one that was present when the settings were stored. If the signal is different (frequency, amplitude) to the one during storage then a distorted display may result.
If the SAVE or the RECALL pushbutton was depressed inadvertently, briefly press both pushbuttons at the same time or wait approx. 10 seconds without pressing either pushbutton to exit that function.
The setting controls and LED‘s for the Y amplifiers, modes, triggering and time base are located underneath the sector of the front panei described before.
SINGLE is active, the current signal can be shifted by the Y-POS. control(s) to make the reference signal visible.
If both REFERENCE | and Il LEDs lit and DUAL or XY mode is active, both reference memories can be overwritten at the same time. The signal from channel | is stored inreference memory land consequently channel Il in reference memory Il. The relation between channel and reference memory is present only during DUAL or XY operation. If onlyREFERENCE lis active and consequently displayed, only the current signal of channel | can overwrite it.
In single channel mode (CHI or CHI) the current signal can be stored in each of both reference memories. This enables to create two reference curves with different Y
(13) TRS — Pushbutton and associated LED.
The instrument contains a trace separation function which is required in the alternate time base mode to separate the B time base trace from the A time base in Y direction. Subsequently this function is only available in alternate time base mode.
After the TRS pushbutton was pressed once the LED related to that pushbutton is lit. Then the Y-POS. I control knob is operative as vertical position control for the trace of the B time base. The maximum position shift is approx.
Subject to change without notice

+/- 4 div. Without a change of the Y-POS. I control the trace separation function is switched off automatically after approx. 10 seconds. The trace separation function can also be left by pressing the TRS pushbutton.
ANALOG _Y- DIGITAL SCOPE
HM1507 VOLTS/DIV.
(14) Y-POS. 1 — Control knob with two functions.
The vertical trace position of channel | can be set with this control knob. In ADD (addition) mode both (Y-POS. | and Y-POS. II) contro! knobs are active. In alternate time base mode, this contro! knob can be used to separate the B time base trace from theA time base trace. Please note TRS (13).
lf automatic triggering (AT) is present and the input is set to GD (34), the vertical trace position corresponds with 0 Volt (reference) at the input and can be set to any suitabie position. In ADD mode these conditions apply to both channels. After switching GD off and selecting DC input coupling it is possible to determine the DC content of a signal by comparing the actual Y position with the previously determined 0 Volt Y position.
Y-POS. | Symbol Provided that the readout is displayed and “DC REFERENCE = ON” is selected in the “SETUP” submenu “MISCELLANEOUS” the 0 Volt reference position is indicated by a ground (1) symbol. For channel | this symbol is displayed on the left of the vertical (graticule) center line, if the ¥Y-POS. I trace position is set within the screen. This allows you to determine the 0 Volt reference position at any time.
Controls and readout
position. In ADD mode these conditions apply to both channels. After switching GD off and selecting DC input coupling it is possible to determine the DC content of a signal by comparing the actual Y position with the previously determined 0 Volt Y position.
Y-POS. !I Symbol Provided that the readoutis displayed and “DC REFERENCE = ON” is selected in the “SETUP” submenu “MISCEL- LANEOUS’ the 0 Volt reference position is indicated by a ground (L) symbol. For channel || this symbol is displayed on the right of the vertical (graticule) center line, if the Y- POS. Il trace position is set within the screen. This allows you to determine the 0 Volt reference position at any time.
Attention! In XY mode the 0 Volt reference symbol is automa- tically switched off.
STORAGE MODE ONLY In contrast to analog mode the Y-POS. Il knob must be used for X position shift in storage XY mode and the X- POS. knob is disabled. The Y-POS. II control knob can also be used for shifting the position of a signal stored with HOLD. Additional information relating to this operation is described under HOLD (7).
(16) NM - AT - / \(SLOPE)- Pushbutton with a double function and associated NM-LED.
The following description assumes that Yt (time base) mode has been chosen.
NM - AT selection Press and hold the pushbutton to switch over from automatic to normal triggering (NM-LED above the pushbutton lit) and vice versa. Ifthe LED is dark, automatic
triggering is selected.
Whether the peak value detection in automatic trigger mode is automatically activated or not, depends on the trigger coupling setting (TRIG.MODE (27)). The way the trigger point symbol in the readout responds on different LEVEL control knob settings indicates the situation:
1.If the trigger symbol can not be shifted in the vertical direction when no signal is applied or the signal height is not sufficient, the peak value detection is active.
2. Under the condition that the trigger point symbol cannot
be shifted in such a way that it leaves the signal display on the screen, the peak value detection is active.
Attention!
In XY mode the 0 Volt reference symbol is automatically switched off.
Subject to change without notice
STORAGE MODE ONLY The Y-POS. Icontrol knob can also be used for shifting the position of a signal stored with HOLD in vertical direction. Additional information relating to this operation is described under HOLD (7).
(15) Y-POS. Il — Control knob with two functions.
The vertical trace position of channel I! can be set with this control knob. In ADD (addition) mode both (Y-POS. land Y- POS. Il) control knobs are active. If the instrument is set to analog XY mode this control knob is inactive and the X- POS. knob must be used for a horizontal position shift.
If automatic triggering (AT) is present and the input is set to GD (38), the vertical trace position corresponds with 0 Volt (reference) at the input and can be set to any suitable
3.The peak value detection is switched off if the trigger point can be set outside the maximum peak values of the signal, thus causing an untriggered signal display.
/\Slope selection Briefly pressing this pushbutton selects which slope of the signal is used for triggering the time base generator. Each time this pushbutton is briefly pressed, the slope direction switches from falling edge to rising edge and vice versa. The current setting is displayed in the readout by a slope symbol.
AT/NM and /\(SLOPE) The current time base mode determines the pushbutton function:
a) A time base mode: Both functions affect the A time base only.

Controls and readout
+/- 4 div. Without a change of the Y-POS. I control the trace separation function is switched off automatically after approx. 10 seconds. The trace separation function can also be left by pressing the TRS pushbutton.
® ® G
ANALOG + DIGITAL SCOPE
HM1507
TRIG
x MAG.
VOLTS/DIV. TIME/DIV.
Tere ae
A/ALT | DEL.TRIG.
(14) Y-POS. 1 - Control knob with two functions.
The vertical trace position of channel | can be set with this control knob. In ADD (addition) mode both (Y-POS. ! and Y-POS. II) contro! knobs are active. In alternate time base mode, this controi knob can be used to separate the B time base trace from theA time base trace. Please note TRS (13).
lf automatic triggering (AT) is present and the input is set to GD (34), the vertical trace position corresponds with 0 Volt (reference) at the input and can be set to any suitable position. In ADD mode these conditions apply to both channels. After switching GD off and selecting DC input coupling it is possible to determine the DC content of a signal by comparing the actual Y position with the previously determined 0 Volt Y position.
Y-POS. | Symbol Provided that the readout is displayed and “DC REFERENCE = ON” is selected in the “SETUP” submenu “MISCELLANEOUS” the 0 Volt reference position is indicated by a ground (1) symbol. For channel | this symbol is displayed on the left of the vertical (graticule) center line, if the ¥Y-POS. I trace position is set within the screen. This allows you to determine the 0 Volt reference position at any time.
Attention!
In XY mode the 0 Volt reference symbol is automatically switched off.
STORAGE MODE ONLY The Y-POS. Icontrol knob can also be used for shifting the position of a signal stored with HOLD in vertical direction. Additional information relating to this operation is described under HOLD (7).
(15) Y-POS. Il — Control knob with two functions.
The vertical trace position of channel I! can be set with this control knob. In ADD (addition) mode both (Y-POS. land Y- POS. Il) control knobs are active. If the instrument is set to analog XY mode this control knob is inactive and the X- POS. knob must be used for a horizontal position shift.
If automatic triggering (AT) is present and the input is set to GD (38), the vertical trace position corresponds with 0 Volt (reference) at the input and can be set to any suitable
Subject to change without notice
position. In ADD mode these conditions apply to both channels. After switching GD off and selecting DC input coupling it is possible to determine the DC content of a signal by comparing the actual Y position with the previously determined 0 Volt Y position.
Y-POS. II Symbol Provided that the readoutis displayed and "DC REFERENCE = ON” is selected in the "SETUP” submenu “MISCEL- LANEOUS’ the 0 Volt reference position is indicated by a ground (L) symbol. For channel II this symbol is displayed on the right of the vertical (graticule) center line, if the Y- POS. Il trace position is set within the screen. This allows you to determine the 0 Volt reference position at any time.
Attention! In XY mode the 0 Volt reference symbol is automa- tically switched off.
STORAGE MODE ONLY In contrast to analog mode the Y-POS. Il knob must be used for X position shift in storage XY mode and the X- POS. knob is disabled. The Y-POS. II control knob can also be used for shifting the position of a signal stored with HOLD. Additional information relating to this operation is described under HOLD (7).
(16) NM - AT - / \(SLOPE)- Pushbutton with a double function and associated NM-LED.
The following description assumes that Yt (time base)
mode has been chosen.
NM - AT selection Press and hold the pushbutton to switch over from automatic to normal triggering (NM-LED above the pushbutton lit) and vice versa. If the LED is dark, automatic triggering is selected.
Whether the peak value detection in automatic trigger mode is automatically activated or not, depends on the trigger coupling setting (TRIG.MODE (27)). The way the trigger point symbol in the readout responds on different LEVEL control knob settings indicates the situation:
1.If the trigger symbol can not be shifted in the vertical direction when no signal is applied or the signal height is not sufficient, the peak value detection is active.
2. Under the condition that the trigger point symbol cannot be shifted in such a way that it leaves the signal display on the screen, the peak value detection is active.
3.The peak value detection is switched off if the trigger point can be set outside the maximum peak values of the signal, thus causing an untriggered signal display.
/\Slope selection Briefly pressing this pushbutton selects which slope of the signal is used for triggering the time base generator. Each time this pushbutton is briefly pressed, the slope direction switches from falling edge to rising edge and vice versa. The current setting is displayed in the readout by a slope symbol.
AT/NM and /\(SLOPE) The current time base mode determines the pushbutton function:
a) A time base mode: Both functions affect the A time base only.

height and the deflection coefficient becomes uncali- brated. The readout then displays i.e. “¥1>...” indicating the uncalibrated condition instead of “Y1:...". Pressing and holding the CHI pushbutton again switches the LED off, sets the deflection coefficient into calibrated condition and activates the attenuator function. The previous vernier setting will not be stored.
The CHI pushbutton can also be pressed simultaneously with the DUAL(23) pushbutton. Please note item (23).
DIGITAL SCOPE
HM 1507 VOLTS/DIV.
Subject to change without notice
(23) DUAL - Pushbutton with multiple functions
DUAL Briefly pressing this pushbutton switches over to DUAL mode. Then both deflection coefficients are displayed. The previous trigger setting stays as it was, but can be changed.
All controls related to both channels are active, if the inputs (32) and (36) are not set to GD (34) (38).
Whether alternated or chopped channel switching is present in analog mode depends on the actual time base setting, and is displayed in the readout.
ALT (analog mede only) displayed in the readout, indicates alternate channel switching. After each time base sweep the instrument internally switches over from channel | to channel || and vice versa. This channel switching mode is automatically selected if any time coefficient from 200us/div to 50ns/ div is active.
CHP (analog mode only) indicates chopper mode, whereby the channel switching occurs constantly between channel! | and I! during each sweep. This channel switching mode occurs when any time base setting between 500ms/div to 500us/div has been chosen.
The actual channel switching can be changed to the opposite mode by briefly pressing both CHI (22) and DUAL (23) simultaneously. If afterwards the time coef- ficient is changed, the channel switching is automatically set to the time coefficient related mode.
STORAGE MODE ONLY In DUAL storage mode the signal capture is performed by both A/D converters. As there is no requirement to select between ALT and CHP, the selection is switched off. The readout then displays the current signal capture and display mode.
Controls and readout
ADD (addition) mode can be selected by briefly pressing the DUAL (23) and CHII (26) pushbuttons simultaneously. Whether the algebraic sum (addition) or the difference (subtraction) of both input signals is displayed, depends on the phase relationship and the INV (34) (38) setting(s). As a result both signals are displayed as one signal. For correct measurements the deflection coefficients for both channels must be equal. Please note “Operating modes of the vertical amplifiers in Yt mode”.
In ADD mode the readout indicates a “+” sign located between both channel deflection coefficients. The trigger point symbol is switched off.
The Y-position of the signal can be influenced by both Y- POS controls (14) and (15).
XY (analog mode) mode can be switched on or off by pressing and holding the DUAL pushbutton (23).
In X¥ mode the deflection coefficients are displayed as “YY...” for channel | and “X...") for channel Il, followed by “XY”. Except the cursor lines which may be active and cause the display of the voltage measurement, all other readout information including the trigger point symbol are switched off. In addition to all trigger and time base related controls, the Y-POS. II (15} knob and INV (38)
pushbutton are deactivated. For X position alteration,
the X-POS. (19) knob can be used.
STORAGE MODE ONLY In XY storage mode the readout indicates”*XY”and the RFR LED (9) is lit. No other STOR. MODE can be chosen. Instead of the time deflection coefficient, the readout displays the sampling rate (e.g. “100MS/s”) which can be selected by the TIME/DIV. knob (29).
In contrast to analog mode, the INV. (38) pushbutton is active and the X signal can be inverted. Also the Y-POS. Il (15) knob must be used for X position shift instead of the X-POS. (19) control. lf HOLD is active, the current XY signal can be moved in X (¥Y-POS. Il) and Y (Y-POS. I) direction.
(24) TRIG. ALT- Pushbutton with double function and associated
LEDs.
The pushbutton and the LEDs are deactivated in XY mode and if line (mains) triggering is selected.
TRIG. With the aid of this pushbutton, the trigger source can be chosen. There are three trigger sources available:
channel |, channel I! (both designated as internal trigger sources) and the TRIG. EXT. (39) input for external
triggering. The availability of the internal sources depends on the actual channel mode. The actual setting is indicated by the associated LED(s) and the readout.
Briefly pressing the pushbutton switches over in the following sequence: 1 - Il - EXT - 1 in DUAL mode, | - EXT - | if mono channel | is present, Il - EXT - Il under mono channel || conditions.
Each condition is indicated by the associated LED and displayed by the readout (“TR:Y1...”, “TR:¥2...” and
17

Controls and readout
“TR:EXT...”). The trigger point symbol is switched off in external trigger condition.
ALT Pressing and holding the pushbutton selects alternate triggering in DUAL mode. Under these conditions both I and fl LEDs lit and the readout displays “TR:ALT...”. As alternate triggering requires alternate channel operation in analog mode, alternate channel switching is set automatically. A change of the time base then has no affect regarding the channel switching mode. In addition to the deflection coefficients display, “ALT” is displayed by the readout instead of “CHP” if analog mode is present.
In alternate trigger mode the trigger point symbol is switched off. TVL, TVF trigger coupling and line (~) triggering can not be selected.
Alternate triggering is not available or automatically switched off under the following conditions: SINGLE (SGL) mode ADD (addition) mode, alternate (A & B) time base mode, B time base mode and line (mains) trigger coupling.
STORAGE MODE ONLY In ROLL mode the signal capture is untriggered. Consequently alternate triggering is not available.
ANALOG DIGITAL SCOPE
HM1507
Z)
(25) VOLTS/DIV. — Control knob
This control knob for channel Ilhas a double function. The following description relates to the input attenuator function (VAR LED dark).
Turning the control knob clockwise increases the sensitivity in a 1-2-5 sequence and decreases it if turned in the opposite direction (ccw.). The available range is from 1mV/div up to 20V/div. The knob is automatically switched inactive if the channel related to it is switched off, or if the input coupling is set to GD (ground).
The defiection coefficients and additional information regarding the active channels are displayed in the readout, i.e. “Y2: deflection coefficient, input coupling”. The ” : “ symbolizes calibrated measuring conditions and is replaced by the “ > “ symbol in uncalibrated conditions.
In DUAL, ADD (addition) and XY mode both deflection coefficients etc. are displayed. Instead of “¥1:...”and“Y2:...” the readout displays “Y:...” and “X:...” in XY mode.
(26) CH Il VAR. - Pushbutton with several functions.
Channel mode Briefly pressing the pushbutton sets the instrument to channel Il (Mono CH Il) mode. The deflection coefficient displayed in the readout indicates the current conditions (“Y2...“). If neither external nor line (mains) triggering was active, the internal trigger source automatically switches over to channel Il (“TR:¥2...”). The last function setting of the VOLTS/DIV (25) knob remains unchanged.
All channel related controls are active if INPUT CHIl (36)
is not set to GD (38).
VAR. Pressing and holding this pushbutton selects the VOLTS/ DIV. (25) control knob function between attenuator and vernier (variable). The current setting is displayed by the VAR-LED located above the knob.
After switching the VAR-LED (25) on, the deflection coefficient is still calibrated. Turning the VOLTS/DIV. (25) control knob counter clockwise reduces the signal height and the deflection coefficient becomes uncalibrated. The readout then displays i.e. “Y2>...” indicating the uncalibrated condition instead of “Y2:...”. Pressing and holding the CHIl pushbutton again switches the LED off, sets the deflection coefficient into calibrated condition and activates the attenuator function. The previous vernier setting will not be stored.
The CHII pushbutton can also be pressed simultaneously with the DUAL (23) pushbutton. Please note item (23).
(27) TRIG. MODE - Pushbutton with double function and
indicator LEDs.
Pressing the upper or lower pushbutton selects the trigger coupling. The actual setting is indicated by a LED and by the readout (”TR: source, slope, AC”).
Each time the lower TRIG. MODE pushbutton is pressed the trigger coupling changes in the sequence:
AC (DC content suppressed), DC (peak value detection inactive), HF (high-pass filter cuts off frequencies below
approx. 50kHz) trigger point symbol switched off,
NR (high frequency noise rejected), LF (low-pass filter cuts off frequencies above
approx. 1.5kHz), TVL (TV signal, line pulse triggering)
trigger point symbol switched off, TVF (TV signal, frame pulse triggering)
trigger point symboi switched off. ~ — (line/mains triggering) trigger point symbol and
TRIG. LEDs (24) switched off. The readout displays “TR:~”. The ~ symbol can be changed by 180° by using the trigger slope function (NM/AT - /\(16)).
Please note: In delay trigger mode (B time base) the instrument is automatically set to DC trigger coupling. This setting can not be changed with the TRIG. MODE pushbuttons.
In some trigger modes such as alternate triggering, some trigger coupling modes are automatically disabled and can not be selected.
This trigger mode is present if the trigger coupling information in The trigger point symbol is inactive in line/mains trigger
wi Subject to change without notice

Controls and readout
mode as there is no direct amplitude relationship between the trigger voltage and the signal voltage.
cee ANALOG DIGITAL SCOPE
HM1507 VOLTS/OIV.
> @
(28) DEL.POS. HO-LED - Control knob with two functions and associated LED.
The function of this control knob depends on the time base mode.
HO (hold off) In A time base mode, the contro! knob applies to the hold off time setting. lf the HO-LED associated with the knob is dark, the hold off time is set to minimum.
Turning the control knob clockwise switches the LED on and extends the hold off time until the maximum is reached (please note “Hold Off-time adjustment”). The hold off time is automatically set to minimum (LED dark), if the A time base setting is changed. The last hold off time setting is stored if alternate (A and B) or B time base mode is selected.
DEL.POS. In alternate (A and B) and B time base modes, the knob controls the delay time setting. Under alternate time base mode conditions, the delay time is visible on the A trace, beginning at the trace start and ending at the start of the intensified sector. In the free run condition (delay trigger not active) of the B time base, an approximate value is displayed in the readout (“Dt:...”). This is an aid to find the position of the intensified sector which may be very small.
If only the B time base is being operated, the delay time can be varied, but there is no intensified sector as the A trace is not visible.
STORAGE MODE ONLY The HOLD OFF function is not available in storage mode.
(29) TIME/DIV. - Contro! knob with two functions.
The following description applies to the time base switch function (VAR LED dark).
ANALOG MODE Turning the control knob clockwise reduces the deflection coefficient in a 1-2-5 sequence and increases it if turned in the opposite direction (ccw.). The time coefficient(s) is (are) displayed in the readout.
In Atime base mode, time deflection coefficients between 500ms/div and 50ns/div can be chosen in 1-2-5 sequence, if the X-MAG. x10 function is not activated.
Subject to change without notice
During alternate (A and B) and B time base operation, the control knob changes the B time base setting in 1-2-5 sequence. The available deflection coefficient range is from 20ms/div up to 5Ons/div (without X-MAG. x10) but the availability depends on the A time base setting. The internal control of the oscilloscope prevents the B time deflection coefficient from becoming higher than the A deflection coefficient, as such an operation condition would make no sense. If theA time base setting is 200us/ div the B time base range from 20ms/div up to 500us/div is not available and the maximum time deflection coefficient for B would be 200us/div. In the last named condition the change of the A time base from 200us/div to 100us/div switches the B time base also to 100us/div. However the B time base setting remains unchanged if the A time base is set to 500us/div.
As already mentioned under DUAL (23) the channel switching depends on the time deflection coefficient setting. In the time base ranges from 500ms/div to
500us/div chopped (CHP) channel switching is auto- matically selected, through which the switching occurs
constantly during the time base sweeps. Alternate (ALT) channel switching is automatically used in all other time deflection coefficient settings (200us/div - 50ns/div). In the latter case the active channel is switched off and the previously inactive channel is switched on after the completion of each time base sweep. To avoid inter- ference in chopped mode, or to make both channels appear simultaneously visible, the actual setting (ALT or CHP) displayed in the readout can be overwritten and changed to the opposite mode. This is carried out by simultaneously pressing and holding the CHI (22) and the DUAL (23) pushbutton.
STORAGE MODE ONLY The time deflection ranges are different in storage mode and therefore must be considered (please note item (7)). In DUAL mode a selection between alternate or chopped signal capture isneither required nor possible. Consequently the readout does not display such information (ALT, CHP).
In XY storage mode the TIME/DIV. knob is still active. It is used to determine the sampling rate, which is then displayed by the readout.
(30) A/ALT- B - Pushbutton with multiple function.
The instrument contains two time bases designated A and B. With the aid of the B time base, signal parts displayed by the A time base can be expanded in X direction. The expansion ratio depends on the time deflection coefficient ratio of both time bases (i.e. “A: 100ps”, “B:1pis” = 100). With higher expansion ratios the B time base trace intensity reduces if analog mode is active.
SINGLE (SGL) event signal capture mode is enabled in A time base mode only.
A/ALT function:
Each time the A/ALT- B pushbutton is briefly pressed, the time base mode changes in the sequence A -— alternate -A.
A In A time base mode the TIME/DIV. (29) control knob is operative only for this time base. The readout then only
19

Controls and readout
displays the A time coefficient. The time base settings for this condition are stored if the time base mode is changed.
ALT If alternate (ALT) time base mode is selected, the TIME/ DIV (29) knob only controls the B time base.
The alternate time base mode is a subfunction of the B time base mode where both time base traces are displayed. Consequently the readout displays both time deflection coefficients (e.g. “A:100yus B:1p1s”). Unlike the former A time base mode, an intensified sector is also visible on the A trace. This sector indicates the signal part which is displayed by the B time base. The intensified segment can be shifted horizontally by the DEL. POS. (28) control knob continuously (if the B time base is operated in free run conditions). The difference between the start of theA time base trace and the beginning of the intensified sector shows the delay time. This information is also displayed in the readout as an approximate value (e.g. “Dt:2.5ms”) related to the calibrated A time coefficient (uncalibrated i.e. “Dt>2.5ms”). The width of the segment decreases when the B time coefficient is set to a lower value (higher time deflection speed).
Alternate time base mode causes the display to alter between A and B time base after each sweep (analog mode). in alternate DUAL mode the sequence is channel | with A time base, channel | with B time base, channel It with A time base and channel II with B time base.
For better reading, the vertical position of the B trace position can be shifted (please note “TRS” (13)).
4
ee
v-P¢s.t ANALOG DIGITAL SCOPE
HM1507 Vv.
B function: Pressing and holding the pushbutton switches over from A or alternate time base mode to B time base mode and vice versa.
In B time base mode the display of the A trace(s), the intensified sector(s) and the A time coefficient display in the readout are disabled. As the trace separation (TRS) is no longer required under these circumstances, this function is switched off too. Consequently only theB time coefficient is displayed by the readout.
Briefly pressing the pushbutton switches B time base mode off and A time base mode on. Pressing and holding the pushbutton switches over from B to alternate time base mode.
STORAGE MODE ONLY In the combination of storage mode and alternate or B time base operation, the pre- and post trigger are automatically switched off. The PTR (8) pushbutton is
deactivated and instead of a pre- or post trigger value the readout displays the delay time.
ROLL mode is not available in alternate or B time base mode.
(31) DEL. TRIG. VAR. - Pushbutton with double function.
DEL. TRIG. function:
ANALOG MODE ONLY Each time the pushbutton is briefly pressed, the instrument switches between free run (untriggered) and triggered B time base, if alternate or B time base mode is present.
DIGITAL MODE ONLY In contrast to analog operation the B time base can not be triggered in alternate time base mode.
ANALOG and DIGITAL MODE The actual setting is displayed in the readout. Instead of the approximate delay time (“Dt:...”) in free run mode, the readout displays “DTr: slope, DC (trigger coupling)” in triggered delay mode. In this mode, the former A time base trigger settings regarding the trigger mode (automatic or normal), -coupling, -slope and -level settings are stored but still active.
With the activated delay trigger the instrument is automatically set to normal (NM) trigger mode and DC trigger coupling for the B time base. As the instrument contains a separate trigger unit for the B time base, the trigger level and slope can be set independently using the same controls used before for the A time base trigger setting. The trigger point is indicated again but has the added letter B in the readout.
In delay trigger mode (DEL.TRIG.)}, the delay time first must elapse. Then the next suitable signal slope (direction and height) starts the B time base. If those basic requirements are not met, the trace is blanked in analog mode and the signal acquisition is stopped in digital mode. Under the condition that the signal contains several suitable slopes after the delay time, it can be seen in alternate time base mode that the delay time setting (DEL. POS.) now causes the intensified sector to jump from one slope to the other.
VAR.
ANALOG MODE ONLY Pressing and holding the DEL.TRIG. - VAR. pushbutton selects the TIME/DIV. (29)control knob function between time base switch and vernier (variable). The current setting is displayed by the VAR-LED located above the knob.
The variable function can be activated for the A time base or the B time base, the settings are stored separately. As alternate time base mode is a B time base sub mode, only the B time base is affected in this condition.
A time base: After switching the VAR-LED on, the time deflection coefficient is still calibrated. Turning the TIME/DIV. (29) control knob counter clockwise increases the time deflection coefficient (reduces the deflection speed) and the deflection coefficient becomes uncalibrated. Instead of e.g. “A:10us", the readout then displays “A>10us” indicating the uncalibrated condition.
me Subject to change without notice

Subject to change without notice
This setting is stored if the instrument is switched to alternate or B time base mode.
Pressing and holding the DEL.TRIG. - VAR. pushbutton again in A time base mode switches the VAR.-LED off, the time base switch function on, and sets the time deflection coefficient back into the calibrated condition.
ALTERNATE or B time base. In alternate as well as in B time base mode, pressing and holding the DEL.TRIG. - VAR. pushbutton selects the TIME/DIV. knob function between B time base switch and B vernier (VAR. -LED on). In the latter case the TIME/ DIV. knob can be used in the same way as described before under A time base condition.
STORAGE MODE ONLY Pressing and holding the DEL.TRIG. - VAR. pushbutton causes no reaction, as a variable time deflection coefficient setting is not possible in storage mode.
Underneath the front panel sector described before, the BNC sockets and four pushbuttons are located.
a ERT ina
» INPUT CH HAMEG tric. " AC INV. Instruments
. iRRRRER
INPUT CHI =. 150 MHz/200MS/s ex
T ‘max. max.400Vp ‘MQ 14 pF cATIC 100Vp
(32) INPUT CH I — BNC socket.
This BNC socket is the signal input for channel I. In XY mode, signals at this input are used for the Y deflection. The outer (ground) connection is galvanically connected to the instrument ground and consequently to the safety earth contact of the line/mains plug.
(33) AC / DC - Pushbutton with two functions.
Input coupling: Briefly pressing this pushbutton switches over from AC (~ symbol!) to DC (= symbol) input coupling and vice versa, if the INPUT CHI (32) is not switched to GD (34). The AC/ DC setting is displayed in the readout with the deflection coefficient.
Probe factor: Pressing and holding the pushbutton selects the indicated deflection coefficient of channel | displayed in the readout, between 1:1 and 10:1. In condition 10:1 the probe factor is thus indicated by a probe symbol displayed by the readout in front the channel information (e.g. “probe symbol”, Y1...). In the case of cursor voltage measu- rement, the probe factor is automatically included.
Please note: The probe symbol should not be activated unless a x10 (10:1) attenuator probe is used.
(34) GD INV. - Pushbutton with two functions.
GD Each time this pushbutton is pressed briefly, the INPUT CHI is switched from active to inactive and vice versa. It is displayed in the readout as an earth (ground) symbol instead of the deflection coefficient and the ~ (AC) or = (DC) symbol.
Controls and readout
The GD setting disables the input signal, the AC/DC (33) input coupling selection and the VOLTS/DIV (21) knob. In automatic trigger mode the undeflected trace is visible representing the "O Volt” trace position. See Y-POS. | (14).
INV. Pressing and holding this pushbutton switches the channel | invert(INV.) function on or off. The invert “on” condition is indicated by the readout with a horizontal bar above "¥1” (Yt mode) or “"¥” (XY mode). The invert function causes the signal display of channel | to be inverted by 180°.
(35) Ground socket - 4mm banana jack galvanically con- nected to safety earth.
This socket can be used as reference potential connection for DC and low frequency signal measurement purposes and in COMPONENT TEST mode.
(36) INPUT CH Il — BNC socket.
This BNC socket is the signal input for channel Il. In XY mode, signals at this input are used for the X deflection. The outer (ground) connection is galvanically connected to the instrument ground and consequently to the safety earth contact of the line/mains plug.
(37) AC / DC - Pushbutton with two functions.
Input coupling: Briefly pressing this pushbutton switches over from AC (~ symbol) to DC (= symbol) input coupling and vice versa, if the INPUT CHI (36) is not switched to GD (38). The AC/ DC setting is displayed in the readout with the deflection coefficient.
Probe factor: Pressing and holding the pushbutton selects the indicated deflection coefficient of channel | displayed in the readout, between 1:1 and 10:1. In condition 10:1 the probe factor is thus indicated by a probe symbol displayed by the readout in front the channel information (e.g. "probe symbol”, Y2...). In the case of cursor voltage measu- rement, the probe factor is automatically included.
Please note: The probe symbol should not be activated unless a x10 (10:1) attenuator probe is used.
(38) GD INV. - Pushbutton with two functions.
GD Each time this pushbutton is pressed briefly, the INPUT CHIl is switched from active to inactive and vice versa. It is displayed in the readout as an earth (ground) symbol instead of the deflection coefficient and the ~ (AC) or = (DC) symbol.
The GD setting disables the input signal, the AC/DC (37) input coupling selection and the VOLTS/DIV (25) knob. In automatic trigger mode the undeflected trace is visible representing the “O Volt” trace position. See Y-POS. If (15).
INV. STORAGE MODE Pressing and holding this pushbutton switches the channel Il invert(INV.) function on or off. The invert “on” condition
21

Controls and readout rN EILEEN
is indicated by the readout with a horizontal bar above "¥2" (Yt mode) or "X” (XY mode). The invert function causes the signal display of channel | to be inverted by 180°.
ANALOG MODE The invert function is not available in XY mode.
RSE
150MHz/200MS/s = INPUT CHI HAME ac INV. Instruments
oc =e
(39) TRIG. EXT. — BNC socket.
This BNC socket is the external trigger signal input. Briefly pressing the TRIG. (24) pushbutton (until the information “TR:EXT, slope, coupling” is visible in the readout and the EXT-LED is lit) switches the input active.
The trigger coupling depends on the TRIG. MODE (27) setting. If external triggering is active line/mains (~) triggering is not available
The outer (ground) connection is galvanically connected to the instrument ground and consequently to the safety earth contact of the line/mains plug.
_Below the CRT there are the controls for the readout, the component tester and the squarewave calibrator with their outputs. :
Please note: The following description of the cursor related controls assumes that the readout is visible and the component tester is switched off.
| (ep \OzZvpp- ~ CAL i a ia! 0) CHUM ag PRINT he | He se MENU I @m: i =e at OFF EE
ao aarer se (40) PRINT / MENU - Pushbutton with 2 functions.
STORAGE MODE ONLY PRINT Briefly pressing the pushbutton starts a documentation (hardcopy) if the following preconditions are met:
1.The oscilloscope must be connected to the external HAMEG interface HO79-6.
2. The software version installed in HO79-6 should not be < V2.00.
The device used for documentation (e.g. printer, plotter) must be connected with one of the HO79-6 ports. The documentation includes the signal display, the graticule, the measurement parameters and additional information such as oscilloscope type and HO79-6 software version. The PRINT function replaces the actuation of the HO79- 6 “START” pushbutton, which may not be accessible (e.g. rack mount).
For further information please note the HO79-6 manual.
ANALOG and DIGITAL MODE MENU Pressing and holding the pushbutton activates the display
of the MAIN MENU. It contains the submenus SETUP, CALIBRATE and HO79 if connected.
Once a menu is displayed, the following pushbuttons are of importance:
1.SAVE and RECALL (12) pushbutton. Briefly pressing selects the submenu or an item within
the submenu.
2. SAVE (12) pushbutton SET function. Pressing and holding the SAVE (12) pushbutton calls (sets) the menu or the previously selected item. in those cases where the item is marked with ON / OFF the setting changes from ON to OFF or vice versa.
In some cases the called function is not performed at once and a warning is displayed to protect from calling the function inadvertently. Then the function can be called by pressing and holding the SAVE pushbutton (SET function) again, otherwise if the function was called inadvertently the proceeding can be cancelled by pressing the AUTOSET (2) pushbutton.
3.AUTOSET (2) pushbutton. Each time the AUTOSET pushbutton is pressed the menu is switched back one step until MAIN MENU is displayed. Then pressing the AUTOSET pushbutton again switches the menu operation off and the AUTO- SET is automatically set to the normal function.
(41) ON/OFF - CHI/H - 1/At - Pushbutton with several functions.
ON/OFF Pressing and holding the pushbutton switches both CUR- SOR lines on or off. As the cursor lines are part of the readout, they are visible only if the readout is switched on.
CHI/II This function is required and available only in DUAL and XY mode if AV (43) measurement is active.
Briefly pressing the pushbutton selects between the deflection coefficients of channel | and channel II. The actual setting is part of the result displayed as “AV1...” for channel | or “AV2...” for channel Il. Of course the horizontal cursor lines must be set on the relevant signal. In X¥ mode the instrument is automatically set to AV measurement. in this mode two signals are normally applied causing an X and a Y deflection. The deflection coefficient selected for each channel may be different, thus as in DUAL mode the AV cursor measurement requires a channel selection. Under channel | (Y signal) measuring condition the cursor lines are displayed as horizontal lines and the readout displays“AVY...”. Briefly pressing the pushbutton changes to channel || (X signal) voltage measurement. Then the cursor lines are dispiayed as vertical jines and the readout indicates “AVX...”.
In CHI and CHII mode, only one deflection coefficient is present and there is no requirement to select between different deflection coefficients. Consequently the pushbutton is inactivated in combination with AV mea- surements.
1/At if the AV function is not present, briefly pressing this pushbutton selects between time and frequency mea- surement which is not available in XY mode.
Subject to change without notice

Controls and readout
The vertical cursor lines and the measurement result apply to the active time base (A or B, resp. B in alternate time base mode).
In calibrated time base condition the readout displays “At:...” if time measurement is chosen. After briefly pressing the pushbutton and switching over to 1/At (frequency) “f:...” is displayed. If the time base is uncalibrated the readout displays “At>...” or “fe...”.
(42) TRK - Track function.
Briefly pressing simultaneously both pushbuttons ON/ OFF - CH I/II - 1/At (41) and Il - AV/At (43) switches over from single cursor line operation to track mode and vice versa.
In TRK (track) mode both cursor lines are indicated as active (both dotted lines uninterrupted).
CHIAl PRINT
a MENU —=_[_ ‘
aa: Ig2
@
(43) I/ll — AV / At - Pushbutton with two functions.
I/Il: Briefly pressing this pushbutton changes the active (controllable) cursor in the sequence I - Il - 1, if TRK (track) mode is not active. The active cursor is indicated by a continuously dotted line. An interrupted dotted line indicates the inactive cursor.
AV / At: Pressing and holding this pushbutton changes from voltage to time (or frequency) measurement and vice versa. In XY mode the instrument is automatically set to AV, as the time base is disabled and consequently time or frequency measurements can not be performed.
AV Cursor supported voltage measurement can be made in different operating conditions. This causes differences.
item 1: Time base mode.
In the voltage measurement condition, the cursors are displayed as horizontal lines and the result is displayed in the readout.
Single channel mode (channel | or channel Il) The AV measuring result is automatically related to the deflection coefficient of the active channel. The readout displays "AV1...” or "AV2...”.
Dual mode The CURSOR lines must be set on the channel | or channei il signal. As the deflection coefficients may be different, it willbe required to select between the deflection coefficients of channel | and ||. Please note item CH I/ I (41).
Addition (ADD) mode In ADD (addition) mode normally two input signals are displayed as one signal (sum or difference). As the result can only be determined if both (calibrated) deflection coefficients are equal, the CH I/II (41) selection function is deactivated. |n that case the readout indicates “AV...” without any additional channel information. Different deflection coefficient settings or uncalibrated deflection coefficient(s) are indicated in the readout as “¥1<>Y2”.
Subject to change without notice
item 2: XY mode In X¥ mode the instrument is automatically set to AV measurement. The deflection coefficient selected for each channel may be different, thus as in DUAL mode the AV cursor measurement requires a channel selection (CHI/II (41)). Under channel (Y signal) measuring condition the cursor lines are displayed as horizontal lines and the readout displays “AVY...”. Briefly pressing the CHI/II (41) pushbutton selects channel II (X signal) measuring. Then the cursor lines are displayed as vertical lines and the readout indicates “AVX...”.
Please note! In all AV (voltage) measurement conditions, the
division ratio of the probe(s} must be taken into account. The voltage value displayed in the readout must be multiplied by 100 if e.g. a x100 (100:1) probe is used. In case of x10 (10:1) probes, the probe factor can be automatically included (see AC/DC (33) and AC/DC (37)).
At: In time or frequency measurement condition two vertical cursor lines are displayed. The measurement result is indicated as “At...” (time measurement) or “f...” (frequency measurement). Please note item (41) 1/Dt.
NOTE: For frequency measurement, the distance between the cursors must equal exactly one signal period.
In XY mode the time base is switched off. Conse- quently time or frequency measurement is disabled.
(44) CURSOR - Center biased lever.
The active cursor line (in track mode: both lines) can be shifted in the selected direction, until the graticule limits are reached. The directions are marked on the front panel and depend on the selected measurement (AV, At or 1/ At).
Which of two shift speeds is used, depends on how far
the CURSOR lever is pressed. With slight knob pressure the cursor line(s) moves slowly. If the knob is pressed to the full extent the cursor moves fast. If the knob is released it automatically reverts to the center position and the cursor shift stops.
(45) CAL. - Pushbutton and concentric socket.
A squarewave signal of 0.2Vpp +1% is available from the socket for probe adjustment purposes.
The signal frequency depends on the pushbutton setting. If the pushbutton is released it is approx. 1kHz and can be switched over (depressed) to approx. 1MHz. The pulse duty factor may deviate from 1:1.
(47) CT - Pushbutton and banana jack.
Pressing the pushbutton switches the instrument over from oscilloscope to component test (analog) mode and vice versa.
In component test mode, all controls are inactivated with the exception of the CT pushbutton, AUTO SET (3) and INTENS (4). All LEDs except “A” (associated with the INTENS knob) are dark. The readout displays only “CT” in this condition.

Menu First Time Operation
gg EEO TS ———
One test lead is connected to the CT socket. The second test lead uses the ground socket (37). Please note “Component Tester”.
The maximum test voltage is approx. 20Vpp under open circuit conditions, while the max. test current under short circuit condition is approx. ZOMApp.
Menu
The instrument software contains several menus. The controls regarding the menus are described under item (40) PRINT / MENU in section "Controls and Readout”.
The following menus, submenus and items within the submenus are available:
1. MAIN MENU contains:
1.1 CALIBRATE Information regarding this can be found in the section "Service Instructions” item “Adjustments”.
1.2 SETUP This menu allows changes to the default settings regarding the instrument behavior during operation. The SETUP menu contains the submenus “MISCELLANEOUS” and “FACTORY”.
1.2.1 MISCELLANEOUS contains:
1.2.1.1 CONTROL BEEP ON/OFF. In OFF condition the acoustic signals actuated by the control limits are switched off.
Note: The default setting is ON. If different conditions are required the setting must be performed each time after switching the oscilloscope on.
1.2.1.2 ERROR BEEP ON/OFF. Acoustic signals indicating faulty control operation are suppressed in OFF condition.
Note: The default is ON. If different conditions are required the setting must be performed each time after switching the oscilloscope on.
1.2.1.3 QUICK START ON/OFF. in condition ON the HAMEG lIogo and the menus will not be displayed after switching the instrument on. Then the instrument is quickly ready for operation. To change from QUICK START OFF to ON, press and hold the AUTOSET pushbutton when switching the instrument on until the menus become visible and change the setting from ON to OFF.
1.2.1.4 TRIG.-SYMBOL ON/OFF. In most of the Yt (time base) modes the readout displays a trigger point symbol which will not be displayed in condition OFF.
1.2.1.5 DC REF ON/OFF. If ON is selected and Yt (time base) mode is present, the readout displays a ground symbol (L). This symbol eases the evaluation and determination of DC contents by indicating the 0 Volt reference position.
1.2.2 FACTORY contains 1.2.2.1 LOAD S/R DEFAULT (S/R = SAVE/RECALL).
This overwrites all SAVE/RECALL memories with the following instrument setting: Single channel operation (”¥1:500mV~”), time base (“A:100ps”), automatic peak value triggering and AC trigger
coupling.
1.2.2.2 RESTORE FACTORY DEFAULT. lf inadvertently an adjustment was performed in CALIBRATE MENU condition, which was not stored by OVERWRITE FACTORY DEFAULT, the factory adjustments can be recalled by this function.
1.2.2.3 OVERWRITE FACTORY DEFAULT.
AN Attention! 2
Calling this function causes the factory adjust- ments to be overwritten by new data. The factory adjustment then is lost and can fiot be recalled by RESTORE FACTORY DEFAULT. :
This function is only intended for those cases in which an adjustment can be performed with very expensive 70% error” calibrators, to adjust the instrument for optimum tolerance when operated under extreme environmental conditions.
1.3 HO79 This information will only be displayed if the interface HO79-
6 is connected to the oscilloscope.
For further information please note the HO79-6 manual
which is supplied with the interface.
First Time Operation
The following text assumes that the “SAFETY” section of this manual has been read carefully and understood.
Each time before the instrument is put into operation check
that the oscilloscope is connected to protective earth. For that
reason the power cable must be connected to the oscilloscope
and the power outlet. Then the test lead(s) must be connected
to the oscilloscope input(s). Check that the device under test
is switched off and connect the test lead(s) to the test point(s).
Then switch on the instrument and afterwards the device
under test.
The oscilloscope is switched on by depressing the red POWER
pushbutton. After a few seconds the HAMEG logo and the
instrument software release is displayed on the screen. As
long as the HAMEG logo is visible different internal checks are
made. Thereafter the instrument will revert to its last used
operating mode.
\f after approx. 20 seconds no trace is visible, the AUTO SET
pushbutton should be pressed briefly. This selects the Yt
mode and medium trace and readout intensity (please note
“AUTO SET”). Adjust Y-POS.I and X-POS. controls to center
the baseline. Adjust INTENS. (intensity) and FOCUS controls
for medium brightness and optimum sharpness (input(s)
grounded) of the trace. The oscilloscope is now ready for use.
lf the AUTO SET function was not used and only a spot
appears (CAUTION! CRT phosphor can be damaged), reduce
the intensity immediately and check that the X¥ mode is not
selected (XY not displayed in the readout).
To obtain the maximum life from the cathode-ray tube, the
minimum intensity setting necessary for the measurement in
hand and the ambient light conditions should be used.
Ene nee Subject to change without notice a

First Time Operation
Particular care is required when a single spot is displayed, as a very high intensity setting may cause damage to the fluorescent screen of the CRT. Switching the oscilloscope off and on at short intervals stresses the cathode of the CRT and should therefore be avoided.
The instrument is so designed that even incorrect operation will not cause serious damage.
Trace Rotation TR
In spite of Mumetal-shielding of the CRT, effects of the earth’s magnetic field on the horizontal trace position cannot be completely avoided. This is dependent upon the orientation of the oscilloscope on the place of work. A centered trace may not align exactly with the horizontal center line of the graticule. A few degrees of misalignment can be corrected by a potentiometer accessible through an opening on the front panel marked TR.
Probe compensation and use
To display an undistorted waveform on an oscilloscope, the probe must be matched to the individual input impedance of the vertical amplifier.
For this purpose a square wave signal with a very fast rise time and minimum overshoot should be used, as the sinusoidal
contents cover a wide frequency range.
The built-in calibration generator provides a square wave signal with a very fast risetime (<4ns), and switch-selectable
frequencies of approx. 1kHz and 1MHz from the output socket below the CRT screen.
As the squarewave signals are used for probe compensation adjustments, neither the frequency accuracy nor the pulse duty factor are of importance and therefore not specified.
The output provides 0.2Vpp +1% (tr <4ns) for 10:1 probes. When the Y deflection coefficient is set to 5mV/div, the
calibration voltage corresponds to a vertical display of 4 divisions (10:1 probe).
The output socket has an internal diameter of 4.9mm to accommodate the internationally accepted shielding tube diameter of modern Probes and F-series slimline probes. Only this type of construction ensures the extremely short ground connections which are essential for an undistorted waveform reproduction of non-sinusoidal high frequency signals.
Adjustment at 1kHz
The C-trimmer adjustment (low frequency) compensates the capacitive loading on the oscilloscope input. By this adjustment, the capacitive division assumes the same ratio as the ohmic voltage divider to ensure the same division ratio for high and low frequencies, as for DC. (For 1:1 probes or switchable probes set to 1:1, this adjustment is neither required nor possible). A baseline parallel to the horizontal graticule lines is essential for accurate probe adjustments. (See also “Trace rotation TR”).
Connect the probes (Types HZ51, 52, 54, or HZ36) to the CH I input. Set the deflection coefficient to 5mV/div and the input coupling to DC. The time deflection coefficient should be set to 0.2ms/div. All defiection coefficients should be calibrated. Plug the probe tip into the calibrator output socket.
Approximately 2 complete waveform periods are displayed on the CRT screen. The compensation trimmer should be adjusted.
Subject to change without notice
incorrect incorrect correct
The location of the low frequency compensation trimmer can be found in the probe information sheet. Adjust the trimmer with the insulated screw driver provided, until the tops of the square wave signal are exactly parallel to the horizontal graticule lines (see 1kKHz diagram). The signal height should then be 4div + 0.16div (= 4% (oscilloscope 3% and probe 1%). During this adjustment, the signal edges will remain invisible.
Adjustment at 1MHz
Probes HZ51, 52 and 54 can also be HF-compensated. They incorporate resonance de-emphasing networks (R-trimmer in conjunction with inductances and capacitors) which permit probe compensation in the range of the upper frequency limit of the vertical oscilloscope amplifier. Only this compensative adjustment ensures optimum utilization of the full bandwidth, together with constant group delay at the high frequency end, thereby reducing characteristic transient distortion near the leading edge (e.g. overshoot, rounding, ringing, holes or bumps) to an absolute minimum.
Using the probes HZ51, 52 and 54, the full bandwidth of the oscilloscope can be utilized without risk of unwanted waveform distortion.
Prerequisite for this HF compensation is a square wave generator with fast risetime (typically 4ns), and low output impedance (approx. 50Q), providing 0.2V at a frequency of approx. 1MHz. The calibrator output of this instrument meets these requirements when the CAL. pushbutton is depressed.
Connect the probe toCH.| input. Depress theCAL. pushbutton for 1MHz. Operate the oscilloscope as described under 1kHz but select for 0.2us/div time deflection coefficient setting.
Insert the probe tip into the output socket. A waveform will be displayed on the CRT screen, with leading and trailing edges clearly visible. For the HF-adjustment now to be performed, it will be necessary to observe the rising edge as well as the upper left corner of the pulse top. The location of the high frequency compensation trimmer(s) can also be found in the probe information sheet. These R-trimmer(s) have to be adjusted such that the beginning of the pulse is as straight as possible. Overshoot or excessive rounding are unacceptable. The adjustment is relatively easy if only one adjusting point is present. In case of several adjusting points the adjustment is slightly more difficult, but causes a better result. The rising edge should beas steep as possible, with a pulse top remaining as straight and horizontal as possible. After completion of the HF-adjustment, the signal amplitude displayed on the CRT screen should have the same value as during the 1kHz adjustment.
He
incorrect correct incorrect
Probes other than those mentioned above, normally have a larger tip diameter and may not fit into the calibrator output. Whilst it is not difficult for an experienced operator to build a suitable adapter, it should be pointed out that most of these
25

Operating modes of the vertical amplifiers in Yt mode
probes have a slower risetime with the effect that the total bandwidth of scope together with probe may fall far below that of the oscilloscope. Furthermore, the HF-adjustment feature is nearly always missing so that waveform distortion can not be entirely excluded. The adjustment sequence must be followed in the order described, i.e. first at 1kHz, then at
1MHz. The calibrator frequencies should not be used for time base calibration. The pulse duty cycle deviates from 1:1 ratio.
Prerequisites for precise and easy probe adjustments, as well as checks of deflection coefficients, are straight horizontal pulse tops, calibrated pulse amplitude, and zero-potential at the pulse base. Frequency and duty cycle are relatively uncritical. For interpretation of transient response, fast pulse risetimes and low-impedance generator outputs are of particular importance. Providing these essential features, as well as switch-selectable output-frequencies, the calibrator of the instrument can, under certain conditions, replace expensive squarewave generators when testing or compensating wideband-attenuators or -amplifiers. In such a case, the input of an appropriate circuit will be connected to the CAL.-output via a Suitable probe.
The voltage provided at a high-impedance input (1MQ II 15- 30pF) will correspond to the division ratio of the probe used (10:1 = 20MVpp output). Suitable probes are HZ51, 52, and 54.
Operating modes of the vertical amplifiers in Yt mode
The most important controls regarding the operation modes of the vertical amplifiers are the pushbuttons: CHI (22), DUAL (23) and CH Il (26). Their functions are described in the section “ Controls and Readout”.
In most cases oscilloscopes are used to display signals in Yt mode. Then the signal amplitude deflects the beam in vertical direction while the time base causes an X deflection (from left to right) at the same time. Thereafter the beam becomes blanked and fly back occurs.
The following Yt operation modes are available:
Single channel operation of channel | (Mono CH I).
Single channe! operation of channel Il (Mono CH Il). Two channel operation of channel | and channel [I (DUAL). Two channel operation of channel | and channel Il -displaying the algebraic result as the sum or difference - (ADD).
The way the channel switching is determined in DUAL mode depends on the time base setting and is described in the section “Controls and Readout”.
In ADD mode the signals of both channels are algebraically added and displayed as one signal. Whether the resulting display shows the sum or difference is dependent on the phase relationship or the polarity of the signals and on the invert function.
in ADD mode the following combinations are possible for
in-phase input voltages: No invert function active = sum.
One invert function active = difference. Both invert functions active = sum.
Antiphase input voltages: No invert function active = difference. One invert function active = sum. Both invert functions active = difference.
In the ADD mode the vertical display position is dependent upon the Y-POS. setting of both channels. The same Y deflection coefficient is normally used for both channels with algebraic addition.
Please note that the Y-POS. settings are also added but are not affected by the INV setting.
Differential measurement techniques allow direct measure- ment of the voltage drop across floating components (both ends above ground). Two identical probes should be used for both vertical inputs. In order to avoid ground loops, use a separate ground connection and do not use the probe ground leads or cable shields.
X-Y Operation
The most important control regarding this operation mode is the DUAL - XY (23)pushbutton (please note section “Controls
and Readout”).
In XY mode the time base is deactivated. The signal applied to the input of channel || - front panel marking HOR. INP. (X) - causes the X deflection. The input related controls (AC/DC, GD pushbutton and the VOLTS/DIV knob) consequently affect the X deflection. For X position alteration, the X-POS. control knob must be used, as the Y-POS. Il control is automatically inactivated. The input deflection coefficient ranges are the same for both channels, because the X x10 magnifier is inactive in XY mode.
The bandwidth of the X amplifier, is lower than the Y amplifier and the phase angle which increases with higher frequencies, must be taken into account (please note data sheet).
The inversion of the X-input signal is not possible.
Lissajous figures can be displayed in the X-¥ mode for certain measuring tasks:
® Comparing two signals of different frequency or bringing one frequency up to the frequency of the other signal. This also applies for whole number multiples or fractions of the one signal frequency.
e Phase comparison between two signais of the same frequency.
Phase comparison with Lissajous figures
The following diagrams show two sine signals of the same frequency and amplitude with different phase angles.
o° 35° 90° 180°
i H i i
| :
| i i
Calculation of the phase angle or the phase shift between the X and Y input voltages (after measuring the distances a andb on the screen) is quite simple with the following formula, and a pocket calculator with trigonometric functions. Apart from the reading accuracy, the signal height has no influence on the result.
sin oF
cos o=| 1- (ey
= ina p=are sing
Subject to change without notice

Operating modes of the vertical amplifiers in Yt mode
The following must be noted here:
e¢ Because ofthe periodic nature of the trigonometric functions, the calculation should be limited to angles <90° However here is the advantage of the method.
e Due to phase shift, do not use a too high test frequency.
e [lt cannot be seen as a matter of course from the screen display if the test voltage leads or lags the reference voltage. A CR network before the test voltage input of the oscilloscope can help here. The 1 MQ input resistance can equally serve as R here, so that only a suitable capacitor C needs to be connected in series. If the aperture width of the ellipse is increased (compared with C short-circuited), then the test voltage leads the reference voltage and vice versa. This applies only in the region up to 90° phase shift. Therefore C should be sufficiently large and produce only a relatively small just observable phase shift.
Should both input voltages be missing or fail in the X-Y mode, a very bright light dot is displayed on the screen. This dot can burn into the phosphor at a too high brightness setting (INTENS. knob) which causes either a lasting loss of brightness, or in the extreme case, complete destruction of the phosphor at this point.
Phase difference measurement in DUAL mode (Yt)
Phase differences between two input signals of the same frequency and shape can be measured very simply on the screen in Dual mode. The time base should be triggered by the reference signal (phase position 0). The other signal can then have a leading or lagging phase angle.
For greatest accuracy adjust the time base for slightly over one period and approximately the same height of both signals on the screen. The Y deflection coefficients, the time base coefficients and the trigger level setting can be used for this adjustment, without influence on the result. Both base lines are set onto the horizontal graticule center line using the Y- POS. knobs before the measurement. With sinusoidal signals, observe the zero (crossover point) transitions; the sine peaks are less accurate. If a sine signal is noticeably distorted by even harmonics, or if a DC voltage is present, AC coupling is recommended for both channels. If it is a question of pulses of the same shape, read off at steep edges.
It must be noted that the phase difference cannot be determined if alternate triggering is selected.
Phase difference measurement in DUAL mode
t = horizontal spacing of the zero transitions in div T = horizontal spacing for one period in div
In the example illustrated, t = 3div and T = 10div. The phase difference in degrees is calculated from
Subject to change without notice
t 3 2 -4.360° = 3. - 360° = 108° @? = 7" 960° = 75
t 3 arc @° =—° 27 = —e2n = 1,885 rad ens 10
Relatively small phase angles at not too high frequencies can be measured more accurately in the X-Y mode with Lissajous figures.
Measurement of an amplitude modulation
The momentary amplitude u at time t of a HF-carrier voltage, which is amplitude modulated without distortion by a sinusoidal AF voltage, is in accordance with the equation
u=U, + sinQt + 0,5m * U, + cos(Q-o) t—0,5m « U, * cos(Q+a)t
where
Ut = unmodulated carrier amplitude Q = 2nF = angular carrier frequency @ = 2nf = modulation angular frequency m= = modulation factor.
The lower side frequency F-f and the upper side frequency F+f arise because of the modulation apart from the carrier frequency F.
The display of an amplitude-modulated HF oscillation can be evaluated with the oscilloscope provided the frequency spectrum is inside the oscilloscope bandwidth. The time base is set so that several cycles of the modulation frequency are visible. Strictly speaking, triggering should be external with modulation frequency (from the AF generator or a demo- dulator). However, internal triggering is frequently possible with normal triggering using a suitable trigger level setting and possibly also using the time vernier (variable) adjustment.
U T
F-f F Fef
Figure?
Amplitude and frequency spectrum for AM display (m = 50%)
Oscilloscope setting for a signal according to figure 2: e Y: CH. |; 20mV/div; AC. e TIME/DIV.: 0.2ms/div. ¢ Triggering: Normal; with LEVEL-setting; internal
(or external) triggering.
Figure 2
Amplitude modulated oscillation: F = 1 MHz; f = 1 kHz;
m = 50 %; UT = 28.3 mVrms.

Triggering and time base
lf the two values a and b are read from the screen, the
modulation factor is calculated from
a-b a-b “aap. SPS Mm TAs * 100 [%]
where
a = Ut (14m) and b = Ut (1-m).
The variable controls for amplitude and time can be set arbitrarily inthe modulation factor measurement. Their position does not influence the result.
Triggering and time base
All controls regarding trigger and time base are located on the right of the VOLTS/DIV. knobs. They are described in the section “Controls and Readout”.
Time related amplitude changes on a measuring signal (AC voltage) are displayable in Yt-mode. In this mode the signal voltage deflects the beam in vertical direction (Y) while the
time base generator moves the beam from the left to the right of the screen (time deflection = t).
Normally there are periodically repeating waveforms to be displayed. Therefore the time base must repeat the time deflection periodically too. To produce a stationary display, the time base must only be triggered if the signal height and slope condition coincide with the former time base start conditions. A DC voltage signal can not be triggered as it is a constant signal with no slope.
Triggering can be performed by the measuring signal itself (internal triggering) or by an external supplied but synchronous voltage (external triggering).
The trigger voltage should have a certain minimum amplitude. This value is called the trigger threshold. It is measured with a sine signal. Except when external trigger is used the trigger threshold can be stated as vertical display height in div, at which the time base generator starts, the display is stable, and the trigger indicator LED lights or flashes. The internal trigger threshold of the oscilloscope is given as < 5div. When the trigger voltage is externally supplied, it can be measured in Vpp at that input. Normally, the trigger threshold may be exceeded up to a maximum factor of 20.
The instrument has two trigger modes, which are characterized as Automatic Peak and Normal triggering.
Automatic Peak (value) -Triggering
Instrument specific information can be drawn from the items NM - AT - /\(16) and LEVEL (18) in the section “Controls and Readout”.
This trigger mode is automatically selected after the AUTO SET pushbutton was pressed. As the peak value detection makes no sense in combination with DC and TV (television) signals, it is switched off automatically in DC, TVL and TVF trigger coupling conditions as well as in alternate trigger mode. In this case the automatic is still present, but a wrong trigger level setting causes an untriggered display.
In automatic trigger mode the sweep generator can run without test signal or external trigger voltage. A base line will always be displayed even with no signal. With an applied AC signal the peak value triggering enables the user to select the voltage point on the trigger signal (trigger point), by the adjustment of the trigger jevel control. The control range depends on the peak to peak value of the signal. This trigger
28 a ee ana ee Se Ee
mode is therefore called Automatic Peak (Value)- Triggering. Operation of the scope needs only correct amplitude and time base settings, for a constantly visible trace. Automatic mode is recommended for all uncomplicated measuring tasks. However, automatic triggering is also the appropriate operation mode for the “entry” into difficult measuring problems, e.g. when the test signal is unknown relating to amplitude, frequency or shape. Presetting of all parameters is now possible with automatic triggering; the change to normal triggering can follow thereafter.
The automatic triggering works above 20Hz. The failure of automatic triggering at frequencies below 20Hz is abrupt. However, it is not signified by the trigger indicator LED this is still blinking. Break down of triggering is best recognizable at the left screen edge (the start of the trace in differing display height).
The automatic peak (value) triggering operates over all variations or fluctuations of the test signal above 20Hz. However, if the
pulse duty factor of a square-wave signal exceeds a ratio of 100:1, switching over to normal triggering will be necessary. Automatic triggering is practicable with internal and external trigger voltage.
Normal Triggering
The description of the most important control elements (NM - AT- /\(16) and LEVEL (18)) is part of the section “Controls and Readout”).
With normal triggering, the sweep can be started by AC signals within the frequency range defined by the trigger coupling setting.
In the absence of an adequate trigger signal or when the trigger controls (particularly the trigger LEVEL control) are misadjusted, no trace is visible, i.e. the screen completely blanked.
When using the internal normal triggering mode, it is possible to trigger at any amplitude point of a signal edge, even with very complex signal shapes, by adjusting the trigger LEVEL control. lf the signal applied at the Y input is used for triggering (internal trigger source), its adjusting range is directly dependent on the display height, which should be at least O.5div. If it is smaller than div, the trigger LEVEL adjustment needs to be operated with a sensitive touch. !n the external normal triggering mode, the same applies to approx. 0.3Vpp external trigger voltage amplitude.
Other measures for triggering of very complex signals are the use of the time base variable control and HOLD OFF time control, hereinafter mentioned.
/\ Slope
Please note item (16) in section “Controls and Readout” for instrument specific information.
The actual slope setting is displayed in the readout. The setting is not changed by the AUTO SET function. The slope setting can be changed in alternate- and B time base mode for the B time base trigger unit if the delay trigger function is active. The previous slope setting for the A time base trigger is stored and still active. For further information please note “Controls and Readout”.
The time base generator can be triggered by a rising or falling edge of the test signal. Whether the rising or the falling edge is used for triggering, depends on the slope direction setting. This is valid with automatic and normal triggering. The positive
m= Subject to change without notice

Triggering and time base
slope direction means an edge going from a negative potential and rising to a positive potential. This has nothing to do with zero or ground potential and absolute voltage values. The positive slope may also lie in a negative part of a signal.
However the trigger point may be varied within certain limits on the chosen edge using the LEVEL control. The slope direction is always related to the input signal and the non inverted display.
Trigger coupling
Instrument specific information regarding this item can be noted in the “Data Sheet”. The coupling setting (TRIG. MODE (27)) and indication are described under “Controls and Readout”.
As the automatic triggering does not work below 20Hz, normal triggering should be used in DC, NR and LF trigger coupling mode. The coupling mode and accordingly the frequency range of the trigger signal should meet the signal requirements.
AC: This is the most frequently used trigger mode. The trigger threshold increases below and above the frequency limits mentioned in the data sheet. This filter cuts off both the DC content of the trigger signal and the lowest frequency range.
DC: In this coupling mode the trigger signal is coupled galvanically to the trigger unit. Therefore there is no low frequency limit.
DC triggering is recommended if the signal is to be triggered with quite slow processes or if pulse signals with constantly changing pulse duty factors have to be displayed.
HF: In this coupling mode the transmission range equals a high pass filter. It cuts off the DC content of the trigger signal and the lower frequency range.
NR: Decreases the maximum trigger bandwidth for high frequency signals. As in DC coupling condition, lower frequency signal parts are not affected.
LF: The LF coupling (low pass filter function) is often more suited for low-frequency signals than the DC coupling, because the (white) noise in the trigger voltage is strongly suppressed. So jitter or double-triggering of complex signals is avoidable or at least reduced, in particular with very low input voltages.
TV-L: The built-in active TV-Sync-Separator provides the separation of line sync pulses from the video signal. Even distorted video signals are triggered and displayed in a stable manner. This mode is described under paragraph “Triggering of video signals”.
TV-F: The built-in active TV-Sync-Separator also provides the separation of frame sync pulses from the video signal. Even distorted video signals are triggered and displayed in a stable manner. This mode is described under paragraph “Triggering of video signals”.
Triggering of video signals
In TV-L and TV-F trigger coupling mode the instrument is automatically set to automatic triggering and the trigger point indicator is switched off. As only the separated synchronization pulses are used for triggering the relationship between the displayed signal and the trigger signal is lost. In TV-F mode
Subject to change without notice
interference may occur if chopped DUAL mode is chosen or the readout is active. Video signals are triggered in the automatic mode. The internal triggering is virtually indepen- dent of the display height, but the sync pulse must exceed 0.5div height.
The polarity of the synchronization pulse is critical for the slope selection. If the displayed sync pulses are above the picture (field) contents (leading edge positive going), then the slope setting for positive going edges must be chosen. In the case of sync pulses below the field/line, the leading edge is negative and consequently the slope selection must be set for falling edges. Since the invert function may cause a misleading display, it must not be activated.
On the 2ms/div setting and field TV triggering selected, 1 field is visible if a 50 fields/s signal is applied. If the hold off control is in fully ccw position, it triggers without line interlacing affects caused by the consecutive field. More details in the video signal become visible if in alternate or B time base mode the B time base speed is increased above the A time base speed. If the time base is set to 5ms/div 2.5 frames are visible. The time delay for the B time base then can be used to select any line(s) to be displayed expanded on the screen. The influence of the integrating network which forms a trigger pulse from the vertical sync pulses may become visible under certain conditions. Due to the integrating network time constant not ail vertical sync pulses starting the trace are visible.
On the 10us/div setting and line TV triggering selected, approx. 1¥% lines are visible. Those lines originate from the odd and even fields at random. The sync-separator-circuit also operates with external triggering. It is important that the voltage range (0.3Vpp to 3Vpp) for external triggering should be noted. Again the correct slope setting is critical, because the external trigger signal may not have the same polarity or pulse edge as the test signal displayed on the CRT. This can be checked, if the external trigger voltage itself is displayed first (with internal triggering).
In most cases, the composite video signal has a high DC content. With constant video information (e.g. test pattern or color bar generator), the DC content can be suppressed easily by AC input coupling of the oscilloscope amplifier. With a changing picture content (e.g. normal program), DC input coupling is recommended, because the display varies its vertical position on screen with AC input coupling at each change of the picture content. The DC content can be compensated using the Y-POS. control so that the signal display lies in the graticule area. Then the composite video signal should not exceed a vertical height of 6div.
Line / Mains triggering (~)
The instrument specific information regarding this mode is part of the section “Controls and Readout” paragraph TRIG. MODE (27).
A voltage originating from mains/line (50 to 60Hz) is used for triggering purposes if this mode is selected. This trigger mode is independent of amplitude and frequency of the Y signal and is recommended for all mains/line synchronous signals. This also applies within certain limits, to whole number multiples or fractions of the line frequency. Line triggering can also be useful to display signals below the trigger threshold (less than 0.5div). It is therefore particularly suitable for measuring small ripple voltages of mains/line rectifiers or stray magnetic field in a circuit. In this trigger mode the slope direction pushbutton selects the positive or negative portion of the line/mains sinewave.
The trigger level control can be used for trigger point adjustment. Magnetic leakage (e.g. from a power transformer) can be
29

Triggering and time base
investigated for direction and amplitude using a search or pick- up coil. The coil should be wound on a small former with a maximum of turns of a thin lacquered wire and connected to a BNC connector (for scope input) via a shielded cable. Between cable and BNC center conductor a resistor of at least 100Q should be series-connected (RF decoupling). Often it is advisabie to shield statically the surface of the coil. However, no shorted turns are permissible. Maximum, minimum, and
direction to the magnetic source are detectable at the measuring point by turning and shifting the coil.
Alternate triggering
This trigger mode can be selected in DUAL mode by pressing and holding the TRIG. pushbutton (24) if the preconditions are met (please note “Controls and readout”). In the case of chopped DUAL mode, selecting alternate trigger mode automatically sets the instrument to alternate DUAL mode.
If the trigger coupling is set to TV-L or TV-F, selecting alternate triggering automatically results in AC coupling conditions. Under line/mains triggering condition alternate triggering can not be chosen. Thus only the following trigger coupling modes are available in alternate trigger mode: AC, DC, HF, NR and LF. The trigger point symbol is internally inactivated.
With alternate triggering it is possible to trigger two signals which are different in frequency (asynchronous). In this case the oscilloscope must be operated in alternate DUAL mode and each input signal must be of sufficient height to enable trigger. To avoid trigger problems due to different DC voltage components, AC input coupling for both channels is recommended.
The internal trigger source is switched in alternate trigger mode in the same way as the channel switching system in alternate DUAL mode, i.e. after each time base sweep. Phase difference measurement is not possible in this trigger mode as the trigger level and slope setting are equal for both signals. Even with 180° phase difference between both signals, they appear with the same slope direction. If signals are applied with a high frequency ratio (difference), the trace intensity then becomes reduced if the time base is set to smaller time coefficients (faster sweep). This happens as the number of sweeps does not increase because it depends on the lower frequency signal, but with a faster sweep the phosphor becomes less activated.
External triggering
The external trigger input is activated with the aid of the TRIG. (24) pushbutton (see “Controls and Readout”), if the trigger coupling is not set to line/mains trigger coupling. Then the internal trigger source is deactivated. As the external trigger signal applied at the TRIG. EXT socket normally has no relation to the signal height of the displayed signal, the trigger point symbol is switched off. The external trigger voltage must have a minimum amplitude of 0.3Vpp and should not increase above 3Vpp. The input impedance of the TRIG. EXT. socket is approx. TMQ || 15pF.
The maximum input voltage of the input circuit is 100V (DC+peak AC).
The external trigger voltage may have a completely different form from the test signal voltage, but must be synchronous with the test signal. Triggering is even possible in certain limits with whole number multiples or fractions of the test frequency.
It must be noted that a different phase angle between the measuring and the triggering signal may cause a display not coinciding with the slope selection setting.
The trigger coupling selection can also be used in external triggering mode.
Trigger indicator
The following description applies to the “TR” LED (17). Please note “Controls and Readout”.
An LED on condition indicates that the trigger signal has a sufficient amplitude and the trigger level control setting is correct. This is valid with automatic and with normal triggering. By observing the trigger LED, sensitive trigger level adjustment is possible when normal triggering is used, particularly at very low signal frequencies. The indication pulses are of only 100ms duration.
Thus for fast signals the LED appears to glow continuously, for low repetition rate signals, the LED flashes at the repetition rate or at a display of several signal periods not only at the start of the sweep at the left screen edge, but also at each signal period. In automatic triggering mode the sweep generator starts repeatedly without test signal or external trigger voltage. If the trigger signal frequency decreases the trigger automatic repetition frequency the sweep generator starts without awaiting the trigger pulse. This causes an untriggered display and a flashing trigger LED.
HOLD OFF-time adjustment
For instrument specific information please note DEL.POS. - HO (28) in section “Controls and Readout”.
lf it is found that a trigger point cannot be found on extremely complex signals, even after careful adjustment of the trigger level control, a stable display may often be obtained using the holdoff control. This facility varies the holdoff time between two sweep periods approx. up to the ratio 10:1. Pulses or other signal waveforms appearing during this off period cannot
trigger the time base.
Particularly with burst signals or aperiodic pulse trains of the same amplitude, the start of the sweep can be delayed until the optimum or required time.
A very noisy signal or a signal with a higher inter- fering frequency is at times displayed double. It is possible that trigger level adjustment only controls the mutual phase shift, but not the double display. The stable single display of the signal, required for evaluation, is easily obtainable by expanding the hold off time until one signal is displayed.
A double display is possible with certain pulse signals, where the pulses alternately show a small difference of the peak amplitudes. Only a very exact trigger level adjustment makes a single display possible. The use of the holdoff control simplifies the right adjustment.
After specific use the holdoff control should be reset into its calibration detent (fully ccw), otherwise the brightness of the display is reduced drastically. The function is shown in the
following figures.(Page 31)
Subject to change without notice

Auto Set
heavy parts are displayed
period
signal
sweep Fig. 1
| | adjusting 1 | |
| | HOLD OFF
p we Fig. 2
Fig.1 shows a case where the holdoff control is inthe minimum
position and various different waveforms are overlapped
onthe screen, making the signal observation unsuccessful.
Fig.2 showsa case where only the desired parts of the signal are
stably displayed.
B time base (2nd time base) / Triggering after Delay
Please note instrument specific information in section “Controls and readout”. The most important controls regarding this mode are A/ALT - B (30), DEL.TRIG. - VAR. (31), TIME/DIV. (29), DEL. POS. (28) and TRS (13).
As mentioned before, triggering starts the time base sweep and unblanks the beam. After the maximum X deflection to the right, the beam is blanked and flies back to the (left) start position. After the hold off time has elapsed the sweep is started automatically by the automatic trigger or the next trigger signal. In normal triggering mode the automatic trigger is switched off and the sweep will only start on receipt of a trigger signal. As the trigger point is always at the trace start position, trace expansion in X direction with the aid of the time base is limited to the display always from the trace start. Parts of the signal to be expanded which are displayed near the trace end (right side of the screen) are lost when the time base speed is increased (time coefficient reduced). The X expansion by 10 may also be used, but again the expansion factor is limited. The B time base solves such problems.
First the A time coefficient should be in a suitable setting to display a complete signal period. After setting the instrument to alternate time base mode (A and 8), the signal part to be expanded must be selected with the aid of the intensified sector on the A time base trace. The B time base deflection coefficient should be at least a tenth of the A time coefficient.
Higher A/B ratios (i.e. A: 1ms/div, B: 1ps/div = 1000fold expansion) result in a drastically reduced B trace intensity. Within certain limits this can be compensated by the intensity setting. To avoid high contrast between the A and B time base trace, change from alternate (A and 8) to B time base mode. Then the A trace is invisible.
The start position of the intensified sector on the A trace can be stated as the delay time. It is related to the A trace start and the A time coefficient. The delay function delays the B trace
Subject to change without notice
start by a variable time from the A trigger point. This allows the sweep to begin on any portion of a signal (except the first millimeters). lf the display shows jitter, it is possible to select triggering of the B time base after the elapsed delay time.
AUTO SET
The instrument specific information regarding this function is part of the section “Controls and Readout” paragraph AUTO SET (2). The following description is relevant for analog and digital operation. In digital operation AUTO SET automatically selects REFRESH signal capture if ROLL or SINGLE mode is active. The signal to be displayed must meet the amplitude and frequency requirements of automatic triggering, to enable a useful automatic instrument setting.
As also mentioned above all controls are electronically selected with the exception of the POWER and calibrator frequency (CAL 1kHz/1MHz) pushbuttons as well as the FOCUS and TR (trace rotation) control. Thus automatic signal related instrument set up in Yt (time base) mode is possible. In most cases no additional manual instrument setting is required.
Briefly pressing the AUTO SET pushbutton causes the instrument to switch over to the last Yt mode settings regarding CH I, CH Il and DUAL. If the instrument was operated in Yt mode, the actual setting will not be affected with the exception of ADD mode which will be switched off. At the same time the attenuator(s) (VOLTS/DIV) are automatically set for a signal display height of approx. 6 div in mono channel mode or if in DUAL mode for approx. 4 div height for each channel. This and the following explanation regarding the automatic time coefficient setting assumes that the pulse duty factor of the input signal is approx. 1:1.
The time deflection coefficient is also set automatically for a display of approx. 2 signal periods. The time base setting occurs randomly if complex signals consisting several frequencies e.g. video signals are present.
AUTO SET sets the instrument automatically to the following operating conditions:
e The input coupling is not affected while AC or DC is used, but if GD was selected the last used input coupling (AC or DC) will be chosen.
e |nternal triggering (channel | or channel I!) e Automatic peak (value) triggering ¢ Trigger level in electrical midrange position e Y deflection coefficient(s) calibrated
between 5mV/div and 20V/div e A time base (deflection coefficient calibrated)
Alternate and B time base mode switched off © AC trigger coupling (DC trigger coupling unchanged) ¢ X x10 magnifier switched off e Automatic X and Y position settings e Trace and readout visible.
If CURSOR measurement is active, AUTO SET causes addi- tional automatic settings. The restrictions already mentioned must be taken into account:
Analog mode in combination with AV ® automatic CURSOR supported voltage measurement. ¢ automatic assignment of the CURSOR lines to the signal, which is used for triggering when DUAL mode is active.
Note If no signal is applied or the trigger conditions can not be met, the CURSOR line positions do not change.

Save/Recall
The positioning accuracy depends on the signal frequency.
Digital mode in combination with all CURSOR measurement modes e automatic CURSOR supported voltage, time and frequency
measurement * automatic assignment of the CURSOR lines to the signal,
which is used for triggering when DUAL mode is active.
Note i. If no signal is applied or the trigger conditions can not be met, the CURSOR line positions do not ehangs:
AN Attention!
If a signal is applied with a pulse duty factor of ap- prox. 400:1 or larger, an automatic signal display can not be performed. The pulse duty factor. causes too low a Y deflection coefficient (sensitivity too high) and too high a time deflection coefficient (time base speed to slow) and results ina ee In which aed the baseline is visible.
In such cases it is recommended to select normal triggering and to set the trigger point approx. 0.5div above or below the trace. If under one of these conditions the trigger indicator LED is lit, this indicates the presence of a signal. Then both the time coefficient and Y deflection coefficient should be reduced. Please note that a reduction in intensity may occur, which could result in a blank screen when the physical limits are reached.
STORAGE MODE ONLY In contrast to analog mode, intensity reduction does not occur. But it must be noted that pulses of less than 20ns width are displayed with too small amplitude. This is because of too few samples per pulse, as in 200MS/s condition (5ns sampling interval) only 4 samples are taken.
SAVE/RECALL
The instrument specific information regarding the controls and their use are part of item (12) in section “Controls and Readout”.
The instrument contains a non volatile memory which can be used by the operator to save 9 different instrument settings and to recall them. This relates to all settings with the exception of FOCUS, TR (trace rotation) and the calibrator frequency pushbutton.
Component Tester (analog mode)
General
The instrument specific information regarding the controls and terminals are part of item CT (46) in section “Controls and Readout”.
The instrument has a built-in electronic Component Tester, which is used for instant display of a test pattern to indicate whether or not components are faulty. It can be used for quick checks of semiconductors (e.g. diodes and transistors), resistors, capacitors, and inductors. Certain tests can also be made to integrated circuits. All these components can be tested individually, or in circuit provided that it is unpowered.
The test principle is fascinatingly simple. A built-in generator delivers a sine voltage, which is applied across the component under test and a built-in fixed resistor. The sine voltage across the test object is used for the horizontal deflection, and the voltage drop across the resistor (i.e. current through test
32
object) is used for vertical deflection of the oscilloscope. The test pattern shows a current-voltage characteristic of the test object.
The measurement range of the component tester is limited and depends on the maximum test voltage and current (please note data sheet). The impedance of the component under test is limited to a range from approx. 20Q to 4.7kQ. Below and above these values, the test pattern shows only short-circuit or open-circuit. For the interpretation of the displayed test pattern, these limits should always be born in mind. However,
most electronic components can normally be tested without any restriction.
Using the Component Tester
After the component tester is switched on, the vertical preamplifier and the time base generator are inoperative. A shortened horizontal trace will be observed. It is not necessary to disconnect scope input cables unless in-circuit measure- ments are to be carried out.
For the component connection, two simple test leads with 4mm @ banana plugs, and with test prod, alligator clip or sprung hook, are required. The test leads are connected as described in section “Controls and Readout”.
Test Procedure
A Caution! Do not test any component in live circuitry - remove all grounds, power.and signals connected to the com- ponent under test. Set up Component Tester as sta- ted. Connect test leads across component to be tes- ted. Observe oscilloscope display.
AN Only discharged capacitors should be tested!
Test Pattern Displays
The “Test patterns” shows typical patterns displayed by the various Components under test.
¢ Open circuit is indicated by a straight horizontal line. e Short circuit is shown by a straight vertical line.
Testing Resistors
If the test object has a linear ohmic resistance, both deflecting voltages are in the same phase. The test pattern expected from a resistor is therefore a sloping straight line. The angle of slope is determined by the resistance of the resistor under test. With high values of resistance, the slope will tend towards the horizontal axis, and with low values, the slope will move towards the vertical axis.
Values of resistance from 20Q to 4.7kQ can be approximately evaluated. The determination of actual values will come with experience, or by direct comparison with a component of a known value.
Testing Capacitors and Inductors
Capacitors and inductors cause a phase difference between current and voltage, and therefore between the X and Y
deflection, giving an ellipse-shaped display. The position and opening width of the ellipse will vary according to the impedance value (at 50Hz) of the component under test.
A horizontal ellipse indicates a high impedance or a relatively small capacitance or a relatively high inductance.
Subject to change without notice

Component Tester (analog mode)
A vertical ellipse indicates a small impedance or a relatively large capacitance or a relatively small inductance.
Asloping ellipse means that the component has a considerable ohmic resistance in addition to its reactance.
The values of capacitance of normal or electrolytic capacitors from 0.1pF to 1000uF can be displayed and approximate values obtained. More precise measurement can be obtained in a smaller range by comparing the capacitor under test with a capacitor of known value. Inductive components (coils, transformers) can also be tested. The determination of the value of inductance needs some experience, because inductors have usually a higher ohmic series resistance. However, the impedance value (at 50H2z) of an inductor in the range from 20Q to 4.7kQ can easily be obtained or compared.
Testing Semiconductors
Most semiconductor devices, such as diodes, Z-diodes, transistors, FETs can be tested. The test pattern displays vary according to the component type as shown in the figures below. The main characteristic displayed during semiconductor testing is the voltage dependent knee caused by the junction changing from the conducting state to the non conducting state. It should be noted that both the forward and the reverse characteristic are displayed simultaneously. This is a two- terminal test, therefore testing of transistor amplification is not possible, but testing of a single junction is easily and quickly possible. Since the test voltage applied is only very low, all sections of most semi-conductors can be tested without damage. However, checking the breakdown or reverse voltage of high voltage semiconductors is not possible. More important is testing components for open or short-circuit, which from experience is most frequently needed.
Testing Diodes
Diodes normally show at least their knee in the forward characteristic. This is not valid for some high voltage diode types, because they contain a series connection of several diodes. Possibly only a small portion of the knee is visible. Zener diodes always show their forward knee and, depending on the test voltage, their zener breakdown forms a second knee in the opposite direction. If the breakdown voltage is higher than the positive or negative voltage peak of the test voltage, it can not be displayed.
The polarity of an unknown diode can be identified by comparison with a known diode.
Type: Normal Diode Highvolt.-Diode 2-Diode 6.8V Terminals: Cathode-Anode Cathode-Anode Cathode-Anode Connections: (CT-GD) (CT-GD) (CT-GD)
Testing Transistors
Three different tests can be made to transistors: base-emitter,
base-collector and emitter-collector. The resulting test patterns are shown below.
The basic equivalent circuit of a transistor is a Z-diode between base and emitter and a normal diode with reverse polarity between base and collector in series connection. There are three different test patterns.
Subject to change without notice
|
| | |
N-P-N Transistor Terminals: B-E B-C E-C Connections: (CT-GD) (CT-GD) (CT-GD)
| I | oo eats el a oe
| | |
P-N-P Transistor Terminals: B-E B-C E-C Connections: (CT-GD) (CT-GD) (CT-GD)
For a transistor the figures b-e and b-c are important. The figure @-c can vary; but a vertical line only shows short circuit condition. These transistor test patterns are valid in most cases, but there are exceptions to the rule (e.g. Darlington, FETs). With the COMPONENT TESTER, the distinction between a P-N-P to an N-P-N transistor is discernible. In case of doubt, comparison with a known type is helpful. It should be noted that the same socket connection (COMP. TESTER or ground) for the same terminal is then absolutely necessary.
Aconnection inversion effects a rotation of the test pattern by 180 degrees round about the center point of the scope graticule.
In-Circuit Tests
Single Transistors
Junction B-C Junction B-E
Junction E-C
Single components
es
Short cirewit Resistor 5100
Main transformer primar
Single Diodes In-circuit Semiconductors
[
Z-Diode below 7V
os Silicon diode Germaniumdiode
( Diode paralleled by 68082
_ Z-Diode beyond 7V 2 Diodes antiparallel
Diode in series with 610 8-E parallel by 6800
Thyristor, G + A together B-E with 1pF +6800 Si-Diode with 10uF
33

Storage Mode
Caution! During in-circuit tests make sure the circuit is dead. No power from mains/line or battery and no signal inputs are permitted. Remove all ground connections including Safety Earth (pull out power plug from out- let). Remove all measuring cables including probes between oscilloscope and circuit under test. Otherwise both COMPONENT TESTER leads are not isolated against the circuit under test.
In-circuit tests are possible in many cases. However, they are not well defined. This is caused by a shunt connection of real or complex impedances - especially if they are of relatively low impedance at 50Hz - to the component under test, often results differ greatly when compared with single components. In case of doubt, one component terminal may be unsoldered. This terminal should then not be connected to the ground socket avoiding hum distortion of the test pattern.
Another way is a test pattern comparison to an identical circuit which is known to be operational (likewise without power and any external connections). Using the test prods, identical test points in each circuit can be checked, and a defect can be determined quickly and easily. Possibly the device itself under test contains a reference circuit (e.g. a second stereo channel,
push-pull amplifier, symmetrical bridge circuit), which is not defective.
Storage mode
In contrast to analog mode, the storage mode offers the following advantages: One time events can be captured easily. Even very low frequency signals can be displayed as a complete curve. Narrow pulses with low repetition rates do not cause intensity reduction. Documentation and processing of captured signals is easily possible.
In comparison with analog mode, the disadvantages of storage mode are: The reduced X and Y resolution and a lower update rate. Danger of alias signal display, caused by a sampling rate (time base setting) which is relatively too low with respect to the current signal.
The analog mode offers an unsurpassed faithful signal display. With the combination of analog and digital oscilloscope, HAMEG enables the user to select the most suitable mode for the specific measurement.
The HM1507-2 contains two 8 bit flash A/D converters with a
maximum sampling rate of 100MS/s each. Except in the combination of DUAL mode and single event recording with a maximum of 100MS/s for each channel, in all other modes 200MS/s is available if the lowest time coefficient is chosen.
Apart from the factors above, there is no principle difference between capturing repetitive signals and one-time events. The signal is always displayed with a linear connection between the dots (Dot Join function).
Signals captured and stored in storage mode can be called via the built-in RS232 interface for documentation purposes. For further information please note section “RS232 Interface - Remote Control”.
Signal recording modes
Signals can be recorded and displayed in six different modes: REFRESH mode (RFR LED lit, readout indicates RFR)
34 une
ENVELOPE mode (ENV LED lit, readout indicates ENV)
AVERAGE mode (AVM LED lit, readout indicates AVM) SINGLE mode (SGL LED lit, readout indicates SGL) ROLL mode (ROL LED lit, readout indicates ROL) XY mode (RFR LED lit, readout indicates XY)
Except ROLL and XY mode, a signal recording in all other modes requires a trigger signal.
In REFRESH, ENVELOPE and AVERAGE modes the ins- truments behaves like an analog oscilloscope. The trigger circuit starts a recording, overwriting the previous recording from the left to the right side of the screen. After the recording has been finished, the next trigger event starts the same procedure. This can also be caused in automatic trigger mode without an applied signal by the automatic circuitry. Then only the trace (Y-POS. setting) is recorded.
In contrast to automatic trigger mode, in normal trigger mode the automatic system is switched off and consequently only a trigger signal can start a recording. Unlike analog mode where the screen is dark until a trigger signal starts the time base, in store mode the last recorded signal remains visible as long as no new recording is triggered by an input signal.
AVERAGE and ENVELOPE are REFRESH sub-modes and described in section “Controls and Readout” under item
STOR. MODE (9).
SINGLE mode (SGL) enables the capture of one-time events, started by a suitable trigger signal. It is recommended, to select input ground (GD) condition and set the trace on a graticule line which is then used as the 0 Volt position (reference) line. After SINGLE (SGL) mode has been selected, the trigger point symbol should be set above or below the 0 Volt position line, according to the expected voltage of the event to be captured. Whether the slope selection is set fora rising or falling slope depends on the measurement task. After this procedure AC or DC input coupling must be selected and the signal capture started after pressing the RESET pushbutton. The following example is for additional explanation.
If a voltage drop on a +5 Volt line is expected, the 0 Volt line may be set to the horizontal center graticule line by using the Y-POS. control. Then the trigger point symbol may be set 2 division above the 0 Volt position using the LEVEL control.
If the deflection coefficient is set to 200mV and DC input coupling selected, using a x10 probe, the trigger point is at +4 Volts. A voltage drop from + 5 Volts below +4 Volts then is used for triggering, if negative slope setting is selected. If the slope selection is positive the end of the event (voltage drop ended) is used for triggering.
For explanations regarding ROLL mode, please note this item (9) in section “Readout and Controls”.
Vertical resolution
The dot density in each operation mode is 8 bits = 28 = 256 dots displayed over a height of roughly 10 divisions. The instrument is adjusted for 25 dots per division. This eases processing and cursor measurement.
Insignificant differences between the (analog) screen display and the (digital) data are unavoidable.
This concerns signal height as well as the position. The trace position is defined in respect to the following horizontal graticule lines:
m= Subject to change without notice

Storage Mode Test instructions
Center line = 10000000 (binary) = 80 (hex) = 128 (dec). Top line = 11100100 (binary) = E4 (hex) = 228 (dec). Bottom line= 00011100 (binary) = 1C (hex) = 28 (dec).
In contrast to analog mode with its theoretically unlimited resolution, the vertical resolution has 25 possible trace positions per division.
If the signal is superimposed by noise or a critical Y-POS. setting is used, the least significant bit (LSB) may change continuously. This additionally reduces the vertical resolution in storage mode, but is unavoidable. In contrast to the expen- sive flash A/D converters used in this instrument, other converters such as CCD cause more noise.
Horizontal resolution
The maximum number of signals to be displayed simultaneously is four. Each signal consists of 2048 (211) byte (samples). Referred to the horizontal raster, the resolution is 200 samples per division.
Pure (only) digital oscilloscope with VGA monitor type CRTs offer only 50 samples per division. If LCD displays are used the current resolution is 25 samples per division. For a given time base setting the HAMEG instrument samples at a 4 (compared to VGA) or 8 ( referred to LCD) times higher sampling rate. The higher number of samples/div results in a shorter sampling interval. For the following example it must be keptin mina, that the time base setting is related to the signal period duration and consequently should enable the display of one complete signal period. If e.g. a 50Hz signal has to be displayed the time base should be set to 2ms/div. The maximum signal frequency of a superimposed sinewave signal, which must be sampled with at least 10 samples per period, depends on the horizontal resolution:
samples/div | sampling interval | sampling rate
2ms : 200 = 10us 100kS/s 10kHz
2ms : 50 = 40us 25kS/s 2.5kHz
2ms : 25 = 80us 2.5kS/s 1.25kHz
During X magnifier mode the record length is still 2048 byte. The CRT displays a tenth of the recording (20 byte/division) plus 180 byte/div calculated in linear interpolation operation by a RISC processor. The smallest available time coefficient then is 5Ons/div instead of 500ns/div without the X magnifier.
Maximum signal frequency in storage mode
The highest capturable signal frequency cannot be exactly defined, since it depends to a large extent on the waveform.
With the start of each recording, the signal voltage at the input(s) of the analog-to-digital converters is briefly measured (sampled), converted to an 8-bit value and written to an address in RAM. The next sampled value is converted in the same way, but stored at the next RAM address.
The maximum sampling rate is 200MS/s. This yields a sampling interval of 5ns. Assuming that 10 measurements (samples) per signal period are sufficient for a sinewave signal, the maximum frequency to be captured is 2OMHz (50ns per perioa).
Alias signal display
If, due to the time base setting, the sampling rate is too low, the display of an alias signal may occur. For example: A sinewave signal may be sampled only once per period. If the
Subject to change without notice
sinewave signal frequency is accidentally in phase with the sampling frequency and each sample is taken at the positive peak value, a straight line is displayed in this position.
Alias signal display may also occur in the form of an apparent untriggered waveform display of different frequency from the true signal. Another aliasing condition is the display of signals seeming to be amplitude modulated.
The easiest way to recognize alias signals is to switch to analog mode, where the true waveform is displayed. Transfer from analog to store mode without changing time base range must produce the same frequency display.
Operating modes of the vertical amplifiers
In principle, the instrument can operate in digital storage mode with the same operating modes as in analog mode. Thus, the following can be displayed:
¢ Channel | by itself © Channel || by itself Channel | and II simultaneously
e¢ The sum or difference of both channels e XY mode
Storage mode differs from analog operation of the scope in the following respects:
e In DUAL mode (for simultaneous display of both channels), both input signals are also simultaneously captured, since each channel has its own A/D converter. In contrast to analog mode therefore, itis not necessary to switch between chopped and alternating mode.
e Because of the high display rate (approx. 80Hz) of the screen, no flicker can occur.
e The storage time base is also active in XY storage mode.
Test Instructions
General
These Test Instructions are intended as an aid for checking the most important characteristics of the instrument at regular intervals without the need for expensive test equipment. Resulting corrections and readjustments inside the instrument, indicated by the following tests, are described in the “Service Manual”. They should only be undertaken by qualified personnel.
A chargeable “Service Manual” is availabie from HAMEG. The “Service Manual” describes the complete adjustment of the instrument in English language and contains the circuit diagrams as well as the component locations.
As with the First Time Operation instructions, care should be taken that all variable functions are set to their calibrated positions. This is the case if AUTO SET had been pressed. it is recommended to switch on the instrument for about 20 minutes prior to the commencement of any check.
Cathode Ray Tube: Brightness and Focus, | Linearity, Raster Distortion
Normally, the CRT of the instrument has very good brightness. Any reduction of this brightness can only be judged visually. Decreased brightness may be the result of reduced high voltage. In this case the sensitivity of the vertical amplifiers is significantly increased .

Test instructions
The control range for maximum and minimum brightness (intensity) must be such that the beam just disappears before reaching the left hand stop of the INTENS. control (particularly when in XY mode), while with the control at the right hand stop the focus and the line width are just acceptable.
With maximum intensity the time base fly-back must on no account be visible. Visible trace fault without input signal:
® bright dot on the left side or decreasing ® brightness from left to right or shortening of the baseline.
(Cause: Incorrect Unblanking Pulse.) It should be noted that with wide variations in brightness, refocusing is always necessary. Moreover, with maximum brightness, no “pumping” of the display must occur. If pumping does occur, it is normally due to a fault in the regulation circuitry for the high voltage supply. The presetting pots for the high voltage circuit, minimum and maximum intensity, are only accessible inside the instrument.
A certain out-of-focus condition in the edge zone of the screen must be accepted. It is limited by standards of the CRT manufacturer. The same is valid for tolerances of the orthogonality, the undeflected spot position, the non-linearity and the raster distortion in the marginal zone of the screen in accordance with international standards (see CRT data book). These limit values are strictly supervised by HAMEG. The selection of a cathode-ray tube without any tolerances is practically impossible.
Astigmatism Check
Check whether the horizontal and vertical sharpness of the display are equal. This is best seen by displaying a square-wave signal with the repetition rate of approximately 1MHz. Focus the horizontal tops of the square-wave signal at normal intensity, then check the sharpness of the vertical edges. If it is possible to improve this vertical sharpness by turning the FOCUS control, then an adjustment of the astigmatism control is necessary. A potentiometer of 47kQ is provided inside the instrument for the correction of astigmatism. A certain loss of marginal sharpness of the CRT is unavoidable; this is due to the manufacturing process of the CRT.
Symmetry and Drift of the Vertical Amplifier
Both of these characteristics are substantially determined by the input stages of the amplifiers.
The symmetry of both channels and the vertical final amplifier can be checked by inverting Channel | and I! (depress the corresponding INV pushbutton). The vertical position of the trace should not change by more than 0.5div. However, a change of ‘div is just permissible. Larger deviations indicate that changes have occurred in the amplifier. A further check of the vertical amplifier symmetry is possibie by checking the control range of the Y-POS. controls. A sine-wave signal of 10- 100kHz is applied to the amplifier input. When the Y-POS. control is then turned fully in both directions from stop to stop with a display height of approximately 8div, the upper and lower positions of the trace that are visible should be approximately of the same height. Differences of up to tdiv are permissible (input coupling should be set to AC).
Checking the drift is relatively simple. 20minutes after switching on the instrument, set the baseline exactly on the horizontal center line of the graticule. The beam position must not change by more than 0.5div during the following hour.
Calibration of the Vertical Amplifier
A square-wave voltage of 0.2Vpp +1% is present at the output socket of the calibrator (CAL.) If a direct connection is made between the 0.2V output and the input of the vertical amplifier (e.g. using a x1 probe), the displayed signal in the 50mV/div position (variable control to CAL.) should be 4div high (DC input coupling).
Maximum deviations of 0.12div (3%) are permissible. if a x10 probe (1%) is connected between the 0.2V output and Y input, the deflection coefficient should be set to 5mV/div. Then the maximum deviation is 0.16div.
With higher tolerances it should first be investigated whether the cause lies, within the amplifier or in the amplitude of the square-wave signa!. On occasions it is possible that the probe is faulty or incorrectly compensated. If necessary the measuring amplifier can be calibrated with an accurately known DC voltage (DC input coupling). The trace position should then vary in accordance with the deflection coefficient set. With variable control in the attenuator sector fully counter-clockwise, the input sensitivity is decreased at least by the factor 2.5 in each position. In the 50mV/div position, the displayed calibrator signal height should vary from 4div to at least 1.6div.
Transmission Performance of the Vertical Amplifier
The transient response and the delay distortion correction can only be checked with the aid of a square-wave generator with a fast risetime (max. 5ns). The signal coaxial cable (e.g. HZ34) must be terminated at the vertical input of the oscilloscope with a resistor equa! to the characteristic impedance of the cable (e.g. with HZ22). Checks should be made at 100Hz, 1kHz,
10kHz, 100kHz and 1MHz, the defiection coefficient should be set at 5mV/div with DC input coupling. In so doing, the square pulses must have a flat top without ramp-off, spikes and glitches; no overshoot is permitted, especially at 1MHz and a display height of 4-5div. At the same time, the leading top corner of the pulse must not be rounded. In general, no great changes occur after the instrument has left the factory, and it is left to the operators discretion whether this test is undertaken or not. A suited generator for this test is HZ60 from HAMEG.
Of course, the quality of the transmission performance is not only dependent on the vertical amplifier. The input attenuators, located in the front of the amplifier, are frequency-compensated in each position. Even small capacitive changes can reduce the transmission performance. Faults of this kind are as a rule most easily detected with a square-wave signal with a low repetition rate (e.g. 1kHz). If a suitable generator with max. output of 4OVpp is available, it is advisable to check at regular intervals the deflection coefficients on all positions of the input attenuators and readjust them as necessary. A compensated 2:1 series attenuator is also necessary, and this must be matched to the input impedance of the oscilloscope. This attenuator can be made up locally. It is important that this attenuator is shielded. For local manufacture, the electrical components required are a 1MQ +1% resistor and, in parallel with it; a trimmer 3-15pF in parallel with approx. 10pF. One side of this parallel circuit is connected directly to the input connector of CH | or CH II and the other side is connected to the generator, if possible via a low-capacitance coaxial cable. The series attenuator must be matched to the input impedance of the oscilloscope in the 5mV/ div position (variable control to CAL., DC input coupling; square tops exactly horizontal; no ramp-off is permitted). This is achieved by adjusting the trimmer located in the 2:1 attenuator. The shape of the square-wave should then be the same in each input attenuator position.
ae Subject to change without notice 36 ia a ee ee eee

Test Instructions
Modes: CH.I/II, DUAL, ADD, VERT and X-Y Operation
echoes a CHOP., |
In DUAL mode two traces must appear immediately. On actuation of the Y-POS. controls, the trace positions should have minimal effect on each other. Nevertheless, this cannot be entirely avoided, even in fully serviceable instruments. When one trace is shifted vertically across the entire screen, the position of the other trace must not vary by more than 0.5mm.
A criterion in chopped operation is trace widening and shadowing around and within the two traces in the upper or lower region of the screen. Set time coefficient to 0.5ms/div, set input coupling of both channels to GD and advance the INTENS. control fully clockwise. Adjust FOCUS for a sharp display. With the Y-POS. controls shift one of the traces to a +2div, the other to a -2div vertical position from the horizontal center line of the graticule.
Do not try to synchronize (with the time variable con- trol) the chop frequency (0.5MHz)!
Check for negligible trace widening and periodic shadowing when switching between 0.5ms/div and 0.2ms/div.
It is important to note that in the I+!! add mode or the I-ll difference mode the vertical position of the trace can be adjusted by using both the Channel | and Channel Il Y-POS. controls.
In X-Y Operation, the sensitivity in both deflection directions will be the same. When the signal from the built-in square-wave generator is applied to the input of Channel Il, then, as with Channel | in the vertical direction, there must be a horizontal deflection of 4div when the deflection coefficient is set to 5O0mV/div position. The check of the mono channel display is unnecessary; it is contained indirectly in the tests above stated.
Triggering Checks
The internal trigger threshold is important as it determines the display height from which a signal will be stably displayed. It should be approx. 0.3-0.5div for the instrument. An increased trigger sensitivity creates the risk of response to the noise level in the trigger circuit. This can produce double-triggering with two out-of-phase traces.
Alteration of the trigger threshold is not required.
Checks can be made with any sine-wave voltage between 50Hz and 1MHz. The instrument should be in automatic peak (value) triggering (NM LED dark) and the LEVEL knob in midrange position. It should be ascertained whether the same trigger sensitivity is also present with Normal Triggering (NM LED lights). In this trigger mode, TRIG. LEVEL adjustment is absolutely necessary. The checks should show the same trigger threshold with the same frequency. On changing the trigger slope, the start of the sweep changes from the positive-going to the negative-going edge of the trigger signal.
As described in the Operating Instructions, the trigger frequency range is dependent on the trigger coupling selected. For lower frequencies the LF coupling mode can be selected. In this mode, triggering up to at ieast 1.5kHz (sine-wave) is possible. Internally the instrument should trigger perfectly at a display height of approx. 0.5div, when the appropriate trigger coupling mode is set.
For external triggering, the external trigger input connector requires a signal voltage of at least 0.3Vpp, which is in
Subject to change without notice
synchronism with the Y input signal. The voltage value is dependent on the frequency and the trigger coupling mode (AC-DC-HF-NR-LF).
Checking of the TV triggering is possible with a video signal of any given polarity.
Use the TV-L or TV-F setting for video sync pulse separation. The correct slope of the sync pulse (front edge) must be selected and a suitable time coefficient setting must be chosen. The slope is then valid for both sync frequencies.
Perfect TV triggering is achieved, when in both display modes the amplitude of the complete TV signal (from white level to the top of the line sync pulse) is limited between 0.8 and Gdiv and sync pulses of more then 0.5 div height. The display should not shift horizontally during a change of the trigger coupling from AC to DC when displaying a sine-wave signal without DC offset.
If both vertical inputs are AC coupled to the same signal and both traces are brought to coincide exactly on the screen, when working in the alternate dual channel mode, then no change in display should be noticeable, when switching from TRIG | to TRIG Il or when the trigger coupling is changed from AC to DC. Checking of the line/mains frequency triggering (50-60Hz) is possible, when the input signal is time-related (multiple or submultiple) to the power line frequency ( ~ LED lights). There is no trigger threshold visible in this trigger mode. Even very small input signals are triggered stably (e.g. ripple voltage). For this check, use an input of approx. 1V. The displayed signal height can then be varied by turning the respective input attenuator switch and its variable control.
Time base
Before checking the time base it should be ascertained that the trace length is approx. 1 Odiv in all time ranges. The X-MAG. x10 LED should not light. This condition should be maintained until the variation ranges of these controls are checked. Check that the sweep runs from the left to the right side of the screen (TIME/DIV. setting to 100ms/div). This check is only necessary after changing the cathode-ray tube.
If a precise marker signal is not available for checking the Time base time coefficients, then an accurate sine-wave generator
may be used. Its frequency tolerance should not be greater than 0.1%. The time base accuracy of the instrument is given as +3%, but it is considerably better than this. For the
simultaneous checking of time base linearity and accuracy at least 10 oscillations, i.e. 1 cycle every div, should always be displayed. For precise determination, set the peak of the first marker or cycle peak exactly behind the first vertical graticule line using the X-POS. control. Deviation tendencies can be noted after some of the marker or cycle peaks. If a precise Time Mark Generator is used for checking, Normal Triggering and LEVEL control adjustment is recommended.
The signal frequency required for each time coefficient setting can be determined easily by the aid of the readout. In time measurement condition the distance of the vertical cursor lines must be set to exactly 1 div. Then both readout information regarding the time deflection coefficient and the time difference show exactly the same value. After switching over from time to frequency measurement, the readout displays the required signal frequency in each time base setting.
Hold Off time
The variation of the hold off time setting can not be measured without opening the instrument. However, a visual check can

Service Instructions
be made if the instrument is operated in A time base mode. Without an input signal, set time base to 50ns/div, use automatic peak (value) triggering. With minimum hold off time the trace should be bright. It should noticeably darken if the hold off time is increased to the maximum.
Component Tester
After selecting component tester mode, a horizontal straight line should appear immediately, when the test leads are not connected (open circuit). The length of this trace should be approx. 8div. With the test leads shorted together, a vertical straight line with approx. 6div height should be displayed. The above stated measurements have some tolerances.
Trace Alignment
The CRT has an admissible angular deviation +5° between the X deflection plane D1-D2 and the horizontal center line of the internal graticule. This deviation, due to tube production tolerances (and only important after changing the CRT), and also the influence of the earth’s magnetic field, which is dependent on the instruments North orientation, are corrected
by means of the TR potentiometer.
In general, the trace rotation range is asymmetric. It should be checked, whether the baseline can be adjusted somewhat sloping to both sides round about the horizonta! center line of the graticule. With the instrument in its closed case, an angle of rotation +0.57° (0.1div difference in elevation per 10div graticule length) is sufficient for the compensation of the earth’s magnetic field.
Service Instructions
General
The following instructions are intended as an aid for the electronic technician, who is carrying out readjustments on the instrument, if the nominal values do not meet the
specifications. These instructions primarily refer to those faults, which were found after using the Test Instructions. However, this work should only be carried out by properly qualified personnel. For any further technical information call or write to HAMEG. Addresses are provided at the back of the manual. It is recommended to use only the original packing material, should the instrument be shipped to for service or repair (see also Warranty).
Instrument Case Removal
The rear cover can be taken off after unplugging the power cords triple-contact connector and after two nuts have been removed. If a cross recessed pan head screw is present on the bottom of the instrument, it must be removed too. While the instrument case is firmly held, the entire chassis with its front panel can withdrawn forward. When the chassis is inserted into the case later on, it should be noticed that the case has to fit under the flange of the front panel. The same applies for the rear of the case, on which the rear cover is put.
AN Caution | During opening or closing of the case, the instrument must be disconnected from all power sources for maintenance work or a change. of parts or: compo- nents: If a measurement, trouble-shooting, or an adjustment is unavoidable, this work must be done by a specialist, who is familiar with the risk involved.
When the instrument is set into operation after the case has been removed, attention must be paid to the acceleration
38
voltage for the CRT -2025V and +12kV and to the operating voltages for both final amplifier stages 115V and 65V. Poten- tials of these voltages are on the PS-Board, the CRT-PCB and on the main PCB. They are highly dangerous and therefore precautions must be taken. It should be noted furthermore that shorts occurring on different points of the CRT high voltage and unblanking circuitry will definitely damage some semiconductors. For the same reason it is very risky to connect capacitors to these points while the instrument is on.
Capacitors in the instrument may still be charged, even when the instrument is disconnected from all voltage sources. Normally, the capacitors are discharged approx. 6 seconds after switching off. However, with a defective instrument an interruption of the load is not impossible. Therefore, after switching off, it is recommended to connect one by one all terminals across 1kQ to ground (chassis) for a period of 1
second.
aN Caution Special care must be taken if the high vonage con- nector has to be removed from the anode contact of the CRT. After disconnection, both the:+ 12kV high. voltage line and the anode contact of the: CRT. both must be discharged through a 10kG resistor to ground (chassis). .
Handling of the CRT needs utmost caution. The ise bulb must not be allowed under any circumstances to come into contact with hardened tools, nor should it undergo local superheating (e.g. by soldering iron) or local undercooling (e.g. by cryogenic-spray). We recommend the wearing of safety goggles (implosion danger).
If any work has been carried out, the complete instrument (with case closed and POWER pushbutton depressed) must undergo a safety test, including a voltage test with 2200V DC, between accessible parts to both mains/line supply terminals.
This test is dangerous and requires an adequately trained specialist. The maximum impedance between each accessible metallic part and the safety earth connector at the 3-pole power connector must be less than 0.1Q.
Operating Voltages
Ail operating voltages ( +12V, -6V, -13.5, +115V, +65V, -2025V) are stabilized by the switch mode power supply. The +12V supply is further stabilized and used as a reference voltage for -6V stabilization. These different operating voltages are fixed voltages, except the +12V, which can be adjusted. The variation of the fixed voltages greater than 5% from the nominal value indicates a fault.
Measurements of the high voltage may only be accomplished by the use of a sufficient highly resistive voltmeter (>10MQ). You must make absolutely sure that the electric strength of the voltmeter is sufficiently high. It is recommended to check the ripple and also the interaction from other possible sources. Excessive values might be very often the reason for incomprehensible faults.
Maximum and Minimum Brightness
A variable resistors (100kQ), located on the CRT PCB, is used for this adjustment procedure. It may only be touched by a properly insulating screwdriver (Caution! High voltagel). Correct adjustment is achieved, when the trace can be blanked in XY mode and, in addition, when the requirement described
in the Test Instructions are met.
Subject to change without notice

Service Instructions RS 232 Interface
Astigmatism control
The ratio of vertical and horizontal sharpness can be adjusted by the variable resistor of 47kQ, located on the CRT PCB. As a precaution however, the voltage for the vertical deflecting plates (approx. +42V when the trace is in center position) should firstly be checked, because this voltage will affect the astigmastism correction. While the adjustment is being carried out (with medium brightness and a 1 MHz square-wave signal), the upper horizontal square-wave tops are firstly focussed with the FOCUS control. Then the sharpness of the vertical lines are corrected with the 47kQ Astigm. pot. The correction should be repeated several times in this sequence.
The adjustment is optimized, when the FOCUS knob exclusively brings no improvement of the sharpness in both directions.
Trigger Threshold
The internal trigger threshold should be in the range 0.3 to 0.5div display height.
Trouble-Shooting the Instrument
For this job, at least an isolating variable mains/line transformer (protection class Il), a signal generator, an adequate precise multimeter, and, if possible, an oscilloscope are needed. This last item is required for complex faults, which can be traced by the display of signa! or ripple voltages. As noted before, the regulated high voltage and the supply voltages for the final stages are highly dangerous. Therefore it is recommended to use totally insulated extended probe tips, when trouble-shooting the instrument. Accidental contact with dangerous voltage potentials is then unlikely. Of course, these instructions cannot thoroughly cover all kinds of faults. Some common-sense will certainly be required, when a complex fault has to be investigated.
If trouble is suspected, visually inspect the instrument thoroughly after removal of the case. Look for loose or badly contacted or discolored components (caused by overheating). Check to see that all circuit board connections are making good contact and are not shorting to an adjacent circuit. Especially inspect the connections between the PCBs. This visual inspection can lead to success much more quickly than a systematic fault location using measuring instruments. Prior to any extensive trouble-shooting, also check the external power source.
lf the instrument fails completely, the first and important step - after checking the power fuses - will be to measure the deflecting plate voltages of the CRT. In almost any case, the faulty section can be located. The sections represent:
2. Horizontal deflection. 4. Power supply.
1. Vertical defiection. 3. CRT circuit.
While the measurement takes place, the position controls of both deflection devices must be in mid-position. When the deflection devices are operating properly, the separate voltages of each plate pair are almost equal then (Y approx. 42V and X approx GOV). If the separate voltages of a plate pair are very different, the associated circuit must be faulty. An absent trace in spite of correct plate voltages means a fault in the CRT circuit. Missing deflection plate voltages is probably caused by a defect in the power supply.
Adjustments
As advised in the Operating, Test and Service Instructions, small corrections and adjustments are easily carried out with the aid of the “Service Manual”.
Subject to change without notice
However, a complete recalibration of the scope should not be attempted by an inexperienced operator, but only someone with sufficient expertise. Several precision measuring instruments with cables and adapters are required, and only then should the pots and trimmers be readjusted, provided that the result of each adjustment can be exactly determined. Thus for each operating mode and switch position, a signal with the appropriate sine or square waveform, frequency, amplitude, risetime and duty cycle is required.
As describedin the “Menu” section, the instrument's software contains the submenu “CALIBRATE”. The following items can be used by operators not equipped with precision instruments.
After the required warm-up time of 20 minutes, first the instrument must be switched off and on again with the AUTO SET pushbutton pressed constantly until the main menu becomes visible. In the “CALIBRATE” submenu three items can be chosen:
1: Y AMP (amplifier channel | and II) 2: TRIGGER AMP (trigger amplifier channel | and I!) 3: STORE AMP (digital section)
AN Attention! During the automatic adjustment Procedire no signal may be applied on any input.
Each item is called by pressing the CURSOR ON/OFF pushbutton. Then the instrument automatically adjusts and stores the adjustment values. In case of the Y amplifiers these are the field effect transistor’s operating points, the invert and the variable gain balance. For the trigger amplifier itis regarding the DC operating points and the trigger threshold. In storage mode the adaptation of the storage display to the analog
display.
The new adjustment values are always present after the instrument is switched on. Therefore it is not required to overwrite the factory adjustment by calling the OVERWRITE FACTORY DEFAULT function in the SETUP menu.
Note! The automatic adjustment should only be made if the instrument’s warm up time has passed and no faults such as incorrect operating voltages are present. During the automatic adjustment procedures the readout indicates “Working”.
RS232 Interface - Remote Control
Safety
A Caution: : All terminals of the S232 interface are galvanically connected with the oscilloscope and subsequently with protective (safety) earth potential.
Measurement on a high level reference potential is not permitted and endangers operator, oscilloscope, interface and peripheral devices.
In case of disregard of the safety warnings contained in this manual, HAMEG refuses any liability regarding personal injury and/or damage of equipment.
Operation
The oscilloscope is supplied with a serial interface for control purposes. The interface connector (9 pole D- SUB female) is . located on the rear of the instrument. Via this bidirectional port,
39

RS 232 Interface
the instrument parameter settings and (in storage mode) signal data, can be transmitted to, or received from a PC. The maximum connecting cable length must not exceed 3 meters and must contain 9 lines connected 1:1. The pin connection of the RS232 interface (9 pole D-SUB female) is determined as follows:
Pin Tx data (data from oscilloscope to external device) Rx data (data from external device to oscilloscope) CTS (clear to send) RTS (request to send) Ground (reference potential - connected via the oscilloscope’s power cord with protective earth) +5V supply voltage for external devices (max. 400mA) wo can why
The maximum voltage swing at pin 2, 3, 7 and 8 is + 12 volt. The RS232 parameter are: N-8-2 (no parity bit, 8 data bits, 2 stop bits,
RTS/CTS hardware protocol).
Baud-Rate Setting
After the first POWER UP (switching on of the oscilloscope ) and the first command SPACE CR (20hex, ODhex) sent from the PC, the baud rate is recognized and set automatically between 110 baud and 19200 baud. The oscilloscope is then switched over to REMOTE control mode. The oscilloscope then transmits the RETURNCODE: 0 CR LF to the PC. In this status all settings (with the exception of those functions mentioned under “Controls and Readout”) can be controlled via the interface only.
Front Panel HM1507-2
A:500ms B:200ps TR:CHISAC DIr:iDdCc )
CHi:=100mvV CH2 i-100mv CHP At:100ns
40
The only ways to quit this status are:
* Switching the oscilloscope off, transmitting the command
* RM= 0 from the PC to the oscilloscope, or ¢ depressing the AUTO SET ( LOCAL ) pushbutton,
if in unlocked condition (command LK=1... was not sent)
After the remote state has been switched off the RM -LED
(3) is dark.
Please note: A minimum time must elapse between the commands RM-=1... (remote on) and RM=0... (remote off) and vice
versa.
The time can be calculated with the formula:
tmin = 2x(1/baud rate) + 60ps.
If at the beginning no SPACE CR command is recognizable, the oscilloscope pulls the TxD line low for approx. 0.2ms and causes a break on the PC.
Data Communication
After successfully being set to remote contro! mode, the oscilloscope is prepared for command reception.
Disks with programming examples, a list of the instrument commands and the program SP107 (WINDOWS 3.x, 95 and NT 4.0) is supplied with the oscilloscope.
HM 1507
es
Subject to change without notice

Printed in Germany
HAMELS, Instruments
Oscilloscopes
Multimeters
Counters
Frequency
Synthesizers
Generators
R- and LC-
Meters
Spectrum
Analyzers
Power Supplies
Curve Tracers
Time Standards
Germany
HAMEG GmbH Kelsterbacher Str. 15-19 60528 FRANKFURT am Main Tel. (069) 67805 0 Telefax (069) 6780513
France
HAMEG S.a.r.l 5-9, av. de la République 94800-VILLEJUIF Tél. (1) 4677 8151 Telefax (1) 4726 3544
Spain
HAMEG S.L. Villarroel 172-174
08036 BARCELONA Teléf. 9 3430 1597 Telefax 93321 2201
Great Britain
HAMEG LTD 74-78 Collingdon Street LUTON Bedfordshire LU1 1RX Phone (01582)413174 Telefax (01582)456416
United States of America
HAMEG, Inc. 1939 Plaza Real OCEANSIDE, CA 92056 Phone’ (760) 630 4080 Telefax (760) 630 6507
HAMEG, Inc. 266 East Meadow Avenue EAST MEADOW, NY 11554 Phone (516) 794 4080 Toll-free (800) 247 1241 Telefax (516) 794 1855
Hongkong
HAMEG LTD Room 204-5, Fook Hong Ind. Blidg., 19 Sheung Yuet Road, Kowloon Bay, Hong Kong Phone (852) 2 793 0218 Telefax (852) 2 763 5236


![Hameg Scpi v09 Commands en[1]](https://img.dokumen.tips/doc/110x75/54ffea924a79598f128b4cd3/hameg-scpi-v09-commands-en1.jpg)