Embed Size (px)
Citation preview
SERIES OF ICES SURVEY PROTOCOLS
SISP 10-IBTS IX
Manual for the International Bottom Trawl Surveys
Revision IX
The International Bottom Trawl Survey Working Group

International Council for the Exploration of the Sea
Conseil International pour l’Exploration de la Mer
H. C. Andersens Boulevard 44–46
DK‐1553 Copenhagen V
Denmark
Telephone (+45) 33 38 67 00
Telefax (+45) 33 93 42 15
www.ices.dk
Recommended format for purposes of citation:
ICES. 2015. Manual for the International Bottom Trawl Surveys. Series of ICES
Survey Protocols SISP 10 ‐ IBTS IX. 86 pp.
The material in this report may be reused for non‐commercial purposes using the
recommended citation. ICES may only grant usage rights of information, data,
images, graphs, etc. of which it has ownership. For other third‐party material cited in
this report, you must contact the original copyright holder for permission. For
citation of datasets or use of data to be included in other databases, please refer to the
latest ICES data policy on the ICES website. All extracts must be acknowledged. For
other reproduction requests please contact the General Secretary.
The document is a report of an Expert Group under the auspices of the International
Council for the Exploration of the Sea and does not necessarily represent the views of
the Council.
ISBN 978‐87‐7482‐170‐0
ISSN 2304‐6252
© 2015 International Council for the Exploration of the Sea

Series of ICES Survey Protocols SISP 10 - IBTS IX | i
Contents
1 Introduction .................................................................................................................... 1
2 IBTS survey ..................................................................................................................... 3
2.1 Current objectives ................................................................................................. 3
2.2 Survey design ........................................................................................................ 3
2.3 GOV‐trawl construction and rigging ................................................................. 5
2.4 Gear quality control ............................................................................................ 12
2.4.1 Before and during the survey ............................................................... 12
2.4.2 Quality control during the survey ....................................................... 14
2.4.3 Quality control after a survey .............................................................. 15
2.5 Standard fishing method ................................................................................... 21
2.6 Monitoring net geometry ................................................................................... 22
2.7 Fishing positions ................................................................................................. 25
3 Sampling of GOV‐trawl catches ............................................................................... 26
3.1 Catch sorting and sampling .............................................................................. 26
3.2 Length composition ............................................................................................ 28
3.3 Sampling for age, sex, and maturity ................................................................ 30
3.4 Measurement types for invertebrates .............................................................. 31
3.5 Measurement types for deep‐water species .................................................... 33
3.5.1 Smoothheads and Searsids (Alepocephalidae and Searsidae) .............. 34
3.5.2 Grenadiers (Macrouridae) ...................................................................... 34
3.5.3 Chimaeridae (Rabbitfish) ...................................................................... 35
3.6 Collection of marine litter from trawl .............................................................. 35
4 MIK net .......................................................................................................................... 36
4.1 Q1 sampling ........................................................................................................ 36
5 Environmental data ..................................................................................................... 36
6 Exchange specifications for IBTS data ..................................................................... 37
7 References ..................................................................................................................... 43
Annex 1: Current rectangle allocation between nations ............................................... 44
Annex 2: History of the IBTSWG survey and manual .................................................. 59
Annex 3: IBTS standard gear check sheet 1 ..................................................................... 69
Annex 4: IBTS standard gear check sheet 2 ..................................................................... 70
Annex 5: IBTS standard gear check sheet 3 ..................................................................... 71
Annex 6a: IBTS standard gear check sheet 4 – Groundgear A ..................................... 72
Annex 6b: IBTS standard gear check sheet 4 – Groundgear B ..................................... 73

ii Series of ICES Survey Protocols SISP 10 - IBTS IX
Annex 7: Summary of catch processing per nation during North Sea Q1 IBTS
......................................................................................................................................... 74
Annex 8: Summary of catch processing per nation during North Sea Q3 IBTS
......................................................................................................................................... 75
Annex 9: Finfish (flatfish and roundfish) maturity key ................................................ 76
Annex 10: Four stage maturity key for skates and rays (Rajidae) ............................... 79
Annex 11: Data sheet for collection of marine litter ...................................................... 80
Annex 12: Haul information ............................................................................................... 82
Annex 13: Length frequency information ........................................................................ 84
Annex 14: Smalk ................................................................................................................... 85
Annex 15: Area type codes: Sampling areas and standard areas for the
calculation of abundance indices .............................................................................. 86
Annex 16: Length splits used to provide preliminary numbers‐at‐age ...................... 86
Series of ICES Survey Protocols SISP 10 - IBTS IX | 1
1 Introduction
Overview of the survey
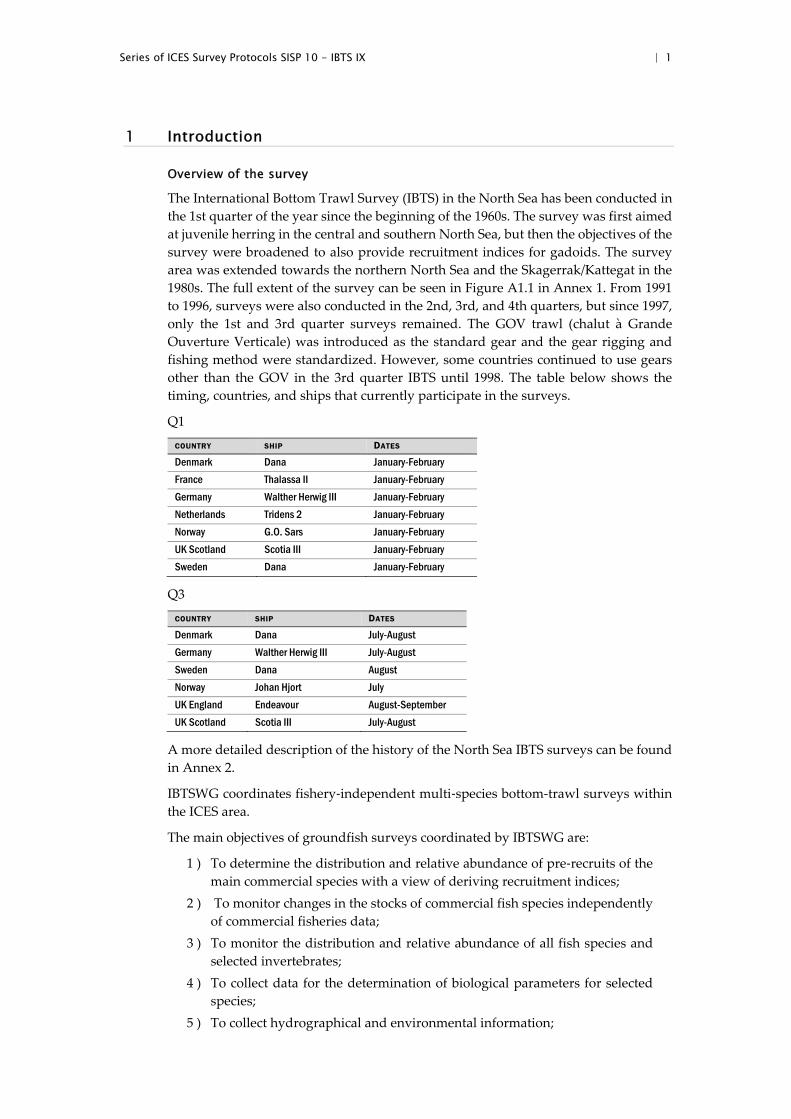
The International Bottom Trawl Survey (IBTS) in the North Sea has been conducted in
the 1st quarter of the year since the beginning of the 1960s. The survey was first aimed
at juvenile herring in the central and southern North Sea, but then the objectives of the
survey were broadened to also provide recruitment indices for gadoids. The survey
area was extended towards the northern North Sea and the Skagerrak/Kattegat in the
1980s. The full extent of the survey can be seen in Figure A1.1 in Annex 1. From 1991
to 1996, surveys were also conducted in the 2nd, 3rd, and 4th quarters, but since 1997,
only the 1st and 3rd quarter surveys remained. The GOV trawl (chalut à Grande
Ouverture Verticale) was introduced as the standard gear and the gear rigging and
fishing method were standardized. However, some countries continued to use gears
other than the GOV in the 3rd quarter IBTS until 1998. The table below shows the
timing, countries, and ships that currently participate in the surveys.
Q1
COUNTRY SHIP DATES
Denmark Dana January-February
France Thalassa II January-February
Germany Walther Herwig III January-February
Netherlands Tridens 2 January-February
Norway G.O. Sars January-February
UK Scotland Scotia III January-February
Sweden Dana January-February
Q3
COUNTRY SHIP DATES
Denmark Dana July-August
Germany Walther Herwig III July-August
Sweden Dana August
Norway Johan Hjort July
UK England Endeavour August-September
UK Scotland Scotia III July-August
A more detailed description of the history of the North Sea IBTS surveys can be found
in Annex 2.
IBTSWG coordinates fishery‐independent multi‐species bottom‐trawl surveys within
the ICES area.
The main objectives of groundfish surveys coordinated by IBTSWG are:
1 ) To determine the distribution and relative abundance of pre‐recruits of the main commercial species with a view of deriving recruitment indices;
2 ) To monitor changes in the stocks of commercial fish species independently
of commercial fisheries data;
3 ) To monitor the distribution and relative abundance of all fish species and
selected invertebrates;
4 ) To collect data for the determination of biological parameters for selected
species;
5 ) To collect hydrographical and environmental information;
2 Series of ICES Survey Protocols SISP 10 - IBTS IX
6 ) To determine the abundance and distribution of late herring larvae
(February North Sea survey).
For a survey to be considered to be coordinated under IBTSWG, it must fulfil the
following criteria:
1 ) Be carried out within the ICES areas: IIIa, IV–IX;
2 ) An ICES assessment working group provides a brief outline of the
management need/context for the survey;
3 ) Be an otter trawl survey, but note that there may be other working groups
better placed to coordinate some bottom‐trawl surveys;
4 ) Have appropriate survey sampling methods and protocols (including gear
descriptions) that conform to the standards encouraged by the IBTSWG or
that can be improved after joining the IBTSWG;
5 ) Aims to enhance existing IBTS surveys and improve data collection for
important stocks. For example, proposed surveys for inclusion within
IBTSWG will (i) overlap and extend existing survey areas using a
comparable gear, or (ii) operate on more specific grounds/times of year with
a gear more appropriate to the target species;
6 ) Store data in the DATRAS database and participate in data quality checking;
7 ) Nations must attend and present data at the annual meetings of IBTSWG;
8 ) For those surveys that do not use a gear that is the standard for IBTS surveys, confirmation must be given from assessment working groups (e.g. after a
five year period) that these surveys are still providing data of high quality
that are used for assessment and provision of advice.
Use of the data
Annual abundance indices (in numbers per hour) by species and age group are
routinely calculated in DATRAS by first averaging catch by age within rectangles and
then averaging over species‐specific standard areas, typically without weighting by
sampling effort or adjustment for unsampled subareas in a given year or quarter.
Weighting factors for the surface area of statistical rectangles at water depths between
10 m and 200 m are only applied for herring, sprat, and saithe.

Series of ICES Survey Protocols SISP 10 - IBTS IX | 3
2 IBTS survey
2.1 Current objectives The International Bottom Trawl Survey Working Group (IBTSWG) coordinates
fishery‐independent multi‐species bottom‐trawl surveys within the ICES area,
including a number of additional surveys in the Northeastern Atlantic. These surveys
aim to provide ICES assessment and science groups with consistent and standardized
data for examining spatial and temporal changes in (a) the distribution and relative
abundance of fish and fish assemblages; and (b) of the biological parameters of
commercial fish species for stock assessment purposes.
In terms of groundfish surveys coordinated by IBTS, the main objectives are to:
1 ) To determine the distribution and relative abundance of pre‐recruits of the main commercial species with a view of deriving recruitment indices;
2 ) To monitor changes in the stocks of commercial fish species independently
of commercial fisheries data;
3 ) To monitor the distribution and relative abundance of all fish species and
selected invertebrates;
4 ) To collect data for the determination of biological parameters for selected
species;
5 ) To collect hydrographical and environmental information;
6 ) To determine the abundance and distribution of late herring larvae
(February North Sea survey).
2.2 Survey design The stratification of the survey grid has always been based on ICES statistical
rectangles of roughly 30 x 30 nautical miles (1 degree longitude x 0.5 degree latitude).
These rectangles were convenient to use for stratification of the survey because they
were already being used for fisheries management purposes. Each rectangle is
typically sampled by two different countries, so that at least two hauls are taken per
rectangle. Only the Skagerrak and Kattegat is fished solely by Sweden, who sample
more than once in every rectangle. Other areas that are sampled by a single country
include west of Shetland during Q1 and Q3 (Scotland), and, during Q3, inshore areas
near Scotland (Scotland), the edge of the Norwegian Trench (Norway), inshore areas
near Denmark (Denmark), in the southern North Sea (Denmark, Germany, England);
France typically is the only country that surveys the western English Channel. Areas
are surveyed by a single country because of the large proportion of untrawlable area
(and subsequent gear damage issues experienced by other nations) or for efficient,
logistical purposes.
The allocation of rectangles to IBTS participants has changed slightly over the years.
The last major reallocation occurred in 1991, but since then, at least one vessel that has
routinely fished in that area has remained in every rectangle. The current rectangle
allocation for the quarter 1 survey is shown in Figures A1.1 to A1.8 in Annex 1, while
the quarter 3 allocation is shown in Figures A1.9 to A1.15.
The survey coordinator is responsible for the allocation of statistical rectangles to each
country. Coordination takes place annually at the IBTSWG and also immediately prior
to and during the surveys. The survey coordinator is also responsible for ensuring
4 Series of ICES Survey Protocols SISP 10 - IBTS IX
adequate coverage during the survey by liaising with the national coordinators/survey
cruise leaders.
Individual vessels survey for different durations due to various operational factors and
staff ‘rest’ issues; however, surveys are generally undertaken during late January to
late February for Q1 (target month February) and July/August for Q3 (target month
August), with overlap occurring between most nations.
The vessels are free to choose any position in the rectangles as long as the hauls are
separated by at least 10 nautical miles wherever this is possible. Tows in adjacent
rectangles are separated by at least 10 miles. Countries must avoid clustering their
stations between adjacent rectangles in order to reduce positive serial autocorrelation
and thereby maximize survey precision.
Trawl tow locations are selected by the cruise leader for each individual country. The
selection process is based on a semi‐random format with each survey having a series
of ‘clear’ (and in many circumstances previously visited) trawl sites. A list of
international clear tow positions exists, but experience has shown that the single
countries rely mostly on their own trawl tracks fished in previous surveys and tend to
fish on positions from the previous year. In the unusual event that no ‘clear’ tow exists,
the cruise leader may select to undertake a ‘blind’ tow on unknown ground after
checking the proposed trawl track for hazardous seabed obstructions with acoustic
methods. The cruise leader will select a site that allows the cruise to maximize
efficiency and secure as many trawl hauls in the ‘daylight’ period prescribed to the day
in question. This can result in a particular trawl site being the same one visited as in
the previous year or alternatively, one that has not been visited for some years.
However, some randomization of tow position within a rectangle is encouraged in
order to decrease bias. National coordinators/survey cruise leaders are encouraged to
utilize known trawl positions taken by other countries in previous years in order to
increase the number of available positions within a rectangle.
Fishing is limited to daylight hours, i.e. from 15 min before sunrise to 15 min after
sunset. Hauls that, for whatever reason, were not or will not be conducted during
daylight hours are to be marked as non‐standard in the DATRAS database.
Series of ICES Survey Protocols SISP 10 - IBTS IX | 5
2.3 GOV-trawl construction and rigging The construction of the 36/47 GOV‐trawl is shown in Figure 2.1. A set of check sheets
(Annex 3 to 6b) is to be used for each trawl to maintain a standard rigged GOV. All
dimensions of the GOV must be checked to ensure that it is rigged correctly on the
vessel. When a new net is delivered check sheets 1 (Annex 3) and 2 (Annex 4) are filled
in to ensure that the net is manufactured to the correct specification.
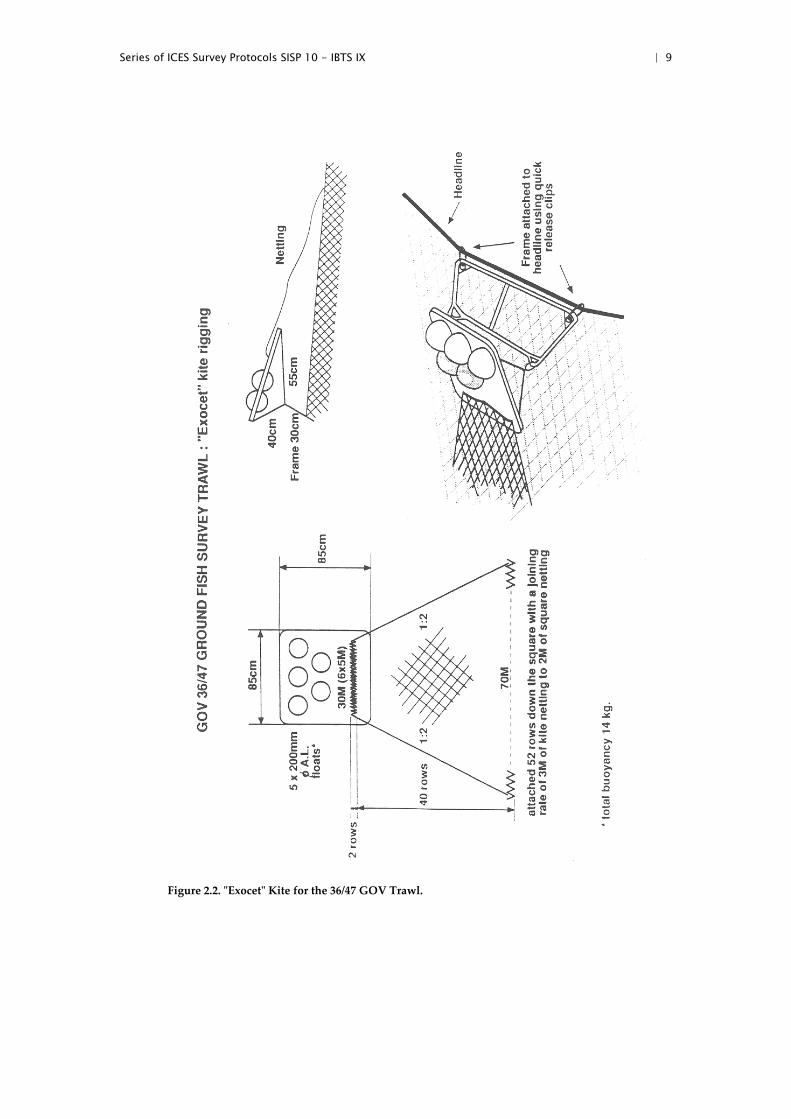
Details of the ʺExocetʺ kite and suggestions how to attach the kite to the trawl are
shown in Figure 2.2. Five floats with a buoyancy of 2.9 kg each are attached to the kite.
If a kite other than the recommended one is used, then the lift of this kite must be the
same as of the “Exocet” kite so that the configuration of the net conforms to expected
parameters. Figure 2.7 illustrates the expected headline height and door spread limits
for deployment depth.
Total buoyancy of the floats on the net is 172 kg. The floats should be spread evenly
over the wings and the square.
The rigging is given in Figure 2.3. On board the vessel, when attaching the trawl to the
bridles and doors, use check sheet 3 (Annex 5).
Historically during the first quarter survey, the length of the sweeps depended on the
bottom depth:
Sweeps including back‐strops and connectors of a total length of 60 m are
used in water depths less than 70 m,
Sweeps including back‐strops and connectors of a total length of 110m are
used in deeper waters.
However, not all countries in Q1 are carrying out these changes (Table 2.3.1).
The different sweep lengths in Q1 were kept for reasons of consistency over the time‐
series. The effect of the different sweep lengths was, however, doubted and therefore
not copied when the quarterly surveys started in 1991.In Q3, this change of sweep
lengths was never applied. In Q3, sweeps including back‐strops and connectors of a
total length of 60 m are used throughout the survey area, except by Norway in 2011–
2013.
The most important consideration is that the net geometry is within the acceptable
limits for the depth of water (see Section 2.6 on monitoring net geometry). Since this
has not always been achieved, in particular not when using the long sweeps, several
countries have stopped to change sweep length during the Q1 surveys.

6 Series of ICES Survey Protocols SISP 10 - IBTS IX
Table 2.3.1. Record of the historical change in sweep length during Q1 surveys (Yes = sweep lengths
have been altered; No = sweep lengths were constant length).
YEAR DENMARK ENGLAND FRANCE GERMANY NETHERLANDS NORWAY SCOTLAND SWEDEN
1985 yes yes yes yes yes no yes
1986 yes yes yes yes yes yes yes
1987 yes yes yes yes yes yes yes
1988 yes yes yes yes yes no yes
1989 yes yes yes yes yes no yes
1990 yes yes yes no yes no yes
1991 yes no yes yes yes yes yes
1992 yes no yes yes yes no yes
1993 yes no no no yes no yes
1994 yes no no no yes no yes
1995 yes no no no yes no yes
1996 yes no no no yes no yes
1997 yes no no no yes no yes
1998 yes no no no yes no yes
1999 yes no no no yes no yes
2000 yes no no no yes no yes
2001 yes no no no yes no yes
2002 yes no no no yes no yes
2003 yes no no no yes no yes
2004 yes no no yes no yes no yes
2005 yes no no yes no yes no yes
2006 yes x no yes no yes no yes
2007 yes x no yes no yes no yes
2008 yes x no yes no yes no yes
2009 yes x no yes no yes no yes
2010 yes x no yes no yes no yes
2011 yes x no yes no yes no no
2012 yes x no yes no yes no yes
2013 yes x no no no yes yes yes
2014 yes x no no no yes no yes
2015 no x no no no yes no yes
The standard groundrope with rubber discs (groundgear ‘A’) as shown in Figure 2.4 is
used throughout the survey area. However, since 1985, Scotland have used groundgear
‘B’ on all stations north of 57° 30’ North (Figure 2.5). Use check sheet (Annexes 6a and
6b) to ensure the groundgear is to specification. The extra weights in the groundrope
are 70 kg in the square, 35 kg in each quarter and 35 kg in each forward wing‐end.
These weights should be evenly spread over the appropriate length of groundrope and
this can be achieved by wrapping chain externally around the groundrope, using a
thicker centre chain, or by interspersing the groundrope rubber discs with steel discs
of the same diameter. Approximate weight in air is given for each section of the
groundgear.
Proper contact of the groundgear might be indicated by use of acoustic devices,
wearing on chains, and presence of benthic organisms and flatfish in the catch. The
contact of the groundgear with the bottom can be greatly influenced by changing the
length of the adjustment chain between the lower leg and the bumper bobbin. The
normal length of this chain is 2 metres but on rough ground it can be shortened to 1.7
Series of ICES Survey Protocols SISP 10 - IBTS IX | 7
metres; if the gear is fishing too light it can be lengthened to 2.2 metres. Shortening the
chain means the net sits lighter upon the bottom, but care must be taken to maintain
proper bottom contact throughout the tow duration.
For a proper performance of the net it is essential that the four upper bridles are of
identical length, and regular checks must be made to ensure this. A total check of the
trawl must be carried out prior to the survey. Technical drift has occurred and is
catalogued in the 2015 IBTSWG Report (see Section 9: Gear Standardization; Annex 9,
WD 3: ToR e – Gear Standardization – Net plans and gear components tables).
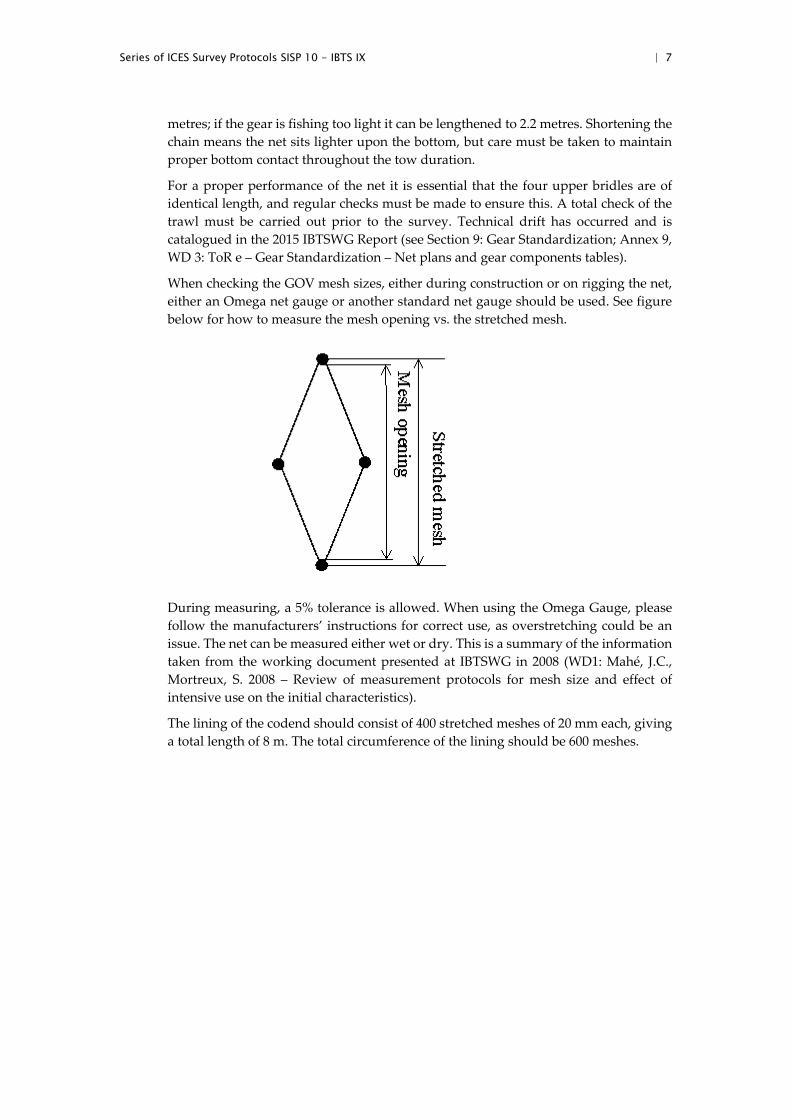
When checking the GOV mesh sizes, either during construction or on rigging the net,
either an Omega net gauge or another standard net gauge should be used. See figure
below for how to measure the mesh opening vs. the stretched mesh.
During measuring, a 5% tolerance is allowed. When using the Omega Gauge, please
follow the manufacturers’ instructions for correct use, as overstretching could be an
issue. The net can be measured either wet or dry. This is a summary of the information
taken from the working document presented at IBTSWG in 2008 (WD1: Mahé, J.C.,
Mortreux, S. 2008 – Review of measurement protocols for mesh size and effect of
intensive use on the initial characteristics).
The lining of the codend should consist of 400 stretched meshes of 20 mm each, giving
a total length of 8 m. The total circumference of the lining should be 600 meshes.

8 Series of ICES Survey Protocols SISP 10 - IBTS IX
Figure 2.1. Construction of the 36/47 GOV Trawl.
Series of ICES Survey Protocols SISP 10 - IBTS IX | 9
Figure 2.2. ʺExocetʺ Kite for the 36/47 GOV Trawl.
10 Series of ICES Survey Protocols SISP 10 - IBTS IX
Figure 2.3. Rigging of the 36/47 GOV Trawl.
Series of ICES Survey Protocols SISP 10 - IBTS IX | 11
Figure 2.4. Standard groundrope for the 36/47 GOV trawl groundgear ‘A’.
Figure 2.5. Groundrope for the 36/47 GOV trawl groundgear ‘B’.

12 Series of ICES Survey Protocols SISP 10 - IBTS IX
2.4 Gear quality control
2.4.1 Before and during the survey
The flow diagram can be used to describe the procedure for the preparation of the GOV
trawl prior to the survey and each haul (Figure 2.6).
The table below presents a short description for each country of the procedure for the
preparation of the gear before and during the survey.
PROCEDURE FOR THE PREPARATION OF THE GEAR BEFORE AND DURING THE SURVEY
Denmark Before the survey: Primary and spare trawls are visually inspected when taken onboard. A primary (with groundgear A) and a secondary trawl (with groundgear B or A) are checked for correct rigging when taken on the two net drums by the fishing master.
During the survey: Nets are checked and measured according the check sheets 1–3 if the correct door spread and vertical net opening cannot be achieved or after damages by the fishing master. The control sheets are given to scientist in charge.
England Before the survey: The primary net and a spare net are pulled out at the net store. The net manager along with the primary and secondary scientists in charge check the net using the specification sheets in Annex 3 to 6b of this manual
During the survey: The flow diagram in Figure 2.6 is followed. The damages and repairs are reported on the specification sheet, which is given to the scientist in charge at the end of the survey.
France Before the survey: The net, which has its own specification sheet, is prepared by the fishing master and checked in presence of the scientist in charge.
During the survey, the procedure is followed according to the flow diagram. The damages and repairs are reported on the specification sheet, which is given to the scientist in charge at the end of the survey. A copy is sent to the technologists team.
Germany Before the survey: The primary net and spare nets are transported aboard from the net store and prepared by the ship’s crew (netmaker) according to the IBTS manual. The chief scientist does not conduct a formal control, but a visual inspection of the rigged net on deck.
During the survey, small net damages are repaired directly after each haul; in the case of larger damages, the replacement net is rigged. No documentation is made of net damages, but the haul is marked invalid if the captain / chief scientist assume that the haul has been affected by the damage.
The Netherlands Before the survey: The primary net and a spare net are checked by the IMARES gear technician together with the crew on board following the specification sheets 3 and 4 of this manual.
During the survey: The crew rigs, controls, and repairs the net if necessary.
Norway Norway revised its procedures in 2015. Before the survey, primary and spare nets (4 in total) are pulled out at the net store. Primary nets are visually inspected by the trawl master and a gear technician, if present, on the vessel. The survey coordinator and gear technician ensure the trawl master has the necessary information to rig the gear properly. Gear calibration trials are performed prior to starting the survey to ensure all gear, including sensors, are working properly.
During the survey: The crew rigs, controls, and repairs the net if necessary. All repairs are noted in gear specification sheets and added to the ‘trawl history’ binder that follows each set of gear. If a net is excessively damaged, a replacement is rigged and calibrated before use. The trawl history binder is delivered to the gear store with the nets at the end of the survey; nets are then inspected and repaired, if needed. The haul is marked invalid if the captain/science survey leader deem that the catch has been affected by the damage.
Series of ICES Survey Protocols SISP 10 - IBTS IX | 13
PROCEDURE FOR THE PREPARATION OF THE GEAR BEFORE AND DURING THE SURVEY
Scotland On each IBTS survey, four GOV trawls are carried aboard Scotia and rotated each cruise so they all get similar soak time. Any trawls used during the preceding survey are fully checked over by staff in the Marine Laboratory Netstore and given a full overhaul. Prior to each survey, all wires and groundgear sections are inspected and measured and if found defective replaced or re-rigged. Prior to the start of each survey, the initial rigging aboard the vessel is undertaken by the crew in the presence of either a gear technologist, scientist in charge (SIC), or nominated competent deputy. During the rigging, a member of scientific staff ensures the gear conforms to the standard trawl/gear rigging plan and acts as a point of contact between the vessel and net store to resolve any queries or problems. Gear technologists at the Laboratory have drafted a rigging manual that details how every component connects together to fully rig the GOV (from trawl door to codline) for Scottish surveys. This manual is more detailed than the IBTS manual and is intended to act as an aid for RV vessel crews and scientists to ensure consistency on every survey.
As standard practice on every survey, one member of the scientific staff is allocated responsibility to act as deck person. This role includes observing shooting and hauling of the gear, along with operating the SCANMAR and bottom contact instrumentation and relaying any issues to the SIC.
During the survey, the procedures as detailed in the flow diagram (2.6) are followed. An electronic haul-by-haul record (Net check form) is kept by the deck person for each trawl used and this details any damage sustained and repairs or replacements made to the fishing gear. A copy of this file is given to the SIC at the end of the cruise.
Sweden Before the survey: Both GOV-trawls are given a complete overhaul by the netmaker on a yearly basis, if possible with the cruise leader present.
During the survey: The flow diagram in Figure 2.6 is followed, except that the fishing master with onboard crew rig the trawl alone. The fishing master and the cruise leader compile a post-cruise trawl status list for the trawls that have been used to make sure that faulty or worn parts of the netting and the rig are replaced prior to next survey.
14 Series of ICES Survey Protocols SISP 10 - IBTS IX
Figure 2.6. IBTS GOV preparation flow diagram.
2.4.2 Quality control during the survey
The GOV trawls are generally used for several surveys during the year. They must be
regularly checked by the fishing crew in relation with scientists and/or gear
technologists. Each gear must have a specification sheet where all modifications or
damage occurred during a survey are registered.
Net checked over by Net store staff.
Groundgear & wires measured and checked by Net store staff.
Any damage or defects observed? Any damage or defects observed? No
Repair and record details on register.
Repair or correct defect
Transport to vessel
Assemble Net and groundgear onboard vessel under observation of appropriate member of staff and Fishing Master.
Is gear rigged as illustrated on drawings to the satisfaction of senior scientist & Fishing Master?
Yes Yes
Yes No Inform crew of change required.
Crew to carry out necessary changes or repair
Do for Each Station
Deploy Net
Examine net on hauling. Any damage?
Is this the last station?
No
No
Yes
Yes
Is repair on deck possible? Yes
No
Stow damaged net and or groundgear for return to Laboratory. Prepare to rig new combination of net and groundgear.
Stow net and gear for return to Laboratory
Net sent for cleaning and damage assessment.
Groundgear sent to store for checking.
Series of ICES Survey Protocols SISP 10 - IBTS IX | 15
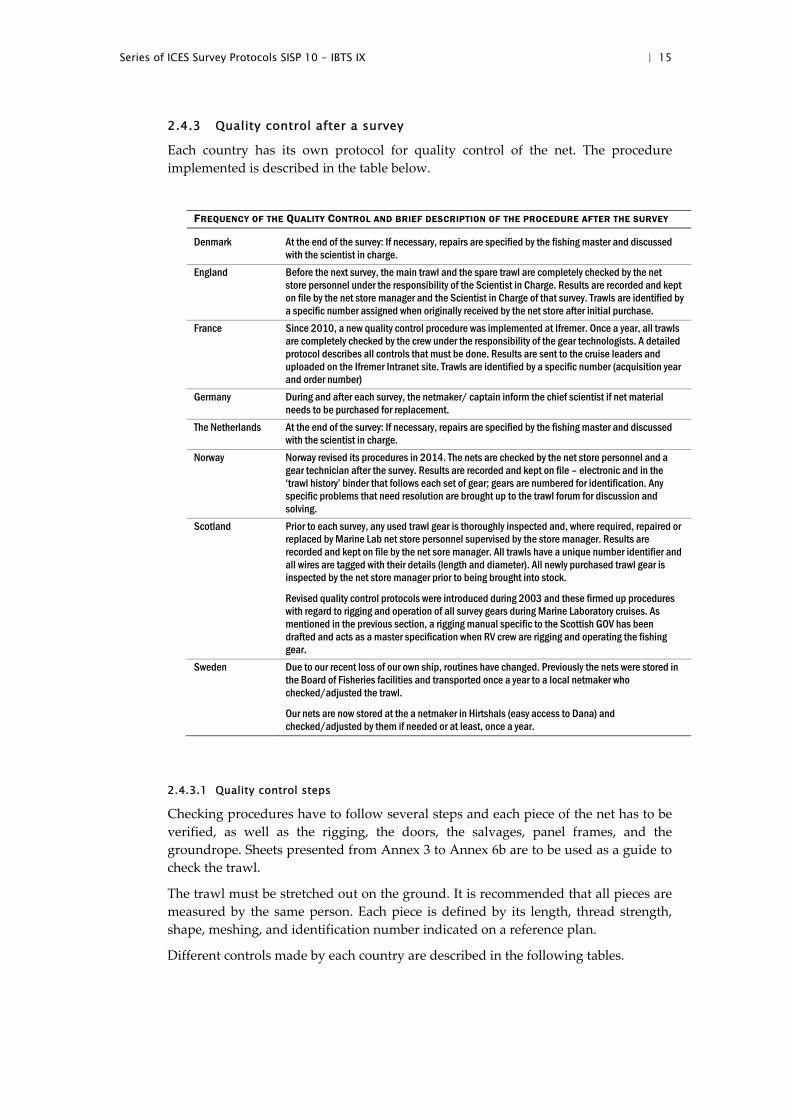
2.4.3 Quality control after a survey
Each country has its own protocol for quality control of the net. The procedure
implemented is described in the table below.
FREQUENCY OF THE QUALITY CONTROL AND BRIEF DESCRIPTION OF THE PROCEDURE AFTER THE SURVEY
Denmark At the end of the survey: If necessary, repairs are specified by the fishing master and discussed with the scientist in charge.
England Before the next survey, the main trawl and the spare trawl are completely checked by the net store personnel under the responsibility of the Scientist in Charge. Results are recorded and kept on file by the net store manager and the Scientist in Charge of that survey. Trawls are identified by a specific number assigned when originally received by the net store after initial purchase.
France Since 2010, a new quality control procedure was implemented at Ifremer. Once a year, all trawls are completely checked by the crew under the responsibility of the gear technologists. A detailed protocol describes all controls that must be done. Results are sent to the cruise leaders and uploaded on the Ifremer Intranet site. Trawls are identified by a specific number (acquisition year and order number)
Germany During and after each survey, the netmaker/ captain inform the chief scientist if net material needs to be purchased for replacement.
The Netherlands At the end of the survey: If necessary, repairs are specified by the fishing master and discussed with the scientist in charge.
Norway Norway revised its procedures in 2014. The nets are checked by the net store personnel and a gear technician after the survey. Results are recorded and kept on file – electronic and in the ‘trawl history’ binder that follows each set of gear; gears are numbered for identification. Any specific problems that need resolution are brought up to the trawl forum for discussion and solving.
Scotland Prior to each survey, any used trawl gear is thoroughly inspected and, where required, repaired or replaced by Marine Lab net store personnel supervised by the store manager. Results are recorded and kept on file by the net sore manager. All trawls have a unique number identifier and all wires are tagged with their details (length and diameter). All newly purchased trawl gear is inspected by the net store manager prior to being brought into stock.
Revised quality control protocols were introduced during 2003 and these firmed up procedures with regard to rigging and operation of all survey gears during Marine Laboratory cruises. As mentioned in the previous section, a rigging manual specific to the Scottish GOV has been drafted and acts as a master specification when RV crew are rigging and operating the fishing gear.
Sweden Due to our recent loss of our own ship, routines have changed. Previously the nets were stored in the Board of Fisheries facilities and transported once a year to a local netmaker who checked/adjusted the trawl.
Our nets are now stored at the a netmaker in Hirtshals (easy access to Dana) and checked/adjusted by them if needed or at least, once a year.
2.4.3.1 Quality control steps
Checking procedures have to follow several steps and each piece of the net has to be
verified, as well as the rigging, the doors, the salvages, panel frames, and the
groundrope. Sheets presented from Annex 3 to Annex 6b are to be used as a guide to
check the trawl.
The trawl must be stretched out on the ground. It is recommended that all pieces are
measured by the same person. Each piece is defined by its length, thread strength,
shape, meshing, and identification number indicated on a reference plan.
Different controls made by each country are described in the following tables.
16 Series of ICES Survey Protocols SISP 10 - IBTS IX
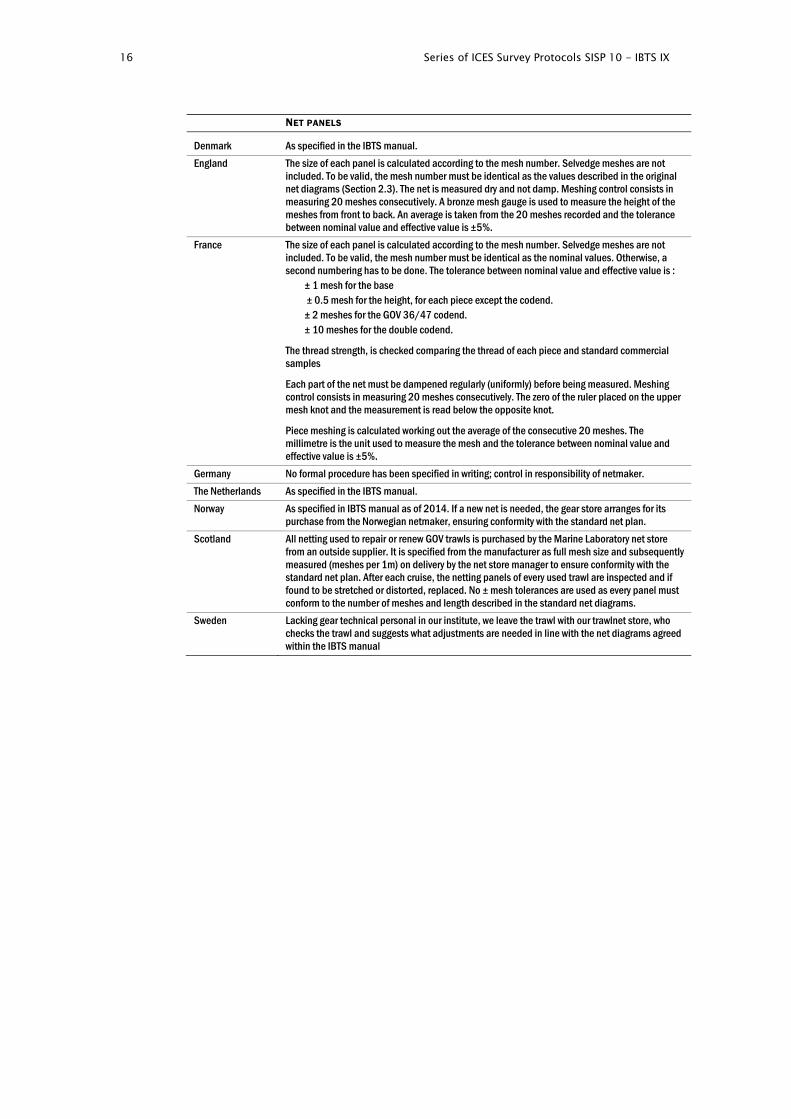
NET PANELS
Denmark As specified in the IBTS manual.
England The size of each panel is calculated according to the mesh number. Selvedge meshes are not included. To be valid, the mesh number must be identical as the values described in the original net diagrams (Section 2.3). The net is measured dry and not damp. Meshing control consists in measuring 20 meshes consecutively. A bronze mesh gauge is used to measure the height of the meshes from front to back. An average is taken from the 20 meshes recorded and the tolerance between nominal value and effective value is ±5%.
France The size of each panel is calculated according to the mesh number. Selvedge meshes are not included. To be valid, the mesh number must be identical as the nominal values. Otherwise, a second numbering has to be done. The tolerance between nominal value and effective value is :
± 1 mesh for the base ± 0.5 mesh for the height, for each piece except the codend. ± 2 meshes for the GOV 36/47 codend. ± 10 meshes for the double codend.
The thread strength, is checked comparing the thread of each piece and standard commercial samples
Each part of the net must be dampened regularly (uniformly) before being measured. Meshing control consists in measuring 20 meshes consecutively. The zero of the ruler placed on the upper mesh knot and the measurement is read below the opposite knot.
Piece meshing is calculated working out the average of the consecutive 20 meshes. The millimetre is the unit used to measure the mesh and the tolerance between nominal value and effective value is ±5%.
Germany No formal procedure has been specified in writing; control in responsibility of netmaker.
The Netherlands As specified in the IBTS manual.
Norway As specified in IBTS manual as of 2014. If a new net is needed, the gear store arranges for its purchase from the Norwegian netmaker, ensuring conformity with the standard net plan.
Scotland All netting used to repair or renew GOV trawls is purchased by the Marine Laboratory net store from an outside supplier. It is specified from the manufacturer as full mesh size and subsequently measured (meshes per 1m) on delivery by the net store manager to ensure conformity with the standard net plan. After each cruise, the netting panels of every used trawl are inspected and if found to be stretched or distorted, replaced. No ± mesh tolerances are used as every panel must conform to the number of meshes and length described in the standard net diagrams.
Sweden Lacking gear technical personal in our institute, we leave the trawl with our trawlnet store, who checks the trawl and suggests what adjustments are needed in line with the net diagrams agreed within the IBTS manual

Series of ICES Survey Protocols SISP 10 - IBTS IX | 17
SALVAGES AND PANEL FRAMES
Denmark As specified in the IBTS manual
England Salvages and panel frames are attached along parts of the net. Each is stretched and measured with a tape measure from eye to eye. The unit is the centimetre and tolerance between nominal value and effective value is ±5 cm. On the same part of the trawl, the port side and the starboard must be equal and difference does not exceed ± 5 cm.
France Lines are attached along parts of the net. Each of them is stretched and measured with a decameter from eye to eye. The unit is the centimetre and tolerance between nominal value and effective value is ±5 cm. The diameter is controlled with a caliper rule and tolerance between nominal value and effective value is ±5mm. On the same part of the trawl, the port side and the startboard must be equal and difference does not exceed ± 5 cm.
Germany See above
The Netherlands As specified in the IBTS manual
Norway As specified in IBTS manual
Scotland Selvedge and panel framelines are attached along parts of the trawl. All are measured to the exact value specified in the standard plan. After a survey, each used trawl is returned to the laboratory net store, where all lengths and diameters are checked and, if different from the standard plan, replaced. Particular attention is made to checks along the nylon (PA) selvedge rope sections as these shrink and are replaced regularly. When selvedge ropes are replaced on one side of the gear, the opposite side is automatically replaced.
Sweden Lacking gear technician in our institute, we leave the trawl with our netmaker, who checks the trawl and suggests what adjustments are needed in line with the net diagrams agreed within the IBTS manual
THE GROUNDROPE
Denmark Once measured, not re-measured unless damaged.
England The groundrope is stretched on the floor and its different parts measured with a tape measure. The unit is the centimetre and the tolerance does not exceed ± 5 cm.
France The groundrope is stretched on the floor and its different parts measured with a decameter. The unit is the centimetre and the tolerance does not exceed ± 5 cm. The weight of the groundrope could be only estimated. Its load must be well distributed on the square and equal between the port side and the starboard wings.
Germany See above
The Netherlands Once measured not re-measured unless damaged.
Norway Once measured not re-measured unless damaged.
Scotland Two sets of each groundrope (A and B) are available for each survey They are checked and measured twice per year, the unit is the centimetre and the tolerance does not exceed + 3 cm.
Sweden Lacking gear technical personal in our institute, we leave the trawl with our trawlnet store, who checks the trawl and suggests what adjustments are needed in line with the net diagrams agreed within the IBTS manual
18 Series of ICES Survey Protocols SISP 10 - IBTS IX
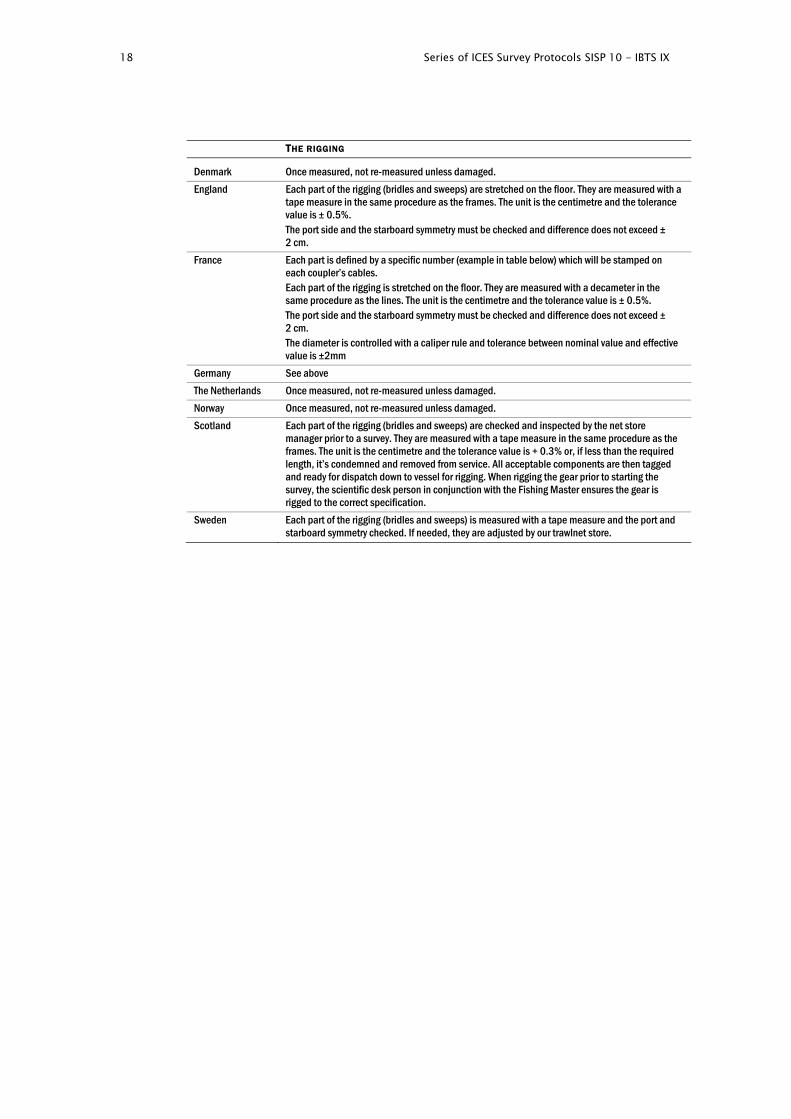
THE RIGGING
Denmark Once measured, not re-measured unless damaged.
England Each part of the rigging (bridles and sweeps) are stretched on the floor. They are measured with a tape measure in the same procedure as the frames. The unit is the centimetre and the tolerance value is ± 0.5%. The port side and the starboard symmetry must be checked and difference does not exceed ± 2 cm.
France Each part is defined by a specific number (example in table below) which will be stamped on each coupler’s cables. Each part of the rigging is stretched on the floor. They are measured with a decameter in the same procedure as the lines. The unit is the centimetre and the tolerance value is ± 0.5%. The port side and the starboard symmetry must be checked and difference does not exceed ± 2 cm. The diameter is controlled with a caliper rule and tolerance between nominal value and effective value is ±2mm
Germany See above
The Netherlands Once measured, not re-measured unless damaged.
Norway Once measured, not re-measured unless damaged.
Scotland Each part of the rigging (bridles and sweeps) are checked and inspected by the net store manager prior to a survey. They are measured with a tape measure in the same procedure as the frames. The unit is the centimetre and the tolerance value is + 0.3% or, if less than the required length, it’s condemned and removed from service. All acceptable components are then tagged and ready for dispatch down to vessel for rigging. When rigging the gear prior to starting the survey, the scientific desk person in conjunction with the Fishing Master ensures the gear is rigged to the correct specification.
Sweden Each part of the rigging (bridles and sweeps) is measured with a tape measure and the port and starboard symmetry checked. If needed, they are adjusted by our trawlnet store.
Series of ICES Survey Protocols SISP 10 - IBTS IX | 19
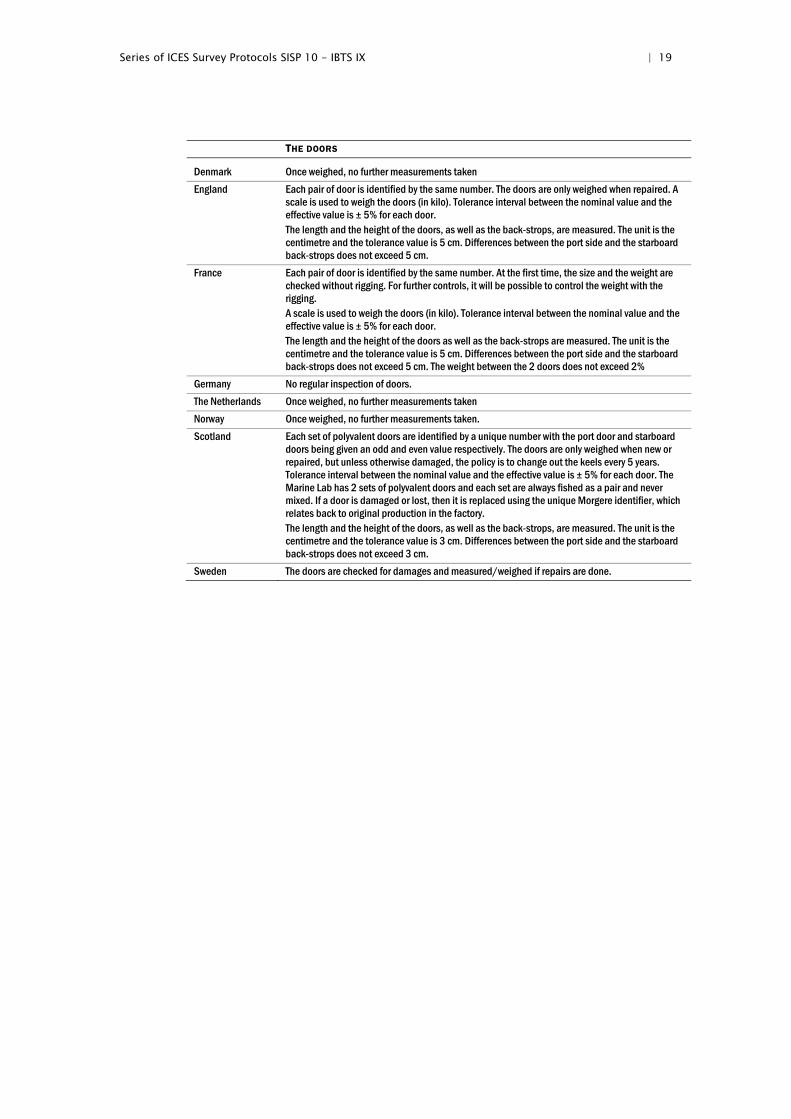
THE DOORS
Denmark Once weighed, no further measurements taken
England Each pair of door is identified by the same number. The doors are only weighed when repaired. A scale is used to weigh the doors (in kilo). Tolerance interval between the nominal value and the effective value is ± 5% for each door. The length and the height of the doors, as well as the back-strops, are measured. The unit is the centimetre and the tolerance value is 5 cm. Differences between the port side and the starboard back-strops does not exceed 5 cm.
France Each pair of door is identified by the same number. At the first time, the size and the weight are checked without rigging. For further controls, it will be possible to control the weight with the rigging. A scale is used to weigh the doors (in kilo). Tolerance interval between the nominal value and the effective value is ± 5% for each door. The length and the height of the doors as well as the back-strops are measured. The unit is the centimetre and the tolerance value is 5 cm. Differences between the port side and the starboard back-strops does not exceed 5 cm. The weight between the 2 doors does not exceed 2%
Germany No regular inspection of doors.
The Netherlands Once weighed, no further measurements taken
Norway Once weighed, no further measurements taken.
Scotland Each set of polyvalent doors are identified by a unique number with the port door and starboard doors being given an odd and even value respectively. The doors are only weighed when new or repaired, but unless otherwise damaged, the policy is to change out the keels every 5 years. Tolerance interval between the nominal value and the effective value is ± 5% for each door. The Marine Lab has 2 sets of polyvalent doors and each set are always fished as a pair and never mixed. If a door is damaged or lost, then it is replaced using the unique Morgere identifier, which relates back to original production in the factory. The length and the height of the doors, as well as the back-strops, are measured. The unit is the centimetre and the tolerance value is 3 cm. Differences between the port side and the starboard back-strops does not exceed 3 cm.
Sweden The doors are checked for damages and measured/weighed if repairs are done.
20 | Series of ICES Survey Protocols SISP 10 - IBTS IX
Summary of quality controls used for GOV.
CONTROL FREQUENCY
NET TOLERANCE %
RIGGING TOLERANCE %
SIZE & LENGTH MESHES SIZE SALVAGES AND FRAMES GROUNDROPE RIGGING DOORS
Denmark As required As described in check sheets
As described in check sheets As described in check sheets As described in check sheets
As described in check sheets
As described in check sheets
England Annually ± 5%(length)
± 2 meshes ± 5 cm (length) difference port side / starboard ± 5 cm
± 5 cm (length) ± 5% (length) ± 5% (each door) ± 2% (between the 2 doors)
Scotland Prior to every survey
0% Must conform to length and count of meshes in standard net plan.
Length must match standard net plan otherwise replaced.
+ 3 cm (length) +0.3% (length) ± 5% (each door)
Netherlands As required As described in check sheets As described in check sheets As described in check sheets
As described in check sheets
As described in check sheets
As described in check sheets
Germany Before each survey (Q1, Q3)
Expert judgement of netmaker
Expert judgement of netmaker
Expert judgement of netmaker Expert judgement of netmaker
Expert judgement of netmaker
Expert judgement of netmaker
Norway As required As described in check sheets
As described in check sheets As described in check sheets As described in check sheets
As described in check sheets
As described in check sheets
Sweden As required As described in check sheets
As described in check sheets As described in check sheets As described in check sheets
As described in check sheets
As described in check sheets
France Every Year (since 2010)
± 5% (length)
Base : ± 1 mesh Height : ± 1 mesh Codend : ± 2 meshes Double codend : ± 10 meshes
± 5 cm (length) difference port side / starboard ± 5 cm
± 5 cm (length) ± 5% (length) ±2mm. (diameter)
± 5% (each door) ± 2% (between the 2 doors)
Series of ICES Survey Protocols SISP 10 - IBTS IX | 21
2.5 Standard fishing method It is suggested that all nations undertaking standardized surveys allocate some of the
survey time to carrying out additional hauls at the start of the survey with the specific
aim of ensuring that all standard elements of the groundfish survey are working
correctly. This includes:
Gear deployment: is the gear rigged correctly and being deployed and
retrieved appropriately by the crew? Is the deck machinery all functioning?
Ground contact: do the groundgear and doors indicate that the net is on the
bottom and fishing correctly?
Trawl sensors and CTDs: are all electronic equipment functioning correctly
and collecting meaningful data?
Catch processing: are all elements of catch processing and data inputting
functioning?
Though there are good reasons for having these additional hauls in the main survey
area, for practical reasons, they should be undertaken near the port of departure. This
would then allow additional staff (including a gear technologist) to be present to fully
check the gear and electronics, and would also save time in case something requires
further attention.
Standard fishing speed is 4 knots measured as trawl speed over the ground. The
recommended speed is set as a target and actual (ground) speed and distance towed
must be monitored and reported. With tide and weather effecting the average speed of
a vessel, as a guide, the minimum trawl speed should not go below 3.5 knots and the
maximum should not exceed 4.5 knots, with the average for the entire tow being as
close to 4 knots as possible. It is also recommended that, if possible, the speed of the
trawl through the water should be monitored and reported.
The maximum fishing depth for standard stations in the North Sea is 200 m and in
Division IIIa 250 m.
A standard tow is fished for 30 minutes. Start time is defined as the moment when the
vertical net opening and doorspread are stable. Stop time is defined as the start of the
winches hauling the net back in. It may be acceptable to fish for less than this i.e. haul
early for safety reasons or in the case of very large catches, however, any tow under 15
minutes is either invalid or tagged as non‐standard and reasons are stated. Tows under
15 minutes are not included in index calculations and therefore a second valid station
must be attempted in that rectangle.
As a minimum, vertical net opening and doorspread are to be monitored at as high a
rate as possible (e.g. 1‐second intervals are recommended) and, after appropriate
filtering for invalid values, the mean value is reported. It is recommended that
wingspread is also measured. In order to ensure that the gear performs correctly, the
net geometry should be within tolerances set out in Section 2.6.
Conduct trawling operations during daylight hours, although some institutes may
wish to trawl both during the day and night. Note that night‐time hauls are not valid
IBTS hauls for index calculations. Night‐time hauls need to be entered as such and
should not be used as standard IBTS hauls or for direct comparison with daylight
hauls. In the morning, the net cannot be shot earlier than 15 minutes before sunrise. At
the end of the day, the net must be hauled within 15 minutes after the time of sunset.
A software package that calculates sunrise and sunset, called “RiseAndSet”, is
available from IMARES, but many other are available and may be used. In order to

22 | Series of ICES Survey Protocols SISP 10 - IBTS IX
make a quick calculation, the daylight hours for various periods can be calculated with
reference to current latitude and the text table below:
Daylight period in UTC at 0 degrees longitude:
DATES SOUTH OF 57° 30' N NORTH OF 57° 30' N
SUNRISE SUNSET SUNRISE SUNSET
01–10 Jan 08.09 - 15.58 08.45 - 15.25
10–20 Jan 08.01 - 16.17 08.31 - 15.45
21–31 Jan 07.47 - 16.35 08.15 - 16.07
01–10 Feb 07.29 - 16.58 07.49 - 16.36
11–20 Feb 07.08 - 17.20 07.23 - 17.05
21–28 Feb 06.47 - 17.41 06.55 - 17.30
01–10 Mar 06.27 - 17.57 06.32 - 17.50
11–20 Mar 06.03 - 18.18 06.05 - 18.15
21–31 Mar 05.35 - 18.38 05.32 - 18.39
01–10 July 03.15 - 20.55 02.28 - 21.40
11–20 July 03.26 - 20.47 02.49 - 21.24
21–31 July 03.41 - 20.33 03.08 - 21.03
01–10 Aug 04.00 - 20.12 03.34 - 20.38
11–20 Aug 04.19 - 19.50 03.59 - 20.09
21–31 Aug 04.37 - 19.26 04.23 - 19.42
01–10 Sep 04.57 - 19.00 04.48 - 19.09
11–20 Sep 05.16 - 18.34 05.12 - 18.38
21–30 Sep 05.35 - 18.08 05.35 - 18.08
Source: ʹThe Times Atlasʹ 1972, p 33.
For each degree longitude west, 4 minutes should be added and for each degree
longitude east, 4 minutes should be subtracted.
2.6 Monitoring net geometry All countries must use electronic equipment to monitor net geometry (e.g.
SCANMAR). On all IBTS hauls, headline height over bottom (vertical net opening),
ground clearance, and doorspread are to be recorded. The sensor manual should be
referred to for the correct method for attaching the units to the gear. In order to ensure
a valid tow, gear stability is crucial. During the tow, it is imperative that net geometry
is measured. The user should continuously monitor net performance during a tow and,
if needed, adjust the trawling conditions to return to accepted limits (e.g. by changing
warp length). The amount of warp deployed at depth to obtain these values can vary
between vessels, e.g. Scotland uses a ratio of 3.5 times the depth plus 30 m for warp
out. However, each country should produce a table that corresponds to their own
needs. If the readings remain outside the recommended values for an unacceptable
period of time it could mean that the gear has become fouled or damaged and should
be hauled in. Constant monitoring of the gear is necessary to build up a baseline of
gear performance for the national coordinators/cruise leaders, making it easier to spot
abnormal gear behaviour while on a survey. Each country should aim to keep their
gear performance within the bounds of what is considered normal for their gear.
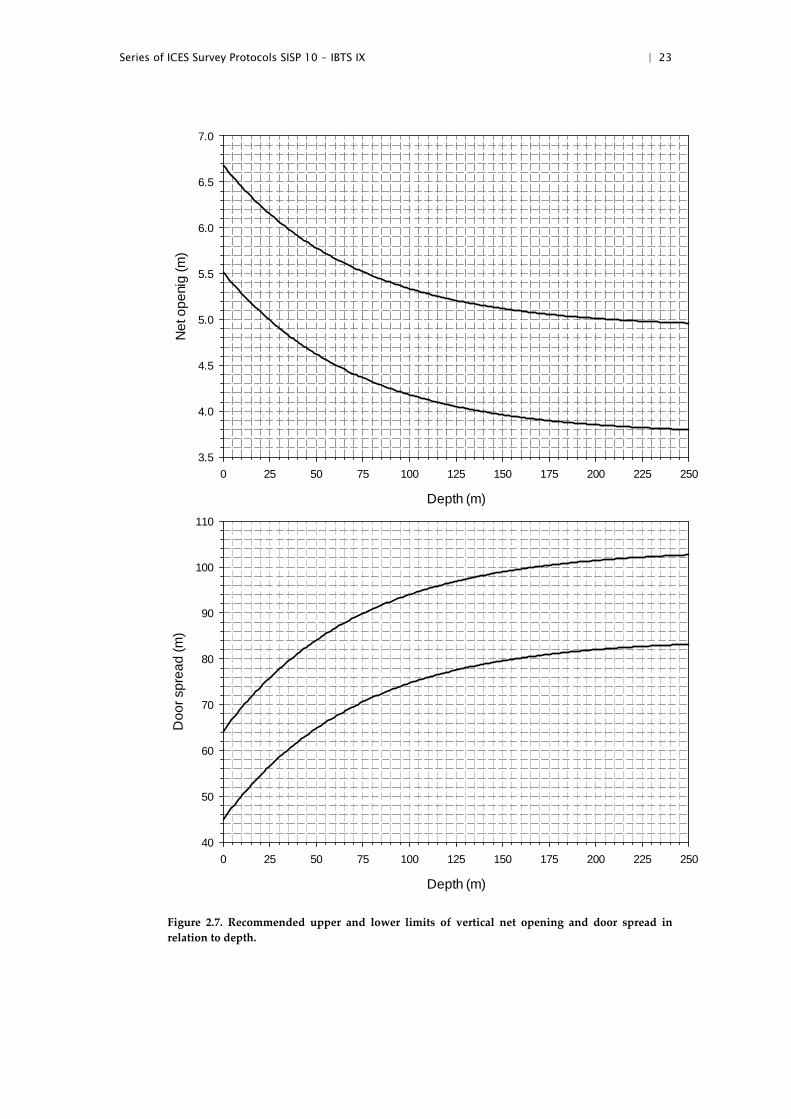
Figure 2.7 shows the recommended ranges of the headline height and door spread of
the GOV relating to the depth of water. This should be used as a guide to ensure
optimum gear performance. Table 2.6.1 details the formula and parameters used to
create the bounds shown in Figure 2.7, allowing the user to determine how their gear
operates in relation to the recommended range.
Series of ICES Survey Protocols SISP 10 - IBTS IX | 23
Depth (m)
0 25 50 75 100 125 150 175 200 225 250
Ne
t op
eni
g (
m)
3.5
4.0
4.5
5.0
5.5
6.0
6.5
7.0
Depth (m)
0 25 50 75 100 125 150 175 200 225 250
Do
or
spre
ad
(m
)
40
50
60
70
80
90
100
110
Figure 2.7. Recommended upper and lower limits of vertical net opening and door spread in
relation to depth.

24 | Series of ICES Survey Protocols SISP 10 - IBTS IX
Table 2.6.1. Definition of recommended upper and lower limits of vertical net opening and door
spread in relation to depth (y = a + b exp(‐c z), where y is net opening or door spread and z is depth in meters).
NET OPENING LIMITS DOOR SPREAD LIMITS
COEFFICIENT UPPER LOWER UPPER LOWER
a 3.7461 4.9088 84.3842 103.9178
b 1.7689 1.7727 -39.4195 -39.6521
c 0.0140 -0.0142 0.0140 0.0139
It is recommended that the entire data stream, including all the net sensor parameters,
are recorded to allow mean values to be calculated and entered into the individual
institutes’ databases. These values are calculated from the time the gear has stabilized
on the bottom to the time the gear is hauled. Data screening must also be done; the
2009 SGSTS report, Section 4.2.1, gives guidance on how to carry this out. Data from
these calculations are to be sent to DATRAS with the standard upload from institutes
databases.
The following flow diagram should be used to help in the process of using net
performance sensors and units during a GOV haul (Figure 2.8).
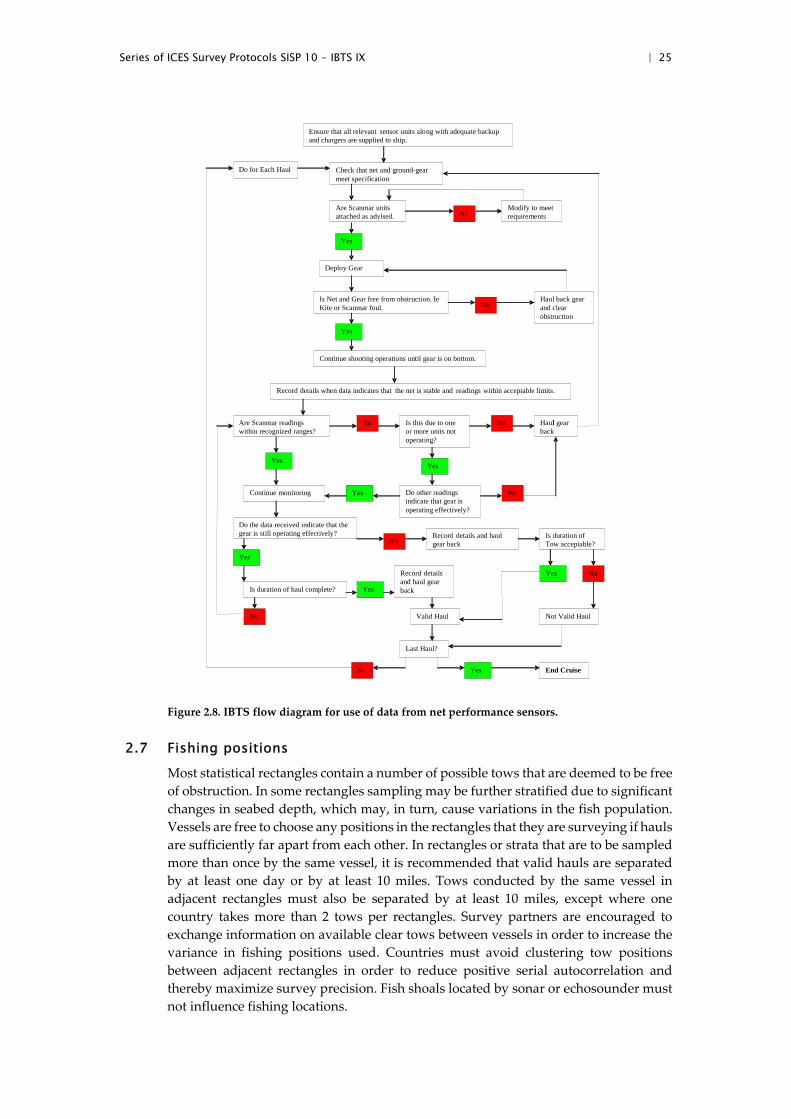
Series of ICES Survey Protocols SISP 10 - IBTS IX | 25
Figure 2.8. IBTS flow diagram for use of data from net performance sensors.
2.7 Fishing positions Most statistical rectangles contain a number of possible tows that are deemed to be free
of obstruction. In some rectangles sampling may be further stratified due to significant
changes in seabed depth, which may, in turn, cause variations in the fish population.
Vessels are free to choose any positions in the rectangles that they are surveying if hauls
are sufficiently far apart from each other. In rectangles or strata that are to be sampled
more than once by the same vessel, it is recommended that valid hauls are separated
by at least one day or by at least 10 miles. Tows conducted by the same vessel in
adjacent rectangles must also be separated by at least 10 miles, except where one
country takes more than 2 tows per rectangles. Survey partners are encouraged to
exchange information on available clear tows between vessels in order to increase the
variance in fishing positions used. Countries must avoid clustering tow positions
between adjacent rectangles in order to reduce positive serial autocorrelation and
thereby maximize survey precision. Fish shoals located by sonar or echosounder must
not influence fishing locations.
Are Scanmar units attached as advised.
No Modify to meet requirements
Yes
Deploy Gear
Is Net and Gear free from obstruction. Ie Kite or Scanmar foul.
Continue shooting operations until gear is on bottom.
Record details when data indicates that the net is stable and readings within acceptable limits.
Are Scanmar readings within recognized ranges?
Is this due to one or more units not operating?
Haull gear back
Continue monitoring
Do the data received indicate that the gear is still operating effectively?
Is duration of haul complete?
No Haul back gear and clear obstruction
Yes
No No
Yes
Yes
Check that net and ground-gear meet specification
Do for Each Haul
Ensure that all relevant sensor units along with adequate backup and chargers are supplied to ship.
Yes No Do other readings indicate that gear is operating effectively?
Yes
No
Yes
No
Record details and haul gear back
Record details and haul gear back
Is duration of Tow acceptable?
Valid Haul Not Valid Haul
Yes No
YesNo End Cruise
Last Haul?

26 | Series of ICES Survey Protocols SISP 10 - IBTS IX
3 Sampling of GOV-trawl catches
3.1 Catch sorting and sampling The catch from all valid hauls must be fully sorted where practicable. The entire catch
is sorted, with fish and shellfish species identified to the lowest taxonomic level
possible. For larger catches, a selection of species/size categories of species may be
identified as being sufficiently abundant that they can be subsampled appropriately. If
the entire catch cannot be sorted, then the data must be flagged accordingly when
submitted to the DATRAS database. Annexes 7 and 8 show tables of the current catch
processing procedures of each nation for the quarter 1 and quarter 3 surveys.
All fish in the catch must be identified to species. Only if this proves impossible may
some be grouped by genus or larger taxonomic group (e.g. Pomatoschistus,
Ammodytidae). Table 3.1.1 lists the shellfish and cephalopods that must also be sorted,
measured, and included in the data submission to DATRAS. Although standardized
data collection for fish is well established in IBTS protocols (see below), there is no
standardized approach to the submission of data on the catches and size distribution
of other invertebrate species (those not in Table 3.1.1). Some national laboratories
record other invertebrate species as “benthos”, while some sort and identify to species
or family level. No agreed protocols for the collection and submission of data exist
because the levels of taxonomic expertise on board vessels can be variable. The GOV is
not an effective gear for catching benthos for quantitative sampling, but it can be used
for some crude distribution information, as long as the limitations of the gear are taken
into consideration, e.g. the type and rigging of the groundgear, the size of the net
meshes. These data may be collected as presence/absence or weights/numbers. It is at
the discretion of the institute collecting the data to decide what means is most
appropriate. Hence, national laboratories collecting information on benthos should
continue to do so, though such data should not be reported to DATRAS until rigorous
quality assurance and reporting procedures are in place, so as to ensure that data are
of high quality.
Table 3.1.1. Shellfish and cephalopods to be recorded and/or measured during surveys.
APHIAID COMMON NAME SCIENTIFIC NAME RECORDING MEASUREMENT UNIT CRUSTACEANS 107275 Golden crab Cancer bellanius Male/Female Carapace width mm below 107276 Edible crab Cancer pagurus Male/Female Carapace width mm below 107369 Deep-water red
crab Chaceon affinis Male/Female Carapace width mm below
107253 European lobster Homarus gammarus Male/Female Carapace length mm below 107703 Crawfish/spiny
lobster Palinurus elephas Male/Female Carapace length mm below
107704 Pink spiny lobster Palinurus mauritanicus Male/Female Carapace length mm below 107350 Spider crab Maja (Maia) squinado Male/Female Carapace length mm below 107254 Norway lobster Nephrops norvegicus Male/Female Carapace length mm below 107205 Stone crab Lithodes maja Male/Female Carapace length mm below BIVALVES 140712 Edible scallop Pecten maximus Sexes
combined – –
140687 Queen scallops Aequipecten opercularis Sexes combined
– –
140658 Common oyster Ostrea edulis Sexes combined
– –
CEPHALOPODS 141444 Cuttlefish Sepia officinalis Sexes
combined Mantle length cm below
141443 Cuttlefish Sepia elegans Sexes combined
Mantle length cm below
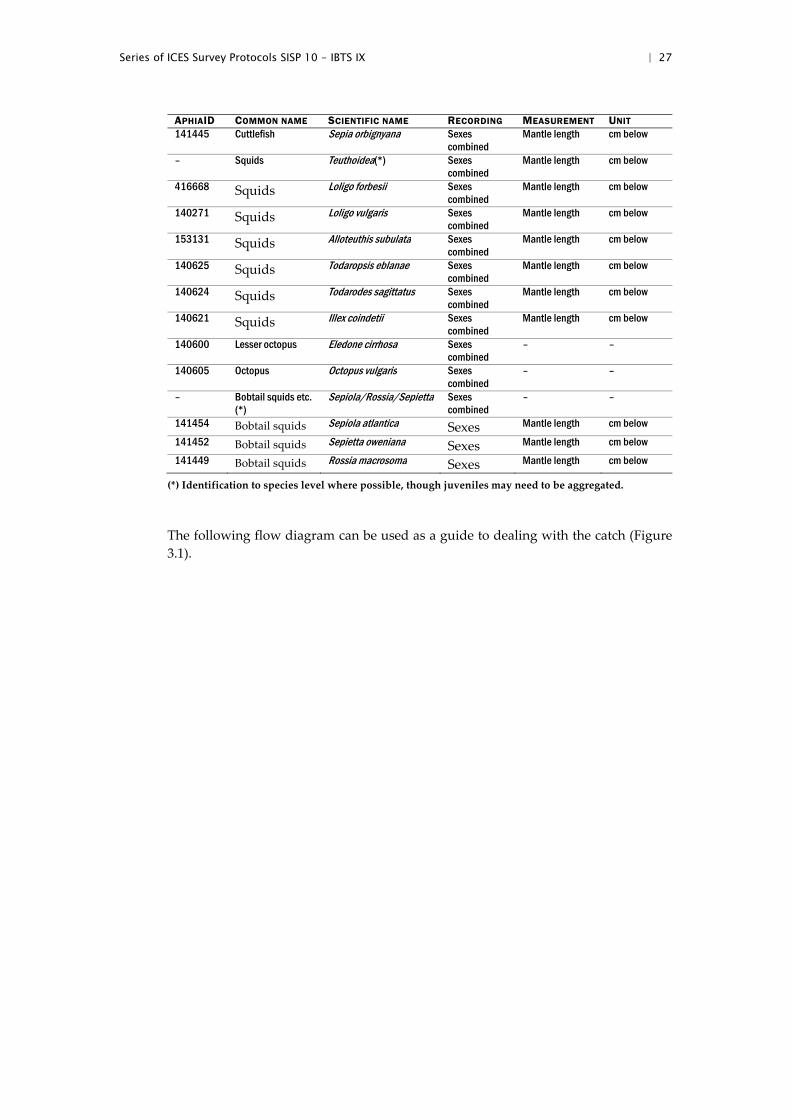
Series of ICES Survey Protocols SISP 10 - IBTS IX | 27
APHIAID COMMON NAME SCIENTIFIC NAME RECORDING MEASUREMENT UNIT 141445 Cuttlefish Sepia orbignyana Sexes
combined Mantle length cm below
– Squids Teuthoidea(*) Sexes combined
Mantle length cm below
416668 Squids Loligo forbesii Sexes combined
Mantle length cm below
140271 Squids Loligo vulgaris Sexes combined
Mantle length cm below
153131 Squids Alloteuthis subulata Sexes combined
Mantle length cm below
140625 Squids Todaropsis eblanae Sexes combined
Mantle length cm below
140624 Squids Todarodes sagittatus Sexes combined
Mantle length cm below
140621 Squids Illex coindetii Sexes combined
Mantle length cm below
140600 Lesser octopus Eledone cirrhosa Sexes combined
– –
140605 Octopus Octopus vulgaris Sexes combined
– –
– Bobtail squids etc. (*)
Sepiola/Rossia/Sepietta Sexes combined
– –
141454 Bobtail squids Sepiola atlantica Sexes Mantle length cm below
141452 Bobtail squids Sepietta oweniana Sexes Mantle length cm below
141449 Bobtail squids Rossia macrosoma Sexes Mantle length cm below
(*) Identification to species level where possible, though juveniles may need to be aggregated.
The following flow diagram can be used as a guide to dealing with the catch (Figure
3.1).
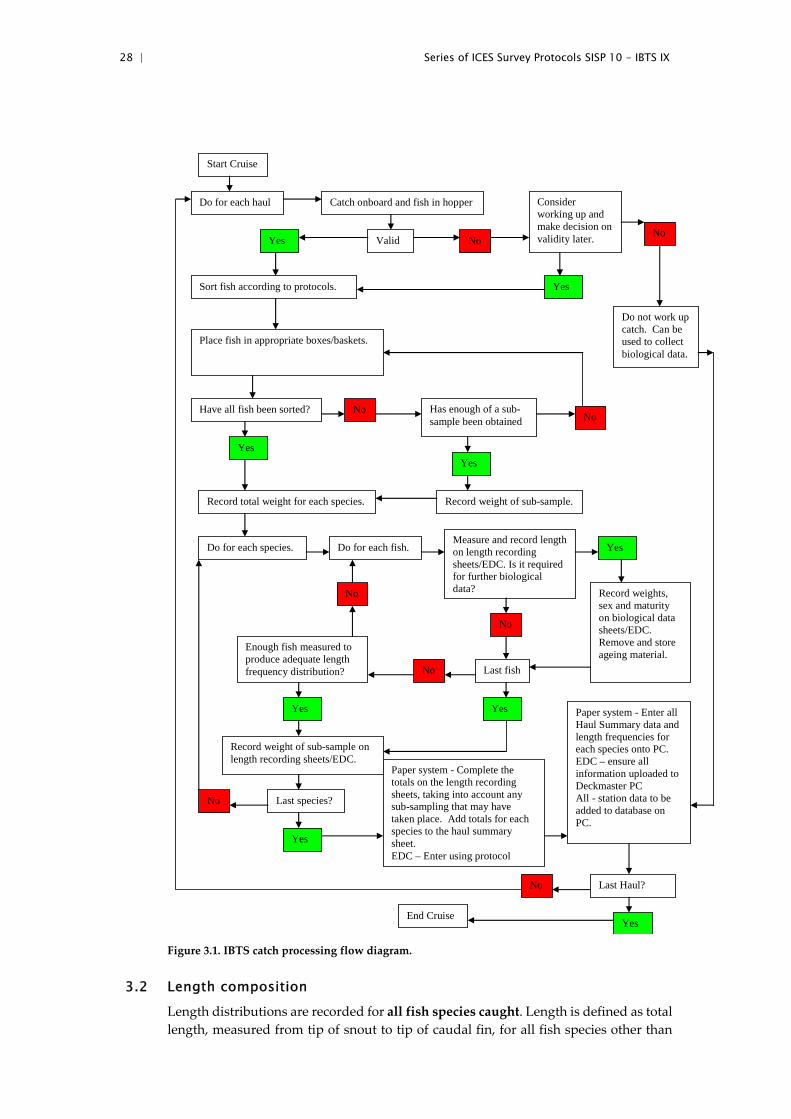
28 | Series of ICES Survey Protocols SISP 10 - IBTS IX
Figure 3.1. IBTS catch processing flow diagram.
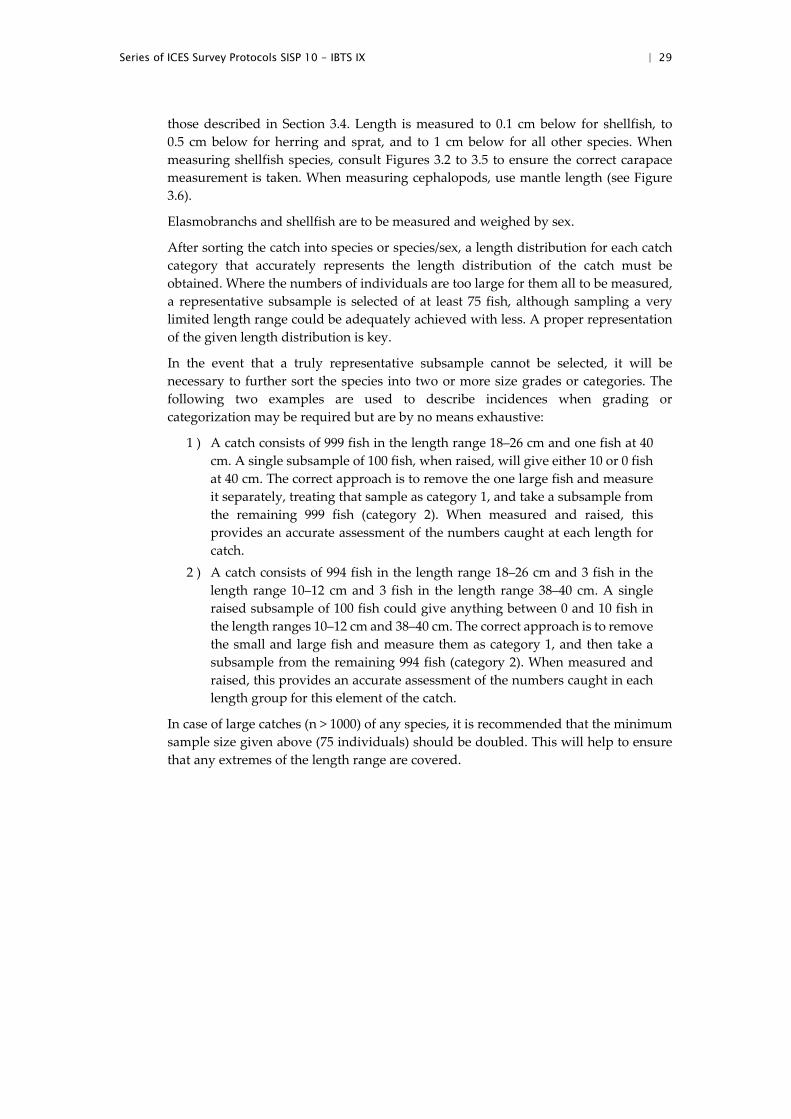
3.2 Length composition Length distributions are recorded for all fish species caught. Length is defined as total
length, measured from tip of snout to tip of caudal fin, for all fish species other than
Start Cruise
Do for each haul Catch onboard and fish in hopper
Valid Yes No
Consider working up and make decision on validity later.
Sort fish according to protocols. Yes
No
Place fish in appropriate boxes/baskets.
Have all fish been sorted?
Yes
No Has enough of a sub-sample been obtained No
Yes
Record total weight for each species. Record weight of sub-sample.
Do not work up catch. Can be used to collect biological data.
Do for each species. Do for each fish. Measure and record length on length recording sheets/EDC. Is it required for further biological data?
Yes
No
Record weights, sex and maturity on biological data sheets/EDC. Remove and store ageing material.
No
Last fish
Yes
No
Enough fish measured to produce adequate length frequency distribution?
Yes
Record weight of sub-sample on length recording sheets/EDC.
Last species? No
Yes
Paper system - Complete the totals on the length recording sheets, taking into account any sub-sampling that may have taken place. Add totals for each species to the haul summary sheet. EDC – Enter using protocol
Paper system - Enter all Haul Summary data and length frequencies for each species onto PC. EDC – ensure all information uploaded to Deckmaster PC All - station data to be added to database on PC.
Last Haul?
Yes
No
End Cruise
Series of ICES Survey Protocols SISP 10 - IBTS IX | 29
those described in Section 3.4. Length is measured to 0.1 cm below for shellfish, to
0.5 cm below for herring and sprat, and to 1 cm below for all other species. When
measuring shellfish species, consult Figures 3.2 to 3.5 to ensure the correct carapace
measurement is taken. When measuring cephalopods, use mantle length (see Figure
3.6).
Elasmobranchs and shellfish are to be measured and weighed by sex.
After sorting the catch into species or species/sex, a length distribution for each catch
category that accurately represents the length distribution of the catch must be
obtained. Where the numbers of individuals are too large for them all to be measured,
a representative subsample is selected of at least 75 fish, although sampling a very
limited length range could be adequately achieved with less. A proper representation
of the given length distribution is key.
In the event that a truly representative subsample cannot be selected, it will be
necessary to further sort the species into two or more size grades or categories. The
following two examples are used to describe incidences when grading or
categorization may be required but are by no means exhaustive:
1 ) A catch consists of 999 fish in the length range 18–26 cm and one fish at 40 cm. A single subsample of 100 fish, when raised, will give either 10 or 0 fish
at 40 cm. The correct approach is to remove the one large fish and measure
it separately, treating that sample as category 1, and take a subsample from
the remaining 999 fish (category 2). When measured and raised, this
provides an accurate assessment of the numbers caught at each length for
catch.
2 ) A catch consists of 994 fish in the length range 18–26 cm and 3 fish in the length range 10–12 cm and 3 fish in the length range 38–40 cm. A single
raised subsample of 100 fish could give anything between 0 and 10 fish in
the length ranges 10–12 cm and 38–40 cm. The correct approach is to remove
the small and large fish and measure them as category 1, and then take a
subsample from the remaining 994 fish (category 2). When measured and
raised, this provides an accurate assessment of the numbers caught in each
length group for this element of the catch.
In case of large catches (n > 1000) of any species, it is recommended that the minimum
sample size given above (75 individuals) should be doubled. This will help to ensure
that any extremes of the length range are covered.

30 | Series of ICES Survey Protocols SISP 10 - IBTS IX
3.3 Sampling for age, sex, and maturity Otolith samples are to be collected from each trawl station by all nations. Both otoliths
from each fish are to be collected. Care should be taken not to extract otoliths from fish
that exhibit length deformities.
Where possible, nations are to collect 1 otolith per 1 cm length group (0.5 cm length
group for herring and sprat) from each trawl haul. Where this is not possible, the
following minimum sampling levels for the target species are to be maintained for each
trawl station:
SPECIES MINIMUM NUMBER OF OTOLITHS TO BE TAKEN PER ROUNDFISH AREA
herring 8 otoliths per 1/2 cm group
sprat 16 otoliths per 1/2 cm group 8.0–11.0 cm
12 otoliths per 1/2 cm group >11.0 cm
mackerel 8 otoliths per 1 cm group
cod 8 otoliths per 1 cm group
haddock 8 otoliths per 1 cm group
whiting 8 otoliths per 1 cm group
Norway pout 8 otoliths per 1 cm group
saithe 8 otoliths per 1 cm group
Plaice 8 otoliths per 1 cm group
For the smallest size groups, that presumably contain only one age group, the number
of otoliths per length class may be reduced. Conversely, more otoliths per length group
are required for the larger length classes. If nations are collecting 1 otolith per cm (or per
0.5 cm for herring and sprat), then additional samples from the upper tail of the size
distribution are not needed.
Participants are encouraged to collect age samples from other commercially important
species, such as sole, lemon sole, and any other species deemed important to the EU
Data Collection Framework (DCF) or specified by the IBTS working group.
Sex, maturity, and weight data are to be reported for all target species for which age
data are collected, especially for surveys that take place during the spawning period of
that species. Maturity stages should be reported according to the maturity scales given
in Annexes 9 and 10, however this key is targeted at roundfish. For flatfish species,
refer to the Report of the Workshop on Sexual Maturity Staging of sole, plaice, dab and
flounder, ICES CM 2012/ACOM:50.
Series of ICES Survey Protocols SISP 10 - IBTS IX | 31
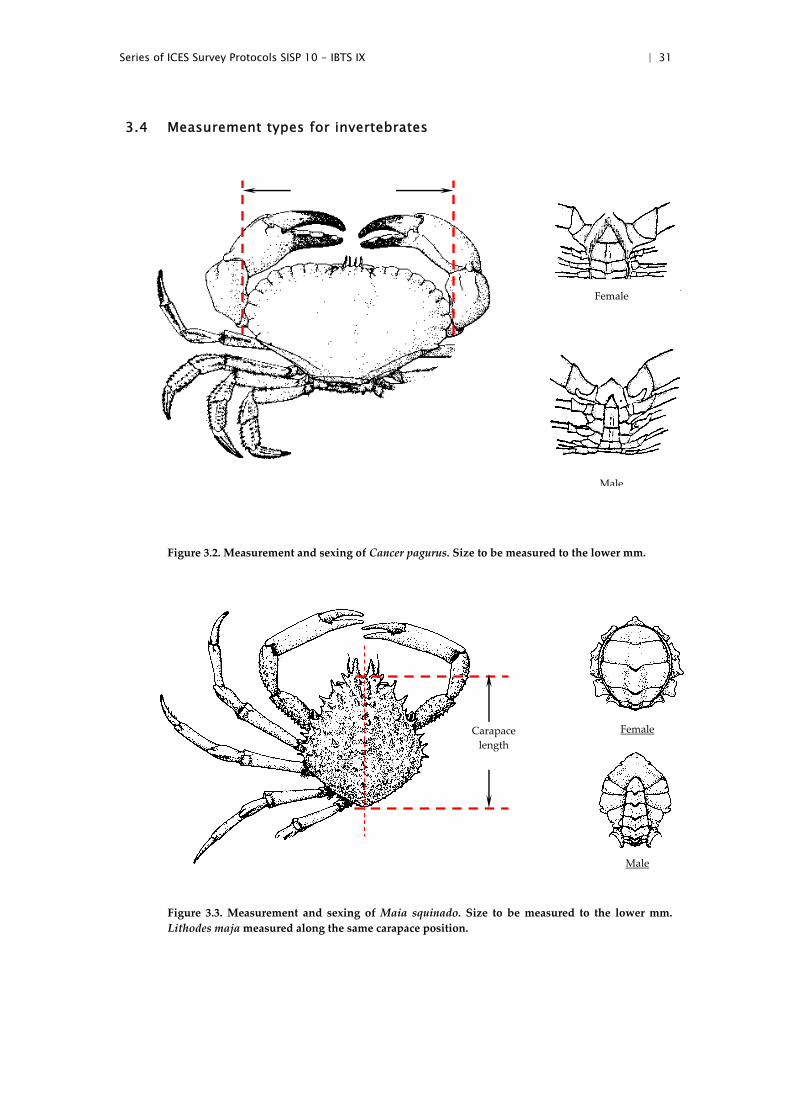
3.4 Measurement types for invertebrates
Figure 3.2. Measurement and sexing of Cancer pagurus. Size to be measured to the lower mm.
Figure 3.3. Measurement and sexing of Maia squinado. Size to be measured to the lower mm.
Lithodes maja measured along the same carapace position.
Female
Male
Female
Male
Carapace
length

32 | Series of ICES Survey Protocols SISP 10 - IBTS IX
Figure 3.4. Measurement and sexing of Nephrops norvegicus and Homarus gammarus Size to be
measured to the lower mm.
Figure 3.5. Measurement and sexing of Palinurus spp. Size to be measured to the lower mm.
Carapace length
Centre
line
Female
Male
Male
Female
Carapace length

Series of ICES Survey Protocols SISP 10 - IBTS IX | 33
Figure 3.6. Measurement of Cephalopods; mantle length to be measured to lower cm.
3.5 Measurement types for deep-water species
The majority of species encountered during the deep‐water surveys are measured to
the centimetre below using total length as the length qualifier (TL; see diagram directly
above). There are, however, some exceptions. As a result of the great variety of body
shapes of deep‐water fish species and the fragility of their tails and fins, some species
are not measured to total length. Listed below are the respective taxa, with details of
the length measurements to be collected for each. Historically, these species, if caught,
may not have been measured to this protocol and care should be taken if using data
for these species.
34 | Series of ICES Survey Protocols SISP 10 - IBTS IX
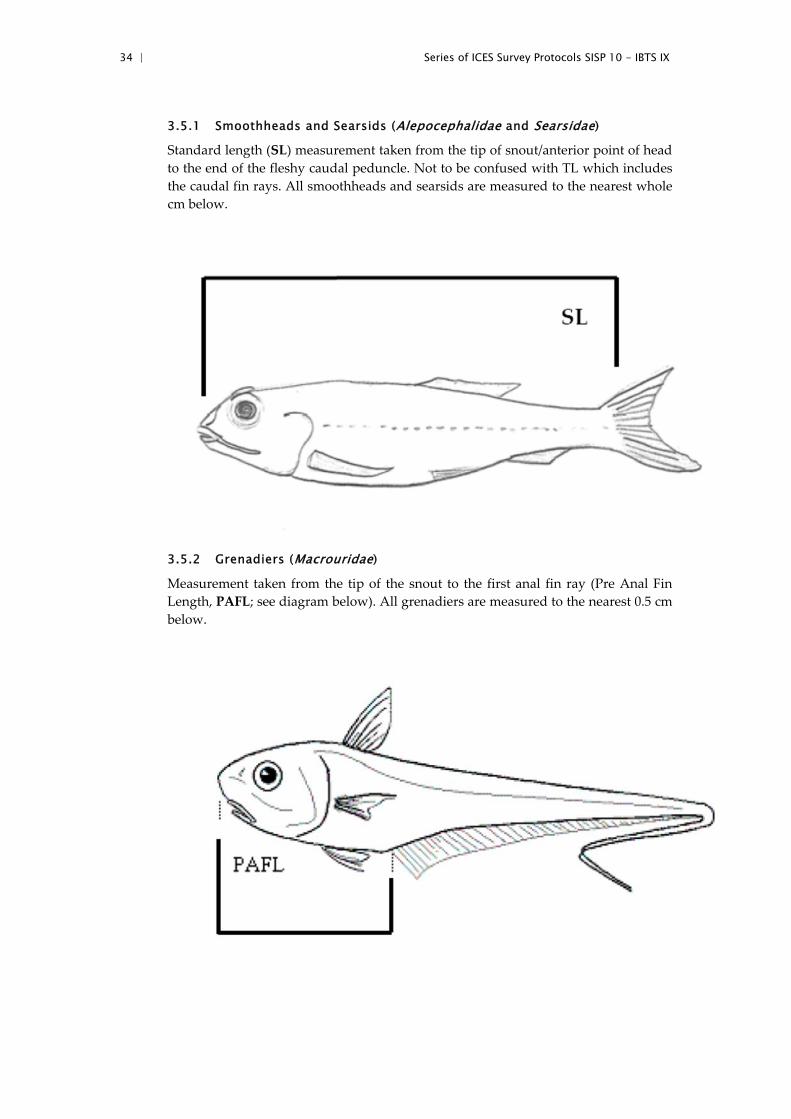
3.5.1 Smoothheads and Searsids (Alepocephalidae and Searsidae)
Standard length (SL) measurement taken from the tip of snout/anterior point of head
to the end of the fleshy caudal peduncle. Not to be confused with TL which includes
the caudal fin rays. All smoothheads and searsids are measured to the nearest whole
cm below.
3.5.2 Grenadiers (Macrouridae)
Measurement taken from the tip of the snout to the first anal fin ray (Pre Anal Fin
Length, PAFL; see diagram below). All grenadiers are measured to the nearest 0.5 cm
below.

Series of ICES Survey Protocols SISP 10 - IBTS IX | 35
3.5.3 Chimaeridae (Rabbitfish)
All Rabbitfish except Rhinochimaeridae are measured to pre‐supra caudal fin length
(PSCFL), which is from the tip of the snout to the point just before the start of the supra
caudal fin (see diagram below). All Chimaerida are measured to the nearest cm below.
3.6 Collection of marine litter from trawl Marine litter is one of the MSFD descriptors. With this in mind, from 2011, all North
Sea IBTS surveys collect data on marine litter captured in the GOV trawl. Annex 11
outlines the categories and description of the categories to be collected at each station.
Photos of litter in each trawl sample are optional, not mandatory. Once collected these
data can be sent to each institutes marine litter co‐coordinator, to be forward to ICES.
The litter data collection procedures are currently in revision, therefore, survey co‐
ordinators must ensure they are up to date with the current procedures (see ICES
website) prior to the survey.

36 | Series of ICES Survey Protocols SISP 10 - IBTS IX
4 MIK net
4.1 Q1 sampling The MIK net is midwater ring net and is the standard gear for the sampling of fish
larvae during the International Bottom Trawl Survey in the first quarter.
A separate manual on all procedures and protocols regarding the MIK sampling on
quarter 1 IBTS surveys has been developed. This is available on the ICES webpage. All
nations sampling during IBTS Q1 must follow the protocols outlined in this
documentation.
5 Environmental data
Either before or after each GOV trawl, the following minimum hydrographical data
are to be collected:
surface temperature
bottom temperature
surface salinity
bottom salinity
When using a CTD‐probe for measuring temperature and salinity, an appropriate
calibration should be undertaken.
Participants are recommended to collect nutrient samples during the International
Bottom Trawl Survey in the first quarter. For further specifications, they should contact
the ICES Data Centre.
Since 1992 the following additional environmental data are sought:
surface current direction
surface current speed
bottom current direction
bottom current speed
wind direction
windspeed
swell direction
swell height
The above parameters, if collected, are reported in the ‘Haul Information file HH’
(Annex 12).

Series of ICES Survey Protocols SISP 10 - IBTS IX | 37
6 Exchange specifications for IBTS data
Three distinct types of computer records have been defined for standard storage of the
IBTS data:
Type 1: HH – Record with detailed haul information (Annex 12)
Type 2: HL – Length frequency data (Annex 13)
Type 3: CA – Sex‐maturity‐age–length keys (SMALK; Annex 14)
The summaries of the formats of these record types are given in the appendices and
detailed descriptions can also be found at the ICES web page:
http://www.ices.dk/datacentre/datsu/selrep.asp.
Provisional data obtained from the North Sea and Skagerrak/Kattegat should be
submitted to the quarterly coordinator as soon as possible after completion of the
cruise. Annex 15 lists the sampling areas and standard areas for the calculation of
abundance indices (using Figures 6.1 to 6.4 and A2.2 for guidance) and Annex 16 lists
the length splits for the various target species. Final data should only be submitted to
the ICES Data Centre after the national institute has checked the data; data are further
checked using official checking programs issued by ICES within DATRAS, but
institutes must instigate their own data checking routines and not rely solely on those
within DATRAS.
NB: Details of environmental data should be submitted to the ICES Data Centre
according to established procedures. The national hydrographic station number must
be reported in Record Type 1 to allow the link to be made between haul data and
environmental data.

38 | Series of ICES Survey Protocols SISP 10 - IBTS IX
Figure 6.1. Standard Roundfish Areas used for roundfish since 1980, for all standard species since
1991. Additional RFA 10 was added in 2009. Application of the roundfish areas is described in the
document: NS‐IBTS indices calculation procedure (2013), available at: http://www.ices.dk/marine‐
data/Documents/DATRAS/Indices_Calculation_Steps_IBTS.pdf.
4° 2° 0° 2° 4° 6° 8° 10° 12°
49°
50°
51°
52°
53°
54°
55°
56°
57°
58°
59°
60°
61°
62°
29
30
31
32
33
34
35
36
37
38
39
40
41
42
43
44
45
46
47
48
49
50
51
52
E5 E6 E7 E8 E9 F0 F1 F2 F3 F4 F5 F6 F7 F8 F9 G0 G1 G2
1
3
2
4
5
6
7
8
9
1028
27
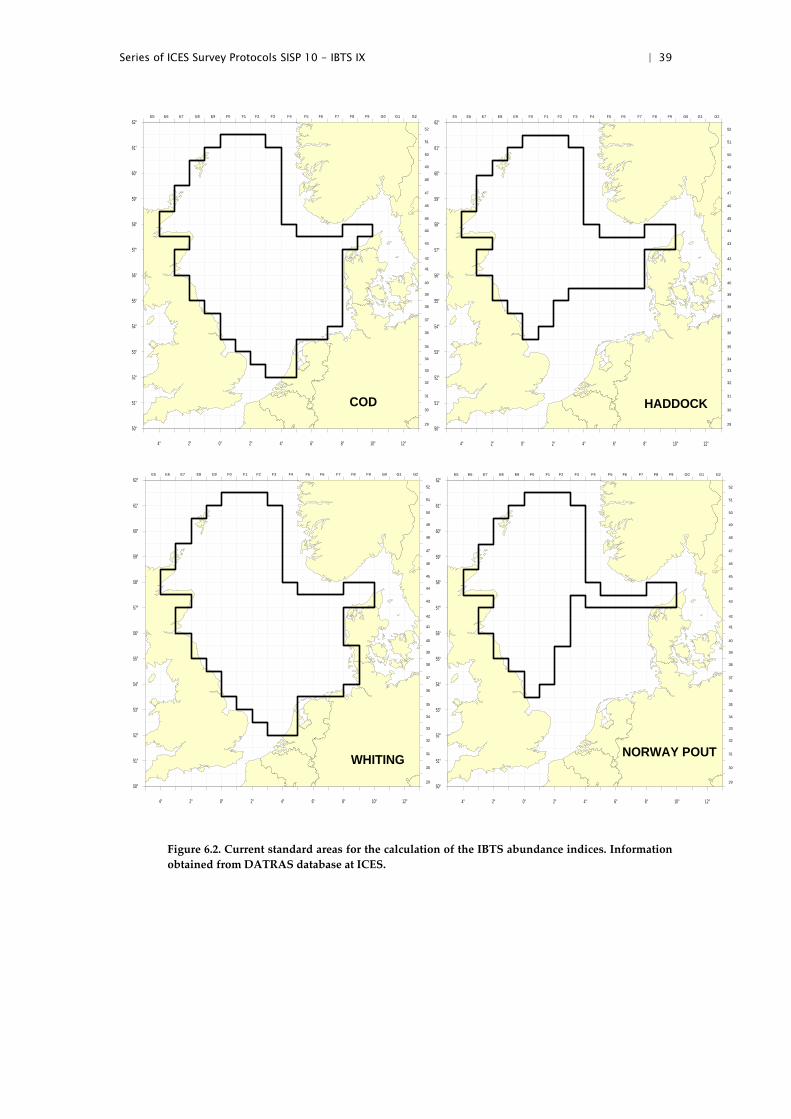
Series of ICES Survey Protocols SISP 10 - IBTS IX | 39
Figure 6.2. Current standard areas for the calculation of the IBTS abundance indices. Information
obtained from DATRAS database at ICES.
4° 2° 0° 2° 4° 6° 8° 10° 12°
50°
51°
52°
53°
54°
55°
56°
57°
58°
59°
60°
61°
62°
29
30
31
32
33
34
35
36
37
38
39
40
41
42
43
44
45
46
47
48
49
50
51
52
E5 E6 E7 E8 E9 F0 F1 F2 F3 F4 F5 F6 F7 F8 F9 G0 G1 G2
COD
4° 2° 0° 2° 4° 6° 8° 10° 12°
50°
51°
52°
53°
54°
55°
56°
57°
58°
59°
60°
61°
62°
29
30
31
32
33
34
35
36
37
38
39
40
41
42
43
44
45
46
47
48
49
50
51
52
E5 E6 E7 E8 E9 F0 F1 F2 F3 F4 F5 F6 F7 F8 F9 G0 G1 G2
HADDOCK
4° 2° 0° 2° 4° 6° 8° 10° 12°
50°
51°
52°
53°
54°
55°
56°
57°
58°
59°
60°
61°
62°
29
30
31
32
33
34
35
36
37
38
39
40
41
42
43
44
45
46
47
48
49
50
51
52
E5 E6 E7 E8 E9 F0 F1 F2 F3 F4 F5 F6 F7 F8 F9 G0 G1 G2
WHITING
4° 2° 0° 2° 4° 6° 8° 10° 12°
50°
51°
52°
53°
54°
55°
56°
57°
58°
59°
60°
61°
62°
29
30
31
32
33
34
35
36
37
38
39
40
41
42
43
44
45
46
47
48
49
50
51
52
E5 E6 E7 E8 E9 F0 F1 F2 F3 F4 F5 F6 F7 F8 F9 G0 G1 G2
NORWAY POUT
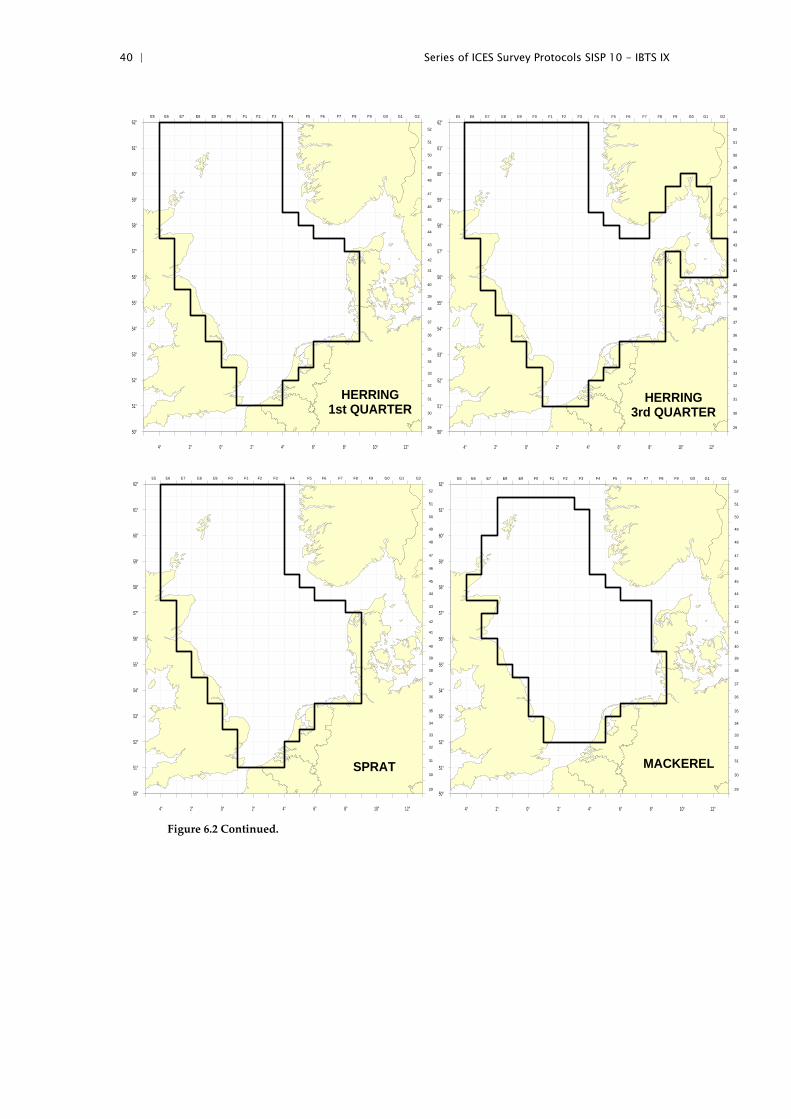
40 | Series of ICES Survey Protocols SISP 10 - IBTS IX
Figure 6.2 Continued.
4° 2° 0° 2° 4° 6° 8° 10° 12°
50°
51°
52°
53°
54°
55°
56°
57°
58°
59°
60°
61°
62°
29
30
31
32
33
34
35
36
37
38
39
40
41
42
43
44
45
46
47
48
49
50
51
52
E5 E6 E7 E8 E9 F0 F1 F2 F3 F4 F5 F6 F7 F8 F9 G0 G1 G2
HERRING1st QUARTER
4° 2° 0° 2° 4° 6° 8° 10° 12°
50°
51°
52°
53°
54°
55°
56°
57°
58°
59°
60°
61°
62°
29
30
31
32
33
34
35
36
37
38
39
40
41
42
43
44
45
46
47
48
49
50
51
52
E5 E6 E7 E8 E9 F0 F1 F2 F3 F4 F5 F6 F7 F8 F9 G0 G1 G2
HERRING3rd QUARTER
4° 2° 0° 2° 4° 6° 8° 10° 12°
50°
51°
52°
53°
54°
55°
56°
57°
58°
59°
60°
61°
62°
29
30
31
32
33
34
35
36
37
38
39
40
41
42
43
44
45
46
47
48
49
50
51
52
E5 E6 E7 E8 E9 F0 F1 F2 F3 F4 F5 F6 F7 F8 F9 G0 G1 G2
SPRAT
4° 2° 0° 2° 4° 6° 8° 10° 12°
50°
51°
52°
53°
54°
55°
56°
57°
58°
59°
60°
61°
62°
29
30
31
32
33
34
35
36
37
38
39
40
41
42
43
44
45
46
47
48
49
50
51
52
E5 E6 E7 E8 E9 F0 F1 F2 F3 F4 F5 F6 F7 F8 F9 G0 G1 G2
MACKEREL
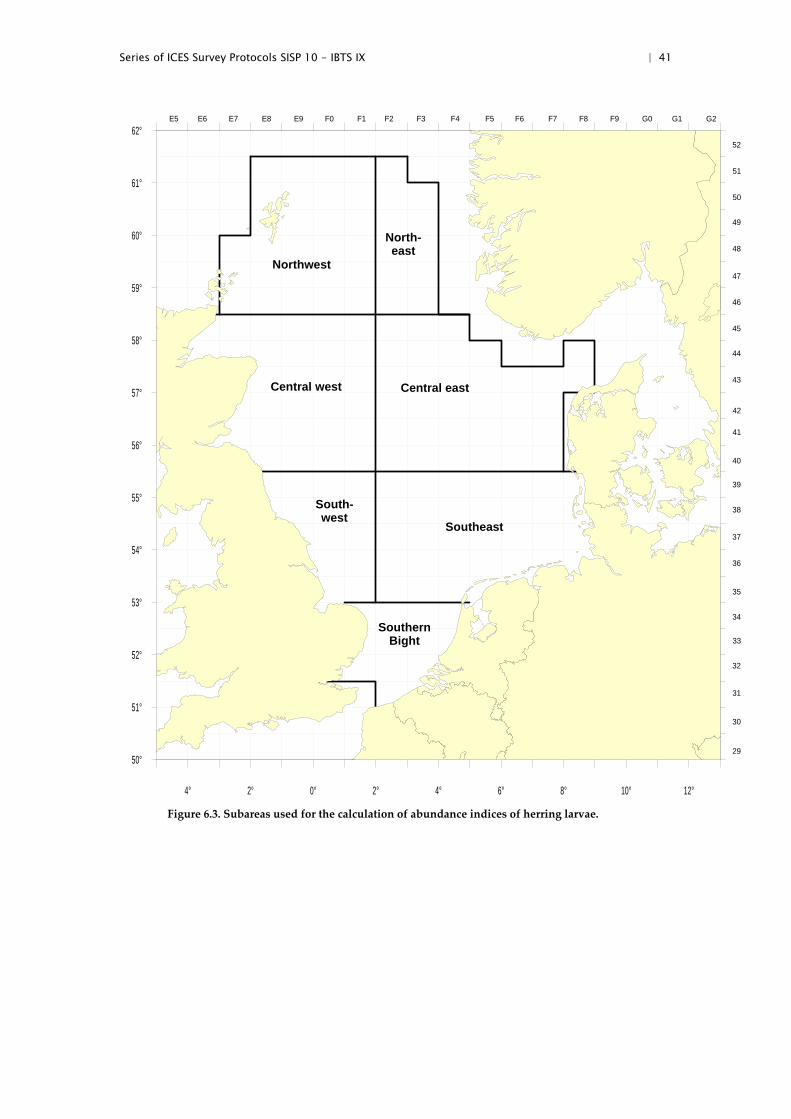
Series of ICES Survey Protocols SISP 10 - IBTS IX | 41
Figure 6.3. Subareas used for the calculation of abundance indices of herring larvae.
4° 2° 0° 2° 4° 6° 8° 10° 12°
50°
51°
52°
53°
54°
55°
56°
57°
58°
59°
60°
61°
62°
29
30
31
32
33
34
35
36
37
38
39
40
41
42
43
44
45
46
47
48
49
50
51
52
E5 E6 E7 E8 E9 F0 F1 F2 F3 F4 F5 F6 F7 F8 F9 G0 G1 G2
SouthernBight
Southeast
South-west
Central west Central east
North-east
Northwest
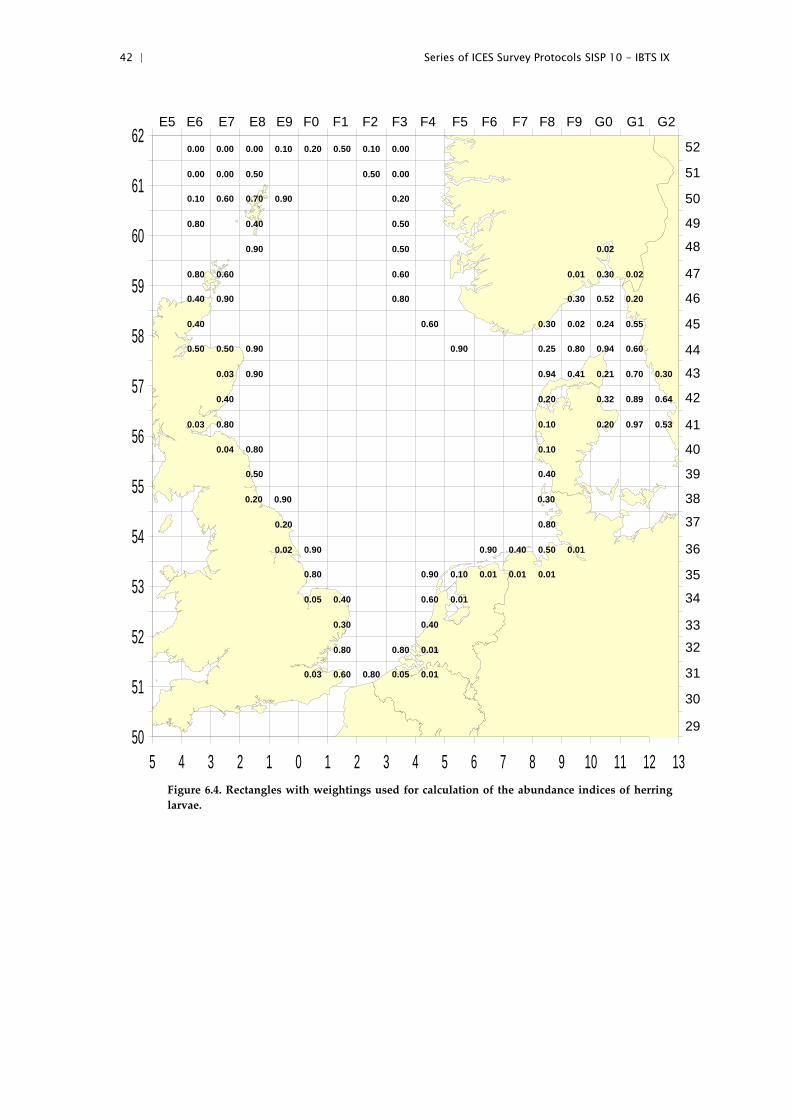
42 | Series of ICES Survey Protocols SISP 10 - IBTS IX
Figure 6.4. Rectangles with weightings used for calculation of the abundance indices of herring
larvae.
5 4 3 2 1 0 1 2 3 4 5 6 7 8 9 10 11 12 1350
51
52
53
54
55
56
57
58
59
60
61
62
29
30
31
32
33
34
35
36
37
38
39
40
41
42
43
44
45
46
47
48
49
50
51
52
E5 E6 E7 E8 E9 F0 F1 F2 F3 F4 F5 F6 F7 F8 F9 G0 G1 G2
0.03 0.60 0.80 0.05 0.01
0.80 0.80 0.01
0.30 0.40
0.05 0.40 0.60 0.01
0.80 0.90 0.10 0.01 0.01 0.01
0.02 0.90 0.90 0.40 0.50 0.01
0.20 0.80
0.40 0.60 0.30 0.02 0.24 0.55
0.900.40 0.80 0.30 0.52 0.20
0.600.80 0.60 0.01 0.30 0.02
0.90 0.50 0.02
0.400.80 0.50
0.900.700.600.10 0.20
0.500.000.00 0.50 0.00
0.10 0.200.000.000.00 0.50 0.10 0.00
0.900.20 0.30
0.50 0.40
0.800.04 0.10
0.800.03 0.10 0.20 0.97 0.53
0.40 0.20 0.32 0.89 0.64
0.900.03 0.94 0.41 0.21 0.70 0.30
0.900.500.50 0.90 0.25 0.80 0.94 0.60
Series of ICES Survey Protocols SISP 10 - IBTS IX | 43
7 References
Heessen, H., Dalskov, J., Cook, R. M. 1997. The International Bottom Trawl survey in the North
Sea, the Skagerrak and Kattegat. ICES, Copenhagen (Denmark). ICES CM 1997/Y:31, 25 pp.
ICES. 1963. International Young Herring Surveys. Report of Working Group meeting in
IJmuiden, 26–27 March, 1963. ICES CM 1963/Herring Committee: 101.
ICES. 1974. Report of the Working Group on North Sea Young Herring Surveys. ICES CM
1974/H:6.
ICES. 1977. Report of the Working Group on North Sea Young Herring Surveys. ICES CM
1977/H:11.
ICES. 1981a. Manual for the International Young Fish Surveys in the North Sea, Skagerrak and
Kattegat. ICES CM 1981/H:9.
ICES. 1981b. Report of the Joint meeting of the International Young Herring Survey. Working
Group and the International Gadoid Survey Working Group. IJmuiden, 12–14 May, 1981.
ICES CM 1981/H:10.
ICES. 1990. Report of the International North Sea, Skagerrak, and Kattegat Bottom Trawl Survey
Working Group. ICES CM 1990/H:3.
ICES. 1992. Report of the International Bottom Trawl Survey Working Group. ICES CM
1992/H:3. 21 pp.
ICES. 1996. Report of the International Bottom Trawl Survey Working Group. ICES CM
1996/H:1.
ICES. 2002. Report of the International Bottom Trawl Survey Working Group. ICES CM
2002/D:03.
ICES. 2006. Manual for the International Bottom Trawl Surveys. Revision VII, ICES CM
2006/RMC:03.
ICES. 2012a. Report of the Workshop on Sexual Maturity Staging of sole, plaice, dab and
flounder, ICES CM 2012/ACOM:50.
ICES. 2012b. Manual for the International Bottom Trawl Surveys. Series of ICES Survey
Protocols. SISP 1‐IBTS VIII. 68 pp.
ICES. 2012c. Manual for the Midwater Ring Net sampling during IBTS Q1. Revision 1. 16 p.
ICES. 2013. Manual for the Midwater Ring Net sampling during IBTS Q1. Series of ICES Survey
Protocols. SISP 2‐MIK 2. 18 pp.

44 | Series of ICES Survey Protocols SISP 10 - IBTS IX
Annex 1: Current rectangle allocation between nations
The current quarter 1 allocation of the different nations is shown in Figures A1.1 to
A1.8, while the quarter 3 surveys are in Figures A1.9 to A1.15.
Figure A1.1. IBTS Quarter 1 Proposed Survey Grid all participants. Applied from 2013.
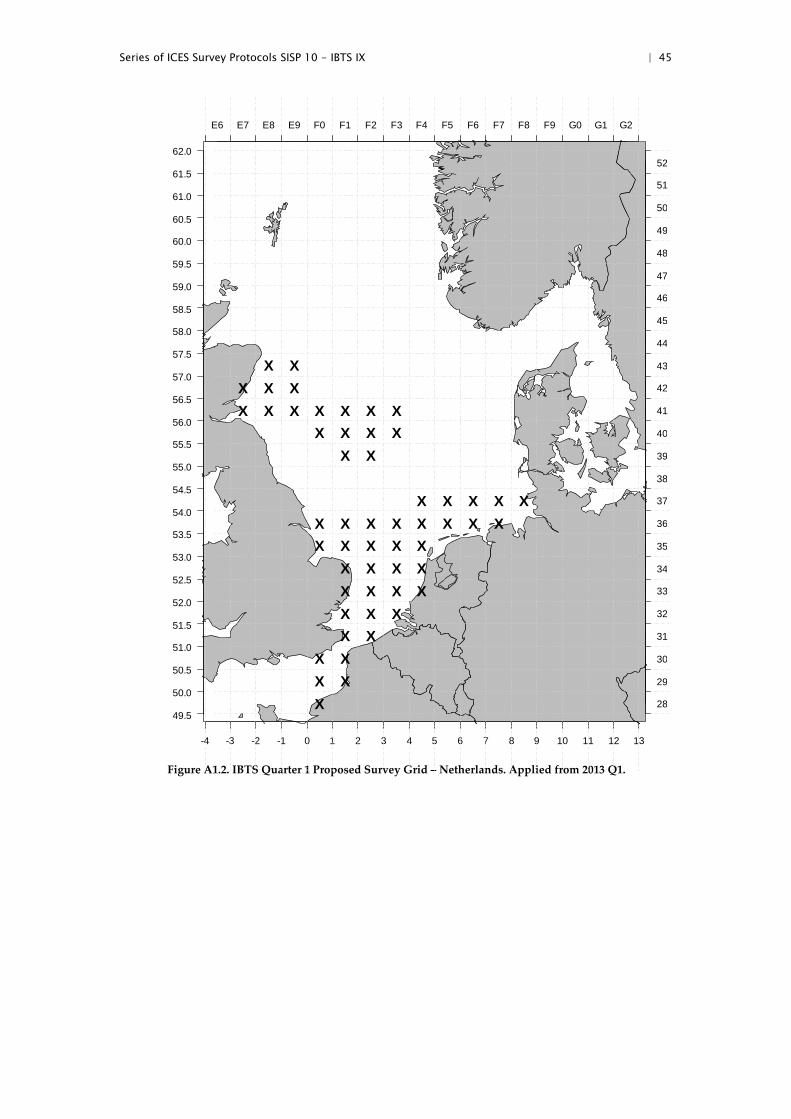
Series of ICES Survey Protocols SISP 10 - IBTS IX | 45
Figure A1.2. IBTS Quarter 1 Proposed Survey Grid – Netherlands. Applied from 2013 Q1.
-4 -3 -2 -1 0 1 2 3 4 5 6 7 8 9 10 11 12 13
49.5
50.0
50.5
51.0
51.5
52.0
52.5
53.0
53.5
54.0
54.5
55.0
55.5
56.0
56.5
57.0
57.5
58.0
58.5
59.0
59.5
60.0
60.5
61.0
61.5
62.0
28
29
30
31
32
33
34
35
36
37
38
39
40
41
42
43
44
45
46
47
48
49
50
51
52
E6 E7 E8 E9 F0 F1 F2 F3 F4 F5 F6 F7 F8 F9 G0 G1 G2
X X
X X X
X X X X X X X
X X X X
X X
X X X X X
X X X X X X X X
X X X X X
X X X X
X X X X
X X X
X X
X X
X X
X
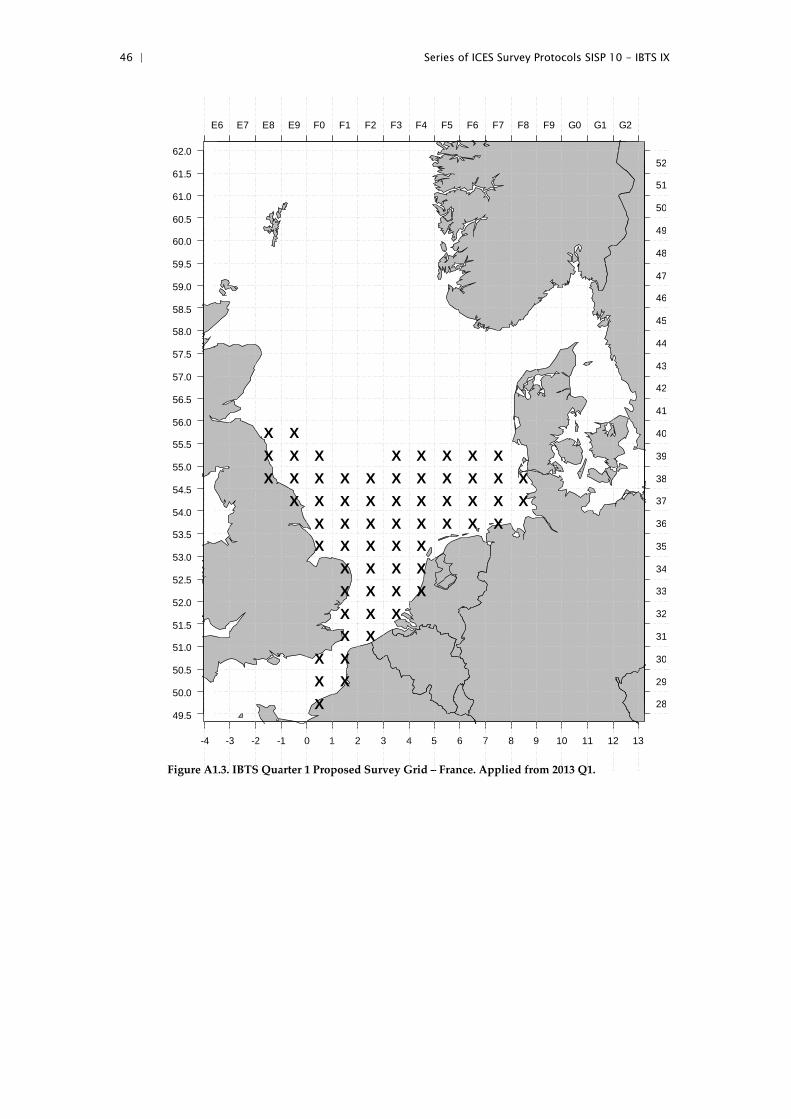
46 | Series of ICES Survey Protocols SISP 10 - IBTS IX
Figure A1.3. IBTS Quarter 1 Proposed Survey Grid – France. Applied from 2013 Q1.
-4 -3 -2 -1 0 1 2 3 4 5 6 7 8 9 10 11 12 13
49.5
50.0
50.5
51.0
51.5
52.0
52.5
53.0
53.5
54.0
54.5
55.0
55.5
56.0
56.5
57.0
57.5
58.0
58.5
59.0
59.5
60.0
60.5
61.0
61.5
62.0
28
29
30
31
32
33
34
35
36
37
38
39
40
41
42
43
44
45
46
47
48
49
50
51
52
E6 E7 E8 E9 F0 F1 F2 F3 F4 F5 F6 F7 F8 F9 G0 G1 G2
X
X X
X X
X X
X X X
X X X X
X X X X
X X X X X
X X X X X X X X
X X X X X X X X X X
X X X X X X X X X X X
X X X X X X X X
X X
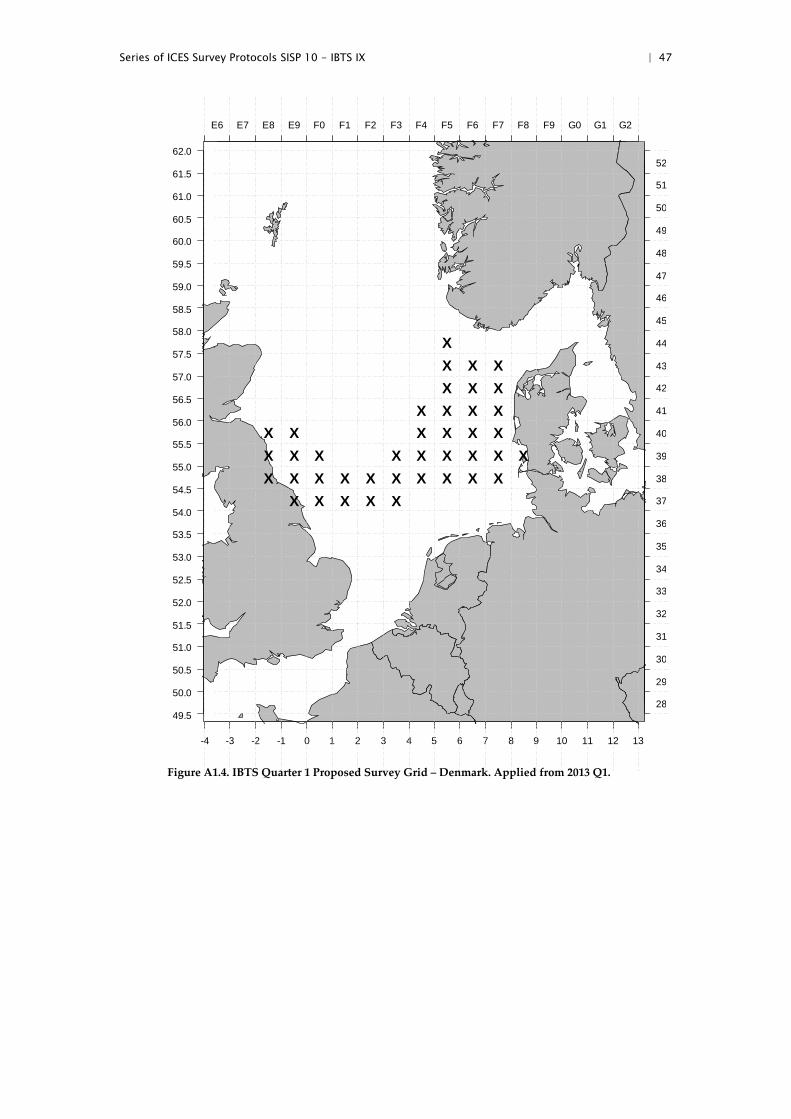
Series of ICES Survey Protocols SISP 10 - IBTS IX | 47
Figure A1.4. IBTS Quarter 1 Proposed Survey Grid – Denmark. Applied from 2013 Q1.
-4 -3 -2 -1 0 1 2 3 4 5 6 7 8 9 10 11 12 13
49.5
50.0
50.5
51.0
51.5
52.0
52.5
53.0
53.5
54.0
54.5
55.0
55.5
56.0
56.5
57.0
57.5
58.0
58.5
59.0
59.5
60.0
60.5
61.0
61.5
62.0
28
29
30
31
32
33
34
35
36
37
38
39
40
41
42
43
44
45
46
47
48
49
50
51
52
E6 E7 E8 E9 F0 F1 F2 F3 F4 F5 F6 F7 F8 F9 G0 G1 G2
X
X X X
X X X
X X X X
X X X X X X
X X X X X X X X X
X X X X X X X X X X
X X X X X
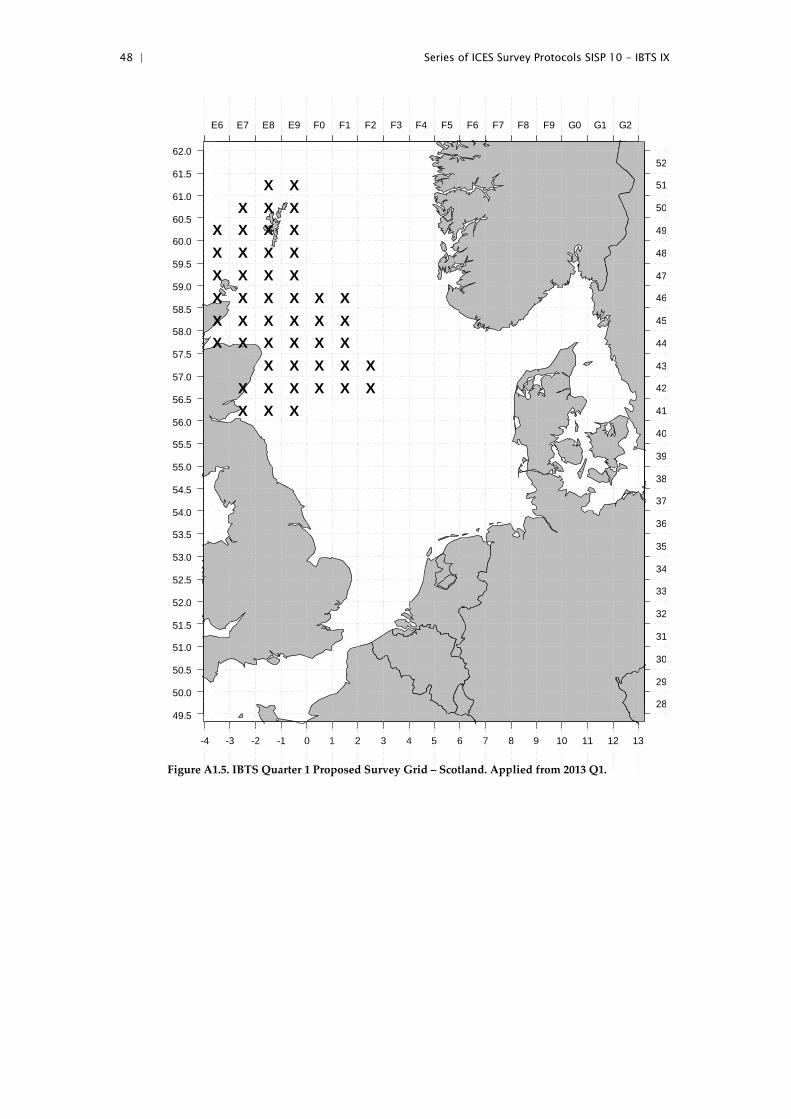
48 | Series of ICES Survey Protocols SISP 10 - IBTS IX
Figure A1.5. IBTS Quarter 1 Proposed Survey Grid – Scotland. Applied from 2013 Q1.
-4 -3 -2 -1 0 1 2 3 4 5 6 7 8 9 10 11 12 13
49.5
50.0
50.5
51.0
51.5
52.0
52.5
53.0
53.5
54.0
54.5
55.0
55.5
56.0
56.5
57.0
57.5
58.0
58.5
59.0
59.5
60.0
60.5
61.0
61.5
62.0
28
29
30
31
32
33
34
35
36
37
38
39
40
41
42
43
44
45
46
47
48
49
50
51
52
E6 E7 E8 E9 F0 F1 F2 F3 F4 F5 F6 F7 F8 F9 G0 G1 G2
X X
X X X
X X X X
X X X X
X X X X
X X X X X X
X X X X X X
X X X X X X
X X X X X
X X X X X X
X X X

Series of ICES Survey Protocols SISP 10 - IBTS IX | 49
Figure A1.6. IBTS Quarter 1 Proposed Survey Grid – Germany. Applied from 2013 Q1.
-4 -3 -2 -1 0 1 2 3 4 5 6 7 8 9 10 11 12 13
49.5
50.0
50.5
51.0
51.5
52.0
52.5
53.0
53.5
54.0
54.5
55.0
55.5
56.0
56.5
57.0
57.5
58.0
58.5
59.0
59.5
60.0
60.5
61.0
61.5
62.0
28
29
30
31
32
33
34
35
36
37
38
39
40
41
42
43
44
45
46
47
48
49
50
51
52
E6 E7 E8 E9 F0 F1 F2 F3 F4 F5 F6 F7 F8 F9 G0 G1 G2
X X X
X X X X
X X X X
X X X X X X
X X X X X X
X X X X X X X
X X X X X X X X X
X X X X X X X X X
X X X X X
X X X X X
X X X X X X X X
X X X X X X X X
X X
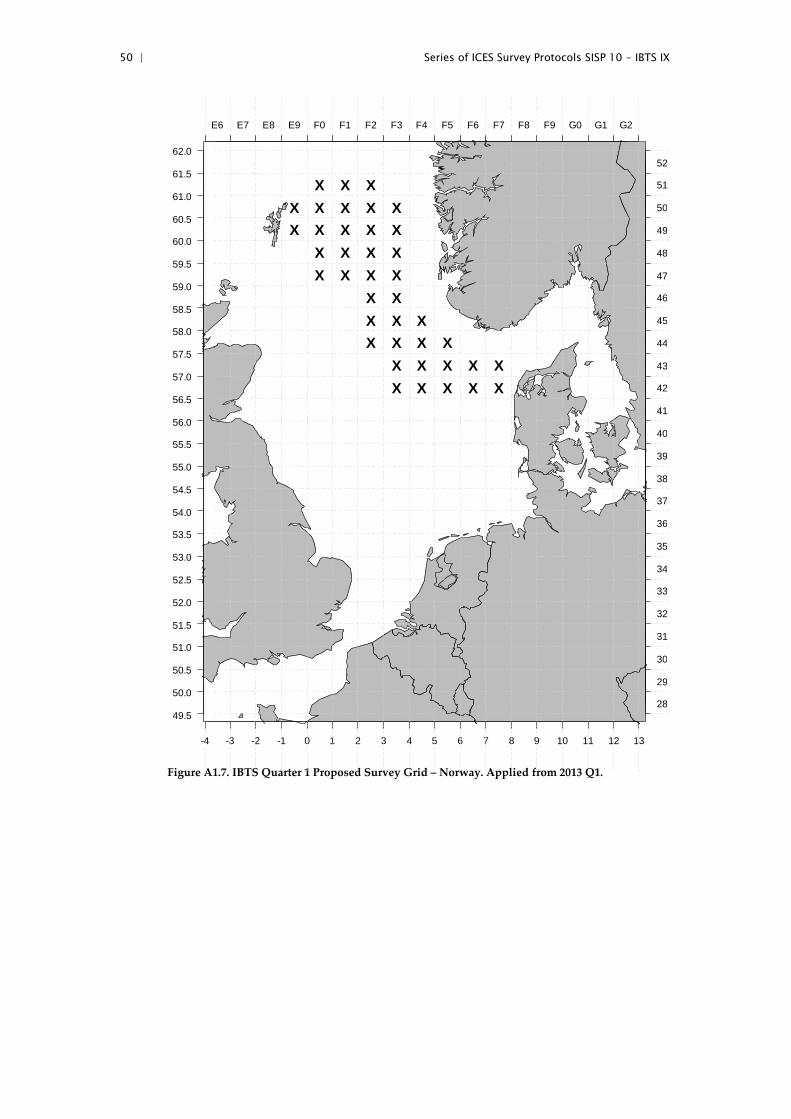
50 | Series of ICES Survey Protocols SISP 10 - IBTS IX
Figure A1.7. IBTS Quarter 1 Proposed Survey Grid – Norway. Applied from 2013 Q1.
-4 -3 -2 -1 0 1 2 3 4 5 6 7 8 9 10 11 12 13
49.5
50.0
50.5
51.0
51.5
52.0
52.5
53.0
53.5
54.0
54.5
55.0
55.5
56.0
56.5
57.0
57.5
58.0
58.5
59.0
59.5
60.0
60.5
61.0
61.5
62.0
28
29
30
31
32
33
34
35
36
37
38
39
40
41
42
43
44
45
46
47
48
49
50
51
52
E6 E7 E8 E9 F0 F1 F2 F3 F4 F5 F6 F7 F8 F9 G0 G1 G2
X X X
X X X X X
X X X X X
X X X X
X X X X
X X
X X X
X X X X
X X X X X
X X X X X

Series of ICES Survey Protocols SISP 10 - IBTS IX | 51
Figure A1.8. IBTS Quarter 1 Proposed Survey Grid – Sweden. Applied from 2013 Q1.
-4 -3 -2 -1 0 1 2 3 4 5 6 7 8 9 10 11 12 13
49.5
50.0
50.5
51.0
51.5
52.0
52.5
53.0
53.5
54.0
54.5
55.0
55.5
56.0
56.5
57.0
57.5
58.0
58.5
59.0
59.5
60.0
60.5
61.0
61.5
62.0
28
29
30
31
32
33
34
35
36
37
38
39
40
41
42
43
44
45
46
47
48
49
50
51
52
E6 E7 E8 E9 F0 F1 F2 F3 F4 F5 F6 F7 F8 F9 G0 G1 G2
X
X X X
X X X X
X X X X
X X X X
X X
X X X
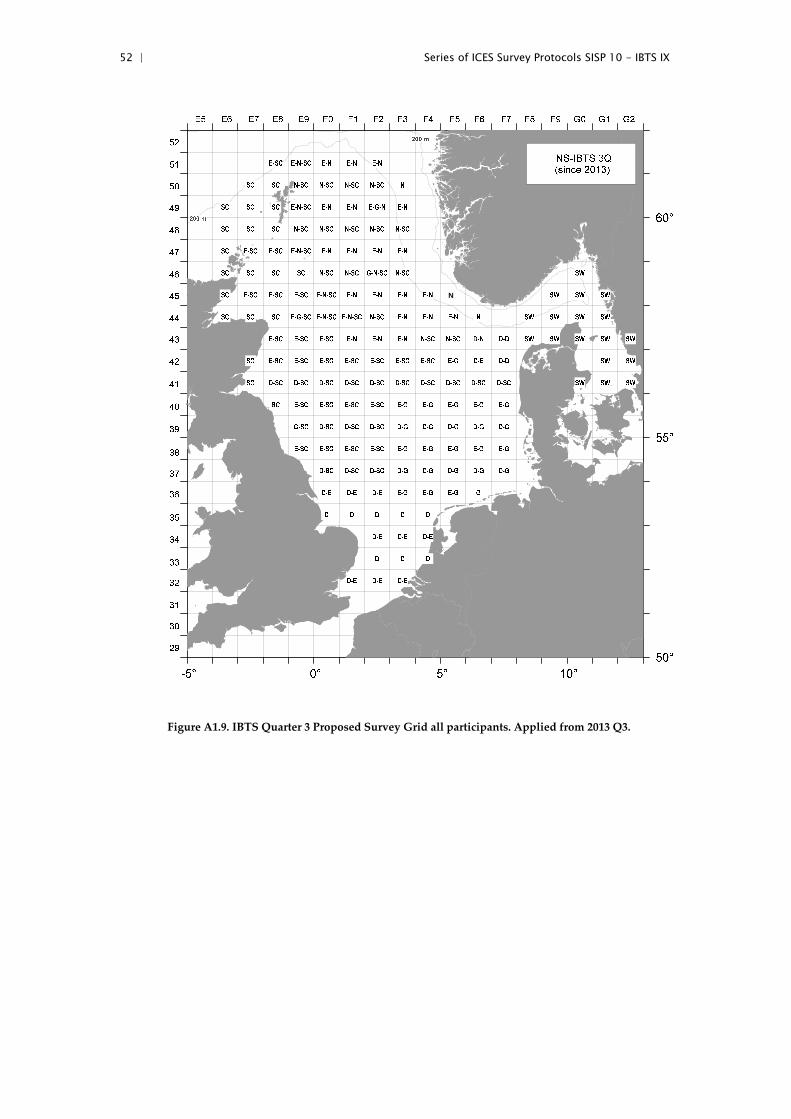
52 | Series of ICES Survey Protocols SISP 10 - IBTS IX
Figure A1.9. IBTS Quarter 3 Proposed Survey Grid all participants. Applied from 2013 Q3.
N

Series of ICES Survey Protocols SISP 10 - IBTS IX | 53
Figure A1.10. IBTS Quarter 3 Proposed Survey Grid – Denmark. Applied from 2005 Q3.
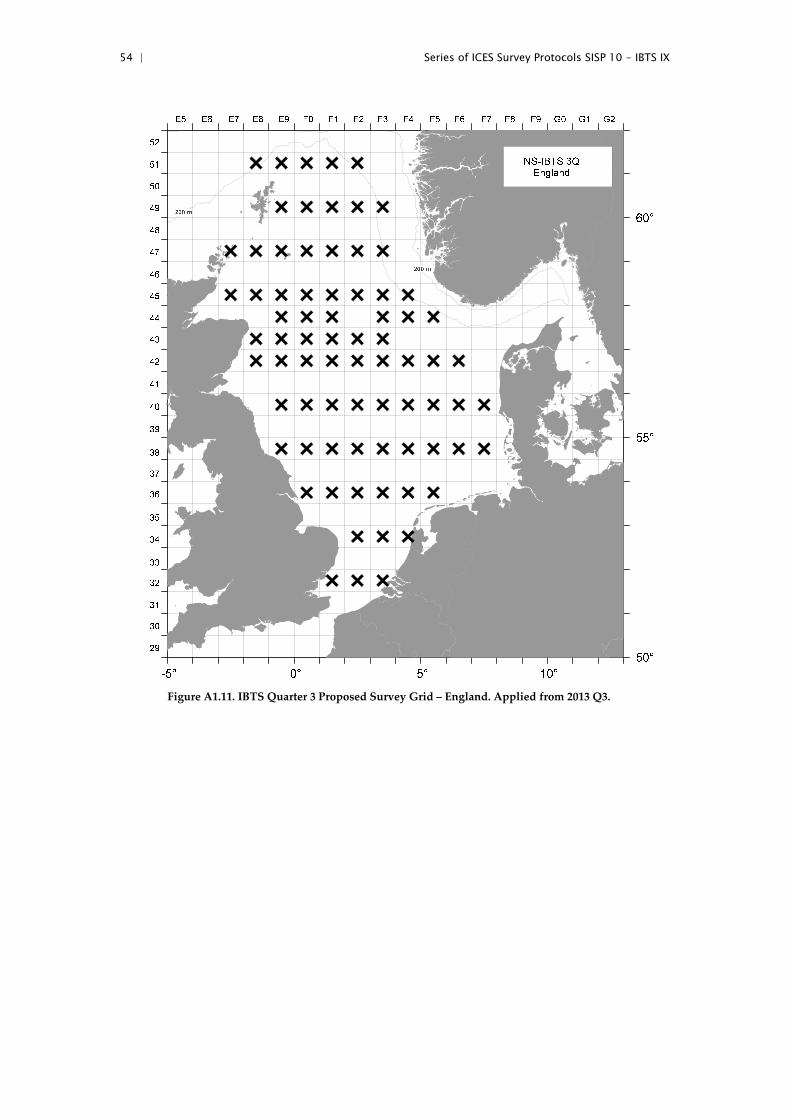
54 | Series of ICES Survey Protocols SISP 10 - IBTS IX
Figure A1.11. IBTS Quarter 3 Proposed Survey Grid – England. Applied from 2013 Q3.
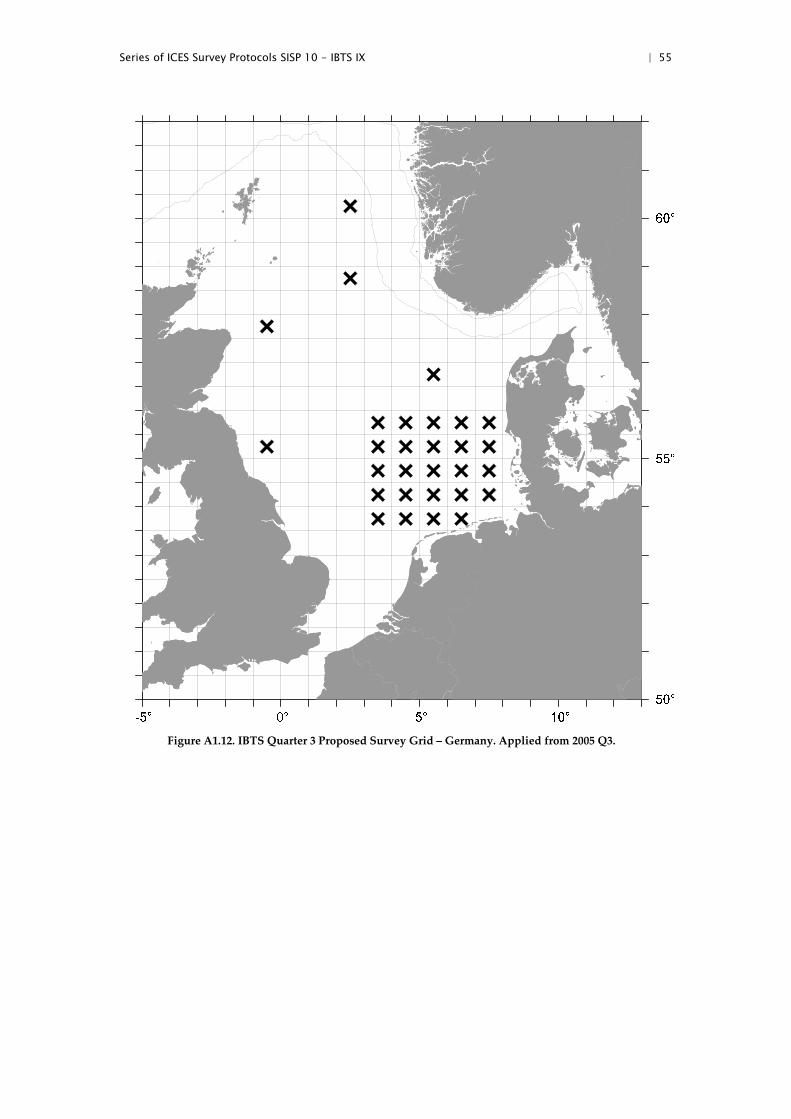
Series of ICES Survey Protocols SISP 10 - IBTS IX | 55
Figure A1.12. IBTS Quarter 3 Proposed Survey Grid – Germany. Applied from 2005 Q3.
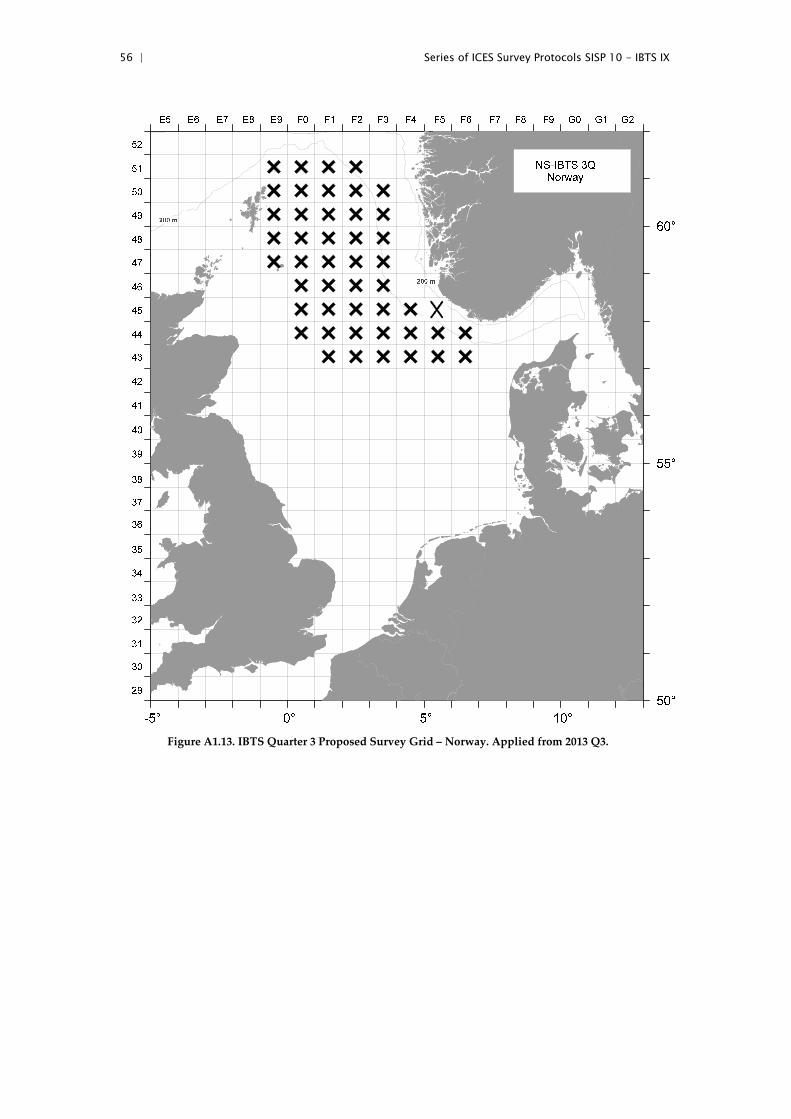
56 | Series of ICES Survey Protocols SISP 10 - IBTS IX
Figure A1.13. IBTS Quarter 3 Proposed Survey Grid – Norway. Applied from 2013 Q3.

Series of ICES Survey Protocols SISP 10 - IBTS IX | 57
Figure A1.14. IBTS Quarter 3 2004 Proposed Survey Grid – Scotland. Applied from 2011 Q3.
-5° 0° 5° 10°50°
55°
60°
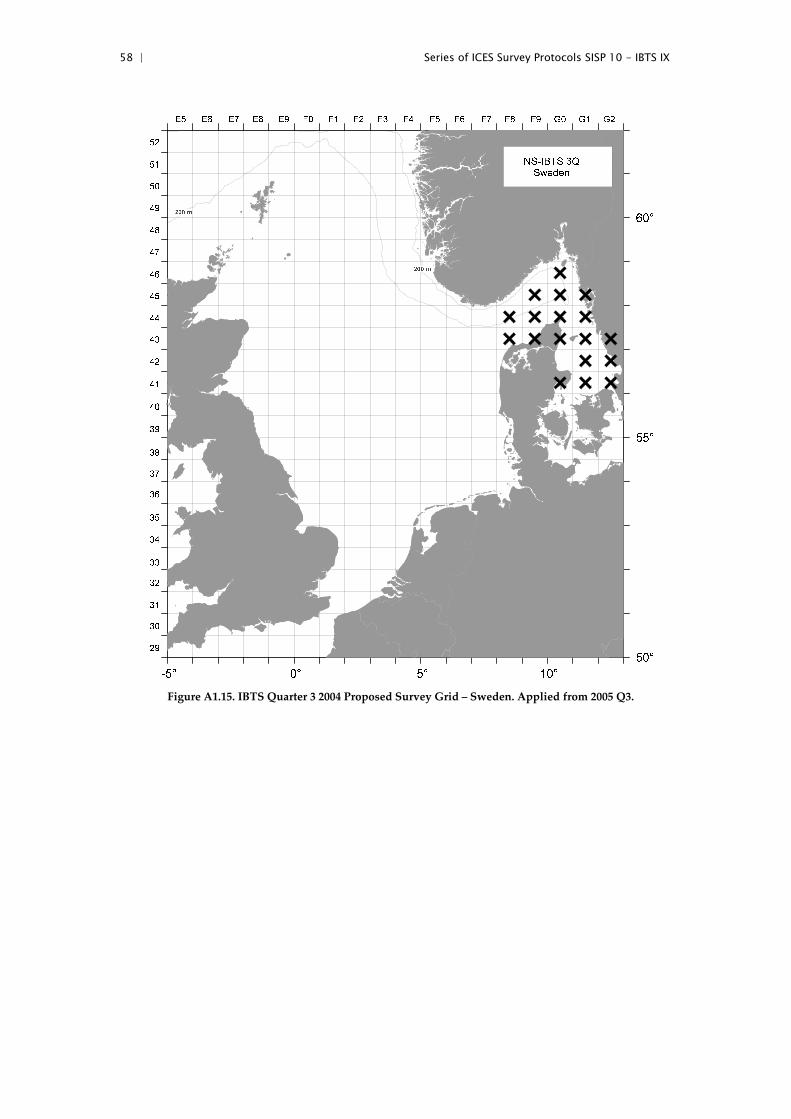
58 | Series of ICES Survey Protocols SISP 10 - IBTS IX
Figure A1.15. IBTS Quarter 3 2004 Proposed Survey Grid – Sweden. Applied from 2005 Q3.

Series of ICES Survey Protocols SISP 10 - IBTS IX | 59
Annex 2: History of the IBTSWG survey and manual
History of the survey
Objectives and procedures
The following account has been adapted from Heessen et al. (1997).
In the spring and autumn of the years 1960 and 1961, a series of four large international
research vessel trawl surveys were organized under the auspices of ICES to map the
distribution of juvenile herring Clupea harengus in the North Sea and to investigate the
links between herring nursery grounds and the adult populations (ICES, 1963).
In the following years, most of the countries participating in the former exercise
continued similar surveys. From 1966 onwards these surveys were conducted annually
with the objective of obtaining annual recruitment indices for the combined North Sea
herring stocks. Gradually, more countries started to participate in the survey, which
was named the International Young Herring Survey (IYHS). For the first few years,
sampling was restricted to the southern and central North Sea and, beginning in 1969,
the Skagerrak and Kattegat.
Although the emphasis from the start of the surveys focused mainly on herring, data
collected for whiting Merlangius merlangus were also analysed. In the course of the
1970s it was realized that the IYHS could provide recruitment indices not only for
herring, but also for roundfish species such as cod Gadus morhua, haddock
Melanogrammus aeglefinus, and whiting. This growing interest resulted in a northwards
extension of the survey area to cover more of the known distribution of juvenile
haddock in the North Sea, as well as that of Norway pout Trisopterus esmarkii. The
whole North Sea, Skagerrak, and Kattegat have been surveyed since 1974.
In 1981, the survey was renamed the International Young Fish Survey (IYFS), the first
manual was produced (ICES, 1981b), and, in 1984, the ICES ‘Working Group on Young
Herring Surveys’ and the “Gadoid 1‐Group Working Group” were combined to form
the International Young Fish Survey Working Group.
In 1990, the IYFS Working Group evaluated the usefulness of a number of bottom‐trawl
surveys in the North Sea, Skagerrak, and Kattegat (ICES, 1990). Apart from the
international IYFS, these surveys were comprised of at least seven national surveys.
The IYFS WG proposed to combine the IYFS and the national surveys in Quarterly
Coordinated Surveys in the North Sea, Skagerrak, and Kattegat, which were to be
called the International Bottom Trawl Surveys (IBTS). It was recommended that
quarterly surveys should run for a period of five years. These surveys should provide
a full description of the seasonal distribution of the stocks sampled, which was
considered urgently necessary for the further improvement of multispecies
assessments and the development of spatially disaggregated assessment models.
This proposal resulted in a series of six years with quarterly surveys, which, with a few
exceptions, covered the whole survey area in the North Sea, Skagerrak, and Kattegat
(ICES, 1996). Subsequently, it has proved impossible to maintain these high levels of
research vessel effort, especially as research budgets have decreased in most countries
and, from 1997, the majority of countries have only carried out a survey twice a year; a
first quarter survey (January‐February) and a third quarter survey (August‐
September).

60 | Series of ICES Survey Protocols SISP 10 - IBTS IX
Table A2.1 shows the timeline of significant events in the history of the IBTS and table
A2.2 shows the history of the how the surveys have been carried out.
Having evolved from a herring survey, where only pelagic data were collected, the
IBTS survey dataset is now made up of data collected on all finfish species. However,
this current level of sampling has evolved gradually. In the manual revision VI,
sampling was defined by two groups, ‘standard’ and ‘closed bycatch’. Because all
participants now sample all finfish species in one way or another, these have not been
defined in this revision.
Coverage of the whole survey area was almost complete for every quarter of the years
1991–1996. In quarters 2 and 4 in 1997, however, the total effort was at a much lower
level and limited to the contributions of a few nations. Since 1997, the surveys have
been conducted in quarters 1 and 3, only.
In 2006, the French began to carry out additional tows in the Eastern English Channel
in quarter 1 as part of the standard IBTS survey. This proved successful and, from 2007,
the RV ‘Thalassa’ carried out 8 GOV trawls and 20 MIK stations. During the IBTSWG
in 2009, Roundfish Area 10 was created to cover these new stations fished by France
and the Netherlands.
Since the beginning of the century, a number of countries have noted that the gear
parameter tables within the historic North Sea IBTS survey manuals had been difficult
to adhere to when trawling. Between 2007 and 2010, an analysis was carried out to
assess whether new tables or a new definition of the standard parameters for towing
were needed. Ultimately during the 2010 working group, it was decided that the
standard tow would be re‐defined with achievable gear parameters. In this revision of
the manual, the old warp out to headline height and doorspread plots have been
removed and replaced with plots of headline height and door spread corresponding to
depth, which should be used as a guide for optimum gear geometry (Figure 2.7). It
should be noted that Norway has not been able to achieve gear parameters within these
limits, but their gear performance is considered normal for their gear.
History of the survey gear
Before the IBTS was coordinated fully, many survey gears were used. In 1960, the
Netherlands used a Dutch Herring Trawl. Germany started a survey in the North Sea
in 1966 and used a Herring Trawl. In 1967, UK (England) and UK (Scotland) joined and
used the Dutch herring Trawl. By 1969, three differently rigged Dutch Herring trawls
and one Herring Trawl were being used in the North Sea to carry out the herring
surveys. As the surveys moved away from concentrating on just herring, there was a
move away from the herring trawls to a more multipurpose gear. In 1976, six different
survey gears were being used by eight different nations. Then, in 1978, one
multipurpose gear began to be used by more nations and, by 1983, all nations
participating in the quarter 1 IYFS were using the GOV 36/47, albeit with slightly
different rigging configurations of the sweep lengths. Since then, the GOV has been the
recommended standard gear of the IBTS and by 1992, the GOV was used in all quarters
of the IBTS.
Survey design
The stratification of the survey grid has always been based on ICES statistical
rectangles of roughly 30 x 30 nautical miles (one degree longitude x 0.5 degree latitude).
Each rectangle is usually fished by the ships of two different countries, so that at least
two hauls are typically taken per rectangle. Only Sweden, fishing in the Skagerrak and
Series of ICES Survey Protocols SISP 10 - IBTS IX | 61
Kattegat, sample their area as a single country, trawling more than once in every
rectangle.
The design of the quarter 1 survey has gradually changed over the years. In 1974, the
survey was still very much a herring survey (ICES, 1974). In that year, the IYHS WG
decided to use three strata, which depended on the amount of herring caught in
previous years and was, in total, 214 hauls. After some years, this design was dropped
and for several years, four hauls per rectangle were made in the southeastern North
Sea (between 50°30’ and 57°N, and 4° and 8°E), the most important area for juvenile
herring, while the remaining survey area was sampled with two hauls per rectangle.
At the beginning of 1991, part of the research vessel effort from quarter 1 was shifted
to the other quarters and, from that year, the target was to have at least two hauls per
rectangle over the whole survey area.
The allocation of stations to IBTS participants has changed slightly over the years. The
latest major reallocation occurred in 1991, but, since then, the survey has tried to keep
at least one vessel in every subarea in which it had fished in the most recent years. The
current quarter 1 allocation of the different nations is shown in Figure A1.1 to A1.8,
while the quarter 3 surveys are in Figures A1.9 to A1.15. For a more detailed history of
stations sampled by country, data can be downloaded from the ICES Data Centre
DATRAS database and plotted by country and year.
For the quarter 2 and 4 surveys, three different grids were introduced (ICES, 1990): the
‘coarse’ grid, based on the English Groundfish Surveys, which covers half of the
rectangles in the North Sea; the ‘complementary coarse grid’, which covers the half not
completed by England; and a grid that consists of all the neighbouring rectangles in a
certain area (as used, for example, in the Scottish Groundfish Surveys). The idea was
that at least four vessels should participate in every quarter: one vessel should fish the
coarse grid, one the complementary coarse grid, one all the rectangles in the southern
half of the North Sea, and one in the Northern half. In this way, all rectangles would
be fished twice by two different vessels. Only the quarter 3 surveys have had this
coverage since 1997.
Initially, one‐hour trawl tows were made, but in 1976, some participants changed to
30‐minute tows. This change was, in part, due to the gadoid outburst, which
contributed to increased catches, to allow nations the opportunity to carry out more
hauls in a day, and to reduce gear damage. Following this cut in towing time, a
recommendation was made at the IYHS‐ and Gadoid I‐Group working groups in 1977
and all countries (with the exception of Scotland) reduced the standard haul duration
in 1978to 30 minutes. Scotland continued to make one‐hour hauls until 1998, when they
changed to a new vessel and standardized tows to 30 minutes.
Fishing is usually limited to daylight hours, i.e. from 15 min before sunrise to 15 min
after sunset, but countries that initially did not participate in the sampling of herring
larvae in the 1st quarter fished at night until 1999. Nations initially sampled roundfish
and herring otoliths according to the statistical rectangle allocation in Figures A2.1 and
A2.2.

62 | Series of ICES Survey Protocols SISP 10 - IBTS IX
Table A2.1. Chronology of the International Bottom Trawl Survey (Overview)
1960–1961 Spring and autumn trawl surveys to map distribution of herring
1966 International Young Herring Survey (IYHS): Annual surveys in the southern and central North Sea established to obtain recruitment indices for the combined North Sea herring stocks.
1969 Skagerrak and Kattegat included in survey area
1970s Several different survey trawls being used by various institutes carrying out surveys in the North Sea, Skagerrak and Kattegat; e.g. the Dutch Herring Trawl, GOV, Herring Trawl
1974 Northern North Sea included in survey area to collect data for gadoids
1975 Recommendation for participants in IYHS to use Isaacs–Kidd midwater net to fish for herring larvae at night
1976 Some nations start to fish 30-minute tows in order to reduce gear damage and increase numbers of hauls per day
1977 IYHS Working Group and Gadoid I-Group Working Group recommend that all participants change to ½ hour tow duration. Working groups also recommend that, from 1978, the GOV trawl be the standard gear for future surveys. At least 4 countries were to use this gear in 1978, with other participants changing over to the GOV at the earliest possible time.
1981 Survey was renamed the International Young Fish Survey (IYFS)
1983 All Quarter 1 participants use standard GOV.
1984 ICES ‘Working Group on Young Herring Surveys’ and the ‘Gadoid 1-Group Working Group’ were combined to form the International Young Fish Survey (IYFS) Working Group.
1990 IYFS WG proposed to combine the IYFS and other national surveys into Quarterly Coordinated Surveys in the North Sea, Skagerrak and Kattegat, which were to be called the International Bottom Trawl Surveys (IBTS).
1991–1996 Quarterly surveys undertaken
1992 All participating countries now using GOV as standard survey gear for all quarters.
1997 National financial constraints reduce coordinated surveys to quarter 1 and quarter 3 with target coverage of 2 hauls per ICES rectangle per survey.
2001 Western Areas IBTS coordinated surveys first manual produced.
2008 France extend Q1 survey area into the Eastern English Channel.
2009 Norway unable to participate in Q3 IBTS. Eastern English Channel area cover by France recognized as new Roundfish Area (RFA) 10.
2011 Start of regular collection of marine litter data from GOV trawl
2013 Minor reallocation of rectangles between Norway, Scotland and Germany.
Table A2.2. History of the North Sea IBTS surveys (Overview).
YEAR(S) FREQUENCY REGION FISHING GEAR USED PELAGIC GEAR (LARVAE)
TOW DURATION SURVEY NAME ICES WG REFERENCE
FROM TO [MIN]
1960 1961 twice annually ICES (1963) - ICES 1963. International Young Herring Surveys. Report of Working Group meeting in IJmuiden, 26–27 March, 1963. ICES CM 1963/Herring Committee:101
1965 1968 annually Southern/ centralNorth Sea
60 International Young Herring Survey
WG on Young Herring Surveys
1969 annually Southern/ centralNorth Sea, Skagerrak, Kattegat
60
1974 annually Entire North Sea, Skagerrak, Kattegat
various 60
1975 annually MIK as standard for larvae
60
1976 annually 30 (some) / 60
1977 annually GOV recommended asstandard
30 (all except one country) / 60
ICES. 1977. Report of the Working Group on North Sea Young Herring Surveys. ICES CM 1977/H:11
1978 annually GOV used by 4 vessels 30 (all except one country) / 60
1981 annually 30 (all except one country) / 60
International Young Fish Survey (IYFS)
WG on Young Herring Surveys; Gadoid 1-Group WG
1983 current GOV used by all nations 30 (all except one country) / 60
1984 annually 30 (all except one country) / 60
IYFS WG
1991 1996 quarterly 30 (all except one country) / 60
International Bottom Trawl Survey (IBTS)
ICES CM 1990/H:3, ICES CM 1996/H:01
Series of ICES Survey Protocols SISP 10 ‐ IB
TS IX
63 |

64 | Series of ICES Survey Protocols SISP 10 - IBTS IX
YEAR(S) FREQUENCY REGION FISHING GEAR USED PELAGIC GEAR (LARVAE)
TOW DURATION SURVEY NAME ICES WG REFERENCE
FROM TO [MIN]
1997 1998 twice annually 30 (all except one country) / 60
Heessen, H.J.L., J. Dalskov and R.M. Cook (1997). The International Bottom Trawl Survey in the North Sea, the Skagerrak and Kattegat. ICES CM 1997/Y:31
1999 current twice annually 30

Series of ICES Survey Protocols SISP 10 - IBTS IX | 65
Figure A2.1. Otolith sampling areas for herring, from the beginning of the survey through 1982,
and for roundfish through 1979.
4° 2° 0° 2° 4° 6° 8° 10° 12°
50°
51°
52°
53°
54°
55°
56°
57°
58°
59°
60°
61°
62°
211
210
209
208
207
206
311
310
309
308
307
306
305
304
411
410
409
408
407
406
405
404
403
402
401
511
510
509
508
507
506
505
504
503
502
501
611
610
609
608
607
606
605
604
603
602
707
706
705
704
703
808
807
804
908
907
906
29
30
31
32
33
34
35
36
37
38
39
40
41
42
43
44
45
46
47
48
49
50
51
52
E5 E6 E7 E8 E9 F0 F1 F2 F3 F4 F5 F6 F7 F8 F9 G0 G1 G2

66 | Series of ICES Survey Protocols SISP 10 - IBTS IX
Figure A2.2. Herring Sampling Areas: used for the period 1983–1990.
4° 2° 0° 2° 4° 6° 8° 10° 12°
50°
51°
52°
53°
54°
55°
56°
57°
58°
59°
60°
61°
62°
29
30
31
32
33
34
35
36
37
38
39
40
41
42
43
44
45
46
47
48
49
50
51
52
E5 E6 E7 E8 E9 F0 F1 F2 F3 F4 F5 F6 F7 F8 F9 G0 G1 G2
11 12 14
31 32 1315
81
8271
22
2133
41
42 61
62 6367
6564
51
5266
23 72
Series of ICES Survey Protocols SISP 10 - IBTS IX | 67
History of the survey manual The International Bottom Trawl Survey Working Group, formerly known as the
International Young Fish Survey Working Group, has the responsibility of
coordinating various research vessel surveys conducted within certain ICES areas. The
first survey to be coordinated was the International Young Fish Survey (IYFS), which
was conducted in the North Sea and Skagerrak/Kattegat in February of each year,
starting in the late 1960s. A procedural manual was produced for the use of scientists
involved in this survey. In 1991, this cooperative programme was expanded to include
the three other quarter surveys in the North Sea and Skagerrak/Kattegat. This
necessitated major alterations to the manual. The revised edition was published as
ICES CM 1992/H:3. Table A2.3 shows the history of the North Sea manual, revised as
international cooperation developed.
During the Annual Science Conference in 1994 in St Johnʹs, Newfoundland, the
recommendation was made that the International Bottom Trawl Survey Working
Group should also incorporate the coordination of bottom‐trawl surveys in ICES Sub‐
Areas VI, VII, VIII, and Division IXa (these areas are designated as the western and
southern areas).
In 1995, the manual was revised for a fifth time to clarify certain aspects of the surveys
in the North Sea and Skagerrak/Kattegat. At the same time, the opportunity was taken
to review the manual, to establish whether the same procedures could be applied to
Sub‐Areas VI, VII, VIII, and Division IXa. Some aspects of the manual applied equally
to all areas, but other procedures required dedicated text. At the same time, it was
decided that a manual for the western and southern areas required further discussion
and input from countries closely associated with these areas. Consequently,
procedures unique to the western and southern areas were provided in Annex XI of
the fifth revision as a draft awaiting approval by all participants.
At the IBTS Working Group meeting in 1999 (Lisbon 7–10 April), it was apparent that
a single manual covering such an extensive area was inappropriate. As corrections and
amendments were outstanding for the North Sea IBTS Manual, the opportunity was
taken to revise the document (the sixth revision).
A separate manual for the western and southern waters was originally produced for
the IBTS meeting in Dublin in 2002, but was updated in 2010 and is now separately
available. Also during 2002, other major revisions were required to the North Sea
manual (the seventh revision) and these were completed in 2004.
In 2012, the procedure for deploying the MIK net was removed from the IBTS manual
and a new MIK‐dedicated manual was produced. This is available from the ICES
website.

68 | Series of ICES Survey Protocols SISP 10 - IBTS IX
Table A2.3. History of North Sea Survey Manuals revisions.
YEAR OF PUBLICATION VERSION SURVEY NAME REFERENCE
1978 I North Sea Young Fish Surveys
Manual for the ICES North Sea Young Fish Surveys, 1. edition. A. Corten (Ref. #/ citation unknown)
1981 II International Young Fish Survey (IYFS)
Manual for the International Young Fish Surveys in the North Sea, Skagerrak and Kattegat. ICES CM 1981/H:9
1986 III IYFS Manual of the International Young Fish Survey in the North Sea, Skagerrak and Kattegat, 3rd revision. ICES CM 1986/H:2
1992 IV IBTS Manual for the International Bottom Trawl Surveys. Revision IV, Addendum to ICES CM 1992/H: 3
1996 V IBTS Manual for the International Bottom Trawl Surveys. Revision V, Addendum to ICES CM 1996/H:1
1999 VI IBTS Manual for the International Bottom Trawl Surveys. Revision VI, ICES CM 1999/D:2
2004 VII IBTS Manual for the International Bottom Trawl Surveys. Revision VII, ICES CM 2006/RMC:03
2010 VIII IBTS ICES. 2012b. Manual for the International Bottom Trawl Surveys. Series of ICES Survey Protocols. SISP 1-IBTS VIII. 68 pp.
2012 VIII IBTS ICES. 2012b. Manual for the International Bottom Trawl Surveys. Series of ICES Survey Protocols. SISP 1-IBTS VIII. 68 pp.
2012 VIII IBTS ICES. 2012b. Manual for the International Bottom Trawl Surveys. Series of ICES Survey Protocols. SISP 1-IBTS VIII. 68 pp. ICES. 2012c. Manual for the Midwater Ring Net sampling during IBTS Q1. Revision 1. 16 p.
2013 VIII IBTS ICES. 2013. Manual for the Midwater Ring Net sampling during IBTS Q1. Series of ICES Survey Protocols. SISP 2-MIK 2. 18 pp.
Series of ICES Survey Protocols SISP 10 - IBTS IX | 69
Annex 3: IBTS standard gear check sheet 1
70 | Series of ICES Survey Protocols SISP 10 - IBTS IX
Annex 4: IBTS standard gear check sheet 2
HE
AD
LIN
E2
Win
gse
ctio
ns
1 B
oso
m s
ecti
on
5m
Hea
dlin
e
o 14
mm
Wire
se
rved
o
Win
glin
e
o22m
m c
omb
o
FIS
HIN
G L
INE
2 W
ing
sect
ion
s1
Bo
som
sec
tio
n
21.1
m
Por
t
21.1
m
Stb
d
5m
NO
TE
: al
l len
gth
s in
met
res
Upp
er w
ingl
ine
Low
er w
ingl
ine
Fis
hing
Lin
e
o22m
m c
omb
o
8.2m
Por
t / S
tbd
Lo
wer
win
glin
e
Up
per
win
glin
e8.
2m
Por
t / S
tbd
Fo
otr
op
e sp
ecif
icat
ion
see
pag
e 4
GO
V 3
6/47
GR
OU
ND
FIS
H S
UR
VE
Y T
RA
WL
CH
EC
KL
IST
Che
ck S
heet
2: F
ram
e ro
pes
daig
ram
15.5
m
Por
t
15.5
m
Stb
d
Series of ICES Survey Protocols SISP 10 - IBTS IX | 71
Annex 5: IBTS standard gear check sheet 3
Det
ails
of
rig
gin
g a
dju
stm
ents
Rib
line
lon
ger
than
net
tin
g
(len
gth
for
len
gth
)
YE
S
NO
6.7m
5.5m
Lo
wer
Bri
dle
Po
rt /
Stb
d
o20
mm
x 3
8m
U/m
Bri
dle
Ext
n.
o14
mm
x 2
0m
Po
rt /
Stb
d
Up
per
Bri
dle
o14
mm
x 2
0m
Po
rt /
Stb
d
Ves
sel
Cru
ise
Dat
e
Ch
ecke
d b
y
Ch
ecke
d b
y
Mid
dle
Bri
dle
o14
mm
x 2
0m
Po
rt /
Stb
d
Ott
erb
oar
d
4.5m
SQ
M
Po
rt /
Stb
d
Ova
l Po
ly
M. B
rid
le E
xtn
.o
14m
m x
7.1
m
Po
rt /
Stb
dKIt
e
Flo
ats
60 x
200
mm
AL
GO
V 3
6/47
GR
OU
ND
FIS
H S
UR
VE
Y T
RA
WL
CH
EC
KL
IST
Che
ck s
heet
3: O
vera
ll ri
ggin
g di
agra
m
Tria
ngle
Sph
eric
albo
bbin
o40
cm
1.7m
min
imum
2.2m
max
imum
30cm
20cm
Cha
in fo
r ad
just
men
t
Mea
sure
d t
o n
eare
st c
m b
elo
w
Sw
eep
len
gth
+ B
acks
tro
p
len
gth
+ B
acks
tro
p
exte
nsi
on
len
gth
(if
use
d)
sho
uld
to
tal 6
0m o
vera
ll.
Sw
eep
Po
rt /
Stb
d
Up
per
/ L
ow
erB
acks
tro
pP
ort
Stb
dB
acks
tro
p E
xtn
.P
ort
Stb
d
o22
mm
Bu
oyan
cy17
2 K
g
72 | Series of ICES Survey Protocols SISP 10 - IBTS IX
Annex 6a: IBTS standard gear check sheet 4 – Groundgear A
5m x
100
mm
o r
ubbe
r di
scs
+ 35
kg c
hain
wra
pped
aro
und
leg
5m x
100
mm
o r
ubbe
r dis
cs
5m x
100
mm
o r
ubbe
r di
scs
Po
rt W
ing
Sec
tio
n
5m x
200
mm
o r
ubbe
r di
scs
+ 35
kg c
hain
wra
pped
aro
und
leg
Po
rt Q
uar
ter
Sec
tio
n
ST
BD
Qu
arte
r S
ecti
on
5m x
200
mm
o r
ubbe
r di
scs
+ 35
kg c
hain
wra
pped
aro
und
leg
5m x
100
mm
o r
ubbe
r di
scs
+ 35
kg c
hain
wra
pped
aro
und
leg
5m x
100
mm
o r
ubbe
r dis
cs5m
x 1
00m
m o
rub
ber d
iscs
Bosom section
5m x 200mm o rubber discs+2 x 35kg chain wrapped around leg
GO
V 3
6/47
GR
OU
ND
FIS
H S
UR
VE
Y T
RA
WL
CH
EC
KL
IST
Che
ck s
heet
4 :
Gro
un
d g
ear
rig
gin
g(M
axim
um
len
gth
of
link
bet
wee
n s
ecti
on
s is
10c
m)
300m
m x
14
mm
o lo
ng
lin
k ch
ain
1m a
par
t, 5
per
leg
Gro
un
d g
ear/
foo
t ro
pe
con
nec
tin
g c
hai
ns
ST
BD
Win
g S
ecti
on
Series of ICES Survey Protocols SISP 10 - IBTS IX | 73
Annex 6b: IBTS standard gear check sheet 4 – Groundgear B
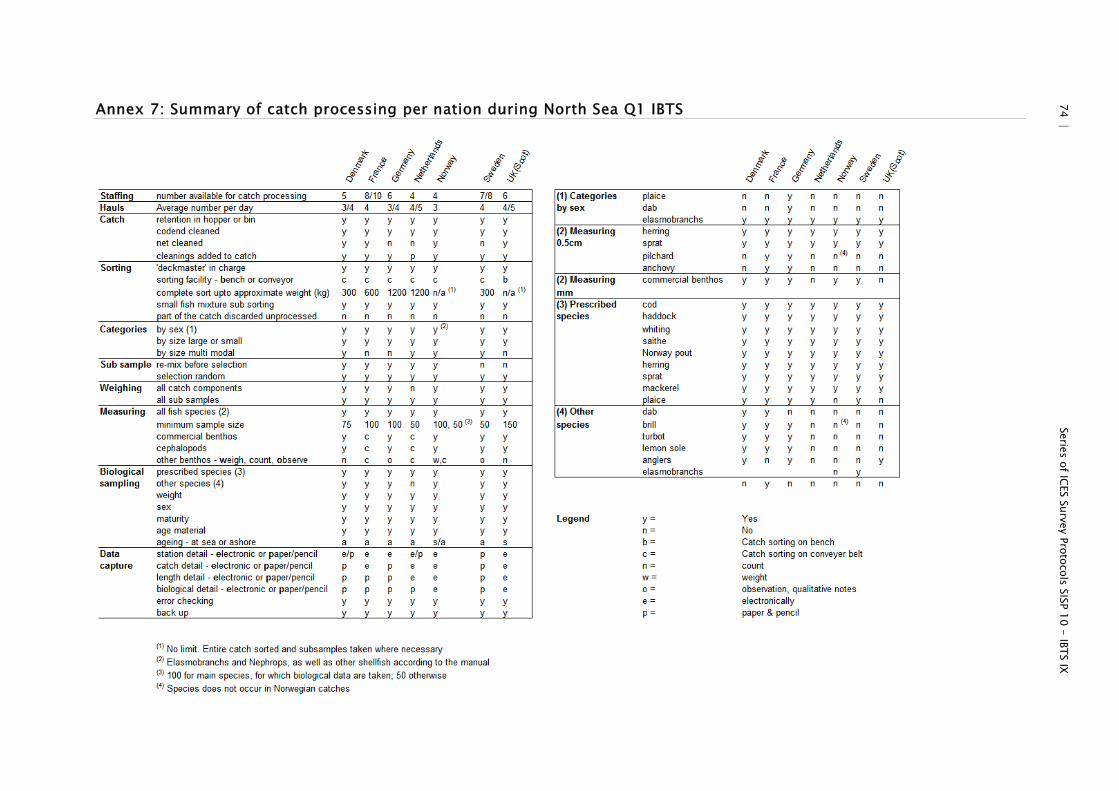
74 | Series of ICES Survey Protocols SISP 10 - IBTS IX
Annex 7: Summary of catch processing per nation during North Sea Q1 IBTS

Series of ICES Survey Protocols SISP 10 - IBTS IX 75 |
Annex 8: Summary of catch processing per nation during North Sea Q3 IBTS

76 | Series of ICES Survey Protocols SISP 10 - IBTS IX
Annex 9: Finfish (flatfish and roundfish) maturity key
Vector diagram showing the maturity cycle for finfish species using the new 6 stage maturity
key.
The tables below give text descriptions of the stages for gadoid species, however,
the differences between the flatfish species are diverse, so one table cannot
describe the stages effectively. A full description of each of the stages for Solea
solea (sole), Pleuronectes plattessa (plaice), Limanda limanda (dab), and Platichthys
flesus (flounder) can be found on the ICES website (ICES, 2012).
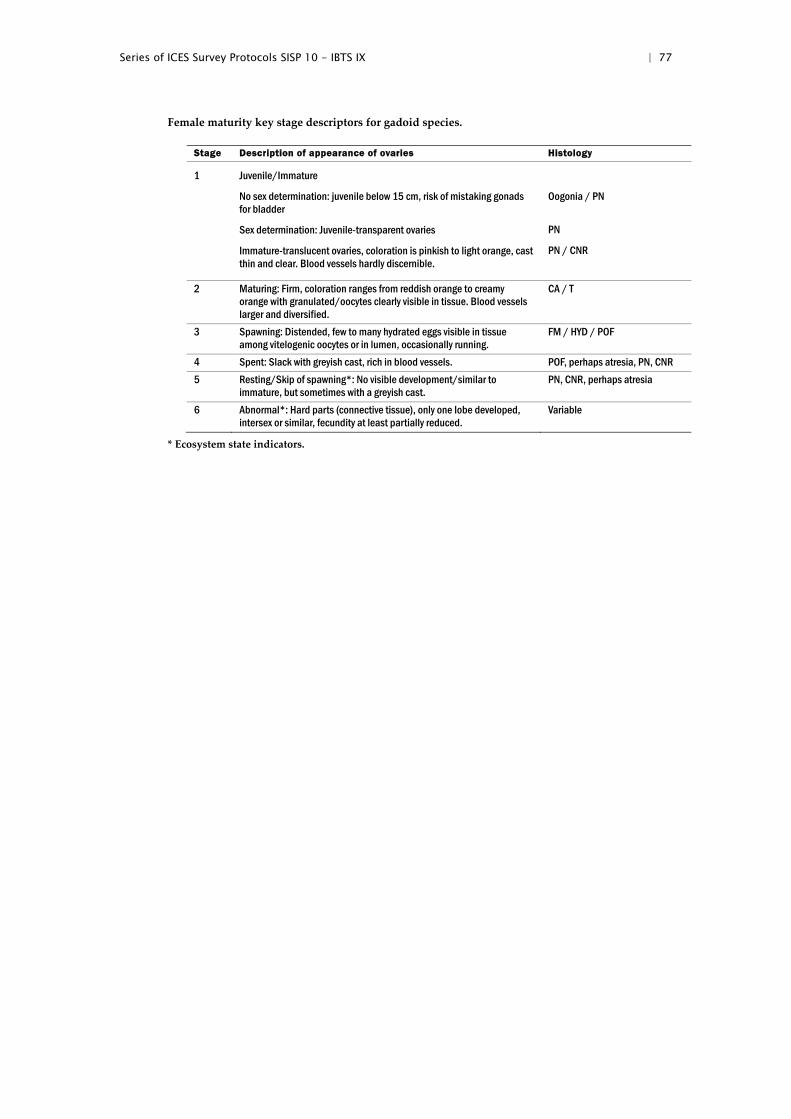
Series of ICES Survey Protocols SISP 10 - IBTS IX | 77
Female maturity key stage descriptors for gadoid species.
Stage Description of appearance of ovaries Histology
1 Juvenile/Immature
No sex determination: juvenile below 15 cm, risk of mistaking gonads for bladder
Sex determination: Juvenile-transparent ovaries
Immature-translucent ovaries, coloration is pinkish to light orange, cast thin and clear. Blood vessels hardly discernible.
Oogonia / PN
PN
PN / CNR
2 Maturing: Firm, coloration ranges from reddish orange to creamy orange with granulated/oocytes clearly visible in tissue. Blood vessels larger and diversified.
CA / T
3 Spawning: Distended, few to many hydrated eggs visible in tissue among vitelogenic oocytes or in lumen, occasionally running.
FM / HYD / POF
4 Spent: Slack with greyish cast, rich in blood vessels. POF, perhaps atresia, PN, CNR
5 Resting/Skip of spawning*: No visible development/similar to immature, but sometimes with a greyish cast.
PN, CNR, perhaps atresia
6 Abnormal*: Hard parts (connective tissue), only one lobe developed, intersex or similar, fecundity at least partially reduced.
Variable
* Ecosystem state indicators.
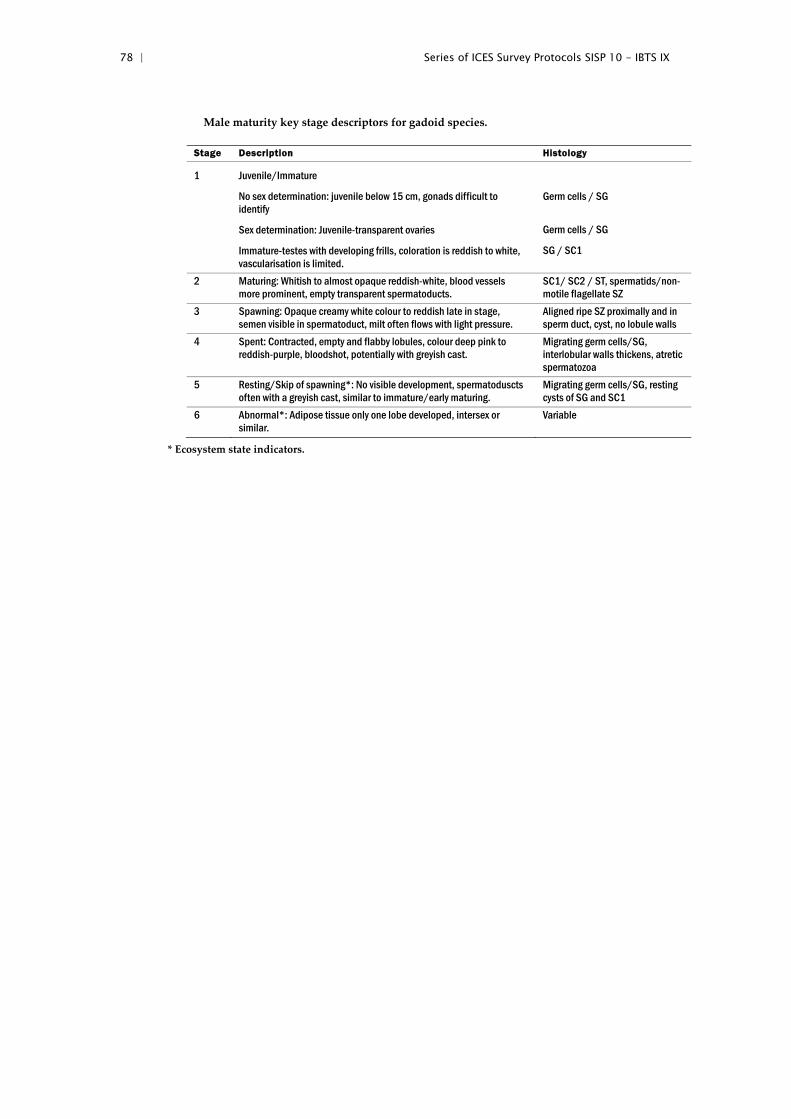
78 | Series of ICES Survey Protocols SISP 10 - IBTS IX
Male maturity key stage descriptors for gadoid species.
Stage Description Histology
1 Juvenile/Immature
No sex determination: juvenile below 15 cm, gonads difficult to identify
Sex determination: Juvenile-transparent ovaries
Immature-testes with developing frills, coloration is reddish to white, vascularisation is limited.
Germ cells / SG
Germ cells / SG
SG / SC1
2 Maturing: Whitish to almost opaque reddish-white, blood vessels more prominent, empty transparent spermatoducts.
SC1/ SC2 / ST, spermatids/non-motile flagellate SZ
3 Spawning: Opaque creamy white colour to reddish late in stage, semen visible in spermatoduct, milt often flows with light pressure.
Aligned ripe SZ proximally and in sperm duct, cyst, no lobule walls
4 Spent: Contracted, empty and flabby lobules, colour deep pink to reddish-purple, bloodshot, potentially with greyish cast.
Migrating germ cells/SG, interlobular walls thickens, atretic spermatozoa
5 Resting/Skip of spawning*: No visible development, spermatoduscts often with a greyish cast, similar to immature/early maturing.
Migrating germ cells/SG, resting cysts of SG and SC1
6 Abnormal*: Adipose tissue only one lobe developed, intersex or similar.
Variable
* Ecosystem state indicators.
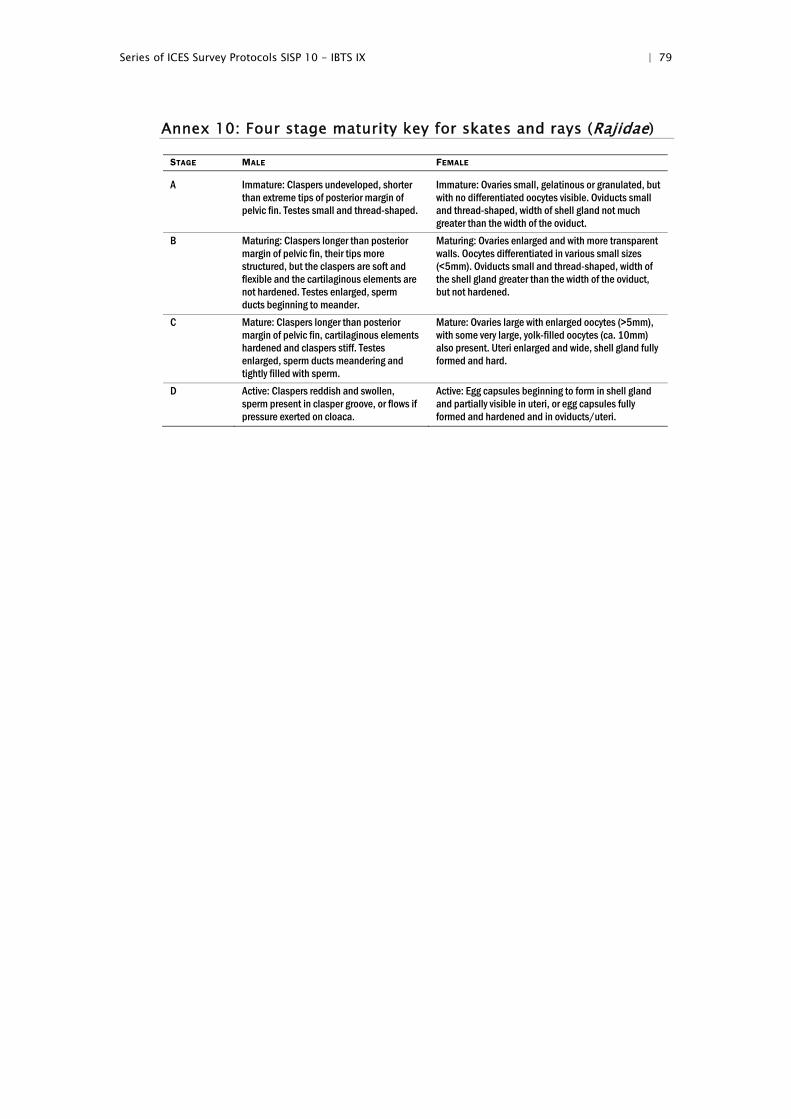
Series of ICES Survey Protocols SISP 10 - IBTS IX | 79
Annex 10: Four stage maturity key for skates and rays (Rajidae)
STAGE MALE FEMALE
A Immature: Claspers undeveloped, shorter than extreme tips of posterior margin of pelvic fin. Testes small and thread-shaped.
Immature: Ovaries small, gelatinous or granulated, but with no differentiated oocytes visible. Oviducts small and thread-shaped, width of shell gland not much greater than the width of the oviduct.
B Maturing: Claspers longer than posterior margin of pelvic fin, their tips more structured, but the claspers are soft and flexible and the cartilaginous elements are not hardened. Testes enlarged, sperm ducts beginning to meander.
Maturing: Ovaries enlarged and with more transparent walls. Oocytes differentiated in various small sizes (<5mm). Oviducts small and thread-shaped, width of the shell gland greater than the width of the oviduct, but not hardened.
C Mature: Claspers longer than posterior margin of pelvic fin, cartilaginous elements hardened and claspers stiff. Testes enlarged, sperm ducts meandering and tightly filled with sperm.
Mature: Ovaries large with enlarged oocytes (>5mm), with some very large, yolk-filled oocytes (ca. 10mm) also present. Uteri enlarged and wide, shell gland fully formed and hard.
D Active: Claspers reddish and swollen, sperm present in clasper groove, or flows if pressure exerted on cloaca.
Active: Egg capsules beginning to form in shell gland and partially visible in uteri, or egg capsules fully formed and hardened and in oviducts/uteri.

80 | Series of ICES Survey Protocols SISP 10 - IBTS IX
Annex 11: Data sheet for collection of marine litter

Series of ICES Survey Protocols SISP 10 - IBTS IX | 81
82 | Series of ICES Survey Protocols SISP 10 - IBTS IX
Annex 12: Haul information
Explanations of the various field names and data types can be found on the
ICES web page: http://www.ices.dk/datacentre/datsu/selrep.asp
RECORD TYPE HH
START/ORDER FIELD NAME WIDTH MANDATORY DATA TYPE
1 RecordType 2 char
2 Quarter 1 int
3 Country 3 char
4 Ship 4 char
5 Gear 6 char
6 SweepLngt 3 int
7 GearExp 2 char
8 DoorType 2 char
9 StNo 6 char
10 HaulNo 3 int
11 Year 4 char
12 Month 2 int
13 Day 2 int
14 TimeShot 4 char
15 Stratum 4 char
16 HaulDur 3 int
17 DayNight 2 char
18 ShootLat 8 decimal
19 ShootLong 9 decimal
20 HaulLat 8 decimal
21 HaulLong 9 decimal
22 StatRec 4 char
23 Depth 4 int
24 HaulVal 1 char
25 HydroStNo 8 char
26 StdSpecRecCode 1 char
27 BycSpecRecCode 1 char
28 DataType 2 char
29 Netopening 4 decimal
30 Rigging 2 char
31 Tickler 2 int
32 Distance 4 int
33 Warplngt 4 int
34 Warpdia 2 int
35 WarpDen 2 int
36 DoorSurface 4 decimal
37 DoorWgt 4 int
38 DoorSpread 3 int
39 WingSpread 2 int
40 Buoyancy 4 int
41 KiteDim 3 decimal
42 WgtGroundRope 4 int
43 TowDir 3 int
44 GroundSpeed 3 decimal
45 SpeedWater 3 decimal
Series of ICES Survey Protocols SISP 10 - IBTS IX | 83
RECORD TYPE HH
START/ORDER FIELD NAME WIDTH MANDATORY DATA TYPE
46 SurCurDir 3 int
47 SurCurSpeed 4 decimal
48 BotCurDir 3 int
49 BotCurSpeed 4 decimal
50 WindDir 3 int
51 WindSpeed 3 int
52 SwellDir 3 int
53 SwellHeight 4 decimal
54 SurTemp 4 decimal
55 BotTemp 4 decimal
56 SurSal 5 decimal
57 BotSal 5 decimal
58 ThermoCline 2 char
59 ThClineDepth 4 int
84 | Series of ICES Survey Protocols SISP 10 - IBTS IX
Annex 13: Length frequency information
RECORD TYPE HL
START/ORDER FIELD NAME WIDTH MANDATORY DATA TYPE
1 RecordType 2 char
2 Quarter 1 int
3 Country 3 char
4 Ship 4 char
5 Gear 6 char
6 SweepLngt 3 int
7 GearExp 2 char
8 DoorType 2 char
9 StNo 6 char
10 HaulNo 3 int
11 Year 4 char
12 SpecCodeType 1 char
13 SpecCode 10 char
14 SpecVal 2 char
15 Sex 2 char
16 TotalNo 9 decimal
17 CatIdentifier 2 int
18 NoMeas 3 int
19 SubFactor 9 decimal
20 SubWgt 6 int
21 CatCatchWgt 8 int
22 LngtCode 2 char
23 LngtClass 4 decimal
24 HLNoAtLngt 6 decimal

Series of ICES Survey Protocols SISP 10 - IBTS IX | 85
Annex 14: Smalk
N.B. When sending information on herring in the first Quarter, number of rings
should be substituted for age.
RECORD TYPE CA
START/ORDER FIELD NAME WIDTH MANDATORY DATA TYPE
1 RecordType 2 char
2 Quarter 1 int
3 Country 3 char
4 Ship 4 char
5 Gear 6 char
6 SweepLngt 3 int
7 GearExp 2 char
8 DoorType 2 char
9 StNo 6 char
10 HaulNo 3 int
11 Year 4 char
12 SpecCodeType 1 char
13 SpecCode 10 char
14 AreaType 2 char
15 AreaCode 4 char
16 LngtCode 2 char
17 LngtClass 4 decimal
18 Sex 2 char
19 Maturity 2 char
20 PlusGr 2 char
21 AgeRings 2 int
22 CANoAtLngt 3 int
23 IndWgt 5 decimal

86 | Series of ICES Survey Protocols SISP 10 - IBTS IX
Annex 15: Area type codes: Sampling areas and standard areas for the calculation of abundance indices
AREA TYPE CODES 0 = ICES STATISTICAL RECTANGLES SEE CM 1977/GEN:3.
1 = Four Statistical Rectangles See Figure 6.1
2 = Standard Roundfish Areas See Figure A2.2
3 = Herring Sampling Areas See Figure 6.3
NB: There has been confusion in the definition of herring areas in the past and, for some years, no ALKs
were collected for areas 14, 15, and 67; in which case, these areas must be considered as subsets of 12, 13,
and 63, respectively. The Skagerrak/ Kattegat areas have also not always been distinguished, in which
case, the appropriate code should be 80. See Figure 6.3.
Annex 16: Length splits used to provide preliminary numbers-at-age
AGE 0-GROUP 1-GROUP
QUARTER 2 3 4 1 2 3 4
Cod 11 18 23 25 33 38 44
Haddock 12 17 20 20 27 30 32
Whiting 9 17 20 20 23 24 26
Norway pout - 13 14 15 15 16 20
Herring - 15.5 17.5 20.0 21.0 23.0 24.5
Sprat - - 10.0 10.0 10.5 13.0 14.0
Mackerel - 17 24 25 25 30 31
Saithe - 22 25 25 25 33 38
Plaice - 10 12 - - 19 21
NB: The lengths indicated are ʹless thanʹ lengths: 0‐group cod in quarter 2 are fish <11 cm.