Embed Size (px)
Citation preview

Treatment Of Unit Non-response In Establishment Surveys
ICES –III: June 18 -21, 2007
M.A. Hidiroglou
Wesley Yung
Statistics Canada
Outline
1. Why is it a problem?2. Causes3. Measurement4. Follow-up5. Score Function6. Adjusting for nonresponse7. Weight adjustment8. Imputation9. Summary

Why is it a Problem?
Bias Non-respondents differ from respondents in the characteristics measured
Sampling varianceIncreased
Reduced effective sample size

Causes
Frame qualityContact information
name, address, telephone number and fax number
Classification (industry/geography)Over-coverage: sampled unit not in scope to the survey - does not respond
Under coverage: units declared out-of-scope – not contacted

Causes, cont.
Questionnaire Design and layout
Coverage: complex businesses
Language
Length / time to fill out
Causes, cont.
Data collection methodDid not adjust to respondent’s preferred contact modeMail, personal interview, telephone interview, computer assisted interviewing, etc

Causes, cont.
Contact: Agency and respondentLack of communication and follow-up
Too much contact: editing checks
TimingBest day and time
Fiscal year end
Causes, cont.
Contact: Agency and respondentData availabilityResponse load
Who else is asking?
Legal obligations for respondents and statistical agencyConfidentiality protection
Measurement
Compile non-response ratesRefusals
Non-contactOut-of-scope
Seasonality /death status (unknown)
Mail returns
Other reasons

Follow Up
Follow-up non-respondentsAll and/or targeted sub-group
Effective way to increase the response rate
Follow Up, cont.
Prioritise follow-up
Who?Target large or significant units first
Non-responding births
Delinquent businesses
How? Score-function
Follow Up, cont.
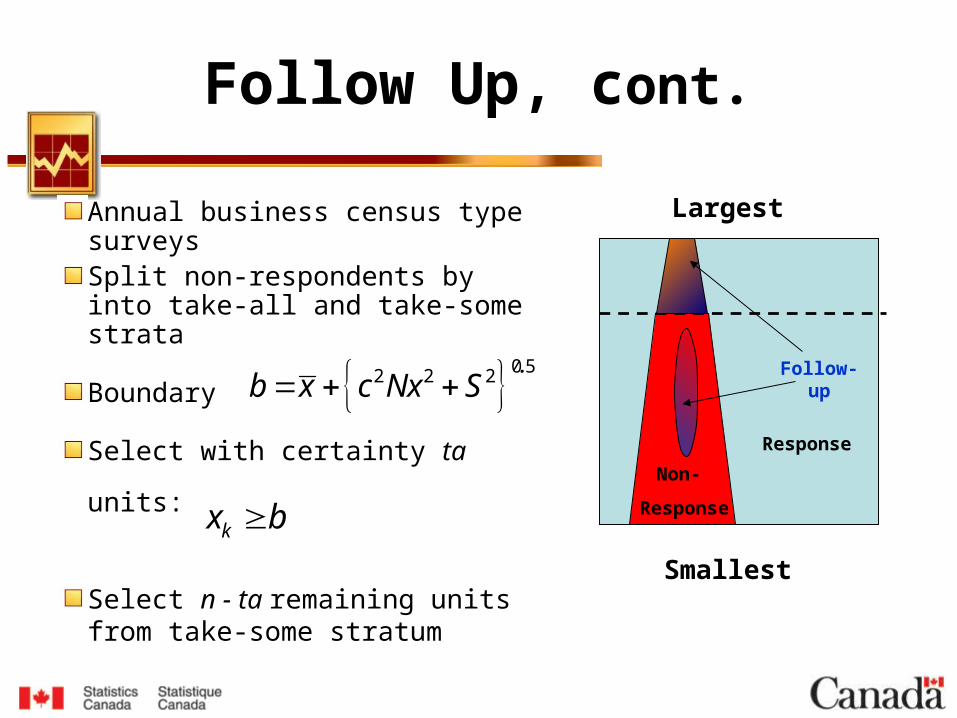
Annual business census type surveys Split non-respondents by into take-all and take-some strata
Boundary
Select with certainty ta units:
Select n - ta remaining units from take-some stratum
0 52 2 2 .
kx bx c Nx S
Largest
Smallest
Response
Follow-up
Non-
Responsekx b
0 52 2 2 .b x c Nx S
Follow Up, cont.
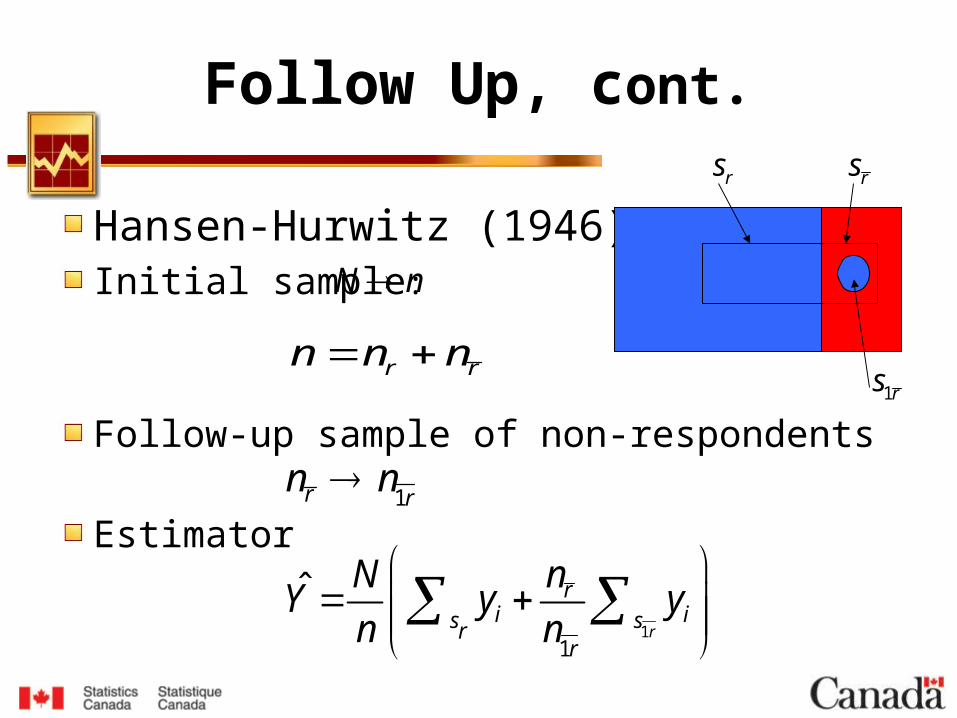
Hansen-Hurwitz (1946) Initial sample:
Follow-up sample of non-respondents
Estimator
N n
r rn n n
11
ˆr
ri is sr
r
nNY y y
n n
1r rn n
rs rs
1rs

Score Function
Basic ideaFollow-up non-responding units that have most impact on estimates
Adaptation of Latouche and Berthelot (1992), McKenzie (2001), and Hedlin (2003).

Score Function, cont.
Key steps1. Define and compute score function from
past values
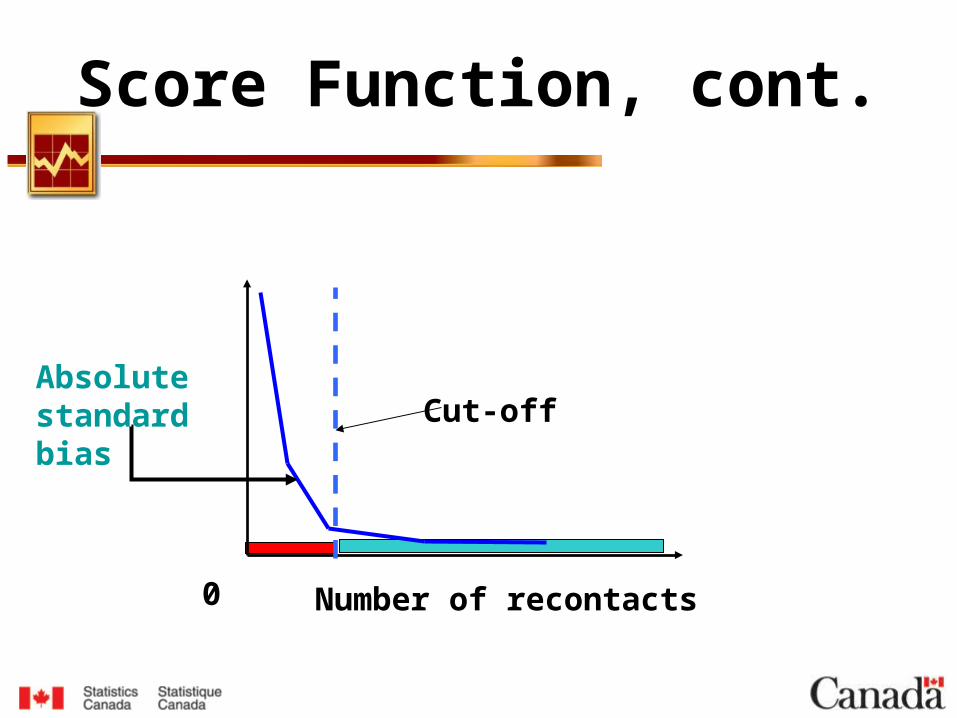
2. Determine score cut-off: minimize absolute standard bias
3. Follow-up units above score cut-off

Score Function, cont.
1. Define and compute score function
( )
Use past data at time (say)
( ) respond: Sample: ( )
( ) do not respond:
ˆ Follow-up everybody: past
past
RESP past j past
prev imppast j pastRESP
RESPFs t j past j past
t
s t y ts t
s t y t
Y w t y t
( )
( )
Compute score function using non-responding units
:
(
( )
) *100ˆ
past
past
j s t
impj past j past j past
j past FU
pastRESP
LLs t
w t y t y tscore
Y
t
t
s
Score Function, cont.
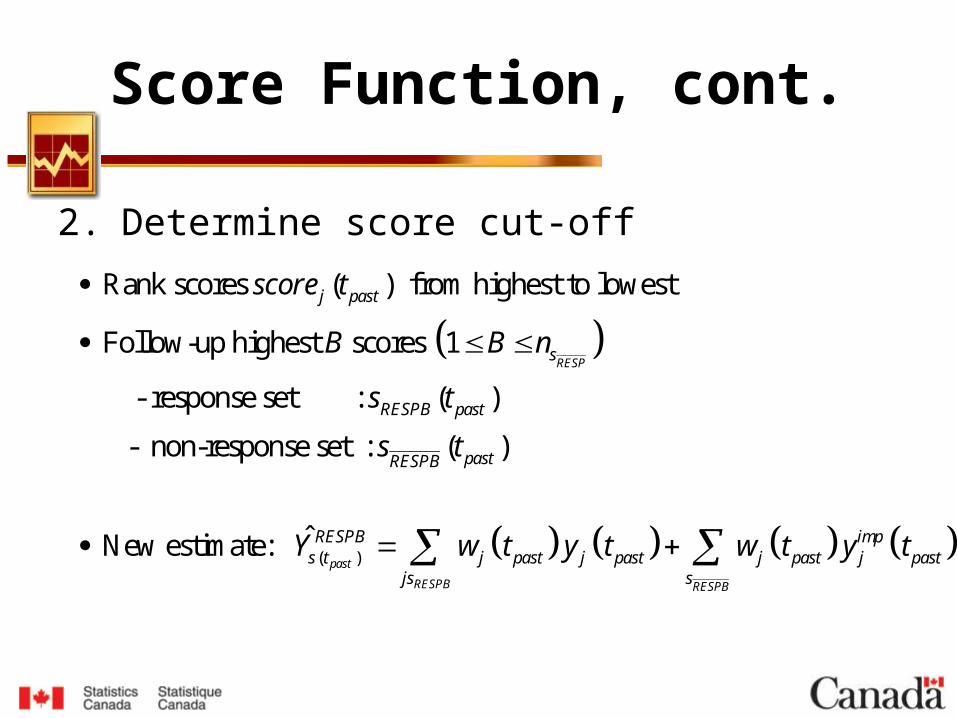
2. Determine score cut-off
(
Rank scores ( ) from highest to lowest
Follow-up highest scores 1
- response set : ( )
- non-response set : ( )
ˆ New estimate:
RESP
j past
s
RESPB past
pastRESPB
s t
score t
B B n
s t
s t
Y
)past
RESPB RESPB
RESPB impj past j past j past j past
js s
w t y t w t y t
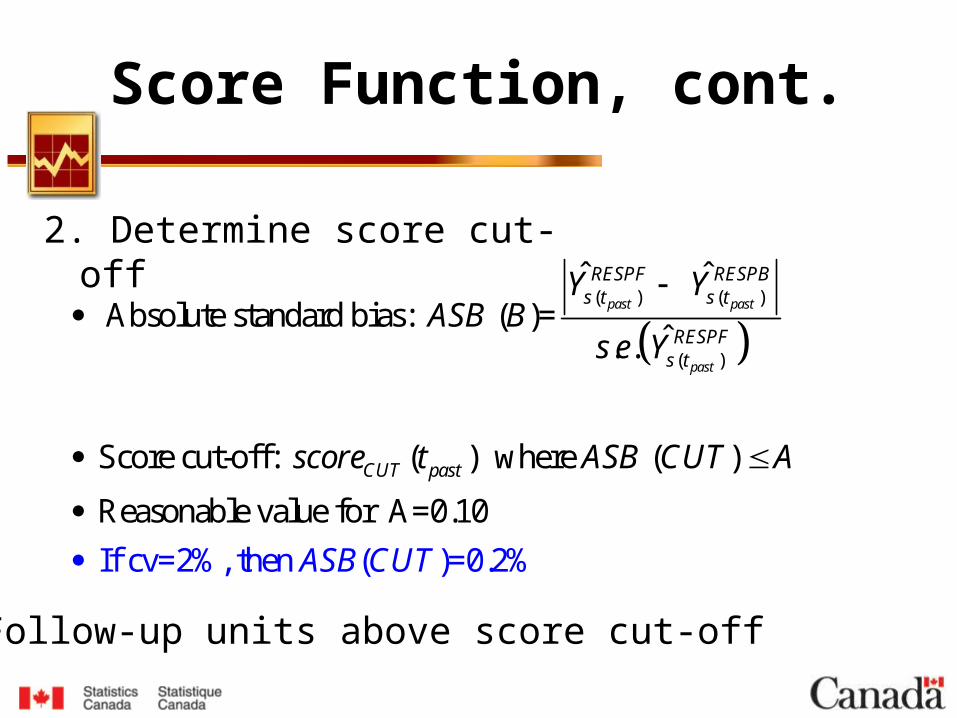
Score Function, cont.
( ) ( )
( )
ˆ ˆ Absolute standard bias: ( )=
ˆ. .
Score cut-off: ( ) where ( )
Reasonable value for A=0.10
If cv=2%, then ( )=0.2%
past past
past
RESPF RESPBs t s t
RESPFs t
CUT past
Y YASB B
s e Y
score t A
ASB CUT
SB CUT A
2. Determine score cut-off
3.Follow-up units above score cut-off

Score Function, cont.
Score-function (Latouche and Berthelot 1992)
Establish threshold based on ASB
Follow-up k-th unit if
1 1
1score
1
survey weight at time
importance of variable
impQk q k q k,q
kk k,qq = s t
k
q
w t I x t - x tt =
w t x t
w t t
I q
,
( )
score thresholdk t
Score Function, cont.
Number of recontacts
Absolute standard bias
0
Cut-off
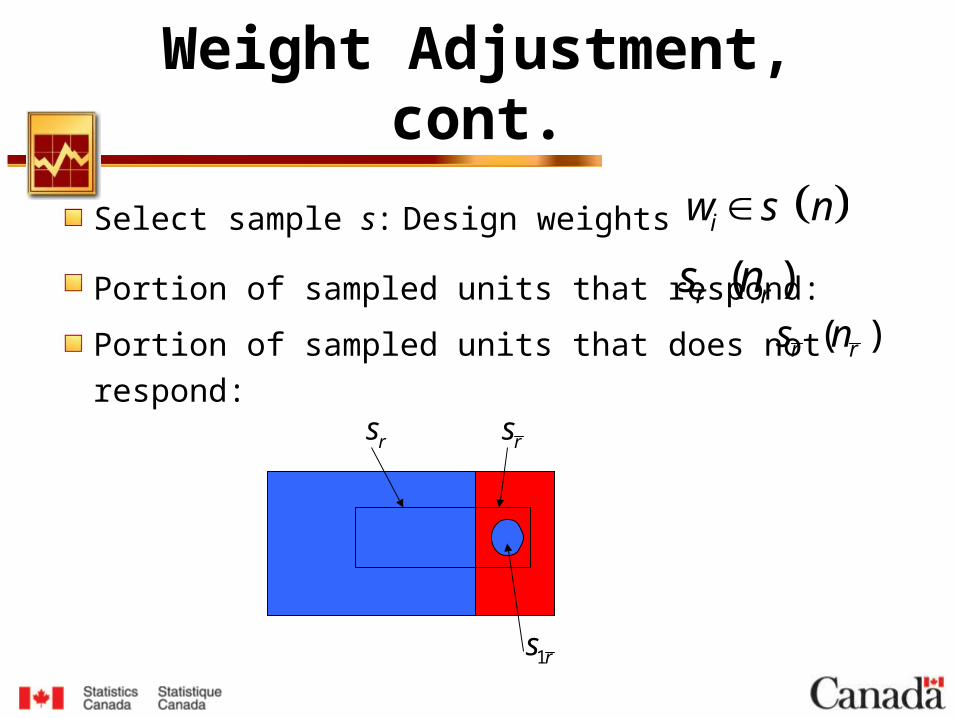
Weight Adjustment, cont.
Select sample s: Design weights
Portion of sampled units that respond: Portion of sampled units that does not respond:
( ) r rs n
rs rs
1rs
iw s n
( ) r rs n
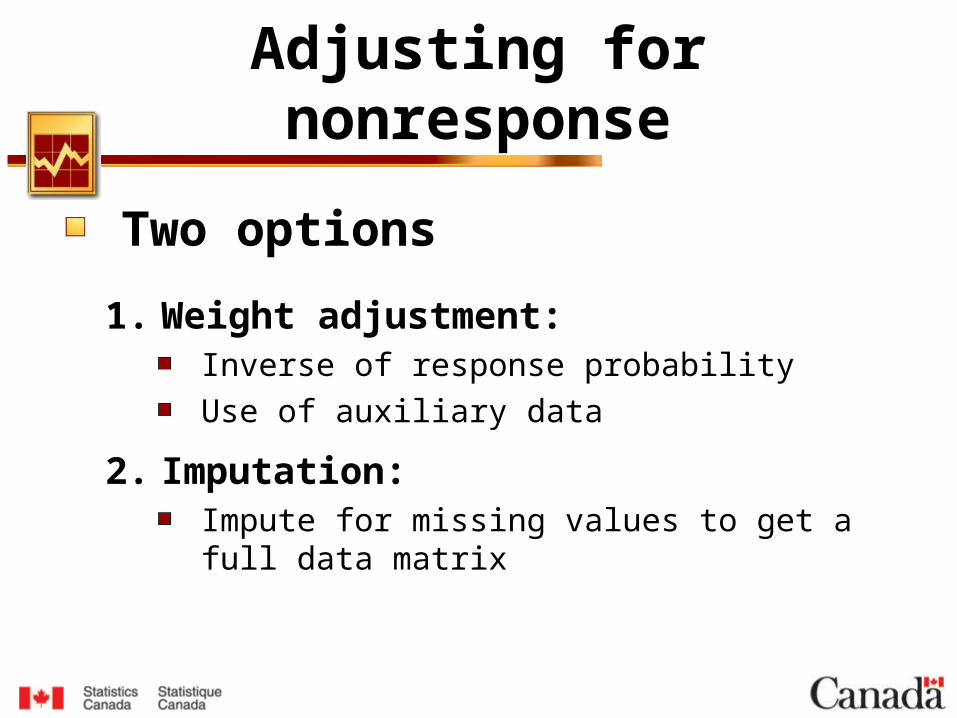
Adjusting for nonresponse
Two options
1. Weight adjustment:Inverse of response probability
Use of auxiliary data
2. Imputation:Impute for missing values to get a full data matrix
Weight Adjustment
Used to reduce bias due to non-response
Depends on the probability to respond
Assumes independent of variable of interest, y Ignorable non-response
Respondents behave same as non-respondents
i
i
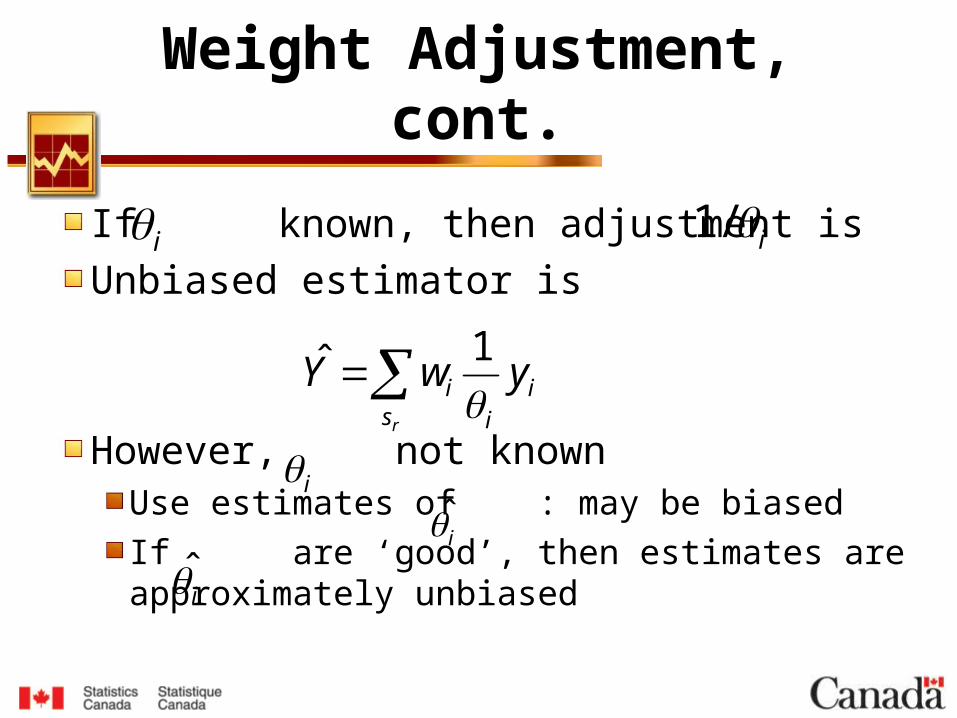
Weight Adjustment, cont.
If known, then adjustment is
Unbiased estimator is
However, not knownUse estimates of : may be biased
If are ‘good’, then estimates are approximately unbiased
i 1/ i
ii
i
rs
ii
i ywY1ˆ
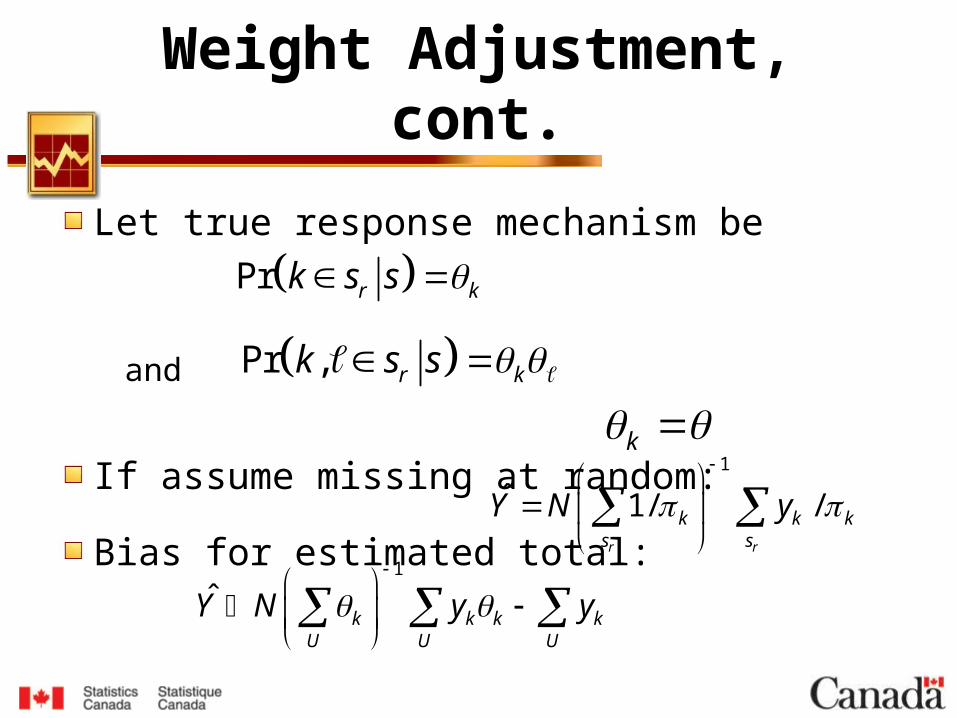
Weight Adjustment, cont.
Let true response mechanism be
and
If assume missing at random:
Bias for estimated total:
Pr r kk s s
Pr , r kk s s
k 1
ˆ 1/ /r r
k k ks s
Y N y
1
ˆk k k k
U U U
Y N y y
Weight Adjustment, cont.
How to estimate (approximate) ?
Auxiliary variablesLogistic regression
Auxiliary data (discrete, continuous)
i
Weight Adjustment, cont.
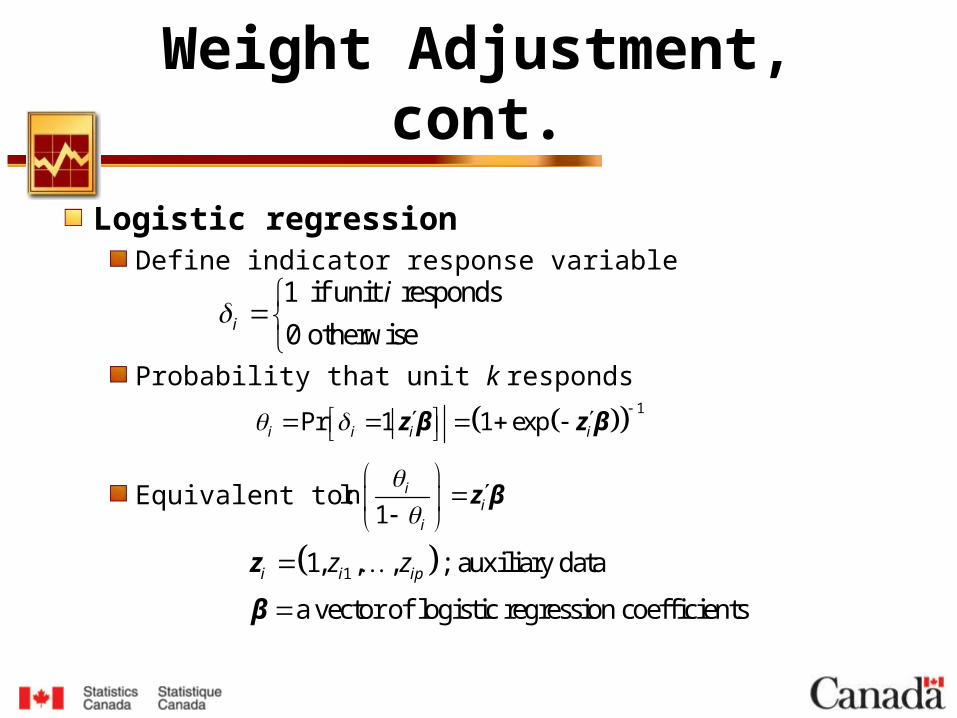
Logistic regressionDefine indicator response variable
Probability that unit k responds
Equivalent to:
1Pr 1 1 expi i i i
z β z β
1 if unit responds
0 otherwisei
i
ln1
ii
i
z β
11, , , ; auxiliary data
a vector of logistic regression coefficients
i i ipz z
z
β
Weight Adjustment, cont.
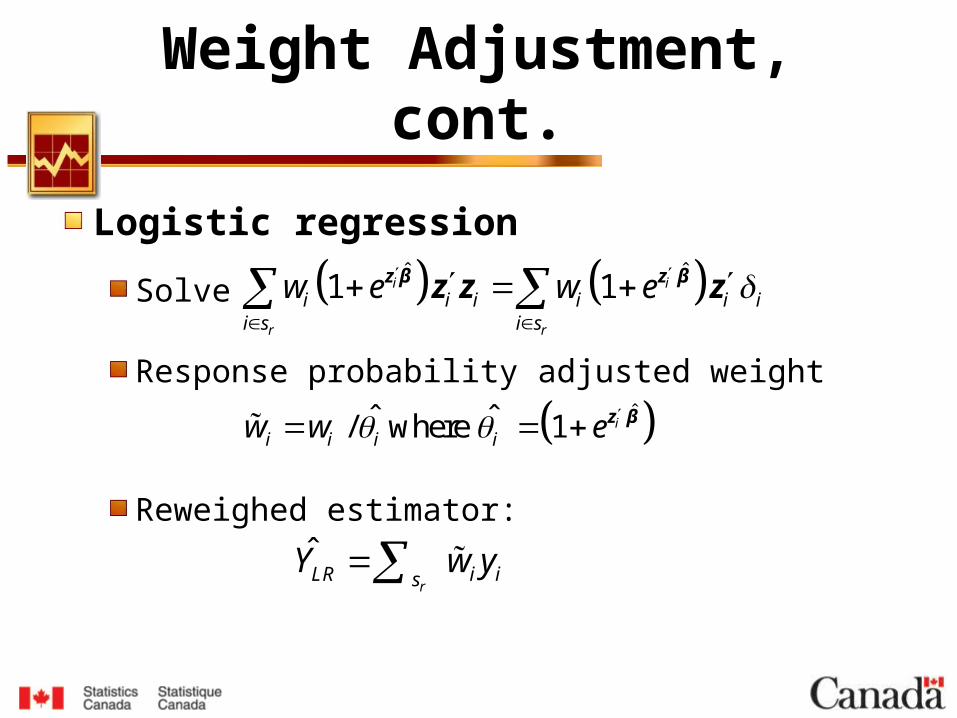
Logistic regression
Solve
Response probability adjusted weight
Reweighed estimator:
ˆ ˆ1 1i i
r r
i i i i i ii s i s
w e w e
z β z βz z z
ˆˆ ˆ/ where 1 ii i i iw w e z β
ˆr
LR i isY w y
Weight Adjustment, cont.
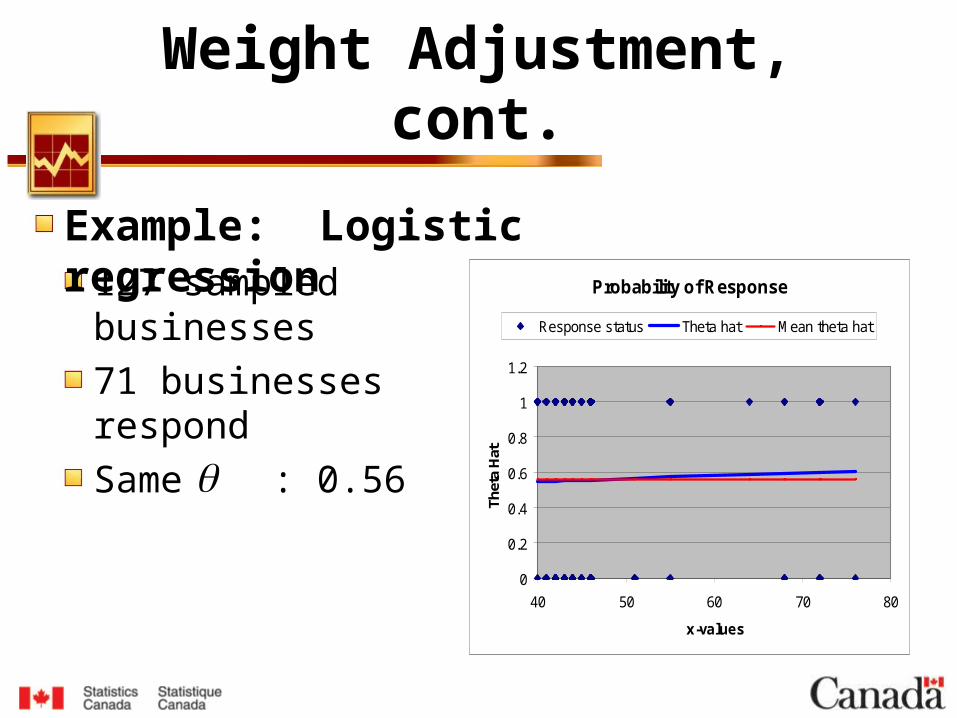
127 sampled businesses
71 businesses respond
Same : 0.56
Probability of Response
0
0.2
0.4
0.6
0.8
1
1.2
40 50 60 70 80
x-values
Th
eta
Hat
Response status Theta hat Mean theta hat
Example: Logistic regression
Weight Adjustment, cont.
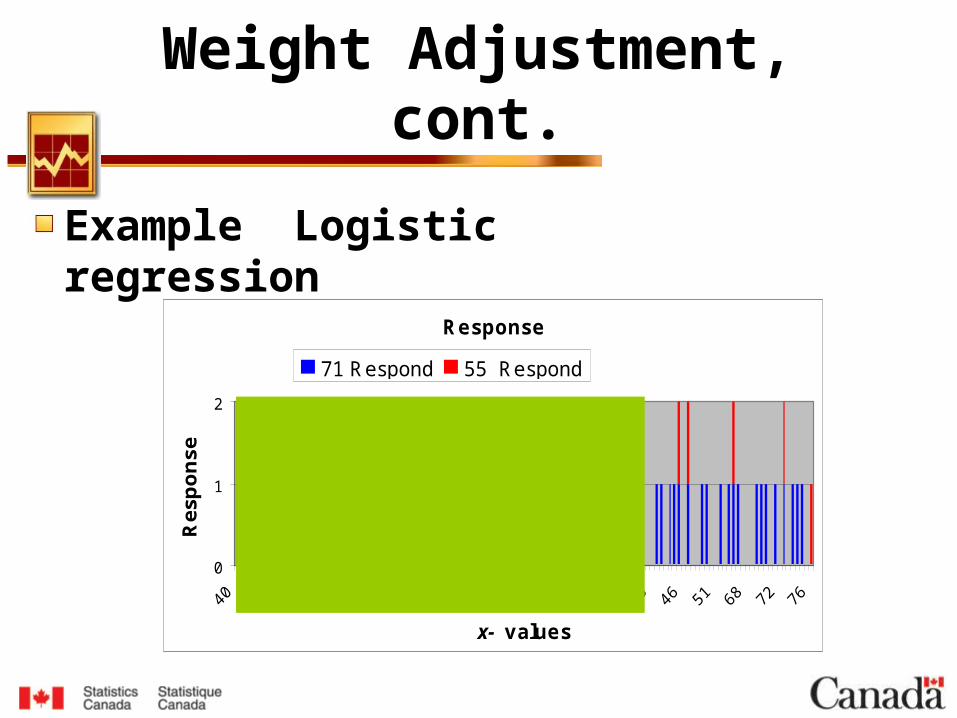
Response
0
1
2
x- values
Res
po
nse
71 Respond 55 Respond
Example Logistic regression

Weight Adjustment, cont.
Probability of Response
0
0,2
0,4
0,6
0,8
1
1,2
40 50 60 70 80
x-values
Th
eta
Hat
Response status Theta hat Mean theta hat
127 sampled businesses
55 businesses respond
Same : 0.43
Example: Logistic regression
Weight Adjustment, cont.
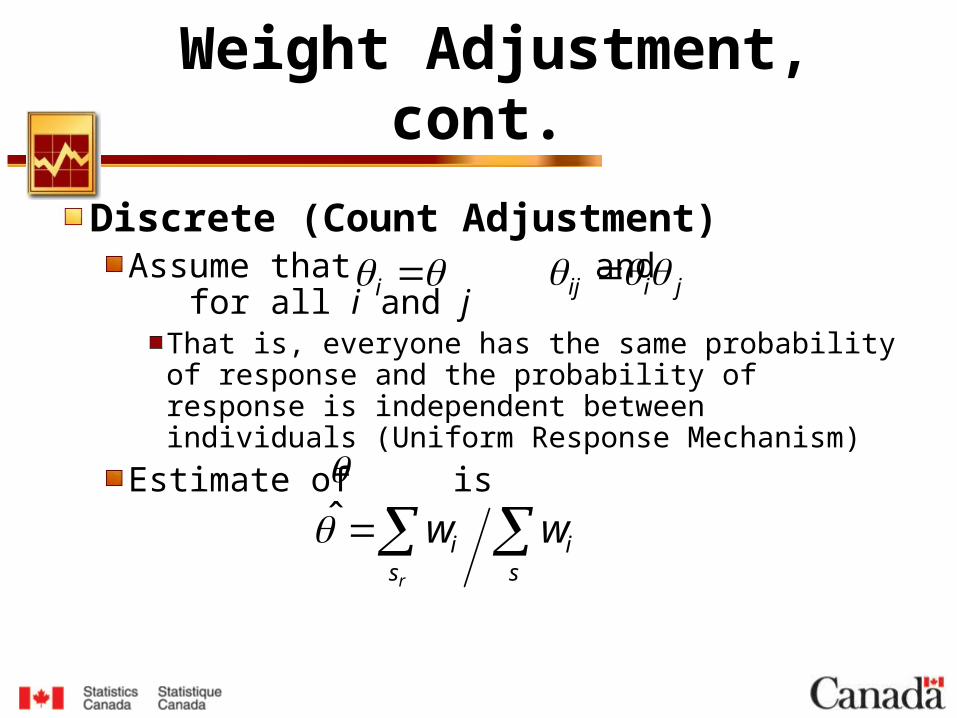
Discrete (Count Adjustment)Assume that and for all i and j
That is, everyone has the same probability of response and the probability of response is independent between individuals (Uniform Response Mechanism)
Estimate of is
i jiij
s
is
i wwr
Weight Adjustment, cont.
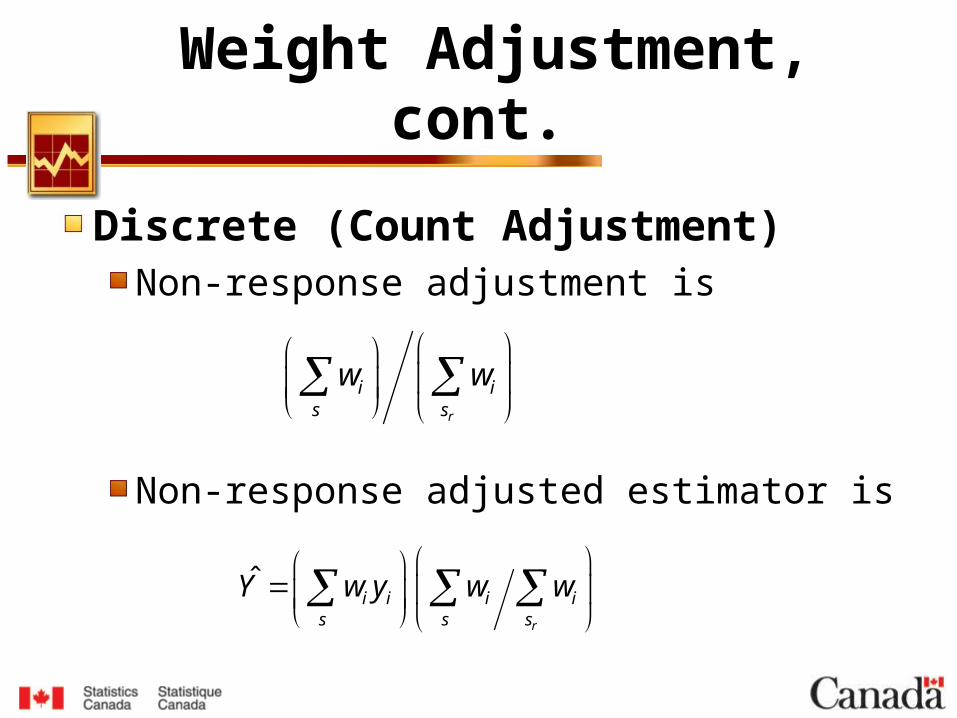
Discrete (Count Adjustment)Non-response adjustment is
Non-response adjusted estimator is
r
i is s
w w
ˆr
i i i is s s
Y w y w w
Weight Adjustment, cont.
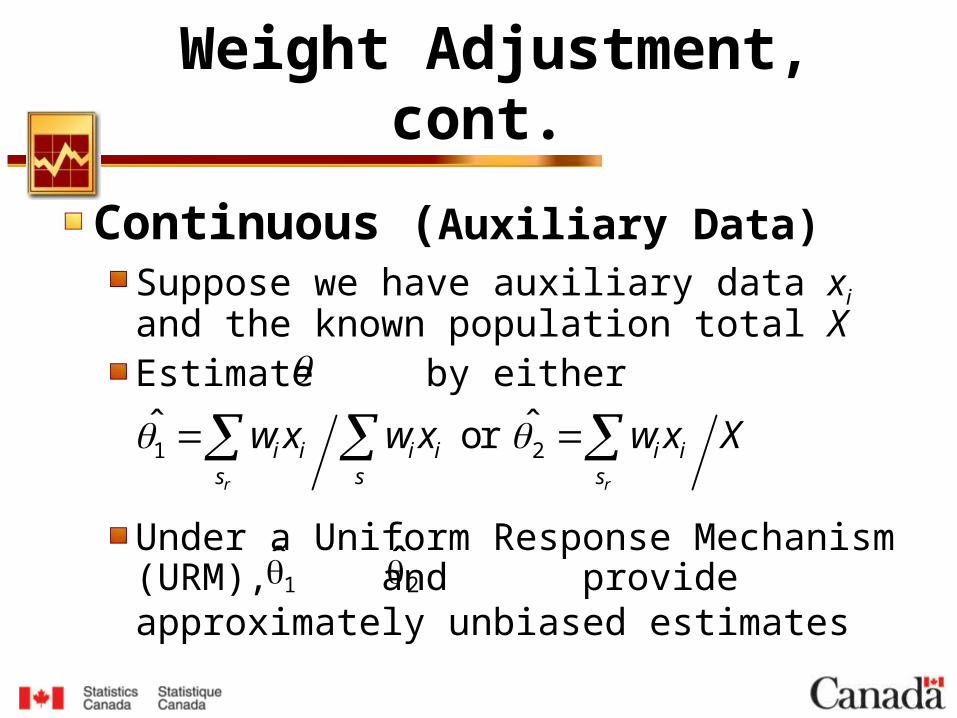
Continuous (Auxiliary Data)Suppose we have auxiliary data xi and the known population total XEstimate by either
Under a Uniform Response Mechanism (URM), and provide approximately unbiased estimates
1 2ˆ ˆ or
r r
i i i i i is s s
w x w x w x X
1 2

Weight Adjustment, cont.
Continuous (Auxiliary Data)Note that leads to a two-phase estimator and to the well known ratio estimator
calibrates to the known total X
12
2

Weight Adjustment, cont.
Continuous (Auxiliary Data)If we have marginal totals for 2 auxiliary variables, X and Z, one can use raking
M F
15-30 ? ? Z1
30-65 ? ? Z2
65+ ? ? Z3
X1 X2
Weight Adjustment, cont.
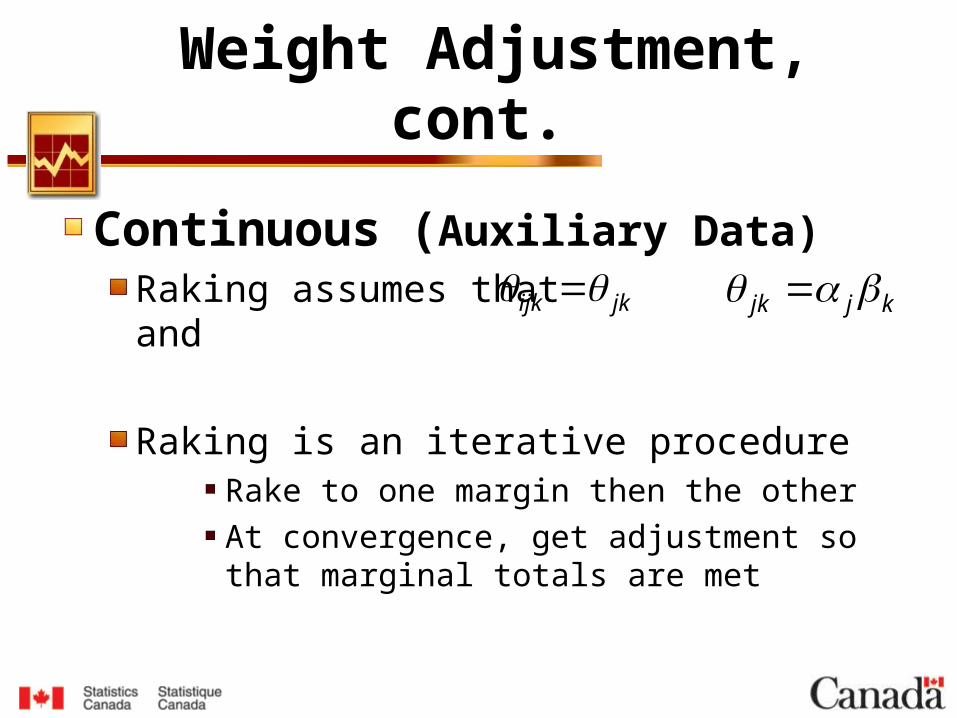
Continuous (Auxiliary Data)Raking assumes that and
Raking is an iterative procedureRake to one margin then the other
At convergence, get adjustment so that marginal totals are met
jkijk kjjk
Weight Adjustment, cont.
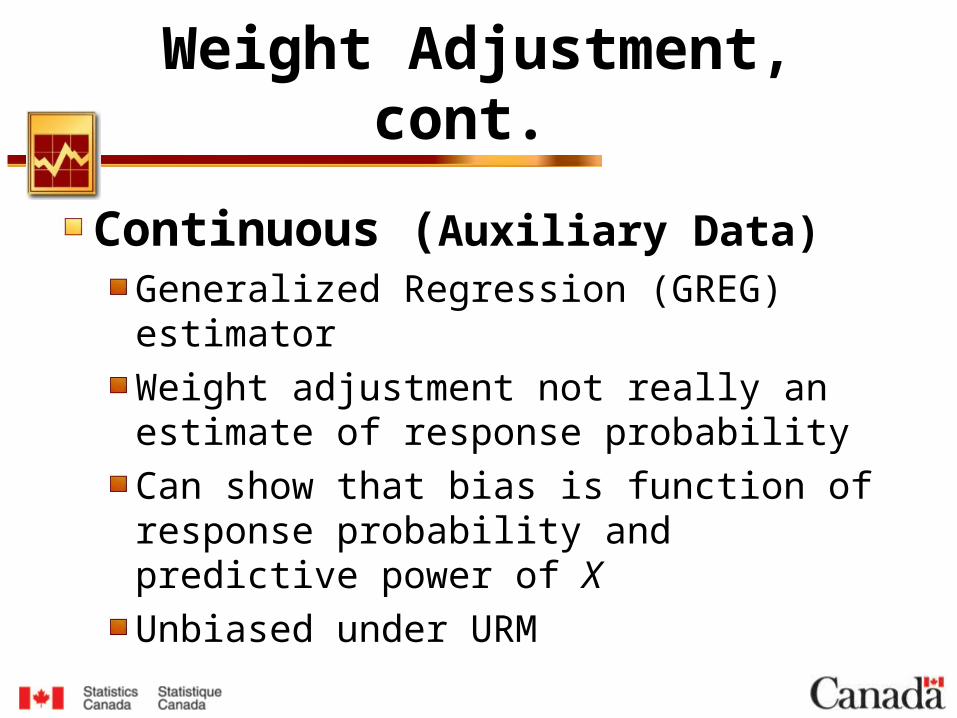
Continuous (Auxiliary Data)Generalized Regression (GREG) estimator
Weight adjustment not really an estimate of response probability
Can show that bias is function of response probability and predictive power of X
Unbiased under URM
Weight Adjustment, cont.
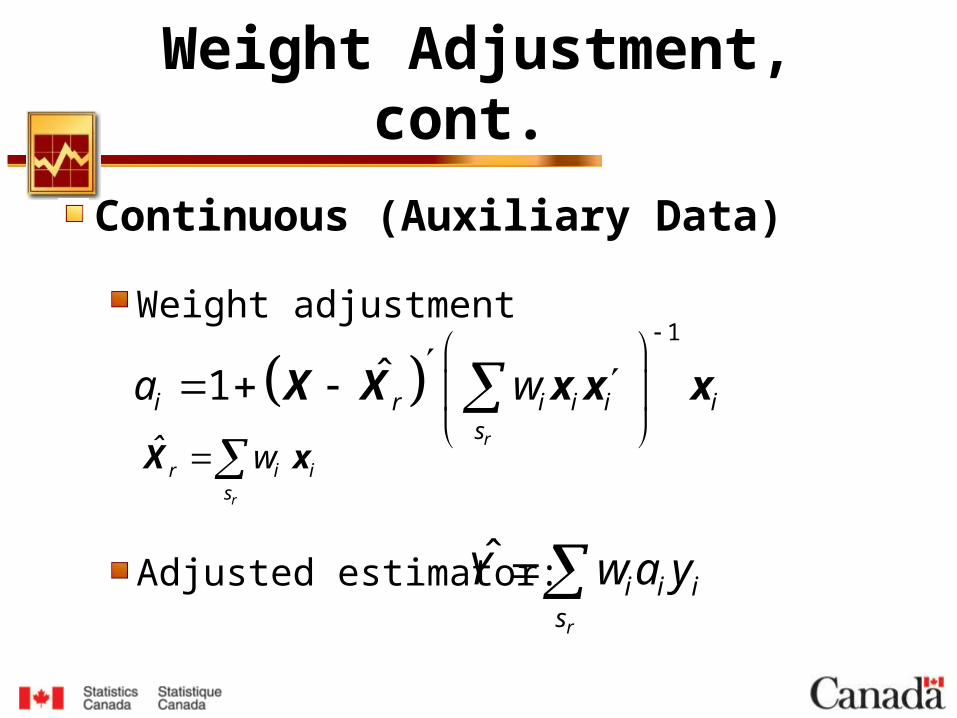
Continuous (Auxiliary Data)
Weight adjustment
Adjusted estimator:
1
ˆ1r
i r i i i is
a w
X X x x x
rs
iii yawY
r
r i is
ˆ wX x
Weight Adjustment, cont.
Weighting ClassesAssumption of URM very strong and somewhat unrealistic
Usually define weighting classesMutually exclusive and exhaustive groups C1, C2, …,CR
Assume URM within each class
Weight Adjustment, cont.
How to define weighting classes?Using auxiliary data to group units so that within the weighting class
Using auxiliary data and logistic regression models
Obtain for all i
Form groups so that
ri
iri ˆ
Weight Adjustment, cont.
Weighting ClassesIf weighting class variable is good at predicting y and non-response, bias and variance will be reduced
If weighting class variable unrelated to non-response but is good predictor of y, no bias reduction but variance reduced
If weighting class variable unrelated to y, no bias reduction. Variance could increase if weighting class variable good predictor of non-response!
Imputation
Usually used for item non-response
Can be used for unit non-response also
Several methods available
Deductive imputation
Class mean imputation
Cold-deck imputation (earlier survey/ historical)
Imputation
Hot-deck imputation (current survey)Random overall imputation
Random imputation classes
Sequential hot deck
Distance function matching
Regression imputationSimplest example is ratio
Imputation, cont.
For business surveys, most commonly used methods involve auxiliary data
Historical dataIf data available from previous time period, use it with a trend (last month / last year)
If none available, use a mean imputation
Administrative data (i.e. tax)Use tax data with or without an adjustment
At Statistics Canada, annual tax data used to directly replace and monthly tax data adjusted before use
Summary
Reduce non-response at front-endFrameContact vehicleEditing
Measure non-responseFollow-up selectively and representatively
Adjust for non-responseModel (Weighting /imputing / Logistic Regression)Homogeneous classes
References
Bethlehem, J.G. (1988) reduction of Nonresponse bias through regression estimation. Journal of Official Statistics, Vol. 4, No. 3, 251-260.
Cochran, W.G. (1977): Sampling Techniques. Third Edition, Wiley, New York. Cornish J. (2004). Response Problems In Surveys: improving response and minimising the load for UNSD. Regional
Seminar on 'Good Practices in the Organization and Management of Statistical Systems’ for ASEAN countries, Yangon Myanmar, 11-13 December 2002.
DeLeeuw, Edith D (ed) (1999). Special issues on Survey Nonresponse Journal of Official Statistics 15, 2.Dillman, D. A. Procedures for Conducting Government-Sponsored Establishment Surveys: Comparisons of the Total
Design Method (TDM), a Traditional Cost- Compensation Model, and Tailored Design, Washington State University.
Ekholm, A. and Laaksonen, S. (1991). Weighting via Response Modeling in the Finnish Household Budget Survey. Journal of Official Statistics, 7, 325–337.
Ekholm, A. and Laaksonen, S. (1991). Weighting via Response Modeling in the Finnish Household Budget Survey. Journal of Official Statistics, 7, 325–337.
Elliot, M.R., Little, R.J.A., and Lewitzky, S. (2000). Subsampling Callbacks to Improve Survey Efficiency. Journal of the American Statistical Association, 95, 730–838.
Groves R M, Dillman D A, Eltinge J L & Little R J A (eds), Survey Nonresponse, 2002, Chichester: WileyHansen, M. H., and Hurwitz, W. N. (1946), The Problem of Nonresponse in Sample Surveys, Journal of the American
Statistical Association, 41, 517–529.Hedlin, D. (2003).Score Functions to Reduce Business Survey Editing at the U.K. Office for National Statistics . Journal
of Official Statistics, Vol.19, No.2, 177-199Hidiroglou, M. A, Drew, D. J, and Gray, G. B, June 1993 A frameworkfor Measuring and Reducing Nonresponse in
Surveys, Survey Methodology 19:81-94International Conference on Survey Nonresponse (1999). http://jpsm.umd.edu/icsn/papers/Index.htm.Kalton G. and Flores-Cervantes I. (2003). Weighting Methods. Journal of Official Statistics, Vol.19, No.2, 2003. pp. 81-
97
References
Laaksonen, S. and Chambers, R. (2006). Survey Estimation under Informative Nonresponse with Follow-up. Journal of Official Statistics, Vol. 22, No. 1, 2006, 81–95.
Latouche, M. and Berthelot, J.-M., (1992). Use of a Score Function to Prioritize and Limit Recontacts in Editing Business Surveys. Journal of Official Statistics, Vol.8, No.3, 1992. 389-400.
Lawrence D. and McKenzie R. (2000).The General Application of Significance Editing . Journal of Official Statistics, Vol.16, No.3, 243-253
Little, R. (1986). Survey Nonresponse Adjustments for Estimates of Means. International Statistical Review, 54, 139–157.
Lundstrom Sixten and Särndal C.-E. (1999). Calibration as a Standard Method for Treatment of Nonresponse. Journal of Official Statistics, Vol. 15, No. 2, 1999, 305-327.
Lynn, Peter and Clarke, Paul, Separating refusal bias and con-contact bias: evidence from UK national surveys, The Statistician, 51, Part 3, 391-333.
Madow, W.G., Nisselson, H., and Olkin, I. (eds.) (1983): Incomplete Data in Sample Sur veys. Vol. 1: Report and Case Studies. Academic Press, New York.
McKenzie, Richard. (2000). A Framework for Priority Contact of Non Respondents. In the Proceedings of The Second International Conference on Establishment Surveys, Buffalo, New York. 473 - 482.
Rao, J.N.K.(1973 ).Double sampling for stratification and survey.Biometrika ,Vol. 60, No. 1 : 125-133 Särndal, C.-E. and Swensson, B. (1987). A General View of Estimation for Two Phases of Selection with Applications to
Two-Phase Sampling and Nonresponse. International Statistical Review, 55, 279–294.Strauss, E.E., and Hidiroglou, M.A. (1984). A Follow-up Procedure for Business Census Type Surveys. In Topics in
Applied Statistics. Y.P. Chaubey and T.D. Dwivedi ed., 447-453. Published by Concordia University, Montréal.Valliant R. (2004) The Effect of Multiple Weighting Steps on Variance Estimation Journal of Official Statistics, Vol.20,
No.1, 1-18.Wang, J.E. (2004). Non-response in the Norwegian Business Tendency Survey. Statistics Norway Department of
Economic Statistics.

Score Function, cont
No follow-up on occasion t-a
Partial follow-up on occasion t-a
Full follow-up on occasion t-a
1_
ˆ IMPNO FU j j j j
j RESP j RESP
Y t - a w t a y t - a w t a y t - a
_
2
2
PART FU j jj RESP
IMPj j
j RE
j jj
SP
FU
Y t - a w t a y t - a
w t a y t -
w t a y t - a
a
_FULL FU j jj RESPFULL
Y t - a w t a y t - a