Embed Size (px)
Citation preview

Water and Environmental EngineeringDepartment of Chemical EngineeringMaster Thesis 2014
Dora Stefansdottir
Manometric method for evaluation of anammox activity in mainstream
anammox at Sjölunda WWTP


Postal address Visiting address Telephone P.O. Box 124 Getingevägen 60 +46 46-222 82 85 SE-221 00 Lund, Sweden +46 46-222 00 00 Web address Telefax www.vateknik.lth.se +46 46-222 45 26
Manometric method for evaluation of anammox activity in mainstream anammox
at Sjölunda WWTP
by
Dora Stefansdottir
Master Thesis number: 2014-09
Water and Environmental Engineering Department of Chemical Engineering
Lund University
October 2014
Supervisor: Professor Jes la Cour Jansen Co-supervisor: PhD David Gustavsson R&D Engineer, VA SYD Examiner: Associate professor Karin Jönsson
Picture on front page: Manammox pilot plant. Photo by Dora Stefansdottir.


Preface This master thesis has been performed at Water and Environmental Engineering, Department of Chemical Engineering at Lund University in cooperation with VA SYD.
The main part of the experimental work has been performed at Sjölunda WWTP for an intensive period of three months. I would like to express my thankfulness to all employees at Sjölunda WWTP who provided a friendly and supportive environment. Without your helpfulness, advices and kindness, my work would not have been manageable. Thanks to Gertrud Persson and Salar Haghighatafshar at Water and Environmental Engineering, Department of Chemical Engineering at Lund University for your support and help with experimental devices.
I would also like to express my great thankfulness to my supervisors, Jes la Cour Jansen and David Gustavsson, for continuous support, interesting discussions and help throughout this challenging project. Your knowledge has been both valuable and inspiring.
At the end, I like to thank my beloved family. No words can be used to describe how much your support has meant to me.
Lund October 2014
Dora Stefansdottir


Summary
Nitrogen removal from municipal and industrial wastewaters is commonly accomplished with a biological process involving nitrification combined with denitrification. Due to increased load on the ecosystem and new regulations, this configuration becomes more and more economically and environmentally unsustainable. An interesting alternative to achieve an efficient nitrogen removal is to combine nitritation of approximately half of the ammonium to nitrite with oxidation of remaining ammonium and the nitrite as electron acceptor to nitrogen gas under anaerobic conditions by ANaerobic AMMonium OXidising (anammox) bacteria. The nitritation-anammox process has been found to be both environmentally and economically profitable and has been used for several years in treatment of ammonium rich sludge liquor streams. Implementing the anammox process in the mainstream is however considered to be challenging, due to insufficient knowledge of handling the slow growing anammox bacteria in unfavourable conditions in the mainstream, with low nitrogen concentrations and low temperature.
In this regard, the aim of the master thesis was to further develop a method to measure and evaluate the specific anammox activity (SAA). The research was performed with MBBR carriers type K1® from the mainstream anammox (Manammox) pilot plant at Sjölunda Wastewater Treatment Plant (WWTP) in Malmö. Carriers from three different reactor types were analysed. Furthermore, this thesis work included implementation of the activity test for frequent investigation of the anammox activity in the Manammox pilot and analysis of the effect of temperature change on the anammox activity.
The anammox activity was measured by continuously monitored manometric batch tests, where the pressure increment is proportional to amount of produced nitrogen gas. The developed method was found to be reliable and reproducible. Moreover, the procedure for the activity test is applicable for further research at the Manammox pilot plant.
The specific anammox activity showed a dependency of initial nitrite concentrations below 75 mg N L-1 whereas the activity was found to be independent of initial concentrations in the interval of 75–125 mg N L-1. No tendency of nitrite inhibition was found at tested initial nitrite concentrations in this study. Temperature dependency of the SAA as expressed in activation energy (Ea) increased at lower temperatures (10–20°C) compared to higher temperatures (20–30°C) for carriers sampled from all three reactor types. Decreasing temperature from 30°C to 10°C resulted in 95% loss of the anammox activity in samples from the reactor for sludge liquor treatment (RP) and Manammox Pilot 1 (MP1) respectively and 98% loss of activity in samples from Manammox Pilot 2 (MP2). The variation of measured SAA between days performed under the particular time period was found to be 3% and 2% for carriers sampled from RP and MP1 respectively, but 17% in tests performed with carriers sampled from MP2.


Sammanfattning
Konventionell kväverening av kommunala och industriella avloppsvatten åstadkoms vanligtvis med biologiska processer som baseras på nitrifikation i kombination med denitrifikation. På grund av ökad belastning på akvatiska och marina ekosystem och nya lagstiftningar med strängare reningskrav, blir denna konfiguration allt mer ekonomiskt och miljömässigt ohållbar. Ett intressant alternativ för att uppnå en effektiv kvävereducering är att kombinera oxidering av ungefär hälften av inkommande ammonium till nitrit, med omvandling av kvarvarande ammonium och den nybildade nitriten till kvävgas. Det senare steget åstadkoms med hjälp av anammoxbakterier (anaerobic ammonium oxidation). Anammox baserade processer har visat sig vara både miljömässigt och ekonomiskt lönsamma och har under de senaste åren inkluderas för behandling av ammoniumrikt och varmt rejektvatten. Implementering av anammox i huvudströmmen är däremot utmanande, på grund av bristande kunskap på hantering av de långsamt växande anammoxbakterierna i huvudströmmen där förhållandena är ogynnsamma.
I detta avseende var syftet med examensarbetet att vidareutveckla en metod för att mäta och utvärdera den specifika anammoxaktiviteten (SAA). Analyserna utfördes på MBBR bärarmaterial av typen K1® från pilotanläggning som använder nitritation-anammox för behandling av huvudströmmen (Manammoxpiloten) vid Sjölunda avloppsreningsverk i Malmö. Bärarmaterial från tre olika reaktorer analyserades. I examensarbetet inkluderades även implementering av aktivitetstestet för frekventa analyser av anammoxaktiviteten i Manammoxpiloten samt effekten av temperaturförändringar på anammoxaktiviteten.
Anammoxaktiviteten mättes med manometriska satstester, där tryckökningen är proportionell mot mängden producerad kvävgas. Den utvecklade metoden visade sig vara tillförlitlig och reproducerbar. Dessutom är proceduren för aktivitetstestet implementerbar för vidare forskning och utveckling av anammox processen i Manammoxpiloten.
Den specifika anammoxaktiviteten visade ett beroende av startkoncentrationer av nitrit vid initiala nitrithalter under 75 mg N L-1. Vid startkoncentrationer i intervallet 75–125 mg N L-1 var aktiviteten oberoende av startkoncentrationen av nitrit. Ingen tendens till nitritinhibering observerades vid testade startkoncentrationer i denna studie. Temperaturberoendet hos SAA, utryckt i aktiveringsenergi (Ea), visade sig öka vid lägre temperaturer (10–20°C) jämfört med högre temperaturer (20–30°C) för bärarmaterial från alla tre reaktorerna. Temperatursänkning från 30°C till 10°C resulterade i förlust på 95 % av anammoxaktiviteten i bärare från rejektvattenpiloten (RP) samt Manammox Pilot 1 (MP1) och 98 % förlust av aktivitet i bärare från Manammox Pilot 2 (MP2). Variationen av uppmätt SAA mellan olika dagar utförda under den specifika perioden visade sig vara 3 % respektive 2 % för bärarmaterial från RP respektive MP1, men 17 % för bärare från MP2.


Acronyms and symbols
Anammox Anaerobic ammonium oxidation
AOA Ammonia Oxidising Archaea
AOB Ammonia Oxidising Bacteria
DO Dissolved Oxygen
Manammox Mainstream anammox
MBBR Moving Bed Biofilm Reactor
MP1 Manammox Pilot 1
MP2 Manammox Pilot 2
NOB Nitrite Oxidising Bacteria
RP Reactor for sludge liquor treatment Process
SAA Specific Anammox Activity
WWTP Wastewater Treatment Plant


Table Of Contents
1 Background ......................................................................................................................... 1
1.1 Aim .............................................................................................................................. 2
1.2 Limitations ................................................................................................................... 2
2 Theory ................................................................................................................................. 3
2.1 Nitrogen cycle and conventional nitrogen removal ..................................................... 3
2.2 ANaerobic AMMonium OXidation - ANAMMOX .................................................... 4
2.3 Deammonification ....................................................................................................... 5
2.4 Moving Bed Biofilm Reactor – MBBR ....................................................................... 6
2.5 Transport phenomena in biofilms ................................................................................ 7
2.6 Processes with anammox applications ......................................................................... 8
2.7 Factors influencing the process .................................................................................... 8
2.8 Controlling and monitoring the process ..................................................................... 11
3 Materials and methods ...................................................................................................... 13
3.1 Sjölunda WWTP ........................................................................................................ 13
3.2 Manammox pilot plant ............................................................................................... 13
3.3 Specific anammox activity (SAA) ............................................................................. 15
3.4 Sampling and pre-treatment ....................................................................................... 15
3.5 Experimental set up and devices ................................................................................ 16
3.6 Preparation of chemical solutions .............................................................................. 17
3.7 Chemical analysis ...................................................................................................... 17
3.8 Method development and implementation ................................................................ 18
3.9 Effect of temperature change ..................................................................................... 22
3.10 Frequent analyses of the anammox activity in the Manammox pilot .................... 23
3.11 Calculations ............................................................................................................ 23
4 Results and discussions .................................................................................................... 27
4.1 Initial experiments and configuration ........................................................................ 27
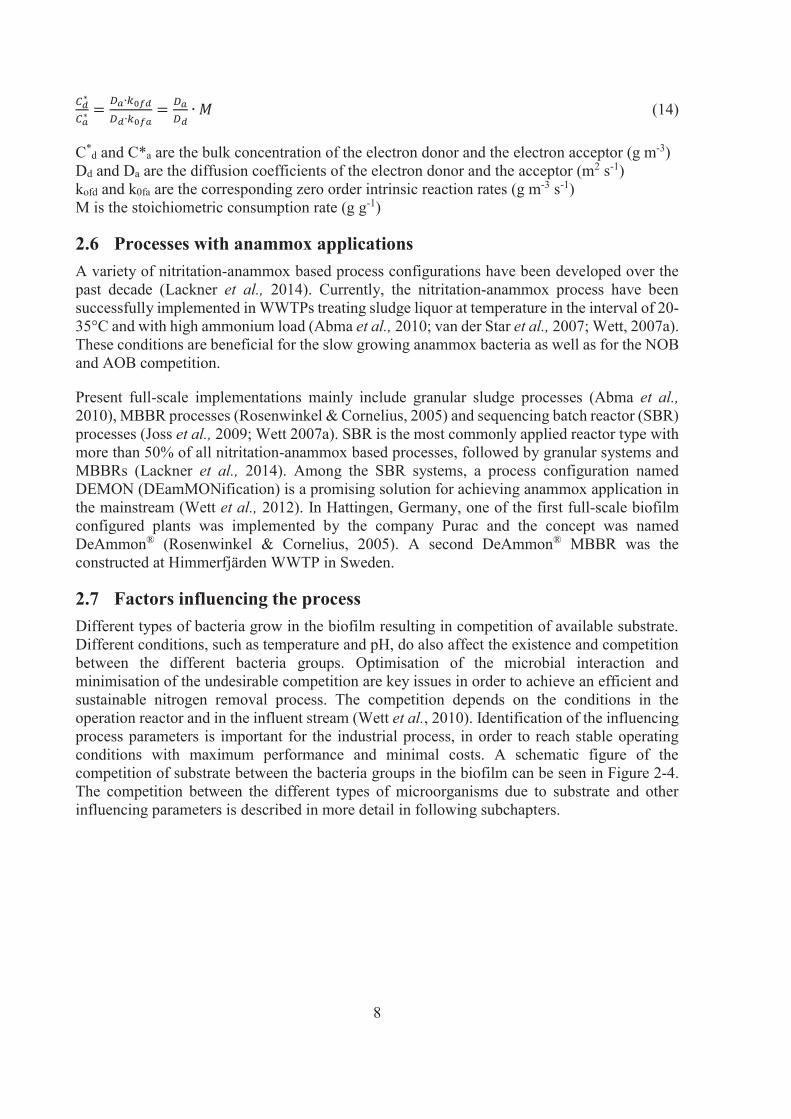
4.2 Reliability and reproducibility ................................................................................... 30
4.3 Initial concentrations and diffusion limitations ......................................................... 34
4.4 Pressure stabilisation .................................................................................................. 37
4.5 Effect of temperature change ..................................................................................... 38
4.6 Frequent analyses of the anammox activity in the Manammox pilot ........................ 43
5 Conclusions ...................................................................................................................... 47
6 Further work ..................................................................................................................... 49
7 References ........................................................................................................................ 51
8 Appendices ....................................................................................................................... 57


1
1 Background
Removal of nitrogen from wastewater has become an emerging concern worldwide. Although nitrogen is essential to all living organisms and the atmosphere consists of 78% nitrogen gas, it becomes a pollutant if the amount reaches higher levels than terrestrial, aquatic and marine ecological system can handle. Nitrogen compounds like ammonium, nitrate and nitrite accumulate in lakes and seas if they are not continuously removed and the accumulation causes eutrophication. In this regard, new legislations were set to prevent eutrophication and according to updated status of the Baltic Sea Action Plan, the nitrogen emission in Sweden must be reduced with 9,240 tonnes per year until year 2021 (HELCOM, 2013).
Nitrogen enters the ecological system mainly through domestic water and industrial pollution. At municipal wastewater treatment plants (WWTPs), traditional nitrogen removal is commonly accomplished with microbiological processes by nitrification-denitrification. The conventional biological nitrogen removal requires in many cases an addition of external carbon source for successful denitrification. With the new legislation, the need of aeration and external carbon source will increase in order to fulfil the requirements. That leads to increased production of greenhouse gases and energy demands (Siegrist et al., 2008; Jetten et al., 1997; Kartal et al., 2010).
An interesting solution to accomplish an efficient nitrogen removal is combining nitritiation of approximately half of the ammonium to nitrite with ammonia oxidising bacteria (AOB), with oxidation of remaining ammonium and the converted nitrite to nitrogen gas under anaerobic conditions by ANaerobic AMMonium OXidising (anammox) bacteria. The anammox bacteria are a relatively new discovered key player in the nitrogen cycle and it was not until 1990 that the anammox process was discovered (Mulder et al., 1995). The anammox bacteria use ammonium as an energy source and nitrite as electron acceptor. Ever since the discovery of the anammox process, the anammox technology has reached an increased interest worldwide and is considered to be an alternative to the conventional nitrogen removal process due to the economic and environmental benefits of the process (Ahn, 2006; Vázques-Padín et al., 2011, Wett 2006).
Currently, the anammox process has been successfully implemented in WWTPs to treat sludge liquor from the dewatering of anaerobically digested sludge at temperatures ranging from 25-35°C and high ammonium concentration (Abma et al., 2010; van der Star et al., 2007; Wett, 2007a). Implementing the process into the mainstream is on the other hand a big challenge since the temperature and the ammonium concentration in the mainstream is much lower compared to conditions in the sludge liquor stream, resulting in undesirable conditions for the slow-growing anammox bacteria.
VA SYD, a municipal joint authority in southern Sweden, have ongoing extensive pilot tests at the WWTP in Malmö (Sjölunda WWTP), analysing the process in Moving Bed Biofilm Reactors (MBBRs). The project is called the Mainstream anammox (Manammox) project and the aim is to implement the nitritation-anammox process in already existing MBBRs in the mainstream (Gustavsson et al., 2012).
To achieve a successful implementation of the nitritation anammox based process, the balance between the different microbial groups involved is of great importance. Aside from sustaining the growth of the anammox bacteria, balanced activity of AOB needs to be achieved in line
2
with a suppression of the nitrite oxidising bacteria (NOB) (Wett et al., 2010). Therefore, reliable methods to analyse the activity of these different groups of microorganisms are required. Additionally, more experiments analysing the activity of these different bacteria under altered conditions are necessary.
In order to get a more efficient nitrogen removal, it is interesting to observe the anammox activity and if it is possible to use the activity test as one of the monitoring parameters in the process.
1.1 Aim The main purpose with this thesis is to further develop a method to measure and evaluate the specific activity of anammox bacteria in the anammox based process performed in a MBBR in the Manammox pilot plant at Sjölunda WWTP.
The effect of temperature change on the specific anammox activity will be analysed with the developed method.
The developed method and procedure will then be applied to perform frequent analysis of the specific anammox activity in the Manammox pilot plant.
Obtained results will be used for determining the direction of further research and control strategies for the process at the pilot plant. The expectation is that the activity test of the anammox bacteria can be used as an important parameter to improve the nitrogen removal in the pilot plant and for full-scale implementation of the anammox process.
Hypothesis
The developed method for measuring the specific anammox activity is reliable, reproducible and applicable for analysis at the pilot plant in Sjölunda WWTP.
Activity test of anammox bacteria can be used as a monitoring parameter for achieving stable and efficient nitrogen removal process.
1.2 Limitations In this thesis work, only the method for anammox activity was developed, evaluated and analysed. In the biofilm, several bacteria groups exists, but measurements and analysis of these bacteria groups were not in the frame for this thesis work.
3
2 Theory
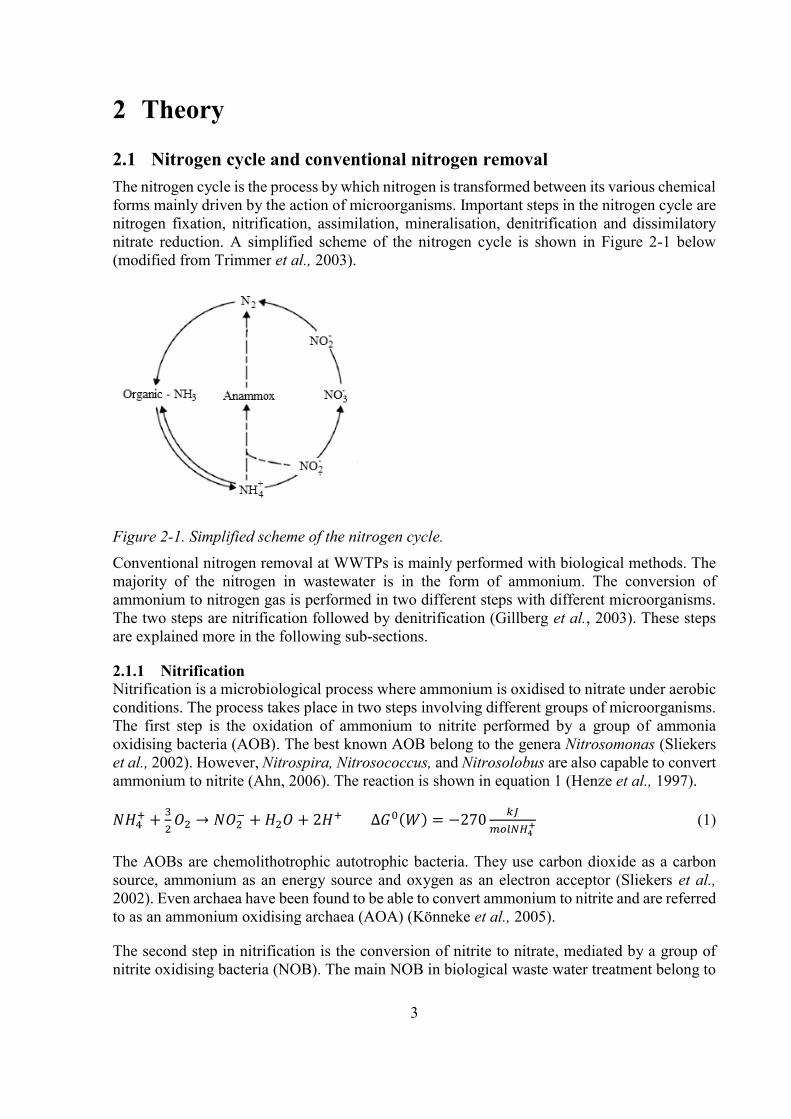
2.1 Nitrogen cycle and conventional nitrogen removal The nitrogen cycle is the process by which nitrogen is transformed between its various chemical forms mainly driven by the action of microorganisms. Important steps in the nitrogen cycle are nitrogen fixation, nitrification, assimilation, mineralisation, denitrification and dissimilatory nitrate reduction. A simplified scheme of the nitrogen cycle is shown in Figure 2-1 below (modified from Trimmer et al., 2003).
Figure 2-1. Simplified scheme of the nitrogen cycle.
Conventional nitrogen removal at WWTPs is mainly performed with biological methods. The majority of the nitrogen in wastewater is in the form of ammonium. The conversion of ammonium to nitrogen gas is performed in two different steps with different microorganisms. The two steps are nitrification followed by denitrification (Gillberg et al., 2003). These steps are explained more in the following sub-sections.
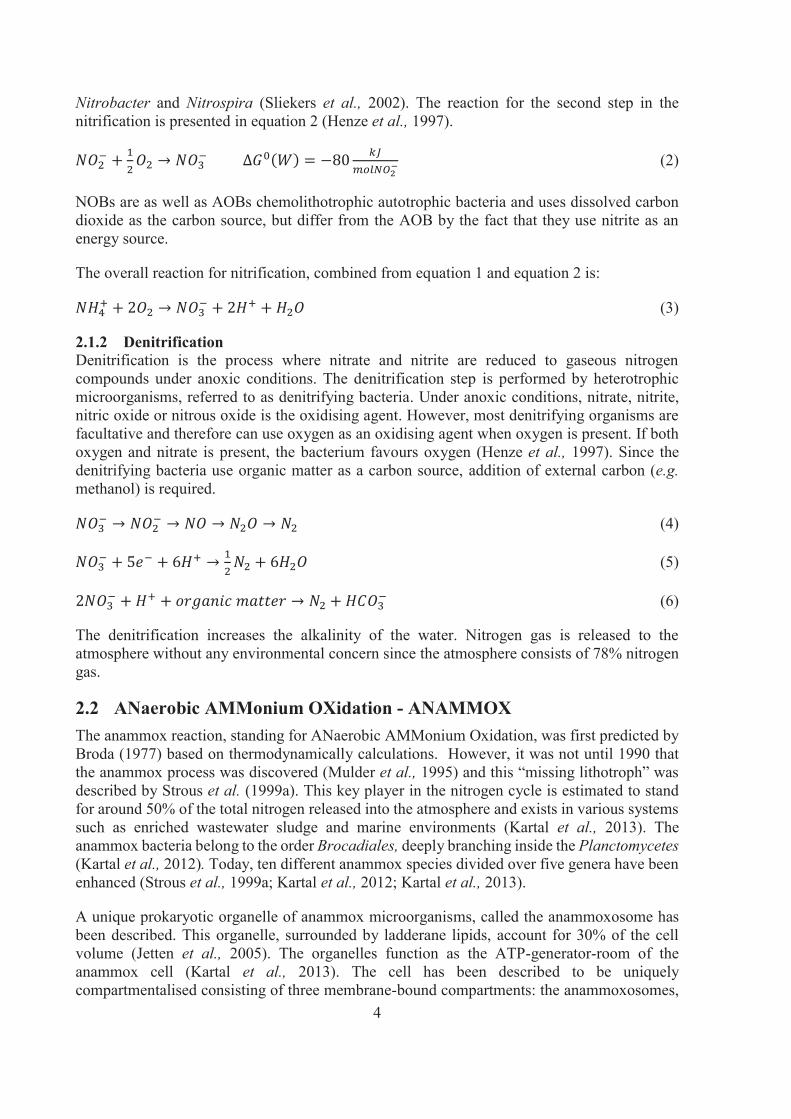
2.1.1 Nitrification Nitrification is a microbiological process where ammonium is oxidised to nitrate under aerobic conditions. The process takes place in two steps involving different groups of microorganisms. The first step is the oxidation of ammonium to nitrite performed by a group of ammonia oxidising bacteria (AOB). The best known AOB belong to the genera Nitrosomonas (Sliekers et al., 2002). However, Nitrospira, Nitrosococcus, and Nitrosolobus are also capable to convert ammonium to nitrite (Ahn, 2006). The reaction is shown in equation 1 (Henze et al., 1997).
(1)
The AOBs are chemolithotrophic autotrophic bacteria. They use carbon dioxide as a carbon source, ammonium as an energy source and oxygen as an electron acceptor (Sliekers et al., 2002). Even archaea have been found to be able to convert ammonium to nitrite and are referred to as an ammonium oxidising archaea (AOA) (Könneke et al., 2005).
The second step in nitrification is the conversion of nitrite to nitrate, mediated by a group of nitrite oxidising bacteria (NOB). The main NOB in biological waste water treatment belong to
4
Nitrobacter and Nitrospira (Sliekers et al., 2002). The reaction for the second step in the nitrification is presented in equation 2 (Henze et al., 1997).
(2)
NOBs are as well as AOBs chemolithotrophic autotrophic bacteria and uses dissolved carbon dioxide as the carbon source, but differ from the AOB by the fact that they use nitrite as an energy source.
The overall reaction for nitrification, combined from equation 1 and equation 2 is:
(3)
2.1.2 Denitrification Denitrification is the process where nitrate and nitrite are reduced to gaseous nitrogen compounds under anoxic conditions. The denitrification step is performed by heterotrophic microorganisms, referred to as denitrifying bacteria. Under anoxic conditions, nitrate, nitrite, nitric oxide or nitrous oxide is the oxidising agent. However, most denitrifying organisms are facultative and therefore can use oxygen as an oxidising agent when oxygen is present. If both oxygen and nitrate is present, the bacterium favours oxygen (Henze et al., 1997). Since the denitrifying bacteria use organic matter as a carbon source, addition of external carbon (e.g. methanol) is required.
(4)
(5)
(6)
The denitrification increases the alkalinity of the water. Nitrogen gas is released to the atmosphere without any environmental concern since the atmosphere consists of 78% nitrogen gas.
2.2 ANaerobic AMMonium OXidation - ANAMMOX The anammox reaction, standing for ANaerobic AMMonium Oxidation, was first predicted by Broda (1977) based on thermodynamically calculations. However, it was not until 1990 that the anammox process was discovered (Mulder et al., 1995) and this “missing lithotroph” was described by Strous et al. (1999a). This key player in the nitrogen cycle is estimated to stand for around 50% of the total nitrogen released into the atmosphere and exists in various systems such as enriched wastewater sludge and marine environments (Kartal et al., 2013). The anammox bacteria belong to the order Brocadiales, deeply branching inside the Planctomycetes (Kartal et al., 2012). Today, ten different anammox species divided over five genera have been enhanced (Strous et al., 1999a; Kartal et al., 2012; Kartal et al., 2013).
A unique prokaryotic organelle of anammox microorganisms, called the anammoxosome has been described. This organelle, surrounded by ladderane lipids, account for 30% of the cell volume (Jetten et al., 2005). The organelles function as the ATP-generator-room of the anammox cell (Kartal et al., 2013). The cell has been described to be uniquely compartmentalised consisting of three membrane-bound compartments: the anammoxosomes,
5
riboplasm and paryphoplasm (Kartal et al., 2013). The anammox bacteria are coccoid cells with a diameter of 0.8 μm and characterized by the red colour (Kartal et al., 2012).
The anammox bacteria have unique property to oxidise ammonium directly to nitrogen gas in the absence of oxygen, with nitrite as an electron acceptor and bicarbonate (HCO3
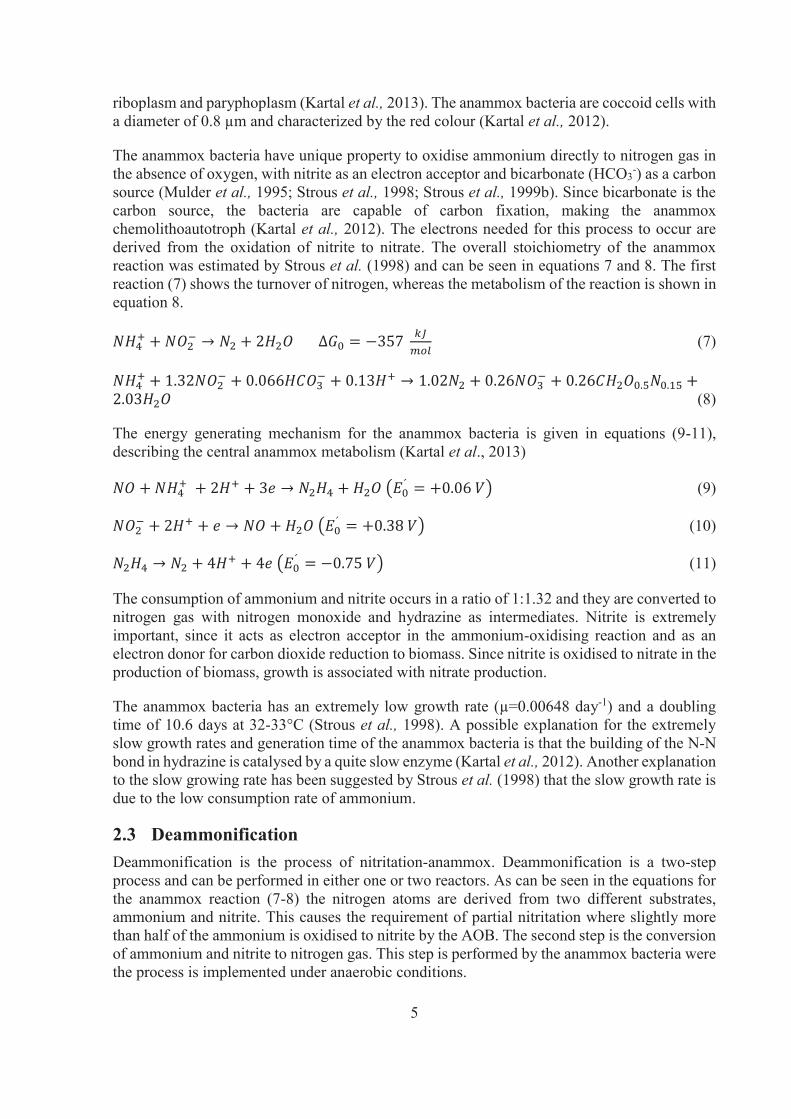
-) as a carbon source (Mulder et al., 1995; Strous et al., 1998; Strous et al., 1999b). Since bicarbonate is the carbon source, the bacteria are capable of carbon fixation, making the anammox chemolithoautotroph (Kartal et al., 2012). The electrons needed for this process to occur are derived from the oxidation of nitrite to nitrate. The overall stoichiometry of the anammox reaction was estimated by Strous et al. (1998) and can be seen in equations 7 and 8. The first reaction (7) shows the turnover of nitrogen, whereas the metabolism of the reaction is shown in equation 8.
(7)
(8)
The energy generating mechanism for the anammox bacteria is given in equations (9-11), describing the central anammox metabolism (Kartal et al., 2013)
(9)
(10)
(11)
The consumption of ammonium and nitrite occurs in a ratio of 1:1.32 and they are converted to nitrogen gas with nitrogen monoxide and hydrazine as intermediates. Nitrite is extremely important, since it acts as electron acceptor in the ammonium-oxidising reaction and as an electron donor for carbon dioxide reduction to biomass. Since nitrite is oxidised to nitrate in the production of biomass, growth is associated with nitrate production.
The anammox bacteria has an extremely low growth rate (μ=0.00648 day-1) and a doubling time of 10.6 days at 32-33°C (Strous et al., 1998). A possible explanation for the extremely slow growth rates and generation time of the anammox bacteria is that the building of the N-N bond in hydrazine is catalysed by a quite slow enzyme (Kartal et al., 2012). Another explanation to the slow growing rate has been suggested by Strous et al. (1998) that the slow growth rate is due to the low consumption rate of ammonium.
2.3 Deammonification Deammonification is the process of nitritation-anammox. Deammonification is a two-step process and can be performed in either one or two reactors. As can be seen in the equations for the anammox reaction (7-8) the nitrogen atoms are derived from two different substrates, ammonium and nitrite. This causes the requirement of partial nitritation where slightly more than half of the ammonium is oxidised to nitrite by the AOB. The second step is the conversion of ammonium and nitrite to nitrogen gas. This step is performed by the anammox bacteria were the process is implemented under anaerobic conditions.

6
Performing deammonification in two reactors, were nitritation and the anammox process are performed in separate reactors, the optimal conditions for the AOB and the anammox bacteria more easily can be accomplished (Ma et al., 2011). On the other hand, deammonification in one single reactor benefits in significantly lower investment costs, lower risk for nitrite inhibition and less nitrous oxide emissions (Cho et al., 2011; Kampschreur et al., 2009).
To allow simultaneous performance of the nitritation and anammox processes, one stage deammonifiation is carried out in biofilms. The biofilm can grow on carriers, like Kaldnes carries, or be in granules (Mulder et al., 1995). In the biofilm, the AOB are believed to be placed in the outer layer and the anammox bacteria in the inner layer (Vlaeminck et al., 2010). With this configuration, the anammox bacteria are protected from oxygen, which otherwise would completely inhibit the process (Jetten et al., 2001). The dominating groups in the system are the AOB and anammox bacteria. However, avoiding NOB and heterotrophic bacteria is very hard, resulting in a competition of the available substrate (Wett, 2007b).
Nitrogen-anammox bioreactors afford environmental friendly and economical alternative to the conventional nitrogen removal process. The benefits of the anammox process in WWTPs compared to the conventional nitrification-denitrification are that no additional organic carbon source is needed which instead can be used to biogas production and the aeration can be decreased by about 60% since only the half of the ammonium is oxidised by AOB with oxygen as electron acceptor. Another benefit with the anammox process is that the production of sludge decreases, which lowers the overhead costs at the WWTPs. Additionally, the greenhouse gas nitrous oxide is not an intermediate in the anammox reaction (Kartal et al., 2011; Van Hulle et al., 2010)
2.4 Moving Bed Biofilm Reactor – MBBR The MBBRs are reactors were the biofilm grows on small plastic carriers that float in the water, and are kept in the in the reactor by a sieve in the outflow. The MBBR system is a well-known configuration of the one stage deammonification process (Lackner et al., 2014). The carriers can have various configurations and biofilm thickness. The filling ratio can vary depending on the nitrogen removal requirements but should not be more than 70% (Ødegaard et al., 2000). One type of carriers for anammox based processes is KaldnesTM K1, shown in Figure 2-2. The total are of the carriers is 670 mm2 per carrier, with an effective area of 490 mm2per carrier (specific surface area 500 m2 m-3), with length and diameter of 7 mm and 10 mm respectively (Ødegaard et al., 2000).
Figure 2-2. Kaldnes K1 media.

7
2.5 Transport phenomena in biofilms Inside the biofilm, the substrate needs to be transported to the bacteria where the reaction occurs, and the products produced in the reaction needs to be transported out to the bulk. The transport of the substrate and the reaction products can be described by Fick´s law of diffusion (la Cour Jansen & Harremoës, 1984). The transport phenomena inside a biofilm are illustrated in Figure 2-3.
Figure 2-3. Model for removal of soluble substrates inside a biofilm (with permission from la Cour Jansen & Harremoës, 1984).
According to la Cour Jansen & Harremoës (1984), the bulk process can be described by analysing the diffusion of the substrate and the reaction products through the biofilm. The diffusion leads to a bulk process of either half or zero order, with respect to the bulk concentration of the considered substrate. This results in following equations:
valid for (12)
valid for (13)
ra is the removal rate per unit area of biofilm surface (g m-2 s-1) k0a is the zero order removal rate per unit area (g m-2 s-1) k1/2a is the half order rate constant per unit area (g1/2 m-1/2 s-1) k0f is the intrinsic zero order removal rate in the biofilm (g m-3 s-1) L is the thickness of the biofilm (m) D is the molecular diffusion coefficient (m2 s-1) C* is the bulk concentration at the surface of the biofilm (g m-3) β is a dimensionless constant, the “penetration ratio”
From the equations, it can be stated that when the substrate penetrates the biofilm fully (β≥1) the bulk process become zero order and independent of the substrate concentration. At a lower substrate concentration in the bulk, the film only gets partially penetrated due to diffusion limitations and the bulk process follows half order and is dependent of the bulk substrate concentration. The limiting factor is either the electron acceptor or the electron donor and can be calculated by equation 14.
8
(14)
C*d and C*a are the bulk concentration of the electron donor and the electron acceptor (g m-3)
Dd and Da are the diffusion coefficients of the electron donor and the acceptor (m2 s-1) kofd and k0fa are the corresponding zero order intrinsic reaction rates (g m-3 s-1) M is the stoichiometric consumption rate (g g-1)
2.6 Processes with anammox applications A variety of nitritation-anammox based process configurations have been developed over the past decade (Lackner et al., 2014). Currently, the nitritation-anammox process have been successfully implemented in WWTPs treating sludge liquor at temperature in the interval of 20-35°C and with high ammonium load (Abma et al., 2010; van der Star et al., 2007; Wett, 2007a). These conditions are beneficial for the slow growing anammox bacteria as well as for the NOB and AOB competition.
Present full-scale implementations mainly include granular sludge processes (Abma et al., 2010), MBBR processes (Rosenwinkel & Cornelius, 2005) and sequencing batch reactor (SBR) processes (Joss et al., 2009; Wett 2007a). SBR is the most commonly applied reactor type with more than 50% of all nitritation-anammox based processes, followed by granular systems and MBBRs (Lackner et al., 2014). Among the SBR systems, a process configuration named DEMON (DEamMONification) is a promising solution for achieving anammox application in the mainstream (Wett et al., 2012). In Hattingen, Germany, one of the first full-scale biofilm configured plants was implemented by the company Purac and the concept was named DeAmmon® (Rosenwinkel & Cornelius, 2005). A second DeAmmon® MBBR was the constructed at Himmerfjärden WWTP in Sweden.
2.7 Factors influencing the process Different types of bacteria grow in the biofilm resulting in competition of available substrate. Different conditions, such as temperature and pH, do also affect the existence and competition between the different bacteria groups. Optimisation of the microbial interaction and minimisation of the undesirable competition are key issues in order to achieve an efficient and sustainable nitrogen removal process. The competition depends on the conditions in the operation reactor and in the influent stream (Wett et al., 2010). Identification of the influencing process parameters is important for the industrial process, in order to reach stable operating conditions with maximum performance and minimal costs. A schematic figure of the competition of substrate between the bacteria groups in the biofilm can be seen in Figure 2-4. The competition between the different types of microorganisms due to substrate and other influencing parameters is described in more detail in following subchapters.

9
Figure 2-4. Competition of substrate in the biofilm.
2.7.1 Dissolved oxygen Dissolved oxygen (DO) has been found to be one of the main factors inhibiting the activity of the anammox process (Wett et al., 2010). Oxygen is needed for the AOB to oxidise the ammonium to nitrite that is used in the anammox reaction. However, anammox have been showed to be reversibly inhibited by high concentration of DO (Strous et al., 1997; Jetten et al., 2001). Too low DO concentrations will on the other hand lead to an insufficient nitrite production decreasing the nitrogen removal in the anammox reaction (Jetten et al., 2001).
The DO concentration has been found to be a very important parameter in outcompeting the NOB, since AOB seem to be more robust against low DO concentration that NOB (Van Hulle et al., 2010). According to Hunik et al. (1994) the oxygen half saturation constant (KO) is 0.16 mg O2 L-1 and 0.54 mg O2 L-1 for AOB and NOB respectively. However, the value for the oxygen affinity parameter vary greatly in the literature, from 0.1-1.45 mg O2 L-1 for AOB and 0.3-1.1 mg O2 L-1 for the NOB (Wett et al., 2012; Hanaki et al., 1990). Regmi et al. (2013) stated that the half saturation coefficient was 0.16 O2 L-1 and 1.14 mg O2 L-1 for NOB and AOB respectively and kinetic out-selection of NOB over AOB could therefore be applied. Higher KO value for NOB compared to AOB have even been suggested by Wett et al (2012). A competition of nitrite between the anammox bacteria and NOB exists in the biofilm, so suppression of the NOB is a crucial action in order to achieve an efficient nitrogen removal process. An intermittent aeration has also been shown to negatively affect the NOB (Wett et al., 2012).
In a recent study, DO concentration of 1.1-1.3 mg O2 L-1 was found to be optimal, but increasing DO to 1.7 mg O2 L-1 increased the activity of NOB resulting in higher nitrate production by NOB (Persson et al., 2014). The set point of oxygen is a balance between stimulating the activity of AOB at the same time of decreasing the activity of the NOB.
2.7.2 Temperature Temperature has been shown to have a great influence on the anammox activity and accomplishing high anammox activity at moderately low temperature is considered to be challenging (Dosta et al., 2008; Hendrickx et al., 2012; Hu et al., 2013; Vázques-Padín et al., 2011).
The optimum temperature interval for the anammox bacteria was claimed to be between 20-37°C by Strous et al. (1999b). Temperature in the interval between 35-40°C have been shown to be optimal by several studies (van der Star et al., 2007) and Egli et al. (2001) claimed that the highest activity was achieved at 37°C with no observed activity at 45°C and 24% less activity at 11°C compared to the activity at 37°C.

10
It is important to consider the temperature dependency of the other types of microorganisms growing in the biofilm. At low temperatures, the activity of anammox and AOB decreases significantly as well as the growth rate. This results in a great decrease of nitrogen removal capacity. On the other hand, high temperature enables the partial nitrification by washout of NOB, since the NOB have a lower growth rate than the AOB at temperatures above 20-25°C (Hellinga et al., 1998).
The wastewater is commonly below 20°C, making the suppression of NOB by high temperature difficult. Even with these hinders, experiments on lab-scale have accomplished to reach a stable process with temperatures below 20°C and a recent study by Hu et al. (2013) stable operation conditions at 12°C was achieved. Additionally, a nitrogen removal of 0.2 g N (L d)-1 was observed in a system operated at 15°C (Vázques-Padín et al., 2011). Interestingly, a recent study with MBBR system presented a stable but decreasing nitrogen removal at temperatures between 13-19°C, but at 10°C the removal became unstable (Persson et al., 2014).
2.7.3 Substrate concentration The nitrite concentration is a crucial parameter for the anammox process. Even though nitrite is an essential substrate, too high concentration is inhibitory to the reaction. However, reported inhibitory concentrations span over a wide range. Complete inhibition for concentrations above 100 mg N L-1 was reported by Strous et al. (1999b) whereas Egli et al. (2001) showed that inhibitory effects were found at concentrations above 182 mg N L-1. Moreover, a 50% inhibition of the anammox process at 350 mg N L-1 was found by Dapena-Mora et al. (2007). Lotti et al. (2012) claimed that inhibition increases with exposure time and according to a previous study, the inhibition effect was larger when bacteria were pre-exposed to nitrite in absence of ammonia (Carvajal-Arroyo et al., 2014). An acceleration of anammox decay starting from 4.8 mg NO2
--
N L-1 was reported by Wett et al. (2007b). Wett et al. (2007b) claimed that high concentration of accumulated nitrite causes irreversible toxic impact on the anammox bacteria and in the DEMON process, the nitrite concentration is kept below 5 mg N L-1 to avoid inhibition (Wett, 2007a). Free ammonia have even been shown to be inhibitory factor for the anammox process (Strous 1999b) where the unprotonated form can diffuse through the cell lipid membrane of bacteria and affect the activity. The chemical balance between the ammonium ions and the ammonia is balanced with pH and temperature.
2.7.4 pH Strous et al. (1999b) observed anammox activity within a pH interval of 6.7 and 8.3 and an optimal pH for the anammox bacteria was claimed to be pH 8 (Egli et al., 2001). The pH level effects the concentration of free ammonia and free nitrous acid (FNA) in the reactors. Higher pH will lead to increment of the concentration of free ammonia and decreased concentration of FNA (Anthonisen et al., 1976). Optimal conditions for nitrification are pH between 7.5 and 8.5 (Hunik et al., 1994; Jetten et al., 2001).
2.7.5 Organic substrate Wastewater containing low concentration of organic matter is favourable for the anammox process since the anammox bacteria are autotrophs. Higher chemical oxygen demand (COD) concentration in the waste water causes increment of the heterotrophic bacteria, which leads to increased competition of oxygen between the heterotrophs and AOB (Wett et al., 2010). To avoid the competition, the COD should be removed in a separate step before the stream enters the MBBR (Gustavsson et al., 2012).

11
2.8 Controlling and monitoring the process In order to achieve a stable and successful implementation and operation of the anammox process, proper control strategies are necessary. Several control strategies have been developed based on different parameters. A control system of pH value based aeration is one opportunity, configured with pH as a monitoring parameter used for adjusting the oxygen supply. Since the nitritation reaction depresses the pH whereas the anammox reaction elevates the pH, the actual duration of aeration intervals are ruled by the pH-signal which characterizes the current state of reaction (Wett, 2007b). Intermittent aeration with high DO to repress NOB in the mainstream has even be suggested (Regmi et al., 2014). On-line measurements of conductivity, nitrogen concentrations and redox potential are additional alternatives that are used as monitoring parameters (Lackner et al., 2014). The monitoring parameters are really important to help adjusting the appropriate oxygen supply in the system in order to accomplish an efficient nitrogen removal (Wett, 2007b; Lackner et al., 2014).

12

13
3 Materials and methods
3.1 Sjölunda WWTP The Sjölunda WWTP is one of the largest WWTP in Sweden, designed for 550.000 population equivalents (pe) regarding COD removal (Hanner et al., 2003). The WWTP Malmö was built in 1963 and has been upgraded in 1970, 1979 and 1998, and the last upgrading was performed to implement nitrification in trickling filters and post-denitrification in MBBRs to fulfil 10 mg N L-1 as a yearly average. A schematic figure of the process can be seen in Figure 3-1.
Figure 3-1. Configuration of the WWTP in Sjölunda.
Nitrification is performed in four parallel nitrifying trickling filters (NTFs) with a nitrification rate of 1.75 g NH4
+-N (m2 day)-1. Denitrification is achieved in MBBR, with media from AnoxKaldnes with filling degree of 50%. The configuration of the denitrification is six parallel lines with two MBBRs in every line. The external carbon source used is methanol and the designed denitrification rate is 1.2 g NO3
--N (m2 day)-1 at 10°C. A dissolved air flotation process is used to remove suspended solids in the effluent from the post-denitrifying MBBR.
3.2 Manammox pilot plant The Manammox pilot plant consists of three MBBRs. One 1.5 m3 reactor for sludge liquor treatment (RP) and two 2.6 m3 reactors in series for the mainstream process (Manammox Pilot 1 = MP1 and Manammox Pilot 2 = MP2), receiving effluent from the present HLAS (High Loaded Activated Sludge). The configuration can be seen in Figure 3-2.
The three reactors are filled with K1® carriers (AnoxKaldnes, Sweden) from the sludge liquor treatment plant at Himmerfjärden WWTP, Sweden (Plaza et al., 2011) with a filling degree of 40%. Every second weekday, carriers are manually transferred between the mainstream reactors (MP1 and MP2) and the sludge liquor reactor (RP), where the amount of transferred carriers is approximately 6% and 22% of the carriers in the mainstream and sludge liquor system respectively (Gustavsson et al., 2014). The exchange of carriers between the three reactors is performed to stimulate the growth of AOB and anammox bacteria and repress the NOB growth.

14
Figure 3-2. Sjölunda pilot plant process scheme. Figure taken with permission from Gustavsson et al. (2014).
The goal is to achieve a nitrogen removal efficiency of 70% at a load of 1 g NH4+-N (m2 d)-1
(Gustavsson et al., 2012). A recent article presented that more than 80% nitrogen reduction has been reached in the sludge liquor system, where the load is around 2.0 mg NH4
+-N (m2 d)-1 and up to 60% in the mainstream process, where the load is around 0.83 mg NH4
+-N (m2 d)-1 (Gustavsson et al., 2014). Description of the conditions in the HLAS effluent and the sludge liquor stream is found in Table 3-1.
Table 3-1. Characteristics of HLAS effluent and sludge liquor stream.
HLAS effluent Sludge liquor (July 14, 2013 – July 10, 2014) (July 14, 2013- June 26, 2014)
Parameter [Unit] Average Standard deviation Average Standard deviation
SS [mg L-1] 43 47 1625 2249 VSS [mg L-1] 35 23 1421 1963 COD [mg L-1] 96 36 1963 2389 COD filtered [mg L-1] 55 13 283 57 BOD7 [mg L-1] 27 16 233 216 BOD7 filtered [mg L-1] 7.5 3.2 56 31 P-tot [mg L-1] 1.2 1 75 86 P-tot filtered [mg L-1] 0.25 0.13 15 5.3 N-tot [mg L-1] 35 7.6 953 148 NH4
+-N [mg L-1] 27 6.2 810 107 NO2
--N [mg L-1] 0.15 0.1 - - NO3
--N [mg L-1] 1.5 0.63 - - Alkalinity [mgHCO3
- L-1] 348 96 3888 574
The aeration control in the sludge liquor reactor is based on a pH-set point, whereas manually chosen DO set-points are used in the mainstream reactors. The temperature in the sludge liquor reactor is around 28-29°C and around 14-20°C for the mainstream reactors. Photos of the MP1 and MP2 reactors are presented in Figure 3-3.

15
Figure 3-3. Reactors MP1 and MP2 (left) and MP2 (right) in the Manammox pilot plant.
3.3 Specific anammox activity (SAA) The maximum specific activity of anammox bacteria (SAA) was measured according to methodology described by Dapena-Mora et al. (2007) and modified by Lotti et al. (2012). The methodology has been applied on carriers from the sludge liquor reactor at the Manammox pilot plant in a recent study performed by Gustafsson (2013). The method is based on measuring the increment of pressure inside a closed reactor. The increment of the pressure is proportional to the conversion of nitrite and ammonium to nitrogen gas by the anammox bacteria. With the ideal gas law (14) the pressure difference can be transformed to amount of produced gas.
(14)
Where p is the pressure [mbar], VG is volume of the headspace [m3], n are the moles [mol], R is the ideal gas coefficient [(mbar m3) (mol K)-1] and T is the temperature [K].
The nitrogen production rate is calculated from the maximum slope of the curve (αmax) achieved from the mole increment as a function of time. The equation is shown in equation 15 below.
(15)
The specific anammox activity can then be calculated by equation 16.
(16)
Where MW(N2) is the molecular weight of nitrogen gas [g mol-1], X is number of carriers in the sample and ae is the effective area of the carriers [m2]. The numbers 24 [hour day-1] and 60 [min hour -1] are conversion from minutes to day.
3.4 Sampling and pre-treatment The experiments were performed with carriers from the Manammox pilot plant at Sjölunda WWTP. The carriers were sampled by sinking a bucket in the different reactors (RP, MP1 and MP2) depending on what kind of carriers where analysed. The carriers where then stored in a

16
plastic bottle and transported to a laboratory room nearby the pilot were all of the experiments were performed, despite the initial ten experiments that were performed at the Department of Chemical Engineering at Lund University. In the beginning of the experimental work, the experiments were performed with carriers sampled and stored for 1 to 5 days. Thereafter, fresh carriers sampled right before each test were used in the experiments.
3.5 Experimental set up and devices If nothing else is stated, the experiments were performed in 1 L reactor with 240 carriers. The carriers were counted manually and carefully rinsed with tap water to remove particulate compounds. Then the carriers were put in a 1 L reactor and 750 ml distilled water was added. That resulted in a filling ratio of 32%. 23 ml of 1 M phosphate buffer was added to the solution to achieve a constant pH around 7.75 throughout the experiment. The reactor was kept in a high water bath which submerged the whole reactor in order to achieve stabilised temperature and equilibrium between the temperature in the liquid phase and in the headspace. If nothing else is stated, the temperature of the water bath was set to 28°C. Homogenous conditions were accomplished with a magnetic stirrer with a stirring speed of 400 rpm. The liquid and gas phase where flushed with nitrogen gas by a gas distributor added to the bottom of the reactor for a total time of 10 minutes in order to achieve anoxic conditions. A pressure meter was connected to the reactor with a needle through the septum and the pressure inside the reactor was equalised to atmospheric pressure with another needle through the septum. Then the sample was pressure- and temperature stabilised for 30 to 60 minutes, for recovery of the biomass after flushing with nitrogen gas and to reach equilibrium of the temperature between the liquid phase and the headspace. Different amount of substrate, nitrite- and ammonium nitrogen, was added dependent on desired initial concentration with a syringe and needle through the septum and the logging was started. The duration time for each experiment was 120 minutes if nothing else is stated. The volume of the headspace was found by weighting the reactor immediately after the experiment and then filling it with water and reweigh the reactor. The weight difference was then converted to volume (m3) by dividing with the density of water. The temperature and pH were measured (WTW pH330, pH-electrode SenTix 41, Weilheim, Germany) before and after each experiment in order to ensure that these values were stable at desired set points.
The pressure meter used in the experiments was GMH 5150 from Greisinger electronic GmbH (Regenstauf, Germany). The pressure meter had a logging function and was programmed to log one value each minute. A sensor GMSD 350MR from Greisinger electronic GmbH, was connected to the pressure meter. The sensor measures relative pressure and has a measure interval of -199 – 350 mbar. The sensor was programmed to present the pressure in mbar and the time in minutes. The pressure meter was connected to a computer with a USB 5100 from Greisinger electronic GmbH. A software, GSOFT 3050 from Greisinger electronic GmbH, was installed on the computer and the recorded data was exported to Microsoft Excel were all processing and calculations were performed.The set up and devices is presented in Figure 3-4. A detailed description of the method for the specific anammox activity test is found in Appendix I.

17
Figure 3-4. Set up of the experiments (left). Devices used in the experiments (right).
3.6 Preparation of chemical solutions A 1 M phosphate buffer was used in all experiments in order to regulate the pH. The phosphate buffer was prepared by mixing 65.11 g Na2HPO4·12H2O and 7.1 g NaH2PO4 in a 200 ml bottle and then the bottle was filled with distilled water up to 200 ml. In order to achieve a faster mixing, the bottle was put on a magnetic stirrer with heater and the buffer was heated up to around 50°C during the stirring. After preparation, the phosphate buffer solution was kept at temperature slightly over room temperature.
A solution of 5 mg NH4+-N mL-1 was prepared by mixing 11.8 g (NH4)2SO4 with distilled water
in a 500 ml bottle. The solution was putted on a stirrer for few minutes for the salt to dissolve. The solution was kept in refrigerator after preparation.
A solution of 5 mg NO2--N mL-1 was prepared by mixing 12.42 g NaNO2 with distilled water
in a 500 ml bottle. The solution was kept on a stirrer for few minutes for the salt to dissolve. The solution was kept in refrigerator after preparation.
3.7 Chemical analysis Concentration of nitrite- and ammonium nitrogen in the liquid phase were analysed in several experiments. The samples were filtrated through paper filters (Munktell No. 00H, S1-80-40. 9 cm Grycksbo, Sweden) and analysed with HACH LANGE (Sköndal, Sweden) cuvettes. Ammonium nitrogen was analysed with LCK 303 cuvettes and nitrite nitrogen was analysed with LCK 342 cuvettes. After filtration, the samples were diluted to applicable concentrations (2.0-47.0 mg L-1 for NH4
+-N and 0.6-6.0 mg L-1 for NO2--N) and analysed in a
spectrophotometer (DR2800, HACH LANGE, Sköndal, Sweden).

18
3.8 Method development and implementation The main purpose of this thesis work is to develop a reliable and robust method to measure the specific anammox activity and implement the method and the procedure at the pilot plant. As mention in section 3.3, the method developed is based on previous work performed at the Manammox pilot plant by Gustafsson (2013). In following subchapters, the procedure for the method development and expectations for each part will be described in more detail. The experiments were performed according to the description in section 3.5, with several exceptions notified for each subchapter, since improvements of the method were made successively.
3.8.1 Initial experiments and configuration Initial experiments (set 1-3)
The first sets of experiments was performed to achieve knowledge of how the process and the instrument functioned and to observe the practical problems that could occur during the experiments. Experiment sets 1 and 2 were performed in the laboratory at the Department of Chemical Engineering at Lund University. Experimental set 3 was performed at the pilot plant at Sjölunda WWTP, since the purpose was to implement the method for analysis at the WWTP. Set 1-3 refers to samples from RP, MP1 and MP2 respectively. Carriers in set 1-2 were sampled at the same day and analysed 1 to 5 days after sampling while fresh carriers were used in set 3.
The expectation was even to analyse how initial concentration of added ammonium and nitrite influenced the specific anammox activity (SAA). Moreover, according to equations 12 and 13, the order of the bulk process hopefully could be indicated by plotting the specific anammox activity as a function of the initial nitrite concentration. In the experiments, the ratio between the initial concentration of ammonium and nitrite was set to one, meaning that the nitrite was the limiting substrate according to equation 14. The experiments where performed as described in section 3.5, with several exceptions. The water bath was lower, resulting in only half size of the reactor was submerged with water and the liquid phase was flushed with nitrogen gas for 2 minutes instead of 10 minutes. No pressure stabilisation was included and the substrate was added to the solution with a pipette and not with syringe and needle through the septum as described in section 3.5. Table of experimental plan can be found in Appendix II.
Isolation to keep the temperature in the whole reactor constant (set 4-5)
The aim of experiment set 4 was to analyse the pressure increment and SAA within isolated reactors. Two alternatives where analysed:
- 1 L reactor with isolating material. The water bath was not high enough so isolating material was used to stabilise the headspace temperature.
- 0.1 L reactor which could be completely submerged in the water bath.
The carriers were sampled from RP. Two initial concentrations of substrate were tested, 75 mg L-1 and 100 mg L-1 for both nitrite and ammonium. The conditions in the experiments performed in the 1 L reactor were the same as described in section 3.5, with the exceptions that isolating material was used instead of higher water bath, nitrogen gas flushing time was 3 minutes, pressure stabilisation and addition of substrate with a syringe through the septum was not included.
For the experiments in the 100 ml reactor, the number of carriers was decreased to 24 and the added distilled water was 75 ml which gave the same filling ratio between the numbers of

19
carriers in the liquid phase as in the 1 L reactor. The added buffer was decreased to 2.2 ml, the nitrogen gas flushing time was 3 minutes and the stirrer speed was set to 200 rpm. Additionally, pressure stabilisation and addition of substrate with a syringe through the septum was not included. Otherwise, the procedure described in section 3.5 was followed.
When preparing experiments 4.7 and 4.8, an oxygen meter was kept in the reactor during the nitrogen gas flushing. With the oxygen meter, the concentration of oxygen in the liquid phase could be observed and the flushing time needed to create anaerobic conditions could be measured. The plan for the experiments can be seen in Table 3-2 below. Experiments 4.1-4.2 were performed on the same day, 4.3-4.5 the day after and experiments 4.6-4.8 on the third day.
Table 3-2. Initial substrate concentration and reactor volume for set 4.
Experiment [NO2-] [mg N L-1] [NH4+] [mg N L-1] Reactor volume [L] 4.1 75 75 0.1 4.2 75 75 0.1 4.3 75 75 1 4.4 75 75 0.1 4.5 75 75 0.1 4.6 100 100 1 4.7 100 100 1 4.8 100 100 0.1
In experiment set 5, the pressure increment and specific anammox activity in a 1 L and 0.1 L reactors were further compared but now with a larger water bath. The 1 L reactor could be fully submerged with water, leading to the same conditions for both of the reactors. It was considered to be profitable running the experiments in a smaller volume since it is less time consuming and requires less material then experiments performed in 1 L reactor.
Improved from previous experiments was that the nitrogen gas flushing was performed for 10 minutes in the 1 L reactor and 6 minutes in the 0.1 L reactor. After the flushing and substrate addition with pipettes, the pressure meter was connected to the reactor with a needle through the septum and the pressure was equalised to atmospheric pressure, but without pressure stabilisation, before the logging was started. The solubility of nitrogen in water increases with increased pressure, following Henry´s law. By starting all the experiments at the same pressure, the results were expected to become more comparable.
The carriers were sampled from RP and the experiments were performed the same day. The experiments were performed according to section 3.5 with the exceptions of no pressure stabilisation and addition of substrate with a needle through the septum and the duration time was 100 minutes instead of 120 minutes. The plan for the experiments is found in Table 3-3.
Table 3-3. Initial concentration and reactor volume for set 5.
Experiment [NO2-] [mg N L-1] [NH4+] [mg N L-1] Reactor volume [L] 5.1 100 100 1 5.2 100 100 0.1

20
Volume of the headspace (set 6)
Since the method to measure the specific anammox activity is based on conversion of pressure increment to mole changes with the ideal gas law, the volume of the headspace in the reactor is crucial. The plastic tube that connects the reactor and the pressure meter is 1.06 meter and the sensor measuring the pressure is attached at the end of the tube. The inner diameter of the tube is 0.4 cm which give arise to additional volume of the gas phase that had not been considered before. The volume of the tube effects the headspace volume of the 0.1 reactor more than the 1 L reactor, which could be the reason for the difference in the results observed in previous experiments.
To investigate if that could be the reason for the difference in SAA between the 1 L and the 0.1 L reactors three experiments were performed. The plastic tube was cut and the set up can be seen in Table 3-4, where short tube refers to a tube of 3.5 cm and the long tube refers to the original length of 106 cm. The carriers were sampled from RP and the experiments where performed on the same day according to section 3.5 except for no pressure stabilisation and addition of substrate with pipettes.
Table 3-4. Experimental plan in set 6.
Experiment [NO2-] [mg N L-1]
[NH4+] [mg N L-1]
Reactor volume [L] Plastic tube
6.1 100 100 0.1 short tube 6.2 100 100 0.1 long tube 6.3 100 100 1 short tube
3.8.2 Reliability and reproducibility The purpose of this part was to analyse the reliability and the reproducibility of the method. The reliability was analysed by comparing the results from the pressure measurements with how much nitrite and ammonium nitrogen had been consumed during the experiment. That was accomplished by sampling several millilitres from the liquid phase in the reactors right before the logging was started and immediately after the experiment and the nitrite- and ammonium nitrogen concentrations were analysed with HACH LANGE cuvettes.
The recorded pressure increment was converted to amount of produced nitrogen gas. The potential amount of nitrogen gas produced based on both consumed nitrite and ammonium was then calculated according to the stoichiometry of the anammox reaction and compared to the measured results. The ratio between consumed nitrite nitrogen and ammonium nitrogen was even calculated according to equation 8 in section 2.2, in order to analyse if the substrate consumption followed the anammox reaction. To analyse the reproducibility, several experiments under the same conditions were performed.
The reliability and reproducibility was analysed in both 0.1 L and 1 L reactor in order to decide which reactor size would make the method more robust and reliable and should be used for further experiments. Using smaller volumes would make the method more time efficient and less material would be needed. On the other hand, larger volume could make the method more robust and reliable with ten times more carriers and less sensitive to small changes in the ratio between the headspace volume and the volume of the liquid phase.

21
Firstly, the experiments where performed in a 0.1 L reactor. The carriers where sampled from RP and to achieve comparable results between the two reactor sizes, five experiments with same conditions were performed, with a total number of 120 carriers. The procedure follows the description in section 3.5 except for no pressure stabilisation and the duration time for each experiment was shortened to 60 minutes to be able to perform all the experiments on the same day with carriers sampled at the same time. The carriers were sampled at the same time and therefore they were not completely fresh before each experiment. The experimental plan can be seen in Table 3-5.
Table 3-5. Initial concentration and reactor volume in set 7
Experiment [NO2-] [mg N L-1] [NH4+] [mg N L-1] Reactor volume [L] 7.1 100 100 0.1 7.2 100 100 0.1 7.3 100 100 0.1 7.4 100 100 0.1 7.5 100 100 0.1
The reliability and reproducibility of the method performed in 1 L reactor were then analysed. Three identical experiments where performed on the same day with fresh carriers sampled from RP right before each experiment. The duration of each experiment was 120 minutes and the procedure follows the description in section 3.5 except for no pressure stabilisation. 5 mL was sampled right before and immediately after each experiment and analysed with HACH LANGE cuvettes in order to analyse how much nitrite and ammonium had been consumed. The experimental plan can be found in Table 3-6.
Table 3-6. Conditions for set 8.
Experiment [NO2-] [mg N L-1] [NH4+] [mg N L-1] Reactor volume [L] 8.1 100 100 1 8.2 100 100 1 8.3 100 100 1
3.8.3 Initial concentrations and diffusion limitations The purpose of experimental set 9 was to analyse how initial concentration of added ammonium and nitrite substrate affected the specific anammox activity. Moreover, the change of reaction order, according to section 2.5, was expected to be indicated by plotting the SAA as a function of the initial nitrite concentration. An important aspect in the development of the method was to decide which initial concentration of substrate should be used, where the anammox activity becomes independent of the concentration in the bulk phase with a zero order of reaction (eq. 12 section 2.5). For lower initial nitrite nitrogen concentrations, the specific anammox activity was expected to decrease due to decreased diffusion through the biofilm (eq. 13 section 2.5). With decreased diffusion, the biofilm becomes not completely penetrated and the all of the substrates do not reach the anammox bacteria which results in decreased activity.
Carriers sampled from all of the three reactors (RP, MP1 and MP2) where analysed and the experiments were performed according to the procedure described in section 3.5, without

22
pressure stabilisation and addition of substrate with pipette and not with a syringe through the septum. The experimental plan is found in Table 3-7. Two to four experiments were performed on the same day and the experiments were performed in chronological order with fresh carriers.
Table 3-7. Initial concentrations and reactor type for set 9.
Experiment [NO2-] [mg N L-1] [NH4+] [mg N L-1] Reactor type 9.1 100 100 RP 9.2 125 125 RP 9.3 75 75 RP 9.4 50 50 RP 9.5 25 25 RP 9.6 100 100 MP1 9.7 75 75 MP1
9.7 b 75 75 MP1 9.8 125 125 MP1 9.9 50 50 MP1
9.9 b 50 50 MP1 9.10 25 25 MP1 9.11 100 100 MP2 9.12 125 125 MP2 9.13 50 50 MP2 9.14 75 75 MP2 9.15 25 25 MP2
3.8.4 Pressure stabilisation – lag phase Throughout the previous experiments, an initial lag phase has been observed. Reduction of the lag phase duration time has not been succeeded, despite several attempts. According to the methodology described by Lotti et al. (2012) the pressure inside the reactors were stabilised in one hour before addition of substrates for recovering of the biomass after flushing with nitrogen gas.. Even if appearance of lag phase was observed in those experiments, the duration time was shorter. To investigate if the occurrence and duration time of the lag phase was due to lack of pressure stabilisation, two experiments were performed. The difference from the procedure in previous experiments was that after flushing with nitrogen gas for ten minutes, a needle was added through the septum and the pressure was stabilised for 60 minutes before addition of substrate through the septum and the logging was started. Samples with carriers from RP and MP1 were tested and the initial concentration of substrate was 125 mg N L-1.
3.9 Effect of temperature change Temperature has been shown to have a great influence on the anammox activity and one of the biggest challenges in the development of the anammox technology is to achieve high anammox activity at relatively low temperatures (Lotti et al., 2014; Dosta et al., 2008; Hendrickx et al., 2012; Hu et al., 2013; Vázques-Padín et al., 2011).
In the Manammox pilot plant, the average temperature in the sludge liquor reactor (RP) and the mainstream reactors (M1 and MP2) differs greatly, with temperature around 28-29°C and 14-21°C respectively depending on the temperature of the wastewater. The biomass is therefore

23
adjusted to different temperatures depending on conditions in the reactors. In the Manammox pilot plant, continuous exchange of carriers in the different reactors is performed every second weekday. Therefore, it is interesting to observe how the specific anammox activity changes at different temperatures.
The experiments where performed according to section 3.5 and the initial concentration of substrate was 125 mg N L-1 for nitrite and ammonium respectively. Additionally, pressure stabilisation according to section 3.8.4 was applied, with different duration time depending on at which temperature the experiment was performed. Experiments performed at low temperature required longer time for stabilisation than experiments performed at temperature above 23°C. Experiments performed at the same temperature were made on the same day with carriers sampled right before each experiment, despite experiments performed at 10°C that were performed in two days. The experimental plan can be seen in Table 3-8.
Table 3-8. Experiment, temperature and reactor type for set 11.
Experiment Temperature [°C] Reactor type 11.1 10 RP 11.2 10 MP1 11.3 10 MP2 11.4 15 RP 11.5 15 MP1 11.6 15 MP2 11.7 20 RP 11.8 20 MP1 11.9 20 MP2 11.10 25 RP 11.11 25 MP1 11.12 25 MP2 11.13 30 RP 11.14 30 MP1 11.15 30 MP2
3.10 Frequent analyses of the anammox activity in the Manammox pilot The purpose of this part was to apply the developed method and analyse the maximum specific anammox activity in carriers sampled and tested several days in a row. By performing experiments for several days in a row, information of the process could be gathered and eventual variation between days was expected be observed. Carriers from all three reactors (RP, MP1 and MP2) were tested. The experiments were performed according to section 3.5 and the initial concentration of nitrite and ammonium were 125 mg N L-1. The experimental temperature were set to 28°C with a pressure and temperature stabilisation of 30 minutes before logging was started.
3.11 Calculations
3.11.1 Specific anammox activity Recorded data of pressure increase in time was exported from the pressure meter to Microsoft Excel were all processing of data was performed. The N2 in both liquid and gas phase was

24
considered, where soluble N2 in liquid phase was calculated with Henry’s law according to equation 17.
(17)
Where KH,cp is Henry’s constant [mol (L atm)-1], 1/1013 is conversion from atm to mbar [atm mbar-1], T is the actual temperature [K], and p is the actual pressure in the reactor [mbar].
The potential soluble pressure in the liquid phase was then calculated by combining the ideal gas law (equation 18).
(18)
Where VL is the volume of the liquid phase [L], R is the gas constant [(mbar m3) (mol K)-1], T is the temperature [K] and VG is the volume of the headspace [m3].
The total pressure was then calculated by adding Psol to every point recorded during the experiments.
The pressure increment was converted to N2 produced according to equation 19. Ideal gas condition was assumed.
(19)
Where 1000 is the conversion from mole to mmole [mmol mol-1], Δp is pressure difference [mbar], VG is the volume of the headspace [m3], R is the gas constant [(mbar m3) (mol K)-1] and T is the temperature [K].
The nitrogen gas production rate was calculated through linear regression of a set of 10 data points, corresponding to a time interval of 10 minutes. The production rate was calculated for every 10 minutes interval with the function SLOPE in Microsoft Excel and plotted as a function of time. The curve describing the N2 production rate in time is expected to present an initial positive slope until a maximum rate is reached. Thereafter, the rate is expected to decrease and the slope gets a negative value. When the second derivative (d2N2/dt2) equals to zero, no more acceleration occurs and the maximum production rate is reached. Equation 20 presents calculations of the N2 production rate and the maximum rate is selected with the function MAX in Microsoft Excel.
(20)
Where αmax is the maximum slope of the line from linear regression of a set of 10 data points.
The ten data points for N2 produced [mmol] representing the maximum increment were then plotted as a function of time and αmax was chosen as the slope of the linear regression line.
The maximum specific anammox activity was then calculated according to equation 21.
(21)

25
Where 0.001 is the conversion from mmole to mole [mol mmol-1], αmax is the maximum slope [mmol min-1], 1400 is conversion from minutes to days [min day-1], 28 is the molecular weight of nitrogen gas [g mol-1], X is the number of carriers in the experiment and 0.00049 is the effective surface area of each carrier [m2].
3.11.2 Activation energy (Ea) The apparent activation energy (Ea) for the anammox reaction can be calculated according to equation 22.
(22)
Where SAAT is the measured specific anammox activity at particular temperature [g N2-N (m2 day)-1], SAA293 is the measured specific anammox activity at 293 K [g N2-N (m2 day)-1], Ea is the activation energy [kJ mol-1], R is the gas constant [kJ (mol K)-1] and T is the temperature that the test is performed at [K].
3.11.3 Substrates molar ratio The molar ratio of substrates was calculated from N-compound concentrations in the liquid samples before and at the end of several experiments, according to equation 23.
(23)
3.11.4 Diffusion limiting substrate The diffusion limiting substrate through the biofilm was calculated according to equation 24.
(24)
Where DNH4 and DNO2 are the diffusion coefficients for ammonium and nitrite in water at 25°C, and M is the stoichiometric consumption rate [g g-1].

26

27
4 Results and discussions
To make the calculation part of the method more clear, typical response of a manometric test is shown in Figure 4-1. Nitrogen gas produced [mmol] was calculated through ideal gas law (eq. 19) from recorded data [mbar]. Increment of every ten minutes period was calculated and the maximum increment within 10 minutes was plotted. With linear regression, the slope could be calculated and represented αmax [mmol min-1] in equation 21 to calculate the maximum specific anammox activity, SAA [g N2-N (m2 day)-1].
Figure 4-1. Typical response of the manometric test. Produced nitrogen gas as a function of time (left). Maximum nitrogen gas production of 10 minute period (right), where the αmax is found as the slope of the linear regression line.
4.1 Initial experiments and configuration Initial experiments
The purpose with the initial experiments was to experience the experimental devices and achieve knowledge of practical difficulties of the method. Additionally, influence of the initial concentration of nitrite was expected to be observed. It can be seen from Figure 4-2 that the initial concentration of nitrite affects the specific anammox activity in carriers sampled from all three reactors (RP, MP1 and MP2 respectively). The results showed on the other hand a great variation of calculated SAA, with no clear pattern as expected.
The calculated SAA from experiment from RP with initial nitrite concentration of 75 mg N L-1 differ greatly from other results. The reason is that during that particular experiment, the effect of the temperature in the air around the reactor on the recorded pressure was tested. That was performed by holding the hands on the reactor for several minutes while recording the pressure. That resulted in rapidly increasing pressure in the reactor which affected the estimated maximum production rate and gave an overestimated value for the specific anammox activity. Figures of the nitrogen gas production and production rate for the experiments can be found in Appendix II.

28
Figure 4-2. Specific anammox activity as a function of initial nitrite nitrogen concentration.
When experiment with carriers sampled from MP2 with initial substrate concentration of 75 mg L-1 was performed, problems with the instrument occurred. Moreover, indications of air temperature dependence on the pressure increment arose. The room temperature at the laboratory at Lund University was constant around 21°C. When the experiments where performed at Sjölunda WWTP, the room temperature depended highly on the outdoor temperature. Therefore, a decision to isolate the reactor was taken. The pressure is highly dependent on temperature, and since the conversion of pressure increment into mole changes is done with the ideal gas law, an equilibrium between the temperature in the gas and liquid phase was desired to be reached. Because on the discovery of influencing parameters and great variation in calculated SAA, the results presented in Figure 4-2 were considered to be neither reliable nor accurate. On the other hand, valuable information of influencing parameters was gathered and further analysed.
Isolation of the reactor
The purpose of this part was to analyse the specific anammox activity within an isolated reactor. Firstly, experiments made in a 1 L reactor isolated with isolating material were performed and compared to experiments made in 0.1 L reactor which was completely submerged in the water bath (experiment 4.1 – 4.8). Then experiment performed in 1 L reactor in a larger water bath, which submerged the whole reactor, was compared to experiment made in 0.1 L (experiment 5.1 and 5.2 respectively).
Results from experiment 4.1 were executed because of problems with the pressure meter and logging of the experiment did not start until 20 minutes after addition of substrates. The initial concentration of nitrite, size of the reactor, calculated specific anammox activity and pressure increment measured with the pressure meter from experiment set 4 and 5 are presented in Table 4-1.
0
2
4
6
8
10
0 25 50 75 100 125
SAA
[g N
2-N
(m2
day)
-1]
Initial NO2- concentration [mg N L-1]
RPMP1MP2

29
Table 4-1. Initial NO2- concentration, reactor volume, specific anammox activity and pressure
increment from experiment sets 4 and 5.
Experiment [NO2-] [mg N L-1]
Reactor volume [L]
SAA [g N2-N (m2 day)-1]
Pressure increment [mbar]
4.2 75 0.1 4.3 79 4.3 75 1 4.6 130 4.4 75 0.1 4.4 63 4.5 75 0.1 4.1 76 4.6 100 1 6.3 177 4.7 100 1 5.8 178 4.8 100 0.1 4.1 72 5.1 100 1 5.5 130 5.2 100 0.1 4.1 64
Interestingly, the specific anammox activity was found to be higher for the experiments performed in a 1 L reactor than tests performed in 0.1 L reactor. Moreover, the pressure increment was almost two times larger in 1 L reactors than in 0.1 L reactors despite same initial nitrite concentration and filling ratio in the reactors. The same behaviour was observed for the experiments performed with isolating material as well as reactor completely submerged in the water bath. It should be observed that the duration time for experiment 5.1 and 5.2 was 100 minutes, resulting in lower pressure increment than for experiments 4.2-4.9 where the duration time was 120 minutes. In Figure 4-3 the measured pressure, instead of produced nitrogen gas, is shown as a function of time for set 5. The reason is that the nitrogen gas production is not comparable for these two experiments because of a great difference in pressure increment. More detailed figures can be found in Appendix II.
Figure 4-3. Pressure as a function of time in experiment set 5.
From Figure 4-3, it can be seen that pressure increment is larger in the test performed in 1 L reactor. On the other hand, the lag phase is shorter in the test performed in 0.1 L reactor. The maximum production rate occurred sooner in 0.1 L in all of the experiments, resulting in possible time optimisation by applying the method in 0.1 L reactor.
0
20
40
60
80
100
120
140
0 20 40 60 80 100 120
Pres
sure
[mba
r]
Time [min]
1 L
0.1 L

30
Measuring the oxygen concentration in the liquid phase during the nitrogen flushing in experiment 4.8 and 4.9 gave valuable information and it was observed that at least 10 minutes of flushing with nitrogen gas was needed to achieve an oxygen concentration < 0.03 mg L-1 in a 1 L reactor and 6 minutes for a 0.1 L reactor.
An initial lag phase of 20-30 minutes had been observed during previous experiments. Attempts to decrease the time of the lag phase by saturating the liquid- and gas phase completely with nitrogen gas and equalising the pressure inside the reactor to atmospheric pressure before the logging was started was tested in set 5. It can be seen in figure 4-2 that the time of the lag phase remains 20-30 minutes despite of attempted improvements.
Volume of the headspace (set 6)
The aim of experimental set 6 was to investigate if the volume of the plastic tube that connected the pressure meter to the reactor could be the reason for observed difference in SAA between the 1 L and the 0.1 L reactors. Due to time constraints, the duration of the last experiment was 95 minutes. Therefore, the results presented in Table 4-2 below show the pressure increment and maximum specific anammox activity (SAA) calculated from measurements of 95 minutes for all of the experiments. Experiments 6.1 and 6.2 refer to test in 0.1 L reactor with a short tube and long tube respectively. Experiment 6.3 refers to test in 1 L reactor with a short tube.
Table 4-2. Specific anammox activity (SAA) and pressure increment (ΔP) in set 6.
Experiment 6.1 6.2 6.3 SAA [g N2-N (m2 day)-1 ] 5.6 4.3 6.1 ΔP [mbar] 71 54 136
From the table it can be stated that the volume of the tube is relevant and is the main reason for the difference of the calculated activity from previous sets of experiments. The length of the tube also affected the time of the lag-phase (figure shown in Appendix II). The reason for the difference in increased pressure between the two reactors is that the ratio between the headspace and the liquid volume in the 0.1 L reactor is twice as big as in the 1 L volume. The short plastic tube was used in all further experiments.
Changes that were made after experimental set 1-5:
- Large water bath which submerged the whole 1 L reactor. - The plastic tube that connected the reactor and the sensor of the pressure meter was
shortened. - The nitrogen gas flushing time to create anoxic conditions was extended to 10 minutes
and 6 minutes for experiments in 1 L and 0.1 L respectively. - The pressure inside the reactors was equalised to atmospheric pressure before logging
of the experiments was started.
4.2 Reliability and reproducibility The purpose was to evaluate the reliability and reproducibility of the method. The reliability was tested by comparing the amount of produced nitrogen gas calculated from the recorded pressure increment to the potential amount of nitrogen gas produced based on consumed

31
nitrogen and ammonium. The reproducibility was analysed by performing several experiments under the same conditions. The procedure was performed in both 0.1 L (experiment set 7) and 1 L (experiment set 8) reactors in order to decide which reactor size should be used in further experiments.
Experiment set 7
Figure 4-5 presents the results from experiment set 7, performed in 0.1 L reactor. It can be seen from figure 4-5 that the N2 produced calculated from the recorded pressure increment is less than the potential production of nitrogen based on both nitrite- and ammonium consumption. The reason might be, that even though the recorded pressure increases relatively little the first 20 minutes, nitrite and ammonium are consumed. Since the experiments were only ran for 60 minutes, the influence of the lag phase had a larger affect compared to running the experiments for 120 minutes. This could be the reason for the large difference in the results.
Figure 4-4. Produced nitrogen gas calculated from recorded pressure and consumed nitrite and ammonium nitrogen for the five repeated experiments in 0.1 L reactor.
The highest N2 produced is from the ammonium nitrogen consumption in all the five experiments. The reason might be ammonium absorption on the carriers in similar way as described by Bassin et al. (2011) which results in lower measured ammonium concentration in the sample but the molecules never dissipate in the anammox reaction and are therefore not converted to nitrogen gas.
Moreover, consumption of nitrite- and ammonium nitrogen decreases during the day, which can be seen from figure 4-4, since the experiments where performed in chronological order. The reason might be that the carriers used in the set were sampled at the same time and kept in a plastic tank with water during the day. Meaning that the first experiment was performed with fresh carriers, but in later experiments the carriers from the plastic tank were used. Important factor for further experiments and the developed method is to perform the activity test with completely fresh carriers.
The specific anammox activity (SAA), produced nitrogen gas and the ratio of consumed nitrite over ammonium can be seen in Table 4-3.

32
Table 4-3. Specific anammox activity (SAA), produced nitrogen gas and nitrite over ammonium ratio (R_NiAm).
7.1 7.2 7.3 7.4 7.5 Mean ± SD
SAA [g N2-N (m2 day)-1] 5.7 5.9 5.5 5.8 5.3 5.6 ± 0.21 N2 produced [mmol] 0.073 0.074 0.071 0.072 0.066 0.0712 ± 0.003 R_NiAm 1.10 1.07 0.91 1.10 1.03 1.04 ± 0.07
The SAA from the five experiments results in an average SAA of 5.6 g N2-N (m2 day)-1 with a standard deviation of 4%. From table 4-3 the ratio between the consumed nitrite and ammonium is 1.04 which is lower than the expected 1.32 based on the stoichiometry for the anammox reaction. The explanation might be that the carriers were not sampled completely fresh between each experiment, or the fact that the experiments were not run for enough time to give representative results. A figure of the production of nitrogen gas in the reactors and experimental data can be found in Appendix III.
During the experiments in 0.1 L reactor, the importance of keeping the ratio between the headspace volume and the volume of the liquid phase arose. To manage to make the results comparable, the ratio needs to be as similar as possible. The ratio VG/VL is more sensitive in smaller reactors, resulting in decreased robustness when the method is applied in 0.1 L reactors.
Based on the importance of a relatively constant VG/VL ratio and the ratio between consumed nitrite- and ammonium ratio, the reliability of the method performed in 0.1 L reactors was considered to be unacceptable. On the other hand, the results from the calculated SAA indicated that the reproducibility of the method was good with only 4% standard deviation.
Experiment set 8
Figure 4-5 presents the results from experiment performed in 1 L reactor. It can be seen that the N2 produced is less than the potential production of nitrogen based on both nitrite and ammonium consumption, but the difference is much smaller compared to the results from experiment set 7 (Figure 4-4). The potential N2 produced is almost the same when calculated from consumed nitrite and ammonium.
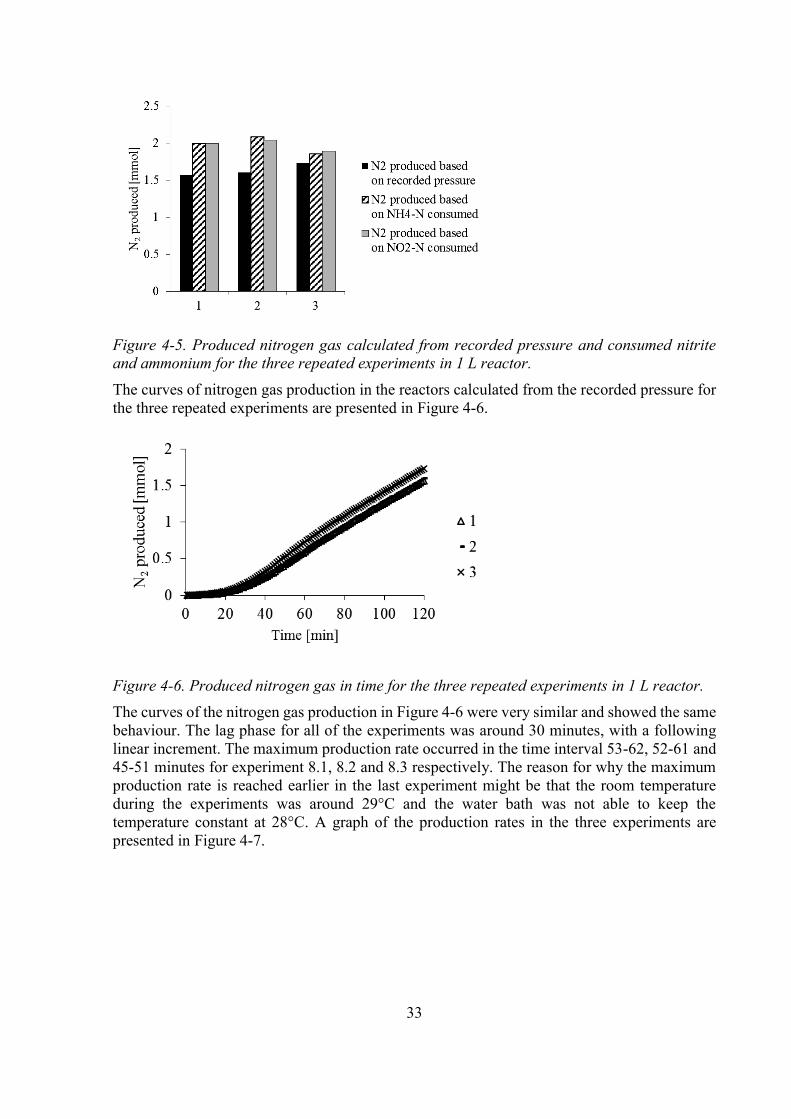
33
Figure 4-5. Produced nitrogen gas calculated from recorded pressure and consumed nitrite and ammonium for the three repeated experiments in 1 L reactor.
The curves of nitrogen gas production in the reactors calculated from the recorded pressure for the three repeated experiments are presented in Figure 4-6.
Figure 4-6. Produced nitrogen gas in time for the three repeated experiments in 1 L reactor.
The curves of the nitrogen gas production in Figure 4-6 were very similar and showed the same behaviour. The lag phase for all of the experiments was around 30 minutes, with a following linear increment. The maximum production rate occurred in the time interval 53-62, 52-61 and 45-51 minutes for experiment 8.1, 8.2 and 8.3 respectively. The reason for why the maximum production rate is reached earlier in the last experiment might be that the room temperature during the experiments was around 29°C and the water bath was not able to keep the temperature constant at 28°C. A graph of the production rates in the three experiments are presented in Figure 4-7.

34
Figure 4-7. Production rate for the three repeated experiments.
The specific anammox activity (SAA), produced nitrogen gas and the ratio of consumed nitrite nitrogen over ammonium nitrogen can be seen in Table 4-4.
Table 4-4. Specific anammox activity (SAA), produced nitrogen gas and nitrite over ammonium ratio (R_NiAm).
8.1 8.2 8.3 Mean SD SAA [g N2-N (m2 day)-1] 6.3 6.5 6.8 6.5 0.209 N2 produced [mmol] 1.57 1.60 1.73 1.64 0.072 R_NiAm 1.32 1.29 1.34 1.32 0.021
The SAA from the three experiments resulted in an average SAA of 6.5 g N2-N (m2 day)-1 with a standard deviation of around 3%. The average ratio between the consumed nitrite and ammonium (R_NiAm) resulted in the expected 1.32 based on the stoichiometry for the anammox reaction. The behaviour of the curve for nitrogen gas production and the variation of the average ratio between the consumed nitrite and ammonium are comparable to results obtained by Lotti et al. (2012). More detailed experimental data is found in Appendix III.
Based on results from set 8, the conclusion was that the method was reliable and reproducible. Furthermore, the experiments should be performed in a 1 L reactor with 240 carriers. With that construction, the method was considered to be more robust and less sensitive to small changes of the ratio between headspace and liquid volume as well as effect of poor anammox activity of one single carrier compared to experiments performed in smaller reactors.
4.3 Initial concentrations and diffusion limitations The purpose was to analyse how the initial concentration of substrate affected the specific anammox activity. Moreover, optimal initial concentration for further experiments was expected to be observed, where the reaction rate follows zero order of reaction and is independent of the substrate concentration throughout the experiment. Since equal initial concentration of ammonium and nitrite was added in every experiment, nitrite became the limiting substrate and therefore the specific anammox activity could be analysed as a function of the initial nitrite concentration.

35
It can be seen from figure 4-8 that the initial concentration of nitrogen affected the anammox activity greatly. Moreover, indication of change from half- to zero order reaction occurred at initial nitrite concentration around 50-75 mg N L-1. No tendency of nitrite inhibition was observed for the tested initial concentrations.
Figure 4-8. Specific anammox activity as a function of initial nitrite concentration.
It can be seen from the graph in Figure 4-8 that the calculated activity for carriers sampled from the tree different reactors followed similar pattern. The specific anammox activity was found to be comparable in the RP and MP1 reactors, whereas the activity in the MP2 reactor was slightly lower. The lower activity in the MP2 reactor was expected, since both ammonium and nitrite concentrations in the Manammox pilot plant are much lower in MP2 compared to concentrations in both RP and MP1.
The curves of produced nitrogen gas during the experiments for samples from RP are presented in Figure 4-9. The N2 production was similar for initial nitrogen concentration of 75, 100 and 125 mg N L-1 respectively. For the experiment where the initial nitrite concentration was 50 mg N L-1, the nitrogen gas production decreased after around 80 minutes and when the initial nitrite concentration was 25 mg N L-1, the amount of produced N2 gas was less than half of the amount produced with higher concentrations. The same pattern was observed from experiments with carriers from MP1 and MP2 with the difference that the amount of produced nitrogen gas was slightly lower in experiments from MP2. Graphs for MP1 and MP2 are found in Appendix IV.

36
Figure 4-9. Produced nitrogen gas in time for samples from RP at different initial nitrate con-centrations (mg N L-1).
An interesting perspective is to analyse how the production rate changes during the experiments. A graph of the production rate as a function of time from experiments with samples from RP is presented in figure 4-10.
Figure 4-10. Nitrogen gas production rate as a function of time for carriers from RP at different initial nitrate concentrations (mg N L-1).
The curve describing the N2 production rate in time presented an initial positive slope until a maximum rate was reached. Thereafter, the rate was relatively constant for high initial nitrite concentrations followed by a slight decrease in production rate where the slope has a negative value. The production rate for low initial nitrite concentrations (25 and 50 mg N L-1 respectively) followed the same pattern initially, but after reaching maximum, the rate decreased rapidly. The results can be compared to the graph of the production rate from carriers sampled from MP1 (Figure 4-11).

37
Figure 4-11. Nitrogen gas production rate in time for carriers from MP1 at different initial nitrite concentrations (mg N L-1).
The production rate reached its maximum faster than observed in RP and the rate for initial nitrite concentration of 75, 100 and 125 mg N L-1 respectively, decreased rapidly until the rate stabilises during the experimental time. When the initial nitrite concentrations were lower, the production rate decreased drastically after reaching its maximum.
The production rate observed from experiments with samples from MP2 showed a similar behaviour as found in samples from MP1, but the maximum production rate was lower compared to the production rate reached in experiments with samples from RP and MP1. Some disturbances were observed in the curves for the productions rate which might be due to that something is blocking the needle connected to the sensor that measures the pressure. The graph of the production rate as a function of time is found in Appendix IV.
Based on results from the experiments performed in set 9, initial nitrogen concentration of 125 mg N L-1 was decided to be used in further experiments. Considering that the desire is to increase the specific anammox activity at the Manammox pilot plant, which would lead to increased substrate consumption rate, initial ammonium and nitrite concentration of 125 mg N L-1 was found to be suitable for the method. Graphs of the produced nitrogen gas and production rate as a function of time for samples form RP, MP1 and MP2 at an initial nitrite concentration of 125 mg N L-1 are found in Appendix IV.
4.4 Pressure stabilisation The aim of the experiments was to investigate if pressure stabilisation before addition of substrates was needed in order to decrease the duration time of observed lag phase. A graph of the nitrogen gas production as a function of time is presented in Figure 4-12. The duration of the experiments was 120 minutes, but only the N2 gas production of the initial 60 minutes is presented in the figure.

38
Figure 4-12. Produced nitrogen gas in the initial 60 minutes.
From Figure 4-12, it can be seen that the length of the lag phase is around 30 minutes which is comparable to the duration time of the lag phase in previous experiments. Therefore, the attempt to decrease the duration time was not obtained. It does not seem like the duration time of the lag phase is due to the pressure stabilisation at this particular temperature. It should be noted that when all previous experiments have been performed, the room temperature at the laboratory has been around 28°C. That of course effects the tests, since the experimental temperature and the room temperature have been very similar, making no changes of the headspace temperature when preparing the samples and therefore no pressure and temperature stabilisation have been needed. Since it could be different when the tests are performed at 28°C and the room-temperature is lower, temperature and pressure stabilisation of at least 30 minutes before adding the substrate is recommended in order to achieve equilibrium between the temperature of the headspace and the liquid phase respectively.
The reason for the long duration time of the lag phase compared to other published results (Lotti et al 2012) could be that the sample has not been pre-exposed to the substrate in the medium, like described in the study performed by Lotti et al., (2012). A possible hypothesis is that nitrogen gas is produced, but gets stuck in small micro bubbles in the liquid phase and do not contribute to measurable pressure increment.
4.5 Effect of temperature change The purpose was to analyse the effect of temperature change on the SAA. Since the temperature is different in the reactors in the Manammox pilot plant, the bacteria in the biofilm of the carriers are adapted to different conditions and the influence of altered temperature on the anammox activity was wanted to be observed. During the experimental period, the temperature in the RP reactor was around 28-29°C and 21°C in the mainstream reactors (MP1 and MP2). The temperature interval tested in the activity tests in this study was [10-30] °C. Investigation of higher temperatures was considered to be unnecessary, since temperatures in the reactors in the Manammox pilot never reach higher values.
According to Lotti et al. (2014) is the effect of temperature change different depending on within which temperature interval the temperature changes are made, where the effect is larger in the interval of [10-20] °C than changes within the temperature interval of [20-30] °C. The apparent activation energy (Ea, kJ mol-1) can therefore not be described by one singular value (Lotti et al., 2014). Activation energy of 70 kJ mol-1 reported by Strous et al. (1999a) is

39
commonly used in modelling anammox-based processes, which according to Lotti et al. (2014) would lead to a systematic overestimation of the anammox activity at 10°C.
Additionally to plotting the SAA as a function of temperature [°C] were an exponential correlation is expected to be observed, it is interesting to analyse the Arrhenius plot of ln(SAA) as a function of the inverse temperature [K-1] to investigate if the correlation should be described with more than one constant.
In figure 4-13 the effect of temperature on the specific anammox activity of carriers sampled from RP is presented. Additionally, in figure 4-13 (left (x)) results from Gustafsson (2013) are presented to observe if they follow the same pattern as found in this study.
In Figure 4-13 (left), the temperature dependency is described as exponential and followed the equation y = 0.1027e0.149x with coefficient of determination (R2) above 0.9. A change of the temperature from 30°C to 10°C resulted in a 95% decrease of the specific anammox activity. However, comparing the equation obtained from the exponential correlation to measured SAA results in an underestimation of the SAA at 20°C and overestimation of the SAA at 30°C.
Analysis of ln(SAA) as a function of T-1 (Figure 4-13 right) shows that even though the whole temperature interval can be described with one linear regression (dotted line in Figure 4-13) and the coefficient of determination (R2) of the linear regression is above 0.9, the fitting becomes much better when the temperature interval was divided into two parts, [10–20] °C and [20–30] °C respectively. That result agrees with the results obtained by Lotti et al. (2014). The activation energy (Ea) calculated from equation 22 resulted in Ea of 151 kJ mol-1 and 60.1 kJ mol-1 for the temperature intervals [10–20] °C and [20–30] °C respectively. Calculated activation energy according to the methodology suggested by Lotti et al. (2014), where the Ea equals the additive slope multiplied by the gas constant (R), the Ea was 151 kJ mol-1 and 60.4 kJ mol-1 for the temperature intervals [10–20] °C and [20–30] °C respectively. Comparison of exact values of Ea to results obtained by Lotti et al. (2014) is not relevant since the biomass is different and operational conditions in the reactors in that study vary from this work. However, the behaviour was the same, where the temperature dependency of the SAA as expressed in the
Figure 4-13. Anammox activity as a function of temperature [°C] (left). The bullets (●) are the measured SAA, crosses (x) SAA from previous study and the dotted line (···) is the exponential correlation. Arrhenius plot of ln(SAA) as a function of temperature [K-1] (right) for carriers sampled from RP. The bullets (●) are ln of the measured SAA, solid line (-) is the linear regression line of different temperature intervals and (···) is linear regression for the whole temperature interval.

40
Ea increased at lower temperatures ([10–20] °C) compared to higher temperatures ([20–30] °C). Similar pattern has even been observed by Isaka et al. (2008).
The temperature dependency of the anammox activity for carriers sampled from MP1 is presented in Figure 4-14.
In Figure 4-14 (left), the temperature dependency is described as exponential and followed the equation y = 0.0625e0.1633x with coefficient of determination (R2) above 0.9. A change of the temperature from 30°C to 10°C resulted in a 95% decrease of the specific anammox activity, which is the same loss as found in samples from RP. As well as for samples from RP, using the equation obtained from the exponential correlation will result in an underestimation of the SAA at 20°C and overestimation of the SAA at 30°C compared to measured SAA.
Analysis of ln(SAA) as a function of T-1 (Figure 4-14 right) showed that the whole temperature interval could be described with one linear regression (dotted line in Figure 4-14) and a coefficient of determination (R2) of the linear regression was above 0.9. However, dividing the temperature into two intervals, the fitting becomes much better in the higher temperature interval, [20–30] °C than in the lower temperature interval [10–20] °C. That might be due to a lower SAA (0.5 g N2-N (m2 day)-1) obtained at 15 °C than expected. Since sample from RP, and MP2 had a SAA of 1.1 and 1.0 g N2-N (m2 day)-1 respectively (values shown in Appendix V), the calculated value is most likely too low. When preparing the test, a longer temperature stabilisation time would have been needed which would result in higher obtained production rate (figure in Appendix V) and the actual SAA would probably turn out to be around 1 g N2-N (m2 day)-1.
The activation energy (Ea) calculated from equation 22 resulted in Ea of 151 kJ mol-1 and 64.9 kJ mol-1 for the temperature intervals [10–20] °C and [20–30] °C respectively. Calculated activation energy according to methodology suggested by Lotti et al. (2014) the Ea was 152 kJ mol-1 and 64.5 kJ mol-1 for the temperature intervals [10–20] °C and [20–30] °C respectively.
Figure 4-14. Anammox activity as a function of temperature [°C] (left). The bullets (●) are the measured SAA and the dotted line (···) is the exponential correlation. Arrhenius plot of ln(SAA) as a function of temperature [K-1] (right) for carriers sampled from MP1. The bullets (●) are ln of the measured SAA, solid line (-) is the linear regression line of different temperature intervals and (···) is linear regression for the whole temperature interval.

41
In Figure 4-15 the effect of temperature on the specific anammox activity of carriers sampled from MP2 is presented.
From Figure 4-15 it can be seen that an exponential correlation did not fit the measured SAA satisfactory for the whole temperature interval and the coefficient of determination (R2) was below 0.9. The SAA seemed to increase linearly as demonstrated with the dashed line in the graph (Figure 4-15 left). However, dividing the temperature interval into [10–20] °C and [20–30] °C respectively, the correlation became much better and R2 of the linear regression is above 0.9. The activation energy (Ea) calculated from equation 22 resulted in Ea of 227 kJ mol-1 and 58.9 kJ mol-1 for the temperature intervals [10–20] °C and [20–30] °C respectively. Calculated activation energy with the methodology suggested by Lotti et al. (2014, the Ea was 209 kJ mol-
1 and 58.5 kJ mol-1 for the temperature intervals [10–20] °C and [20–30] °C respectively. A change of the temperature from 30°C to 10°C resulted in a 98% decrease of the specific anammox activity, which is higher than the loss found in samples from both RP and MP1.
In Figure 4-16, the specific anammox activity for samples from RP, MP1 and MP2 measured at 10°C, 15°C, 20°C, 25°C and 30°C is presented.
Figure 4-15. Anammox activity as a function of temperature [°C] (left). The bullets (●) are the measured SAA, the dotted line (···) is the exponential correlation and the dashed line (---) is linear correlation. Arrhenius plot of ln(SAA) as a function of temperature [K-1] (right) for carriers sampled from MP2. The bullets (●) are ln of the measured SAA, solid line (-) is the linear regression line of different temperature intervals and (···) is linear regression for the whole temperature interval.
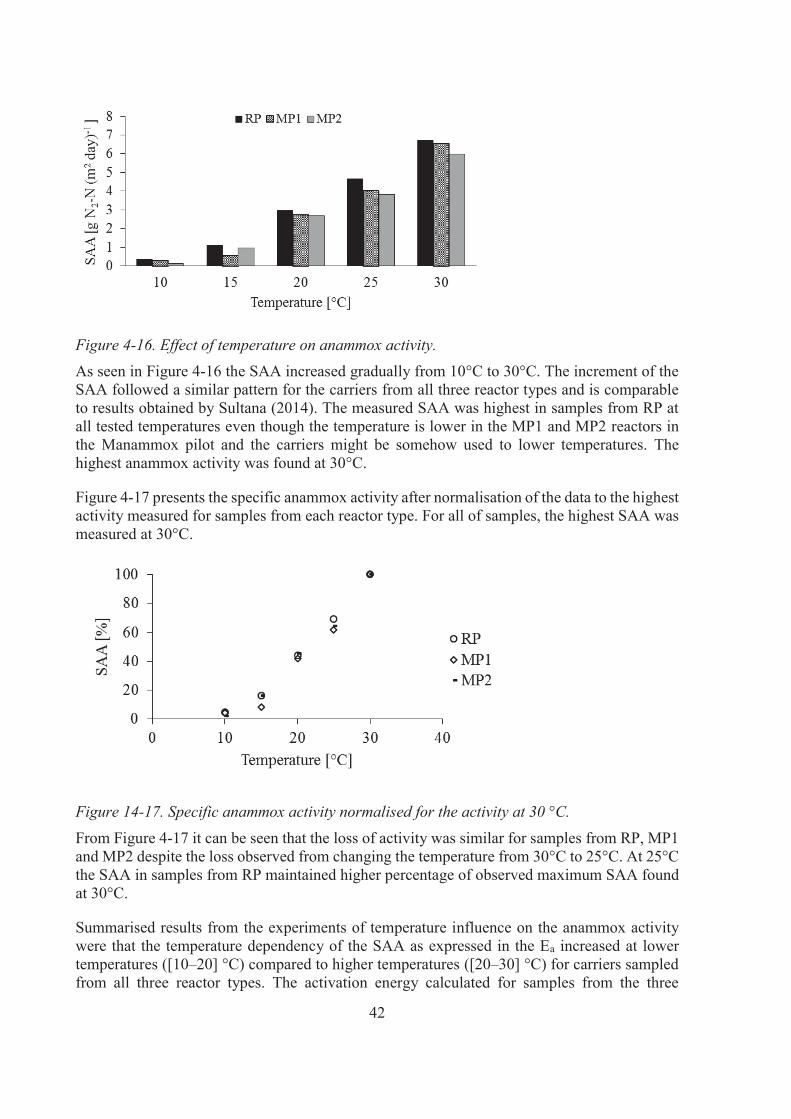
42
Figure 4-16. Effect of temperature on anammox activity. As seen in Figure 4-16 the SAA increased gradually from 10°C to 30°C. The increment of the SAA followed a similar pattern for the carriers from all three reactor types and is comparable to results obtained by Sultana (2014). The measured SAA was highest in samples from RP at all tested temperatures even though the temperature is lower in the MP1 and MP2 reactors in the Manammox pilot and the carriers might be somehow used to lower temperatures. The highest anammox activity was found at 30°C.
Figure 4-17 presents the specific anammox activity after normalisation of the data to the highest activity measured for samples from each reactor type. For all of samples, the highest SAA was measured at 30°C.
Figure 14-17. Specific anammox activity normalised for the activity at 30 °C.
From Figure 4-17 it can be seen that the loss of activity was similar for samples from RP, MP1 and MP2 despite the loss observed from changing the temperature from 30°C to 25°C. At 25°C the SAA in samples from RP maintained higher percentage of observed maximum SAA found at 30°C.
Summarised results from the experiments of temperature influence on the anammox activity were that the temperature dependency of the SAA as expressed in the Ea increased at lower temperatures ([10–20] °C) compared to higher temperatures ([20–30] °C) for carriers sampled from all three reactor types. The activation energy calculated for samples from the three

43
different reactors tested at the higher temperature interval was relatively similar (60.4, 64.5 and 58.5 kJ mol-1 respectively). The Ea values for the lower temperature interval was similar for the samples from RP and MP1, with Ea of around 151 kJ mol-1 but differed greatly to the value for samples from MP2 (209 kJ mol-1). Since the tested carriers came from the same inoculum and continuous exchange of carriers between the three reactors occurs, the activation energy was expected to be relatively similar for samples from the three reactors in the two temperature intervals. The difference might be due to adaption to different operating conditions in the Manammox pilot. Decreasing temperature from 30°C to 10°C resulted in 95% loss of the anammox activity in samples from RP and MP1 respectively and 98% loss of activity in samples from MP2. However, it is promising that anammox activity was still observed at 10°C in samples from all of the reactor types.
It should be observed that the results are based on experiments made only once for each temperature and reactor type and the whole experimental set required 8 days to be finished. That leads to that variation derived from the method as well as eventual variation between days have not been included in this analysis. Additionally, it should be mentioned that during the experimental time when the temperature dependency was analysed, the temperatures in the reactors in the Manammox pilot were around 28-29°C and 21°C for the RP and the mainstream reactors (MP1 and MP2) respectively. At winter time, the temperature difference will be larger, since the temperature in the mainstream is normally around 14°C during winter time. That will most likely result in temperature dependency of the anammox activity that differs from this work and further analysis of the temperature dependency of the anammox activity is therefore recommended. Additional data and graphs are found in Appendix V
The continuous exchange of carriers between the three reactors performed in the Manammox plant seems to be helpful and leading to continuous adaption of the anammox bacteria to decreased temperature. Since the activity depends on operating conditions and conditions in the batch tests, it would be interesting to observe the consequences of stop of transferring carriers between the reactors and perform activity test at different temperatures again.
4.6 Frequent analyses of the anammox activity in the Manammox pilot The developed method was applied and activity tests were perform for several days in a row to observe eventual variation between days. The measured specific anammox activity (SAA), date of the experiments and samples from which reactor are presented in Table 4-5.
Table 4-5. Specific anammox activity measured at different days.
Specific Anammox Activity [g N2-N (m2 day)-1]
2014-08-15 2014-08-18 2014-08-19 2014-08-20 Mean ± SD
RP 6.2 6.0 6.0 6.4 6.2 ± 0.17
MP1 6.1 6.2 5.9 6.2 6.1 ± 0.12
MP2 5.8 3.7 4.5 5.6 4.9 ± 0.85
The average SAA tested at this specific days were found to be 6.2, 6.1 and 4.9 [g N2-N (m2 day)-1] for samples from RP, MP1 and MP2 respectively. The variation of SAA in samples from

44
RP and MP1 was only 3% and 2% respectively, whereas the variation was 17% in samples from MP2. This can be compared to the results from the analysis of reproducibility, where the standard deviation between the repeated experiments with carriers from RP was found to be 3%.
Interestingly, the SAA observed in the sample from MP2 was normal at the first experimental day (2014-08-15) but decreased significantly at the dates 2014-08-18 and 2014-08-19 before stabilisation again on the 2014-08-20. The results can be related to operating conditions in the reactors for these days, where wet weather conditions caused low concentrations in the mainstream and particularly in the MP2 reactor since the flow to the pilot is kept constant. The concentrations were only 1 mg NH4
+-N L-1 and 0.11 mg NO2--N L-1 the 2014-08-18 and 2014-
08-19 compared to 8.2 mg NH4+-N L-1 and 0.54 mg NO2
--N L- on the 2014-08-15.
Graphs of the nitrogen gas production and production rate during the experiments performed with samples from RP, MP1 and MP2 at these four different days are found in figures 4-18, 4-19 and 4-20 respectively.
As seen in Figure 4-18, the behaviour of the curves was similar at all tested dates for both nitrogen gas produced and the production rate. Comparable amount of nitrogen gas was produced during the experiment and the production rate reached approximately the same value.
In Figure 4-19 the nitrogen gas produced and the production rate for samples from MP1 are shown. Similarly to results from RP, the behaviour of the production of nitrogen gas and production rate is comparable for the different days. The production rate followed the same pattern as observed in previous performed experiments, where the rate increased rapidly until a maximum is reached. After attaining the maximum, the rate decreased gradually.
Figure 4-18. Nitrogen gas produced in time (left) and production rate (right) observed in samples from RP at different days.

45
Profiles of the nitrogen gas production and production rate in experiments performed with samples from MP2 (Figure 4-20) showed significantly lower amount of nitrogen gas produced and lower production rate at dates 2014-08-18 and 2014-08-19 compared to the other dates. At these dates, the specific anammox activity was 3.7 and 4.3 [gN2-N (m2 day)-1] respectively. It should be noted that the experiment performed 2014-08-15 was only ran for 95 minutes because of time constrains. A shorter duration time for that experiment did not affect the calculated SAA, since the maximum production rate used in the calculation had already been reached (Figure 4-20 right (●)). Additionally, due to low pressure increment observed during the activity test performed with carriers from MP2 the 2014-08-18, the test was stopped after 50 minutes. When the result was analysed, it was observed that the production rate was still increasing, (see Figure 4-20 right (◊)), which indicated that the maximum rate had not been reached. If the test had been run for a longer time, the calculated SAA would most likely be a bit higher than presented in Table 4-5. However, the reached production rate did not seem far from its maximum when analysing Figure 4-20 (◊).
Figure 4-19. Nitrogen gas produced in time (left) and production rate (right) observed in samples from MP1 at different days.
Figure 4-20. Nitrogen gas produced in time (left) and production rate (right) observed in samples from MP2 at different days.

46
As previous mentioned, low concentrations in the mainstream most likely was the reason for low activity measured at 2014-08-18. Additionally it should be mentioned that 4 hours before the carriers were sampled from MP2 that day, exchange of carriers between the RP, MP1 and MP2 reactors in the Manammox plant was performed which could have affected the activity due to acclimatisation to changed conditions. This was not further investigated since it was concluded that the low activity was due to the low concentrations in the mainstream.
Several problems were detected during the experimental set. Disturbances in the recorded pressure were observed. After experiment MP2 – 2014-08-18, a new septum was fixed and the needle that connected the sensor of the pressure meter to the reactor was washed with 2 M HCl and distilled water and then dried. The disturbances in the recorded pressure were most likely because of some pollutants in the needle. Additionally, problems when the door was open occurred when it was windy. Even though effort had been made to minimise the influence of varying parameters outside the system, the wind and lower outdoor temperature might effect and cause some disturbances in the recorded pressure.
Additional figures, where the results of nitrogen gas produced and the production rate for samples from RP, MP1 and MP2 are compared for the four different days, are found in Appendix VI.

47
5 Conclusions
The experimental research was performed with MBBR carriers type K1® from the Manammox pilot plant at Sjölunda WWTP in Malmö for a period of three months. Based on obtained results from analysis of the experimental data, following conclusions have been derived:
The developed method to measure the specific anammox activity based on manometric batch tests was found to be reliable and reproducible. Additionally, the procedure for the activity test is applicable for further research at the Manammox pilot plant.
The ratio between the liquid phase and the headspace volume had an effect on the measured activity and should be kept the same in order to achieve comparable results.
The temperature of the headspace volume, including the volume of the connecting pipe, influenced the behaviour of recorded pressure and therefore the calculated SAA, which led to great importance of controlling the temperature for the whole reactor during the activity test.
The specific anammox activity showed a dependency of initial nitrite concentrations below 75 mg N L-1 whereas the activity was independent of initial nitrite concentrations in the interval of 75–125 mg N L-1. No tendency of nitrite inhibition was found at tested initial nitrite concentrations in this study.
Temperature dependency of the SAA as expressed in the Ea increased at lower temperatures ([10–20] °C) compared to higher temperatures ([20–30] °C) for carriers sampled from all three reactor types.
Decreasing temperature from 30°C to 10°C resulted in 95% loss of the anammox activity in samples from RP and MP1 respectively and 98% loss of activity in samples from MP2.
The variation of measured SAA between days performed under the particular time period was found to be 3% and 2% for carriers sampled from RP and MP1 respectively, but 17% in tests performed with carriers sampled from MP2.
The anammox activity test has a potential to become an important parameter in evaluating the efficiency of nitrogen removal in the Manammox pilot if performed carefully. The activity test will hopefully be helpful for further development of the process.

48

49
6 Further work
More tests are needed to be performed to gather more experimental data and observe potential problems with the method, for example observe results performed at winter time with low temperature both in the streams to the pilot as well as in the pilot plant laboratory. Additionally, it would be interesting to correlate the activity test to changes of the operating conditions in the Manammox pilot.
It would be interesting to analyse the measured data for Specific Anammox Activity (SAA) in correlation to activity test for the other existing microorganism in the biofilm with expectations that a better understanding of the co-existence of the three groups of microorganisms (AOB, NOB and anammox) can be achieved.
Nitrogen gas produced by denitrification under anoxic conditions has not been considered. Analysis of denitrification should therefore be performed as well as frequent analysis of the reliability with consumed ammonium and nitrite. Additionally, tests with different amount of substrate as well as blank tests are recommended to be performed to observe if any pressure increment occurs without added substrate. It would even be interesting to perform the test but only add one substrate nitrite and ammonium respectively. Considering the lag phase, increasing the liquid volume in relation to the head space volume, might decrease the duration time. Longer flushing time with nitrogen gas before substrate addition should be analysed further. Even though the oxygen concentration in the liquid phase is really low after flushing with nitrogen gas for 10 minutes, it is not sure if the liquid phase is completely saturated with nitrogen.
To observe the effect of transferring carriers between the three reactors, it would be interesting to stop transferring carriers and perform the “effect of temperature change” analysis again and see if the results differ from the results gathered from this study.

50

51
7 References
Abma W.R., Drissen W., Haarhuis R., van Loosdrecht M.C.M., 2010. Upgrading of sewage treatment plant by sustainable and cost-effective separate treatment of industrial wastewater. Water Science and Technology, 61:1715-1722. Ahn Y.-H., 2006. Sustainable nitrogen elimination biotechnologies: A review. Process Biochemistry, 41:1709-1721. Bassin J.P., Pronk M., Kraan R., Kleerebezem R., van Loosdrecht M.C.M., 2011. Ammonium adsorption in aerobic granular sludge, activated sludge and anammox granules. Water Research, 45:5257-5265. Broda E., 1977. Two kinds of lithotrophs missing in nature. Z. Allg. Microbiol., 17(6):491-493. Carvajal-Arroyo J.M., Puyol D., Li G., Lucero-Acuña A., Sierra-Álvarez R., Field J.A., 2014. Pre-exposure to nitrite in the absence of ammonium strongly inhibits anammox. Water Research, 48:52-60. Cho S., Fujii N., Lee T., Okabe S., 2011. Development of a simultaneous partial nitrification and anaerobic ammonia oxidation process in a single reactor. Bioresource Technology, 102:652-659. Dapena-Mora A., Fernández I., Campos J.L., Mosquera-Corral A., Méndez R., Jetten M.S.M., 2007. Evaluation of activity and inhibition effects on Anammox process by batch tests based on the nitrogen gas production. Enzyme and Microbial Technology, 40:859-865. Dosta J., Fernández I., Vázquez-Padín J.R., Mosquera-Corral A., Campos J.L., Mata-Álvarez J., Méndez R., 2008. Short- and long-term effects of temperature on the Anammox process. Journal of Hazardous Materials, 154:688-693. Egli K., Fanger U., Alvarez P.J.J., Siegrist H., van der Meer J., Zehnder A.J.B., 2001. Enrichment and characterization of an anammox bacterium from a rotating biological contactor treating ammonium-rich leachate. Archives of Microbiology, 175:198-207. Gillberg L., Hansen B., Karlsson I., Nordström Enkel A., Pålsson A., 2003. About water treatment. Kemira Kemwater, Helsingborg. Gustafsson I, 2013. Metoder för aktivitetstest av anammox och ammoniakoxiderande bakterier på bärarmaterial. Examensarbete, UPTEC W 13021, 30 hp. Gustavsson D.J.I., 2010. Biological sludge liquor treatment at municipal wastewater treatment plants – A review. VATTEN – Journal of Water Management and Research, 66:179-192. Gustavsson D.J.I., Persson F., Aspegren H., Stålhandske L., la Cour Jansen J., 2012. Anammox i huvudströmmen – Vad är problemet? (In Swedish). VATTEN – Journal of Water Management and Research, 68:195-208.

52
Gustavsson D.J.I., Persson F., la Cour Jansen J., 2014. Manammox – mainstream anammox at Sjölunda WWTP. Proceedings of IWA World Water Conference & Exhibition, Lisbon, Portu-gal, September 21-26, 2014. Hanaki K., Wantawin C., Ohgaki S., 1990. Nitrification at low levels of dissolved oxygen with and without organic loading in a suspended-growth reactor. Water Research, 24(3):297-302. Hanner N., Aspegren H., Nyberg U., Andersson B., 2003. Upgrating the Sjölunda WWTP according to a novel process concept. Water Science and Technology, 47:1-7. HELCOM 2013. [online] Available at: <http://www.helcom.fi/Documents/Ministerial2013/Ministerial%20declaration/2013%20Copenhagen%20Ministerial%20Declaration%20w%20cover.pdf> [Accessed 1 September 2014]. Hellinga C., Schellen A.A.J.C., Mulder J.W., van Loosdrecht, M.C.M., Heijnen, J.J., 1998. The Sharon process: an innovative method for nitrogen removal from ammonium-rich waste water. Water Science and Technology 37:135-142. Hendrickx T.L.G., Wang Y., Kampman C., Zeeman G., Temmink H., Buisman C.J.N., 2012. Autotrophic nitrogen removal from low strength waste water at low temperature. Water Research, 46:2187-2193. Henze M., Harremoës P., la Cour Jansen J., Arvin, E., 1997. Wastewater treatment – Biological and Chemical Processes. 2nd edition. Springer-Verlag, Berlin.
Hu Z., Lotti T., de Kreuk M., Kleerebezem R., van Loosdrecht M., Kruit J., Jetten M.S.M., Kartal B., 2013. Nitrogen removal by a nitration-anammox bioreactor at low temperature. Applied and Environmental Microbiology, 79:2807-2812. Hunik J.H., Tramper J., Wijffels R.H., 1994. A strategy to scale up nitrification processes with immobilized cells of nitrosomonas europaea and nitrobacter agilis. Bioprocess Engineering, 11:73-82. Isaka K., Date Y., Kimura Y., Sumino T., Tsuneda S., 2008. Nitrogen removal performances using anaerobic ammonium oxidation at low temperatures. Federation of European Microbiological Societies Research Letter, 282:32-38. Jetten M.S.M., Horn S.J, van Loosdrecht., M.C.M., 1997. Towards a more sustainable municipal wastewater treatment system. Water Science Technology, 35:171-180. Jetten M.S.M, Wagner M., Fuerst J., van Loosdrecht M., Kuenen G., Strous M., 2001. Microbiology and application of the anaerobic ammonium oxidation (´anammox process´). Current Opinion in Biotechnology, 12:283-288. Jetten M.S.M., Kartal C.P., van Niftrik L., van de Pas-Schoonen K.T., Sliekers O., Haajer S., van der Star W., Smid M., van de Vossenberg J., Schmidt I., Harhangi H., van Loosdrecht M., Kuenen J.G., Op den Camp H., Strous M., 2005. 1994-2004: 10 years of research on the anaerobic oxidation of ammonium. Biochemical Society Transactions, 33:119-123.
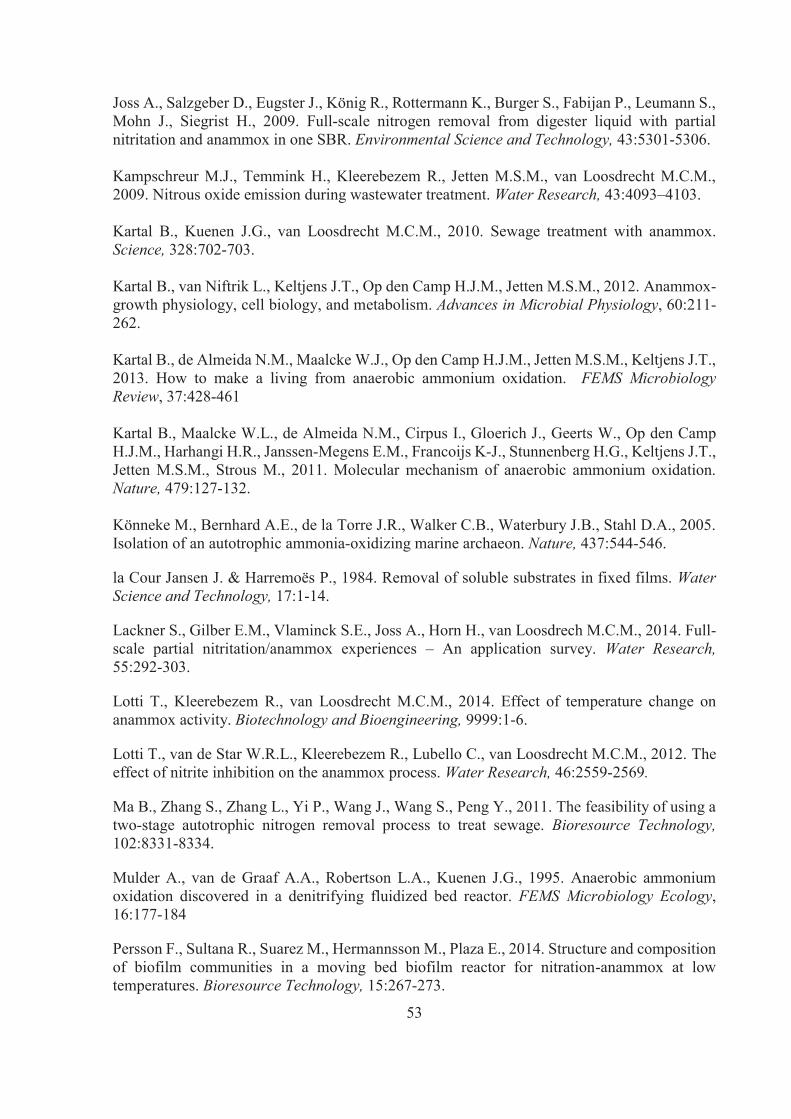
53
Joss A., Salzgeber D., Eugster J., König R., Rottermann K., Burger S., Fabijan P., Leumann S., Mohn J., Siegrist H., 2009. Full-scale nitrogen removal from digester liquid with partial nitritation and anammox in one SBR. Environmental Science and Technology, 43:5301-5306. Kampschreur M.J., Temmink H., Kleerebezem R., Jetten M.S.M., van Loosdrecht M.C.M., 2009. Nitrous oxide emission during wastewater treatment. Water Research, 43:4093–4103. Kartal B., Kuenen J.G., van Loosdrecht M.C.M., 2010. Sewage treatment with anammox. Science, 328:702-703. Kartal B., van Niftrik L., Keltjens J.T., Op den Camp H.J.M., Jetten M.S.M., 2012. Anammox-growth physiology, cell biology, and metabolism. Advances in Microbial Physiology, 60:211-262. Kartal B., de Almeida N.M., Maalcke W.J., Op den Camp H.J.M., Jetten M.S.M., Keltjens J.T., 2013. How to make a living from anaerobic ammonium oxidation. FEMS Microbiology Review, 37:428-461 Kartal B., Maalcke W.L., de Almeida N.M., Cirpus I., Gloerich J., Geerts W., Op den Camp H.J.M., Harhangi H.R., Janssen-Megens E.M., Francoijs K-J., Stunnenberg H.G., Keltjens J.T., Jetten M.S.M., Strous M., 2011. Molecular mechanism of anaerobic ammonium oxidation. Nature, 479:127-132. Könneke M., Bernhard A.E., de la Torre J.R., Walker C.B., Waterbury J.B., Stahl D.A., 2005. Isolation of an autotrophic ammonia-oxidizing marine archaeon. Nature, 437:544-546.
la Cour Jansen J. & Harremoës P., 1984. Removal of soluble substrates in fixed films. Water Science and Technology, 17:1-14.
Lackner S., Gilber E.M., Vlaminck S.E., Joss A., Horn H., van Loosdrech M.C.M., 2014. Full-scale partial nitritation/anammox experiences – An application survey. Water Research, 55:292-303.
Lotti T., Kleerebezem R., van Loosdrecht M.C.M., 2014. Effect of temperature change on anammox activity. Biotechnology and Bioengineering, 9999:1-6.
Lotti T., van de Star W.R.L., Kleerebezem R., Lubello C., van Loosdrecht M.C.M., 2012. The effect of nitrite inhibition on the anammox process. Water Research, 46:2559-2569.
Ma B., Zhang S., Zhang L., Yi P., Wang J., Wang S., Peng Y., 2011. The feasibility of using a two-stage autotrophic nitrogen removal process to treat sewage. Bioresource Technology, 102:8331-8334.
Mulder A., van de Graaf A.A., Robertson L.A., Kuenen J.G., 1995. Anaerobic ammonium oxidation discovered in a denitrifying fluidized bed reactor. FEMS Microbiology Ecology, 16:177-184
Persson F., Sultana R., Suarez M., Hermannsson M., Plaza E., 2014. Structure and composition of biofilm communities in a moving bed biofilm reactor for nitration-anammox at low temperatures. Bioresource Technology, 15:267-273.

54
Plaza E., Stridh S., Örnmark J., Kanders L., Trela, J., 2011. Swedish experiences of the deammonification process in a biofilm system. In: Proceedings of the WEF/IWA Conference on Nutrient Recovery and Management. Miami, USA, January 9-12, 2011. Regmi P., Miller M.W., Holgate B., Bunce R., Park H., Chandran K., Wett B., Murthy S., Bott C.B., 2014. Control of aeration, aerobic SRT and COD input for mainstream nitritation/denitritation. Water Research, 57:162-171. Rosenwinkel K.-H. & Cornelius A., 2005. Deammonification in the moving-bed process for the treatment of wastewater with high ammonia content. Chemical Engineering and Technology, 28:49-52. Siegrist H., Salzgeber D., Eugster J., Joss A., 2008. Anammox brings WWTP closer to energy autarky due to increased biogas production and reduced aeration energy for N-removal. Water Science and Technology, 57:383-388. Sliekers A.O., Derwort N., Campos Gomez J.L., Strous M., Kuenen J.M., Jetten M.S.M., 2002. Completely autotrophic nitrogen removal over nitrite in one single reactor. Water Research, 36:2475–82.
Strous M., Fuerst J.A., Kramer E.H.M., Logemann S., Muyzer G., van de Pas-Schoonen K.T., Webb R., Kuenen J.G., Jetten M.S.M., 1999a. Missing lithotroph identified as a new planctomycete. Nature, 400:446-449.
Strous M., Heijnen J.J., Kuenen J.G., Jetten M.S.M.., 1998. The sequencing batch reactor as a powerful tool for the study of slowly growing anaerobic ammonium-oxidizing microorganisms. Applied Microbiology and Biotechnology, 50:589-596.
Strous M., Kuenen J.G., Jetten M.S.M., 1999b. Key physiology of anaerobic ammonium oxidation. Applied and Environmental Microbiology, 65:3248-3250.
Strous M., van Gerven E., Kuenen J.G., Jetten M., 1997. Effects of Aerobic and Microaerobic Conditions on Anaerobic Ammonium-Oxidizing (Anammox) Sludge. Applied and Environmental Microbiology, 63:2446-2448.
Sultana R., 2014. Partial nitritation/anammox process in a moving bed biofilm reactor operated at low temperatures. Licentiate thesis, TRITA-LWR LIC-2014:05, 33p.
Trimmer M., Nicholls J.C., Deflandre, B., 2003. Anaerobic ammonium oxidation measured in sediments along the Thames Estuary, United Kingdom. Applied and Environmental Microbiology, 69(11):6447-6454.
van der Star W.R.L., Abma W.R., Blommers D., Mulder J-W., Tokutomi T., Strous M., Picioreanu C., van Loosdrecht M.C.M., 2007. Startup of reactors for anoxic ammonium oxidation: Experiences from the first full-scale anammox reactor in Rotterdam. Water Research, 41:826-834.

55
Van Hulle S.W.H., Vandeweyer H.J.P., Meesschaert B.D., Vanrolleghem P.A., Dejans P., Dumoulin A., 2010. Engineering aspects and practival application of autotrophic nitrogen removal from nitrogen rich streams. Chemical Engineering Journal, 162:1-20. Vázques-Padín J.R., Fernández I., Morales N., Campos J.L., Mosquera-Corral A., Méndez R., 2011. Autotrophic nitrogen removal at low temperature. Water Science and Technology, 63:1282-1288. Vlaeminck S.E., Terada A., Smets B.F., De Clippeleir H., Schaubroeck T., Bolca S., Demeestere L., Mast J., Boon N., Carballa M., Verstraete W., 2010. Aggregate size and architecture determine microbial activity balance for one-stage partial nitritation and anammox. Applied and Environmental Microbiology, 76:900-909. Wett B., 2006. Solved upscaling problems for implementing deammonification of rejection water. Water Science and Technology, 53:121-128. Wett B., 2007a. Development and implementation of a robust deammonification process. Water Science and Technology, 56:81-88. Wett B., Hell M., Nyhuis G., Puempel T., Takacs I., Murthy S., 2010. Syntrophy of aerobic and anaerobic ammonia oxidisers. Water Science and Technology, 61:1915-1922. Wett B., Murthy S., Takács I., Hell M., Bowden G., Deur A., O´Shaugnessy M., 2007b. Key parameters for control of DEMON deammonification process. Water Practice, 1:1-11. Wett B., Omari A., Podmirseg S.M., Han M., Akintayo O., Gómez Brandón M., Murthy S., Bott C., Hell M., Takács I., Nyhuis G., O´Shaughnessy M., 2012. Going for mainstream deammonification from bench- to full scale for maximized resource efficiency. Proceedings of IWA World Water Conference & Exhibition, Busan, South Korea, September 16-21, 2012. Ødegaard H., Gisvold G., Strickland J., 2000. The influence of carrier size and shape in the moving bed biofilm process. Water Science and Technology, 41:383-391.

56

57
8 Appendices
Appendix I Method description for anammox activity test
Appendix II Additional data and figures from: Initial experiments and configuration
Appendix III Additional figures and data from: Reliability and reproducibility
Appendix IV Additional figures from: Initial concentrations and diffusion limitations
Appendix V Additional figures and data from: Effect of temperature change
Appendix VI Additional figures from: Frequent analysis of the anammox activity in the Manammox pilot
Appendix VII Article – Manometric method for evaluation of anammox activity in mainstream anammox at Sjölunda WWTP

58

59
Appendix I
Method description for anammox activity test The specific anammox activity test is based on pressure increment inside a closed reactor and is performed with continuous manometric batch test. The pressure increment occur because of conversion of ammonium and nitrite to nitrogen gas by the anammox bacteria.
1) Fill a water bath and select a set point for the temperature. Observe that the water bath should be high enough to cover the whole experimental reactor.
2) Sample carriers from the Manammox pilot plant by sinking a bucket in the desired reactor and put the carriers in a plastic bottle and transfer to the laboratory room.
3) Add the carriers to a sieve and rinse them carefully with tap water. 4) Count 240 carriers and put them in a 1 L reactor. 5) Add 750 ml water and 22 ml buffer solution to the reactor. 6) Put a magnet to the reactor and place it on a stirrer with 400 rpm. It is recommended
that the stirrer speed is increased successively in order to reach a good mixing. 7) Measure the temperature and pH. 8) Wait until the temperature in the reactor has reached desired temperature. 9) Flush the solution with nitrogen gas through a gas distributor added to the bottom of
the reactor for at least 10 minutes in order to achieve anoxic conditions. Put a septum and a lock on the reactor immediately after removing the gas distributor.
10) Add separate needles through the septum, connect the pressure meter to the reactor and let the reactor stand in the water bath for 30 minutes for pressure and temperature stabilisation.
11) Add 20 ml ammonium (5 mg NH4+-N mL-1) and 20 ml nitrite (5 mg NO2
--N mL-1) substrate to the solution with a syringe and needle through the septum.
12) Start logging by pressing “Store-button” two times, first by holding the button for 2 seconds, then again when the message “Logg run” appears.
13) Run the analysis for 120 minutes. 14) Stop logging by pressing “Store-button” once, and choose: “Stop” – “yes”. 15) When the analysis is finished, measure the temperature and pH and weigh the reactor. 16) Fill the reactor completely with water and weigh the reactor again.

60

61
Appendix II Additional data and figures from: Initial experiments and configuration.
Table a-1. Set up for initial experiments, set 1-3. Set 1-3 refer to experiments with carriers from RP, MP1 and MP2 respectively.
Experiment [NO2-] [mg N L-1] [NH4
+] [mg N L-1] 1.1 125 125 1.2 75 75 1.3 100 100 1.4 50 50 1.5 25 25 2.1 125 125 2.2 100 100 2.3 75 75 2.4 50 50 2.5 25 25 3.1 100 100 3.2 125 125 3.3 75 75
Figure a-1. N2 produced as a function of time (left) and production rate (right) at different initial NO2
- concentrations with carriers sampled from RP.
Figure a-2. N2 produced as a function of time (left) and production rate (right) at different initial NO2-
concentrations with carriers sampled from MP1.
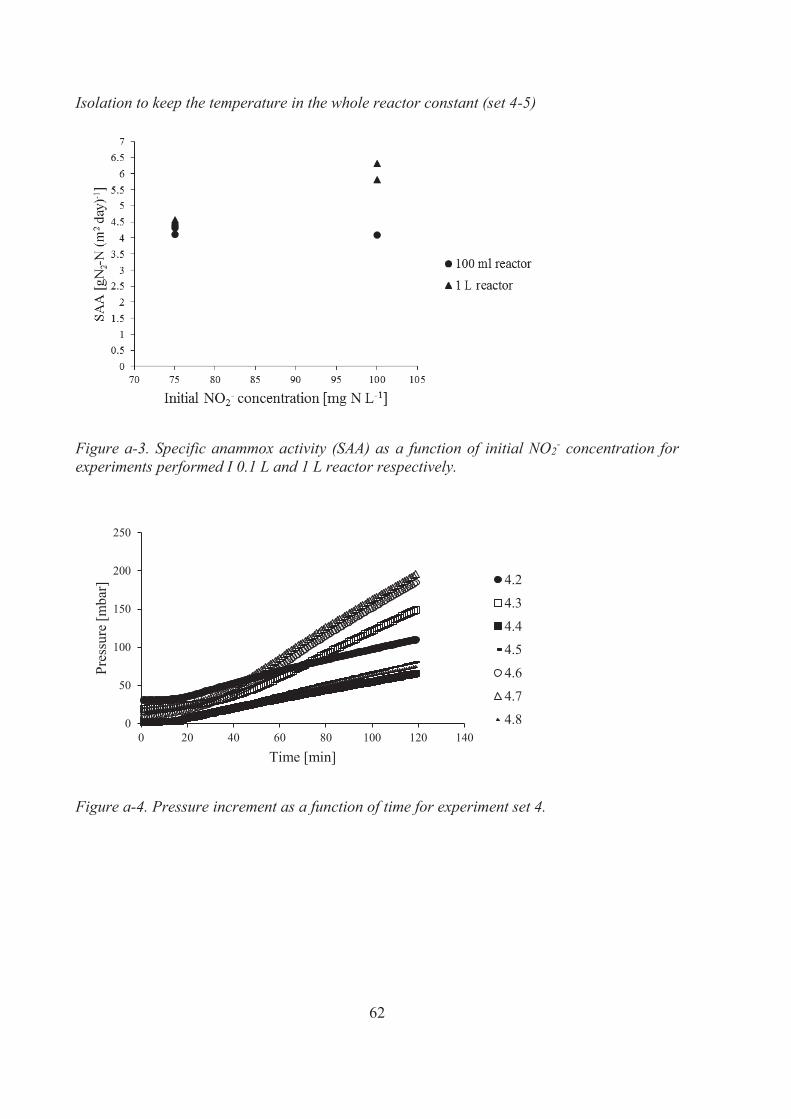
62
Isolation to keep the temperature in the whole reactor constant (set 4-5)
Figure a-3. Specific anammox activity (SAA) as a function of initial NO2- concentration for
experiments performed I 0.1 L and 1 L reactor respectively.
Figure a-4. Pressure increment as a function of time for experiment set 4.
0
50
100
150
200
250
0 20 40 60 80 100 120 140
Pres
sure
[mba
r]
Time [min]
4.2
4.3
4.4
4.5
4.6
4.7
4.8

63
Appendix III Additional figures and data from: Reliability and reproducibility.
Figure a-5. N2 produced in time from experiment set 7.
Table a-2. Experimental data from set 7.
7.1 7.2 7.3 7.4 7.5 Mean SD N2 produced [mmol] 0.0731 0.0743 0.0714 0.0723 0.0664 0.0715 0.0028 ΔP [mbar] 45.6 48.6 39.4 41.2 36.3 42.2 4.4
ΔNH4-N [mg L-1] 23.6 22.8 25.6 20.0 18.8 22.2 2.5
ΔNO2-N [mg L-1] 26.0 24.4 23.4 22.0 19.4 23.0 2.24 R_NiAm 1.10 1.07 0.91 1.10 1.03 1.04 0.91
dN2/dt [mmol N min-1] 1.695E-03 1.770E-03 1.650E-03 1.749E-03 1.603E-03 1.694E-03 6.2E-05
VG [m3] 3.9E-05 3.71E-05 4.42E-05 4.28E-05 4.459E-05 4.15E-05 3E-06
SAA [gN2-N (m2 day)-1] 5.65 5.90 5.50 5.83 5.34 5.645122 0.20532
VL [m3] 7.94E-05 7.94E-05 7.84E-05 7.94E-05 7.84E-05 7.90E-05 4.90E-07
VG/VL [m3 m-3] 0.490785 0.467336 0.563566 0.53844 0.568800729 0.525786 0.0402

64
Table a-3. Experimental data from set 8. 8.1 8.2 8.3 Mean SD SD (%)
ΔP [mbar] 174.6 182.4 189.5 182.2 6.1 3.3
N2 produced [mmol] 1.56898 1.6034 1.73492 1.63577 0.0715 4.4
ΔNH4-N [mg L-1] 35.6 37.1 33.2 35.3 1.60624 4.6
ΔNO2-N[mg L-1] 46.9 47.9 44.6 46.4667 1.38163 3.0
R_NiAm 1.3174 1.2911 1.3434 1.3173 0.02134 1.6
dN2/dt [mol N min-1] 0.0174 0.0181 0.0189 0.0184 0.0006 3.3
VG [m3] 2.25E-04 2.20E-04 2.19E-04 2.21E-04 2.8E-06 1.2
SAA [gN2-N (m2 day)-1] 6.306 6.539 6.816 6.5535 0.2087 3.2
VL [m3] 8.00E-04 8.00E-04 8.00E-04 8.00E-04 0 0.0
VG/VL [m3 m-3] 2.81E-01 2.75E-01 2.73E-01 2.76E-01 0.00344 1.2

65
Appendix IV Additional figures from: Initial concentrations and diffusion limitations.
Figure a-6. N2 produced in time at different initial concentration of NO2-1 in experiments
performed with carriers sampled from MP1.
Figure a-8. Produced nitrogen gas as a function of time (left) and production rate as a function of time (right) in samples from RP (●), MP1 (◊) and MP2 (x) with initial concentration of nitrite of 125 mg N L-1.
Figure a-7. N2 produced in time (left) and production rate (right) at different initial concentration of NO2-
in experiments performed with carriers sampled from MP2.

66

67
Appendix V Additional figures and data from: Effect of temperature change.
Figure a-8. N2 produced in time (left) and production rate (right) at different temperatures in experiments with carriers sampled from RP.
Figure a-9. N2 produced in time (left) and production rate (right) at different temperatures in experiments with carriers sampled from MP1.
Figure a-10. N2 produced in time (left) and production rate (right) at different temperatures in experiments with carriers sampled from MP2.
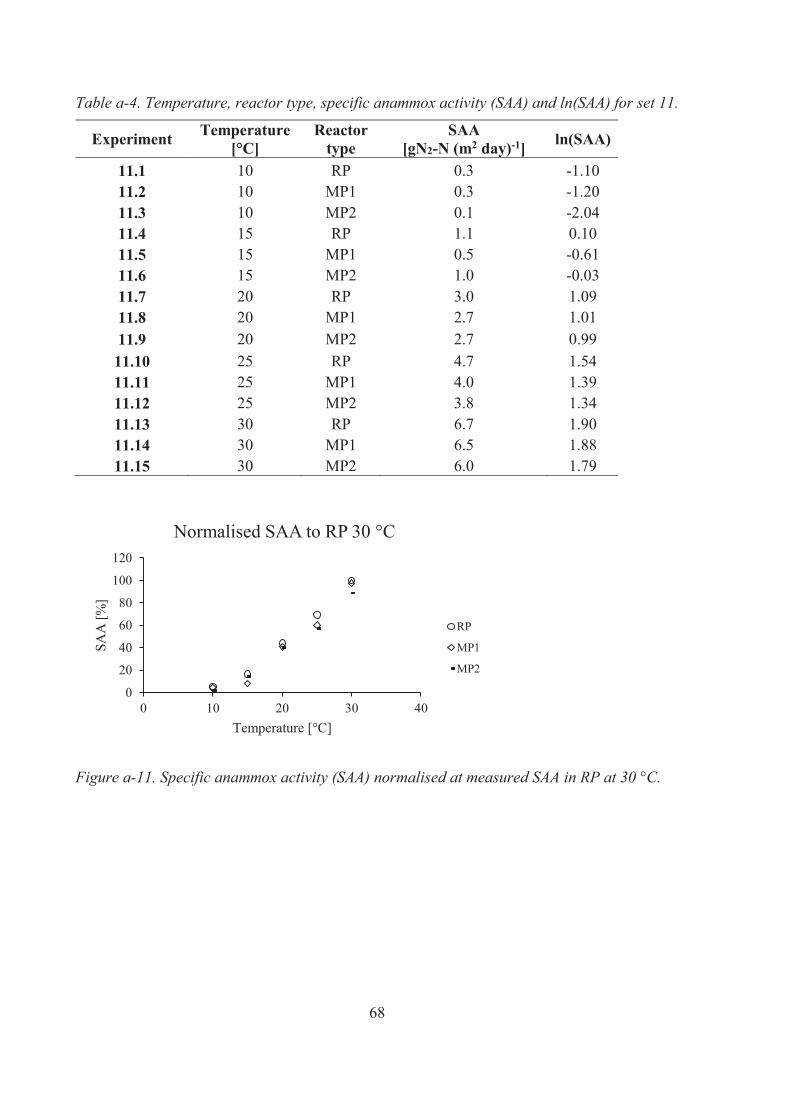
68
Table a-4. Temperature, reactor type, specific anammox activity (SAA) and ln(SAA) for set 11.
Experiment Temperature [°C]
Reactor type
SAA [gN2-N (m2 day)-1] ln(SAA)
11.1 10 RP 0.3 -1.10 11.2 10 MP1 0.3 -1.20 11.3 10 MP2 0.1 -2.04 11.4 15 RP 1.1 0.10 11.5 15 MP1 0.5 -0.61 11.6 15 MP2 1.0 -0.03 11.7 20 RP 3.0 1.09 11.8 20 MP1 2.7 1.01 11.9 20 MP2 2.7 0.99 11.10 25 RP 4.7 1.54 11.11 25 MP1 4.0 1.39 11.12 25 MP2 3.8 1.34 11.13 30 RP 6.7 1.90 11.14 30 MP1 6.5 1.88 11.15 30 MP2 6.0 1.79
Figure a-11. Specific anammox activity (SAA) normalised at measured SAA in RP at 30 °C.
0
20
40
60
80
100
120
0 10 20 30 40
SAA
[%]
Temperature [°C]
Normalised SAA to RP 30 °C
RP
MP1
MP2

69
Appendix VI Additional figures from: Continuous analysis of the anammox activity in the Manammox pilot.
Figure a-12. N2 produced in time (left) and production rate (right) for RP, MP1 and MP1 in experiments performed 15-08-2014.
Figure a-13. N2 produced in time (left) and production rate (right) for RP, MP1 and MP1 in experiments performed 18-08-2014.
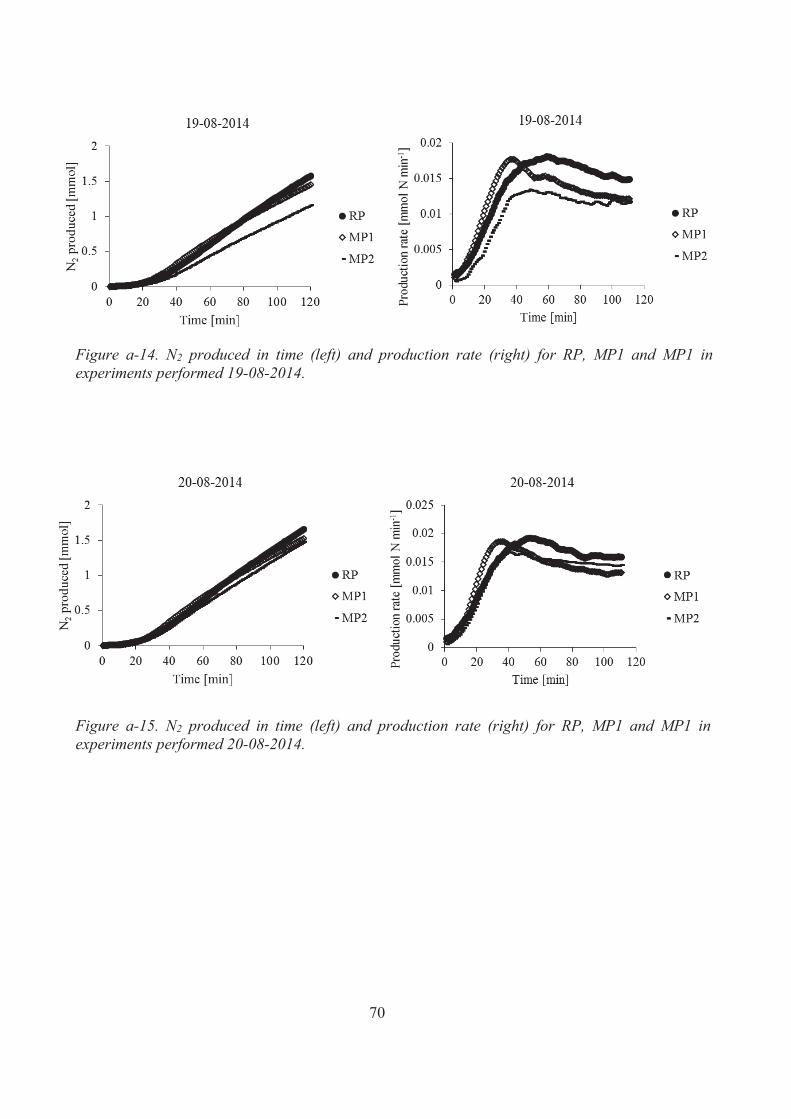
70
Figure a-14. N2 produced in time (left) and production rate (right) for RP, MP1 and MP1 in experiments performed 19-08-2014.
Figure a-15. N2 produced in time (left) and production rate (right) for RP, MP1 and MP1 in experiments performed 20-08-2014.

Appendix VII Manometric method for evaluation of anammox activity in
mainstream anammox at Sjölunda WWTP Dora Stefansdottir
Water and Environmental Engineering at the Department of Chemical Engineering, Lund University, Sweden
October 2014
Abstract
Implementing anammox based processes in the mainstream at municipal wastewater treatment plants is challenging and requires carefully constructed control strategies in order to be successful. A method to measure the specific anammox activity (SAA) was further developed and implemented in the mainstream anammox pilot plant at Sjölunda Wastewater Treatment Plant. The developed method was found to be reliable and reproducible. The influence of initial nitrite and ammonium concentrations on the SAA as well as temperature dependency were analysed. The tests, based on continuously monitored manometric batch tests, were performed on MBBR carriers type K1®. The SAA showed a dependency of initial nitrite concentrations below 75 mg N L-1 whereas the activity was independent of initial concentrations in the interval of 75–125 mg N L-1. Temperature dependency of the specific anammox activity as expressed in Ea increased at lower temperatures (10–20°C) compared to higher temperatures (20–30°C). Decreasing temperature from 30°C to 10°C resulted in 95-98% loss of the anammox activity.
Keywords: Activity test, anammox, mainstream, MBBR, temperature dependency
Introduction
Removal of nitrogen from wastewater has become an emerging concern worldwide. Nitrogen enters the ecological system mainly through domestic water and industrial pollution, where compounds like ammonium, nitrate and nitrite accumulate in lakes and seas if they are not continuously removed and the accumulation causes eutrophication. In this regard, new legislations have been set to prevent eutrophication and according to updated status of the Baltic Sea Action Plan, the nitrogen emission in Sweden must be reduced with 9,240 tonnes per year until year 2021 [1]. At municipal wastewater treatment plants (WWTPs), traditional nitrogen removal is commonly
accomplished with nitrification followed by denitrification which in many cases requires an addition of external carbon source for successful denitrification. With the new legislation, the need of aeration and external carbon source will increase in order to fulfil the requirements. That leads to increased production of greenhouse gases and energy demands [2]. An interesting solution to accomplish an efficient nitrogen removal is a process configuration that combines nitritation and anaerobic ammonium oxidation (anammox). The anammox bacteria grow on ammonia and uses nitrite as an electron acceptor where the reactants are converted to nitrogen gas. Since the anammox bacteria is anaerobic and autotrophic, significant savings in aeration energy can be achieved, no added carbon is

needed and the sludge production can be lowered [3][4]. Currently, the anammox process has been successfully implemented in WWTPs to treat sludge liquor from the dewatering of anaerobically digested sludge at temperatures ranging from 25-35°C and high ammonium concentration [5]. Implementing the process into the mainstream is on the other hand challenging since the temperature and the ammonium concentration in the mainstream is much lower compared to conditions in the sludge liquor stream, resulting in undesirable conditions for the slow-growing anammox bacteria. Temperature have been shown to have a great influence on the anammox activity and one of the biggest challenges in the development of the anammox technology is to achieve high anammox activity at low temperatures [6] [7] [8].
VA SYD, a municipal joint authority in southern Sweden, have ongoing extensive pilot tests at the WWTP in Malmö (Sjölunda WWTP), evaluating the nitritation-anammox process in Moving Bed Biofilm Reactors (MBBRs). The project is called the Mainstream anammox (Manammox) project and the aim is to implement the deammonification process in already existing MBBRs in the mainstream [9].
The aim of this work was to further develop a method to measure and evaluate the specific anammox activity (SAA) in the anammox based process performed in an MBBR in the Manammox pilot plant. The reliability and reproducibility of the method was analysed, as well as the effect of different initial concentrations of nitrite on the SAA. Additionally, the effect of temperature change on the specific anammox activity was analysed.
Materials and methods
Manometric test and equipment
The specific anammox activity (SAA) was measured according to methodology
described by Dapena-Mora et al. [10] and modified by Lotti et al. [11]. Anammox activity was measured in MBBR carriers type K1® by continuously monitored manometric batch tests.
The pressure meter was GMH 5150 from Greisinger electronic GmbH (Regenstauf, Germany) logged one value each minute. A GMSD 350MR sensor (Greisinger electronic GmbH) was connected to the pressure meter. The sensor measures relative pressure (interval of -199 – 350 mbar). To transfer logged data to the computer, the pressure meter was connected to a computer with a USB 5100 (Greisinger electronic GmbH) and a software, GSOFT 3050 (Greisinger electronic GmbH). The recorded data was exported to Microsoft Excel were all processing and calculations were performed.
Origin of the biomass
The experiments were performed with carriers from the Manammox pilot plant at Sjölunda WWTP. The Manammox pilot plant consists of three MBBR reactors. One 1.5 m3 reactor for sludge liquor treatment (RP) and two 2.6 m3 reactors in series for the mainstream process (Manammox Pilot 1 = MP1 and Manammox Pilot 2 = MP2). The three reactors are filled with K1® carriers (AnoxKaldnes, Sweden, effective surface area = 500 m2 m-3) from the sludge liquor treatment plant at Himmerfjärden WWTP, Sweden [12] with a filling degree of 40%. Every second weekday, carriers are manually transferred between the mainstream reactors (MP1 and MP2) and the sludge liquor reactor (RP), where the amount of transferred carriers is approximately 6% and 22% of the carriers in the mainstream and sludge liquor system respectively. The temperature in the sludge liquor reactor is around 28-29°C and in the range 14-21°C for the mainstream reactors. The intention with the exchange of carriers between the reactors is to stimulate the growth of the anammox and ammonia oxidising bacteria (AOB) and inhibit the

growth of nitrite oxidising bacteria (NOB) [13].
General procedure for manometric tests
The experiments were performed in 1 L reactor with 240 carriers. The carriers were counted manually and washed with tap water to remove particulate compounds. The carriers were put in a 1 L reactor and 750 ml distilled water was added. 23 ml of 1 M phosphate buffer (contained Na2HPO4·12H2O and NaH2PO4 dissolved in distilled water) was added to the solution to achieve a constant pH around 7.75 throughout the experiment. The reactor was kept in a high water bath which submerged the whole reactor in order to achieve stabilised temperature and equilibrium between the liquid phase and headspace temperature. The temperature of the water bath was set to 28 °C unless mentioned otherwise. Homogenous conditions were accomplished with a magnetic stirrer with a stirring speed of 400 rpm. The liquid and gas phase where flushed with nitrogen gas for a total of 10 minutes in order to achieve anoxic conditions. The pressure meter was connected to the reactor with a needle through the septum and the pressure inside the reactor was stabilised to atmospheric pressure by adding another needle through the septum. The substrate (contained (NH4)2SO4 and NaNO2 dissolved in distilled water) was injected with a syringe and needle through the septum and the logging was started. The duration time for each experiment was 120 minutes. The volume of the headspace was found by weighting the reactor immediately after the experiment, then filling it with water and reweigh. The weigh difference was converted to volume (m3) by dividing with the density of water.
Reliability and reproducibility
The reliability was analysed by comparing the results from the pressure measurements with how much nitrite- and ammonium nitrogen had been consumed
during the experiment. Several mL from the liquid phase in the reactors were sampled right before the logging was started and immediately after the experiment and the nitrite and ammonium concentrations were analysed with HACH LANGE (Sköndal, Sweden) cuvettes. Ammonium was analysed with LCK 303 cuvettes and nitrite was analysed with LCK 342 cuvettes. Additionally, the ratio of consumed nitrite over ammonium was calculated in order to analyse if the consumption followed the stoichiometry of the anammox reaction. To analyse the reproducibility, several experiments under the same conditions were performed. The reliability and reproducibility test was performed with carriers from RP. Initial concentrations of nitrite and ammonium were 100 mg N L-1 for respective substrate and the temperature was set to 28°C.
Initial concentrations and diffusion limitations
The dependency of SAA of initial concentration of added ammonium and nitrite was analysed. The bulk process can be described by analysing the diffusion of the substrate and the reaction products through the biofilm. The diffusion leads to a bulk process of either half or zero order, with respect to the bulk concentration of the considered substrate [14]. Therefore, the change of reaction order was expected to be indicated by plotting the SAA as a function of the initial nitrite concentration. An important aspect in the development of the method was to decide which initial concentration of substrate should be used, where the anammox activity became independent of the concentration in the bulk phase with a zero order of reaction, but without nitrite inhibition [10][11]. Carriers sampled from all of the three reactors (RP, MP1 and MP2) where analysed and the carriers were sampled fresh before each experiment. Starting concentrations of 25, 50, 75, 100 and 125 mg N L-1 of ammonium and nitrite were tested.

Effect of temperature change
The effect of temperature change have been shown to have great impact on the anammox activity [6][7][8]. Therefore, the influence of temperature change on the specific anammox activity in the Manammox pilot was desired to be observed. Carriers sampled from all of the reactors (RP, MP1 and MP2) were analysed and three experiments performed at the same temperature were performed on the same day with samples from respective reactor. Temperatures of 10, 15, 20, 25 and 30°C were tested and the initial concentrations of both nitrite and ammonium were 125 mg N L-1.
Calculations
Specific Anammox Activity (SAA)
The N2 in both liquid and gas phase was considered, where soluble N2 in liquid phase was calculated with Henry’s law. The pressure increment was converted to N2 produced according to equation (1)
(1)
Where 1000 is the conversion from mole to mmole [mmol mol-1], Δp is pressure difference [mbar], VG is the volume of the headspace [m3], R is the gas constant [(mbar m3) (mol K)-1] and T is the temperature [K].
The nitrogen gas production rate was calculated for every 10 minutes interval with the function SLOPE in Microsoft Excel and plotted as a function of time.
(2)
Where αmax is the maximum slope of the line from linear regression of a set of 10 data points.
The ten data points for N2 produced [mmol] representing the maximum increment were then plotted as a function of time and αmax was chosen as the slope of the
linear regression line. The specific anammox activity was calculated according to equation (3).
(3)
Where 0.001 is the conversion from mmole to mole [mmol mol-1], αmax is the maximum slope [mmol min-1], 1400 is conversion from minutes to days [min day-1], 28 is the molecular weight of nitrogen gas [g mol -1], X is the number of carriers in the experiment and 0.00049 is the effective area of each carrier [m2].
Results and discussions
Reliability and reproducibility
Comparison between the amount of produced nitrogen gas calculated from the recorded pressure increment and the potential nitrogen gas produced based on consumed nitrogen and ammonium is presented in Figure 1.
Figure 1. Produced nitrogen gas based on recorded pressure ( ) and consumed ammonium ( ) and nitrite ( ) respectively in the three experiments (1, 2 and 3).
It can be seen that the N2 produced is slightly less than the potential amount of nitrogen based on both nitrite and ammonium consumption. The reason might be ammonium absorption on the carriers which results in lower measured ammonium concentration in the sample but the molecules never dissipate in the anammox reaction and are therefore not

converted to nitrogen gas [15]. Observed appearance of an initial lag phase of around 20 minutes, where only small pressure increment occurred, does even affect the amount of produced nitrogen gas calculated from the recorded pressure [16].
The SAA from the three experiments resulted in an average SAA of 6.5 gN2-N (m2 day)-1 with a standard deviation of around 3%. Which is similar to the standard deviation observed by Lotti et al. [11]. The average ratio between the consumed nitrite and ammonium was 1.32 ± 0.021 as expected based on the stoichiometry for the anammox reaction and demonstrates that the nitrogen gas production followed the anammox reaction. The method was considered to be reliable and reproducible and in further experiments, only one test was made for each parameter tested.
Initial concentrations and diffusion limitations
Specific anammox activity as a function of initial nitrite concentration for samples from RP, MP1 and MP2 is presented in Figure 2. It can be seen that the initial concentration of nitrogen affected the anammox activity greatly at the initial nitrate concentrations tested.
Figure 2. Specific anammox activity as a function of initial nitrite concentration.
Moreover, indication of change from half- to zero order reaction occurred at initial nitrite concentration around 50-75 mg N L-1. No tendency of nitrite inhibition
was observed for the tested initial nitrite concentrations.
Further, it can be seen from Figure 2 that the activity for carriers sampled from the three different reactors followed similar pattern. The specific anammox activity was found to be comparable in the RP and MP1 reactors, whereas the activity in the MP2 reactor was slightly lower. The lower activity in the MP2 reactor was expected, since both ammonium and nitrite concentrations in the Manammox pilot are much lower in MP2 compared to concentrations in both RP and MP1 [13].
In Figure 3 and Figure 4, the profiles for produced nitrogen gas and the production rate respectively, are presented as a function of time for experiments performed with different initial concentrations of nitrite and ammonium. The carriers were sampled from RP. More detailed data can be found in [16].
Figure 3. Produced nitrogen gas at different initial nitrite concentrations [mg N L-1].
As seen in Figure 3, the curves for nitrogen gas produced have similar behaviour at initial nitrite and ammonium concentrations at 75, 100 and 125 mg N L-1 respectively. On the contrary, initial concentrations of 25 and 50 mg N L-1 led to a decreased slope after around 40 and 60 minutes respectively and where the curves flatten out.
This becomes even clearer in Figure 4, where the production rates are relatively stable during the experiments with initial nitrate and ammonium concentrations of 75, 100 and 125 mg N L-1, but decreases

drastically after 40 respectively 60 minutes at initial concentrations of 25 respectively 50 mg N L-1.
Figure 4. Production rate at different initial nitrite concentrations [mg N L-1].
That behaviour indicates that the substrate in the liquid phase have decreased to a level where the production rates and activities are limited by diffusion of substrate through the biofilm. Similar pattern for the nitrogen gas production and production rate was found for samples from MP1 and MP2 [16].
Considering that the wish is to increase the specific anammox activity at the Manammox pilot plant, which would lead to increased substrate consumption rate, initial ammonium and nitrite concentrations of 125 mg N L-1 was found to be suitable for the method.
Effect of temperature change on the anammox activity
Transfer of carriers between the three different reactors (RP, MP1 and MP2) in the Manammox pilot plant is performed every other weekday. Since the temperature is different in the reactors, the bacteria in the biofilm of the carriers are adapted to different conditions.
During the experimental period, the temperatures in the Manammox pilot was around 28-29°C in the RP reactor and 21°C in the mainstream reactors (MP1 and MP2). The temperature interval tested in the activity tests in this study ranged from 10°C
to 30°C. Investigation of higher temperatures was considered to be unnecessary, since temperatures in the pilot plant reactors never reach higher values. Graphs of SAA as a function of temperature (°C) as well as ln(SAA) as a function of the inversed temperature (K-1) for samples from all three reactor types are presented in Figure 5.
In Figure 5 (left), the temperature dependence is described as exponential with coefficient of determination (R2) above 0.9 for samples from RP and MP1, but linear increment is more suitable for samples from MP2. Analysis of ln(SAA) as a function of T-1 (Figure 5 right) shows that even though the whole temperature interval can be described with one linear regression (dotted line in the figure) for samples from RP and MP1, the fitting became much better when the temperature interval was divided into (10–20°C) and (20–30°C) respectively. For samples from MP2, the linear regression for the whole temperature interval became unsufficient (R2 < 0.9), but division into two parts made the linear correlation suitable. These results agrees with results obtained by Lotti et al. [6]
Summarised results from the experiments of temperature influence on the anammox activity were, that the temperature dependency of the SAA as expressed in the Ea increased at lower temperatures (10–20°C) compared to higher temperatures (20–30°C) for carriers sampled from all three reactor types which follows the behaviour stated by Lotti et al. [6] and Isaka et al. [8]. The activation energy (Ea) (calculated according [6]) for samples from the three different reactors tested at the higher temperature interval were relatively similar, 60.4, 64.5 and 58.5 kJ mol-1 for samples from RP, MP1 and MP2 respectively. The Ea values for the lower temperature interval were similar for the samples from RP and MP1, with Ea of around 151 kJ mol-1 but differed greatly to the value for samples from MP2 (209 kJ mol-1). Since the tested carriers came from

the same inoculum and continuous exchange of carriers between the three reactors occurs, the activation energy was expected to be relatively similar for samples
from the three reactors in the two temperature intervals. The difference might be due to adaption to different operating conditions in the Manammox pilot.
Figure 5. Anammox activity as a function of temperature [°C] (left). The bullets (●) are the measured SAA, the dotted line (∙∙∙) is the exponential correlation and the dashed line (---) is linear correlation. Arrhenius plot of ln(SAA) as a function of temperature [K-1] (right). The bullets (●) are ln of the measured SAA, solid line (-) is the linear regression line of different temperature intervals and (∙∙∙) is linear regression for the whole temperature interval. Rows A, B and C refers to samples from RP, MP1 and MP2 respectively.
To make the comparison of the temperature dependency for samples from the three reactors more clear, the anammox activity for samples from RP, MP1 and
MP2 measured at 10°C, 15°C, 20°C, 25°C and 30°C are presented in Figure 6.
A
B
C

Figure 6. Effect of temperature on anammox activity.
Decreasing temperature from 30°C to 10°C resulted in 95% loss of the anammox activity in samples from RP and MP1 respectively and 98% loss of activity in samples from MP2. However, it is promising that anammox activity was still observed at 10°C in samples from all of the reactor types.
Conclusions
The developed method to measure the specific anammox activity based on manometric batch tests was found to be reliable and reproducible. Additionally, the procedure for the activity test is applicable for further research at the Manammox pilot plant.
The specific anammox activity showed a dependency of initial nitrite concentrations below 75 mg N L-1 whereas the activity is independent of initial concentrations in the interval of 75–125 mg N L-1. No tendency of nitrite inhibition was found at tested initial nitrite concentrations.
Temperature dependency of the SAA as expressed in Ea increased at lower temperatures (10–20°C) compared to higher temperatures (20–30°C) for carriers sampled from all three reactor types. Decreasing temperature from 30°C to 10°C resulted in 95% loss of the anammox activity in samples from RP and MP1 respectively and 98% loss of activity in samples from MP2.
The anammox activity test has a potential to become an important parameter in evaluating the efficiency of nitrogen removal in the Manammox pilot if performed carefully.
References
[1] HELCOM 2013. [Online]. Available: <http://www.helcom.fi/Documents/Ministerial2013/Ministerial%20declaration/2013%20Copenhagen%20Ministerial%20Declaration%20w%20cover.pdf> [Accessed 01-09-2014] [2] Hu Z., Lotti T., de Kreuk M., Kleerebezem R., van Loosdrecht M., Kruit J., Jetten M.S.M., Kartal B. (2013). Nitrogen removal by a nitration-anammox bioreactor at low temperature. Appl. and Environ. Microbiol. 79:2807-2812. [3] Kartal B., Kuenen J.G., van Loosdrecht M.C.M. (2010). Sewage treatment with anammox. Science 328:702-703
[4] Siegrist H., Salzgeber D., Eugster J., Joss A., (2008). Anammox brings WWTP closer to energy autarky due to increased biogas production and reduced aeration energy for N-removal. Water Sci. Technol. 57:383-388. [5] Lackner S., Gilber E.M., Vlaminck S.E., Joss A., Horn H., van Loosdrech M.C.M. (2014). Full-scale partial nitritation/anammox experiences – An application survey. Water Res. 55:292-303.
[6] Lotti T., Kleerebezem R., van Loosdrecht M.C.M. (2014). Effect of temperature change on anammox activity. Biotechnol. Bioeng. 9999:1-6.
[7] Dosta J., Fernández I., Vázquez-Padín J.R., Mosquera-Corral A., Campos J.L., Mata-Álvarez J., Méndez R. (2008). Short- and long-term effects of temperature on the Anammox process. J. Hazard. Mater. 154:688-693.

[8] Isaka K., Date Y., Kimura Y., Sumino T., Tsuneda S. (2008). Nitrogen removal performances using anaerobic ammonium oxidation at low temperatures. FEMS Microbiol. Lett. 282:32-38. [9] Gustavsson D.J.I., Persson F., Aspegren H., Stålhandske L., la Cour Jansen J. (2012). Anammox i huvudströmmen – Vad är problemet? VATTEN – J. Water Manage. Res. 68:195-208. [10] Dapena-Mora A., Fernández I., Campos J.L., Mosquera-Corral A., Méndez R., Jetten M.S.M. (2007). Evaluation of activity and inhibition effects on Anammox process by batch tests based on the nitrogen gas production. Enz. Microb. Technol. 40:859-865. [11] Lotti T., van de Star W.R.L., Kleerebezem R., Lubello C., van Loosdrecht M.C.M. (2012). The effect of nitrite inhibition on the anammox process. Water Res. 46:2559-2569.
[12] Plaza E., Stridh S., Örnmark J., nders L. and Trela, J., (2011). Swedish experiences of the deammonification process in a biofilm system. In: Proceedings of the WEF/IWA Conference on Nutrient Recovery and Management. Miami, USA, January 9-12, 2011. [13] Gustavsson D.J.I., Persson F., la Cour Jansen J. (2014). Manammox – mainstream anammox at Sjölunda WWTP. Proceedings of IWA World Water Conference & Exhibition, Lisbon, Portugal, September 21-26, 2014. [14] la Cour Jansen J. & Harremoës P. (1984). Removal of soluble substrates in fixed films. Water Sci. Technol. 17:1-14.
[15] Bassin J.P., Pronk M., Kraan R., Kleerebezem R., van Loosdrecht M.C.M. (2011). Ammonium adsorption in aerobic granular sludge, activated sludge and anammox granules. Water Res. 45:5257-5265.
[16] Stefansdottir D. (2014). Manometric method for evaluation of anammox activity in mainstream anammox at Sjölunda WWTP. Lund: Lund University