Embed Size (px)
Citation preview

Doctoral School in Environmental Engineering
Simultaneous partial Nitritation, Anammox and Denitrification (SNAD) process
for treating ammonium-rich wastewaters
Michela Langone
2013
NO3-
O2N2
NH2OH
NO2-
NO
N2O
O2
Organic N
NH3/NH4
+
N2H4
O2
CH4
Organic CO2
CO2


Simultaneous partial Nitritation, Anammox and Denitrification (SNAD) process
for treating ammonium-rich wastewaters
Michela Langone
2013

Doctoral thesis in Environmental Engineering, XXV cycle
Faculty of Engineering, University of Trento, Italy
Academic year 2011/2012
Supervisor
Prof. dr. eng. Gianni Andreottola, University of Trento, Italy
Panel Members:
Prof. dr. ir. Mike S.M. Jetten, Radboud University of Nijmegen, Netherlands
Prof. dr. eng. Francesco Pirozzi, University of Naples “Federico II”, Italy
Manuscipt commitee:
Prof. Elsa Weiss-Hortala, Ecole nationale supérieure des techniques industrielles et des mines d'Albi-Carmaux, France
Dr. eng. Elena Ficara, Technical University of Milan, Italy
Dr. eng. Paola Verlicchi, University of Ferrara, Italy
University of Trento
Trento, Italy
2013

to my family


Contents
Contents

Contents
ii
Contents
Contents ....................................................................................................................................................................................... ii Outline of the thesis .................................................................................................................................................................... v I.Chapter General introduction: Sustainable biological nitrogen removal processes from ammonium rich wastewater .............................. 3 1.Introduction ............................................................................................................................................................................... 4 2.Sustainable metabolic pathways for nitrogen removal from ammonium-rich wastewater ........................................................ 8 2.1Nitrification - Ammonia and nitrite oxidation by bacteria ....................................................................................................... 8 2.1.1Stoichiometry of nitrification ................................................................................................................................................ 8 2.1.2Mechanisms of nitrification .................................................................................................................................................. 9 2.1.3Phylogeny ........................................................................................................................................................................... 11 2.1.4Bioinformatics .................................................................................................................................................................... 14 2.1.5Kinetics ............................................................................................................................................................................... 14 2.1.6Factors involved in nitrification kinetics ............................................................................................................................ 15 2.2Ammonium oxidation by archaea .......................................................................................................................................... 24 2.3.Denitrification ....................................................................................................................................................................... 26 2.3.1Stoichiometry of denitrification .......................................................................................................................................... 26 2.3.2Mechanisms of denitrification ............................................................................................................................................ 27 2.3.3Phylogeny ........................................................................................................................................................................... 28 2.3.4Bioinformatics .................................................................................................................................................................... 29 2.3.5Kinetics ............................................................................................................................................................................... 29 2.3.6Factors involved in denitrification kinetics ......................................................................................................................... 30 2.4.Heterotrophic nitrification and Nitrifiers denitrification ....................................................................................................... 32 2.5.Anammox - Anaerobic Oxidation of Ammonium ................................................................................................................ 33 2.5.1Stoichiometry of Anammox ................................................................................................................................................ 33 2.5.2Mechanisms of anaerobic ammonia oxidation .................................................................................................................... 34 2.5.3Phylogeny ........................................................................................................................................................................... 36 2.5.4Bioinformatics .................................................................................................................................................................... 37 2.5.5Kinetics ............................................................................................................................................................................... 38 2.5.6Factors involved in nitrification kinetics ............................................................................................................................ 38 2.6.DNRA ................................................................................................................................................................................... 44 2.7.N-damo ................................................................................................................................................................................. 46 3.Advantages and issues in the co-existence of microorganisms for wastewater treatment ....................................................... 47 3.1Anammox– and Aerobic Ammonia Oxidizing- Bacteria ....................................................................................................... 47 3.2Anammox bacteria and Aerobic Ammonia Oxidizing Archaea............................................................................................ 49 3.3Anammox– and Denitrifying- Bacteria.................................................................................................................................. 49 3.Anammox bacteria – DNRA .................................................................................................................................................... 50 3.5Anammox- and n-damo- bacteria .......................................................................................................................................... 50 3.Anammo- and–filamentous bacteria ........................................................................................................................................ 51 3.7Aerobic Ammonia Oxidizing-, Anammox- and Denitrifying Bacteria ................................................................................. 51 4.Biological process modeling .................................................................................................................................................... 52 4.1Over the ASMx Models ......................................................................................................................................................... 53 5.Conclusion ............................................................................................................................................................................... 58 Supplementary Figures ............................................................................................................................................................... 60 II.Chapter Co-existence of nitrifying, anammox and denitrifying bacteria in a sequencing batch reactor .................................................. 63 1.Introduction ............................................................................................................................................................................. 64 2.Materials and Methods ............................................................................................................................................................ 67 2.1.Sample collection.................................................................................................................................................................. 67 2.2.Genomic DNA extraction and purification ........................................................................................................................... 68 2.3.PCR amplification ................................................................................................................................................................ 68 2.4.Cloning and sequencing ........................................................................................................................................................ 70 2.5.Nucleotide sequence accession numbers .............................................................................................................................. 71 2.6.Phylogenetic analysis ............................................................................................................................................................ 71 2.7.Fluorescence in situ hybridization (FISH) ............................................................................................................................ 71 2.8.Potential activity analyses ..................................................................................................................................................... 72 2.9.Analytical methods ............................................................................................................................................................... 73 3.Results ..................................................................................................................................................................................... 73 3.1PCR and phylogenetic analysis .............................................................................................................................................. 73 3.2Fluorescence in situ hybridization (FISH) ............................................................................................................................. 78

Contents
iii
3.3AerAOB and anammox activity assays ................................................................................................................................. 79 4.Discussion ................................................................................................................................................................................ 80 4.1Microbial community of the SNAD biomass ........................................................................................................................ 80 4.2Microbial spatial distribution in the SNAD biomass ............................................................................................................. 82 4.3Activity analyses .................................................................................................................................................................... 83 5.Conclusions ............................................................................................................................................................................. 84 Supplementary Figures ............................................................................................................................................................... 86 Supplementary data: nucleotide and amino acid sequences. ....................................................................................................... 89 III.Chapter Old landfill leachate characterization using respirometric and physical-chemical methods ....................................................... 99 1.Introduction ........................................................................................................................................................................... 100 2.Materials and Methods .......................................................................................................................................................... 102 2.1.Landfill leachate collection ................................................................................................................................................. 102 2.2.Analytical methods ............................................................................................................................................................. 102 2.3.Determination of CODsoluble and TAN ............................................................................................................................ 103 2.4.Determination of biodegradable COD fractions ................................................................................................................. 103 2.4.1.Respirometers .................................................................................................................................................................. 103 2.4.2.Readily biodegradable COD (RBCOD) ........................................................................................................................... 104 2.4.3.Total biodegradable COD (CODbio) ............................................................................................................................... 104 2.4.4.Chemical OUR................................................................................................................................................................. 105 3.Results and Discussion .......................................................................................................................................................... 106 3.1Conventional leachate characterization ............................................................................................................................... 106 3.2Truly CODsoluble and TAN ................................................................................................................................................ 108 3.3Biodegradable COD fractions using the activated sludge of the WWTP............................................................................. 109 3.4Biodegradable COD fractions using the SNAD biomass ..................................................................................................... 110 3.5Landfill leachate COD characterization ............................................................................................................................... 111 3.6Landfill leachate C/N ratio .................................................................................................................................................. 112 4.Conclusions ........................................................................................................................................................................... 112 IV.Chapter Application of the Simultaneous, partial Nitritation, Anammox and Denitrification (SNAD) process to Municipal Solid Waste landfill leachate .............................................................................................................................................................. 115 1.Introduction ........................................................................................................................................................................... 116 1.1.Old Landfill Leachate Pollution and treatments ................................................................................................................. 116 1.2.General overview: Innovative biological treatments for old landfill leachate .................................................................... 118 2.Materials and Methods .......................................................................................................................................................... 122 2.1.Feeding media and old landfill leachate ............................................................................................................................. 122 2.2.Seed sludge ......................................................................................................................................................................... 122 2.3.Batch tests ........................................................................................................................................................................... 123 2.4.Experimental procedure ...................................................................................................................................................... 125 2.5.Analytical methods ............................................................................................................................................................. 126 2.6.Calculations ........................................................................................................................................................................ 127 3.Results ................................................................................................................................................................................... 128 3.1Period I – feasibility of SNAD process ................................................................................................................................ 128 3.2Period II–feasibility of SNAD process for treating old leachate and SBR phases optimization .......................................... 130 3.3Period III –Effect of high total ammonia nitrogen on SNAD performance ......................................................................... 132 4.Discussion .............................................................................................................................................................................. 133 4.1Feasibility of SNAD process ............................................................................................................................................... 133 4.2SNAD process for treating old landfill leachate .................................................................................................................. 134 4.3SBR configuration for SNAD process ................................................................................................................................. 135 5.Conclusions ........................................................................................................................................................................... 136 Supplementary Table ................................................................................................................................................................ 138 V.Chapter Simultaneous partial Nitritation, Anammox and Denitrification (SNAD) process at moderate temperature treating anaerobic digester effluent ........................................................................................................................................................ 141 1.Introduction ........................................................................................................................................................................... 142 2.Materials and Methods .......................................................................................................................................................... 146 2.1.Feeding media and supernatant from anaerobic digester .................................................................................................... 146 2.2.Seed sludge ......................................................................................................................................................................... 146 2.3.Experimental lab scale reactor ............................................................................................................................................ 147 2.4.Monitoring and control system ........................................................................................................................................... 149 2.5.Pilot-plant operation experimental set-up and operation .................................................................................................... 150 2.6.Potential specific activity assays ......................................................................................................................................... 151 2.6.1.Aerobic activity assays .................................................................................................................................................... 151

Contents
iv
2.6.2.Anaerobic activity assays ................................................................................................................................................. 152 2.7.Molecular techniques .......................................................................................................................................................... 153 2.7.1Sampling and genomic DNA extraction ........................................................................................................................... 153 2.7.2SYBR Green Real-Time PCR ........................................................................................................................................... 153 2.7.3Real-Time PCR data analysis ........................................................................................................................................... 154 2.8.Analytical methods ............................................................................................................................................................. 154 2.9.Calculations ........................................................................................................................................................................ 155 3.Results and discussion ........................................................................................................................................................... 156 3.1Period I: temperature effect on the reactor performance ...................................................................................................... 156 3.2Period I: C/N effect on the reactor performance .................................................................................................................. 159 3.3Period I: DO shocking effect on the reactor performance .................................................................................................. 159 3.4Period I: microbial activities ................................................................................................................................................ 159 3.5Period II: acclimatizing to the digester effluent at moderate temperature ........................................................................... 160 3.6Period II: Load shocking effect on the reactor performance ............................................................................................... 163 3.7Evolution of the nitrogen over a 6h SBR cycle.................................................................................................................... 163 3.8Stoichiometry model based evaluation of the SNAD system .............................................................................................. 167 3.9Microbial analysis ................................................................................................................................................................ 170 3.8.1.Specificity of PCR primer ................................................................................................................................................ 170 3.8.2.Anammox bacteria detection and distribution in the SNAD biomass .............................................................................. 170 3.10Influence of FA and FNA .................................................................................................................................................. 171 4.Wastewater implications ........................................................................................................................................................ 174 5.Conclusions ........................................................................................................................................................................... 175 Supplementary Table ................................................................................................................................................................ 177 Supplementary Figures ............................................................................................................................................................. 179 VIChapter Real time control strategy for Simultaneous partial Nitritation, anammox and Denitrification (SNAD) process in SBR ........ 181 1.Introduction ........................................................................................................................................................................... 182 1.1Meaning of indirect parameters ........................................................................................................................................... 185 1.2pH, DO,ORP and EC variations in a conventional nitrification- denitrification SBR ......................................................... 185 2.Materials and Methods .......................................................................................................................................................... 188 2.1Reactor set up ...................................................................................................................................................................... 188 2.2SBR operation ...................................................................................................................................................................... 189 2.3Monitoring and control system. ........................................................................................................................................... 190 2.4Control strategies ................................................................................................................................................................. 191 2.4.1.Fixed time control. ........................................................................................................................................................... 191 2.4.2.Real-time control. ............................................................................................................................................................ 192 2.5Analytical methods .............................................................................................................................................................. 193 3.Results and discussion ........................................................................................................................................................... 194 3.1Reactor performance (fixed time control) ............................................................................................................................ 194 3.2Variation of CE, pH, DO and ORP over a SNAD-SBR cycle (fixed time control) ............................................................. 197 3.2.1pH correlation ................................................................................................................................................................... 197 3.2.2ORP correlation ................................................................................................................................................................ 198 3.2.CE correlation ..................................................................................................................................................................... 200 3.2.4DO and OUR correlation .................................................................................................................................................. 200 3.3Reactor operation during the fixed time control strategy ..................................................................................................... 202 3.4Reactor operation and cycle optimization (real-time control) .............................................................................................. 206 4.Conclusion ............................................................................................................................................................................. 207 Supplementary Table ................................................................................................................................................................ 209 Summary and outlook ............................................................................................................................................................ 211 List of Figures & Tables ......................................................................................................................................................... 217 References ............................................................................................................................................................................... 223 Acknoledgements – Ringraziamenti ...................................................................................................................................... 243 Curriculum vitae ..................................................................................................................................................................... 248 Publications & relevant work ................................................................................................................................................ 250

Outline of thesis
v
Outline of the thesis
Outline of thesis
vi
Outline of the thesis
Nowadays, in a rapidly growing world, there is an increasing need for innovative solutions to deal with water
challenges. Water problems are increasingly globalised and it is important to focus policy, planning and
scientific investigation on water reducing, water treatment, water recycling and reuse.
Processes and technologies have to be implemented to reduce the environmental concentrations of pollutants
released into the environment and to reduce the energetic requirements and the generation of secondary products.
A sustainable water policy through facilitating innovation has been placed central in the Europe 2020 strategy.
The present work focus on nitrogen removal from high strength ammonium wastewaters. Biological nitrogen
removal from strong nitrogenous wastewaters received a great deal of attention during the last years, due to the
stricter limits set by the EU Standards for nutrient content in wastewater effluents. Currently, there is a wide
range of European legislation covering many different aspects of water management. Among them, the Directive
91/271/EEC of the European Union, as amended by the Directive 98/15/EC, concerns the collection, treatment
and discharge of urban wastewater and the treatment and discharge of wastewater from certain industrial sectors.
Its aim is to protect the environment from any adverse effects due to discharge of such waters and evidences the
concern of Europeans for sensitive areas which are subject to eutrophication. The Directive 91/676/EEC
(Nitrates Directive) concerns the protection of waters against pollution caused by nitrates from agricultural
sources. The Water Framework Directive (Directive 2000/60/EC) establishs a framework for the protection of
inland surface waters (including rivers and lakes), transitional waters (estuaries), coastal waters and
groundwater.
Some high strength ammonium wastewaters, such as anaerobic digester effluents and old landfill leachates,
are further characterized by low biodedradable organic content (CODbio). Those wastewaters are usually treated
in – situ by conventional biological processes (nitrification – denitrification) or collected and recirculated to the
conventional activated sludge (CAS) tanks in the wastewater treatment plants (WWTP), inducing operational and
economic problems, as they cause nitrogen overloads and inhibition effects. The amount of CODbio contained in
these effluents is usually not enough to carry out the removal of nitrogen by the nitrification-denitrification
process and an external carbon source must be added. Apart the high costs related to the external carbon source
furniture, it must be taken into account the high energy consumption related to the oxygen supply for the
oxidation of the ammonium (nitrification).
The aim of the research presented in this thesis is to characterize high strength ammonium wastewaters and to
develop a more energetically efficient technology for nitrogen removal. Since the discovery of anammox
bacteria, the traditional theory of biological nitrogen removal has been extended to new nitrogen metabolic
pathways. The present work is focused on investigating the feasibility and sustainability of the Simultaneous
partial nitritation, Anammox and Denitrification (SNAD) process in “1 reactor system” for treating anaerobic
digested effluents and old landfill leachates.
SNAD process is a complex biological process where different populations with opposed environmental
requirements coexist. Thus, the microbial community composition in the reactor has been investigated by
analysis of Polymerase Chain Reaction (PCR) combined with sequential DNA sequencing and phylogenetic tree
and fluorescence in situ hybridization (FISH). Special attention has been paid to wastewaters characterization,
reactor configuration design, operative conditions and control process strategies in order to optimize the nitrogen

Outline of thesis
vii
and carbon removal efficiencies. The main factors that influence the performance of the SNAD process have
been studied, and a real time strategy, based on indirect on-line parameters, has been implemented.
This thesis addresses the microbiology, strategies and wastewater implications in the co-existence of
nitritation, anammox and denitrification processes.
The research described in this thesis was conducted at the Department of Civil and Environmental
Engineering of the University of Trento, Italy, and a three month – period, from 30 June 2011 to 30 September
2011, was spent at the Department of Microbiology of the Radbound University Nijmegen, Netherland. The
experiments at the University of Trento focused on the develop of a sustainable nitrogen removal system to treat
ammonium rich wastewaters using Simultaneous partial nitritation, Anammox and denitrification (SNAD)
process in a “1 reactor system”. A Sequencing Batch Reactor (SBR) has been equipped. A collaboration with the
“Servizio Elettronico & Progettazione” of Physic Department of the University of Trento allowed to implement
an acquisition control software and hardware, useful to manage the SNAD process in the SBR. The research at
the Radbound University Nijmegen focused on the characterization of bacteria involved in SNAD process using
microbiology techniques and microbial activity tests in order to perform phylogenetic analyses and to detect the
potential microbial activity of each microorganism. A new PCR primer set to detect anammox bacteria was
developed working together with the Servizio Opere Igienico-Sanitarie, Provincia Autonoma di Trento, Italy.
Finally, due to reciprocal interests on modeling, plans for a future collaboration associated with the University of
Naples, Italy, have been initiated, in order to define a mathematical model based on the ASMs and calibrate and
validate the model using experimental data obtained by SNAD process developed in the “1-reactor system” in
Trento (Italy).

Outline of thesis
viii
The first chapter of this thesis starts with the description of the origin and effects of nitrogen pollution.
Further it gives a general overview of nitrogen removal process from wastewater looking at new nitrogen
metabolic pathways which have extended the microbial nitrogen cycle. The current knowledge on the
stoichiometry, phylogeny, bioinformatics, kinetics and factors involved in kinetics of the nitrogen removal
biological processes are reviewed. The advantages of the microbial co-existence are discussed and finally an
overview of mathematical models based on ASMn family is given.
Chapter two describes the microorganisms community composition of the SNAD sludge sampled at the
Wastewater Treatment Plant (WWTP) of Zürich, Switzerland, and used as inoculums to start a lab scale reactor.
The community structure and phylogeny of the whole biomass was analyzed using the PCR technique combined
with sequential DNA sequencing and phylogenetic tree construction. FISH analysis were performed in order to
determinate the microbial spatial distribution.
The third chapter opens with a brief overview of landfill leachate composition. This is followed by a
leachate characterization through chemical and respirometric analysis.
The fourth chapter deals landfill leachate treatments, focusing on biological process to treat old landfill
leachates. Batch tests, performed simulating a cycle of a Sequential Bacth Reactor (SBR) at T=30°C, confirmed
the sustainability of the SNAD process for the old landfill leachate treatment.
The chapter fifth shows the construction, start-up and continuous operation of an SBR reactor in view of
performing the SNAD process for treating anaerobic digested effluents at moderate temperature. In this chapter,
first the effect of temperature on the SNAD process are investigated, treating a synthetic wasteawater in a
suspended/growth – granular SBR both at 30°C and 25°C. Then, the applicability to the anaerobic digester
effluents is confirmed. Special emphasis was placed on the reactor configuration and operative conditions.
In the chapter sixth a correlation between the on-line ORP, pH, conductivity and DO profiles with the
biological nitrogen and carbon removal was studied. Then, a real time control strategy, mainly based on the
conductivity and ORP signals, was designed and successfully applied.
Finally the main results of the aforementioned chapters are summarized and discussed in the summary and
outlook section.

Outline of thesis
ix


Chapter I
3
I. Chapter
General introduction: Sustainable
biological nitrogen removal processes
from ammonium rich wastewater

Chapter 1
4
General introduction: Sustainable biological nitrogen removal processes from ammonium rich wastewater
Michela Langonea, Gianni Andreottolaa
a Department of Civil, Environmental and Mechanical Engineering, University of Trento, Via Mesiano 77, Trento 38123, Italy
ABSTRACT
Biological nitrogen removal from strong nitrogenous wastewaters received a great deal of attention during the last years. Nitrogen removal performed by biological treatments is economically preferred over nitrogen recovery techniques for wastewaters containing less than 5 g N L−1. Therefore, due to their simplicity and high cost-effectiveness, biological treatments are widely applied for nitrogen and carbon removal. Conventional biological treatments are carried out by means of the combination of autotrophic nitrification and heterotrophic denitrification. Conventional biological processes are generally performed to treat wastewaters with low nitrogen concentrations, as could be municipal wastewaters. Nevertheless, the high oxygen demand and the addition of external carbon source do not allow the application of the conventional biological processes for treating wastewaters with a high ammonium load and a low biodegradable organic matter content, such as anaerobic digester effluents and old landfill leachates. Since the discovery of anammox bacteria, the traditional theory of the biological nitrogen removal has been extended. Further, new nitrogen metabolic pathways have been discovered expanding the nitrogen cycle, such as the nitrite-dependent methane oxidation (n-damo), aerobic ammonia oxidation by archaea, dissimilatory nitrate reduction to ammonia. In particular, after the discovery of anammox reaction, several nitrogen removal processes have been developed in the wastewater treatments field, among them ANaerobic AMMonium OXidation (anammox); Nitritation and Partial Nitritation, such as Single reactor High activity Ammonia Removal Over Nitrite (SHARON), denitrification via nitrite, and innovative combinations of those processes. Several strategies have been adopted by using 2 separate reactors in series (2-reactor system), such as the shortcut nitritation and denitrification as well as SHARON/anammox, and accomplishing two or more processes in the same reactor (1-reactor system): Simultaneous Nitrification and Denitrification via nitrite (SND via nitrite), Completely Autotrophic Nitrogen removal Over Nitrite process (CANON), Oxygen-Limited Autotrophic Nitrification-Denitrification (OLAND), Single-stage Nitrogen removal using anammox and partial Nitritation (SNAP) and Simultaneous partial Nitrification, Anammox and Denitrification (SNAD) process. A description of the current knowledge of the innovative biological nitrogen removal processes from ammonium rich wastewaters is presented. Special importance is given to the influence of the wastewaters composition, to the environmental factors, to the reactor configurations on the nitrogen removal efficiency, to the microbial community and the co-existence of different biological processes. The present status, regarding practical applications of these processes, modeling and future developments, is provided looking at the sustainability of nitrogen removal technologies.
Keywords: aerobic ammonia oxidizing-bacteria, aerobic nitrite oxidizing-bacteria, anammox, archaea, autotrophic nitrogen removal, denitrifiers, CANON, co-existence, n-damo, nitrogen cycle; SNAD, wastewater treatment
1. Introduction
The most potentially hazardous pollutant of wastewaters is nitrogen, especially ammonium - nitrogen (NH4+-N)
which has been identified as the main long-term pollutant as well as the main cause of acute and chronic toxicity
in aquatic environments (Camargo and Alonso 2006; Kurniawan et al. 2006b). Nitrogen is an important element
for life and is one of the essential nutrients for plants growth. Wastewater discharges containing nitrogen can
lead to, amongst others, the oxygen depletion and the eutrophication in receiving waters. Nitrogen is a versatile
element, existing in both inorganic and organic forms as well as in many different oxidation states from -3 (NH4+
or NH3) to + 5 (NO3-) and chemical forms. The exchange of nitrogen between the atmosphere, biosphere,
hydrosphere and geosphere in different forms is known as the “nitrogen cycle” and it is mostly governed by
microbial activities (Francis et al. 2007). In particular, the nitrogen cycle is mainly driven by prokaryotic
Chapter 1
5
organisms (both Eubacteria and Archaebacteria) that use nitrogen compounds for assimilatory, dissimilatory, or
respiratory purpose. Until the last decade of the nineteenth century it was assumed that the microbial nitrogen
cycle was essentially complete (Jetten 2008). Free-living or symbiotic N2 gas-fixing bacteria, such as Rhizobium,
reduced dinitrogen gas (N2) to ammonium for assimilation (Beijerinck 1888; Fred et al. 1932). Biological
nitrogen fixation is an important process, as it provides ammonia (NH3) for plants and animals. Soil and aquatic
microbes were responsible of the assimilation (uptake or immobilization) of inorganic nitrogen (in form of NH3)
(Yevdokimov and Blagodatsky 1993) and the production of ammonium (NH4+) from organic N compounds
(ammonification /mineralization) (Stanford and Smith 1972). In soil, freshwater, and marine environments, two
physiologically and phylogenetically distinct groups of chemolithotrophic nitrifying bacteria oxidized ammonia,
via nitrite, to nitrate (Winogradsky 1890). Prokaryotes chemoorganotrophic microorganisms closed the cycle by
returning the oxidized form of nitrogen back to N2, a highly stable gas, in a four step denitrification process
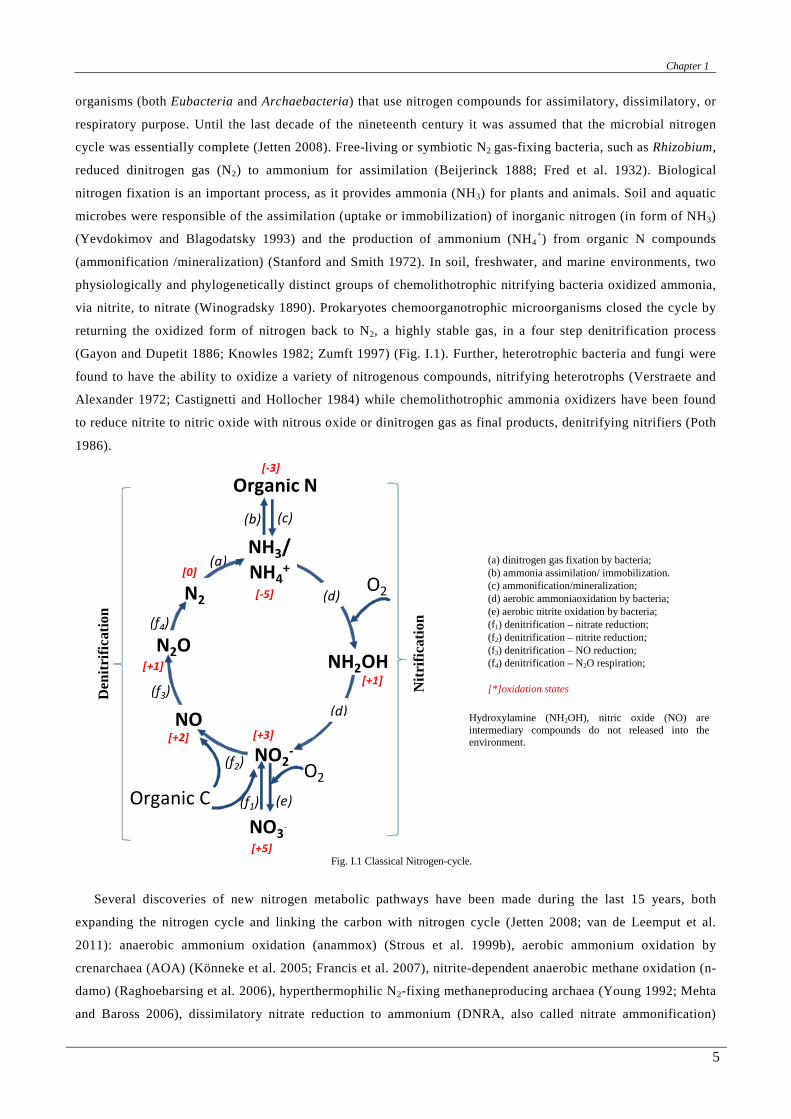
(Gayon and Dupetit 1886; Knowles 1982; Zumft 1997) (Fig. I.1). Further, heterotrophic bacteria and fungi were
found to have the ability to oxidize a variety of nitrogenous compounds, nitrifying heterotrophs (Verstraete and
Alexander 1972; Castignetti and Hollocher 1984) while chemolithotrophic ammonia oxidizers have been found
to reduce nitrite to nitric oxide with nitrous oxide or dinitrogen gas as final products, denitrifying nitrifiers (Poth
1986).
(e)
[0]
[+1]
[+2]
[+1]
(f1)
(f3)
(f4)
(f2)
(c)(b)
(a)O2N2
NH2OH
NO2-
NO3-
NO
N2O
O2Organic C
Organic N
(d)
(d)[+3]
[+5]
[-3]
NH3/NH4
+
[-5]
(a) dinitrogen gas fixation by bacteria; (b) ammonia assimilation/ immobilization. (c) ammonification/mineralization; (d) aerobic ammoniaoxidation by bacteria; (e) aerobic nitrite oxidation by bacteria; (f1) denitrification – nitrate reduction; (f2) denitrification – nitrite reduction; (f3) denitrification – NO reduction; (f4) denitrification – N2O respiration; [*]oxidation states
Hydroxylamine (NH2OH), nitric oxide (NO) are intermediary compounds do not released into the environment.
Fig. I.1 Classical Nitrogen-cycle.
Several discoveries of new nitrogen metabolic pathways have been made during the last 15 years, both
expanding the nitrogen cycle and linking the carbon with nitrogen cycle (Jetten 2008; van de Leemput et al.
2011): anaerobic ammonium oxidation (anammox) (Strous et al. 1999b), aerobic ammonium oxidation by
crenarchaea (AOA) (Könneke et al. 2005; Francis et al. 2007), nitrite-dependent anaerobic methane oxidation (n-
damo) (Raghoebarsing et al. 2006), hyperthermophilic N2-fixing methaneproducing archaea (Young 1992; Mehta
and Baross 2006), dissimilatory nitrate reduction to ammonium (DNRA, also called nitrate ammonification)
Nitr
ifica
tion
Den
itrifi
catio
n

Chapter 1
6
(Woods 1938; Stanford et al. 1975), nitrate reduction to dinitrogen gas by unicellular eukaryotes foraminifera
(Risgaard-Petersen et al. 2006), nitrite-oxidizing phototrophs (Griffin et al. 2007; Schott et al. 2010) (Fig. I.2).
The overall biological reactions involved in the nitrogen and carbon cycles create a network of pathways. Fig.
I.3, as adapted from Ettwig (2010), shows the nitrogen cycle coupled with carbon cycle.
(h)
(g)
(g)
NO3-
(i)
(h,i)
(e)(f1)
(f3)
(f4)
(f2)
(c)(b)
(a)O2N2
NH2OH
NO2-
NO
N2O
O2Organic C
Organic N
(d)
(d)
NH3/NH4
+
N2H4
(h)
(h)
(i)
(h)
(h) (g)
(g)
NO3-
(i)
(h,i)
(e)(f1)
(f3)
(f4)
(f2)
(c)(b)
(a)O2N2
NH2OH
NO2-
NO
N2O
O2
Organic N
(d)
(d)
NH3/NH4
+
N2H4
O2
CH4
Organic C
O2
(i)
(m)
CO2
(l)
(n)
(h)
Fig. I.2 Overall Nitrogen cycle Fig. I.3 Nitrogen cycle coupled with Carbon cycle
(a) dinitrogen gas fixation by bacteria; (b) ammonia assimilation/ immobilization. (c) ammonification/mineralization; (d) aerobic ammoniaoxidation by bacteria; (e) aerobic nitrite oxidation by bacteria; (f1) denitrification – nitrate reduction; (f2) denitrification – nitrite reduction; (f3) denitrification – NO reduction; (f4) denitrification – N2O respiration; (g) dissimilatory nitrate and nitrite reduction to ammonium (DNRA)*; (h) anaerobic ammonium oxidation *; (i) nitrite-dependent anaerobic methane oxidation by bacteria (proposed pathway) *.
(a) dinitrogen gas fixation by bacteria; (b) ammonia assimilation/ immobilization. (c) ammonification/mineralization; (d) aerobic ammoniaoxidation by bacteria; (e) aerobic nitrite oxidation by bacteria; (f1) denitrification – nitrate reduction; (f2) denitrification – nitrite reduction; (f3) denitrification – NO reduction; (f4) denitrification – N2O respiration; (g) dissimilatory nitrate and nitrite reduction to ammonium (DNRA)* (h) anaerobic ammonium oxidation*; (i) nitrite-dependent anaerobic methane oxidation by bacteria (proposed pathway) *. (l) carbon oxidation (m) carbon fixation (n) methanogenesis.
Hydrazine (N2H4), hydroxylamine (NH2OH), nitric oxide(NO) are intermediary compounds do not release into the environment. * New pathway
The discovering biological pathways have opened up new possibilities in wastewater treatment plants
(WWTP). Consequently, several nitrogen removal processes have been developed. These processes include the
ANaerobic AMMonium OXidation (anammox) (Van Der Star et al. 2007); the nitritation and partial nitritation,
achieved using either high temperature, i.e. Single reactor High activity Ammonia Removal Over Nitrite
(SHARON) process (Mulder et al. 2001; van Hulle et al. 2007) or other suitable strategies (i.e oxygen limited
conditions, high free ammonia levels); denitrification via nitrite (Glass and Silverstein 1998; Adav et al. 2010);
Simultaneous Nitrification and Denitrification (SND) via nitrate and via nitrite (Münch et al. 1996; Yoo et al.
1999; Ruiz et al. 2006; Wu et al. 2007; Blackburne et al. 2008a). In particular, the anammox process has to be

Chapter 1
7
preceded by a (partial) nitritation process. Most researches on autotrophic biological treatments for nitrogen
removal has been directed towards understanding the integration of partial nitritation and anammox processes
using both 2 separate reactors in series (2-reactor systems) such as SHARON/anammox (Van Dongen et al.
2001a) and accomplishing two or more processes in the same reactor (1-reactor systems): Completely
Autotrophic Nitrogen removal Over Nitrite process (CANON) (Dijkman and Strous 1999; Sliekers et al. 2002),
Oxygen-Limited Autotrophic Nitrification-Denitrification (OLAND) (Kuai and Verstraete 1998), Single-stage
Nitrogen removal using anammox and partial Nitritation processes (SNAP) (Lieu et al. 2005; Furukawa et al.
2006).
Other researchers have studied the anammox process looking at the interactions between nitrogen and carbon
cycle (Ahn et al., 2004, Kumar and Lin, 2010). Actually, this represents a common problem in the anammox
system because most of the wastewaters contain carbon compounds as well as nitrogen. The combined system
for nitrogen and carbon removal based on the partial nitritation, anammox and denitrification processes in 1-
reactor systems is known as the Simultaneous partial Nitrification, Anammox and Denitrification (SNAD)
process (Chen et al. 2009; Wang et al. 2010; Lan et al. 2011; Daverey et al. 2012; Winkler et al. 2012b; Langone
et al. 2013b). The SNAD process, under oxygen limitation, in one single reactor, has various advantages
compared to the 2-stage systems and to the conventional biological treatments, such as lower capital costs, no
need for external carbon additions, negligible sludge productions and lower energy and oxygen requirements.
The SNAD process comprises three main processes: one micro-aerobic, partial nitritation process (Eq. I-1),
where about 50% of ammonia is oxidized to nitrite; one anoxic, anammox process (Eq. I-2), where ammonia and
nitrite are converted to nitrogen gas producing a small amount of nitrate; and an anoxic one, denitrification
process (Eq. I-3 - Eq. I-4), where organic carbon as electron donor could deoxidize nitrate and nitrite to
dinitrogen gas.
b4 2 3 2 4 2 20,75 0,5 0,5 1,5
AOBautotrophic acteriaNH O HCO NO NH H O CO+ − − ++ + → + + + Eq. I-1
b4 2 3 2 3 2 2 0.5 0.151.32 0.066 0.13 1.02 0.26 2.03 0.066
anammoxautotrophic acteriaNH NO HCO H N NO H O CH O N+ − − + −+ + + → + + +
Eq. I-2
b
3 2 2 3 25 2heterotrophic
acteriaC NO H O CO HCO N− −+ 4 + → + 4 + 2 Eq. I-3
b
2 2 2 3 25.5 3.5heterotrophic
acteriaC NO H O CO HCO N− −+ 6 +1 → + 2 + 3 Eq. I-4
The SNAD process has a high potential for the complete conversion of ammonium and organic carbon to
dinitrogen gas and carbon dioxide from ammonium rich wastewaters characterized by a low biodegradability and
a low biodegradable carbon (CODbio) – nitrogen (N) ratio, such as urban anaerobic digester effluents (Joss et al.
2009), swine digester liquor (Zhang et al. 2012) and old landfill leachates (Xu et al. 2010). Recently, it was also
applied to treat some industrial wastewaters, such as opto-electronic wastewaters (Daverey et al. 2012). The
main advantage of the SNAD process is the complete nitrogen and carbon removal, requiring a low energy
demand. From an overview of literature, more studies are necessary to investigate how to improve the
performance, the cost-effectiveness, the nitrous oxide emissions and the robust control of reactors. A key factor
for the development of the SNAD process is a better understanding of both the biological processes involved in
the nitrogen removal and the numerous microbial interactions using microbiological and modeling tools. In this
contribution a general overview of nitrogen removal processes is presented looking at the nitrogen metabolic
pathways which have extended the microbial nitrogen cycle, with a main focus on the partial nitritation,

Chapter 1
8
anammox and denitrification processes and the co-existence of them in one single reactor. The reactor
configurations applied up to date for nitrogen removal from ammonium rich wastewater are also presented.
2. Sustainable metabolic pathways for nitrogen removal from ammonium-rich wastewater
For each biological process involved in N removal, the stoichiometry, microbial and kinetic aspects are
reviewed: the well known ‘aerobic’ ammonia and nitrite oxidizers bacteria, anaerobic ammonia oxidizers
bacteria and denitrifiers. Also other nitrogen biological pathways are briefly analyzed, such as the aerobic
ammonia oxidation by archaea, heterotrophic nitrification, nitrifiers denitrification, dissimilatory nitrate
reduction to ammonium (DNRA) and nitrite-dependent anaerobic methane oxidation (n-damo).
2.1. Nitrification - Ammonia and nitrite oxidation by bacteria
Nitrification, the biological oxidation of ammonia to nitrate via nitrite by bacteria, occupies an essential
position within the nitrogen cycle and has various direct and indirect implications for natural and man-made
systems (Fiencke et al. 2005). Nitrification has traditionally been considered as a single process in wastewater
treatment plants whereby ammonia/ammonium is oxidized to nitrate by specific chemical autotrophic
microorganisms under strict aerobic conditions. Some nitrifying bacteria are known to have limited heterotrophic
capability, as the consumption and the assimilation of simple organic compounds (Verstraete and Alexander
1972; Arp and Bottomley 2006). From a biological point of view, nitrification is composed of two steps: the
oxidation of ammonia/ammonium (oxidation state -3/-5) to nitrite (oxidation state +3) by Ammonia-Oxidizing
Bacteria (AOBs) and the oxidation of nitrite to nitrate (oxidation state +5) by Nitrite-Oxidizing Bacteria (NOBs).
The first step is termed nitritation while the second step is called nitratation. After the anammox process
discovery, the term “partial nitritation” was introduced. The term “partial nitritation” stands for the partial
oxidation of ammonia to nitrite, with a residual fraction of ammonium not converted into nitrite. A stable partial
nitritation is an essential step for the following anammox step (Fux et al., 2002). Nitritation (ammonia oxidation
to nitrite) provides significant costs savings compared to the complete nitrification (ammonia oxidation to
nitrate) because the stoichiometry indicates that it demands less oxygen and produces less sludge resulting in
energy and volume requirement savings. Nitritation process can be coupled with anammox or denitrification “via
nitrite” in order to achieve a more sustainable nitrogen removal solution than the conventional nitrification and
denitrification “via nitrate”.
2.1.1 Stoichiometry of nitrification
In the nitrification process, oxygen acts as the terminal electron acceptor both for ammonia- and for nitrite-
oxidizing bacteria: electrons are removed from ammonia and nitrite and finally transferred to oxygen. Nitrifiers
bacteria use mainly ammonia and nitrite as an energy source (catabolism) and only a negligible fraction is used
for biosynthesis of new molecules, cell maintenance, and growth (anabolism), while carbon dioxide is used as a
carbon source.
In the literature it is generally accepted that although ammonia (NH3), and not ammonium (NH4+), is the
actual substrate, the oxidation reaction of nitritation can be written using ammonium. Simplified oxidation

Chapter 1
9
reactions for nitritation and nitratation are shown in Eq. I-5 and Eq. I-6, respectively, while the overall oxidation
reaction for nitrification is shown in Eq. I-7.
4 2 2 21.5 2AOBsNH O NO H H O+ − ++ + +→ 1' 275 G kJ mol−∆ ° = − Eq. I-5
2 2 30.5 NOBsNO O NO− −+ → 1' 74 G kJ mol−∆ ° = − Eq. I-6
4 2 3 22 2NH O NO H H O+ − ++ + +→ 1' 360 G kJ mol−∆ ° ≅ − Eq. I-7
The energy yields from ammonium and nitrite oxidation are modest, leading to small biomass yields and low
maximum specific growth rates. As the energy generating reaction for the aerobic oxidation of ammonia is
higher than the energy for the aerobic oxidation of nitrite, it is reasonable that AOBs grow faster than NOBs.
Bock (1978) confirmed a minimum doubling times of 7–8 hours for AOBs and 10–13 hours for NOBs. The
combined synthetis-oxidation reactions for nitritation and nitratation are reported in Eq. I-8 and Eq. I-9.
4 2 3 2 5 7 2 2 2 355 10976 54 57 104AOBsNH O HCO NO C H H O H COO N+ − −+ ++ → + + Eq. I-8
2 4 2 3 2 3 3 5 7 2 2400 4 195 400 3NOBsNO NH H CO O HCO NO C H H OO N− + − −+ + + + → + + Eq. I-9
Using the Eq. I-8 and Eq. I-9, the overall synthesis and oxidation reaction in the complete nitrification can be
represented as follows (Eq. I-10):
4 2 3 3 5 7 2 2 2 31.981.83 0.98 0.021 1.041 1.88AOBsNH O HCO NO C H H O H COO N+ − −+ ++ → + + Eq. I-10
C5H7O2N is the empirical cell formula usually utilized for nitrifying bacteria (Brown&Caldwell 1975).
Nitritation is an acidifying process. Approximately 2 mol of bicarbonate (HCO-3) are consumed for every mole
of ammonium oxidized producing carbon acid (H2CO3), resulting in 7.07 mg of alkalinity as CaCO3 for every mg
of nitrogen ammonium. In these equations, the oxygen requirements are 3.16 mg O2 per mg NH4-N oxidized and
1.11 mgO2 per mg NO2-N oxidized, respectively. Hence, the stoichiometric conversion of ammonia to nitrate
requires 4.27 mgO2 mgN-1, complessively. Expressed as volatile suspended solids (VSS), growth yields for
AOBs and NOBs are 0.15 mg cell/mg NH4-N oxidized and 0.02 mg cell/mg NO2-N oxidized, respectively.
Expressed as chemical oxygen demand (COD), growth yields are 0.21 mg COD/mg NH4-N oxidized for AOBs
and 0.028 mg COD/mg NO2-N oxidized for NOBs.
2.1.2 Mechanisms of nitrification
Nitritation. For the nitritation step, Suzuki et al., 1974 formulated the hypothesis that ammonia (NH3), rather
than ammonium (NH4+), is the actual substrate for AOBs. Anthonisen et al. (1976) observed that at higher
concentrations, ammonia becomes inhibiting for both AOBs and NOBs. Van Hulle et al. (2007) using an
experimental study verified both those hypothesis. Further, genetic studies demonstrated the enzyme involved in
ammonia oxidation uses NH3, not NH4+. The aerobic ammonia oxidation to nitrite proceeds through two
consecutive intermediate oxidation reactions, and hydroxylamine (NH2OH) is an intermediate (Kluyver and
Donker 1926). First, ammonia is oxidized to hydroxylamine using O2 as a substrate (electron acceptor) (Eq.
I-11). One oxygen atom is added to ammonia, while the second oxygen is reduced to water. This reaction is
catalyzed by a membrane-bound enzyme called ammonia monooxygenase (AMO). The second step of aerobic
ammonia oxidation is the oxidation of hydroxylamine to nitrite during which four electrons are released (Eq.
I-12). This second reaction is catalyzed by hydroxylamine oxidoreductase (HAO), a key enzyme in the
chemoautotrophic respiratory chain, which is a soluble trimer of three identical octaheme subunits that could

Chapter 1
10
serve to direct electrons along two separate pathways (Prince and George 1997). This allows that in every cycle
of oxidation of ammonia, two hydroxylamine-derived electrons return to the ammonia monooxygenase enzyme
(AMO) to regenerate hydroxylamine (Hooper et al. 1997; Whittaker et al. 2000).
3 2 222 2 AMONH O H e NH H OOH+ −+ + + → + 1' 120 G kJ mol−∆ ° = − Eq. I-11
2 22 5 4HAONH H NO H eOH O − + −+ ++ → 1' 289 G kJ mol−∆ ° = − Eq. I-12
Under anoxic conditions, Nitrosomonas spp. has also been shown to be a denitrifying organism that use
nitrite reductase and nitrous oxide reductase enzymes to form nitrous oxide (N2O) and dinitrogen (N2)
respectively (Poth and Focht 1985a; Poth 1986). Nitrosomonas eutropha can grow with nitrite (NO2) as oxygen
source (electron acceptor) instead of O2 for ammonia oxidation to hydroxylamine and NO is formed (Schmidt
and Bock 1997a, 1998). This process is known as nitrifier denitrification and its contribution has been observed
at oxygen-limiting conditions or elevated nitrite concentrations (Colliver and Stephenson 2000).
According to Kampschreur et al. (2009), nitritation process is responsible for N2O emission. In particular,
N2O is produced via hydroxylamine oxidation at 2 - 3 mgO2 L-1, and it is favored at high ammonia and low
nitrite concentrations (Wunderlin et al. 2012). The N2O production in hydroxylamine oxidation could be related
to an imbalanced metabolic activity of AOBs (Yu et al. 2010), or to a chemical decomposition of hydroxylamine
as well as to a chemical oxidation with NO2 as an electron acceptor (Ritchie and Nicholas 1972). In addition,
N2O is also produced by nitrifier denitrification by AOBs.
Free ammonia can be used directly as substrate or can made available by hydrolyzation of urea (Koops et al.
1991). Free ammonia (NH3) is in chemical equilibrium with its ionic forms (NH4+) (Eq. I-13). In nitrification
process, the ammonia oxidation releases protons which cause the acidification of the environment and thereby
shift the NH3/NH4+ equilibrium and the oxidation rate of nitritation.
43EquilibriumNH H NH+++ ←→
Eq. I-13
Nitratation. Regarding the nitrite oxidizing bacteria, the use of nitrite ion (NO2-) or free nitrous acid (FNA
or HNO2) as substrate is not unequivocal. Hellinga et al., (1999) and Magrí et al., (2007) defined FNA as the
direct substrate. The growth rate of NOB, thus, depended on the free nitrous acid concentration. Boon and
Laudelout, (1962) and Park and Bae, (2009) suggested to consider nitrite (NO2-) as the substrate and free nitrous
acid (FNA) as the inhibitor. Others considered the growth rate of NOBs depended on total nitrite concentration
(TNN = NO2—N + HNO2-N) according to the Monod Equation (Pambrun et al. 2006; Jiménez et al. 2011). Clear
experimental results showed that the inhibitor is FNA (HNO2) rather than nitrite (NO2-) (Vadivelu et al. 2006).
However, the mechanism of NO2- oxidation remains uncertain. An empirical mechanism of NO2
- oxidation has
been proposed, where the oxidation of NO2- and the conversion of O2 occurred simultaneously preventing the
formation of H+ gradient (Eq. I-14 - Eq. I-15).
2 2 32 2 4 42NO H O NO H e− − + −+ → + + 1' 83 G kJ mol−∆ ° = + Eq. I-14
224 4 2H e O H O+ −+ + → 1' 157 G kJ mol−∆ ° = − Eq. I-15
Nitratation is carried out by the enzyme nitrite oxidoreductase in Nitrobacter spp.. In the genera Nitrococcus,
Nitrospina, and Nitrospira the key enzyme is called the nitrite-oxidizing system.

Chapter 1
11
2.1.3 Phylogeny
Nitrification is performed by two specific genera of autotrophic bacteria, the Ammonium-Oxidizing Bacteria
(AOBs) and the Nitrite-Oxidizing Bacteria (NOBs). Recent molecular techniques have shown that there are
several genera of nitrifying organisms.
Aerobic AOB. The terrestrial AOBs are restricted to the beta- subdivision of the phylum proteobacteria (Fig.
I.4), while the marine AOBs are found both to the beta- and gamma- subdivision of the phylum proteobacteria
(Fig. I.4 and Fig. I.5). Each cluster identifies typical Ammonia-Oxidizing Bacteria of specific environments,
including sewage, wastewater, marine and terrestrial environments. Soils are often dominated by Nitrosospira
spp., while marine and freshwater often have mixtures of the genera of AOBs. Focussing on terrestrial AOBs,
Nitrosomonas and Nitrosospira are the currently genera comprising the beta-proteobacteria. Controversial
aspects are linked to (i) Nitrosococcus mobilis proposed to be reclassified to the genus Nitrosomonas spp.
(cluster 7), (ii ) Nitrosolobus and Nirosovibrio superseded by Nitrosospira and (iii ) Nitrosomonas cryotolerans
and Nitrosomonas Strain Nm143 placement (Norton 2011). In wastewater treatment plants are usually found
beta- proteobacteria of the cluster 7 (Nitrosomonas europea, Nitrosomonas mobilis strains and Nitrosomonas
eutropha) (Wagner et al. 1996; Juretschko et al. 1998; Kelly et al. 2005) and the cluster 8 (Nitrosomonas
nitrosa). They are capable of tolerating high-ammonia concentration. Nitrosospira have also been observed
under cool temperature and high dissolved oxygen concentration (Park et al. 2002). Often, Nitrosomonas cluster
6A, related to N. oligotropha, have been found in pool with low ammonia/ammonium concentration (Park et al.
2002). In constructed wetland for wastewater treatment are often present both Nitrosospira and Nitrosomonas
spp. (Gorra et al. 2007; Ruiz-Rueda et al. 2009).
Molecular techniques targeting the signature regions of the 16S ribosomal DNA (rDNA) and 16S rRNA of
AOB have been successfully applied in both environmental and engineered systems in order to: investigate the
phylogenetic tree and the affinities of members (Stephen et al. 1996; Kowalchuk et al. 1997); identify and direct
microscopic enumerate through fluorescent in situ hybridization techniques (FISH) (Mobarry et al. 1996;
Schramm et al. 1996, 1999; Juretschko et al. 1998; Okabe et al. 1999); quantify by real-time PCR (Polymerase
Chain Reaction) (Hermansson and Lindgren 2001; Dionisi et al. 2002). On the other hand, the gene encoding
AMO can be a function-specific target for detecting AOB in wastewater treatment processes. The amoA-DNA-
based method enables the detection, quantification and phylogenetic analysis of AOB (Sinigalliano et al. 1995;
Rotthauwe et al. 1997; Juretschko et al. 1998; Purkhold et al. 2000; Hoshino et al. 2001). DNA- or rRNA-based
analysis gives little information on the specific activity under any different environmental conditions while Aoi
et al., 2004 analyzed amoA- messenger RNA (mRNA) as an indicator of the ammonia oxidation activity because
the turn-over of mRNA is rapid in living bacterial cells, with most mRNA having a half-life of only a few
minutes (Alifano et al. 1994).

Chapter 1
12
Nitrosomonas eutropha C91 (NR_074751)
Nitrosomonas sp GH22 (AB000701)
Nitrosomonas sp TK794 (AB031960)
Nitrosomonas sp HPC101 (AB000702)
Nitrosomonas europaea ATCC19718 (NR_074774)
Nitrosomonas sp ENI - 11 (AB079053)
Nitrosomonas halophila (FR828475)
Nitrosococcus mobilis M93 N6 (AF037105)
Nitrosococcus mobilis NC2 (M96403)
Nitrosomonas communis Nm2 (HE856821)
Nitrosomonas sp Nm33 (AJ298733)
Nitrosomonas nitrosa Nm 90 (FR828477)
Nitrosomonas sp NM 41 (AF272421)
Nitrosomonas cryotolerans (AF272423)
Nitrosomonas aestuarii Nm36 (FR828476)
Nitrosomonas marina Nm 22(FR828473)
Nitrosomonas sp. JL21 (AB000700)
Nitrosomonas oligotropha AS1 (EF016119)
Nitrosomonas oligotropha Nm 45 (FR828478)
Nitrosomonas sp AL212 (NR_074682)
Nitrosomonas ureae (FR828472)
Nitrosomonas sp Nm 143 (AY123794)
Nitrosospira sp III2 (AJ000344)
Nitrosospira sp Nsp5 (AY123793)
Nitrosospira sp Ka3 ( AY123806)
Nitrosospira sp III7 (AY123809)
Nitrosospira sp O13 (AJ012108)
Nitrosospira sp Nsp65 (AY123813)
Nitrosospira multiformis ATCC 25196 (NR_074736)
Nitrosospira sp TCH711 (AY856377)
Nitrosospira sp TCH716 (AF353156)
Nitrosospira sp. 24 C (AJ298724)
Nitrosovibrio tenuis (M96404)
Nitrosospira sp Nl5 (AY123812)
Nitrosospira briensis C-128 (L35505)
Nitrosospira sp NSp1 (AY123808)
Nitrosospira briensis Nsp10 (AJ298741)
Nitrosospira tenuis Nv1 (AJ298746)
Outgroup Spirillum volutans (M34131)
100
47100
3947
100
99
99
98
96
96
95
84
79
68
52
33
28
77
46
60
45
93
55
89
86
82
63
84
83
81
57
54
55
72
0.02 Fig. I.4 16S ribosomal RNA phylogenetic tree for the cluster of beta- proteobacterial AOB, based on high quality sequences (>1200 bp) from isolates The scale bar indicate 0.02. Adapted from Norton (2011)
Nitrosococcus oceani AFC5P (AF508990)
Nitrosococcus oceani AFC24P (AF508987)
Nitrosococcus oceani AFC132 (AF508986)
Nitrosococcus oceani C-27 (AF338213)
Nitrosococcus oceani AFC27 (AF508988)
Nitrosococcus oceani ATCC19707 (AF363287)
Nitrosococcus watsoni C-113 (NR_074791)
Nitrosococcus halophilus Nc4 (NR_074790)
Outgroup Ectothiorhodospira (FR733667)
100
58
797131
89
0.02 Fig. I.5 16S ribosomal RNA phylogenetic tree for the cluster of Gamma- proteobacterial AOB, based on high quality sequences (>1200 bp) from isolates. The scale bar indicate 0.02. Adapted from Norton (2011)
Nitr
oso
mo
na
s N
itro
sosp
ira
Clu
ste
r 7
Clu
ste
r 8
Clu
ste
r 6
Clu
ste
r 3
Clu
ste
r 0, 2
, 4
Clu
ste
r 6 A

Chapter 1
13
Aerobic NOB. NOBs proliferate in a broad range of environmental conditions (terrestrial, marine, acidic) and
have diverse lifestyles (lithoautotrophic, mixotrophic, and heterotrophic) (Daims et al. 2011). NOBs are
comprised of five genera, which have been found in several lineages of Bacteria (Fig. I.6). Nitrobacter spp. are
located in the alpha-proteobacteria lineage whereas Nitrococcus spp. in the gamma-proteobacteria. Nitrospina
spp. are temporarily placed in delta-proteobacteria but could belongs to a separate bacterial phylum while
Nitrospira spp. occupy its own branching lineage (Starkenburg et al. 2011). A new candidate genus have been
found in Siberian Arctic, the “Candidatus Nitrotoga”, located in the beta-proteobacteria (Alawi et al. 2007).
Nitrospina and Nitrococcus have been recovered from marine environments and are characterized as obligate
halophilic (Starkenburg et al. 2011) while Nitrobacter spp. and Nitrospira spp. assumed to be the major players
in nitrite oxidation in freshwater environments and wastewater treatment plants. For decades, Nitrobacter spp.
were mainly regarded to be responsible for the nitrite oxidation in wastewater treatment plant and was the most
famous nitrite oxidizer genus. Recently, independent molecular techniques (FISH with rRNA – targeted
oligonucleotide probes, PCR) and metagenomics-based analysis showed that Nitrobacter spp. cannot be relevant
for nitrite oxidation in most wastewater treatment plants while Nitrospira spp. are much more abundant in
sewage treatment systems (Daims et al. 2011). Further, Schramm et al. (1999) demonstrated that Nitrospira spp.
have much higher affinity for nitrite that Nitrobacter spp.. Nitrospira spp. are more likely to dominate nitrite
oxidation under low ammonium and low nitrite concentrations (Blackburne et al. 2007). Nitrobacter spp. can be
found in systems treating wastewater with high nitrogen loads (Mobarry et al. 1996; Gieseke et al. 2003).
Blackburne et al. (2007) have found that the yield of Nitrospira spp. (gVSS gN-1) is higher than that of
Nitrobacter spp. and is likely similar to that of the ammonia oxidizers.
Candidatus Nitrotoga arctica (DQ839562)
Gallionella ferruginea (L07897)
Rhodocyclus tenuis (D16208)
Nitrosomonas europaea (AB070982)
Nitrosospira multiformis (AB070984)
Burkholderia cepacia (U96927)
Chromatium okenii (AJ223234)
Thiocapsa sp. KS1 (EF581005)
Escherichia coli ATCC 11775T (X80725)
Phototrophic bacterium (X93481)
Nitrococcus mobilis ATCC 25380 (L35510)
Nitrosococcus oceani (AF363287)
Agrobacterium tumefaciens (M11223)
Rhizobium pisi DSM 30132 (AY509899)
Bradyrhizobium japonicum (X87272)
Rhodopseudomonas palustris (D25312)
Nitrobacter hamburgensis X14 (CP000319)
Nitrobacter vulgaris (AM114522)
Nitrobacter alkalicus AN1(AF069956)
Nitrobacter sp. 311 (AM292300)
Nitrobacter winogradskyi Nb-255 (CP000115)
Desulfovibrio desulfuricans (AF192153)
Nitrospina gracilis (Atlantic Ocean isolate) (L35504)
Desulfobacter postgatei (AF418180)
Syntrophobacter wolinii (NR_028020)
Candidatus Magnetobacterium bavaricum (X71838)
Thermodesulfovibrio yellowstonii (AB231858)
Leptospirillum ferriphilum (AF356829)
Nitrospira marina Nb-295 (X82559)
Candidatus Nitrospira brockiana (EU084879)
Candidatus Nitrospira defluvii (DQ059545)
Nitrospirae moscoviensis (X82558)
91
58
51
82
100
9794
100
51
73
100
97
100
9448
99
5044
46
85
6979
82
59
4199
0.05
Fig. I.6: Phylogenetic tree, based on protein sequences showing the phylogenetiv affiliation of the currently know NOB. The scale bar indicate 0.05. Adapted from Daims et al. (2011).
α-proteobacteria
α-proteobacteria
ϭ-proteobacteria
β-proteobacteria
γ-proteobacteria

Chapter 1
14
Molecular techniques targeting the signature regions of the 16S ribosomal RNA (rRNA) have been applied to
detect NOBs. In particular, Nitrobacter spp. show high 16 rRNA similarities to their closest non-nitrifying
bacteria suggesting that the 16 rRNA is too conserved to explicitly resolve lineage within the genus Nitrobacter
(Daims et al. 2011). A better approach to identify Nitrobacter spp. uses genes encoding subunits of the key
enzyme of nitrite oxidation, nitrite oxidoreductase (Nxr), as functional and phylogenetic markers. Poly et al.,
2008 used PCR primers targeting the gene of the Nxr alpha subunit of Nitrobacter spp., nxrA genes. Also other
two genes from the Nxr cluster are used as molecular markers, nxrB and nxrC (Vanparys et al. 2007)
2.1.4 Bioinformatics
Aerobic AOB. More than a century has passed since the discovery of the nitrification process and, today is
finally known genomes from AOB representative of several ecotype in beta-proteobacteria and gamma-
proteobacteria. AOBs have a small genome (~ 3 megabases) and it contains genes necessary for the ammonia
catabolism, energy and reductant generation, biosynthesis, CO2 and NH3 assimilation and iron acquisition. Genes
encoding transporters for inorganic ions were plentiful. The gene profiles reveal limited genes for catabolism and
transport of complex organic compounds, whereas genes for sucrose synthesis/degradation have been identified
(Chain et al. 2003; Arp et al. 2007)).
Aerobic NOB. Until now, five genomes of NOBs have been sequenced (Nitrobacter spp., Nitrococcus spp.
and Nitrospira spp.). On average, Nitrobacter genomes is 4.1 megabases and encode approximately 4000 genes.
It is relatively small compared to its closest non-nitrifying bacteria. It contains genes for nitrite oxidoreductase
(Nxr). The functional gene nxrA, encoding the catalytic subunit of the nitrite oxidoreductase in nitrite-oxidizing
bacteria (NOB) has been detected. Cytochromes associated with a dissimilatory nitrite reductase (NirK), PII-like
regulators, and polysaccharide formation were identified (Starkenburg et al. 2008). The high diversity of genes
identified may reflect the high diversity of NOBs and their flexibility. It is interesting note that Nxr can behave
as a dissimilatory nitrate reductase during anaerobic growth, reducing nitrate to nitrite under anaerobic
conditions at pH 6 to 7 (Tanaka et al. 1893). This properties agrees with the fact that nxrA and nxrB are
homologos of narGH that comprise subunits of dissimilatory nitrate reductse, found in some denitrifying
bacteria (Kirstein and Bock 1993).
2.1.5 Kinetics
AOBs and NOBs are characterized by different general kinetics (Eq. I-16, Eq. I-17). Biochemical
experiments performed on different nitrifying cultures indicated that nitritation and nitratation kinetics are
strongly influenced by the nature of nitrifying cultures and by many physico-chemical environmental factors
such as substrate concentration, intermediate and final products concentration, temperature, dissolved oxygen,
pH, and various inhibitors such as salts and so on. The difference in sensitivity of AOBs and NOBs towards
these influences determines the dominance of one group over the other. The specific autotrophic growth rate
(µAut) can be expressed by the interactive Monod model for growth which is used to describe the effect of
limiting substrate on microbial growth.
Monod – Based growth Kinetics:
4
, 4 4
MAX NH OAOB AOB AOB AOB
S NH NH O O
S S
K S K Sµ µ= ⋅
+ + Eq. I-16
2
, 2 2
MAX NO ONOB NOB NOB NOB
S NO NO O O
S S
K S K Sµ µ= ⋅
+ + Eq. I-17

Chapter 1
15
where µAOB and µNOB are the actual specific growth rate of AOB and NOB, respectively; µAOBMAX and
µNOBMAX are the maximum specific growth rate of AOB and NOB; SNH4 and SNO2 are the NH4
+-N and NO2--N
concentrations in the bulk liquid and KS,NH4AOB and KS,NO2
NOB are the NH4+-N and NO2
--N half saturation
constants for AOB and NOB, respectively. Finally, SO is the O2 concentration in the bulk liquid, while KOAOB
and KONOB are the oxygen half saturation constants for AOB and NOB, respectively.
Several models describing nitrite build-up during nitrification (NH4+/NH3→NO2
-→NO3
-) have been
developed as reviewed by Sin et al., (2008) (Hellinga et al. 1999; Hao et al. 2002; Wett and Rauch 2003; Carrera
et al. 2004; Wyffels et al. 2004; Pambrun et al. 2006; Kaelin et al. 2009; Park and Bae 2009).
Carbon dioxide, the carbon source for autotrophic growth, is present in abundance, so that it is not taken into
account in the kinetic expressions. The nitritation and nitratation kinetics could be different both in processes
and in models considered. In particular, some differences are in the form of the substrate considerated
(dissociated/undissociate) to model nitritation and nitratation. In addition, some substrates can be also inhibitors.
Among models and theories, Jubany et al., 2008 expressed the AOBs inhibition/limitation by TAN and NOB
inhibition/limitation by TNN with a Haldane model while AOB inhibition by TNN and NOB inhibition by TAN
with a non-competitive model.
2.1.6 Factors involved in nitrification kinetics
As autotrophic microorganisms are very sensitive to change in environmental conditions, a number of factor
are found to affect the kinetics of nitrification.
Free ammonia and ammonium concentration
Free ammonia (FA or NH3-N) and ammonium (NH4+-N) concentrations have a great influence on AOBs and
NOBs kinetics. In particular, free ammonia (NH3-N) acts both as substrate (Suzuki et al., 1974) and inhibitor for
AOBs and as inhibitor for NOBs (Anthonisen et al. 1976). Free ammonia (NH3-N) is in chemical equilibrium
with its ionic form (NH4+-N) and it is calculated as a function of pH, temperature and total ammonium nitrogen
(TAN= NH3-N+ NH4+-N) (Wiesmann 1994) (Eq. I-18 - Eq. I-20). The formation of FA is favorable at a basic pH
and at high temperature (Fig. I.7).
( )( )
16344/ 273 ( )
6344/ 273 ( )
( )10 10 1 101 1
pH T CpH pH
NH T Ce
TAN TAN TANFA mgNL
eK e
−− + °− −
− + °
= = = + ⋅+ +
Eq. I-18
3 4TAN NH N NH N+= − + − Eq. I-19
( )6344/ 273 ( )3
4
T CNHe
NH N HK e
NH
+− + °
+− ⋅
= = Eq. I-20
pH7 8 9 10 11 12
NH3 c
onten
t [%]
0
20
40
60
80
100
NH3 at T=20°C NH3 at T=25°C NH3 at T=30°C
T [°C]
Fig. I.7 NH3/NH4
+ equilibrium (calculated from Wiesmann et al., 1994)

Chapter 1
16
Anthonisen et al. (1976) stated that aerobic ammonia oxidizers are inhibited at NH3-N concentrations
between 10 – 150 mg NH3-N L−1 while inhibition of nitrite oxidation is observed at NH3-N concentration of
0.08–0.82 mg NH3-N L−1 (Anthonisen et al. 1976; Philips et al. 2002a). As nitrite oxidizers are more sensitive
than the ammonia oxidizers to free ammonia, working at high pH (7.5 – 8) and, thus, at high free ammonia
concentrations could be a way to outcompete NOBs. A summary of main literature findings on the FA initiated
inhibition thresholds on AOBs and NOBs is given in Table I-1.
Table I-1 FA inhibition thresholds. The corresponding nitrite concentrations at pH 7.5 are also shown
Culture FA (mg NH3-N L -1)
Total nitrogen ammonium at pH 7.5 at 35°C
(mg TAN L -1) Reference
AOB
10 - 150 290 - 4330 (Anthonisen et al. 1976)
73 2100 (Hellinga et al. 1999)
>>16 >>460 (Vadivelu et al., 2006)
300 8660 (van Hulle et al. 2007)
NOB
0.08-0.82 2-24 (Anthonisen et al. 1976)
0.04–0.08 Nitrospira spp.
1 -2 (Kim et al. 2008)
30 ~ 50 Nitrobacter spp.
860 -1440 (Kim et al. 2008)
1 -9 Nitrobacter sp. anabolism
inibition 100% 29 - 260 (Vadivelu et al., 2007)
1 -9 Nitrobacter sp. catabolism
inibition 12 – 25% 29 - 260 (Vadivelu et al., 2007)
Vadivelu et al. (2006) showed that FA up to 16.0 mg NH3-N L-1 at pH of 7.1 and 30°C (1574 mg NH4-N L-1)
did not have any inhibitory effect on either the catabolic or anabolic process of a Nitrosomonas culture.
Literature on the NH3–N inhibition of NOBs shows disagreement about the threshold NH3-N concentration
and its inhibition degree. Kim et al. (2008a) reported different threshold for Nitrobacter spp. and Nitrospira spp..
In particular, Nitrobacter spp. were inhibited at 30~50 mg NH3-N L-1 and Nitrospira spp. were inhibited at
0.04~0.08 mg NH3-N L-1. The authors also showed that free ammonia inhibition of nitrite oxidizing bacteria was
reversible. Turk and Mavinic (1989) showed an adaptation of the nitrite oxidizing bacteria to FA, confirmed also
by other studies (Villaverde 2000). The higher resistance of Nitrobacter spp. was also confirmed by Vadivelu et
al., (2007), who stated that the respiration (catabolism) of Nitrobacter spp. was inhibited by FA even at
concentrations in the range of 1 – 9 mgNH3-N L−1 at pH of 7.3 and 22°C (100 - 1000 mg NH4-N/L). However,
this inhibitory effect was limited (inhibited by 12 - 25%). Further, they found the biosynthesis (anabolism) of
NOBs ceased completely at a FA concentration of 7.5 mgNH3-N L−1, although at this point the oxygen
consumption rate was only reduced by 25%.
Nitrite and free nitrous acid (FNA)
Nitrite, under certain environmental conditions, can be accumulate in WWTPs. The protonated form of
nitrite, free nitrous acid (HNO2-N or FNA), has been found to cause a severe inhibition to numerous biological
processes. In particular, Anthonisen et al. (1976) had first reported that both the inhibition of AOBs and NOBs
was related to concentrations of FNA rather than the nitrite itself (NO2-), as the undissociated form is easily
transported over the cell way by a passive transport. The nitrite produced by nitritation process will exist in
equilibrium with the un-ionized form (HNO2), depending on the pH and the temperature. The formation of FNA

Chapter 1
17
is favorable at an acidic pH (Fig. I.8). FNA can be determined through the total nitrite (TNN=HNO2-N+NO2--N)
concentrations by the following formula (Eq. I-21- Eq. I-23):
( ) ( )1
2300/ 273 ( )2300/ 273 ( )( )
1 101 110 10
NO T C pHT Ce
pH pH
TNN TNN TNNFNA mgNL
K ee
−− + °− + °
− −
= = = + ⋅+ +
Eq. I-21
2 2TNN HNO N NO N−= − + − Eq. I-22
( )2300/ 273 ( )2
2
T CNOe
NO N HK e
HNO N
+− + °− ⋅
= =−
Eq. I-23
pH6 7 8 9 10 11 12
HNO 2
cont
ent [
%]
0,0
0,1
0,2
0,3
0,4
0,5
HNO2 at T=20°C HNO2 at T=25°C HNO2 at T=30°C
T [°C]
Fig. I.8 HNO2/NO2- equilibrium (calculated from Wiesmann et al., 1994)
In terms of nitrite, Silva et al. (2011) in their study reported that, using an initial pH of 7.7 and T=30°C, at 25
mg NO2-N L-1 (0.001 HNO2-N L-1), complete nitrification well proceeded while at 100 and 200 mg NO2-N L-1
(mg 0.004–0.008 HNO2-N L-1) inhibition effects on the nitrification respiratory process was evidenced. The
authors also demonstrated that the nitrite oxidizing process was more sensitive to the presence of nitrite than the
ammonium oxidizing process. Anthonisen et al. (1976) reported that the inhibition on AOBs and NOBs will be
initiated at a FNA concentration of 0.22 e 2.8 mg HNO2-N L-1. Using the Eq. I-21 and varying the pH,
Anthonisen and coauthors defined a boundary zone of FNA inhibition to the nitrification process. Later studies
have found variable inhibitory FNA threshold levels. A range of 0.2-1.72 mg HNO2-N L-1 has resulted in a 50%
reduction in AOB activity (Hellinga et al. 1999; Vadivelu et al. 2006; Torà et al. 2010). Inhibition on NOB was
observed even at lower HNO2--N concentrations.
Table I-2 reported some FNA and nitrite concentrations at pH 7 that have been reported to inhibit both the
ammonia- and nitrite- oxidizing bacteria by 50% and 100%, respectively (Zhou et al. 2011).
Table I-2 FNA inhibition thresholds. The corresponding nitrite concentrations at pH 7 and T=30°C are also shown
Culture 100% inhibition 50% inhibition
Reference FNA
(mg HNO2-N L -1) Total Nitrite at pH 7
(mg TNN L-1) FNA
(mg HNO2-N L -1) Nitrite at pH 7 (mg TNN L-1)
AOB - - 0.2 1010 (Hellinga et al. 1999)
NOB 0.023 116 0.0175 88 (Vadivelu et al. 2006)
The range of inhibition thresholds reported above shows that NOBs are more sensitive to FNA than AOBs by
approximately one order of magnitude. FNA inhibited both the growth (0.10–0.40 mg HNO2-N L-1) and the
energy production abilities (0.50– 0.63 mgHNO2-N L-1) of Nitrosomonas culture (Vadivelu et al. 2006). Yang et
al. (2003) found that FNA inhibition on nitritation can be reversible and AOBs recovered their activity after a
short period of 12 days. On the contrary, FNA concentrations start to affect NOBs activity in the range of 0.011

Chapter 1
18
- 0.07 mg HNO2-N L-1, while a complete inhibition was observed at 0.023 - 0.22 mg HNO2-N L-1 (Anthonisen et
al. 1976; Vadivelu et al. 2006; Zhang et al. 2010a).
The wide range of inhibition thresholds values, both for AOB and NOB, could be due to the diversity of
microbial community and to contrasting FNA inhibition effects. For istance, Nitrosomonas europaea has some
different metabolic properties as compared to Nitrosomonas eutropha, such as the ability to use nitrite as an
electron acceptor anaerobically (Zhou et al. 2011). Nitrospira spp. have been reported to be more sensitive to
FNA than Nitrobacter spp. (Blackburne et al. 2007). Different species and strains within a genus could possess
distinct tolerances towards FNA. Jiménez et al., (2011) demonstrated that the nitrite oxidation rate (NOR)
depended33 on the TNN concentrations independently of the free nitrous acid (FNA) concentration, thus FNA
cannot be considered as the real substrate for NOB.
pH
The pH of wastewaters has a strong influence on nitrification as it plays an important role on nitrifying
bacteria activity. The pH impacts are both direct and associated with nutritional effect (indirect) and it is difficult
to distinguish them. The cellular environment affects enzymatic activity, so at extremes values of pH (as well as
temperature) the native structure of the enzyme could be directly compromised and the molecule will become
inactive in a reversible way (Gaudy and Gaudy 1980; Quinlan 1984; Paredes et al. 2007). Using batch
experiments based on respirometric techniques, the direct effect of pH on the nitritation (Jiménez et al. 2012)
and nitratation process (Jiménez et al. 2011) has been determined and pH inhibition constants have been
proposed for both ammonia- and nitrite- oxidation. Jiménez et al., (2011) showed that pH values below 6.5
caused the complete inhibition of the NOB activity, but high pH values did not affect it, and similar NOB
activities were measured at pH values ranging from 7.5 to 9.95.
In addition, pH plays an important role on TAN (total ammonium nitrogen), total nitrite nitrogen (TNO2) and
(total inorganic carbon TIC) speciation, affecting the substrate/inhibitors chemical equilibria, substrates
availability and inhibition phenomena and thus the biological processes performances. (Magrí et al. 2007;
Ganigué et al. 2012).
Considering the availability of CO2 and NH3 and the potential adverse impact of NH3 and HNO2, pH around
7.5 would be the most favorable for the complete nitrification (i.e. NH3 and HNO2 concentration are higher at
higher and lower pH, respectively). Alleman (1984) observed an optimum range of 7.9 – 8.2 for ammonia
oxidizers (Nitrosomonas spp.) and of 7.2 – 7.6 for nitrite oxidizers (Nitrobacter spp.). In natural environments,
nitrification has been also reported to occur at pH values as low as 4 (De Boer et al. 1991, 1995).
However, the most probable mechanism that influence how pH impacts on AOBs and NOBs is related to the
speciation of ammonia and nitrite. In general, the maximum specific autotrophic growth rate (µAut) is extremely
sensitive to the pH of the liquid bulk. It is well accepted, in WWTPs, that the optimum pH for both ammonium
oxidizers and nitrite oxidizers lies between 7 and 8.5 (Ekama and Wentzel 2008). The specific growth rate (µAut)
is maximum for the range 7.2 <pH< 8.0 but decrease as the pH decreases below 7.2 and as the pH increases up 9
– 9.5. Below pH 7, nitrification rate could decreases since carbon limitation, due to CO2 stripping, will occur
(Wett and Rauch 2003) and since pH has a direct effect on the specific growth rate (Van Hulle et al. 2007).
Studies have shown that maximum µAutmax can be expressed as a percentage of the highest value at the optimum
pH and different model have been proposed (Quinlan 1984; Siegrist and Gujer 1987; Magrí et al. 2007; Park et
al. 2007; van Hulle et al. 2007).

Chapter 1
19
Temperature
The impact of the temperature on nitrifying activity is normally much more pronounced than the effect of pH.
Temperature is a mean parameter in the nitrification process and, as for the pH influence, the precise effect on
the biological process is difficult to determine due to its interaction with chemical equilibria, mass transfer and
growth rate. Increasing temperature multiple effects occur: a decrease of the solubility of ammonia gas and a
shift of the NH4+/NH3 equilibrium in favor of NH3 gas, an increase of mass transfers of O2, CO2 and an increase
of the activity of the organisms according to the Arrhenius principle until a certain critical temperature above
which biological activity decreases again.
The range of the temperatures favorable to nitrification is quite wide. The lower limit would be 8-10°C (Jones
and Hood 1980; Choi et al. 1998; Park et al. 2008) whereas the higher limit would be between 35°C and 45°C
(Willers et al. 1998). The thermal death point of pure cultures of Nitrosomonas spp. lies between 54 – 58°C
(Barrit 1933). Correlation of the maximum growth rate of nitrifying bacteria and temperature is described in the
Arrhenius equation at temperature of 5° - 40°C (Eq. I-24), that for small temperature differences can be
simplified (Eq. I-25):
( )( ), ,20
20exp
293 273amax max
Aut T Aut C
E T
R Tµ µ °
= ⋅ -
-+
Eq. I-24
( ) ( ) ( )rT TrT T eϑµ µ −
= Eq. I-25
where (µAutmax)T is the maximum specific growth rate at the actual temperature T, Tr is the reference
temperature (often taken as 20°C), Ea is the activation energy and θ is the Arrhenius constant, θ =1,08 - 1,12
(Painter and Loveless 1983; Henze et al. 2000).
As reported in Table I-3 the activation energy of the ammonia oxidation process is higher than that of the
nitrite oxidation process. As consequence of this, an increase of temperature implies an increase on the ammonia
oxidation rate larger than that by the nitrite oxidation rate. This means that temperature has distinct effects on the
competition between AOB and NOB and could be used as a key operation parameter to achieve a stable
nitritation, as AOB would out-compete NOB at the relatively higher temperatures. As reported in Fig. I.9, the
maximum specific growth rate of the AOBs will be higher than that of NOBs at temperatures above 20-25°C.
This principle is the basis of the SHARON process, which consists of a chemostat reactor operated at a hydraulic
retention time (HRT) of 1 d and 30°C to promote the growth of the AOB and to washout the NOB (Mulder et al.
2001; van Hulle et al. 2007).
Temperature (°C)
0 5 10 15 20 25 30 35 40
Spe
cific
Gro
wth
rat
es (
d-1)
0
1
2
3
4
5
AOBNOB
Table I-3 Activation energy of ammonia- nitrite oxidation Ea Nitrosomonas 86,4* KJ mol-1
Ea Nitrobacter 58,4* KJ mol-1
growth rate Nitrosomonas 0,801 d-1 at 20°C
growth rate Nitrobacter 0,788 d-1 at 20°C
* at 2 – 30°C Nitrosomonas europaea (Wijffels, 1995)
Fig. I.9 Maximum Growth rate of AOBs and NOBs at different temperature
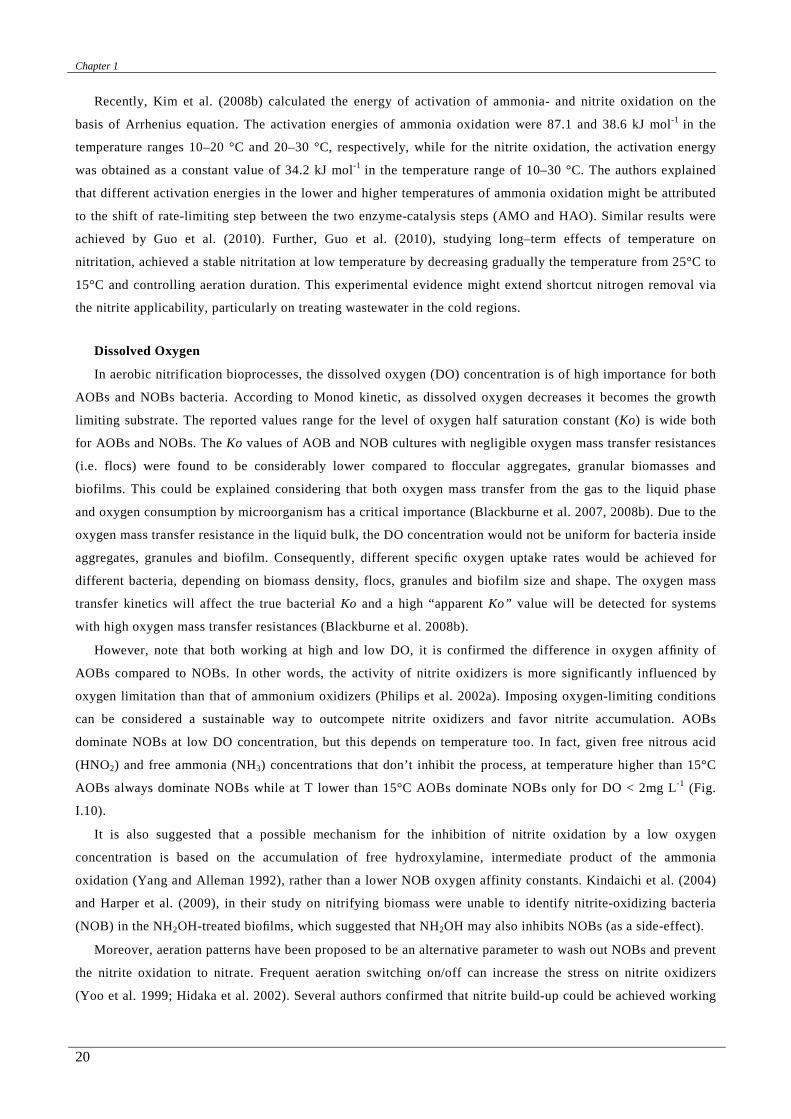
Chapter 1
20
Recently, Kim et al. (2008b) calculated the energy of activation of ammonia- and nitrite oxidation on the
basis of Arrhenius equation. The activation energies of ammonia oxidation were 87.1 and 38.6 kJ mol-1 in the
temperature ranges 10–20 °C and 20–30 °C, respectively, while for the nitrite oxidation, the activation energy
was obtained as a constant value of 34.2 kJ mol-1 in the temperature range of 10–30 °C. The authors explained
that different activation energies in the lower and higher temperatures of ammonia oxidation might be attributed
to the shift of rate-limiting step between the two enzyme-catalysis steps (AMO and HAO). Similar results were
achieved by Guo et al. (2010). Further, Guo et al. (2010), studying long–term effects of temperature on
nitritation, achieved a stable nitritation at low temperature by decreasing gradually the temperature from 25°C to
15°C and controlling aeration duration. This experimental evidence might extend shortcut nitrogen removal via
the nitrite applicability, particularly on treating wastewater in the cold regions.
Dissolved Oxygen
In aerobic nitrification bioprocesses, the dissolved oxygen (DO) concentration is of high importance for both
AOBs and NOBs bacteria. According to Monod kinetic, as dissolved oxygen decreases it becomes the growth
limiting substrate. The reported values range for the level of oxygen half saturation constant (Ko) is wide both
for AOBs and NOBs. The Ko values of AOB and NOB cultures with negligible oxygen mass transfer resistances
(i.e. flocs) were found to be considerably lower compared to floccular aggregates, granular biomasses and
biofilms. This could be explained considering that both oxygen mass transfer from the gas to the liquid phase
and oxygen consumption by microorganism has a critical importance (Blackburne et al. 2007, 2008b). Due to the
oxygen mass transfer resistance in the liquid bulk, the DO concentration would not be uniform for bacteria inside
aggregates, granules and biofilm. Consequently, different specific oxygen uptake rates would be achieved for
different bacteria, depending on biomass density, flocs, granules and biofilm size and shape. The oxygen mass
transfer kinetics will affect the true bacterial Ko and a high “apparent Ko” value will be detected for systems
with high oxygen mass transfer resistances (Blackburne et al. 2008b).
However, note that both working at high and low DO, it is confirmed the difference in oxygen affinity of
AOBs compared to NOBs. In other words, the activity of nitrite oxidizers is more significantly influenced by
oxygen limitation than that of ammonium oxidizers (Philips et al. 2002a). Imposing oxygen-limiting conditions
can be considered a sustainable way to outcompete nitrite oxidizers and favor nitrite accumulation. AOBs
dominate NOBs at low DO concentration, but this depends on temperature too. In fact, given free nitrous acid
(HNO2) and free ammonia (NH3) concentrations that don’t inhibit the process, at temperature higher than 15°C
AOBs always dominate NOBs while at T lower than 15°C AOBs dominate NOBs only for DO < 2mg L-1 (Fig.
I.10).
It is also suggested that a possible mechanism for the inhibition of nitrite oxidation by a low oxygen
concentration is based on the accumulation of free hydroxylamine, intermediate product of the ammonia
oxidation (Yang and Alleman 1992), rather than a lower NOB oxygen affinity constants. Kindaichi et al. (2004)
and Harper et al. (2009), in their study on nitrifying biomass were unable to identify nitrite-oxidizing bacteria
(NOB) in the NH2OH-treated biofilms, which suggested that NH2OH may also inhibits NOBs (as a side-effect).
Moreover, aeration patterns have been proposed to be an alternative parameter to wash out NOBs and prevent
the nitrite oxidation to nitrate. Frequent aeration switching on/off can increase the stress on nitrite oxidizers
(Yoo et al. 1999; Hidaka et al. 2002). Several authors confirmed that nitrite build-up could be achieved working
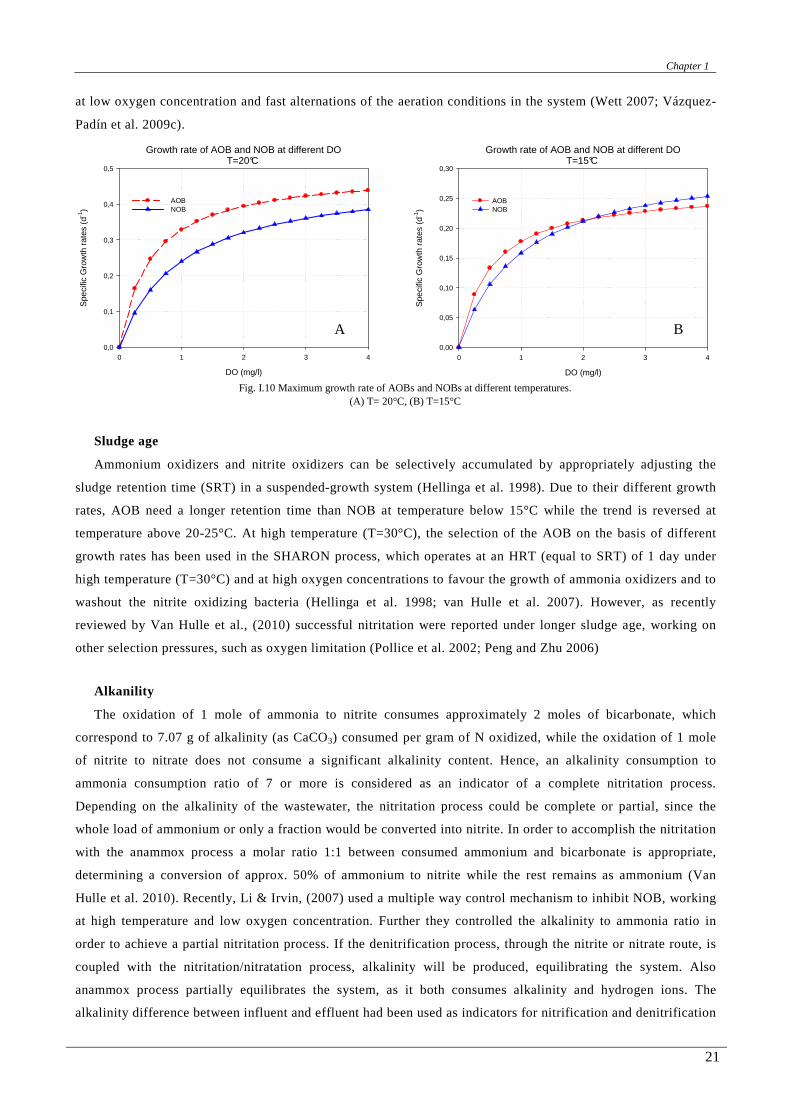
Chapter 1
21
at low oxygen concentration and fast alternations of the aeration conditions in the system (Wett 2007; Vázquez-
Padín et al. 2009c).
Growth rate of AOB and NOB at different DOT=20°C
DO (mg/l)
0 1 2 3 4
Spe
cific
Gro
wth
rat
es (
d-1)
0,0
0,1
0,2
0,3
0,4
0,5
AOBNOB
Growth rate of AOB and NOB at different DOT=15°C
DO (mg/l)
0 1 2 3 4
Spe
cific
Gro
wth
rat
es (
d-1)
0,00
0,05
0,10
0,15
0,20
0,25
0,30
AOBNOB
Fig. I.10 Maximum growth rate of AOBs and NOBs at different temperatures. (A) T= 20°C, (B) T=15°C
Sludge age
Ammonium oxidizers and nitrite oxidizers can be selectively accumulated by appropriately adjusting the
sludge retention time (SRT) in a suspended-growth system (Hellinga et al. 1998). Due to their different growth
rates, AOB need a longer retention time than NOB at temperature below 15°C while the trend is reversed at
temperature above 20-25°C. At high temperature (T=30°C), the selection of the AOB on the basis of different
growth rates has been used in the SHARON process, which operates at an HRT (equal to SRT) of 1 day under
high temperature (T=30°C) and at high oxygen concentrations to favour the growth of ammonia oxidizers and to
washout the nitrite oxidizing bacteria (Hellinga et al. 1998; van Hulle et al. 2007). However, as recently
reviewed by Van Hulle et al., (2010) successful nitritation were reported under longer sludge age, working on
other selection pressures, such as oxygen limitation (Pollice et al. 2002; Peng and Zhu 2006)
Alkanility
The oxidation of 1 mole of ammonia to nitrite consumes approximately 2 moles of bicarbonate, which
correspond to 7.07 g of alkalinity (as CaCO3) consumed per gram of N oxidized, while the oxidation of 1 mole
of nitrite to nitrate does not consume a significant alkalinity content. Hence, an alkalinity consumption to
ammonia consumption ratio of 7 or more is considered as an indicator of a complete nitritation process.
Depending on the alkalinity of the wastewater, the nitritation process could be complete or partial, since the
whole load of ammonium or only a fraction would be converted into nitrite. In order to accomplish the nitritation
with the anammox process a molar ratio 1:1 between consumed ammonium and bicarbonate is appropriate,
determining a conversion of approx. 50% of ammonium to nitrite while the rest remains as ammonium (Van
Hulle et al. 2010). Recently, Li & Irvin, (2007) used a multiple way control mechanism to inhibit NOB, working
at high temperature and low oxygen concentration. Further they controlled the alkalinity to ammonia ratio in
order to achieve a partial nitritation process. If the denitrification process, through the nitrite or nitrate route, is
coupled with the nitritation/nitratation process, alkalinity will be produced, equilibrating the system. Also
anammox process partially equilibrates the system, as it both consumes alkalinity and hydrogen ions. The
alkalinity difference between influent and effluent had been used as indicators for nitrification and denitrification
A B

Chapter 1
22
in a Sequencing Batch Reactor (SBR), and could be utilize in the new biological nitrogen removal
configurations, which include the integration of partial nitritation, anammox (Bagchi et al. 2010).
Salinity
The presence of salts in wastewaters may negatively affect bacteria and inhibit their activity. Salinity
influences the life strategies of bacteria. Bacteria can tolerate salinity, being able to survive in environments with
high salinity by maintaining their cytoplasm at the same osmotic level as that of the surrounding environment
(Bollmann and Laanbroek 2002). However, the effect of salinity on nitrogen removal, is not clear at all, mainly
because different experimental conditions were used in the literature studies (Paredes et al. 2007). Nevertheless,
different degrees of inhibition on nitrification process have been reported in literature, mainly depending on the
adaptation of biomass to the saline environments (Table I-4).
It has been confirmed that the nitrite oxidizers were more sensitive to salt concentration than the ammonium
oxidizers (Vredenbregt et al. 1997; Campos et al. 2002; Mosquera-Corral et al. 2005), even if some researcher
concluded that, compared to nitrite oxidizers, ammonia oxidizers were more sensitive to short- and long-term
salt stress (Moussa et al. 2006; Sudarno et al. 2011). In saline environments, the adaptation of a microbial
community to the high salinity concentration has a significant effect on their species diversity. Nitrosomonas
europaea was detected at higher levels in saline environments compared to the levels in freshwater systems (Tal
et al. 2003). In addition, Ye and Zhang (2011) demonstrated that the ammonia-oxidizing bacteria dominates over
ammonia-oxidizing archaea in a saline nitrification reactor under low DO and high nitrogen loading.
Table I-4 Effects of salinity on the nitrification processes.
Salinity Inhibition System Reference
non adapted biomass
5.8 g NaCl L-1 0% SHARON (Mosquera-Corral et al.
2005)
30 g NaCl L-1 20% nitrification reactor (Dincer and Kargi 2001)
30 g NaCl L-1 55% activated sludge (Panswad and Anan
1999)
66 gNaCl L-1 95% SBR (Moussa et al. 2006)
adapted biomass
8.3 g Na2SO4 L-1 higher inhibition on
NOB rather than AOB activated sludge (Campos et al. 2002)
>13.7 g NaCl L-1 inhibition activated sludge (Campos et al. 2002)
19.9 g NaNO3 L-1 inhibition activated sludge (Campos et al. 2002)
25 g NaCl L-1 0% SHARON (Mosquera-Corral et al.
2005)
30 g NaCl L-1 30% activated sludge (Panswad and Anan
1999)
40 g NaCl L-1 60% PNBR. (Aslan and Simsek
2012)
78 g NaCl L-1 0% SBR (Dahl et al. 1997)

Chapter 1
23
Other sources of inhibition
Nitrification may also be influenced by several inhibitory compounds. Among them, the influence of heavy
metals on the nitrification has been thoroughly studied. You et al. (2009b) showed that the inhibition degrees for
the nitrification activity was nickel (Ni) > cadmium (Cd) > lead (Pb). No significant inhibition in the nitrification
reaction of the activated sludge was observed even when as much as 40 ppm Pb were used. In addition, no
synergistic effect was found when different heavy metals were simultaneously added in different concentrations,
and the overall inhibition effect depended on the heavy metal with the highest toxicity. Cecen et al. (2010)
showed that copper (Cu) proved to be the most inhibitory metal on nitrification, while nickel (Ni) was in second
place, Cobalt (Co) appeared to be the least inhibitory metal and the inhibitory effect evolved only very slowly.
The author suggested to pay attention to factors such as the exposure time besides the metal concentration and
speciation (labile and free metal). However inhibitor-resistant nitrifying cultures can be obtained from long-term
batch incubations of decaying activated sludge incubated with high levels of added inhibitor (Yeung et al. 2013).
Chromium, nickel, copper, zinc, lead and cadmium inhibit both steps of nitrification reaction but the bacteria are
not inhibited according to the same pattern (Grunditz et al. 1998). Carucci et al. (2006) reported significant
inhibition of nitrification by lincomycin, a lincosamide antibiotic. Free cyanide cause a lag phase on nitrification
in activated sludge. However, the continuous exposure to the toxicity of free cyanide progressively increase its
toxicity over time (Kim et al. 2011). Also benzene, toluene and xylene affect nitrification activity, mainly the
ammonia oxidizing bacteria (Zepeda et al. 2006). In literature, opposite effects of volatile fatty acid on nitrite
oxidation have been reported (Eilersen et al. 1994; Oguz et al. 2007). A selective inhibition of nitrite oxidation
can be achieved using chlorate (Xu et al. 2011). High chloride concentration were used to select ammonia
oxidizing bacteria over nitrite oxidizing bacteria (Chen et al. 2003). Allylthiourea ATU (86µM) is an inhibitor of
the aerobic ammonia oxidation while sodium azide (50µM) is an inhibitor of aerobic nitrite oxidation, both used
in research studies to inhibit AOB and NOB, respectively (Ginestet et al. 1998).
Chapter 1
24
2.2. Ammonium oxidation by archaea
The aerobic oxidation of ammonia is a central bioprocess in the nitrogen cycle coupling ammonia production
from mineralization of organic matter with denitrification process. Over a century from their discovery, bacterial
nitrifiers were assumed to be the only microorganisms capable of the autotrophic nitrification. Recently, it was
demonstrated that also Archaea are involved in the aerobic nitrification as well as bacteria. For years,
microbiologists characterized the Archaea as obligate extremophiles, that are able to live in environments too
harsh for other organisms, i.e. sulphur- metabolizing thermophiles. The first observation of nitrification in the
Archaea was reported by Könneke et al. (2005), who isolated a marine Crenarchaeote, Nitrosopumilus
maritimus, that grows chemolithoautotrophically by aerobically oxidizing ammonia to nitrite, suggesting that
nitrifying marine Crenarchaeota may be important to the global carbon and nitrogen cycles. 16S rRNA
phylogeny places this organism firmly in the Group 1.1a Crenarchaeota. Ammonia Oxidizing Archaea (AOAs)
contain putative ammonia mono-oxygenase genes amoA, amoB and amoC (Francis et al. 2007). Nevertheless, in
the analysis of genome, hydroxylamine oxidoreductase (HAO) was not identified, indicating that other different
mechanism than known for AOBs occurred (Hallam et al. 2006). AOAs are predominantly autotrophic but
facultative and like heterotrophs Crenarchaeote are able to use solved organic carbon, such as amino acids, as
carbon source (Herndl et al. 2005).
Other two Archeaea species were detected able to perform the aerobic oxidation of ammonia: “Candidatus
Nitrososphaera gargensis” (usually detected in soils), and “Candidatus Nitrosocaldus yellowstonii”. The amoA
genes had been used to detect aerobic ammonia oxidizing Archaea (AOA) in natural samples. However, the
amoA gene of AOB and AOA are distantly related, and different PCR primer sets are used for the AOB and AOA
detection. AOAs are found to thrive in various habitats including hot/thermal springs, marine and fresh waters,
marine sponge, agriculture soils, estuarine sediments and wastewater treatment systems (Francis et al. 2007; You
et al. 2009a). Phylogenetic analysis of several hundred archaeal amoA sequences revealed diverse and distinct
AOA communities which can be associated with different habitats and sampling sites, with little overlap between
water columns and sediments. In the natural environments, AOBs and AOAs co-occurr and AOAs appear to be
much more abundant than AOBs in the ocean and in soils (Leininger et al. 2006; Mincer et al. 2007). However,
the mechanisms of the competition are not completely understood, yet. In particular ammonia concentrations
could be the major selection pressure of one species over the others. For example, AOBs grow in agricultural
soil, with high concentrations of ammonium, which are typical of mineral fertilization strategies (100 – 1000 mg
L -1) (Nicol et al. 2011). On the contrary, AOAs were observed in soil with particular low ammonium
concentration (Offre et al. 2009). While AOBs typically grown in media in the range of 20 – 350 mg TAN L-1
and concentration lower than 1 mg TAN L-1 are limiting, AOAs grow in media containing 7 - 20 mg TAN L-1
(Koops et al. 2003). Ammonium concentrations higher than 40 mg TAN L-1 cause the inhibition of the AOAs
(Hatzenpichler et al. 2008). Other studies, suggest that AOAs are well adapted to grow in the nutrient limiting
(oligotrophic) environment (Martens-Habbena et al. 2009). Nevertheless, AOA could also adapt to higher
ammonia concentrations.
Archaeal ammonium-oxidizer amoA sequences have been found in some wastewater treatment plant (Park et al.
2006; Zhang et al. 2009). Cao et al. (2011) and Park et al. (2006) used PCR primers targeting archaeal amoA
genes to retrieve and compare 75 sequences from the activated sludge of WWTPs across the US. 50 of 75
sequences were archaeal amoA sequences The presence of AOAs appeared in WWTPs operating at low DO
concentrations for simultaneous nitrification and denitrification and high Sludge Retention Time (SRT) (Cao et

Chapter 1
25
al. 2011). AOAs were also detected in wetland systems (You et al. 2009a; Wang et al. 2011a; Sims et al. 2012).
In particular, Sims et al. (2012) showed a strong correlation between the abundance of AOAs and AOBs and
nitrification activity in wetland soils. The results suggested that AOAs are more persistent and more abundant
than AOB in the nutrient-depleted (oligotrophic) wetlands. The authors investigated the seasonal and spatial
distributions of AOB and AOA. AOAs were detected both in the top soil and in the water. AOB were more
sensitive to low temperature than AOA. Finally, the results confirmed that ammonium concentrations is one of
the major factor influencing AOA and AOB population in wetlands, although other factors such as temperature,
dissolved oxygen, and soil organic matter are involved. Recently, the cooperation between marine anammox
bacteria and ammonia- oxidizing archaea in a laboratory-scale model system under oxygen limitation was
succesflul demostrated (Yan et al. 2012).

Chapter 1
26
2.3. Denitrification
The denitrification activity was observed in the late nineteenth century, when nitrogen losses in agriculture
soil were noticed. In 1875, Meusel associated microorganisms with nitrogen losses (Meusel 1875). Gayon and
Dupetit (1882) introduced the term of denitrification and the modern era of studies of the nitrate and nitrite
reduction. Denitrification involves the reduction of the oxidised forms of nitrogen –nitrate (NO3-), nitrite (NO2
-),
nitric oxide (NO) and nitrous oxide (N2O)– into dinitrogen gas (N2). This process is used as an alternative to the
oxygen respiration, under low oxygen or anoxic conditions (Sørensen 1978). Heterotrophic denitrification has
been considered for a long time to be the only anoxic process contributing significantly to the loss of inorganic
nitrogen, playing a fundamental role both in oceanography and wastewater treatment.
The sequential production of intermediates via a linear pathway of four reductive steps was first proposed by
Payne (1973) and has been widely accepted (Eq. I-26):
3 2 2 2NO NO NO N O N− −→ → → → Eq. I-26
2.3.1 Stoichiometry of denitrification
The main pathways of denitrification can be summarized by the following nitrate and nitrite reduction
reactions (Eq. I-27 - Eq. I-28).
3 220.2 1.2 0.1 0.6heterotrophicNO HH e N O− + −+ + →+ +
Eq. I-27
2 220.34 1.36 0.17 0.68heterotrophicNO HH e N O− + −+ + →+ +
Eq. I-28
Denitrification process and, in particular, the reduction of nitrate and nitrite could be accomplished with a
variety of electron donors and carbon sources, such as: methanol, acetate, glucose, ethanol (Constantin and Fick
1997; Adav et al. 2010). Methane was recently used by Modin et al. (2007), while Elefsiniotis et al. (2004)
investigated the use of volatil fatty acid (acetic, butyric and propionic acid) from an acid-phase digester effluent.
A widespread use of methanol (CH3OH) had been gained, as it was a relatively inexpensive external carbon
source. The combined dissimilation and synthesis equations for denitrification via nitrate and via nitrire, using
methanol as an electron donor, are following reported (Eq. I-29 - Eq. I-30) (Ahn 2006):
3 2
2
3 3
5 7 2 2 3
1.08 0.24
0.056 0.47 1.68
NO H O
H
CH OH C
C H O N N O HCO
−
−
+ +
→ + + +
Eq. I-29
2 2
2
3 3
5 7 2 2 3
0.53 0.67
0.04 0.48 1.23
NO H O
H
CH OH C
C H O N N O HCO
−
−
+ +
→ + + +
Eq. I-30
In these equations, the theoretical methanol requirement for nitrate reduction to dinitrogen gas, considering
the synthesis requirement, is 2.46 mg CH3OH per mg NO3-N, corresponding to 1.7 mg COD mg NO3-N-1. The
methanol requirement for nitrate reduction to dinitrogen gas is 1.21 mg CH3OH per mg NO2-N. Considering the
acetate (CH3OOH) instead of methanol as carbone source for the whole denitrification process, the requirement
of acetate is 2.67 mg CH3OOH per mg NO3-N, corresponding to 2.86 mg COD mg NO3-N-1.
Expressed as volatile suspended solids (SSV), the growth yield for heterotrophic denitrifiers is 0.45 mg cell
per mg NO3-N reduced, using methanol and 0.67 mg cell per mg NO3-N reduced using acetate. Finally, in the
denitrification process, alkalinity is produced. Approximately 1 mol of bicarbonate (HCO3-) is produced for

Chapter 1
27
every mole of nitrate or nitrite reduced, resulting in 3.57 mg of alkalinity as CaCO3 for every mg of nitrate or
nitrite reduced.
2.3.2 Mechanisms of denitrification
A number of thorough reviews have been published during the last years discussing the biology and
molecular basis of the denitrification (Knowles 1982; Zumft 1997; Philippot 2002; Kraft et al. 2011).
Denitrification can be seen as the assemblage of nitrate (NO3-) respiration, nitrite (NO2
-) respiration
combined with nitric oxide (NO) reduction and nitrous oxide (N2O) respiration. The three respiratory complexes
maintain a certain degree of independence, thus, denitrification is best described as a modular organization
(Zumft 1997). In each reaction of the denitrification process, the oxidised nitrogen substrates serve as an electron
acceptor in the subsequent respiration usually coupled to the oxidation of organic compounds, which are used as
electron donors for energy generation. Denitrification pathways are now also well‐ characterized on the
enzymatic level (Berks et al. 1995; Zumft 1997). Each step of denitrification is carried out by specialized
enzymes: nitrate reductase (nar - narG, narH, narI or nap- napA, napB), nitrite reductase (the copper‐containing
nirK and the cytochrome c‐type nirS), nitric oxide reductase (nor -norB, norC, norZ) and nitrous oxide reductase
(nosZ).
In denitrification, the reduction of nitrate (NO3-) to nitrite (NO2
-) is catalyzed by the membrane bound
complex nitrate reductase (nar), which could be also present in several non-denitrifying bacteria (Zumft 1997;
Kraft et al. 2011). In addition, in some denitrifying bacteria, the nitrate reduction step in the denitrification
process is not dependent on the presence of nar gene but on a periplasmic nitrate reductase gene (nap) (Bedmar
et al. 2005). The reduction of nitrite (NO2-) to nitric oxide (NO) is catalyzed by two isofunctional periplasmic
enzymes, which are evolutionary unrelated: a copper-containing enzyme, nirK, and a cytochrome c‐type nirS
(Zumft 1997; Kraft et al. 2011). The product of nirS and nirK is nitric oxide (NO), that is a radical which reacts
with many other molecules. It is now well accepted that the reduction of nitric oxide (NO) to nitrous oxide (N2O)
is catalyzed by the membrane bound nitric oxide reductase (nor) (Zumft 2005; Kraft et al. 2011). Finally, the last
of the four enzymes required for the complete denitrification is the multicopper enzyme nitrous oxide reductase,
nos, that reduce nitrous oxide (N2O) to dinitrogen gas (N2). Nos gene could be either a periplasmic or a
membrane bound enzyme depended on the bacteria (Kraft et al. 2011). However, also other non-denitrifying
microorganisms use nitrous oxide as electron acceptor and reduce NO to dinitrogen via nos (Zumft,1997).
Dinitrogen gas is the main end product of denitrification while the nitrogenous gases (nitric oxide and nitrous
oxide) are obligatory and free intermediates. Nevertheless, these gases may be released as end products when
denitrification is not complete. Thus, denitrification could be also a source of environmental trouble, as it may
produce N2O emissions, that is a powerful greenhouse gas.
Factors influencing the N2O production during denitrification have been identified in the literature, related to
an imbalanced activity of nitrogen-reducing enzymes. Wunderlin et al. (2012) confirmed that in anoxic
conditions, N2O emission is low under optimal growth conditions for heterotrophic denitrifiers (e.g. no oxygen
input and no limitation of readily biodegradable organic carbon). Limited carbon substrate may lead to an
incomplete denitrification and a N2O production (Itokawa et al. 2001). Further, N2O can also be released in high
quantities under low oxygen conditions (Noda et al. 2003). Indeed, denitrification also occurs in the presence of
oxygen (Bell et al. 1990). Dissolved oxygen acts as an inhibitor of N2O reductase, nos (Bonin 1996; Baumann et
al. 1997; Wunderlin et al. 2012). N2O reductase is more sensitive to oxygen than the other enzymes. Therefore,

Chapter 1
28
aerobic denitrification is often incomplete. An increase in N2O formation has been observed when conditions
switch from anaerobic to aerobic (Frette et al. 1997). In addition, several authors have shown that high nitrite
concentrations lead to a lower denitrification rate and N2O emissions (Von Schulthess et al. 1994; Wunderlin et
al. 2012). This may be due to the inhibition of N2O reductase by NO or NO2.
Over denitrification, also other processes could be involved in N2O emission under low oxigen concentration.
Tallec et al. (2008) reported that below 0.3 mg O2 L-1, heterotrophic denitrification appeared to be the major
process responsible for the N2O emission, while from 0.4 to 1.1 mg O2 L-1, N2O emissions were due to two
processes: (i) heterotrophic denitrification (40%) and autotrophic nitrifier denitrification (60%).
2.3.3 Phylogeny
Denitrification occurs in natural aqueous habitats (Trevors and Starodub 1987; Gao et al. 2009), in
engineered systems (Wiesmann 1994) and in soil (Trevors 1985). Denitrification is carried out by a wide
diversity of bacteria as well as by archaea and fungi (Focht and Verstraete 1977; Kobayashi et al. 1996;
Philippot 2002). The denitrification pathway in archaea (Philippot 2002; Cabello et al. 2004) and some
eukaryotes (Risgaard-Petersen et al. 2006) is much less understood than in bacteria.
However, denitrifiers are somewhat more frequent within the phylum proteobacteria (alpha, beta, gamma, and
epsilon divisions), although there is no an identifiable pattern of their distribution (Zumft 1997; Kraft et al.
2011). Among the gram-negative proteobacteria, there are the H2 oxidizing Pseudomonas (γ- proteobacterium),
the aerobic and H2 oxidizing Paracoccus (α- proteobacterium) and the lithotrophic sulfur oxidizing Thiobacillus
(β- proteobacterium) which can degrade complex or toxic natural and synthetic organic compounds. Among the
N-fixation bacteria, denitrification was detected in Alcaligenes (aerobic β-proteobacterium), in Azospirillum,
Magnetospirillum, Bradyrhizobium and Rhizobia (α-proteobacteria) and Azoarcus (β-proteobacterium). Azoarcus
tolulyticus is a N-fixation bacteria which degrades toluene and exhibits the complete denitrification (β-
proteobacterium). On the contrary, Azoarcus evansii degrades a variety of monoaromatic compounds under
denitrifying conditions but is unable to use toluene. However, denitrification and N-fixation can proceed
concomitantly. Among the denitrifiers Pseudomonads, N-fixation strains have been reported for P. fluorescens,
some P. stutzeri and P. pseudoflava. Among the photosynthetic denitrifying bacterium, Rhodobacter sp (α-
proteobacterium) were identified.
Anoxic-microaerophilic denitrification. Most denitrifiers are heterotrophic organisms which use an organic
carbon source to reduce nitrate and nitrite to dinitrogen gas. In heterotrophs, a wide range of organic substrates is
known to support denitrification: glycerol, acetic acid, lactic acid (Akunna et al. 1993) methanol (Akunna et al.
1993; Kalyuhznaya et al. 2009), sugars and alcohols, diverse complex organic molecules (Burford and Bremner
1975), wastewater organic carbon (Gayon and Dupetit 1886; Matějů et al. 1992), aromatic hydrocarbons (Rabus
and Widdel 1995, 1996), to name a few. Generally denitrification is nearly exclusively a facultative anaerobic or
microaerophilic process. However, metagenomic studies on uncultivated bacteria suggested that nitrate
respiration could be also performed by strictlpy anaerobic lifestyle bacteria (Walsh et al. 2009).
Aerobic denitrification. The complete aerobic denitrification at high dissolved oxygen (DO) concentrations
may also occurr and it is well reviewed (Zumft 1997; Ahn 2006). Most aerobic denitrifiers are heterotrophic
organisms, such as the Paracoccus species (Ludwig et al. 1993). Magnetospirillum magnetotacticum is also a
bacterium that denitrifies only under microaerophilic but not under anaerobic conditions, consuming oxygen
Chapter 1
29
(Bazylinski and Blakemore 1983). Also Pseudomonas stutzeri reduced nitrate to nitrogen gas without nitrite
accumulation under aerobic conditions (Su et al. 2001).
A variety of molecular methods have been applied to investigations of denitrifying genes in natural
environments as reviewed by Wallenstein et al. (2006). Due to the enormous diversity, abundance and
widespread distribution of denitrifying microorganisms, the detection of denitrifiers requires the use of
functional genes rather than 16S ribosomal RNA (rRNA) genes (Kraft et al. 2011). The expression of narG,
napA, nirS, nirK and nosZ in different environments had been investigated (Philippot et al. 2001; Nogales et al.
2002; Throbäck et al. 2004) using different microbial techniques, i.e PCR and FISH. The nitrite reductase genes
nirS and nirK have frequently been used as marker genes for denitrifying bacteria in environments samples
(Braker et al. 1998; Pratscher et al. 2009), such as estuarine sediments (Bulow et al. 2008), sea (Ward et al.
2009), and activated sludge (Pratscher et al. 2009; Zafiriadis et al. 2011). Nevertheless, Philippot (2002) showed
that the phylogeny of nir and nor genes, coding for the key enzymes nitrite reductase and NO reductase in the
denitrification pathway, does not always agree with the phylogeny of the 16S rRNA gene. In their study on
denitrification, Cuhel et al. (2010) suggested that counting functional genes is not sufficient for a comprehensive
understanding of how denitrification is developing. Today, the identification of relevant environmental
denitrifiers in situ remains a challenge (Kraft et al. 2011).
2.3.4 Bioinformatics
Genomes size among denitrifying genera varies within a wide range. Among the highest, there is the genome
of Bradyrhizobium japonicum (8.7 Mb) (Kündig et al. 1993), while, among the lowest, there is the genome of
Neisseria gonorrhoeae (2.2 Mb) (Dempsey and Cannon 1994). Different data were obtained for Pseudomonas,
resulting in 5.9 Mb for P. aeruginosa PAO (Holloway et al. 1994), 6.5 Mb for P. aeruginosa C (Schmidt et al.
1996), 6.63 Mb for P. fluorescens SBW25 (Rainey and Bailey 1996) and 4.3 Mb for P. stutzeri. Among the
other, genes related to the NO3-, NO2
-, NO and N2O reduction were identified (Zumft 1997).
2.3.5 Kinetics
Denitrification is a four-step process (NO3-→NO2
-→NO→N2O→N2). Usually, it is modeled as one or two
step model (NO3-→NO2
-→ N2.) as the production of NO and N2O does not contribute significantly to the total
mass –flow of nitrogen in the biological system. Recently, N2O modeling has received attention as N2O is a
powerful greenhouse gas. Most models only consider N2O production by denitrifying microorganisms. A three-
step denitrification model including the reduction of nitrate, nitrite and nitrous oxide has been formulated by von
Schulthess et al., (1994). Samie et al., (2011) considered as a four-step denitrification process, based on ASM1,
to simulate soluble N2O production by heterotrophic denitrifying biomass and estimate the gaseous emissions
from the reactors.
Further, different denitrification rate can be considered, depending on the organic source type. Mainly, two
organic sources come from the wastewater, i.e. readily biodegradable organic (RBCOD) and slowly
biodegradable organics (SBCOD). A third source is the slowly biodegradable organic generated by the biomass
itself through death and lysis of organism mass (the endogenous mass loss/respiration) that is utilized in the
same way as the wastewater SBCOD, but recognized separately. The RBCOD can be used at a high rate, using
Chapter 1
30
the Monod equation. The SBCOD must be first broken down (hydrolysed) and then utilized. The SBCOD
hydrolysis rate is slow and forms the limiting rate in the utilization of SBCOD (Ekama and Wentzel 2008).
2.3.6 Factors involved in denitrification kinetics
Scientists have investigated the factors controlling denitrification in an attempt to better understand the
process. Many studies have been focalized on the roles of NO3- availability, O2, and pH in controlling
denitrification process both in aquatic and in soil systems. There is a large diversity of bacteria, archaea, and
fungi capable of denitrification, and their community composition depends on the long-term environmental
drivers (Wallenstein et al. 2006). Thus, the denitrifying community may differ in physiology, and environmental
tolerances to pH, Temperature (T) and oxygen (O2). Growth rate, and enzyme kinetics could vary.
The rate of denitrification processes generally increases exponentially with increasing temperature. Most of
the studies of the effect of temperature on denitrification have been carried out with soil in which there appears
to be a marked temperature dependence. This is in contrast to aquatic sediments where lower temperature
variation can be measured and controlled (Heinen 2006). Low temperatures, caused by seasonal changes, affect
denitrification by reducing the microbial growth rate and decreasing the rate of biologically-mediated reactions
(Madigan and Martinko 2006). Mckenney et al. (1984) successful applied the Arrenhius type equation to study
the kinetic of several denitrification steps in the temperature range of 5 to 25°C in soils. However above 60 -
75°C, a rapid decline of denitrification activity was observed both in soil and in aquatic systems (Knowles
1982). Several authors investigated denitrification at temperature lower than 20°C (Welander and Mattiasson
2003; Elefsiniotis et al. 2004). Further, low temperatures exacerbate the effects of inhibitory compounds (Hajaya
et al. 2011).
Experiments on the effect of pH on denitrifiers activity in soils have clearly showed that pH has a remarkable
effect on denitrification (Cuhel et al. 2010). In general, denitrification rate increases with increasing pH values
up to the optimum pH, while the N2O emmission decreases. A clear optimum in denitrification rate exists around
pH=7 to 7.5, and denitrification almost ceases for pH values of 4 or 10 (Heinen 2006). At low pH values, the
nitrous oxide reductase, which reduces N2O, is progressively inhibited such that the overall rate of denitrification
decreases and the mole fraction of N2O produced increases. Glass and Silverstein (1998) showed that
denitrification activity on an activeted sludge was significantly inhibited at pH of 6.5- 7. At higher pH (pH 7.5 –
9), denitrification was achieved with a high nitrite accumulation. The pH also regulate the chemical compounds
equilibria. Abeling and Seyfried (1992) concluded that FNA inhibited denitrifiers. The toxicity threshold in their
study was reported to be 0.04 mgHNO2-N L-1 on activated sludge. Ma et al. (2010) revealed that FNA exhibited
a similar inhibitory effect on nitrate and nitrite reducers. The nitrate and nitrite reduction activities were reduced
to 40% in the FNA concentration range of 0.01-0.025 mgHNO2-N L-1 and completely stopped at the FNA
concentration of 0.2 mgHNO2-N L-1.
However, some denitrifiers lack key enzymes to obtain a complete denitrification. The lack of some enzymes
can determine the production and the accumulation of free intermediates. Accumulation of nitrite has been often
observed in denitrification systems, both in soil and aquatic environments (Betlach and Tiedje 1981). Nitrite
accumulation may result from nitrate inhibition of nitric oxide reductase (Payne 1973). On the contrary, Betlach
and Tiedje (1981) reported that nitrate did not inhibit nitrite and nitrous oxide reduction. The accumulation of
nitrite seemed to depend on the relative rates of nitrate and nitrite reduction. Bilanovic (1999) obtained
denitrification under high nitrate concentration (500-750 mg NO3--N L-1). Nitrite accumulation was only

Chapter 1
31
observed initially but its concentration decreased with time, reaching zero when acetate or anaerobic digester
effluent was used as carbon source. However nitrite accumulation limits the expression of nar (nitrate-), nir,
(nitrite) and nos (nitrous oxide) reductase (Glass et al. 1997). Adav et al. (2010) studied the capacity of
supplementary carbon sources (acetate, methanol, and ethano) on the nir enzyme reactivation.
Both the synthesis and activity of nitrate reductase (nar) are inhibited by oxygen. Nitrous oxide reduction,
carried out by nitrous oxide reductase (nos), is more sensitive to oxygen inhibition than the other steps in
denitrification (Krul and Veeningen 1977). The nitrous oxide reductase is inhibited by DO concentrations less
than 0.2 mg/L (Kumar and Lin 2010).
The availability of electrons in organic carbon compounds is one of the most important factors controlling the
activity of the heterotrophs. As can be observed from denitrification stoichiometry, for a complete denitrification
an influent COD/NO3--N ratio over 2.86 is required. Experience suggests a COD/N ratio over 7 would be
appropriate. Moreover, the influence of the type of carbon source on the denitrification rate have been widely
studied. Constantin and Fick (1997) showed that the specific denitrification rate obtained using acetic acid was
higher than that measured using ethanol, as acetic acid is a directly assimilable carbon source while the ethanol
must be first changed into acetate. Further, Akunna et al. (1993) showed that using acetic and lactic acids media
the nitrate/nitrite reduction was essentially denitrification activity, while ammonium production by DNRA
occurred using glucose and glycerol media.
Production of N2O can be obtained by heterotrophic denitrifiers, when an imbalanced activity of nitrogen-
reducing enzymes occur (Wunderlin et al. 2012), e.g. due to oxygen inhibition (Baumann et al. 1997; Lu and
Chandran 2010), nitrite accumulation (Von Schulthess et al. 1994), as well as a limited availability of
biodegradable organic compounds (Itokawa et al. 2001).
Brunet and Garcia-Gill (1996) showed that at extremely low concentrations of metal sulfides, nitrate was
reduced via denitrification whereas at higher metal sulfides concentrations, reduction to ammonia (DNRA) and
incomplete denitrification took placed. Finally, the reductase enzymes involved in denitrification are susceptible
to inhibition by a variety of compounds, such as pesticide, azide, cyanide, acetylene, nitrapyrin (nitrification
inhibitor) and sulfur compound (Knowles 1982). Chloramphenicol is an antibiotic, used as inhibitor of
denitrification process in research studies (300 mg L-1). It acts inhibiting the formation of the peptidic bonds for
the proteins synthesis (Brooks et al. 1992).

Chapter 1
32
2.4. Heterotrophic nitrification and Nitrifiers denitrification
Among autotrophic nitrifiers and heterotrophic denitrifiers which perform nitrification and denitrification
respectively, other organisms participate to the nitrogen cycle (Stein 2011).
Heterotrophic nitrification. Aside the autotrophic nitrifying bacteria, several heterotrophic bacteria are
capable to oxidize ammonia (Van Niel et al. 1993), hydroxylamine (Ralt et al. 1981), organic nitrogen
compounds (Castignetti and Hollocher 1984) to nitrite and nitrate: This process is termed, in literature, as
heterotrophic nitrification while the bacteria responsible are called heterotrophic nitrifiers. Many heterotrophic
nitrifiers are also able of aerobic denitrification, such as Thiosphaera pantotropha (Robertson and Kuenen
1988). Thus, the nitrite and nitrate produced during the heterotrophic nitrification are immediately reduced to N-
oxides or dinitrogen gas via denitrifies enzymes. This is the so-called simultaneous nitrification-denitrification
process.
Autotrophic denitrification. On the contrary, many autotrophic bacteria are capable to utilize inorganic
compounds as electron donors, such as sulfur compounds (Beijerinck 1920), hydrogen, ferrous iron (Straub et
al., 1996), arsenite (Sun et al., 2008), or nitrite (De Bruijn et al. 1995) to produce N2, both in anoxic and micro-
aerobic conditions. T. pantotropha is a facultatively anaerobic, autotrophic sulfur bacterium (Robertson and
Kuenen 1984). Thiobacillus denitrificans is a widely distributed and well-characterized obligate
chemolithoautotrophic bacterium, which is able to couple the oxidation of inorganic sulfur compounds (such as
hydrogen sulfide and thiosulfate) to denitrification. The oxidation of Fe(II) is also coupled to a complete
denitrification (Straub et al. 1996; Blöthe and Roden 2009).
Among the other, the denitrifying nitrifiers can play an important role. Initially, the nitrifying bacteria
seemed to be excluded from being considered denitrifiers, as they are involved in the aerobic branch of the N
cycle. Using 15N as a tracer, evidence of denitrifying activity by Nitrosomonas species have been reported,
producing N2O from nitrite. Indeed, hydroxylamine is an intermediate in the oxidation of ammonia to nitrite. In
the absence of oxygen, hydroxylamine can be oxidized with nitrite as electron acceptor, while nitrous oxide is
produced (De Bruijn et al. 1995). Nitrosomonas eutropha is an obligate lithoautotrophic nitrifying, but under
anaerobic conditions could be stimulated by the presence of nitrogen oxide and acts as a denitrifying organism,
using hydrogen as the electron donor and nitrite as the electron acceptor (Schmidt and Bock 1997b). N. europaea
also produce N2O in the denitrification process (Poth and Focht 1985b). The denitrifying nitrifiers
microorganisms are mainly detected in bioreactors which have a combination of aerobic and anaerobic ammonia
oxidation, as denitrifying nitrifiers operate under aerobic conditions during ammonia oxidation but they are
enhanced under micro-aerobic condition, while anaerobic conditions are required for the growth of some of
denitrifying nitrifiers (Stein 2011). Denitrifying nitrifiers were also detected at elevated nitrite concentration
(Colliver and Stephenson 2000).

Chapter 1
33
2.5. Anammox - Anaerobic Oxidation of Ammonium
Ammonium oxidation was long assumed to be a strictly aerobic process. However, based on thermodynamic
calculations, in 1977, Broda proposed the existence in nature of lithotrophic organisms that could derive their
energy for growth from the oxidation of ammonium using nitrite as electron acceptor and producing dinitrogen
gas (Broda 1977). In the early 1990s, anaerobic ammonium oxidizing (anammox) bacteria were discovered in a
denitrifying bioreactor and patented (Mulder 1992). Later, experiments with labeled 15NH4+ and unlabeled NO2
-
confirmed that N2 was generated by anammox reaction (Mulder et al. 1995). As illustrated by Kuenen (2008),
this discovery led to the realization that a substantial part of the nitrogen losses in the marine environment were
due to the activity of these bacteria, as well as the denitrification process. Considering both the reduction of
costs of ammonium removal from wastewaters and the reduction of CO2 emission, the anammox process was
further proposed as an innovative and sustainable wastewater treatment for nitrogen removal (Jetten et al. 1997).
Until now, many research groups studied and are studying various microbial and industrial aspects of the
anammox process.
2.5.1 Stoichiometry of Anammox
Several basic studies investigated the stoichiometry of the anammox reaction based on mass balance over
anammox enrichment cultures. Under steady state condition, ammonium, nitrite and bicarbonate are converted
according the following catabolic and anabolic reactions (Eq. I-31 - Eq. I-32), respectively. The overall reaction
is expressed in the Eq. I-33 (Strous et al. 1998):
4 2 2 22AnammoxNH NO N H O+ −+ → + 1' 358 G kJ mol−∆ ° = − Eq. I-31
2 2 2 2
3 2
3
0.5 0.15
0.26 0.26
0.26
0.066 0.033 0.066
0.066Anammox
H O NO NO
NO H O
CO HCO
C N
− −
−
−+ → ++
→ + Eq. I-32
4 2 3
2 2 0.5 0.15 3 2
1.32 0.13
0.066
0.066
1.02 0.26 2.03
AnammoxNH NO O H
N CH O NO H O
HC
N
+ − − +
−
+
+ +
+ + →
+ Eq. I-33
The anammox reaction is associated with a considerable release of Gibbs free energy and is mediated by a
group of microorganism associated with the phylum of Planctomycetes. The main product of the anammox
process is dinitrogen gas, but about 10% of the nitrogen feed is converted to nitrate. The overall nitrogen balance
gave a ratio of ammonium to nitrite conversion of 1:1.32 and a ratio of nitrite conversion to nitrate production of
1:0.26. Nitrate production is a fundamental part of anammox reaction and has be used to measure the growth of
anammox bacteria, at it is only involved in the anabolic reaction (Eq. I-32). NO2-N/NH4- N and NO3
-N/NH4- N
ratios which differ from the stoichiometric values reported above, have been found in some systems, indicating
the co-occurrence of other biological processes, such as denitrification or DNRA under anoxic conditions (Strous
et al. 1999b; Ahn et al. 2004) and nitritation under micro-aerobic conditions (Third et al. 2001).
Bicarbonate is utilized as the sole carbon source for the synthesis of biomass (CH2O0.5N0.15), as this
microorganisms are autotrophs. Nitrite can act as electron acceptor in the energy generating reaction (Eq. I-31)
as well as electron donor for the CO2 reduction to biomass, producing nitrate (Eq. I-32). Approximately 1 mol of
bicarbonate (HCO3-) is consumed to oxidize 15 mol of ammonium, resulting in 0.23 mg of alkalinity as CaCO3
for every mg of nitrogen ammonium. The alkalinity consumption is significantly lower than the requirements of
nitritation process. However, in anammox reaction hydrogen ions are consumed and a pH decrease of the system

Chapter 1
34
can be detected. In anammox stoichiometric equations, are required about 0.066 mol of fixed carbon per mol of
ammonium and 0.05 mol of fixed carbon per mol of nitrite. Although the energy yield from anammox catabolic
reaction is similar to the energy of AOB, the maximum specific growth rate of anammox bacteria is lower, with
value between 0.054-0.2 d-1 (Strous et al. 1999b; Van Der Star et al. 2008). Expressed as volatile suspended
solids (VSS), growth yield for anammox bacteria is 0.11 mg cell per mg NH4-N oxidized. Expressed as chemical
oxygen demand (COD), growth yield is 0.08 mg COD per mg NH4-N oxidized. The decay rate of anammox
bacteria is also low. It is estimated one order of magnitude lower that the maximum growth rate, in the range of
0.001 – 0.008 (Koch et al. 2000a; Dapena-Mora et al. 2004; Scaglione et al. 2009).
2.5.2 Mechanisms of anaerobic ammonia oxidation
The biochemistry of the anammox bacteria is very complex and only recently almost resolved. Initially it was
conceived that anammox process involved the turnover of hydroxylamine (NH2OH) and hydrazine (N2H4) as
intermediates (Van de Graaf et al. 1997). In the original model, it was proposed that hydroxylamine was the true
intermediate that would combine directly with ammonium to form hydrazine. In this case, hydroxylamine would
have to be formed directly from nitrite (NO2-) or nitric oxide (NO). The conversion of hydrazine to dinitrogen
gas was postulated as the reaction generating the electron equivalents for the reduction of nitrite to
hydroxylamine (Jetten et al. 1999). The model consisted in three subsequent steps: (i) the four-electron reduction
of nitrite to hydroxylamine; (ii) the condensation of the hydroxylamine with ammonium to hydrazine; and (iii)
the oxidation of hydrazine to dinitrogen gas (Van de Graaf et al. 1997; Jetten et al. 2001) (Fig. I.11).
An analysis of the genome revealed the apparent lack of a nitrite-hydroxylamine oxidoreductase and the
presence of a nitrite-nitric oxide oxidoreductase, nirS, in the genome of K. stuttgartiensis. In addition, anammox
bacteria are characterized by a separated membrane–bound compartment, termed “anammoxosome”, which
contains large quantities of a hydroxylamine oxidoreductase (HAO)-like enzyme (Schalk et al. 2000). HAO-lime
enzyme was postulated to be responsible for the oxidation of hydrazine to N2 gas. HAO can oxidize both
hydroxylamine and hydrazine. However, a recent work has revealed that the anammox organisms not only
expresses the HAO enzyme in high concentrations, but also encodes a true hydrazine-oxidizing enzyme (HZO)
(Shimamura et al. 2007), which has a significantly higher affinity for hydrazine than HAO and is strongly
inhibited by hydroxylamine. Thus, the postulated pathway for energy metabolism and hydrazine formation was
modified. A plausible alternative three steps cyclic pathway was suggested (Kartal et al. 2011): (i) the one-
electron reduction of nitrite to nitric oxide (NO) by nirS; (ii) the condensation of one molecule of NO with one
molecule of the ammonium with the concomitant input of three electrons generating hydrazine; and (iii) the
oxidation of hydrazine, catalyzed by HZO, yielding four electrons and dinitrogen gas as the end product. Kartal
and coauthors have recently proposed the biochemical pathway and enzymatic machinery of “Ca. K.
stuttgartiensis”, resolving the genes and proteins central to anammox metabolism (Fig. I.12). A set of three
redox reactions (Eq. I-34 - Eq. I-36) involving N2H4 and nitric oxide (NO) was proposed to explain the overall
anammox stoichiometry (Eq. I-31):
2 22NO H e N H OO− + −+ + → + Eq. I-34
4 2 4 22 3NO NH N H OH e H+ + −+ + + → + Eq. I-35
2 4 2 4 4N NH H e+ −→ + + Eq. I-36

Chapter 1
35
Several studies showed that anammox bacteria are not strictly lithotrophic but their metabolism is versatile,
as they are able to use a range of organic electron donors and inorganic electron acceptors (Güven et al. 2005;
Strous et al. 2006; Kartal et al. 2007b). Short chain fatty acids, (i.e acetate, formate, propionate) can be
metabolized by anammox bacteria producing ammonium and nitrite from nitrate, completely changing the
stoichiometry described above. This characteristic in future could lead to apply the anammox process for the
treatment of nitrate rich wastewaters using limited amounts of organic material (Kartal et al. 2007b).
Fig. I.11 Past postulated mechanism of anaerobic ammonium oxidation. NR is a nitrite-reducing enzyme and NH2OH is the assumed product; HH (hydrazine hydrolase) condenses hydrazine out of ammonia and hydroxylamine; HZO is a hydrazine-oxidising enzyme (which might be equivalent to hydroxylamine oxidoreductase, HAO). Picture from Jetten et al. (2001).
Fig. I.12 Current biochemical pathway and enzymatic machinery of K. stuttgartiensis.
The anammoxosome, an intracytoplasmic compartment bounded by a membrane (grey line), is the locus of anammox catabolism. Identifiers of open reading frames and the degree to which the encoded respiratory protein complexes were detected in the proteome are indicated. Hydrazine synthase depicted in the centre of the figure is also loosely membrane associated. Yellow arrows, electron flow; yellow square, iron–sulphur clusters. Picture from Kartal et al. (2011)

Chapter 1
36
2.5.3 Phylogeny
Strous et al. (1999a), were able, using an isolation strategy based on density gradient centrifugation, to
isolate, from an enrichment culture, bacterial species with a high anammox activity and capable of CO2 fixation
(Strous et al. 1999b). The authors characterized the 16S ribosomal RNA (rRNA) gene of the isolated bacteria,
which was given the status of “Candidatus Brocadia anammoxidans”. 16S rRNA gene phylogeny confirmed that
the organism was a member of Planctomycetes (Strous et al. 1999a). Using the previously developed 16S rRNA
sequences and FISH probes, research efforts resulted in other seven anammox species: “Candidatus Brocadia
fulgida”, “Candidatus Jettenia asiatica”, “Candidatus Anammoxoglobus propionicus”, “Candidatus Kuenenia
Stuttgartiensis”, “Candidatus Scalindua wagneri”, “Candidatus Scalindua sorokinii”, “Candidatus Scalindua
brodae” (Strous et al. 1999a; Schmid et al. 2000, 2003; Kuypers et al. 2003; Kartal et al. 2007b; Quan et al.
2008). As can be seen in Fig. I.13, the identified anammox families and species are characterized by different
evolutionary distances, probably due to their habitats and ecological niches rather than difference in their
physiologies, metabolisms and ultrastructures (Kuenen 2008). Recently, a new divergent Brocadia-like anammox
phylotype has been found in a WWTP, for which the name “Candidatus Brocadia sinica” has been proposed (Hu
et al. 2010; Oshiki et al. 2011).
Anammox bacteria have been found in different environments. As they need the simultaneous presence of
ammonium and nitrite, they can be found near to the aerobic–anaerobic interface of sediments and water bodies,
in marine and fresh aquatic environments and in wastewater treatment plants. As recently reviewed by Trimmer
and Engstrom (2011), anammox bacteria were found in marine or estuarine sediments, deep marine sediments,
shallower coastal sediments (temperate and artic), and oceanic Oxygen Minimum Zones (OMZs), in which the
oxygen saturation is at its lowest level (at at depths of about 200 to 1,000 metres). Anammox process plays an
important role in the global nitrogen turnover.
Isosphaera spp
Gemmata spp
Pirellula spp
Planctomyces spp
Candidatus Brocadia sinica (AB565477)
Candidatus Brocadia anammoxidans (AF375994)
Candidatus Brocadia fulgida (DQ459989)
Candidatus Anammoxoglobus propionicus (DQ317601)
Candidatus Jettenia asiatica (DQ301513)
Candidatus Kuenenia stuttgartiensis (AF375995)
Candidatus Scalindua wagneri (AY254882)
Candidatus Scalindua brodae(AY254883)
Candidatus Scalindua sorokinii (AY257181)
Nitrobacter wino-Outgroup (NR_74324)98
100
100
100
91
80
77
51
93
99100
65
87
88100
0.05 Fig. I.13. A 16s ribosomal RNA-gene-based phylogenetic tree of anammox bacteria, The tree illustrates the relationships of the different families of anaerobic ammonium oxidation bacteria among the Planctomycetes (genera Pirellula, Planctomyces, Gemmata and Isophaera). The triangles indicate phylogenetic groups. The scale bar represents 5% sequence divergence. Adapted from Kuenen (2008)
The “Candidatus Scalindua” family has been found principally, but not exclusively, in marine environments,
such as the Black Sea, the coasts of Namibia, Chile, Peru and, more recently, in a fresh-water lake in western
Tanzania (Kuypers 2005; Schubert 2006; Hamersley 2007). “Candidatus Brocadia” and “Candidatus Kuenenia”
species are the most commonly found organisms in the enrichments from wastewater-treatment plants
(Innerebner et al. 2007; Hu et al. 2010). In a lab scale competition experiments between “Candidatus A.
Chapter 1
37
propionicus” and “Candidatus B. anammoxidans”, the higher capacity of “Candidatus A. propionicus” for
propionate metabolism have been demonstrated, pointing out a defined ecological niche for this organism (Kartal
et al. 2007b).
Up to day several groups of methods are used in detection of anammox bacteria based on their physiological
and biochemical characteristics (Li and Gu 2011). The most commonly used phylogenetic biomarker for
studying anammox communities is the 16S rRNA gene, using different microbial techniques (PCR, FISH).
Usually, amplification of 16S rRNA genes of either planctomycetes or anammox bacteria is usually the first step
for the identification of anammox bacteria in the environment (Kuenen 2008; Jetten et al. 2009). The next step,
over the amplification of 16S rRNA, is the utilize of functional gene targeting anammox bacteria. The hao/hzo
gene has been used as an additional genetic marker for anammox bacteria (Schmid et al. 2008; Hirsch et al.
2011), even if some phylogenetic diversity were found for hao/hzo gene compared to 16S rRNA gene (Li et al.
2010). Another functional genetic marker for anammox bacteria is the anammox cd1 nitrite reductase nirS gene,
which is very different from the nirS sequences of denitrifiers. Currently, PCR primer sets designed for the
amplification of nirS gene of “Candidatus Scalindua spp.” are available (Lam et al. 2009; Li et al. 2011a).
However, further analysis of environmental clones, metagenomes study and genome sequencing of the other
anammox bacteria will be necessary to better identify environmental anammox bacteria diversity (Kraft et al.
2011).
2.5.4 Bioinformatics
The first metagenome of an anammox bacterium came from an enrichment culture of “Candidatus Kuenenia
stuttgartiensis” in 2006 (Strous et al. 2006). The genome stuttgartiensis has been assembled by a metagenomics
approach from a laboratory reactor fed with synthetic wastewater. The genome of “Candidatus Kuenenia
Stuttgartiensis” was almost complete (98.5%) and it is 4.2 megabases, encoding 4663 genes involved in nitrogen
metabolism and substrate uptake reactions, cell carbon synthesis and intermediary anabolism, other catabolic and
anabolic pathways (Strous et al. 2006). The presence of cytochromes makes this bacteria brightly red.
In 2012, the genome of “Candidatus Scalindua profunda” has been assembled by a metagenomics approach
from a marine anammox enrichment culture (Van de Vossenberg et al. 2012). Scalindua bacteria are most likely
a very specialized group that are well adapted to marine environmental conditions. The genome of “Candidatus
Scalindua profunda” encoded 4756 genes, but only about a half of them showed the highest identity to the
“Candidatus Kuenenia stuttgartiensis”, mainly due to the adaptations of Scalindua to the substrate limitation of
the ocean, to salinity and other environmental factors (Van de Vossenberg et al. 2012). The genomes of other
species are underway.

Chapter 1
38
2.5.5 Kinetics
The specific anammox growth rate (µAN) can be expressed by the interactive Monod model for growth which
is used to describe the effect of limiting substrate on microbial growth (Eq. I-37):
Monod – Based growth Kinetic 4 2
, 4 4 , 2 2
MAX NH NOAN AN AN AN
S NH NH S NO NO
S S
K S K Sµ µ= ⋅
+ + Eq. I-37
where µAN is the actual specific growth rate of anammox; µANMAX is the maximum specific growth rate; SNH4
and SNO2 are the NH4+-N and NO2
--N concentrations in the bulk while KS,NH4 AN and KS,NO2
AN are the NH4+-N and
NO2--N half saturation constants for anammox, respectively. Carbon dioxide, the carbon source for anammox
growth, is present in abundance, so that is not taken into account in the kinetic expression. In addition, some
substrates can also inhibit the anammox process, such as nitrite and they could be also included in the kinetic
law. The anammox submodel has been implemented in the two-step nitrification ASM1 described by Wyffels et
al., 2004 (Van Hulle et al. 2003; Dapena-Mora et al. 2004).
2.5.6 Factors involved in nitrification kinetics
Anammon is a promising biological nitrogen removal process with attractive application prospects.
Nevertheless, some studies reported many factors influencing the anammox process. However, these works were
sometimes carried out under very different operational conditions, such as pH and temperature and using
different anammox-type bacteria. Further, both short- and long- term effect have been studied using batch and
continuous tests, entailing that the results of inhibition tests are often difficult to compare and to use in order to
develop an anammox reactor operational strategy. As recently reviewed by Jin et al. (2012), anammox process is
inhibited by a lot of factors which are commonly present in the practical applications: substrates (ammonia and
nitrite), organic matter (nontoxic organic matter and toxic organic matter), salts, heavy metals, phosphate and
sulfide, oxygen. The authors conducted a detailed review of previous researches on the inhibition of the
anammox processes, but more recent works have been published, due to the interest in anammox process. For the
application of avammox process in wastewater treatment plants, the prevention of inhibitions is fundamental,
especially as anammox bacteria are characterized by very growth rates and high doubling time (10 -24 day)
(Strous and Jetten 2004).
Free ammonia and ammonium
Total nitrogen ammonium (TAN) up to concentrations of 1 gTAN L-1 in continuous operation SBR during 1
week do not inhibit anammox process (Strous et al. 1999b). This result was partially confirmed by Dapena-Mora
et al. (2007) in batch tests, who found a 50% inhibition of anammox process at concentration of 770 gTAN L -1.
Further, Jung et al. (2007) observed free ammonia (NH3-N or FA), rather than ammonium itself (NH4+-N) was
the true inhibitor of the anammox process, even at levels as low as 1.7 mgFA L-1. However more recent literature
does not consider FA to be an important parameter at FA concentrations below of 13–38 mg FA L-1 (Waki et al.
2007; Fernández et al. 2012).
Both short- and long-term effects of ammonia on the anammox process have been investigated by Fernández
et al. (2012). In short-term tests, a decrease of 50% in the anammox activity was observed at FA concentrations
of 38 mgFA L-1. Long-term tests conducted in a Sequencing Batch Reactors, enriched with anammox biofilm
biomass, showed performance instability when the FA concentrations reached values between 35-40 mgFA L-1.
In an anammox biofilm reactor, Waki et al. (2007) also reported FA as one of the inhibitory factors of the
Chapter 1
39
anammox reaction with FA levels of 13–90 mgFA L-1, while Tang et al. (2010a) suggested that FA
concentrations of 57–187 mgFA L-1 may be toxic to anammox microorganisms. Aktan et al. (2012), in their
study, investigated the inhibitory effect of FA on anammox bacteria in a continuous lab-scale upflow fixed-bed
reactor with Kaldnes biofilm carriers (T=34°C and pH=8). Results showed that anammox process inhibition was
not observed when the FA concentration in the reactor gradually increased up to 150 mgFA L-1. However,
anammox activity suddenly dropped to 10 % when the free ammonia concentration reached to 190 mgFA L-1. In
the reactor, the main anammox organisms were phylogenetically related to “Candidatus Kuenenia
stuttgartiensis”, “Candidatus Jettenia asiatica” and “Candidatus Brocadia anammoxidans”.
Some discrepancies between the different threshold can be attributed at different operative conditions,
microbial populations and physical structures of the sludge (flocculent sludge, biofilm or granular sludge).
Granular and biofilm may provide a suitable circumstance for anammox bacteria to tolerate FA inhibition
compared to single cells.
Nitrite and free nitrous acid
Nitrite, as ammonium, is a substrate of the anammox process. However, high-concentrations of nitrite
severely inhibited anammox bacteria. Unlike AOBs and NOBs, which are inhibited by the free nitrous acid (FNA
or HNO2-N), the inhibition of anammox bacteria is caused by the ion itself (NO2--N). Recently, Lotti et al.
(2012b) performed nitrite inhibition tests, using a manometric approach. The authors obtained a similar decrease
of the anammox activity under different pH, confirming that nitrite rather than nitrous acid is the actual
inhibiting compound. The authors also showed that the nitrite inhibition was reversible and depended on the time
of exposure and on the concentration of NO2-, as total nitrite nitrogen (TNN). Any toxic effects (irreversible
inhibitions) were detected, thus the authors concluded that nitrite inhibitions on anammox process is reversible.
Reversibility by nitrite inhibition was also confirmed by other studies (Bettazzi et al. 2010; Kimura et al. 2010).
In literature, a wide range of nitrite concentrations at which the inhibition occurs have been reported, under
different experimental conditions and operating modes. Different thresholds are reported for short and a long
term effects of nitrite on anammox process. Usually when only short-term effects are evaluated, high values of
nitrite threshold had been found: 50% reduction at 400 mg NO2-N L-1 (Strous et al. 1999b; Lotti et al. 2012b);
50% reduction at 350 mg NO2-NL -1 (Dapena-Mora et al. 2007); 25% reduction at 60 mg NO2-NL -1 (Bettazzi et
al. 2010); 37 % reduction at 430 mg NO2-NL -1 (Kimura et al. 2010). Scaglione et al. (2012) reported for
anammox granules, mainly Brocadia species, a reduction of anammox activity of 40% at 500 mg NO2-N L-1 for
an exposure time of 3–4 h. The activity loss was substantial after prolonged exposure (24 h). However the
inhibition was reversible after washing. Lotti et al. (2012b) reported a 50% reduction at 4000 mg NO2-N L-1,
which is a significantly high nitrite concentration compared to other studies.
During long period, the inhibition had been observed at much lower but contradictory concentrations, as it
depends on the operative reactor conditions. Nitrite concentrations as low as 5 mg NO2-N L -1 has been reported
as inhibitive in an intermittently aerated one reactor nitritation-anammox process (Wett 2007). In contrast to the
inhibition at this low levels, Strous et al. (1999a) found that dispersed anammox aggregates completely lost their
activity in a nitrite solution of 100 mg NO2-N L-1 in an SBR reactor conducted for 1 week. Significant long-term
inhibitions in the presence of 80 mg NO2-N L -1 has been reported (Fux et al. 2004; Fernández et al. 2012).
Further, a full scale anammox reactor worked at typical concentration of 40 – 80 mg NO2-N L -1 (Van Der Star et
al. 2007).. Repeated additions of nitrite higher than 30 mg NO2-N L -1 caused losses of activity, and the inhibition
Chapter 1
40
was found to increase after each spike (Bettazzi et al. 2010). However, inhibition appears to be more severe in
case of suspended and flocculent biomass, suggesting that the outer layer of the biofilm or granules can protect
the anammox bacteria in the inner part, mainly due to diffusion (Cho et al. 2010; Fernández et al. 2012). Lotti et
al. (2012b) in their experiments showed that the inhibition increased as increasing exposure times to high nitrite
concentrations.
Presence of ammonium (2 g TAN L-1) during nitrite exposure resulted in a stronger loss of activity after the
nitrite exposure (50% and 30% in presence and absence of ammonium respectively) (Lotti et al. 2012b). Those
results were also found by Jaroszynski et al. (2011). The authors observed at low FA levels nitrite concentrations
up to 250 mg NO2-N L-1 did not cause inactivation of anammox consortia over a 2-days exposure time.
Moreover, Lotti et al. (2012b) showed that the presence of oxygen during nitrite incubation led to a maximum
activity reduction of 32%. However, at 2g N L-1 of ammonium and nitrite, the presence of oxygen even seemed
to decrease the inhibiting effect of substrates resulting in 30% loss of activity in batch tests (compared to a 50%
loss after exposure in the absence of oxygen).
Organic matter
Anammox bacteria are chemoautotrophic microorganisms that require inorganic chemicals as their energy
source, like bicarbonate. The concentration of bicarbonate in the influent of the anammox process is therefore
important but the stoichiometry requirement is significantly lower compared to nitrification stoichiometry.
However, an appropriate addition of inorganic carbon in the influent can promote the growth or enhance the
activity of anammox bacteria until an influent bicarbonate and nitrogen ratio of 10. Higher ratios led to an
anammox process inhibition (Liao et al. 2008).
Some kinds of nitrogen-rich wastewaters, such as landfill leachate and wastewater from digested animal
waste, contain both biodegradable and refractory organic matter. High concentrations of biodegradable organic
carbon in the influent wastewater may inhibit anammox bacteria. Biodegradable organic carbon may cause a
heterotrophic denitrifying bacteria competition with anammox bacteria for nitrite (Molinuevo et al. 2009). This
effect is concentration dependent and it has been usually observed when influents with a C/N ratio higher than 2
are treated (Kumar and Lin 2010). Because the heterotrophic bacteria grow faster than the autotrophic anammox
bacteria under high concentrations of biodegradable organic matter, the heterotrophic bacteria may eliminate the
anammox bacteria and thereby reduce the anammox nitrogen removal capability (Chamchoi 2008; Ruscalleda et
al. 2008; Kumar and Lin 2010). As reviewed by Jin et al. (2012), this type of inhibition could be considered as a
phenomenon of ‘‘out-competition’’.
Further, the presence of biodegradable organic carbon may activate different anammox metabolic pathways,
which could inhibit the main anammox bacteria activity, reducing nitrogen removal efficiency, i.e., using organic
matter rather than ammonium and nitrite as a substrate (Güven et al. 2005; Kartal et al. 2007b). As proposed by
Jin et al. (2012), this kind of inhibition could be considered as a phenomenon of ‘‘metabolic pathway conversion
inhibition’’. Anammox microorganisms have the capacity to couple the oxidation of various organic acids to the
reduction of nitrate. Güven et al. (2005) demonstrated that anammox bacteria have a versatile metabolism
because propionate and acetate were shown to be potential substrates for anammox bacteria. Kartal et al. (2007b)
reported that “Candidatus Anammoxoglobus propionicus’ outcompeted other anammox bacteria and
heterotrophic denitrifiers for the oxidation of propionate in the presence of ammonium, nitrite and nitrate, still
using CO2 as the only carbon source. Further, Kartal et al. (2008) showed that anammox bacteria can also be
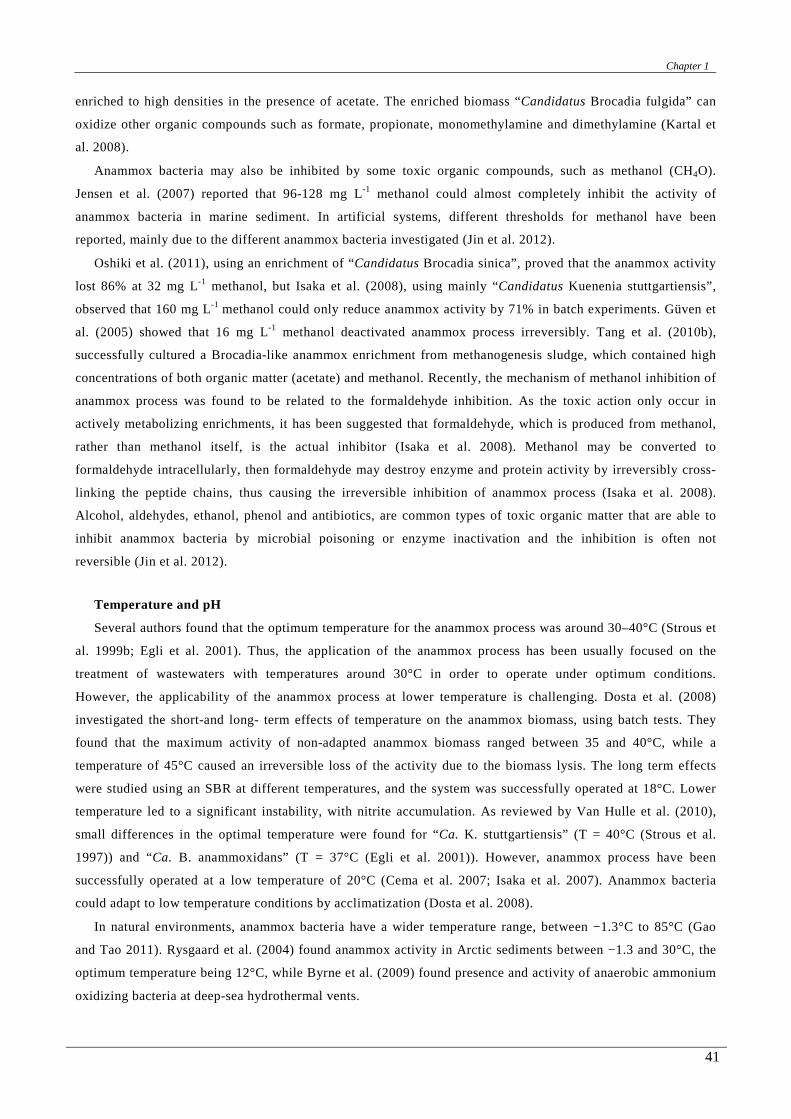
Chapter 1
41
enriched to high densities in the presence of acetate. The enriched biomass “Candidatus Brocadia fulgida” can
oxidize other organic compounds such as formate, propionate, monomethylamine and dimethylamine (Kartal et
al. 2008).
Anammox bacteria may also be inhibited by some toxic organic compounds, such as methanol (CH4O).
Jensen et al. (2007) reported that 96-128 mg L-1 methanol could almost completely inhibit the activity of
anammox bacteria in marine sediment. In artificial systems, different thresholds for methanol have been
reported, mainly due to the different anammox bacteria investigated (Jin et al. 2012).
Oshiki et al. (2011), using an enrichment of “Candidatus Brocadia sinica”, proved that the anammox activity
lost 86% at 32 mg L-1 methanol, but Isaka et al. (2008), using mainly “Candidatus Kuenenia stuttgartiensis”,
observed that 160 mg L-1 methanol could only reduce anammox activity by 71% in batch experiments. Güven et
al. (2005) showed that 16 mg L-1 methanol deactivated anammox process irreversibly. Tang et al. (2010b),
successfully cultured a Brocadia-like anammox enrichment from methanogenesis sludge, which contained high
concentrations of both organic matter (acetate) and methanol. Recently, the mechanism of methanol inhibition of
anammox process was found to be related to the formaldehyde inhibition. As the toxic action only occur in
actively metabolizing enrichments, it has been suggested that formaldehyde, which is produced from methanol,
rather than methanol itself, is the actual inhibitor (Isaka et al. 2008). Methanol may be converted to
formaldehyde intracellularly, then formaldehyde may destroy enzyme and protein activity by irreversibly cross-
linking the peptide chains, thus causing the irreversible inhibition of anammox process (Isaka et al. 2008).
Alcohol, aldehydes, ethanol, phenol and antibiotics, are common types of toxic organic matter that are able to
inhibit anammox bacteria by microbial poisoning or enzyme inactivation and the inhibition is often not
reversible (Jin et al. 2012).
Temperature and pH
Several authors found that the optimum temperature for the anammox process was around 30–40°C (Strous et
al. 1999b; Egli et al. 2001). Thus, the application of the anammox process has been usually focused on the
treatment of wastewaters with temperatures around 30°C in order to operate under optimum conditions.
However, the applicability of the anammox process at lower temperature is challenging. Dosta et al. (2008)
investigated the short-and long- term effects of temperature on the anammox biomass, using batch tests. They
found that the maximum activity of non-adapted anammox biomass ranged between 35 and 40°C, while a
temperature of 45°C caused an irreversible loss of the activity due to the biomass lysis. The long term effects
were studied using an SBR at different temperatures, and the system was successfully operated at 18°C. Lower
temperature led to a significant instability, with nitrite accumulation. As reviewed by Van Hulle et al. (2010),
small differences in the optimal temperature were found for “Ca. K. stuttgartiensis” (T = 40°C (Strous et al.
1997)) and “Ca. B. anammoxidans” (T = 37°C (Egli et al. 2001)). However, anammox process have been
successfully operated at a low temperature of 20°C (Cema et al. 2007; Isaka et al. 2007). Anammox bacteria
could adapt to low temperature conditions by acclimatization (Dosta et al. 2008).
In natural environments, anammox bacteria have a wider temperature range, between −1.3°C to 85°C (Gao
and Tao 2011). Rysgaard et al. (2004) found anammox activity in Arctic sediments between −1.3 and 30°C, the
optimum temperature being 12°C, while Byrne et al. (2009) found presence and activity of anaerobic ammonium
oxidizing bacteria at deep-sea hydrothermal vents.

Chapter 1
42
The optimal pH interval for anammox process is 6.7–8.3 with an optimum of 8. (Strous et al. 1997). Further,
both temperature and pH affects FA and FNA concentrations, therefore, the temperature and pH control are
important parameter, that can be used to monitor and control the anammox process.
Salinity
The increase of the osmotic pressure due to salts may impact negatively anammox activity. Nevertheless,
anammox bacteria can grow both in freshwater and marine environments, where the salt concentrations are high.
Hence, anammox reaction is a promising process for the treatment of wastewater with high salts concentrations.
The salt tolerance depends on the kind of the anammox biomass and on the biomass acclimatation. In natural
saline ecosystems only anammox species belonging to “Scalindua” genus have been detected (Schmid et al.
2003). The other genera are known to inhabit freshwater ecosystems. However, Kartal et al. (2006) reported that
the freshwater anammox species “Candidatus Kuenenia stuttgartiensis” successfully adapted to salts (90% NaCl
and 10% KCl) concentrations as high as 30 g L-1. Higher salt concentrations reversibly inhibited anammox
bacteria, but the inhibition was reversible.
Yang et al. (2011) reported a stable anammox process in an up-flow column reactor at 30 g NaCl L-1, after a
gradual adaption process. Different results have been obtained using adapted and non-adapted biomass. Jin et al.
(2011) observed that a saline shock loading of 30 g NaCl L-1 caused a 67.5% decrease in the specific anammox
activity compared to the reference biomass, while the acclimatized anammox biomass displayed an activity just
45.1% lower than that of the reference biomass. Dapena-Mora et al. (2010) showed that when the anammox
biomass is continuously subjected to high NaCl concentrations its resistance to salt clearly increases. Further, the
authors observed a stimulatory effect of salt on the anammox activity at concentrations up to 6 and 15 g NaCl
L−1, while higher salt concentrations caused a decrease in the activity. Windey et al. (2005), studying the
performance of the OLAND process for the treatment of high salinity wastewater. The authors found that the
activity of the salt-adapted anammox biomass decreased 59% at 30 g NaCl L−1. Zhang et al. (2010b), conducting
a CANON process in a sequencing batch biofilm reactor (SBBR), achieved the maximal total nitrogen (TN)
removal rate when the salinity was maintained at a constant value of 10.0 g NaCl L-1. Oshiki et al. (2011),
studying the “Candidatus Brocadia sinica”, found that anammox activities were 70% of baseline in the presence
of 30 g L-1 salinity. Thus, it seems clear that the anammox biomass is highly resistant to the presence of salt
concentration (NaCl), even if the salt adaption ability of other anammox species should be studied in future.
However, the salinity inhibition depends also on the types of salts. Dapena-Mora et al. (2007), conducting batch
tests on anammox biomass, showed that NaCl concentrations below 6 g L-1 did not affect the anammox activity
while KCl and Na2SO4 had adverse effect at concentrations higher than 7.5 g L-1and 7.1 g L-1, respectively . It
was reported that salinity in certain concentrations (3–15 g NaCl L-1) promoted the formation of anammox
granular sludge and increased the retention of bacteria in the reactor (Fernández et al. 2008; Dapena-Mora et al.
2010).

Chapter 1
43
Oxygen
Anammox bacteria are anaerobic and are inhibited by dissolved oxygen (Strous et al. 1997; van Dongen et al.
2001b). Nevertheless, inhibition caused by low concentration of oxygen (0.25–2%) was demonstrated to be
reversible (Strous et al. 1997; Egli et al. 2001), but probably irreversibly at high levels (>18% air saturation)
(Egli et al. 2001). Lotti et al. (2012b) recently reported the short- and long- effect of oxygen exposure on
anammox process. After 1 h exposure in the presence of 5 mg O2 L-1, any inhibition effect on anammox process
was detected for concentrations up to 2000 mg N L-1 of ammonium and nitrite. Further, after an exposure for
24 h to 2000 mg N L-1 ammonium and nitrite (actively metabolizing cells), the authors reported that oxygen even
seemed to decrease the inhibiting effect of substrates resulting in 30% loss of activity in batch tests (compared to
a 50% loss after exposure in the absence of oxygen).
Other sources of inhibition
There are few studies on the heavy-metal and antibiotic inhibitions of anammox bacteria, even if some kinds
of nitrogen-rich wastewaters, such as landfill leachates or anaerobic digester effluents, often contain heavy metal
ions and antibiotic traces. Recently, Lotti et al. (2012a) using a Brocadia enrichment, investigated the short
effects of heavy metals and antibiotics on anammox bacteria. Anammox activity was inhibited by 50% after an
exposition of 24 hours at 1.9, 3.9, 650 and 1,100 mg L-1 of copper, zinc, sulfathiazole and oxytetracycline,
respectively. The authors investigated the effect of prolonged exposure (14 days) to the antibiotics
oxytetracycline and sulfathiazole at concentration of 100 mg L-1. The anammox activity decreased by 75% and
50% respectively. Both anabolism and catabolism reactions were active during the inhibition tests, as any
discrepancy from the accepted anammox stoichiometry was found. Fernández et al. (2009) measured a 40%
decrease in activity in the continuous operation of an anammox bioreactor after tetracycline hydrochloride was
fed for 30 days at a concentration of 10 mg L-1.
Dapena-Mora et al. (2007) reported inhibition effects on Anammox process due to different compounds.
Concentrations up to 1 g L-1 of allylthiourea and chloramphenicol, used as nitrification and denitrification
inhibitors, caused no significant decrease of the maximum anammox activity, implying that allylthiourea and
chloramphenicol could be used as an useful method to distinguish anammox activity from the activity of other
microorganisms. Further, polymerising flocculant positively charged compounds, usually used for a physical–
chemical process-like flocculation process were tested. The complete inhibition of anammox activity was
measured at concentration higher than the values adopted in the flocculation process.
Phosphate is commonly used as a pH buffer in batch experiments. A difference in tolerance for phosphate
exists between different anammox species. The anammox species most common used for inhibition tests is
“Candidatus Kuenenia stuttgartiensis”. Using a culture of “Candidatus K. stuttgartiensis”, Egli et al. (2001) did
not see any inhibitory effect of phosphate up to 620 mgPO43--P L-1 tested. In batch tests using a biomass enriched
in bacteria belonging to the specie “Candidatus K. stuttgartiensis”, Dapena-Mora et al. (2007), observed an
inhibition of 50% of anammox activity at concentration of 620 mgPO43--P L-1. Performing batch tests with
sludge from a highly loaded lab-scale rotating biological contactor containing “Candidatus K. stuttgartiensis”,
Pynaert et al. (2003) measured an anammox activity inhibition of 63% at 55.8 mgPO43--P L-1, of 80% at 111
mgPO43--P L-1. No further decrease was observed at higher concentrations. A lower tolerance to phosphate was
measured by Van de Graaf et al. (1996), who observed a loss of activity of “Candidatus B. anammoxidans” when
incubated the anammox reactor with more than 62 mgPO43--P L-1.

Chapter 1
44
Some kind of wastewaters contain sulphur compounds (sulphate or sulphide). Sulphate (SO42−) is usually
present in wastewaters such as seafood processing, leather tanning, oil refining and alcohol fermentation over
carbon and nitrogen concentration. Recently, simultaneous removal of ammonium and sulphate by anammox
bacterias have been reported by Yang et al. (2009). Sulphate (SO42−) is often reduced to suphide (H2S) in
anaerobic conditions by sulphate reducing bacteria which use organic carbon as electron donor. Sulphide may act
as inorganic inhibitors of anammox process. Dapena-Mora et al. (2007) showed an inhibition of 50% on
anammox process at low sulphide concentration of 9.6 mgS L−1 while Van de Graaf et al. (1996) showed any
inhibition effect of anammox process to at least 64 mgS L−1 in batch and continuous experiments. This large
difference in sulphide inhibition could be explained either by the two different species of anammox bacteria
utilized in the two experiments (“Candidatus K. stuttgartiensis” vs “Candidatus B. anammoxidans”) or by the
addition of nitrate as electron donor for the anammox biomass in Van de Graaf et al. (1996) since sulphide could
reduce nitrate to nitrite, which is the preferable electron donor of the process (Van Hulle et al. 2010).
2.6. DNRA
Dissimilatory nitrate reduction to ammonium (DNRA), also called nitrate ammonification or autotrophic
denitrification, is a potentially significant pathway of the nitrogen cycle (Tiedje 1988). For a long time it was
generally assumed that most of the nitrate in nature is mainly reduced and transformed via denitrification to
dinitrogen gas and any particularly high relevance was assigned to DNRA. While denitrification represents a
nitrogen removal pathway producing N2, DNRA is a nitrogen-conserving mechanism that transforms nitrate
(NO3-) to ammonium (NH4
+), a more bio-available inorganic nitrogen form, with nitrite (NO2−) as a free
intermediate.
In DNRA process, nitrate and nitrite are reduced to ammonium. Information on the physiology, phylogeny
and on enzymes involved in DNRA has been obtained by characterizing isolated DNRA-performing strains
(Bonin 1996; Strohm et al. 2007). Recently, Kraft et al. (2011) reviewed the mechanisms of DNRA: (i) the
reduction of nitrate to nitrite is assumed to mostly being catalyzed by the periplasmic nitrate reductase complex
NapAB, however, same organisms also present a membrane-bound nitrate reductase, NarGHI; (ii) the reduction
of nitrite to ammonium is catalyzed by NrfA, a pentaheme cytochrome c nitrite reductase, without the release of
any intermediate. The authors reported that there are some indications that N2O is also released as a byproduct of
DNRA. NO and NH2OH are also probable intermediates. The ability to carry out DNRA is phylogenetically
widespread in nature and the functional gene NrfA, which reduce nitrite to ammonium, had been detected in
diverse groups of bacteria as reviewed by Kraft et al. (2011): gamma-, delta- and epsilon-proteobacteria and in
members of the bacteroides and sulfate reducing delta-proteobacteria.
Most organisms that carry out DNRA also can reduce nitrate to nitrite except some sulfate reducing bacteria
which are only able to use nitrite (Dannenberg et al. 1992). DNRA has been shown to be mediated by obligate
anaerobes, facultative anaerobes and some aerobes microorganisms (Tiedje 1988; Cole 1996). Although, the
conditions promoting DNRA and heterotrophic denitrification are similar (absence of oxygen, and available
nitrate and organic substrates) some mechanisms could drive the competition between those two biological
processes. The conditions that favor the one or the other nitrate respiration pathway remain to be univocally
determined. In contrast to denitrification, dissimilatory nitrate reduction to ammonium (DNRA) is assumed to
occur when nitrate in comparison to organic carbon is limiting. This behavior was explained by the fact that
DNRA, despite having a lower energy yield, consumes less nitrate per carbon than denitrification (Cole and

Chapter 1
45
Brown 1980; Tiedje 1988). Further, DNRA is only predicted at strictly anoxic conditions, whereas denitrification
is predicted in anoxic conditions and at both low and high oxygen concentrations. The ratio between the
available electron donor compared to nitrate (C:NO3-), the kind of electron donor and the prevailing redox
potential in the environment are hypothesized factors for the selection of the predominating nitrate reduction
process (Tiedje 1988; Akunna et al. 1993). Van de Leemput et al. (2011), using simulation, based only on the
stoichiometry and energy yield of the redox reactions involved in the nitrogen cycle, and assuming competition
for resources between alternative pathways, showed that in hypothetical freshwater and marine sediment
situations, at relatively low nitrate inflow levels, DNRA outcompeted denitrification at low oxygen inflow
levels, while at high nitrate inflow levels, DNRA was outcompeted by denitrification at different oxygen
concentration.
Recently, the role of DNRA has been established in different environments, showing the importance for the
terrestrial nitrogen cycle (Rütting et al. 2011). In tropical forest soils, DNRA was shown to be at least three
times higher than denitrification (Templer et al. 2008), accounting in some cases for nearly 99% of nitrate
reduction (Huygens et al. 2007). In contrast, DNRA has been shown to account for only 5-15% of nitrate
reduction in temperate freshwater environments, such as riparian fens, wetlands and paddy soils (Ambus et al.
1992; Yin et al. 2002; Matheson et al. 2003), where denitrification was responsible for the majority of nitrate
removal through the production of N2 gas. DNRA is measured under anoxic conditions and in deeper sediment
layers (Jørgensen 1989). In natural systems, DNRA activity has been found coupled with sulfur cycling (Brunet
and Garcia-Gill 1996). There has been recent indication that sulfate reduction is preferred over DNRA if both
electron acceptors are present (Marietou et al. 2009). Evidence for sulfide-enhanced DNRA activity can be found
in stratified aquatic microbial ecosystems (Brettar et al. 2006). In a mariculture system, Sher et al. (2008)
showed that the addition of sulfide in the anaerobic reactor treating high nitrate and carbon stream, increased the
nitrate reduction rate, pointing to the important role of DNRA in the anaerobic reactor. The importance of nitrate
reduction to ammonium in fermenting conditions, performed by fermentative bacteria (e.g., Enterobacteriaceae,
Aeromonas, Vibrio spp., Clostridium sp.) have been demonstrated (Cole and Brown 1980; Cole 1996). Akunna
et al. (1994) detected nitrate reduction to ammonium in anaerobic sludge using glucose at various nitrate
concentrations together with denitrification and methanogenic activities. Thus, DNRA needs to be considered
also in WWTPs to optimize nitrogen removal.
Evidence for DNRA has been detected in the Benguela upwelling system (Kartal et al. 2007a), where
anammox bacteria actively remove massive amounts of N (Kuypers 2005). This result showed that DNRA could
be also performed by anammox bacteria, providing NH4+, that could be used consequently for the traditional
anammox pathway producing N2 gas. “Ca. K. stuttgartiensis” is capable of dissimilatory nitrate reduction to
ammonium (DNRA), reducing NO3- even in the presence of high ammonium concentration (140 mg TAN L-1)
(Kartal et al. 2007a). The overall process could be seen effectively concealed as a denitrification process, as in
anoxic systems, starting from NO3-, dinitrogen gas (N2) is produced.
Coupled DNRA and denitrification and coupled DNRA–anammox processes are indistinguishable with most
conventional activity assays and isotope tracer experiments activity assays, while the application of specific gene
markers could help to assess the importance of the DNRA in the environment (Francis et al. 2007; Kartal et al.
2007a).
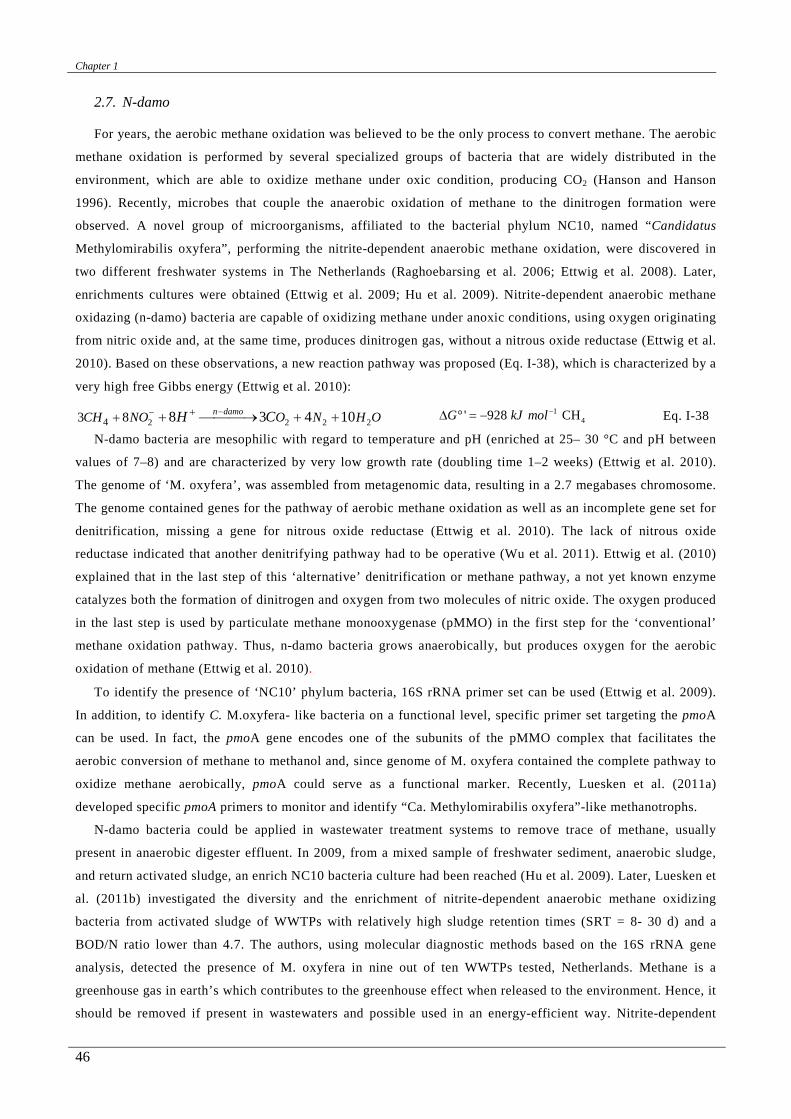
Chapter 1
46
2.7. N-damo
For years, the aerobic methane oxidation was believed to be the only process to convert methane. The aerobic
methane oxidation is performed by several specialized groups of bacteria that are widely distributed in the
environment, which are able to oxidize methane under oxic condition, producing CO2 (Hanson and Hanson
1996). Recently, microbes that couple the anaerobic oxidation of methane to the dinitrogen formation were
observed. A novel group of microorganisms, affiliated to the bacterial phylum NC10, named “Candidatus
Methylomirabilis oxyfera”, performing the nitrite-dependent anaerobic methane oxidation, were discovered in
two different freshwater systems in The Netherlands (Raghoebarsing et al. 2006; Ettwig et al. 2008). Later,
enrichments cultures were obtained (Ettwig et al. 2009; Hu et al. 2009). Nitrite-dependent anaerobic methane
oxidazing (n-damo) bacteria are capable of oxidizing methane under anoxic conditions, using oxygen originating
from nitric oxide and, at the same time, produces dinitrogen gas, without a nitrous oxide reductase (Ettwig et al.
2010). Based on these observations, a new reaction pathway was proposed (Eq. I-38), which is characterized by a
very high free Gibbs energy (Ettwig et al. 2010):
2 2 2 243 8 8 3 4 10n damoCH NO O N H OH C−− ++ + → + + 1
4' 928 CHG kJ mol−∆ ° = − Eq. I-38
N-damo bacteria are mesophilic with regard to temperature and pH (enriched at 25– 30 °C and pH between
values of 7–8) and are characterized by very low growth rate (doubling time 1–2 weeks) (Ettwig et al. 2010).
The genome of ‘M. oxyfera’, was assembled from metagenomic data, resulting in a 2.7 megabases chromosome.
The genome contained genes for the pathway of aerobic methane oxidation as well as an incomplete gene set for
denitrification, missing a gene for nitrous oxide reductase (Ettwig et al. 2010). The lack of nitrous oxide
reductase indicated that another denitrifying pathway had to be operative (Wu et al. 2011). Ettwig et al. (2010)
explained that in the last step of this ‘alternative’ denitrification or methane pathway, a not yet known enzyme
catalyzes both the formation of dinitrogen and oxygen from two molecules of nitric oxide. The oxygen produced
in the last step is used by particulate methane monooxygenase (pMMO) in the first step for the ‘conventional’
methane oxidation pathway. Thus, n-damo bacteria grows anaerobically, but produces oxygen for the aerobic
oxidation of methane (Ettwig et al. 2010).
To identify the presence of ‘NC10’ phylum bacteria, 16S rRNA primer set can be used (Ettwig et al. 2009).
In addition, to identify C. M.oxyfera- like bacteria on a functional level, specific primer set targeting the pmoA
can be used. In fact, the pmoA gene encodes one of the subunits of the pMMO complex that facilitates the
aerobic conversion of methane to methanol and, since genome of M. oxyfera contained the complete pathway to
oxidize methane aerobically, pmoA could serve as a functional marker. Recently, Luesken et al. (2011a)
developed specific pmoA primers to monitor and identify “Ca. Methylomirabilis oxyfera”-like methanotrophs.
N-damo bacteria could be applied in wastewater treatment systems to remove trace of methane, usually
present in anaerobic digester effluent. In 2009, from a mixed sample of freshwater sediment, anaerobic sludge,
and return activated sludge, an enrich NC10 bacteria culture had been reached (Hu et al. 2009). Later, Luesken et
al. (2011b) investigated the diversity and the enrichment of nitrite-dependent anaerobic methane oxidizing
bacteria from activated sludge of WWTPs with relatively high sludge retention times (SRT = 8- 30 d) and a
BOD/N ratio lower than 4.7. The authors, using molecular diagnostic methods based on the 16S rRNA gene
analysis, detected the presence of M. oxyfera in nine out of ten WWTPs tested, Netherlands. Methane is a
greenhouse gas in earth’s which contributes to the greenhouse effect when released to the environment. Hence, it
should be removed if present in wastewaters and possible used in an energy-efficient way. Nitrite-dependent

Chapter 1
47
anaerobic methane oxidazing (n-damo) bacteria could play an important role in developing new sustainable
wastewater treatment implementations (Luesken et al. 2011b).
3. Advantages and issues in the co-existence of microorganisms for wastewater treatment
Conserving energy and resources in WWTPs is nowadays a blessing rather than a duty or a burden. Therefore
more attention is being paid to the selection of processes that conserve energy and resources. The discovery of
anammox bacteria opened new ways in nitrogen removal from wastewaters. Also the discovery of the versatility
of processes such as the heterotrophic nitrification, the autotrophic denitrification and other microbial pathways
such as the aerobic ammonia oxidation by archaea, the dissimilative nitrate reduction to ammonia (DNRA) and
the nitrite- dependent methane oxidation (n-damo) may lead to the development of new treatment processes.
Some researchers have reported that anammox bacteria can co-exist with other bacteria, such as the aerobic
nitrifying and denitrifying bacteria, and this co-existence can play an important role in treating nitrogen- and
carbon- containing wastewaters (Third et al. 2001; Ruscalleda et al. 2008; Chen et al. 2009; Kumar and Lin
2010).
3.1 Anammox– and Aerobic Ammonia Oxidizing- Bacteria
Ammonium removal with the anammox process always consists of the nitritation process followed by the
anammox process. Processes like SHARON has been developed to carry on the nitritation process (Hellinga et
al. 1998). First, “2-reactors systems” have been implemented, such as the SHARON/anammox (Van Dongen et
al. 2001a; van Dongen et al. 2001b; Vázquez-Padín et al. 2009b), to treat wastewaters with high ammonia
concentrations and no carbon content.
Later, a complete autotrophic nitrogen removal process (ammonia to N2) in “1-reactor systems” had been
implemented by a mixed population of aerobic ammonia oxidizers and anammox bacteria under oxygen
limitation conditions (Third et al. 2001; Sliekers et al. 2002). In the Completely Autotrophic Nitrogen removal
Over Nitrite (CANON) process, in one single reactor, the aerobic ammonia-oxidizers and the anaerobic ammonia
oxidizers simultaneously oxidize ammonia to dinitrogen gas and a small amount of nitrate is produced. Oxygen
limited conditions are necessary both to avoid inhibition of anammox bacteria by oxygen and to achieve
appropriated conditions to obtain nitritation process. The growth of NOBs (and subsequent nitrate production) is
prevented due to their lower affinity to oxygen compared to AOB (KO_AOB <KO_NOB) (Wiesmann 1994) and due
to their lower affinity to nitrite compared to anammox bacteria (KNO2_anammox <KNO2_NOB) (Van Der Star et al.
2008). A combined Nitrosomonas/Brocadia cultures was obtained by Third et al. (2001), which converted
ammonium into mainly dinitrogen gas and some nitrate according to the following reaction:
4 2 2 32.5 2.1 2.81.15 0.2AOB AnammoxNH O N NO H++ − ++ + +→ Eq. I-39
Theoretically, the potential advantages of the nitrogen removal via nitritation and anammox process are: (a)
the decrease (theoretically ~ 60%) of oxygen consumption by limiting the ammonia oxidation to only 50% of
nitrite (partial nitritation); (b) the reduction of organic carbon uptake as no denitrification is required; (c) the
reduction of sludge production as only autotrophic bacteria are involved in the nitrogen removal process.
Nevertheless, in CANON systems the presence of nitrite oxidizing bacteria have been detected, mainly
caused by NH4+-N limitation. Third el al. (2001) observed that under NH4
+-N limitation only the 31% of NO2-
generated by AOB reacted in anammox process, while the 69% of nitrite reacted in nitratation process. Possible

Chapter 1
48
inhibitions of nitrite oxidizers by high free ammonium levels (Anthonisen et al. 1976) and high temperatures
(Hellinga et al. 1998) have been also suggested. Recently, the possibility of using salt stress as a technical
approach to inhibit the nitrite-oxidizing bacteria (NOB) activities during the start-up of a CANON process from
activated sludge have been investigated (Zhang et al. 2010b). In addition, the salinity kept at a moderate level
could also strengthen the biomass granulation (Kartal et al., 2006; Liu et al., 2008).
The main systems adopted to perform the CANON process, allowing the co-existence of these AOB and
anammox bacteria species are biofilm systems (Rotating Biological Contactor (RBC), Moving-Bed Biofilm
Reactor (MBBR)), or granular systems (Granular Sequencing Batch Reactor (GSBR), Upflow Anaerobic Sludge
Blanket (UASB)) or reactors with an intermitted aeration (Sequencing Batch Reactor (SBR), RBC, Membrane
BioReactor (MBR)) (Van Hulle et al. 2010). Usually systems with efficient retention of biomass in order to
cultivate slowly growing bacteria are preferable.
As reviewed by Van Hulle et al. (2010), among the CANON configurations reported in literature, one of
maximum nitrogen removal rate (NRR) was 1.5 kg N m-3 day-1, achieved in a gas-lift reactor (Sliekers et al.
2003). This value is lower compared to the NRR of the 2-separate reactor configuration “SHARON-anammox”,
where a maximum value of 9 kg N m-3 day-1 has been reported using a gas-lift anammox reactor (Van Der Star et
al. 2007). However, NRRs lower than 1.5 kg N m-3 day-1 have been also reported in “2-reactors systems”, where
anammox process had been carried out in SBR, MBR or UASB configurations.
Usually granular and biofilm systems are adopted to perform the CANON process. The distribution of AOBs
and anammox bacteria in CANON systems, performed in a granular reactor, was investigated by Nielsen et al.
(2005). Under oxygen limited conditions (< 0,1 mgO2 L-1), AOBs were restricted to the outer shell of the
CANON aggregates, while anammox bacteria were found in the central anoxic parts. The larger type aggregate
(>500 micron) accounted for about 68% of the anammox potential whereas 65% of the nitrification potential was
found in the smaller aggregates (<500 micron). Fluorescence in situ hybridization (FISH) analysis of the
CANON biomass showed that about 40% of the community consisted of AOBs, and 40% of anammox. No NOBs
had ever been detected. The NOBs are only able to develop in CANON reactor after prolonged exposure (>1
month) to ammonium limitation (Third et al, 2001). The spatial distribution of AOB and anammox bacteria was
also confirmed by Li et al. (2011b) in a lab-scale granular SBR, working at DO <0.8 mg L-1. The authors found
that the inner zone and the outer layer of the granules appeared to have an obvious difference because of the
different situation of dissolved oxygen. In the outer layer of a granule, biomass was mostly micrococcus,
presumably aerobic ammonia-oxidizing bacteria. On the other hand, in the inner layer of a granule, biomass was
typical cauliflower-like aggregates, presumably anammox organisms. In addition, lots of cavities were present in
the granules, which can enhance substrate transfer from the bulk to granules and intermediate or by-product
transfer from inside granules to the bulk. The biofilm structure of a Rotating Biological Contactor performing
the CANON process was analyzed by Pynaert et al. (2003), which found that the biofilm was largely a nitrifying
community, with anammox bacteria spread throughout the biofilm. The AOBs were shown to be active at around
the same depth as the anammox bacteria, possibly having two functions: either they consume O2 (thus producing
NO2-), protecting the anammox microorganism and supplying substrate, or they have some kind of anoxic
metabolism.
The “1-reactor systems” for nitritation and anammox process have some advantages compared to the “2-
reactor systems”. Because only one reactor is required in the CANON systems, the capital and operational costs
of the ”1- single reactors” are lower compared to the “2- separate reactor” configurations. In addition, the “1-

Chapter 1
49
reactor systems” may prevent inhibition effect, especially when biofilm or granular systems are used to perform
the process. Biofilm and granular biomass structures create a mass transfer resistance which depends on the
biofilm/granular thickness, protecting anammox bacteria by the inhibition of high concentrations of oxygen and
nitrite in the bulk liquid. Usually, ammonium concentrations in the bulk are much higher than the oxygen or
nitrite concentration, thus ammonium diffusion into the biofilm/granule will not limit the process rate. Then, the
fluctuations of the ammonia and nitrite concentrations in the bulk and the ammonia and nitrite gradient
concentration in the granule and biofilm may enable the co-existence of sublineage of Nitrosomonas, Nitrobacter
or Nitrospira species (Maixner et al. 2006), getting more flexible the biological nitrogen process. Beyond
CANON, different names have been used to describe the “1-syngle reactor” system, where the harmonious co-
existence and cooperation of aerobic (AOB) and anaerobic ammonium-oxidizing (anammox) bacteria is achieved
treating ammonium-rich wastewater, without organic carbon content. Among them, the OLAND-process
(Oxygen Limited Autotrophic Nitrification and Denitrification) (Kuai and Verstraete 1998; Philips et al. 2002b),
the aerobic/anoxic deammonification or DEMON process (Seyfried et al. 1998; Wett 2007) and the SNAP
process (Single-stage Nitrogen removal using Anammox and Partial nitritation) (Lieu et al. 2005; Furukawa et
al. 2006).
3.2 Anammox bacteria and Aerobic Ammonia Oxidizing Archaea
Mimicking the oxygen minimum zones, the cooperation between marine anammox bacteria, ammonia
oxidizing bacteria (AOBs) and ammonia oxidizing archaea (AOAs) have been successful achieved in a
laboratory-scale model system under oxygen limitation and low ammonium concentrations (Yan et al. 2012). The
applicability of a biological process where anammox bacteria, AOB and AOA co-exist might be useful for the
treatment of very dilute waste streams at ambient temperature. However, the presence of archaea has been
investigated in a lab scale anaerobic up-flow granular bed anammox reactor (Cho et al. 2010), but any archaea
have been detected. Further researches are necessary to study the applicability of anammox bacteria and
ammonia oxidizing archaea co-existence in WWTPs.
3.3 Anammox– and Denitrifying- Bacteria
The co-existence of anammox and denitrifying bacteria have been reported in literature both in natural and
artificial systems (Kumar and Lin 2010) even if denitrification is favorite over anammox process. In fact, the
standard free energy (∆G°) of denitrification reaction is higher than the anammox reaction; therefore, the
denitrification is thermodynamically more feasible. Further, denitrifiers have higher growth yield compared to
autotrophic anammox bacteria.
In WWTPs, the co-existence of anammox and denitrification in one reactor would be useful to reduce the
nitrate concentration in the reactor, produced by anammox process itself, improving the the total nitrogen
removal via denitrifiers (Ruscalleda et al. 2008; Ni et al. 2012). Under anoxic conditions, nitrate can be reduced
by denitrifiers to dinitrogen gas or to nitrite as intermediate which can be further utilized by anammox bacteria
for the oxidation of ammonium (Kumar and Lin 2010; van Hulle et al. 2010). However, heterotrophic
microorganisms could reduce also nitrite to gaseous nitrogen in anoxic denitrification, competing with anammox
bacteria (Ahn et al. 2004). The coupling of anammox and denitrification processes will be successful only when
the denitrification reaction is not competing with anammox for NO2−. Denitrification could be limited by the low

Chapter 1
50
availability of easily biodegradable organic carbon; thus, denitrifiers are not able to dominate and cannot
outcompete anammox bacteria in environments. The C/NH4+ ratio in the wastewater, and therefore, the C/NH4
+
in the liquid bulk, is one of the most critical factor determining the co-existence of anammox and denitrification
processes. Experimental studies reported that influent C/NH4+ ratios lower than 2 are necessary to achieve a
stable co-existence between anammox and denitrifiers (Kumar and Lin 2010). Recently, it has been demonstrated
that for granular systems when C/NH4+ ratio is over 3.1, anammox microorganisms could not compete with
denitrifiers, which led to the reduction in the number of anammox bacteria and an increase of denitrifiers
quantity (Ni et al. 2012). Further, at high C/NO3- ratio, nitrate will probably be reduced to ammonia due to
dissimilative pathway (DNRA). The possibility of dissimilatory nitrate reduction to ammonium by anammox
bacteria was also studied (Kartal et al. 2007a)
Nevertheless, the key role of the mechanism of the denitrification-anammox co-existence is not completely
clear. Anammox bacteria could also use organic carbon. Unexpectedly, Sabumon (2007) found that in the
presence of organic matter, ammonia was oxidized anoxically to nitrate by an unknown mechanism unlike
anammox process. The authors hypothesized an enzymatic anoxic oxidation of NH4+ to NO3
−, followed by
denitrification via autotrophic and/or heterotrophic routes, i.e using hydrogen sulfide ions or organic carbon
respectively. Further, it was showed that anammox bacteria have a more versatile metabolism than initially
assumed. Güven et al. (2005) demonstrated that anammox biomass could oxidize propionate to CO2 with nitrate
and/or nitrite as the electron acceptor. Kartal et al. (2007b) reported that the anammox bacteria “Ca.
Anammoxoglobus propionicus” was shown to outcompete both other anammox bacteria and denitrifiers for
propionate. Further, “Ca. B. fulgida’ was able to oxidize other organic compounds such as acetate, formate,
monomethylamine, and dimethylmine with nitrate and/or nitrite as the electron acceptor (Kartal et al. 2008).
3.4 Anammox bacteria – DNRA
Anammox process can be coupled with dissimilatory nitrate reduction to ammonia (DNRA). The
dissimilatory nitrate reduction to ammonium also proceeds in two steps: first nitrate is reduced to nitrite, then
nitrite is reduced to ammonium. In artificial systems with NO3− limiting conditions and under anoxic conditions,
NO3− can be reduced by bacteria which promote the dissimilatory reduction of NO3
− to NH4+ (known as, DNRA)
and release NO2− as a free intermediate. Subsequently, NO2
− can be utilized by anammox bacteria for the
anaerobic oxidation of NH4+ (Kumar and Lin 2010). A similar coupling between anammox and denitrification
processes was observed in the marine environments (Dalsgaard et al. 2005)
Recently, Kartal et al. (2007a) verified that anammox bacteria were able to perform by itselfs the
dissimilatory nitrate reduction to ammonia. The nitrogen gas production by anammox bacteria through nitrate
reduction proceeds via two reactions: dissimilatory nitrate reduction to ammonium followed by anaerobic
oxidation of ammonium.
3.5 Anammox- and n-damo- bacteria
The feasibility of a co-existence of anammox and n-damo bacteria has been successful tested by Luesken et
al. (2011c) in a lab –scale reactor. Those results open the possibility to implement, in the near future, new
biological configuration in WWTP to treat wastewaters that contain substantial amounts of both methane and
ammonium.

Chapter 1
51
3.6 Anammo- and–filamentous bacteria
Cho et al. (2010) reported Chloroflexi-like filamentous bacteria present mainly at the surface of the granules
and around the anammox bacterial cluster. Several studies reported that Chloroflexi-like bacteria were present in
a highly enriched anammox biomass (Li et al. 2009, 2011c; Xiao et al. 2009; Cho et al. 2011). The high
detection frequency of Chloroflexi-like bacteria in an anammox reactor suggests that this group may be
important for granulation. Chloroflexi-like bacteria could degrade and utilize macromolecules which derived
from biomass decay and reinforce the structure of granules with a network of filamentous biomass (Miura et al.
2007; Miura and Okabe 2008; Li et al. 2009; Cho et al. 2010).
3.7 Aerobic Ammonia Oxidizing-, Anammox- and Denitrifying Bacteria
The co-existence of partial nitritation, anammox, and denitrification processes in one single reactor is a
challenging process for treating wastewaters with high ammonium concentrations and a low carbon content, such
as anaerobic digester effluents and old landfill leachate. The process is known as Simultaneous partial
Nitritation, Anammox and Denitrification (SNAD) process. It consists in one single reactor where different
biological processes take place. The potential advantages of the nitrogen removal via SNAD process are: (a) the
decrease (theoretically about 60%) of oxygen consumption by limiting the ammonia oxidation to 50% nitrite
(partial nitritation) (b) the reduction (theoretically 100%) of organic carbon uptake during anoxic respiration, (c)
lower sludge production, as the main processes are carried out by autotrophic bacteria, (d) a high total nitrogen
removal efficiency compared ti the CANON process. In addition, compared to the 2 – reactor systems, the SNAD
process requires lower capital and operational costs.
The co-existence of nitritation, anammox and denitrification processes has been reported in literature in
engineered systems both at lab-scale (Chen et al. 2009; Xu et al. 2010; Lan et al. 2011; Li et al. 2011b; Daverey
et al. 2012; Winkler et al. 2012a; Zhang et al. 2012) and full scale (Wett 2007; Joss et al. 2009; Wang et al.
2010). Partial nitritation requires an aerobic condition for ammonium oxidation by chemolithoautotrophic AOBs
with oxygen as electron acceptor. The residual ammonium and the nitrite produced can be removed by anammox
process. In the anammox process, autotrophic bacteria utilize carbon dioxide as carbon source and nitrite as
electron acceptor for ammonium oxidation under anoxic conditions. In the heterotrophic denitrification, nitrogen
oxides serve as the terminal electron acceptor for organic carbon metabolism. Part of nitrate produced in
anammox reaction can be removed by denitrification with the remaining organic carbon (COD) as electron
donors, which will improve total nitrogen removal efficiency.
The performance of the SNAD process in treating wastewater would not only depend on anammox bacteria
but also on the co-existence of the other important processes, mainly the aerobic ammonia and nitrite oxidation
and heterotrophic denitrification via nitrate and nitrite. Previous studies indicated that also other mechanisms
could occur: organic compounds can be utilized as supplementary carbon sources by some
chemolithoautotrophic nitrifiers; anammox bacteria could consume acetate, propionate and could compete
successfully over heterotrophic denitrifiers. However, the contribution of those other mechanisms can be
considered secondary.
The SNAD process requires the simultaneous presence of aerobic and anaerobic conditions. Oxygen limited
conditions are required to inhibit nitrite oxidizing bacteria (NOBs) over the ammonia oxidizing bacteria (AOBs)
and further to avoid inhibition of anammox bacteria. In addition, some substances could act both as substrates

Chapter 1
52
for some processes and inhibitors for other processes, requiring appropriate substrate concentrations and ratios.
In particular, an appropriate C/N ratio of the influent wastewater should be established to ensure the co-existence
of anammox and denitrifying bacteria. A maximum working Free Ammonia levels of 10 mg NH3-N should be
reached in order to avoid ammonia oxidizing bacteria (AOBs) inhibition while a minimum Free ammonia
concentration of 0.04-0.08 mg NH3-N should be ensured in order to achieve the nitrite oxidizing bacteria (NOBs)
inhibition. High nitrite accumulation in the system should be avoid to prevent inhibition of anammox bacteria.
The control of other parameters (i.e., DO values, temperature, pH, C/N ratios, sludge structure) plays an
important role in maintaining the co-existence of anammox with other processes (Kumar and Lin 2010; Jin et al.
2012) and in impacting on the activities of partial nitrification, anammox and denitrification. However, the
impact on the microbial interaction has not been well documented (Zhang et al. 2012). The structure of the
sludge also plays a key role on the resistance of the bacteria involved in the SNAD process. Chen et al. (2009),
in a single, oxygen-limited, non-woven rotating biological contactor (NRBC) reactor, showed that in the outer
layer of biofilm, biomass was mostly micrococcus, presumably AOBs, with a spot of aerobic heterotrophic
bacteria. In the inner layer of biofilm, biomass was typical cauliflower like aggregates, presumably anammox
organisms. The biomass structure was similar to that of CANON biomass, however, the authors also found other
biomass in the inner layer of biofilm, presumably denitrifying organisms. Those results were confirmed later by
other researches in granular systems (Li et al. 2011b).
Sequencing Batch Reactors (SBRs) are usually applied to develop the SNAD process (Lan et al. 2011;
Daverey et al. 2012). SBRs provides efficient biomass retention (over 90% of biomass retention), ensuring the
enrichment of very slow-growing microbial community, such as the aerobic and anaerobic autotrophic nitrifiers
(AOB and anammox bacteria). Also other reactor configuration have been applied, such as a non-woven rotat-
ing biological contactor (NRBC) reactor (Chen et al. 2009), an aeration tank (Wang et al. 2010), a sequencing
batch biofilm reactor (SBBR) (Zhang et al. 2012). The performance of SNAD process can be further enhanced
by applying high sludge retention time. This could be achieved by applying carrier materials to develop biofilms
or by self-aggregation in granules. Biofilm and granules also help to prevent inhibition by high concentration of
oxygen, nitrite and other inhibitors in the bulk liquid.
The co-existence of nitrifying, anammox and denitrifying bacteria has also been proved by molecular
techniques (Innerebner et al. 2007; Langone et al. 2013b). Investigations are further required to work out optimal
conditions for such challenging co-existence.
4. Biological process modeling
Nowadays, in Wastewater Treatment Plants (WWTPs), mathematical models, based on deterministic
approaches, are widely applied, especially to describe biological processes. Models usually express bulk
biological processes which are not pure microbiologically correct due to the difficulty in modeling the several
mechanisms involved and to the lack of a clear knowledge. The Activated Sludge Model No.1, ASM1 (Henze et
al. 1987)) can be considered as the reference deterministic model, describing autotrophic and heterotrophic
reactions, developed with the aim of creating a word standard mathematical model. In 1995, updated versions
have been proposed to incorporate biological phosphorous removal, ASM2 (Henze et al. 1995) and ASM2d
(Henze et al. 2000). In 1999, another version of ASM1, called the ASM3 model (Gujer et al. 1999), has also
been introduced which corrects a number of known defects present in the original model. The modular structure
of ASMx is designed to be easily update by adding new chemical- biological modules. As consequence several

Chapter 1
53
ASM-type models have been developed. Also stochastic approaches that model time series have been applied to
WWTPs. Those methods can be developed from input and output monitoring data, without the use of a large
number of coefficients required in common deterministic dynamic mathematical models (Novotny et al. 1990).
In recent years, the application of Artificial Neural Networks to predict the performance of biological systems
has been attempted (Civelekoglu et al. 2007; Khataee and Kasiri 2011) especially to capture the non-linear
relationships that exist between variables in complex systems. However the mathematical modeling remains the
most applied method to understand and predict phenomena in WWTPs, due to its large diffusion and relatively
simplicity. At the same time, as the knowledge of the biological- physical- and chemical processes improves, the
mathematical models are getting more and more complex with a large numbers of kinetic and stoichiometric
parameters. The support of a mathematical model is fundamental to both research purposes, to evaluate
experimental results and in testing hypotheses, in industrial applications, in the design of processes and
management strategies.
Simultaneous partial Nitritation, Anammox and Denitrification (SNAD) process is a changeling choice to
treat highly concentrated ammonium wastewaters with a low biodegradable carbon nitrogen ratio (CODbio/N),
such as anaerobic digester effluents, landfill leachates, industrial wastewaters (Chen et al. 2009; Wang et al.
2010; Daverey et al. 2012). In order to explain, predict and control the complicated interactions and dynamics in
SNAD processes, models and computer simulations are helpful tools. The developments of mathematical
modeling, focusing mainly on recent ASM-type models and aerobic and anoxic nitrite route models in WWTPs
are following reported.
4.1 Over the ASMx Models
The Activated Sludge Models (ASMx) are the most widespread and standard models for WWTPs. They were
developed by a Task Group on Mathematical Modeling for design and Operation of Activate Sludge Processes
established by the International Association on Water Pollution Research and Control (IAWPCR), as it was then
called.
The ASMx family describes biological reactions introducing a matrix format (the Petersen or Gujer table).
The ASMx structure is composed of a stoichiometric matrix with compounds and biological processes, and a
composition matrix with the composition in terms of conserved balances (es. COD, N and Charge balance), a
rate vector and extra information as units and names. In the model, the organic carbon and nitrogenous
compounds are subdivided into a restricted number of fractions based on their biodegradability and solubility
characteristic building a specific component. The chemical oxygen demand (COD) is usually adopted as measure
of the concentration of organic matter. The effects of each component are described in the kinetic equations with
a Monod saturation function, which includes two main parameters: the maximum rate parameter (µ) and the
saturation constant (K). The saturation term (S/(K+S)) can have a value between 0 and 1. Inhibition effects are
described similarly, using an inhibition constant. Some of the main assumptions of the first ASM1 – ASM2 and
ASM3 models have several implications for practical model application. Some of these assumptions had been
modified in later extended models (temperature and pH range, wastewater type influent, to name a few). In this
contribution, notations according to Corominas et al., (2010) are adopted.
The Activated Sludge Model No.1, ASM1, was published in 1987 (Henze et al. 1987) and represents the first
standard mathematical model. Many of the basic concepts of ASM1 were adapted from the activated sludge
model described by (Dold et al. 1980). ASM1 was developed primarily for municipal activated sludge WWTPs

Chapter 1
54
to model carbon oxidation, nitrification and denitrification, performed by autotrophic nitrogen organisms (ANO)
and ordinary heterotrophic organisms (OHO), which use oxygen or nitrate as the electron acceptor. ASM1 was
designed for applications at lower temperature (5-20°C), under which no significant accumulation of nitrite
occurs. Thus, the nitrite production and consumption is not modeled and, for simplicity, both nitrification and
denitrification were considered to be a single step process. The first step of nitrification (nitritation) is normally
considered the limiting step in aerobic oxidation of ammonia (Downing et al. 1964). The model does not take
into account temperature and pH variations (pH near neutrality). Further this model does not implement storage
of organic substrates process. The model aims at achieving a good description of the sludge production.
The ASM1 has 13 components and 19 parameters, five of which are stoichiometry. In ASM1 basically four
processes are considered: (i) growth of biomass: aerobic growth of heterotrophs (XOHO); anoxic growth of
heterotrophs; aerobic growth of autotrophs (XANO); (ii ) decay of heterotrophs and autotrophs biomass; (iii )
ammonification of organic nitrogen (XCB,N); (iv) hydrolysis of particulate organic carbon (XS) and nitrogen
(XCB,N). The readily biodegradable COD (SB) and the soluble total ammonium-nitrogen concentration (TAN),
SNHx, are considered as the only substrates for the growth of heterotrophs and autotrophs, respectively. The
slowly biodegradable material (XCB) is supposed to be converted into readily biodegradable (SB) material by
hydrolysis reaction, introducing a delay into the oxygen utilization. The aerobic growth of heterotrophs occurs at
the expense of soluble organic matter (SB) and oxygen (SO2) while the anoxic growth of heterotrophs occurs at
the expense of soluble organic matter (SB) and nitrate (SNOx) with oxygen as inhibitor using a switching function.
The SNOx is assumed to be both the sum of nitrate and nitrite and the sum of the ionized (NO2--N) and un-ionized
(HNO2) nitrogen forms, not considering pH variation and HNO2/NO2- equilibrium. In the model, the growth rate
expression (µOHO,max) and the saturation coefficient (KSB,OHO) used for heterotrophic aerobic growth and anoxic
are the same, thus to simulate that the maximum specific rate of substrate removal under anoxic conditions is
lower than under aerobic condition, an empirical coefficient (ηu,OHO,AX) is added to the anoxic rate expression.
The aerobic growth of autotrophs is expressed as function of total soluble ammonium-nitrogen concentration
(TAN), SNHx, which is assumed to be the sum of the ionized (NH4+-N) and un-ionized (NH3-N) nitrogen forms,
not considering pH variation and NH3/NH4+ equilibrium. The coefficients for nitrification are assumed to be
constant and to incorporate any inhibitory effects. In all growth process TAN is considered removed from
solution and incorporated in cell mass (iN,XBio). The approach adopted for modeling decay of the heterotrophic
and autotrophic biomass is the same and based on the growth - death – growth concept (death-regeneration) of
Dold et al., 1980, defined as the decay of biomass followed by hydrolysis and growth on secondary substrate
arising from decay (Van Loosdrecht and Henze 1999). A single decay process (decay, lysis, endogenous
respiration, predation, etc) was introduced to describe the sum of all decay processes under all environmental
conditions (aerobic, anoxic). The decay acts to convert biomass to a combination of endogenous particulate
products (XU,B and XCB,N) and slowly biodegradable material (XCB), without loss of COD and electron acceptor
utilization. Further the decay continues at a constant rate (bOHO and bANO). The biomass decay implies a recycle
of organic and nitrogen substrate through the system. As consequence the flow of COD in ASM1 is rather
complex, with interaction between the decay of heterotrophs and of nitrifiers. The model considers the
ammonification process of soluble biodegradable organic nitrogen (XCB,N) into total ammonium nitrogen (SNHx).
Finally, the model puts emphasis on hydrolysis of organic matter, which is well described but the model couples
together the hydrolysis of the slowly biodegradable substrate (XCB) and particulate biodegradable organic
nitrogen (XCB,N) considering that occur simultaneously with equal rate. The alkalinity is introduced to guarantee

Chapter 1
55
the continuity in ionic charge of biological processes and is taken into account in the stoichiometry but does not
limit the kinetic rates. Main gaps in ASM1 are: the absence of any term in the kinetic rate expression to model
nutrient (ammonia) limitation in the heterotrophic growth process and ammonia and nitrite inhibition in the
autotrophic growth process; the lack of the component N2 in the anoxic growth of heterotrophic biomass in order
to close mass balances. Finally soluble non-biodegradable organic nitrogen and particulate non-biodegradable
organic nitrogen do not appear.
In 1995, an updated version of ASM1 was introduced to include a simple model of biological phosphorous
removal (BPR) performed by phosphorous-accumulating- organisms (PAO), ASM2 (Henze et al., 1995). In
addition to the phosphorous biological process, ASM2 includes the fermentation process and two chemical
processes to model chemical precipitation of phosphorus. ASM2 replace the readily biodegradable substrate (SB)
of ASM1 by the sum of the end products of fermentation (SAc) and the truly readily biodegradable substrate,
which is fermentable (SF). In contrast to ASM1, where all particulate organic material is expressed as COD, in
ASM2 the biomass has a cell internal structure where all organic storage products are lumped into one model
component (XPAO,PHA) and includes poly-phosphate (XPAO,PP) as inorganic fraction of activated sludge, which
does not exert any COD. PAOs can only grow on cell internal organic storage material (XPAO,PHA); storage is not
depending on the electron acceptor conditions, but is only possible when fermentation products (SF) such as
acetate are available. In ASM2 basically six processes are considered: (i) growth of biomass: aerobic growth of
heterotrophs (XOHO) on fermentable substrate (SF) and fermentable products (SAc); anoxic growth of heterotrophs
on fermentable substrate (SF) and fermentable products (SAc); aerobic growth of phosphorous- accumulating
organisms (XPAO) on cell internal organic storage products (XPAO,PHA), aerobic growth of autotrophic nitrifiers
(XANO); (ii ) transformation process: anaerobic fermentation of heterotrophs (iii ) storage processes: storage of
cell external fermentation products (SAc) in the form of cell internal organic storage material (XPAO,PHA); storage
of ortho-phosphate (SPO4) in the form of cell internal poly-phosphate (XPAO,PP); (iv) decay of heterotrophs,
autotrophs and phosphorous-accumulating biomass and decay of PAO storage products; (v) hydrolysis of
particulate organic carbon; (vi) chemical precipitation of phosphate.
The heterotrophic biomass (XOHO) is responsible for the hydrolysis of slowly biodegradable substrate (XCB),
the aerobic degradation of fermentable organic substrate (SF) and of fermentation products (SAc), anoxic
oxidation of SF and SAc and the reduction of nitrate (SNOx) (denitrification), and anaerobic fermentation of SF
into SAc. Further, microorganisms are subject to decay. These processes are modeled as parallel processes and
require nutrient uptake into the biomass. Nitrification is one step process and it is modeled as proposed in ASM1
with the exception of nutrient uptake into the biomass. In contrast to ASM1, ASM2 introduces phosphorous –
accumulating microorganisms (XPAO) which are able to accumulate phosphorous in the form of poly-phosphate
(XPP). ASM2 does not consider the ability of PAO to denitrify but they can only grow on cell internal stored
organic materials (XPAO,PHA). First, it is assumed that PAO, in anaerobic/anoxic/aerobic condition may release
phosphate (SPO4) from the internal inorganic storage products (poly-phosphate (XPAO,PP)). This reaction release
energy that is utilized in the hydrolysis of XPAO,PP in order to store cell external fermentation products (SAc) in
the form of cell internal organic storage materials (XPAO,PHA). Then the regeneration of poly-phosphate,
necessary for the growth of PAO, occurs and the storage of ortho-phosphate (SPO4), in the form of cell internal
poly-phosphate (XPAO,PP) happens. The ASM2 can describe the block of storage of poly-phosphate if the
phosphorous content of PAOs becomes too high, introducing an inhibition term which is active as the ratio
XPAO PP/XPAO achieves the maximum allowable value of KSF PP_PAO. Finally the growth of PAO is modeled as an
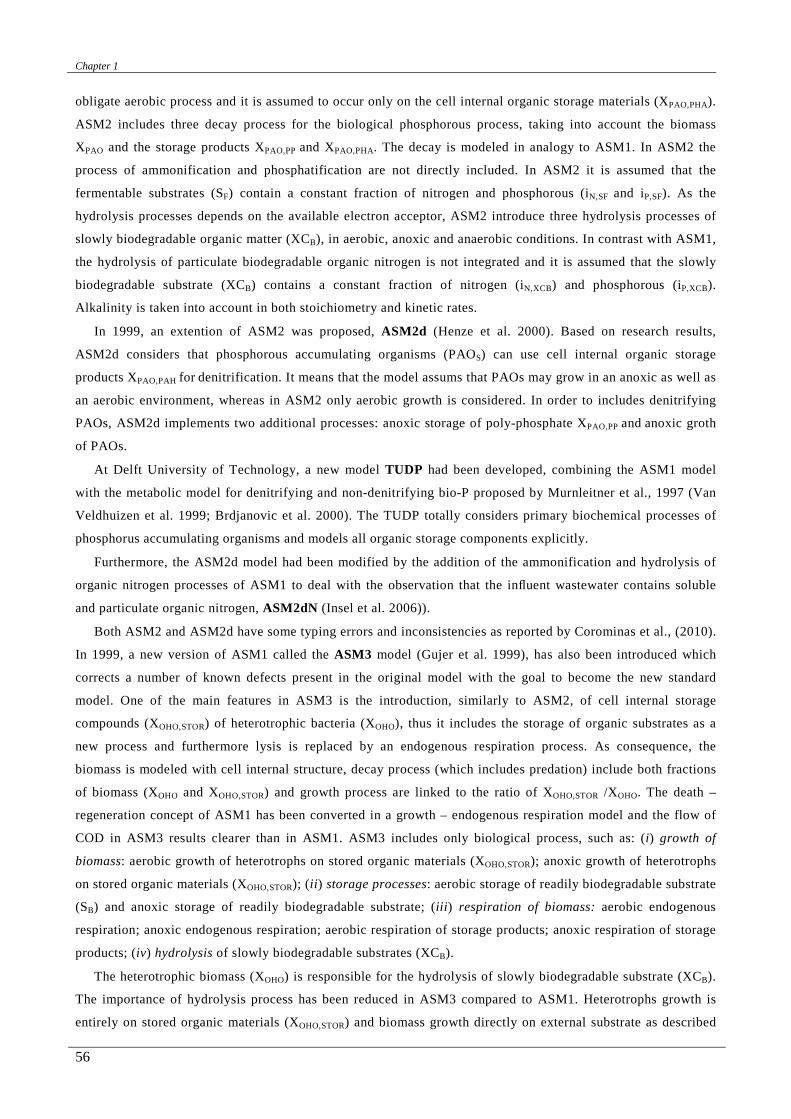
Chapter 1
56
obligate aerobic process and it is assumed to occur only on the cell internal organic storage materials (XPAO,PHA).
ASM2 includes three decay process for the biological phosphorous process, taking into account the biomass
XPAO and the storage products XPAO,PP and XPAO,PHA. The decay is modeled in analogy to ASM1. In ASM2 the
process of ammonification and phosphatification are not directly included. In ASM2 it is assumed that the
fermentable substrates (SF) contain a constant fraction of nitrogen and phosphorous (iN,SF and iP,SF). As the
hydrolysis processes depends on the available electron acceptor, ASM2 introduce three hydrolysis processes of
slowly biodegradable organic matter (XCB), in aerobic, anoxic and anaerobic conditions. In contrast with ASM1,
the hydrolysis of particulate biodegradable organic nitrogen is not integrated and it is assumed that the slowly
biodegradable substrate (XCB) contains a constant fraction of nitrogen (iN,XCB) and phosphorous (iP,XCB).
Alkalinity is taken into account in both stoichiometry and kinetic rates.
In 1999, an extention of ASM2 was proposed, ASM2d (Henze et al. 2000). Based on research results,
ASM2d considers that phosphorous accumulating organisms (PAOS) can use cell internal organic storage
products XPAO,PAH for denitrification. It means that the model assums that PAOs may grow in an anoxic as well as
an aerobic environment, whereas in ASM2 only aerobic growth is considered. In order to includes denitrifying
PAOs, ASM2d implements two additional processes: anoxic storage of poly-phosphate XPAO,PP and anoxic groth
of PAOs.
At Delft University of Technology, a new model TUDP had been developed, combining the ASM1 model
with the metabolic model for denitrifying and non-denitrifying bio-P proposed by Murnleitner et al., 1997 (Van
Veldhuizen et al. 1999; Brdjanovic et al. 2000). The TUDP totally considers primary biochemical processes of
phosphorus accumulating organisms and models all organic storage components explicitly.
Furthermore, the ASM2d model had been modified by the addition of the ammonification and hydrolysis of
organic nitrogen processes of ASM1 to deal with the observation that the influent wastewater contains soluble
and particulate organic nitrogen, ASM2dN (Insel et al. 2006)).
Both ASM2 and ASM2d have some typing errors and inconsistencies as reported by Corominas et al., (2010).
In 1999, a new version of ASM1 called the ASM3 model (Gujer et al. 1999), has also been introduced which
corrects a number of known defects present in the original model with the goal to become the new standard
model. One of the main features in ASM3 is the introduction, similarly to ASM2, of cell internal storage
compounds (XOHO,STOR) of heterotrophic bacteria (XOHO), thus it includes the storage of organic substrates as a
new process and furthermore lysis is replaced by an endogenous respiration process. As consequence, the
biomass is modeled with cell internal structure, decay process (which includes predation) include both fractions
of biomass (XOHO and XOHO,STOR) and growth process are linked to the ratio of XOHO,STOR /XOHO. The death –
regeneration concept of ASM1 has been converted in a growth – endogenous respiration model and the flow of
COD in ASM3 results clearer than in ASM1. ASM3 includes only biological process, such as: (i) growth of
biomass: aerobic growth of heterotrophs on stored organic materials (XOHO,STOR); anoxic growth of heterotrophs
on stored organic materials (XOHO,STOR); (ii ) storage processes: aerobic storage of readily biodegradable substrate
(SB) and anoxic storage of readily biodegradable substrate; (iii ) respiration of biomass: aerobic endogenous
respiration; anoxic endogenous respiration; aerobic respiration of storage products; anoxic respiration of storage
products; (iv) hydrolysis of slowly biodegradable substrates (XCB).
The heterotrophic biomass (XOHO) is responsible for the hydrolysis of slowly biodegradable substrate (XCB).
The importance of hydrolysis process has been reduced in ASM3 compared to ASM1. Heterotrophs growth is
entirely on stored organic materials (XOHO,STOR) and biomass growth directly on external substrate as described

Chapter 1
57
in ASM1 is not considered in ASM3. As in previous models, only a fraction of the heterotrophs is capable of
denitrification and a reducing factor is introduced. The storage of readily biodegradable substrate (XCB) in the
form of cell internal products (XOHO,STOR) can occur both in aerobic and anoxic conditions using the energy from
aerobic respiration and denitrification respectively. The model considers that the anoxic storage of (XCB) is
lower than aerobic one, introducing a reducing factor. The model assumes that substrates (SB), first become
stored material (XOHO,STOR) an then are assimilated to biomass for growth. This hypothesis is not true and a direct
growth rather than storage followed by growth can be simulated using a low yield coefficient for storage
(YSB,STOR Ox and YSB,STOR Ax) and a higher one for subsequent growth (Ystor,OHO Ox and Ystor,OHO Ax). In ASM3, the
model of decay is completely different from ASM1. The endogenous respiration occur both in aerobic and
anoxic conditions and describe all forms of biomass loss and energy requirements not associated with growth:
decay, maintenance, endogenous respiration, lysis, predation, motility, death and so on. Further, the model
assumes that also the storage products (XOHO,STOR) decay with biomass, under aerobic and anoxic conditions.
ASM3 makes some change in the matrix form, introducing a composition matrix that indicated the composition
of each components of the stoichiometric matrix relative to ThOD, N, ionic charge, SS. ASM1 and ASM3 are
both capable of describing the dynamic behavior in municipal WWTPs. Koch et al., 2000 concluded that ASM3
performs better in situations where the storage of readily biodegradable substrate is important such as for
industrial wastewater or for WWTPs with significant non-aerated zones. Also a carbon- based model (ASM3C)
was proposed where organic state variables are expressed in terms of organic carbon rather than COD (Henze et
al. 2000). The ASM3 model has been extended with a bio-P removal module ASM3+BioP by EAWAG Institute
(Rieger et al. 2001). The EAWAG Bio-P module requires four state variables in addition to the 13 components
defined in ASM3 to model the biological phosphorus removal differing from the BPR proposed in ASM2 model.
The ASMx models family do not consider as a model component nitrite (NO2-), which is an intermediate of
nitrification and denitrification. In the context of nitrification, modeling nitrite production and consumption
would be relatively easy. However, the exact fate of nitrite during denitrification was not sufficiently known
until the last decade. Until the ASM3, ASMx models with one step nitrification – denitrification always
considering total soluble ammonium-nitrogen concentration (TAN), SNHX, and total soluble nitrite-nitrogen
concentration, (TNN), as actual substrates for ammoniaum and nitrite oxidizers, respectively. In the subsequent
models some hypothesis have been advanced and tested to explain the limitation/inhibition effect of real
substrates/inhibitors of nitrification process.
Several models describing nitrite build-up during nitrification (NH4+/NH3→NO2
-→NO3-) have been
developed as reviewed by Sin et al., (2008) (Hellinga et al. 1999; Hao et al. 2002; Wett and Rauch 2003; Carrera
et al. 2004; Wyffels et al. 2004; Pambrun et al. 2006; Kaelin et al. 2009; Park and Bae 2009). Denitrification is
considered as a four-step process (NO3-→NO2
-→NO→N2O→N2). Usually, denitrification is modeled as two step
process (NO3-→NO2
-→ N2.) as the production of NO and N2O does not contribute significantly to the total mass
–flow of nitrogen in the biological system.
To date, some authors propone an extension of ASMx models for nitrite build-up in aerobic and anoxic
conditions as nitrite can play an important role in microbial conversions. Under certain conditions nitrite
concentrations can increase to a harmful level in WWTPs and aquatic environments (Philips et al. 2002a).
Further, nitrite route is becoming a changeling opportunity in WWTPs as new processes have been discovered
and developed: nitritation, simultaneous partial nitrification denitrification “via nitrite” route, anammox,
SHARON/anammox, CANON, SNAD and so on (Van Hulle et al. 2010).

Chapter 1
58
The Activated Sludge Model Nr. 1 (ASM1) was extended with a 2 step nitrification model (Wyffels et al.
2004). The authors preferred the ASM1 model with death–regeneration concept over the ASM3 model with the
endogenous respiration concept from the fact that endogenous respiration process was not yet clearly
documented for ammonium and nitrite oxidizing biomass. Further, the ASM1 described by Wyffels et al., 2004,
has been implemented with submodels for anammox process to interpret the results of an anammox enrichment
in an SBR system (Van Hulle et al. 2003; Dapena-Mora et al. 2004). Here, the death–regeneration concept was
chosen as biomass behaviors under substrate-limiting conditions was not completely clear and no biodegradable
substrate (BOD) was added with the influent, avoiding accumulation phenomena. The extension of ASM1 with
anammox process and two-step nitrification and denitrification was implemented is in the commercial software
WEST® (ASM1.e). In 2006, an evolution of an ASM2d-like model was proposed, ASM2d2N (Sin and
Vanrolleghem 2006)). The ASM2d2N introduces hydrolysis of organics nitrogen, two-step nitrification and two-
step denitrification. The Arrhenius equation was also included in the ASM2d2N to take into account temperature
effects. Further, updated versions of ASM3 were introduced to incorporate the 2 step nitrification and
denitrification process, ASM3_N (Iacopozzi et al. 2007) and the revised version of ASM3_N, ASM3_NO2
(Kaelin et al. 2009; Giusti et al. 2011).
Recently N2O modeling has received attention, as N2O is a powerful greenhouse gas. Most models only
consider N2O production by denitrifying microorganisms. A three-step denitrification model including the
reduction of nitrate, nitrite and nitrous oxide has been formulated (Von Schulthess et al. 1994). Samie et al.,
(2011) considered a four-step denitrification process, based on ASM1, to simulate soluble N2O production by
heterotrophic denitrifying biomass and estimate the gaseous emissions from the reactors. Nevertheless, N2O can
be produced both by heterotrophs (Richardson et al. 2009) and nitrifiers (Campos et al. 2009; Wunderlin et al.
2012; Xie et al. 2012). The N2O production mechanisms by nitrifying microorganisms are not well known.
Schreiber et al., (2009) have recently proposed a preliminary model for NO and N2O emissions from both
nitrification and denitrification occurring in a complex biofilm where during nitrification nitric and nitrous oxide
can be emitted, respectively, from the reduction of NO2 - and NO by ammonia-oxidizing bacteria.
A ASMN model (activated sludge model for nitrogen) based on the ASM1 with a two-step nitrification and a
four-step denitrification has been developed (Hiatt and Grady CP 2008). The ASMN model incorporates two
nitrifying populations-ammonia-oxidizing bacteria and nitrite-oxidizing bacteria-using free ammonia and free
nitrous acid, respectively, as their true substrates and four-step denitrification (sequential reduction of nitrate to
nitrogen gas via nitrite, nitric oxide, and nitrous oxide) using individual, reaction-specific parameters. The
authors also showed that results determined by using ASMN seem to be to be comparable with ASM1 results for
municipal-type influent. Magrí et al., (2007) developed a new model for the simulation of the treatment of
wastewaters with high nitrogen concentration, containing organic matter and phosphorus based on activated
sludge models ASMx and on specific models of the SHARON process. Finally, several modeling protocols
suggest values or how to measure some kinetic and stoichiometric parameters to be used in mathematic models:
WERF (Melcer et al., 2003), BIOMATH (Vanrolleghem et al., 2003) and HSG (Langergraber et al., 2004).
5. Conclusion
Anammox process was first proposed in wastewater treatment plants by Jetten et al. (1997), introducing the
concept of a more sustainable WWTP. The concept consisted in a first sedimentation step for the complete
removal of COD from wastewaters, maximizing the sludge production. Then, the sludge could be digested to
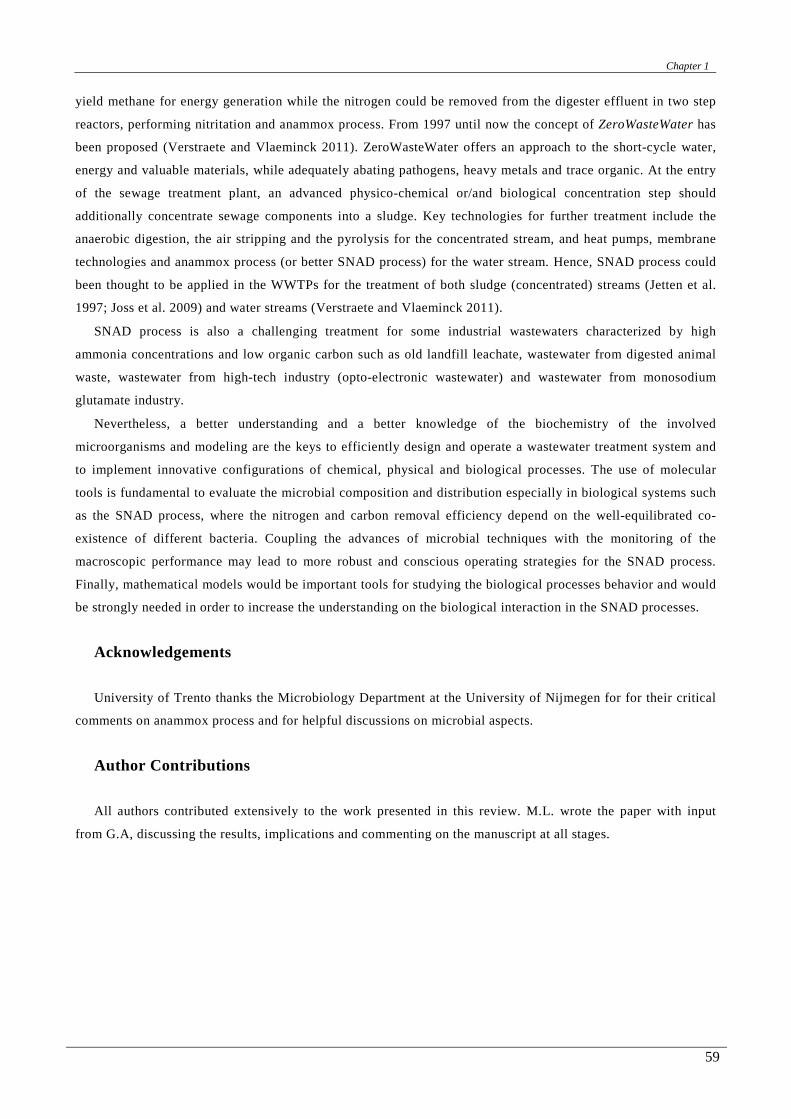
Chapter 1
59
yield methane for energy generation while the nitrogen could be removed from the digester effluent in two step
reactors, performing nitritation and anammox process. From 1997 until now the concept of ZeroWasteWater has
been proposed (Verstraete and Vlaeminck 2011). ZeroWasteWater offers an approach to the short-cycle water,
energy and valuable materials, while adequately abating pathogens, heavy metals and trace organic. At the entry
of the sewage treatment plant, an advanced physico-chemical or/and biological concentration step should
additionally concentrate sewage components into a sludge. Key technologies for further treatment include the
anaerobic digestion, the air stripping and the pyrolysis for the concentrated stream, and heat pumps, membrane
technologies and anammox process (or better SNAD process) for the water stream. Hence, SNAD process could
been thought to be applied in the WWTPs for the treatment of both sludge (concentrated) streams (Jetten et al.
1997; Joss et al. 2009) and water streams (Verstraete and Vlaeminck 2011).
SNAD process is also a challenging treatment for some industrial wastewaters characterized by high
ammonia concentrations and low organic carbon such as old landfill leachate, wastewater from digested animal
waste, wastewater from high-tech industry (opto-electronic wastewater) and wastewater from monosodium
glutamate industry.
Nevertheless, a better understanding and a better knowledge of the biochemistry of the involved
microorganisms and modeling are the keys to efficiently design and operate a wastewater treatment system and
to implement innovative configurations of chemical, physical and biological processes. The use of molecular
tools is fundamental to evaluate the microbial composition and distribution especially in biological systems such
as the SNAD process, where the nitrogen and carbon removal efficiency depend on the well-equilibrated co-
existence of different bacteria. Coupling the advances of microbial techniques with the monitoring of the
macroscopic performance may lead to more robust and conscious operating strategies for the SNAD process.
Finally, mathematical models would be important tools for studying the biological processes behavior and would
be strongly needed in order to increase the understanding on the biological interaction in the SNAD processes.
Acknowledgements
University of Trento thanks the Microbiology Department at the University of Nijmegen for for their critical
comments on anammox process and for helpful discussions on microbial aspects.
Author Contributions
All authors contributed extensively to the work presented in this review. M.L. wrote the paper with input
from G.A, discussing the results, implications and commenting on the manuscript at all stages.

Chapter 1
60
Supplementary Figures
Supplementary Fig. I-1 The phylogenetic tree of life as defined by comparative rRNA gene sequencing. The tree shows the three domains of organisms and a few representative groups in each domain. All Bacteria and Archaea and most Eukarya are microscopic organisms; only plants, animals, and fungi contain macroorganisms. Figure from Madigan and Martinko (2006).
Supplementary Fig. I-2 Some major phyla of Bacteria based on 16S ribosomal RNA gene sequence comparisons. Over 80 phyla of Bacteria are currently known, including many phyla known only from environmental sequences obtained in community sampling. Figure from Madigan and Martinko (2006).
.

Chapter 1
61
Supplementary Fig. I-3 Phylogenetic tree of some key genera of proteobacteria. Phylogenetic tree constructed by comparative 16S rRNA sequencing. Identical metabolisms are often distributed in phylogenetically distinct genera. Some organisms listed may have multiple properties: some sulfur chemolithotrophs are also iron or hydrogen chemolithotrophs, and several of the organisms listed can fix nitrogen. Figure from Madigan and Martinko (2006).


Chapter 2
63
II. Chapter
Co-existence of nitrifying, anammox and
denitrifying bacteria in a sequencing batch
reactor
This chapter was based on:
Langone M., Yan J., Haaijer S. C.M., Op den Camp H. J. M., Jetten, M. S. M., Andreottola G. (2013).
Coexistence of nitrifying, anammox and denitrifying bacteria in a sequencing batch reactor. submitted

Chapter 2
64
Coexistence of nitrifying, anammox and denitrifying bacteria in a Sequencing Batch Reactor.
Michela Langonea, Jia Yanb, Suzanne C.M. Haaijerb, Huub J. M. Op den Campb, Mike S. M. Jettenb, Gianni Andreottolaa
a Department of Civil, Environmental and Mechanical Engineering, University of Trento, Via Mesiano 77, Trento 38123, Italy b Department of Microbiology, IWWR, Radboud University Nijmegen, Heyendaalseweg 135, 6525 AJ Nijmegen, Netherlands
ABSTRACT
High nitrogen and carbon removal efficiencies were observed in a sequencing batch reactor (SBR), treating reject waters (up to 650 mg NH4
+-N L-1 and 300 mg COD L-1) of the Zürich wastewater treatment plant (Switzerland). The Simultaneous partial Nitritation, Anammox and Denitrification (SNAD) process appeared to occur. The SNAD biomass, at room temperature, showed potential aerobic and anaerobic ammonia oxidation activities of 1.8 nmol N mg protein-1 min-1 and 0.34 nmol N mg protein-1 min-1, respectively. The microbial community composition of the SNAD biomass was analyzed by 16S rRNA and functional gene-based analysis and further visualized by FISH. The 16S rRNA gene and functional gene approach suggested this SNAD biomass had a diverse microbial community. The main groups of microorganisms were found to be ammonia-oxidizing bacteria of the Nitrosomonas europaea/eutropha group, anaerobic ammonium-oxidizing bacteria of the “Candidatus Brocadia fulgida” type and denitrifying bacteria related to the betaproteobacteria Thauera, Pseudomonas, D. aromatica and Aromatoleum aromaticum. Nitrite-oxidizing bacteria from the genus Nitrobacter were detected while no nitrite-dependent anaerobic methane oxidizing bacteria were found.
FISH analysis of the SNAD biomass samples clearly showed that long filamentous microorganisms were dominant in the outer layer of the granules, with single cells as well as aggregates trapped in a net of these filamentous bacteria. The spatial position of two of the major community constituents, aerobic and anaerobic ammonia oxidizing bacteria, were visualized within the biomass. Aerobic nitrifiers were located at the outside of the aggregates as single cells and in clusters, while anammox bacteria were abundant in the inner part of the granules in agreement with the expectation that the interior of the aggregates would be anoxic. PCR and FISH results correlated well and confirmed that the co-existence of aerobic ammonia-oxidizing, anammox and denitrifying bacteria.
Keywords: amoA, Brocadia, co-existence, Denitrifiers, FISH, n-damo, Nitrobacter, Nitrosomonas, NirS, PCR, phylogenetic, SNAD, 16 S rRNA
1. Introduction
Biological nitrogen removal in wastewater treatment plants (WWTPs) is carried out by various subsequent
microbial processes. Traditionally, nitrogen removal from main-stream wastewaters has been performed by a
combination of autotrophic nitrification and heterotrophic denitrification in activated sludge, biofilm and
granular systems. Nitrification and denitrification processes can be developed either in separate tanks or in one
single reactor. In conventional activated sludge processes, nitrification and denitrification processes are
physically divided and the optimal operative conditions for each microorganism species are achieved in each
reactor. In one-step systems, the co-existence of nitrifiers and denitrifiers has to be ensured by optimal design
and operation of the bioreactor, biomass carrier and selection pressure. Due to its space-saving and operation
flexibility, the Sequencing Batch Reactor (SBR) is a one-step system that has been widely used for nitrogen
removal (Henze 1991; Obaja et al. 2003). However, high operational costs, due to the oxygen supply for
nitrification and external organic carbon requirements for denitrification, have restricted wider applications of
nitrification and denitrification for side-stream wastewater such as reject waters of urban and industrial plants
and landfill leachates (Ahn 2006; van Hulle et al. 2010; Zhang et al. 2010a; Verstraete and Vlaeminck 2011).

Chapter 2
65
Reject waters, the liquid fractions produced in the dewatering stage after anaerobic digestion, like landfill
leachates, are characterized by high nitrogen (N) concentrations and low organic carbon (COD) content,
resulting in a very low biodegradable COD:N ratio. The amount of total ammonium nitrogen is extremely high,
with a high oxygen demand in nitrification, while organic matter is usually not enough for a complete
denitrification and has to be provided externally (Obaja et al. 2003; Wiszniowski et al. 2006). New nitrogen
removal pathways were recently discovered and new biological nitrogen removal processes have been developed
in WWTPs as alternatives to the traditional nitrification–denitrification. For instance, the nitritation process
followed by denitrification via nitrite is more energy and cost-effective than conventional full
nitrification/denitrification process, due to the elimination of nitrite oxidizer activity. This process has been
successfully implemented in full scale application (Hellinga et al. 1998; Mulder et al. 2001). Further innovation
came from the enrichment of the anaerobic ammonium oxidizing bacteria (anammox), whose existence were
predicted by Broda (Broda 1977) and activity first observed in a WWTP by Mulder et al. (1995), and finally
identified by Strous et al. (1999b). The possibility to convert ammonium with nitrite under anaerobic conditions
without the need for addition of electron donors has opened up possibilities to further minimize energy and other
expenses within wastewater treatments (Jetten et al. 1997; Kartal et al. 2010). Combination of nitritation with the
anammox process has been implemented in various wastewater treatment plants around the globe (Wett et al.
1998; Third et al. 2001; Philips et al. 2002b; Szatkowska et al. 2007b). Other nitrogen converting bacteria of
possible use for wastewater treatment are the so-called n-damo bacteria which are capable of nitrite-dependent
anaerobic methane oxidation. These bacteria were first discovered in a freshwater system (Raghoebarsing et al.
2006), enriched from a ditch in the “Ooijpolder”, The Netherlands, (Ettwig et al. 2009) and finally detected in
nine activated sludges of WWTPs with an anaerobic digestion section (Luesken et al. 2011b).
The possible co-existence of anammox bacteria in a single reactor with either nitrifiers (Third et al. 2001),
denitrifiers (Kumar and Lin 2010) or n-damo bacteria (Luesken et al. 2011c) is attractive and has been studied
and tested. In particular, different combinations of nitrification, denitrification and anaerobic oxidation of
ammonium, under appropriate environmental oxygen-limited conditions, have been reported for nitrogen
removal both for main and side-stream wastewaters (Daverey et al. 2012; Winkler et al. 2012a). The engineering
challenge of using one single reactor to achieve a complete nitrogen and carbon removal has led to studies on the
co-existence and interaction between different bacteria (Yan et al. 2010, 2012; Luesken et al. 2011c). The use of
a single tank has some advantages over a configuration with two or more reactors, as single-stage processes
generally have a higher volumetric nitrogen removal rate and lower capital costs than multi-stage systems
(Kalyuzhnyi et al. 2006; van Hulle et al. 2010; Wang et al. 2012). Full-scale implementations of the biological
Simultaneous partial Nitritation, Anammox and Denitrification (SNAD) process in one single reactor, where
autotrophic oxidation of ammonium to nitrite is followed by an anaerobic ammonium oxidation and
denitrification process, were successfully achieved in the last decade (Chen et al. 2009; Wang et al. 2010; Lan et
al. 2011; Daverey et al. 2012). Most SNAD systems are operated in granular Sequencing Batch Reactors (SBRs).
Both SBR technology and granulation allow the co-existence of several bacterial populations. The SBR, widely
used in WWTPs and in laboratory studies, is a single tank that serves as both a biological reactor and a settler in
a temporal sequence (Artan and Orhon 2005). The dynamic operative conditions of SBRs can dictate different
metabolic activity by sequencing each phase of the mixing, aeration and non-mixing/non-aeration pattern during
each cycle, ensuring different macro-environmental conditions for bacteria (aerobic/anoxic conditions or
high/low loading). On the other hand, bio-granulation technology (both aerobic and anaerobic) has attracted

Chapter 2
66
great research interests for the removal of organic, nitrogen and phosphorus compounds from wastewater.
Aerobic granulation is naturally developed in SBR systems (Liu and Tay 2004; Liu et al. 2005). Aerobic
granules, compared to fluffy and irregular conventional activated-sludge flocs, have a compact microbial
structure and a strong microbial stratification that develops different micro-environments from the outer to the
inner layer of aggregates (Vlaeminck et al. 2010). Both SBR and granulation technology facilitate high biomass
concentration and accumulation of slow growing organisms, such as nitrifying and anammox bacteria (Strous et
al. 1998; de Kreuk and van Loosdrecht 2004; Liu et al. 2005). Moreover, both of these technologies improve the
system resistance to shock and toxic loadings, preventing inhibition effects (Etterer and Wilderer 2001; Mohan
et al. 2005). Therefore, coupling the SBR and granulation technology, creating different macro- and micro-
environments both in the bulk liquid and in the biomass, is a sustainable way to improve the co-existence of
nitrifying, anammox and heterotrophic denitrifying biomass in one single reactor for nitrogen and organic carbon
removal.
A better understanding of the microbial community composition and concomitant knowledge of the
physiology of the community members may lead to improved success for biological nitrogen removal in
wastewater treatment. Recent applications of molecular biology have provided techniques to determine microbial
presence, diversity and abundance in different environmental compartments and in WWTPs. A variety of
molecular methods are used to estimate either the diversity or overall abundance of microbial communities. The
nucleic acid isolation and extraction from environmental samples (total DNA isolation and extraction) is one of
the first steps in molecular studies, as organisms can be detected by assaying genes that encode either ribosomal
RNA (rRNA) or enzymes that support a specific physiology. The rRNA or functional genes can be amplified by
the Polymerase Chain Reaction (PCR) technique. Following the amplification of a gene, there are a number of
strategies for investigating the diversity, abundance and structure of that gene in a mixed community. In order to
examine the community structure and phylogeny, a library of gene sequences is usually developed from the
products of the PCR by cloning gene fragments and performing a sequencing analysis. The overall relative
abundance of any particular gene fragment is frequently measured by a modified PCR (quantitative PCR -
qPCR). Fluorescence in situ hybridization (FISH) is another molecular technique widely applied in
environmental analysis, where fluorescent probes are used to identify organisms that contain a nucleic acid
sequence complementary to the probe (Amann et al. 1990). Studies have investigated the diversity of specific
bacteria in a complex microorganism community, as could be the SNAD biomass, using FISH (Third et al. 2001;
Vázquez-Padín et al. 2010; Winkler et al. 2012a), phylogenetic analysis (Quan et al. 2008; Li et al. 2009; Xiao et
al. 2009; Burgmann et al. 2011; Daverey et al. 2012) and both techniques (Date et al. 2009; Wang et al. 2010).
However, further research into both the microbial community composition and the activities of important
community members remained to be performed. Therefore the objectives of this study were to assess the
microbial community composition and the activities of major community members of SNAD biomass originating
from a WWTP located in Zürich, Switzerland (Joss et al. 2009). To investigate the microbial community
composition by polymerase chain reaction (PCR), amplifications using primers targeting 16S rRNA genes
(phylogenetic marker) and primers targeting genes coding for parts of physiologically relevant enzymes
(functional marker) were performed for relevant groups of microorganisms (anammox bacteria, aerobic ammonia
oxidizers and denitrifiers). For each microorganism, clone libraries were constructed and clones sequenced and
phylogenetic analyses were performed. In addition, the presence and diversity of bacteria involved in possible
secondary processes were assessed: the aerobic nitrite-oxidizing bacteria and nitrite-dependent anaerobic

Chapter 2
67
methane oxidation (n-damo) bacteria. Furthermore, the spatial structure within the biomass of two of the major
community constituents, the aerobic and anaerobic ammonia-oxidizing bacteria, was visualized by FISH
analyses using specific probes. The activities of these two groups were also assessed.
2. Materials and Methods
2.1. Sample collection
The SNAD seed sludge, investigated in this study, was collected from an SBR for the digester supernatant
treatment at the WWTP of Zürich, Switzerland. In this reactor a complete partial nitrification, anammox and
denitrification process occurred (Joss et al. 2009). Table II-1 and Table II-2 list SBR details. The SNAD sludge
contained granules surrounded by a matrix of brownish flocs. Two kinds of granules (red and brown) could be
distinguished. The granules had diameters between 0.1 and 2.0 mm. Prior to the microbial characterization, the
sludge was stored at – 4°C and gently mixed to avoid the destruction of granules.
Table II-1 Influent and effluent characteristics of reject water of Zürich plant (CH) (Joss et al. 2009).
Parameters Influent Effluent u.m Temperature 27±1 30±3 °C Conductivity 5.5±0.1 2.4±0.2 mS cm-1 pH 7.8 ±0.1 7.1 ±0.2 Total Ammonium Nitrogen (TAN) 650±50 30±10 mgN L-1 Total Nitrite Nitrogen (TNN) <0.2 <0.2 mgN L-1 Nitrate Nitrogen <0.2 5 ±5 mgN L-1 Soluble COD 300±50 190±50 mg L-1
Total COD 630±50 400±100 mg L-1 SST 250±50 150±100 mg L-1 DOC 80 - mg L-1
Table II-2 SBR operative conditions of Zürich plant (Joss et al. 2009).
Parameters Values u.m
Volume 1400 m3 Dissolved Oxygen < 0.8 mg L-1 pH 7.1 ± 0.2 - Temperature 30 °C MLSS ̴ 3.6 kg SS m
-3
Nitrogen Load 1250 kgN d-1
Volumetric Nitrogen Load 0.44 kgN m-3 d-1 HRT 1.45 d
Chapter 2
68
2.2. Genomic DNA extraction and purification
To maximize DNA extraction efficiency a representative sample (0.3 mL) with red and brown granules and
brownish flocs was taken and its granules and flocs were aseptically broken, by passing through a series of
syringe needles (0.60-0.30 mm). Thereafter, DNA was extracted using a CTAB DNA isolation method adapted
from the protocol published by Zhou et al. (1996) and described previously (Yan et al. 2010).
The method is a CTAB (cetyltrimethylammonium bromide) extraction buffer- and a SDS-lysis-based method
with phenol chloroform purification, as it is a suitable method for samples with a high molecular weight.
Biomass (0.3 mL) was harvested by centrifugation for 10 min, 13,000×g. Cells were re-suspended in 675 µL of
1% CTAB extraction buffer (1% CTAB, 100 mM Tris, 100 mM EDTA, 100 mM sodium phosphate buffer, and
1.5 M NaCl, adjust to pH 8 using HCl). After addition of 50 µL lysozyme (10 mg mL−1; 66,200U mg−1) and of
30µL Rnase A (10 mg mL−1), biomass was incubated (30 min, 37°C). Then, 50 µL of proteinase K (10 mg mL−1;
20 U mg−1) was added, followed by incubation for 30 min at 37°C. Subsequently, 150µL 10% SDS was added
and the mixture was incubated for 2h at 65°C. The DNA was separated from cell debris by addition of 500 mL
Phenol/Chloroform/Isoamylalcohol (25:24:1) and 20 min of incubation at 65°C, followed by centrifugation for
20 min at 13,000×g. The upper water phase, containing the genomic DNA, was mixed with 1 volume of
Chloroform/Isoamylalcohol (24:1) and centrifuged (20 min, 13,000×g) to remove traces of phenol. Again, the
upper water phase was removed and 0.6 volume of isopropanol was added to the supernatant. After incubation at
room temperature for 30 min and subsequent centrifugation for 20 min at 13,000×g, the precipitation of DNA
was achieved. The genomic DNA was then washed with 0.5 mL of ice cold 70% ethanol (to remove co-
precipitated salts) and air dried at room temperature for about 15 min. Finally, the DNA was suspended in 50 µL
of ultrapure water (MilliQ, Millipore SA, Moisheim, France) and kept at 4°C until further analysis. DNA quality
was checked by 1% agarose gel electrophoresis.
2.3. PCR amplification
After genomic DNA isolation, qualitative PCRs have been performed. PCR analyses were performed in a
T gradient cycler (Whatman Biometra, Göttingen, Germany) using as buffer and enzyme formulation the
GoTaq® Green Master Mix (Promega Benelux BV, Leiden, the Netherlands), according to the manufacturer’s
protocol instructions. Negative controls (no DNA added) were included in all sets of amplifications. To analyze
the microbial community composition in the SNAD process, independent PCR assays were conducted, targeting
both main and possible secondary biological processes (Fig. II.1). Reaction mixtures (25 µL) used for PCR
amplification contained 0.5 µL of each primer forward and 0.5 µL of each primer reverse, 12.5 µL of GoTaq®
Green Master Mix, including GoTaq® DNA Polymerase, dNTPs, MgCl2 and reaction buffers, 1 µL of DNA
diluted template corresponding to 25 ng of total DNA, and RNase-free water (DEPC) to complete the 25 µL
volume. Specifications of all the primers used in this study are listed and described in Table II-3 including the
annealing temperatures (Ta). All PCR’s were run with an initial denaturation of the template DNA at 96 °C for 1
min, followed by 35 cycles of 1 min at 96°C, 1 min at a different annealing temperature (Ta), and 1 min at 72 °C.
The reaction was completed after 10 min at 72 °C. In all cases, PCRs were performed both using 1:100 and 1:10
dilutions of the original template DNA solution.
Aerobic Ammonia oxidizing bacteria (AerAOB). To detect AerAOB of the beta-subclass of proteobacteria,
the bacterial amoA gene (coding for the alpha subunit of the ammonia monoxygenase enzyme) was amplified

Chapter 2
69
using forward primer AmoA-1F and reverse primer AmoA-2R, resulting in 453-bp fragments (Rotthauwe et al.
1997).
Anammox bacteria. To investigate the anammox bacterial community two different primer combinations
were used. A standard PCR amplification of the 16S rRNA gene of members of the Planctomycetales phylum
was performed with forward primer Pla46F targets a stretch corresponding to positions 46-63 and universal
reverse primer 630R targets a stretch corresponding to positions 1529-1545, resulting in 1400 bp products
(Schmid et al. 2003). Also, a specific primer combination of Amx368F/Amx820R (452 bp) was used for the direct
preferential amplification of the 16S rRNA gene of the members of anammox bacteria (Schmid et al. 2003).
Denitrifying bacteria. To determine the presence of denitrifying bacteria, PCR amplification targeting the
nitrite reductase (nirS) gene was performed, as the nirS gene is widely distributed in denitrifiers microorganisms
(Braker et al. 1998). Forward primer NirS1 targeting a stretch corresponding to positions 763–780 and reverse
primer NirS 6 targeting a stretch corresponding to positions 1638–1653 (890 bp products) were used (Braker et
al. 1998; Throbäck et al. 2004).
Aerobic Nitrite oxidizing bacteria (AerNOB). Both Nitrobacter spp. and Nitrospira spp. AerNOB were
targeted. To identify Nitrobacter spp. specific primer combinations targeting both 16S rRNA genes
Nitro1198F/Nitro1423R (225 bp) (Graham et al. 2007), and NxrA functional genes, NxrAF1370F/F2843R
(1473 bp) (Wertz et al. 2008) were used. Nitrospira-like nitrite-oxidizing bacteria were investigated by
amplification of the 16S rRNA gene using primer combinations Nspra-675F/Nspra-746R (93 bp) (Graham et al.
2007) and 616F/ Ntspa1158R (1168 bp) as previously described by Maixner et al. (2006).
Anaerobic nitrite-dependent methane oxidation bacteria (n-damo). In order to detect n-damo bacteria two
different primer combinations were used. First, in order to identify M. oxyfera-like bacteria on a functional level,
the bacterial pmoA gene was amplified using the specific forward primer pmoA 47 (cmo182) (Luesken et al.
2011a) and the reverse primer A 682 (Holmes et al. 1995) in a direct PCR. In view of the fact that all enrichment
cultures of n-damo bacteria were dominated by the same group of bacteria within the NC10 phylum, specific
‘NC10’ primers, targeting the 16S rRNA gene, were used (Holmes et al. 1995; Luesken et al. 2011b).
Considering the presumably low concentration of DNA from the n-damo bacteria, the 16S rRNA of ‘NC10’
phylum bacteria was amplified through a nested PCR. The 16S rRNA primers used were an ‘NC10’ specific
forward primer 202F (Ettwig et al. 2009) and a general bacteria reverse primer (Juretschko et al. 1998). The PCR
product obtained was then used as template for the nested PCR using the ‘NC10’ specific primers qP1F and
qP2R (Ettwig et al. 2009).
Fig. II.1 Schematic representation of main and possible secondary biological processes involved in the SNAD process with the corresponding genes targeted and primer sets used in this study.

Chapter 2
70
2.4. Cloning and sequencing
Presence and size of amplificates were checked by agarose (1%) gel electrophoresis of 5 µL aliquots of the
PCR products. PCR products were cloned directly using the pGEM-T Easy cloning vector kit, following the
instructions of the manufacturer (Promega Benelux BV, Leiden, the Netherlands). Plasmid-DNA of clones was
isolated from randomly selected clones per library using a GeneJETTM Plasmid Miniprep Kit (Fermentas GMBH,
St. Leon-Rot, Germany). Clones were checked for inserts of the expected size by agarose (1%) gel
electrophoresis after EcoRI digestion (5 U, Eco RI- buffer for 3 h at 37 °C). Sequencing was performed at the
DNA Diagnostics Center of Nijmegen University Medical Center using the M13 forward primer.
Table II-3 Primers used for PCR amplifications and sequencing
Name primer target organism(s)
target gene sequence (5’-3’) of primer Position
Ta (°C)
reference
AmoA-1F Nitrosomonas spp.
amoA GGGGTTTCTACTGGTGGT 332-349
a
52 (Rotthauwe et al.
1997)
AmoA-2R CCCCTCKGSAAAGCCTTCTTC 802-822 a
(McTavish et al. 1993)
Pla46-F Planctomycetes Most Bacteria
16S
GGATTAGGCATGCAAGTC 46-63 a
56 (Neef et al. 1998)
630 R CAKAAAGGAGGTGATCC 1529-1545 a
(Juretschko et al.
1998; Schmid et al. 2003)
Amx 368F Anammox bacteria Kuenenia/ Brocadia
16S
CCTTTCGGGCATTGCGAA 368-385
56 (Schmid et al. 2003)
Amx 820R AAAACCCCTCTACTTAGTGCCC 820-841
b (Schmid et al. 2000,
2003)
NirS1F Denitrifiers nirS
CCTA(C/T)TGGCCGCC(A/G)CA(A/G)T 763-780 b
57
(Braker et al. 1998; Throbäck et al. 2004)
NirS6R CGTTGAACTT(A/G)CCGGT 1638-1653 b
(Braker et al. 1998; Throbäck et al. 2004)
Nitro-1198F Nitrobacter spp.
16S ACCCCTAGCAAATCTCAAAAAACCG 1198
a
58 (Graham et al. 2007)
Nitro1423R CTTCACCCCAGTCGCTGACC 1423 a
(Graham et al. 2007)
NxrA F1370 F Nitrobacter spp.
nxrA CAGACCGACGTGTGCGAAAG 1370
55 (Wertz et al. 2008)
F2843 R TCCACAAGGAACGGAAGGTC 2843 (Wertz et al. 2008)
Nspra-675F Nitrospira spp. (total) 16S
GCGGTGAAATGCGTAGAKATCG 675–696 a
58
(Graham et al. 2007)
Nspra-746 R TCAGCGTCAGRWAYGTTCCAGAG 746–768 a
(Graham et al. 2007)
Ntspa 616F- Domain Bacteria
16S
AGAGTTTGATYMTGGCTC 8-25 a
56
(Juretschko et al. 1998)
Ntspa 1158R Nitrospira spp. CCCGTTMTCCTGGGCAGT 1158–1176
a (Maixner et al. 2006)
PmoA-A47F n-damo bacteria
pmoA TCACGTTGACGC CGA TCC 47
60 (Luesken et al.
2011a) PmoA-A682R GAAASGCNGAGAAGAASGC 682 (Holmes et al. 1995)
202F ‘N10’ Phylum bact.
16S
GACCAAAGG GGGCGAGCG 193 c
57
(Ettwig et al. 2009)
1543R Most Bacteria TCTCCACGCTCCCTTGCG 1027 c
(Juretschko et al. 1998)
qP1F M. oxyfera GGGCTTGACATCCCACGAACCTG 1016- 65 (Ettwig et al. 2009)
qP2R Most Bacteria. CTCAGCGACTTCGAGTACAG 1481 (Ettwig et al. 2009)
M13 Forward sequencing pGEMT easy vector
GTAAAACGACGGCCAG Region flanking
cloning site - -
a Escherichia coli numbering (Brosius et al. 1981). b Positions in the nirS gene of Pseudomonas stutzeri ZoBell EMBL (X56813). c Positions based on the gap-free sequence of the N10 bacterial clone D-BACT (DQ369742), starting at Escherichia coli position 8.

Chapter 2
71
2.5. Nucleotide sequence accession numbers
The 16S rRNA and the functional gene sequences determined during this study were deposited in the
GenBank database using the the stand-alone software tool Sequin developed by the NCBI
(http://www.ncbi.nlm.nih.gov/Sequin/). The partial amoA gene sequences are available under the accession
numbers KC569470 - KC569477 (Nitrosomonas spp.), the partial NirS gene sequences are found under
KC569496 - KC569503 (denitrifiers), while the partial 16S rRNA gene sequences are available under the
accession number KC569478 - KC569483 (anammox species) and KC569484 - KC569495 (Nitrobacter spp.).
2.6. Phylogenetic analysis
Clone gene sequences were analyzed by BLASTN searches (http://www.ncbi.nih.nlm.edu/BLAST) (Altschul
et al. 1997). The clone sequences were aligned using the MEGA5 software (Tamura et al. 2011). Sequences of
related species and a selection of relevant clones sequences from different environments taken from the Genbank
(NCBI) database were also included in the alignments. Phylogenetic trees were constructed based on nucleic acid
(16S rRNA, amoA, NirS) and amino acid (amoA, NirS) sequence alignments using the same software, applying
the neighbor joining statistical method (Saitou and Nei 1987) with the pairwise deletion option for gaps. The tree
topology was based on bootstrap analysis. Evolutionary distances were computed using the Jukes-Cantor
substitution model (Jukes and Cantor 1969) for nucleic acid analysis. Poisson correction model (Zuckerkandl
and Pauling 1965) and the Dayhoff matrix based method (Schwarz and Dayhoff 1979) were used for amino acid
analysis.
2.7. Fluorescence in situ hybridization (FISH)
The presence of two of the major community constituents of the SNAD process, the aerobic ammonia-
oxidizing- and anammox bacteria, was verified by qualitative fluorescence in situ hybridization (FISH) analysis,
using 16S rRNA- and 23S rRNA- genes targeted oligonucleotide probes. Two samples were analyzed: (i)
biomass with entire granules and flocs and (ii ) biomass with broken granules and flocs, where granules and flocs
were aseptically broken by passing them through syringe needles as described before. Fixation and hybridization
were performed as described by Schmid et al. (2000).
Fixation. Biomass (1 mL) was harvested from the SNAD sample by centrifugation. Samples were fixed in
4% (w/v) paraformaldehyde, incubated on ice (2 h) and centrifuged (10 min; 13,000×g). The resulting pellets
were washed with phosphate buffered saline (PBS; 10 mM Na2HPO4/NaH2PO4 pH 7.5 and 130 mM NaCl) and
finally suspended in 1 mL of PBS and 100% EtOH (1:1) mixture. Fixed samples were stored at −20°C until
analysis. Oligonucleotide probes. To detect anammox bacteria, the probe S-*-Amx-0820-a-A-22 (AMX820),
specific for “Candidatus Kuenenia stuttgartiensis” and “Candidatus Brocadia anammoxidans” (Schmid et al.
2001), was used. The phylogenetic group-specific probe for the identification of betaproteobacteria, L-C-bProt-
1027-a-A-17 (BET42a), which targets the 23S rRNA gene, was labeled with Cy3 and used to assess the presence
of betaproteobacteria (Manz et al. 1992). In order to avoid false positives probe GAM42a was always used as an
unlabeled competitor for BET42a. Probe S-*-Neu-0653-a-A- 18 (NEU653), which targets the 16S rRNA of most
halophilic/tolerant Nitrosomonas spp. (N. europaea, N. eutropha, N. mobilis, N. halophila), was used to identify
Nitrosomonas spp. An equimolar amount of corresponding competitor oligonucleotide probe was used for NEU

Chapter 2
72
653 (Wagner et al. 1995). Details of the probes used in this study, their sequences, hybridization conditions, and
references are given in the Table II-4.
Immobilization of fixed cells on microscope slides. For individual hybridizations, 5 µL of
paraformaldehyde fixed material was used and located together with 10 µL of PBS in microscopic slides. After
air drying (30 min), to allow optimal attachment to the slides, the samples were dehydrated by successive
passage through 50, 80 and 100% ethanol (3 minutes each) and finally air dried. In situ hybridization. All
probes were purchased as Cy3- and FLUOS- (5(6)- carboxyfluorescein-N-hydroxysuccinimide ester) labeled
derivatives from Thermohybaid (Ulm, Germany). To each well on the slide were added 10 µL of freshly
prepared hybridisation buffer and 1 µL of each probe. All hybridizations were performed at 46°C for 90 min in
hybridization buffer, containing 180 µL 5 M NaCl, 20 µl 1 M Tris-HCl (pH 8.0), formamide at the percentage
shown in the Table II-4, and 2 µL 10% (w/v) SDS. Hybridization was followed by a stringent washing step at
48°C for 20 min in washing buffer, containing 1 mL 1 M Tris-HCl (pH 8.0), 1.02 mL 5 M NaCl and 0.5 mL
0.5 M EDTA. Washing buffer was removed by rinsing the slides with precooled distilled water. The slides were
air dried with compressed air or briefly in the 46°C oven. Samples were counterstained using Vectashield
(Vector Laboratories, CA, USA) mounting medium with DAPI (4,6-diamidino-2-phenylindole, 1.5 µg mL-1) in
order to enhance the fluorescent signal and stain all DNA. Image acquisitions. Image acquisitions were
performed with a Zeiss Axioplan II epifluorescence microscope (Zeiss, Jena, Germany) together with the
standard software package delivered with the instrument. The relative abundance of Nitrosomonas spp. and
anammox bacteria was estimated by visual inspection because the large flocs and granules in which these
organisms are present makes difficult counting.
Table II-4 Oligonucleotide probes for FISH
Probe Labeling dye Formamide Sequence of probe
(Accession number pB)+ target organism Reference
BET-42a L-C-bProt-1027-a-A-17
Cy3 30 GCCTTCCCACTTCGTTT
(pB-00034) ß-proteobacteriën (23S rRNA gene)
(Manz et al. 1992)
Competitor for BET -42a Gam-42a
L-C-gProt-1027-a-A-17 - 30
GCCTTCCCACATCGTTT (pB-00174)
γ-proteobacteriën (23S rRNA gene)
(Manz et al. 1992)
AMX-0820 S-*-Amx-0820-a-A-22
FLUOS 30 AAAACCCCTCTACTTAGTGCCC
(pB-00409)
“Ca. Kuenenia stuttgartiensis”, “Ca. Brocadia anammoxidans”
(16S rRNA)
(Schmid et al. 2001)
NEU -0653 S-*-Nsm-0653-a-A-18
Cy3 30 CCCCTCTGCTGCACTCTA
(pB-00382)
Most halophilic/tolerant Nitrosomonas spp.
(16S rRNA)
(Wagner et al. 1995)
Competitor for NEU -0653 Cte - 30
TTCCATCCCCCTCTGCCG (pB-00378)
Comamonas spp., Acidovorax spp., Hydrogenophaga sp.,
Aquaspirillum sp. (16S rRNA)
(Wagner et al. 1995)
AMX-0820 S-*-Amx-0820-a-A-22
FLUOS 30 AAAACCCCTCTACTTAGTGCCC
(pB-00409)
“Ca. Kuenenia stuttgartiensis”, “Ca. Brocadia anammoxidans”
(16S rRNA)
(Schmid et al. 2001)
+Information about all probes can be found in probeBase.net (Loy et al. 2007)
2.8. Potential activity analyses
Activity assays were conducted in order to determine the potential activities of aerobic ammonia oxidizing
bacteria (AerAOB) and anaerobic ammonium oxidizing bacteria (anammox). The assays were performed under
aerobic and anaerobic conditions, respectively. Sludge (10 mL) was washed 3-5 times with tap water in order to
remove residual substrates, mainly ammonia for AerAOB and ammonia and organic carbon for anammox
bacteria. The last wash was performed using HEPES 20 mM as a buffer solution (pH 8). All incubations were
performed at room temperature, pH 8 and under continuous mixing (150 rpm). Activity was determined by

Chapter 2
73
measurement of the rates of depletion of ammonium and nitrite. To this end, measurements were performed as
described below over a time span of 3h with a sampling interval of 30 min.
AerAOB activity assays. The washed SNAD biomass (10 mL) was transferred to 30 mL conical glass flasks
covered with a wad of cotton wool. To measure the aerobic ammonium oxidation activity, the flasks were
incubated aerobically, aerobic conditions were maintained under active mixing and substrate was added from a
sterile 100 mM NH4Cl stock solution to initial concentrations of 9-10 mM total ammonium nitrogen.
Anammox activity assays. The washed SNAD biomass (10 mL) was transferred to 30 mL glass serum
bottles. Bottles were sealed with butyl rubber stoppers and soluble substrates added from sterile 100 mM stock
solutions (NH4Cl and NaNO2). Directly hereafter, the bottles were made anoxic by alternatingly applying under-
pressure and flushing with N2 gas, as no growing effect was investigated. An overpressure of 1 bar was
maintained in the bottles. Initial concentrations of 5 mM total ammonium nitrogen and 1-3 mM total nitrite
nitrogen were used.
2.9. Analytical methods
To monitor the depletion of total ammonium and nitrite in the activity assays, samples (1 mL) were
centrifuged (5 min, 10,000 x g) and the resulting supernatants analyzed. Ammonium, as total ammonium
nitrogen (TAN), and nitrite, as total nitrite nitrogen (TNN), were measured colorimetrically at 420 nm (adapted
from Taylor et al. (1974)) and 540 nm (adapted from Griess-Romijn van Eck (1996)), respectively. Total solids
(TS) were quantified weighing samples after drying at 105 ˚C for 24 hours and subsequent cooling in a
desiccator. The Biuret method was used to determine the protein concentration (Layne 1957).
3. Results
3.1 PCR and phylogenetic analysis
In previous studies on SNAD bioreactors, it has been confirmed that different bacteria can co-exist in
biofilms (Xiao et al. 2009; Zhang et al. 2012), flocs and granules (Third et al. 2001; Vázquez-Padín et al. 2010),
but further phylogenetic analysis are necessary. As described in the materials and methods section, genomic
DNA extracted from the SNAD sludge from the Zürich wastewater treatment plant was used as a template for
PCR reactions targeting respectively: bacterial amoA genes which are diagnostic for aerobic ammonia oxidizing
bacteria (AerAOB), nxrA genes diagnostic for Nitrobacter spp. (AerNOB), pmoA genes diagnostic for methane-
oxidizing bacteria and nirS genes diagnostic for denitrifying bacteria. In addition to functional gene targeting
PCR reactions also 16S rRNA amplifications were performed using primers specific for Nitrobacter spp.,
Nitrospira spp., Planctomycetes, anammox and NC10 phylum bacteria were performed. PCR products were
checked for size on 1% (w/v) agarose gel (Supplementary Fig. II-1).
Phylogenetic diversity of the AerAOB
Primers specific for subunit A of the ammonium monooxygenase (amoA) enzyme, key enzyme in aerobic
ammonium oxidation, were used to detect AerAOB. Correct-sized products of 453 nt were obtained. After
transformation and cloning, eight clones were randomly selected for plasmid DNA isolation and sequencing.
Phylogenetic analysis of amino acid sequences deduced from the DNA sequences showed that the AerAOBs in
the samples belonged to the betaproteobacteria and were affiliated to environmental clone sequences from

Chapter 2
74
wastewater and other engineered nitrogen treatment systems. Clone sequences closely related to different
members of the multiple Nitrosomonas genera (N. europaea, N. eutropha and N. oligotropha) were detected,
suggesting a high AOB species diversity (Fig. II.2). One clone SNAD_amoA_7 was closely related to
Nitrosomonas oligotropha (AF272406, 92% identity), one clone SNAD_amoA_4 to Nitrosomonas eutropha
(AY177932, 100% identity), and the other six clones were closely related to Nitrosomonas europaea (L08050,
97- 99% identity) (Fig. II.2).
Fig. II.2 Phylogenetic tree, reflecting amoA gene diversity in SNAD sludge. Names of ammonia-oxidizing bacteria are printed in italics and names of clone sequences are printed in bold. The phylogenetic tree was constructed using the Neighbour – Joining method (Saitou and Nei 1987) with the Poisson correction model (Zuckerkandl and Pauling 1965). Distances are in the units of the number of amino acid substitutions per site. The analysis involved 32 amino acid sequences. Evolutionary analyses were conducted in MEGA.5 (Tamura et al. 2011). The numbers at the nodes indicate the levels of bootstrap support (based on data for 500 replicates) for groups to the right of the nodes. The scale bar represents 2% estimated sequence divergence.
Nitrosomonas halophila Nm1 (AF272398, AJ298704) Nitrosomonas eutropha Nm57 (AY177932)
Xiamen SBR active sludge (GU249118)
SNAD_amoA_4 (KC569472)
Nitrosomonas europaea Nm50 (L08050) Korea Anoxic granular sludge, anammox (EU010401) Baltic Sea Water column, sediment-water interface (EF222047)
SNAD_amoA (2, 3, 5) (KC569470, KC569471, KC569473)
SNAD_amoA (8, 9) (KC569476, KC569477)
Anoxic biofilm (AF202654) Tianjin active sludge (HQ821927)
SNAD_amoA_6 (KC569474)
Nitrosococcus mobilis Nc2 (AJ298701) Nitrosomonas nitrosa Nm90 (AF272404)
Nitrosomonas communis Nm2 (AF272399) Nitrosomonas sp. Nm58 (AY123820)
Nitrosomonas oligotropha Nm45 (AF272406) China Nitrosomonadaceae Wetlands (FJ603095)
SNAD_amoA_7 (KC569475)
Nitrosomonas ureae Nm10 (AF272403) Nitrosomonas aestuarii Nm36 (AF272400)
Nitrosomonas marina Nm22 (AF272405) Nitrosomonas cryotolerans ATCC49181 (AF314753)
Nitrosospira briensis C-128 (U76553) Nitrosovibrio tenuis NV-12 (U76552)
Nitrosospira sp. Ka3 (AY123827) Nitrosospira multiformis ATCC 25196 (DQ228454)
Nitrosococcus halophilus Nc4-2 (AF272521) Nitrosococcus oceani AFC27 (AF509001) 100
75
36
96
69
81
58
52
77
68
98
35
76
47
44
21
35
26
57
88
3226
59
48
39
68
99
0.02
β-p
rote
obac
teria
g-
pro
teo
bac
teria

Chapter 2
75
Phylogenetic diversity of the anammox bacteria.
To determine the diversity of anammox bacteria, two different primer combinations were used. The
Planctomycete 16S rRNA was amplified using Pla46F and 630R primers and correct-sized (1483 nt) products
cloned. Nine clones were randomly selected for sequencing and almost full-length 16S rRNA sequences (average
length 1,490 bases) were obtained. Subsequent phylogenetic analysis showed that the clones were associated
with the phylum Planctomycetes but none of the sequences were similar to the known anaerobic ammonium
oxidizing (anammox) bacteria. When the anammox specific primer combination (368F- 820R) was applied, a
clear PCR product of 452 bp was obtained. Six clones were randomly selected and sequenced. Phylogenetic
analysis of the nucleotide sequences revealed that the clone sequences were highly similar to each other (more
than 99 % sequence similarity), forming a cluster SNAD_Amx (4, 5, 9, 11, 20, 33). Bootstrap analysis confirmed
that the cluster SNAD-Amx (4, 5, 9, 11, 20, 33) was closely related (99%) to the known anammox bacteria of the
“Candidatus Brocadia fulgida” (bootstrap value, 99%) (Fig. II.3).
Fig. II.3 Phylogenetic tree, based on 16S rRNA gene sequences using anammox-specific primers The tree shows the phylogenetic position of the clone sequences within the anammox bacterial genera. The clone sequences are in bold. Names of anammox species are printed in italics. The phylogenetic tree was constructed using the Neighbour – Joining method (Saitou and Nei 1987) with the Jukes-Cantor model (Jukes and Cantor 1969). The analysis involved 21 nucleotide sequences. Evolutionary analyses were conducted in MEGA.5 (Tamura et al. 2011). The numbers at the nodes indicate the levels of bootstrap support (based on data for 500 replicates) for groups to the right of the nodes. The scale bar represents 0.5% estimated sequence divergence.
Candidatus Kuenenia stuttgartiensis (AF375995)
Candidatus Brocadia anammoxidans (AF375994)
Candidatus Brocadia fulgida (DQ459989)
USA Anammox bioreactors_municipal anaerobic digestion reject (GQ356195)
SNAD_Amx (4, 5, 9, 11, 20, 33) (KC569478 - KC569483 )
China Shallow Yangcheng Lake (JF261060)
Japan Anaerobic continuous-feeding cultivation reactor (AB376553)
USA Anammox bioreactors _ municipal anaerobic digestion reject (GQ356048)
Germany Deammonification process for anaerobic digestion effluents(JF286586)
China Freshwater wetland ecosystems (GU084105)
China Constructed wetland (JF346193)
Candidatus Anammoxoglobus propionicus (DQ317601)
Candidatus Jettenia asiatica (DQ301513)
Candidatus Scalindua brodae(AY254883)
Candidatus Scalindua sorokinii (AY257181)
Candidatus Scalindua wagneri (AY254882)
99
100
93
74
88
86
80
45
69
98
81 25
99
68
0.005

Chapter 2
76
Phylogenetic diversity of the denitrifiers
In addition to the aerobic ammonia oxidizing and anammox bacteria, the diversity of denitrifiers was assessed
by using the dissimilatory nitrite reductase (nirS) gene as a proxy. Until now, no detailed studies, investigating
the diversity of the functional NirS gene of heterotrophic bacteria in the SNAD sludge, have been carried out.
The correct-sized (875 nt) amplificated were cloned and eight clones were randomly selected and further
analyzed by comparative sequencing. Phylogenetic analysis of the deduced amino acid sequences showed that
the denitrifiers in the SNAD sample belonged to the betasubdivision of the proteobacteria. The phylogenetic tree
of nitrite reductase genes (nirS) is presented in Fig. II.4.
Fig. II.4 Phylogenetic tree, based on nitrite reductase (NirS) functional gene sequences obtained with the nirS1F/6R primers. Names of denitrifiers are printed in italics, while the NirS clones are printed in bold. The phylogenetic tree was constructed using the Neighbour – Joining method (Saitou and Nei 1987) with the Dayhoff matrix based method (Schwarz and Dayhoff 1979). The analysis involved 14 amino acid sequences. Evolutionary analyses were conducted in MEGA.5 (Tamura et al. 2011). The numbers at the nodes indicate the levels of bootstrap support (based on data for 500 replicates) for groups to the right of the nodes. The scale bar represents 5% estimated sequence divergence.
Phylogenetic diversity of the AerNOB
The AerNOB diversity was analyzed by using multiple primer sets. The primer combination
Nitro1198F/Nitro1423R, targeting the 16S rRNA genes of Nitrobacter-like bacteria (Graham et al. 2007),
yielded products of the correct size (225 nt), while no PCR products were obtained using primers targeting the
NxrA gene of Nitrobacter spp., nor the 16S rRNA gene of Nitrospira spp.. Although recent metagenomic-based
studies (Daims et al. 2011) indicated that Nitrospira-like bacteria are more abundant AerNOB in sewage
treatment systems, our PCR analysis showed that in our SNAD biomass only Nitrobacter spp. could be detected.
The PCR targeting the 16S rRNA of Nitrospira spp. did not yield any specific products. A 16S rRNA gene clone
library was constructed from the aggregate samples to identify the nitrite oxidizers in SNAD sludge. Twelve
clones were selected at random and used for comparative sequence analysis. Phylogenetic analysis of the
nucleotide sequences showed that the nitrite oxidizers belonged to the alphasubdivision of the proteobacteria
(Fig. II.5). Five clone sequences SNAD_16SrRNA_NOB_1_1, SNAD_16SrRNA_NOB1_3 and a cluster of
sequences SNAD_16SrRNA_NOB(1_2, 1_4 and 1_7) were related (98% identity) to Nitrobacter hamburgensis.
Five of the remaining clone sequences (SNAD_16SrRNA_NOB(1_5, 2_5), SNAD_16SrRNA_NOB(1_6, 1_9,
SNAD_nirS_55_1 (KC569496)
Thauera sp. MZ1T nirS (CP001281)
Pseudomonas stutzeri A1501 nirS (NC_009434)
SNAD_NirS (27_4, 57_3) (KC569502, KC569498)
Dechloromonas aromatica RCB nirS (NC_007298)
SNAD_nirS_25_2 (KC569501)
Pseudomonas stutzeri ATCC 17588 nirS (CP002881)
SNAD_nirS_28_9 (KC569503)
Aromatoleum aromaticum EbN1 nirS (NC_006513)
Greece_Uncultured bacterium _DEPHANOX WWTP (GU564892)
SNAD_nirS_24_1 (KC569500)
Sideroxydans lithotrophicus ES-1 nirS (CP001965)
SNAD_NirS(56_2, 58_5) (KC569497, KC569499)
98
81
56
41
97
100
99
94
76
66
100
54
0.05
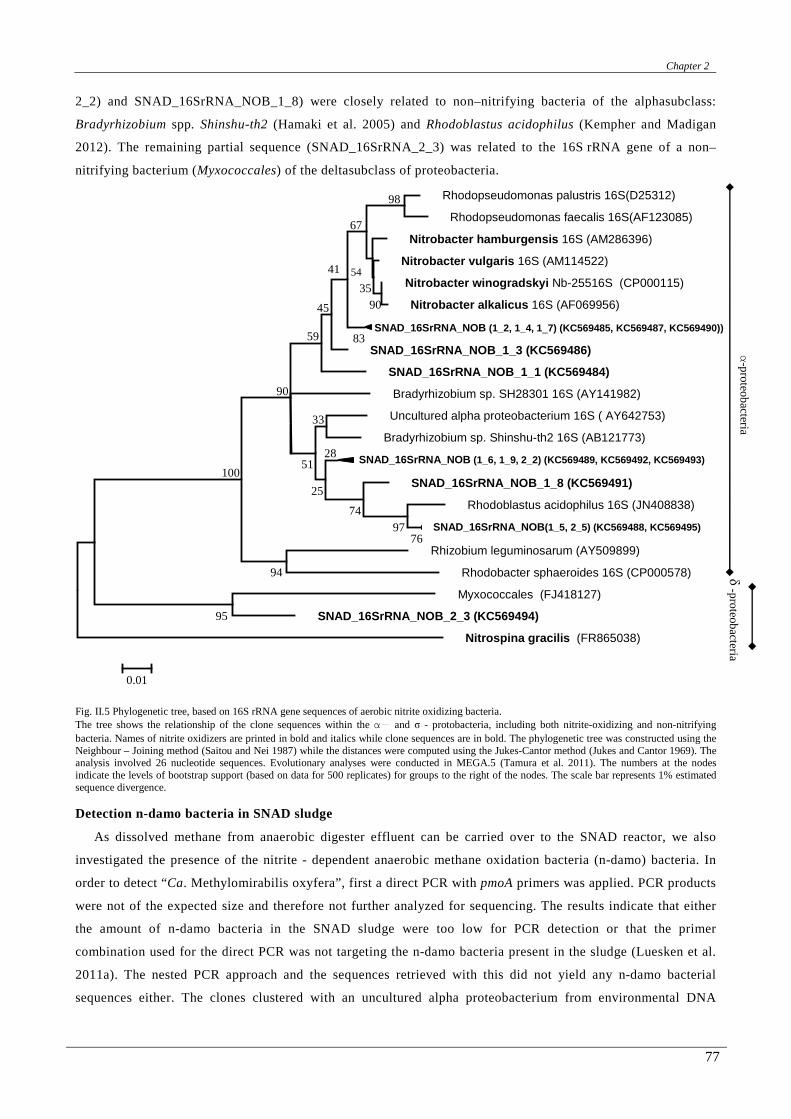
Chapter 2
77
2_2) and SNAD_16SrRNA_NOB_1_8) were closely related to non–nitrifying bacteria of the alphasubclass:
Bradyrhizobium spp. Shinshu-th2 (Hamaki et al. 2005) and Rhodoblastus acidophilus (Kempher and Madigan
2012). The remaining partial sequence (SNAD_16SrRNA_2_3) was related to the 16S rRNA gene of a non–
nitrifying bacterium (Myxococcales) of the deltasubclass of proteobacteria.
Fig. II.5 Phylogenetic tree, based on 16S rRNA gene sequences of aerobic nitrite oxidizing bacteria. The tree shows the relationship of the clone sequences within the α- and σ - protobacteria, including both nitrite-oxidizing and non-nitrifying bacteria. Names of nitrite oxidizers are printed in bold and italics while clone sequences are in bold. The phylogenetic tree was constructed using the Neighbour – Joining method (Saitou and Nei 1987) while the distances were computed using the Jukes-Cantor method (Jukes and Cantor 1969). The analysis involved 26 nucleotide sequences. Evolutionary analyses were conducted in MEGA.5 (Tamura et al. 2011). The numbers at the nodes indicate the levels of bootstrap support (based on data for 500 replicates) for groups to the right of the nodes. The scale bar represents 1% estimated sequence divergence.
Detection n-damo bacteria in SNAD sludge
As dissolved methane from anaerobic digester effluent can be carried over to the SNAD reactor, we also
investigated the presence of the nitrite - dependent anaerobic methane oxidation bacteria (n-damo) bacteria. In
order to detect “Ca. Methylomirabilis oxyfera”, first a direct PCR with pmoA primers was applied. PCR products
were not of the expected size and therefore not further analyzed for sequencing. The results indicate that either
the amount of n-damo bacteria in the SNAD sludge were too low for PCR detection or that the primer
combination used for the direct PCR was not targeting the n-damo bacteria present in the sludge (Luesken et al.
2011a). The nested PCR approach and the sequences retrieved with this did not yield any n-damo bacterial
sequences either. The clones clustered with an uncultured alpha proteobacterium from environmental DNA
Rhodopseudomonas palustris 16S(D25312)
Rhodopseudomonas faecalis 16S(AF123085)
Nitrobacter hamburgensis 16S (AM286396)
Nitrobacter vulgaris 16S (AM114522)
Nitrobacter winogradskyi Nb-25516S (CP000115)
Nitrobacter alkalicus 16S (AF069956)
SNAD_16SrRNA_NOB (1_2, 1_4, 1_7) (KC569485, KC569487, KC569490))
SNAD_16SrRNA_NOB_1_3 (KC569486)
SNAD_16SrRNA_NOB_1_1 (KC569484)
Bradyrhizobium sp. SH28301 16S (AY141982)
Uncultured alpha proteobacterium 16S ( AY642753)
Bradyrhizobium sp. Shinshu-th2 16S (AB121773)
SNAD_16SrRNA_NOB (1_6, 1_9, 2_2) (KC569489, KC569492, KC569493)
SNAD_16SrRNA_NOB_1_8 (KC569491)
Rhodoblastus acidophilus 16S (JN408838)
SNAD_16SrRNA_NOB (1_5, 2_5) (KC569488, KC569495)
Rhizobium leguminosarum (AY509899)
Rhodobacter sphaeroides 16S (CP000578)
Myxococcales (FJ418127)
SNAD_16SrRNA_NOB_2_3 (KC569494)
Nitrospina gracilis (FR865038)
95
98
94
100
90
83
35
41
67
54
45
59
90
33
2851
25
74 97
76
0.01
α-p
roteob
acteria δ
-pro
teobacteria

Chapter 2
78
sampled from oligotrophic environments (obtained from 15mdepth in the Northern Atlantic Gyre) (AM706683
(Mühling et al. 2008) (100% identity).
3.2 Fluorescence in situ hybridization (FISH)
To investigate the microbial spatial distribution of bacteria, and in particular the community structure of two
of the main processes (aerobic and anaerobic ammonia oxidation) in the SNAD system, qualitative FISH
measurements with specific probes for Nitrosomonas spp. and “Candidatus Brocadia anammoxidans” were
performed. The presence of both aerobic ammonia-oxidizing and anammox cells was confirmed in these
analyses. FISH analysis applied to the whole biomass, containing both granules and flocs, gave a high
background signal. However, a stratification in the granules was observed with a clear division of different
bacteria in the inner (anammox bacteria) and outer layers (AerAOB). (Supplementary Fig. II-2 A,B,C). Smaller
aggregates and single cells exhibited less background and therefore clearer results (Supplementary Fig. II-2 D).
A distinct distribution of aerobic ammonia-oxidizing bacteria (outer layers) and anaerobic ammonium-oxidizing
bacteria (inner layers) within the aggregates was observed (Fig. II.6, A and B). While, the aerobic ammonia
oxidizers were located at the surface layer of the aggregate, where oxygen is expected to be available, anammox
bacteria tended to occupy the inner (anoxic) zones of the aggregates, probably to avoid oxygen exposure which
is reported to be inhibitory to anammox activity. Pictures taken of DAPI-stained SNAD sludge showed a high
morphological diversity of the microorganisms which included spherical-, rod- and long filamentous-shaped
microorganisms (Supplementary Fig. II-3 A). In particular, long filamentous-shaped microorganisms were the
dominant bacteria in the outer layer of granules, while single cells as well as aggregates appeared fixed in a net
of filamentous bacteria.
Fig. II.6 Fluorescence images of homogenized SNAD biomass. Nitrosomonas spp. were labeled with Cy3 (red) (probe Neu 653, targeting most halophilic/tolerant Nitrosomonas spp.) while anammox bacteria were labeled with FLOUS (GREEN) (Probe AMX820, targeting “Candidatus Brocadia anammoxidans”). Scale bar: 10 um.
A B
outer
inner
outer
outer
inner

Chapter 2
79
3.3 AerAOB and anammox activity assays
In the Sequencing Batch Reactor (SBR), treating the anaerobic digested effluent at the wastewater treatment
plant in Zürich (Switzerland), the SNAD process was full achieved (Joss et al. 2009). Data reported by Joss et al.
(2009) demonstrated that total ammonium nitrogen (95,4%), total nitrogen (94,6 %) and COD removal (36,7 %)
were achieved simultaneously in the SBR. Our activity assays confirmed that both aerobic and anaerobic
ammonia oxidation occurred in the SNAD sludge (Fig. II.7 A and B).
The total protein concentration and total solids content of the SNAD sludge were determined prior to the
activity assays as described in the analytical methods section. The protein concentration was about 2.85 mg
protein mL-1, while the total solids content was 10 g TSS L-1. This showed that the protein concentration was
approximately a third of the measured dry weight (0.3 g protein/g biomass), similarly to the data previously
reported for a CANON biomass (Third et al. 2001).
The potential aerobic ammonia oxidizer activity was 1.8 nmol N mg protein-1 min-1, corresponding to about
4.3 mg TAN gTSS-1 h-1. The molar ratio of TNNproduced/TANconsumed was about 0.9, in accordance to the nitritation
stoichiometry performed by AerAOB (1.0), demonstrating a low activity of nitrite oxidizing bacteria (AerNOB).
The potential anammox activity was 0.34 nmol N mg protein-1 min-1, corresponding to 0.82 mg TANgTSS-1 h-1.
The molar ratio of TNNconsumed/TAN consumed was calculated to be 1.7. This value was higher than the theoretical
anammox stoichiometry (1.32), indicating that part of the nitrite is converted by heterotrophic denitrifiers
(Kumar and Lin 2010) or anammox bacteria (Kartal et al. 2007b; Kartal 2008) which use organic carbon
substrates present in the sludge, mainly cell lysis products.
time(min)
0 50 100 150 200
Tot
al A
mm
oniu
m a
nd N
itrite
con
cent
ratio
n (m
M)
0
2
4
6
8
10maximum
y= - 0,0511x + 8,81
R2=0,987
y= 0,0472x + 0,32
R2=0,991
Aerobic conditions
time (min)
0 50 100 150 200 250
Tot
al A
mm
oniu
m a
nd N
itrite
Con
cent
ratio
n (m
M)
0
1
2
3
4
5Anaerobic condition
maximum
y= - 0,0098x + 3,87
R2=0,83
y = - 0,0171x + 2,769
R2=0,989
Fig. II.7 Potential AOB and anammox activity Potential aerobic ammonia-oxidizing activity (A) and potential anaerobic ammonia-oxidizing activity (B) in the SNAD sludge. Concentration of total ammonium ( ) and nitrite ( ) in batch tests.
A B
Chapter 2
80
4. Discussion
4.1 Microbial community of the SNAD biomass
In this study an analysis of the microbial community of the SNAD biomass was performed, using molecular
tools to detect the bacteria involved in the biological process. In the SNAD system, ammonium and carbon
removal is achieved by the concerted action of aerobic ammonia-oxidizing, anammox and denitrifying bacteria
under oxygen limitation. We showed that the SNAD sludge of the SBR of the WWTP of Zürich (CH) did contain
different bacteria (aerobic and anaerobic ammonia oxidizers, aerobic nitrite oxidizers, denitrifiers). The SNAD
sludge harbored a high microbial diversity. Both the main (aerobic and anaerobic ammonium oxidation and
denitrification), and possible secondary biological processes (aerobic nitrite oxidation and n-damo) were
assessed.
Our results showed that different members of Nitrosomonas genera coexisted in the SNAD sludge. As
expected on basis of the high total ammonium load (0.3 – 1.1 kgTAN m-3 d-1) of the SBR, amoA gene sequences
were affiliated with those of the ammonia oxidizers of the genus Nitrosomonas europaea (97-98% similarity).
Clone sequences were highly similar to environmental sequences previously recovered in an anoxic granular
sludge (EU010401), an anoxic biofilm (AF202654 (Schmid et al. 2000)) and an activated sludge, treating
ammonium rich wastewater (HQ821927). Similar results were observed by Pynaert et al. (2003) in a highly
loaded Rotating Biological Contactor (RBC). We observed one sequence belonged to the Nitrosomonas-
eutropha-like cluster (SNAD_AmoA_4), usually detected and demonstrated to have activity in oxygen-limited
environments (Li et al. 2009). Both Nitrosomonas europea and Nitrosomonas eutropha are capable of tolerating
high-ammonia concentration (Holmes et al. 1995; Szatkowska et al. 2007a). The sequence SNAD_AmoA_7 was
distantly related to all of the previously recognized sequences and closely linked to the Nitrosomonas-
oligotropha-like cluster, which have been found usually in pools with low ammonia/ammonium concentration
(Park et al. 2002). The clone sequence was extremely similar to environmental sequences previously recovered
in a constructed wetland for wastewater treatment (FJ603095). Our results supported the hypothesis that in the
SNAD process, carried out in an SBR, different macro- and micro-environments strongly affected the AerAOB
population structure. The different aerobic and anoxic phases and the presence of dense biomass-flocs and
granules can create physical and chemical gradients of substrates. The high ammonia concentration in the bulk
liquid is a critical factor for the involvement of Nitrosomonas europea and Nitrosomonas eutropha relatives in
the flocs and in the outer part of granules, while the low ammonia concentration in the inner part of granules
might allow the development of Nitrosomonas-oligotropha-spp. A high AOB species diversity may be beneficial
to the stability of wastewater treatments (Daims et al. 2001) and in particular for the SNAD process.
Phylogenetic analysis revealed that all the clone sequences obtained from the anammox 16S rRNA analysis
were highly similar to eachother and affiliated with the known anammox bacteria of the “Candidatus Brocadia
fulgida” (99% similarity). The cluster was most closely related to clones retrieved from a USA anammox reactor,
treating anaerobic digestion effluents (GQ356195, (Park et al. 2010)). Our results were in line with the previous
studies that found “Ca. Brocadia” as the abundant anammox species in WWTPs, where organic acids are present
(Hu et al. 2010). Brocadia-like bacteria are able to oxidize organic substrates to CO2 with the reduction of nitrate
and nitrite to di-nitrogen gas (Kartal et al. 2007b; Kartal 2008).
The amplification of the nitrite reductase gene (nirS) fragments revealed that the SNAD biomass was
characterized by a high diversity of denitrifiers of the betasubdivision of the proteobacteria. Phylogenetic

Chapter 2
81
analysis showed that the clone sequences were related to the nirS sequences from different anaerobic denitrifying
bacteria, Thauera spp., Pseudomonas stutzeri, Dechloromonas aromatic and Aromatoleum aromaticum. The
presence of so many denitrifying bacteria indicated that denitrification may have an important role in nitrogen
removal from high nitrogen streams which contain organic substrate. Among the denitrifiers here identified,
Thauera MZ1T, Pseudomonas stutzeri and Dechloromonas aromatica have been shown to degrade several
aromatic compounds (Yan et al. 2005; Heylen et al. 2006; Salinero et al. 2009). Thauera MZ1T is unique among
the Thauera spp. in its production of abundant extracellular polymeric substances (EPS) which may contributes
to the granular process (Heylen et al. 2006), while Dechloromonas aromatica strain RCB appears to support a
highly complex lifestyle which might involve biofilm/granules formation and interaction with a eukaryotic host
(Salinero et al. 2009). Both Pseudomonas stutzeri and Dechloromonas aromatica encode proteins, suggestive of
the ability to fix nitrogen and CO2 (Yan et al. 2005; Salinero et al. 2009). The sequence SNAD_nirS 24 was
closely related to clones from biological anoxic phosphorus removal reactor (DEPHANOX-type) fed with
municipal wastewater, where denitrifying polyphosphate accumulating organisms (DPAOs) have been observed
(Zafiriadis et al. 2011). This observation is probably mirrored by the fact that in the SBR anaerobic/anoxic and
aerobic phases alternate, favoring phosphorus release/uptake. Finally, the cluster SNAD_NirS (56.2, 58.5) was
88% similar to the lithoautotrophic, microaerophilic Fe(II)-oxidizing betaproteobacterium Sideroxydans
lithotrophicus ES-1, which may play a role for Fe(II) oxidation in the enrichment culture (Blöthe and Roden
2009).
Bacteria involved in the possible secondary biological processes such as aerobic nitrite oxidizing and n-damo
bacteria were investigated. Although recent metagenomic-based studies (Daims et al. 2011) indicated that
Nitrospira-like bacteria are more abundant AerNOB in sewage treatment systems, our PCR analysis showed that
Nitrobacter-like bacteria, rather than Nitrospira spp., were the dominant AerNOB in the SNAD biomass. Those
finding are in agreement with results of previous studies, where significant amounts of Nitrobacter spp. have
been detected by FISH in high-loaded WWTPs (Mobarry et al. 1996; Gieseke et al. 2003). The PCR, targeting
the 16S rRNA gene of Nitrospira spp., did not yield any specific products, which may indicate either that the
Nitrospira spp. cell numbers are too low for PCR detection or that a Nitrospira species not targeted by the
primer set are present. The 16S rRNA sequences of two of the twelve clones (SNAD_16SrRNA_NOB_1_1),
(SNAD_16SrRNA_NOB_1_3) and the cluster SNAD_16SrRNA_NOB(1_2, 1_4,1_7) were related to the
members of nitrite oxidizers of the Nitrobacter hamburgensis (98% identity). In addition, in our study, some
sequences related to Nitrobacter spp. closest non-nitrifying relatives, Bradyrhizobium sp. Shinshu-th2 (Hamaki
et al. 2005) and Rhodoblastus acidophilus (Kempher and Madigan 2012), were detected. The detection of non-
nitrifying relatives may be explained considering both the low phylogenetic diversity of Nitrobacter spp. (Daims
et al. 2011) and their high 16S rRNA similarities to their closest non-nitrifying relatives. Further, recent research
reported the ability of other non-nitrifying bacteria (purple non-sulfur bacteria (strain LQ17)) related to the
Rhodopseudomonas spp. to use nitrite phototrophically as an electron donor as well (Schott et al. 2010). Some
studies reported that the 16S rRNA method seems to be too conserved to unequivocally determine evolutionary
lineage within the genus Nitrobacter (Vanparys et al. 2007; Daims et al. 2011). However the presence of
AerNOB does not seem to compromise the SNAD process efficiency, probably due to the selective pressures in
the SBR management (low dissolved oxygen, high ammonia concentration) and consequently to the low
AerNOB activity, as also confirmed by the AerAOB activity assays.

Chapter 2
82
As dissolved methane from anaerobic digester effluent can be carried over to the SNAD reactor in the Zürich
WWTP, the nitrite - dependent anaerobic methane oxidation bacteria (n-damo) bacteria were also screened in our
study, using both the 16S rRNA and the functional level approach (Luesken et al. 2011b). No n-damo bacterial
amplificates were obtained suggesting the absence of these microorganisms in the SNAD sludge. Further
analysis would be required to definitively prove the absence of n-damo bacteria in the SNAD sludge.
4.2 Microbial spatial distribution in the SNAD biomass
Our FISH results correspond to the experimental findings of other researchers (Guo et al. 2009; Cho et al.
2010; Wang et al. 2011b), who revealed that long filamentous- shaped microorganisms were dominant bacteria
in the outer layer of granules, while single cells as well as aggregates were trapped in a net of filamentous
bacteria. Filamentous microorganisms are considered to be responsible for the construction of web-like
structures (Li et al. 2008) and were also detected in some anammox reactors co-existing with the AerAOB (Li et
al. 2009; Park et al. 2010; Zhu et al. 2011). We delved deeper into the spatial distribution of microorganisms
responsible for two of the main biological processes (aerobic and anaerobic ammonia oxidation) involved in the
SNAD process by FISH, with specific probes for Nitrosomonas spp. and “Candidatus Brocadia anammoxidans”
and hereby confirmed the presence of both aerobic ammonia-oxidizing- and anammox cells. Furthermore, this
revealed that a distinct microbial distribution from the outer to the inner layer of aggregates existed, as was
observed in previous studies by other researchers (Gong et al. 2007; Vázquez-Padín et al. 2009c, 2010;
Vlaeminck et al. 2010). Although anammox bacteria are sensitive to oxygen, our visual estimations, based on
FISH pictures, demonstrated that nitrifying and anammox bacteria co-existed in the SNAD reactor, which was
operated at micro-aerobic (oxygen-limited) conditions. This suggests that the aerobic ammonia oxidizers are able
to effectively protect the anammox bacteria from inhibiting substances such as oxygen. In an anammox granular
reactor, Li et al. (2011b) observed that in the outer layer of a granule, the biomass was mostly micrococcus
shaped, presumably aerobic ammonia-oxidizing bacteria. In the inner layer of a granule, the biomass consisted of
typical cauliflower-like aggregates, presumably anammox organisms. Anammox bacteria tends to form
aggregates like biofilm (Gong et al. 2007; Szatkowska et al. 2007a; Zhang et al. 2010b) or granules (Quan et al.
2008; Ni et al. 2009; Li et al. 2011b; Volcke et al. 2012; Winkler et al. 2012a). Recently, Chen et al. (2010)
confirmed the complex anammox granules morphology. The authors detected lots of cavities in the granules,
which can enhance substrate transfer from the bulk to granules and intermediates or by-products transfer from
inside granules to the bulk, allowing the co-existence of partial nitrification and anammox process. Moreover,
the biofilm of non-woven rotating biological contactor (NRBC) reactor, performing the SNAD process, was
characterized by a outer layer of biofilm, where the biomass was mostly micrococcus shaped, apparently
AerAOB, with a spot of aerobic heterotrophic bacteria. In the inner layer of biofilm, anammox organisms were
detected, but presumably denitrifying organisms were also present (Chen et al. 2009). The identity of the aerobic
nitrite oxidizers and denitrifiers in our SNAD sludge has not yet been investigated through FISH analysis in this
study. Nitrobacter spp., Nitrospira spp. and denitrifiers were not specifically targeted in our approach. PCR
analysis did demonstrate the presence of Nitrobacter spp. nitrite oxidizers as well as denitrifiers. Nitrospira spp.
targeting PCR did not yield any specific products, which may indicate that either the Nitrospira spp. cell
numbers are too low for PCR detection or that a Nitrospira species not targeted by the primers used in this study
are present. The SNAD sludge was characterized by the presence of both brown and red granules. De Clippeleir
et al. (2009), in their experimental study, verified that brown granules were dominated by aerobic ammonia-

Chapter 2
83
oxidizing bacteria (AerAOB ), resulting in a high nitrite accumulation compared to red granules, where the net
nitrite production by AerAOB and the net anoxic nitrite consumption by anammox bacteria were in equilibrium.
Moreover, when a carbon source is present in the system, aerobic heterotrophic bacteria, performing aerobic
carbon oxidation and denitrification via nitrite or nitrate, can contribute to the formation of different types of
aggregates with different characteristics. Further research is necessary to study the microbial diversity of
different types of granules. Finally, the presence of compact aggregates in the sludge made it difficult to
determine the absolute quantity of AerAOB and anammox bacteria in the SNAD biomass with FISH microscopy.
Enumeration of both aerobic ammonia-oxidizing and anammox bacteria by quantitative real-time PCR (qPCR)
may be of use.
4.3 Activity analyses
The activity analyses performed on aerobic and anaerobic ammonia-oxidizing bacteria showed that these
microorganisms coexist. Even with the activity assays designed and optimized to measure aerobic and anaerobic
ammonia potential rate only, the effects of other biological processes were detected. The molar ratio of TNN
produced/TAN consumed of aerobic ammonia oxidation was about 0.9, in accordance to the nitritation stoichiometry
performed by AerAOB, demonstrating the low activity of nitrite-oxidizing bacteria. On the other hand, the molar
ratio of TNN consumed/TAN consumed of anaerobic ammonia oxidation was calculated to be 1.7, higher than the
theoretical anammox stoichiometry (1.32). This indicates that part of the nitrite is consumed faster than
ammonium. Nitrite may be converted by other pathways, that involve carbon removal. In fact, carbon was clearly
present in the batch test due to the starvation conditions of the analyzed sample. Heterotrophic denitrifiers could
use organic carbon substrates present in the sludge (Kumar and Lin 2010). Further, the anammox process
contribution should be take into account, as anammox bacteria may oxidize organic carbon to CO2, reducing
nitrate/nitrite to di-nitrogen gas (Kartal et al. 2007b; Kartal 2008). The anammox process contributed up to 76%
of total nitrite consumption in the anammox activity assay while the other processes overall account for 24%.
The aerobic and anaerobic ammonia oxidizer activities measured for the SNAD sludge were low compared to
previously reported rates for CANON or SNAD systems (Strous et al. 1998; Third et al. 2001; Sliekers et al.
2002; Xu et al. 2010). The lower aerobic and anaerobic ammonia oxidizer activities observed in this study may
be explained by the fact that the SNAD sludge was stored for 5 months at 4°C prior to analysis.

Chapter 2
84
5. Conclusions
In conclusion, the data in this study gave insights into the phylogenetic diversity and relationships in the
SNAD microbial community, providing a clear evidence for a high species diversity. The findings reported in
this study may be of relevance for wastewater treatments. The identification of specific groups of bacteria may
contribute to better understanding design, and enable stable operation of complicated but challenging biological
processes, where different bacteria may co-exist, such as the SNAD process for the treatment of ammonium-rich
wastewaters, with a low C/N ratio. Further research to evaluate the diversity of heterotrophic denitrifiers in
SNAD systems responsible for the COD reduction, may use different functional genes or enzymes involved in
denitrification as molecular markers looking at both the nitrite and nitrate reduction routes. The n-damo bacteria
were not detected in our current study but further research, e.g by designing and using less specific primers, is
needed to conclusively validate the absence of these bacteria. Moreover, other possible secondary biological
processes may be investigated, such as the presence of the sulfate reducing bacteria (SRB) which reduce sulfate
(SO42-) to hydrogen sulfide (H2S) using organic compounds as electron donors and the sulfide-oxidizing
autotrophic denitrifiers (SOAD) which may utilize the produced dissolved sulfide with oxidized nitrogen
compounds (Lau et al. 2006). In addition, the quantification of bacteria in the granules and flocs and the
detection of the active fraction (mRNA) of the community for monitoring the activity in the SNAD process could
be useful tools to control the process in WWTPs and require future researches.

Chapter 2
85
Acknowledgements
The authors gratefully acknowledge Adriano Joss from EAWAG (CH) and Mrs Sabine Burger from ERZ
Entsorgung + Recycling Zürich, (SWZ), for providing the SNAD sludge and for their helpful information
concerning the SBR. University of Trento thanks the Microbiology Department at the University of Nijmegen for
their technical guidance during the molecular analyses and for their critical comments, their interest and support.
We thank A. Pol, Theo van Alen, N. de Almeida, F. Luesken, M. van Kessel, H. R. Harhangi, M. Wu, Z. Hu, W.
Maalcke, K.F. Ettwig and B. Kartal for helpful discussions. MSMJ was supported by ERC 232937; JJY by SCUT
SH by DARWIN 3011.
Author Contributions
All authors contributed extensively to the work presented in this paper. Phylogenetic analysis were conducted
by M.L and J.Y. H.J.M.O.d.C. provided support with alignments and trees. Experiments for microbial activity
were designed by J.Y., S.C.M.H. and M.L. M.S.M.J. an G.A. conceived the research. M.L. wrote the paper with
input from all other authors, discussing the results, implications and commenting on the manuscript at all stages.
Supplementary Material
Further details concerning the PCR products and FISH analysis as well as nucleotide and amino acid
sequences.
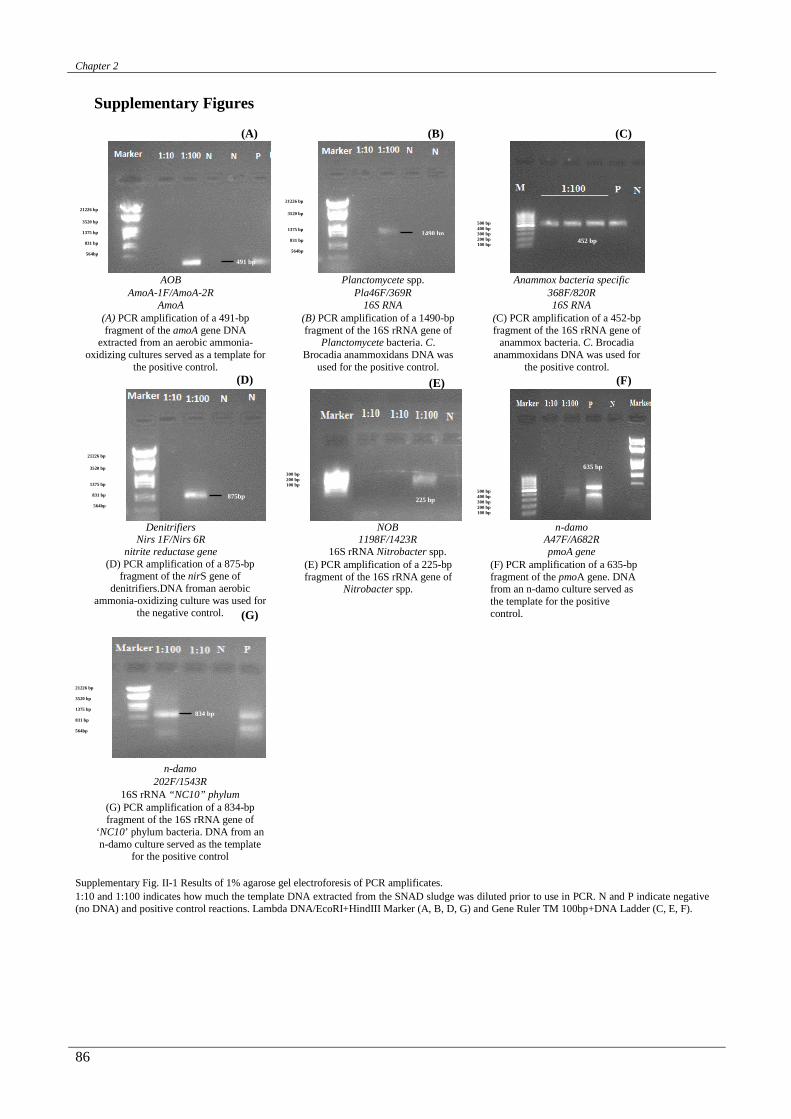
Chapter 2
86
Supplementary Figures
21226 bp
3520 bp
1375 bp
831 bp
564bp
21226 bp
3520 bp
1375 bp
831 bp
564bp
500 bp 400 bp 300 bp 200 bp 100 bp
AOB AmoA-1F/AmoA-2R
AmoA
Planctomycete spp. Pla46F/369R
16S RNA
Anammox bacteria specific 368F/820R 16S RNA
(A) PCR amplification of a 491-bp fragment of the amoA gene DNA
extracted from an aerobic ammonia-oxidizing cultures served as a template for
the positive control.
(B) PCR amplification of a 1490-bp fragment of the 16S rRNA gene of
Planctomycete bacteria. C. Brocadia anammoxidans DNA was
used for the positive control.
(C) PCR amplification of a 452-bp fragment of the 16S rRNA gene of
anammox bacteria. C. Brocadia anammoxidans DNA was used for
the positive control.
21226 bp
3520 bp
1375 bp
831 bp
564bp
300 bp 200 bp 100 bp
500 bp 400 bp 300 bp 200 bp 100 bp
Denitrifiers Nirs 1F/Nirs 6R
nitrite reductase gene
NOB 1198F/1423R
16S rRNA Nitrobacter spp.
n-damo A47F/A682R pmoA gene
(D) PCR amplification of a 875-bp fragment of the nirS gene of
denitrifiers.DNA froman aerobic ammonia-oxidizing culture was used for
the negative control.
(E) PCR amplification of a 225-bp fragment of the 16S rRNA gene of
Nitrobacter spp.
(F) PCR amplification of a 635-bp fragment of the pmoA gene. DNA from an n-damo culture served as the template for the positive control.
21226 bp 3520 bp 1375 bp 831 bp 564bp
n-damo 202F/1543R
16S rRNA “NC10” phylum
(G) PCR amplification of a 834-bp fragment of the 16S rRNA gene of
‘NC10’ phylum bacteria. DNA from an n-damo culture served as the template
for the positive control
Supplementary Fig. II-1 Results of 1% agarose gel electroforesis of PCR amplificates. 1:10 and 1:100 indicates how much the template DNA extracted from the SNAD sludge was diluted prior to use in PCR. N and P indicate negative (no DNA) and positive control reactions. Lambda DNA/EcoRI+HindIII Marker (A, B, D, G) and Gene Ruler TM 100bp+DNA Ladder (C, E, F).
491 bp
1490 bp 452 bp
(D)
875bp 225 bp
635 bp
(E) (F)
(G)
834 bp
(A) (B) (C)

Chapter 2
87
Supplementary Fig. II-2 Fluorescence microscopy images of SNAD sludge. Nitrosomonas spp. were labeled with Cy3 (red) (probe Neu 653, targeting most halophilic/tolerant Nitrosomonas spp.) while anammox bacteria were labeled with FLUOS (green) (Probe AMX820, targeting “Candidatus Brocadia anammoxidans” and “Candidatus Kuenenia stuttgartiensis”). (A,B). SNAD Biomass with entire granules; C). Biomass with entire granules; (D) broken SNAD biomass with a small aggregate. A to D were pictures from different locations of the sample. Scale bar: 10 µm.
(B)
Surface
Inside Inside
Surface
(A)
Surface
Inside
Surface
Inside
(D) (C)A
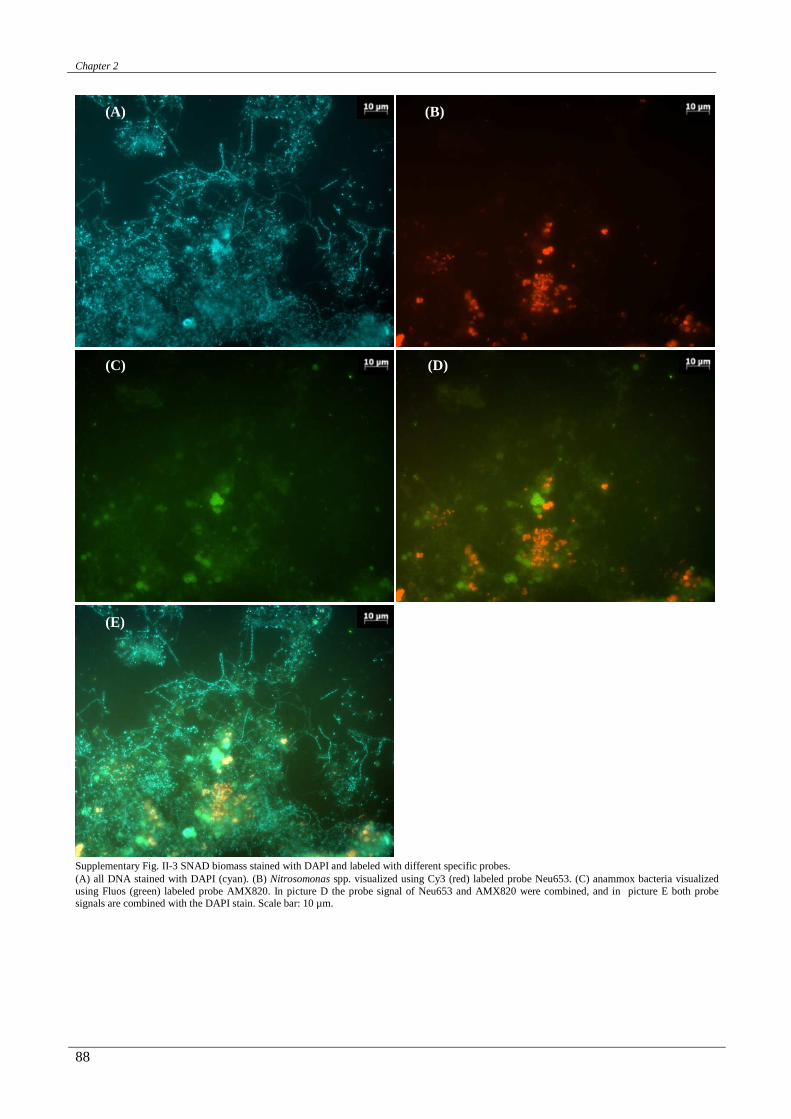
Chapter 2
88
Supplementary Fig. II-3 SNAD biomass stained with DAPI and labeled with different specific probes. (A) all DNA stained with DAPI (cyan). (B) Nitrosomonas spp. visualized using Cy3 (red) labeled probe Neu653. (C) anammox bacteria visualized using Fluos (green) labeled probe AMX820. In picture D the probe signal of Neu653 and AMX820 were combined, and in picture E both probe signals are combined with the DAPI stain. Scale bar: 10 µm.
(A) (B)
(C) (D)
(E)

Chapter 2
89
Supplementary data: nucleotide and amino acid sequences.
Aerobic Ammonia oxidizing bacteria
Nucleotide Sequences
>SNAD_amoA_2 [organism=uncultured Bacteria, Proteobacteria; Betaproteobacteria; environmental samples] [mol_type=genomic DNA] [isolation_source=SNAD sludge treating anaerobic digester effluent] [clone=SNAD_amoA_2] [environmental_sample=TRUE] AmoA SBR clone SNAD_amoA_2 ammonia monooxygenase (amoA) gene, partial cds GATTGGGGTTTCTACTGGTGGTCACACTACCCCATCAACTTCGTAACACCGGGCATTATGCTTCCGGGTGCGCTGATGCTGGACTTCACGCTGTATCTGACACGCAACTGGCTGGTGACGGCTCTGGTTGGAGGTGGATTCTTCGGTCTGCTGTTCTATCCGGGTAACTGGCCGATTTTTGGACCAACCCATTTGCCAATCGTTGTAGAAGGCACATTGCTGTCGATGGCTGATTACATGGGACATCTGTATGTTCGTACAGGTACACCCGAGTATGTTCGTCATATTGAGCAAGGTTCACTGCGTACCTTTGGTGGTCATACCACAGTTATTGCAGCATTCTTCTCTGCGTTCGTATCAATGTTGATGTTCACCGTATGGTGGTATCTTGGAAAAGTTTACTGTACAGCCTTTTTCTACGTTAAAGGTAAAAGAGGTCGTATCGTACATCGCAATGATGTTACCGCATTCGGTGAAGAAGGCTTTCCCGAGGGGAATCA >SNAD_amoA_3 [organism=uncultured Bacteria, Proteobacteria; Betaproteobacteria; environmental samples] [mol_type=genomic DNA] [isolation_source=SNAD sludge treating anaerobic digester effluent] [clone=SNAD_amoA_3] [environmental_sample=TRUE] AmoA SBR clone SNAD_amoA_3 ammonia monooxygenase (amoA) gene, partial cds GATTGGGGTTTCTACTGGTGGTCACACTACCCCATCAACTTCGTAACACCGGGCATTATGCTTCCGGGTGCGCTGATGCTGGACTTCACGCTGTATCTGACACGCAACTGGCTGGTGACGGCTCTGGTTGGAGGTGGATTCTTCGGTCTGCTGTTCTATCCGGGTAACTGGCCGATTTTTGGACCAACCCATTTGCCAATCGTTGTAGAAGGCACATTGCTGTCGATGGCTGATTACATGGGACATCTGTATGTTCGTACAGGTACACCCGAGTATGTTCGTCATATTGAGCAAGGTTCACTGCGTACCTTTGGTGGTCATACCACAGTTATTGCAGCATTCTTCTCTGCGTTCGTATCAATGTTGATGTTCACCGTATGGTGGTATCTTGGAAAAGTTTACTGTACAGCCTTTTTCTACGTTAAAGGTAAAAGAGGTCGTATCGTACATCGCAATGATGTTACCGCATTCGGTGAAGAAGGCTTTCCCGAGGGGAATCA >SNAD_amoA_4 [organism=uncultured Bacteria, Proteobacteria; Betaproteobacteria; environmental samples] [mol_type=genomic DNA] [isolation_source=SNAD sludge treating anaerobic digester effluent] [clone=SNAD_amoA_4] [environmental_sample=TRUE] AmoA SBR clone SNAD_amoA_4 ammonia monooxygenase (amoA) gene, partial cds GATTGGGGTTTCTACTGGTGGTCACATTACCCGCTTAACTTTGTAACACCGGGTACAATGCTCCCAGGCGCACTGATGCTGGACTTCACAATGTACCTGACACGCAACTGGCTGGTAACAGCACTGGTTGGTGGTGCATTCTTTGGTCTGTTGTTCTACCCTGGAAACTGGGCAATCTTTGGTCCAACCCATCTGCCAATCGTTGTAGAAGGAACCCTGTTATCAATGGCTGACTACATGGGTCACCTGTATGTCCGTACAGGTACACCAGAATATGTTCGTCATATTGAACAAGGCTCATTACGTACCTTCGGTGGTCATACAACTGTGATTGCAGCGTTCTTCGCATCATTCGTATCCATGTTGATGTTTGCAGTCTGGWGGTATCTTGGAAAAGTATATTGCACAGCCTTTTTCTACGTTAAAGGTAAAAGAGGTCGTGTTGTACAACGCAATGACGTTACAGCATTTGGTGAAGAAGGCTTTGCAGAGGGGAATCA >SNAD_amoA_5 [organism=uncultured Bacteria, Proteobacteria; Betaproteobacteria; environmental samples] [mol_type=genomic DNA] [isolation_source=SNAD sludge treating anaerobic digester effluent] [clone=SNAD_amoA_5] [environmental_sample=TRUE] AmoA SBR clone SNAD_amoA_5 ammonia monooxygenase (amoA) gene, partial cds GATTGGGGTTTCTACTGGTGGTCACACTACCCCATCAACTTCGTAACACCGGGCATTATGCTTCCGGGTGCGCTGATGCTGGACTTCACGCTGTATCTGACACGCAACTGGCTGGTGACGGCTCTGGTTGGAGGTGGATTCTTCGGTCTGCTGTTCTATCCGGGTAACTGGCCGATTTTTGGACCAACCCATTTGCCAATCGTTGTAGAAGGCACATTGCTGTCGATGGCTGATTACATGGGACATCTGTATGTTCGTACAGGTACACCCGAGTATGTTCGTCATATTGAGCAAGGTTCACTGCGTACCTTTGGTGGTCATACCACAGTTATTGCAGCATTCTTCTCTGCGTTCGTATCAATGTTGATGTTCACCGTATGGTGGTATCTTGGAAAAGTTTACTGTACAGCCTTTTTCTACGTTAAAGGTAAAAGAGGTCGTATCGTACATCGCAATGATGTTACCGCATTCGGTGAAGAAGGCTTTCCCGAGGGGAATCA >SNAD_amoA_6 [organism=uncultured Bacteria, Proteobacteria; Betaproteobacteria; environmental samples] [mol_type=genomic DNA] [isolation_source=SNAD sludge treating anaerobic digester effluent] [clone=SNAD_amoA_6] [environmental_sample=TRUE] AmoA SBR clone SNAD_amoA_6 ammonia monooxygenase (amoA) gene, partial cds GATTGGGGTTTCTACTGGTGGTCACACTACCCCATCAACTTCGTAACACCGGGCATTATGCTTCCGGGTGCGCTGATGCTGGACTTCACGCTGTATCTGACACGCAACTGGCTGGTGACAGCTCTGGTTGGAGGCGGATTCTTCGGTCTGCTGTTCTATCCGGGTAACTGGCCGATCTTTGGTCCAACGCATCTGCCAATCGTTGTAGAAGGAACACTGTTGTCGATGGCTGACTACATGGGCCATATGTATGTTCGTACAGGTACACCCGAGTATGTTCGTCATATTGAGCAAGGTTCACTGCGTACCTTTGGTGGTCATACCACAGTTATTGCAGCATTCTTCTCTGCGTTCGTATCAATGTTGATGTTCACCGTATGGTGGTATCTTGGAAAAGTTTACTGTACAGCCTTTTTCTACGTTAAAGGTAAAAGAGGTCGTATCGTACATCGCAATGATGTTACCGCATTCGGTGAAGAAGGCTTTCCAGAGGGGAATCA >SNAD_amoA_7 [organism=uncultured Bacteria, Proteobacteria; Betaproteobacteria; environmental samples] [mol_type=genomic DNA] [isolation_source=SNAD sludge treating anaerobic digester effluent] [clone=SNAD_amoA_7] [environmental_sample=TRUE] AmoA SBR clone SNAD_amoA_7 ammonia monooxygenase (amoA) gene, partial cds GATTGGGGTTTCTACTGGTGGTCACACTATCCGCTCAACTTTGTATTGCCATCGACCATGATTCCTGGTGCGCTGATGATGGATACGATCCTGTTGTTGACGGGTAACTGGCTGATCACAGCCCTGTTAGGCGGCGGCTTCTTCGGATTATTTTTCTACCCGGGCAACTGGCCCATTTTTGGCCCAACCCACTTACCGGTGGTAGTAGAAGGCGTCCTGTTATCAGTAGCTGACTACACAGGCTTCCTGTATGTACGTACAGGTACA

Chapter 2
90
CCTGAATATGTTCGCCTGATTGAGCAAGGTTCACTGCGTACTTTCGGTGGACACACCACGGTAATTGCAGCGTTCTTCGCAGCGTTCGTATCGATGCTGATGTTCTGCGTATGGTGGTACTTTGGCAAACTGTACTGCACCGCTTTCTACTATGTTAAAGGAGAAAGAGGACGTATTTCGATGAAGAACGACGTAACCGCGTTTGGTGAAGAAGGCTTTCCCGAGGGGAATCA >SNAD_amoA_8 [organism=uncultured Bacteria, Proteobacteria; Betaproteobacteria; environmental samples] [mol_type=genomic DNA] [isolation_source=SNAD sludge treating anaerobic digester effluent] [clone=SNAD_amoA_8] [environmental_sample=TRUE] AmoA SBR clone SNAD_amoA_8 ammonia monooxygenase (amoA) gene, partial cds GATTGGGGTTTCTACTGGTGGTCACACTACCCCATCAACTTCGTAACACCGGGCATTATGCTTCCGGGTGCGCTGATGCTGGACTTCACGCTGTATCTGACACGCAACTGGCTGGTGACAGCTCTGGTTGGAGGCGGATTCTTCGGTCTGCTGTTCTATCCGGGTAACTGGCCGATCTTTGGTCCAACGCATCTGCCAATCGTTGTAGAAGGAACACTGTTGTCGATGGCTGACTACATGGGCCATATGTATGTTCGTACAGGTACACCCGAGTATGTTCGTCATATTGAGCAAGGTTCACTGCGTACCTTTGGTGGTCATACCACAGTTATTGCAGCATTCTTCTCTGCGTTCGTATCAATGTTGATGTTCACCGTATGGTGGTATCTTGGAAAAGTTTACTGTACAGCCTTTTTCTACGTTAAAGGTAAAAGAGGTCGTATCGTACATCGCAATGATGTTACCGCATTCGGTGAAGAAGGCTTTGCCGAGGGGAATCA >SNAD_amoA_9 [organism=uncultured Bacteria, Proteobacteria; Betaproteobacteria; environmental samples] [mol_type=genomic DNA] [isolation_source=SNAD sludge treating anaerobic digester effluent] [clone=SNAD_amoA_9] [environmental_sample=TRUE] AmoA SBR clone SNAD_amoA_9 ammonia monooxygenase (amoA) gene, partial cds GATTGGGGTTTCTACTGGTGGTCACACTACCCCATCAACTTCGTAACACCGGGCATTATGCTTCCGGGTGCGCTGATGCTGGACTTCACGCTGTATCTGACACGCAACTGGCTGGTGACGGCTCTGGTTGGAGGTGGATTCTTCGGTCTGCTGTTCTATCCGGGTAACTGGCCGATTTTTGGACCAACCCATTTGCCAATCGTTGTAGAAGGCACATTGCTGTCGATGGCTGATTACATGGGACATCTGTATGTTCGTACAGGTACACCCGAGTATGTTCGTCATATTGAGCAAGGTTCACTGCGTACCTTTGGTGGTCATACCACAGTTATTGCAGCATTCTTCTCTGCGTTCGTATCAATGTTGATGTTCACCGTATGGTGGTATCTTGGAAAAGTTTACTGTACAGCCTTTTTCTACGTTAAAGGTAAAAGAGGTCGTATCGTACATCGCAATGATGTTACCGCATTCGGTGAAGAAGGCTTTGCAGAGGGGAATCA

Chapter 2
91
Amino Acid Sequences
>SNAD_amoA_2 [gene=amoA] [protein=ammonium monooxygenase] [comment=similar to Nitrosomonas europaea ammonia monooxygenase] ammonium monooxygenase subunit A DWGFYWWSHYPINFVTPGIMLPGALMLDFTLYLTRNWLVTALVGGGFFGLLFYPGNWPIFGPTHLPIVVEGTLLSMADYMGHLYVRTGTPEYVRHIEQGSLRTFGGHTTVIAAFFSAFVSMLMFTVWWYLGKVYCTAFFYVKGKRGRIVHRNDVTAFGEEGFPEGN >SNAD_amoA_3 [gene=amoA] [protein=ammonium monooxygenase] [comment=similar to Nitrosomonas europaea ammonia monooxygenase]ammonium monooxygenase subunit A DWGFYWWSHYPINFVTPGIMLPGALMLDFTLYLTRNWLVTALVGGGFFGLLFYPGNWPIFGPTHLPIVVEGTLLSMADYMGHLYVRTGTPEYVRHIEQGSLRTFGGHTTVIAAFFSAFVSMLMFTVWWYLGKVYCTAFFYVKGKRGRIVHRNDVTAFGEEGFPEGN >SNAD_amoA_4 [gene=amoA] [protein=ammonium monooxygenase] [comment=similar to Nitrosomonas eutropha ammonia monooxygenase] ammonium monooxygenase subunit A DWGFYWWSHYPLNFVTPGTMLPGALMLDFTMYLTRNWLVTALVGGAFFGLLFYPGNWAIFGPTHLPIVVEGTLLSMADYMGHLYVRTGTPEYVRHIEQGSLRTFGGHTTVIAAFFASFVSMLMFAVWXYLGKVYCTAFFYVKGKRGRVVQRNDVTAFGEEGFAEGN >SNAD_amoA_5 [gene=amoA] [protein=ammonium monooxygenase] [comment=similar to Nitrosomonas europaea ammonia monooxygenase] ammonium monooxygenase subunit A DWGFYWWSHYPINFVTPGIMLPGALMLDFTLYLTRNWLVTALVGGGFFGLLFYPGNWPIFGPTHLPIVVEGTLLSMADYMGHLYVRTGTPEYVRHIEQGSLRTFGGHTTVIAAFFSAFVSMLMFTVWWYLGKVYCTAFFYVKGKRGRIVHRNDVTAFGEEGFPEGN >SNAD_amoA_6 [gene=amoA] [protein=ammonium monooxygenase] [comment=similar to Nitrosomonas europaea ammonia monooxygenase] ammonium monooxygenase subunit A DWGFYWWSHYPINFVTPGIMLPGALMLDFTLYLTRNWLVTALVGGGFFGLLFYPGNWPIFGPTHLPIVVEGTLLSMADYMGHMYVRTGTPEYVRHIEQGSLRTFGGHTTVIAAFFSAFVSMLMFTVWWYLGKVYCTAFFYVKGKRGRIVHRNDVTAFGEEGFPEGN >SNAD_amoA_7 [gene=amoA] [protein=ammonium monooxygenase] [comment=similar to Nitrosomonas oligotropha ammonia monooxygenase] ammonium monooxygenase subunit A DWGFYWWSHYPLNFVLPSTMIPGALMMDTILLLTGNWLITALLGGGFFGLFFYPGNWPIFGPTHLPVVVEGVLLSVADYTGFLYVRTGTPEYVRLIEQGSLRTFGGHTTVIAAFFAAFVSMLMFCVWWYFGKLYCTAFYYVKGERGRISMKNDVTAFGEEGFPEGN >SNAD_amoA_8 [gene=amoA] [protein=ammonium monooxygenase] [comment=similar to Nitrosomonas europaea ammonia monooxygenase] ammonium monooxygenase subunit A DWGFYWWSHYPINFVTPGIMLPGALMLDFTLYLTRNWLVTALVGGGFFGLLFYPGNWPIFGPTHLPIVVEGTLLSMADYMGHMYVRTGTPEYVRHIEQGSLRTFGGHTTVIAAFFSAFVSMLMFTVWWYLGKVYCTAFFYVKGKRGRIVHRNDVTAFGEEGFAEGN >SNAD_amoA_9 [gene=amoA] [protein=ammonium monooxygenase] [comment=similar to Nitrosomonas europaea ammonia monooxygenase] ammonium monooxygenase subunit A DWGFYWWSHYPINFVTPGIMLPGALMLDFTLYLTRNWLVTALVGGGFFGLLFYPGNWPIFGPTHLPIVVEGTLLSMADYMGHLYVRTGTPEYVRHIEQGSLRTFGGHTTVIAAFFSAFVSMLMFTVWWYLGKVYCTAFFYVKGKRGRIVHRNDVTAFGEEGFAEGN

Chapter 2
92
Anammox bacteria
Nucleotide Sequences
>SNAD_Amx_4 [organism=uncultured planctomycete, anammox bacteria; environmental samples] [mol_type=genomic DNA] [isolation_source=SNAD sludge treating anaerobic digester effluent] [clone=SNAD_Amx_4] [environmental_sample=TRUE] Uncultured planctomycete clone SNAD_Amx_4 16S ribosomal RNA gene, partial sequence TTCGCAATGCCCGAAAGGGTGACGAAGCGACGCCGCGTGCGGGAAGAAGGCCTTCGGGTTGTAAACCGCTGTCGGGAGTTAAGAAATGCAAGGATGTTAATAGCATCTTTGTTTGAGTACGGCTCCGGAGGAAGCCACGGCTAACTCTGTGCCAGCAGCCGCGGTAATACAGAGGCGGCAAGCGTTGTTCGGAATTATTGGGCGTAAAGAGCACGTAGGCGGCTGTGTAAGTCGGTTGTGAAAGCCTTCCGCTTAACGGAAGAACGGCATCCGATACTGCATAGCTCGAGTGCGGGAGGGGAGAGTGGAACTTCTGGTGGAGCGGTGAAATGCGTAGATATCAGAAGGAACACCGGCGGCGAAGGCGACTCTCTGGCCCGTAACTGACGCTGAGTGTGCGAAAGCTAGGGGAGCAAACGGGATTAGATACCCCGGTAGTCCTAGCCGTAAACGATGGGCACTAAGTAGAGGGGTTTT >SNAD_Amx_5 [organism=uncultured planctomycete, anammox bacteria; environmental samples] [mol_type=genomic DNA] [isolation_source=SNAD sludge treating anaerobic digester effluent] [clone=SNAD_Amx_5] [environmental_sample=TRUE] Uncultured planctomycete clone SNAD_Amx_5 16S ribosomal RNA gene, partial sequence TTCGCAATGCCCGAAAGGGTGACGAAGCGACGCCGCGTGCGGGAAGAAGGCCTTCGGGTTGTAAACCGCTGTCGGGAGTTAAGAAATGCAAGGATGTTAATAGCATCTTTGTTTGACTAAGGCTCCGGAGGAAGCCACGGCTAACTCTGTGCCAGCAGCCGCGGTAATACAGAGGCGGCAAGCGTTGTTCGGAATTATTGGGCGTAAAGAGCACGTAGGCGGCTGTGTAAGTCGGTTGTGAAAGCCTTCCGCTTAACGGAAGAACGGCATCCGATACTGCATAGCTCGAGTGCGGGAGGGGAGAGTGGAACTTCTGGTGGAGCGGTGAAATGCGTAGATATCAGAAGGAACACCGGCGGCGAAGGCGACTCTCTGGCCCGTAACTGACGCTGAGTGTGCGAAAGCTAGGGGAGCAAACGGGATTAGATACCCCGGTAGTCCTAGCCGTAAACGATGGGCACTAAGTAGAGGGGTTTT >SNAD_Amx_9 [organism=uncultured planctomycete, anammox bacteria; environmental samples] [mol_type=genomic DNA] [isolation_source=SNAD sludge treating anaerobic digester effluent] [clone=SNAD_Amx_9] [environmental_sample=TRUE] Uncultured planctomycete clone SNAD_Amx_9 16S ribosomal RNA gene, partial sequence TTCGCAATGCCCGAAAGGGTGACGAAGCGACGCCGCGTGCGGGAAGAAGGCCTTCGGGTTGTAAACCGCTGTCGGGAGTTAAGAAATGCAAGGATGTTAATAGCATCTTTGTTTGACTAAGGCTCCGGAGGAAGCCACGGCTAACTCTGTGCCAGCAGCCGCGGTAATACAGAGGCGGCAAGCGTTGTTCGGAATTATTGGGCGTAAAGAGCACGTAGGCGGCTGTGTAAGTCGGTTGTGAAAGCCTTCCGCTTAACGGAAGAACGGCATCCGGTACTGCATAGCTCGAGTGCGGGAGGGGAGAGTGGAACTTCTGGTGGAGCGGTGAAATGCGTAGATATCAGAAGGAACACCGGCGGCGAAGGCGACTCTCTGGCCCGTAACTGACGCTGAGTGTGCGAAAGCTAGGGGAGCAAACGGGATTAGATACCCCGGTAGTCCTAGCCGTAAACGATGGGCACTAAGTAGAGGGGTTTT >SNAD_Amx_11 [organism=uncultured planctomycete, anammox bacteria; environmental samples] [mol_type=genomic DNA] [isolation_source=SNAD sludge treating anaerobic digester effluent] [clone= SNAD_Amx_11] [environmental_sample=TRUE] Uncultured planctomycete clone SNAD_Amx_11 16S ribosomal RNA gene, partial sequence TTCGCAATGCCCGAAAGGGTGACGAAGCGACGCCGCGTGCGGGAAGAAGGCCTTCGGGTTGTAAACCGCTGTCGGGAGTTAAGAAATGCAAGGATGTTAATAGCATCTTTGTTTGACTAAGGCTCCGGAGGAAGCCACGGCTAACTCTGTGCCAGCAGCCGCGGTAATACAGAGGCGGCAAGCGTTGTTCGGAATTATTGGGCGTAAAGAGCACGTAGGCGGCTGTGTAAGTCGGTTGTGAAAGCCTTCCGCTTAACGGAAGAACGGCATCCGATACTGCATAGCTCGAGTGCGGGAGGGGAGAGTGGAACTTCTGGTGGAGCGGTGAAATGCGTAGATATCAGAAGGAACACCGGCGGCGAAGGCGACTCTCTGGCCCGTAACTGACGCTGAGTGTGCGAAAGCTAGGGGAGCAAACGGGATTAGATACCCCGGTAGTCCTAGCCGTAAACGATGGGCACTAAGTAGAGGGGTTTT >SNAD_Amx_20 [organism=uncultured planctomycete, anammox bacteria; environmental samples] [mol_type=genomic DNA] [isolation_source=SNAD sludge treating anaerobic digester effluent] [clone= SNAD_Amx_20] [environmental_sample=TRUE] Uncultured planctomycete clone SNAD_Amx_20 16S ribosomal RNA gene, partial sequence TTCCCAATGCCCGAAAGGGTGACGAAGCGACGCCGCGTGCGGGAAGAAGGCCTTCGGGTTGTAAACCGCTGTCGGGAGTTAAGAAATGCAAGGATGTTAATAGCATCTTTGTTTGACTAAGGCTCCGGAGGAAGCCACGGCTAACTCTGTGCCAGCAGCCGCGGTAATACAGAGGCGGCAAGCGTTGTTCGGAATTATTGGGCGTAAAGAGCACGTAGGCGGCTGTGTAAGTCGGTTGTGAAAGCCTTCCGCTTAACGGAAGAACGGCATCCGATACTGCATAGCTCGAGTGCGGGAGGGGAGAGTGGAACTTCTGGTGGAGCGGTGAAATGCGTAGATATCAGAAGGAACACCGGCGGCGAAGGCGACTCTCTGGCCCGTAACTGACGCTGAGTGTGTGAAAGCTAGGGGAGCAAACGGGATTAGATACCCCGGTAGTCCTAGCCGTAAACGATGGGCACTAAGTAGAGGGGTTTT >SNAD_Amx_33 [organism=uncultured planctomycete, anammox bacteria; environmental samples] [mol_type=genomic DNA] [isolation_source=SNAD sludge treating anaerobic digester effluent] [clone=SNAD_Amx_33] [environmental_sample=TRUE] Uncultured planctomycete clone SNAD_Amx_33 16S ribosomal RNA gene, partial sequence TTCGCAATGCCCGAAAGGGTGACGAAGCGACGCCGCGTGCGGGAAGAAGGCCTTCGGGTTGTAAACCGCTGTCGGGAGTTAAGAAATGCAAGGATGTTAATAGCATCTTTGTTTGACTAAGGCTCCGGAGGAAGCCACGGCTAACTCTGTGCCAGCAGCCGCGGTAATACAGAGGCGGCAAGCGTTGTTCGGAATTATTGGGCGTAAAGAGCACGTAGGCGGCTGTGTAAGTCGGTTGTGAAAGCCTTCCGCTTAACGGAAGAACGGCATCCGATACTGCATAGCTCGAGTGCGGGAGGGGAGAGTGGAACTTCTGGTGGAGCGGTGAAATGCGTAGATATCAGAAGGAACACCGGCGGCGAAGGCGACTCTCTGGCCCGTAACTGACGCTGAGTGTGCGAAAGCTAGGGGAGCAAACGGGATTAGATACCCCGGTAGTCCTAGCCGTAAACGATGGGCACTAAGTAGAGGGGTTTT

Chapter 2
93
Denitrifying bacteria
Nucleotide Sequences
>SNAD_Nirs_55_1 [organism=uncultured Bacteria; Proteobacteria; Betaproteobacteria; Environmental Samples] [mol_type=genomic DNA] [isolation_source=SNAD sludge treating anaerobic digester effluent] [clone=SNAD_Nirs_55_1] [environmental_sample=TRUE] Uncultured bacterium clone SNAD_Nirs_55_1 dissimilatory nitrite reductase (nirS) gene, partial cds TGATCTCGACGCCGCATGACAATCCCAAGTTCGCCAAGTACAAGAGCAAGAACTGGAAGGTTGTCCAGGAACTGCCGATGCCCGGCGCCGGCAACCTGTTCGTCAAGACCCACCCGAAGTCGAAGCACCTGTGGGCCGACATGCCGATGAACCCCGAGCGCGAGAACGCCGAGTCGATGGTGGTGTTCAATATGAACGACCTGACCAAGCCGCCGGTCAAGATCGACGTGGCCAAGGATTCGGGCCTGCCGATGACCAAGGCGCTGCGCCGTGCGGTGCACCAGGAGTTCAGCCAGGACGGCACGGAAGTGTGGGTCTCACTGTGGGGCGGCAAGACGGACCAGTCGGCCATCGTGGTGTATGACGACAAGACGCTCAAGGTCAAGAAGGTGATCACCGATCCGAAGATGATCACCCCGACCGGCAAGTTCAACG >SNAD_Nirs_56_2 [organism=uncultured Bacteria; Proteobacteria; Betaproteobacteria; Environmental Samples] [mol_type=genomic DNA] [isolation_source=SNAD sludge treating anaerobic digester effluent] [clone=SNAD_Nirs_56_2] [environmental_sample=TRUE] Uncultured bacterium clone SNAD_Nirs_56_2 dissimilatory nitrite reductase (nirS) gene, partial cds CGGCACCGATCCGAAGGGGCACCCGAAGAGCGCCTGGAAAGTCGTGCGCTCGCTCAAGGCGCAGGGCGGCGGCAACCTGTTCATCAAGACCCATCCGAAGTCCACGAACCTCTGGGTCGACACGCCGCTGAACCCCGACGCCAAGATCGCCCAGTCGGTCGCGGTGTTCGACATCAGGAACCTCGACAAGCCGTTCGAAGTGCTGCCGATCGCCGACTGGGCCCAGGTTGGCGAAGGCGCCAAGCGGATCACCCAGCCTGAGTACAACAAGGCGGGCGACGAGGTCTGGTTCTCGGTGTGGAGCGCGAAGAACCAGGAGTCCGCGATCGTGGTCGTCGACGACAGGACGCGCAAGCTGAAAGCCGTGATCAAAGACCCCAAGCTGATCACGCCTACCGGCAAGTTCAACG >SNAD_Nirs_57_3 [organism=uncultured Bacteria; Proteobacteria; Betaproteobacteria; Environmental Samples] [mol_type=genomic DNA] [isolation_source=SNAD sludge treating anaerobic digester effluent] [clone=SNAD_Nirs_57_3] [environmental_sample=TRUE] Uncultured bacterium clone SNAD_Nirs_57_3 dissimilatory nitrite reductase (nirS) gene, partial cds CGCCGCAGTACTCGATCATGGAAGGCGAGACGCTCAAGCCGCTGAAGGTGGTCTCGACCCGCGGCAACACGGTGGATGGCGACTACCACCCCGAGCCGCGCGTGGCCTCGATCGTCTCCTCGATGATCAAGCCCGAGTGGGTGGTGAATGTGAAGGGGACCGGCCAGATCATGCTGGTGGACTACTCCGACATCAAGAACCTGAAGACGACCACGATCGAATCGGCCAAGTTCCTCCATGACGGCGGCTGGGACGCCTCCAAGCGCTACTTCCTGGTGGCAGCCAACGCGTCCAACAAGATCGCTGCGGTCGACACGAAGACGGGCAAGCTGGCGGCGCTGGTCGACACCAAGAAGATCCCGCACCCGGGCCGCGGTGCCAACTTCACGCACCCGACGTTCGGTCCCGTGTGGGCCACCGGCCACTTGGGCGACGCCGTGGTCACGCTGATCTCGACGCCGTCGGAGAAGGCTTCCGATGCCAAGTTCAAGACGCACAATTGGAAGGTCGTGCAGGAGCTGCCGATGCCTGGCGCGGGCAACCTGTTCGTGAAGACGCATCCGAAGTCCACCAACCTGTGGGCCGACATGCCGATGAACCCCGAGCGCGAGAACGCCGAATCGGTGTACGTGTTCAGCCTCAAGGACCTGAACAAGGCGCCGGTGAAGATCGACGTCGCCAAGGACTCCGGCCTGCCGCAGACCAAGGCGCTGCGCCGCGCAACGCATCCCGAGTACAACGAGGCCGGGGACGAGGTGTGG >SNAD_Nirs_58_5 [organism=uncultured Bacteria; Proteobacteria; Betaproteobacteria; Environmental Samples] [mol_type=genomic DNA] [isolation_source=SNAD sludge treating anaerobic digester effluent] [clone= SNAD_Nirs_58_5] [environmental_sample=TRUE] Uncultured bacterium clone SNAD_Nirs_58_5 dissimilatory nitrite reductase (nirS) gene, partial cds CGGCACCGATCCGAAGGGGCATCCGAAGAGCGCCTGGAAAGTCGTGCGCTCGCTCAAGGCGCAGGGCGGCGGCAACCTGTTCATCAAGACCCATCCGAAGTCCACGAACCTCTGGGTCGACACGCCGCTGAACCCCGACGCCAAGATCGCCCAGTCGGTCGCGGTGTTCGACATCAAGAACCTCGACAAGCCGTTCGAAGTGCTGCCGATTGCCGACTGGGCCCAGGTTGGCGAAGGCGCCAAGCGGATCACCCAGCCCGAGTACAACAAGGCGGGCGACGAGGTCCGGTTCTCGGTGTGGAGCGCGAAGAACCAGGAGTCCGCGATCGTGGTCGTCGACGACAAGACGCGCAAGCTGAAAGCCGTGATCAAGGACCCCAAGCTGATCACGCCTACCGGCAAGTTCAACG >SNAD_Nirs_24_1 [organism=uncultured Bacteria; Proteobacteria; Betaproteobacteria; Environmental Samples] [mol_type=genomic DNA] [isolation_source=SNAD sludge treating anaerobic digester effluent] [clone=SNAD_Nirs_24_1] [environmental_sample=TRUE] Uncultured bacterium clone SNAD_Nirs_24_1 dissimilatory nitrite reductase (nirS) gene, partial cds CATGAAGGGCGACACGCTCGAGCCGCTGAAGATCCAGGCGACCCGCGGCATGGCGGTCGACACGCAGGAGTTCCACCCCGAGCCGTGCGTGGCCTCGATCGTCGCCGTGCACGACAAGCCGCAGTTCATCGTGAACGTGAAGGAAACCGGCAAGATCCTGCTGGTTGACTATGGCGATATCAACGCTCTGAAGGTCACCGAAATCGGCGCCGCCCGCTTCCTGCACGACGGCGGTTTGGATTCGAGCCACCGCTACTTCATGGTGGCCGCCAATCAGTCCAACAAGATCGCGGTGGTGGACACCAAGGAAGGCAAGCTGGCGGGGCTGGTGGATGTCGGCAAGATTCCGCATCCGGGCCGTGGGGCCAACTTTGTGGATCCCAAGTTTGGACCGGTCTGGGCGACGGGTCACCTGGGCGATGAAACCATCTCGTTGATCGGCACCGACCCAGAGAAACACAAGGATCAGGCCTGGAAGGTGGTGCGTACCCTCAAGGGTCAGGGCGGCGGTTCGCTGTTCATCAAGACCCATCCCACATCCAAGAACGTGTATGTGGACACCACTCTGAATCCGGACCCCAAGATCAGCCAGTCGGTGGCGGTGTACAATGTGGATGATCTGGACAAGCCCTATCAGGTGCTGCCAATCGCCGAATGGGCCGGTTTGAAAGACGATAGCGCCAAGCGGGTGGTGCAACCGGAGTACAATAAGGCCGGCGACGAGGTTTGGTTCTCGGTGTGGAGCGCCGAGGATAAGGAATCGGCTATCGTGGTGGTGGACGACAAGACCCTGAAGCTGAAGACCGTCATCAAGGATCCGAAGCTGATCACCCCGACCGGCAAGTTCAACG >SNAD_Nirs_25_2 [organism=uncultured Bacteria; Proteobacteria; Betaproteobacteria; Environmental Samples] [mol_type=genomic DNA] [isolation_source=SNAD sludge treating

Chapter 2
94
anaerobic digester effluent] [clone=SNAD_Nirs_25_2] [environmental_sample=TRUE] Uncultured bacterium SNAD_Nirs_25_2 dissimilatory nitrite reductase (nirS) gene, partial cds CCTACTGGCCGCCGCAGTACGTGATCATGGATGGCGACACATTGAAGCCGCGCAAGGTCGTGTCCACCCGTGGCATGACGGTCGCTGGCGAATACCATCCGGAGCCGCGCGTCGCTTCCATCGTCGCTTCCTTCATCAAGCCGGAATGGGTTATCAACATCAAGGAAACCGGCCAGATTCTGCTGGTCGATTACTCTGACATCGAGAACCTGAAGACGACGACGGTCGGTTCAGCCAAGTTCCTGCATGATGGCGGCTGGGATGCTTCCAAGCGTTACTTCCTGGTGGCAGCGAATGCCTCCAACAAGATCGCTGCGGTTGATACCAAGACCGGCAAGCTGGCCGCTCTGGTCGATACGGCCAAGATCCCGCACCCGGGTCGCGGCGCCAACTTCACCCATCCGAAGTTTGGTCCGGTATGGACGACGGGTCACCTCGGTGCCGATGTCCTGACCCTGATCAGCACGCCGTCGGAGAAGAAGTCGGATGCCAAGTTCAAGGAATACAACTGGAAGGTCGTTCAGGAAGTGAAGCACGTGCCGGGCAACCTGTTCGTCAAGACCTATCCGAAGTCCAAGCACCTGTGGGCTGACTCGCCGCAGAATCCGGACAAGACGCTGGCTGAATCCGTTGCCATCTGGGACGTGGCTGATCTGTCCAAGCCGGTCAAGGTG >SNAD_Nirs_27_4 [organism=uncultured Bacteria; Proteobacteria; Betaproteobacteria; Environmental Samples] [mol_type=genomic DNA] [isolation_source=SNAD sludge treating anaerobic digester effluent] [clone=SNAD_Nirs_27_4] [environmental_sample=TRUE] Uncultured bacterium clone SNAD_Nirs_27_4 dissimilatory nitrite reductase (nirS) gene, partial cds CTACTGGCCGCCGCAATACTCGATCATGGAAGGCGAGACGCTCAAGCCGCTGAAGGTGGTCTCGACCCGCGGCAACACGGTGGATGGCGACTACCACCCCGAGCCGCGCGTGGCCTCGATCGTCTCCTCGATGATCAAGCCCGAGTGGGTGGTGAATGTGAAGGAGACCGGCCAGATCATGCTGGTGGACTACTCCGACATCAAGAACCTGAAGACGACCACGATCGAATCGGCCAAGTTCCTCCATGACGGCGGCTGGGACGCCTCCAAGCGCTACTTCCTGGTGGCAGCCAACGCGTCCAACAAGATCGCTGCGGTCGACACGAAGACGGGCAAGCTGGCGGCGCTGGTCGACACCAAGAAGATCCCGCACCCGGGCCGCGGTGCCAACTTCACGCACCCGACGTTCGGTCCCGTGTGGGCCACCGGCCACTTGGGCGACGCCGTGGTCACGCTGATCTCGACGCCGTCGGAGAAGGCTTCCGATGCCAAGTTCAAGACGCACAATTGGAAGGTCGTGCAGGAGCTGCCGATGCCTGGCGCGGGCAACCTGTTCGTGAAGACGCATCCGAAGTCCACCAACCTGTGGGCCGACATGCCGATGAACCCCGAGCGCGAGAACGCCGAATCGGTGTACGTGTTCAGCCTCAAGGACCTGAACAAGGCGCCGGTGAAGATCGACGTCGCCAAGGACTCCGGCCTGCCGCAGACCAAGGCGCTGCGCCGCGCAACGCATCCCGAGTACAACGAGGCCGGGGACGAGGTGTGG >SNAD_Nirs_28_9 [organism=uncultured Bacteria; Proteobacteria; Betaproteobacteria; Environmental Samples] [mol_type=genomic DNA] [isolation_source=SNAD sludge treating anaerobic digester effluent] [clone= SNAD_Nirs_28_9] [environmental_sample=TRUE] Uncultured bacterium clone SNAD_Nirs_28_9 dissimilatory nitrite reductase (nirS) gene, partial cds CCTACTGGCCGCCACAATTCACGATCATGGACGGCGCCACGCTCGAGCCGCTCAAGGTGGTCTCGACGCGCGGCATGACGGTGGACACGCAGGAGTTCCACCCGGAGCCGCGCGTGGCCGCCATCGTGGCCTCGCACCAGCATCCCGAGCTCATCGTCAACGTCAAGGAGACCGGGCAGGTCATGCTGGTCAACTACGAGGACATCGATAACCTCCGGACCACCACGATCGGCGCGGCCCGCTTCCTGCACGACGGCGGCTGGGACGTGACCAAGCGCTACTTCCTCACCGCGGCGAACCAGTCGAACAAGATCGCCGTGATCGATTCGAAGGACCAGAAGCTCACCGCACTCGTCGACGTGGACAAGATCCCGCACCCGGGCCGCGGCGCGAACTTCATCGATCCGAAGTACGGGCCGGTGTGGGCGACGAGCGCGCTCGGCAACGAGAAGGTGACGCTGGTCGCGACCGACCCCGAGAACTACCCGCAGCACGCCTGGAAGGCCGTGCGCGTGCTGAAGGGCCAGGGTGGCGGGTCGTTGTTCGTGAAGACGCACCCGAAATCGAAGCACCTGTACGTGGATACCACGCTGAACCCCGATCCGAAG

Chapter 2
95
Amino Acid Sequences
>SNAD_Nirs_55_1 [gene=NirS] [protein= dissimilatory nitrite reductase] [comment=similar to Thauera dissimilatory nitrite reductase] dissimilatory nitrite reductase ISTPHDNPKFAKYKSKNWKVVQELPMPGAGNLFVKTHPKSKHLWADMPMNPERENAESMVVFNMNDLTKPPVKIDVAKDSGLPMTKALRRAVHQEFSQDGTEVWVSLWGGKTDQSAIVVYDDKTLKVKKVITDPKMITPTGKFN >SNAD_Nirs_56_2 [gene=NirS] [protein= dissimilatory nitrite reductase] dissimilatory nitrite reductase GTDPKGHPKSAWKVVRSLKAQGGGNLFIKTHPKSTNLWVDTPLNPDAKIAQSVAVFDIRNLDKPFEVLPIADWAQVGEGAKRITQPEYNKAGDEVWFSVWSAKNQESAIVVVDDRTRKLKAVIKDPKLITPTGKFN >SNAD_Nirs_57_3 [gene=NirS] [protein= dissimilatory nitrite reductase] [comment=similar to Thauera dissimilatory nitrite reductase] dissimilatory nitrite reductase PQYSIMEGETLKPLKVVSTRGNTVDGDYHPEPRVASIVSSMIKPEWVVNVKGTGQIMLVDYSDIKNLKTTTIESAKFLHDGGWDASKRYFLVAANASNKIAAVDTKTGKLAALVDTKKIPHPGRGANFTHPTFGPVWATGHLGDAVVTLISTPSEKASDAKFKTHNWKVVQELPMPGAGNLFVKTHPKSTNLWADMPMNPERENAESVYVFSLKDLNKAPVKIDVAKDSGLPQTKALRRATHPEYNEAGDEVW >SNAD_Nirs_58_5 [gene=NirS] [protein= dissimilatory nitrite reductase] dissimilatory nitrite reductase GTDPKGHPKSAWKVVRSLKAQGGGNLFIKTHPKSTNLWVDTPLNPDAKIAQSVAVFDIKNLDKPFEVLPIADWAQVGEGAKRITQPEYNKAGDEVRFSVWSAKNQESAIVVVDDKTRKLKAVIKDPKLITPTGKFN >SNAD_Nirs_24_1 [gene=NirS] [protein= dissimilatory nitrite reductase] dissimilatory nitrite reductase MKGDTLEPLKIQATRGMAVDTQEFHPEPCVASIVAVHDKPQFIVNVKETGKILLVDYGDINALKVTEIGAARFLHDGGLDSSHRYFMVAANQSNKIAVVDTKEGKLAGLVDVGKIPHPGRGANFVDPKFGPVWATGHLGDETISLIGTDPEKHKDQAWKVVRTLKGQGGGSLFIKTHPTSKNVYVDTTLNPDPKISQSVAVYNVDDLDKPYQVLPIAEWAGLKDDSAKRVVQPEYNKAGDEVWFSVWSAEDKESAIVVVDDKTLKLKTVIKDPKLITPTGKFN >SNAD_Nirs_25_2 [gene=NirS] [protein= dissimilatory nitrite reductase] [comment=similar to Dechloromonas aromatica dissimilatory nitrite reductase] dissimilatory nitrite reductase YWPPQYVIMDGDTLKPRKVVSTRGMTVAGEYHPEPRVASIVASFIKPEWVINIKETGQILLVDYSDIENLKTTTVGSAKFLHDGGWDASKRYFLVAANASNKIAAVDTKTGKLAALVDTAKIPHPGRGANFTHPKFGPVWTTGHLGADVLTLISTPSEKKSDAKFKEYNWKVVQEVKHVPGNLFVKTYPKSKHLWADSPQNPDKTLAESVAIWDVADLSKPVKV >SNAD_Nirs_27_4 [gene=NirS] [protein= dissimilatory nitrite reductase] [comment=similar to Thauera dissimilatory nitrite reductase] dissimilatory nitrite reductase YWPPQYSIMEGETLKPLKVVSTRGNTVDGDYHPEPRVASIVSSMIKPEWVVNVKETGQIMLVDYSDIKNLKTTTIESAKFLHDGGWDASKRYFLVAANASNKIAAVDTKTGKLAALVDTKKIPHPGRGANFTHPTFGPVWATGHLGDAVVTLISTPSEKASDAKFKTHNWKVVQELPMPGAGNLFVKTHPKSTNLWADMPMNPERENAESVYVFSLKDLNKAPVKIDVAKDSGLPQTKALRRATHPEYNEAGDEVW >SNAD_Nirs_28_9 [gene=NirS] [protein= dissimilatory nitrite reductase] [comment=similar to Pseudomonas stutzeri dissimilatory nitrite reductase] dissimilatory nitrite reductase YWPPQFTIMDGATLEPLKVVSTRGMTVDTQEFHPEPRVAAIVASHQHPELIVNVKETGQVMLVNYEDIDNLRTTTIGAARFLHDGGWDVTKRYFLTAANQSNKIAVIDSKDQKLTALVDVDKIPHPGRGANFIDPKYGPVWATSALGNEKVTLVATDPENYPQHAWKAVRVLKGQGGGSLFVKTHPKSKHLYVDTTLNPDPK

Chapter 2
96
Aerobic nitrite oxidizing bacteria bacteria
Nucleotide Sequences
>SNAD_NOB_1_1 [organism=uncultured Nitrobacter; Proteobacteria; Alphaproteobacteria; Environmental Samples] [mol_type=genomic DNA] [isolation_source=SNAD sludge treating anaerobic digester effluent] [clone=SNAD_NOB_1_1] [environmental_sample=TRUE] Uncultured Nitrobacter clone SNAD_NOB_1_1 16S ribosomal RNA gene, partial sequence TCCCCTAGCAAATCTCAAAAAACCGTCTCAGTTCGGATTGGGCTCTGCAACTCGAGCCCATGAAGTTGGAATCGCTAGTAATCGTGGATCAGCATGCCACGGTGAATACGTTCCCGGGCCTTGTACACACCGCCCGTCACACCATGGGAGTTGGCTTTACCCGAAGGCGTTTCGCTAACCGCAAGGAGGCAGGCGACCACGGTAGGGTCAGCGACTGGGGTGAAG >SNAD_NOB_1_2 [organism= uncultured Nitrobacter; Proteobacteria; Alphaproteobacteria; Environmental Samples] [mol_type=genomic DNA] [isolation_source=SNAD sludge treating anaerobic digester effluent] [clone=SNAD_NOB_1_2] [environmental_sample=TRUE] Uncultured Nitrobacter clone SNAD_NOB_1_2 16S ribosomal RNA gene, partial sequence ACCCCTAGCAAATCTCAAAAAACCGTCTCAGTTCGGATTGGGCTCCGCAACTCGAGCCCATGAAGTTGGAATCGCTAGTAATCGTGGATCAGCATGCCACGGTGAATACGTTCCCGGGCCTTGTACACACCGCCCGTCACACCATGGGAGTTGGTTTTACCTGAAGACGGTGCGCTAACCCGCAAGGGAGGCAGCCGGCCACGGTAGGGTCAGCGACTGGGGTGAAG >SNAD_NOB_1_3 [organism=uncultured Nitrobacter; Proteobacteria; Alphaproteobacteria; Environmental Samples] [mol_type=genomic DNA] [isolation_source=SNAD sludge treating anaerobic digester effluent] [clone=SNAD_NOB_1_3] [environmental_sample=TRUE] Uncultured Nitrobacter clone SNAD_NOB_1_3 16S ribosomal RNA gene, partial sequence TACCCMTAGCAAATCTCAAAAAACCGTCTCAGTTCGGATTGGACTCTGCAACTCGAGTCCATGAAGTTGGAATCGCTAGTAATCGTGGATCAGCATGCCACGGTGAATACGTTCCCGGGCCTTGTACACACCGCCCGTCACACCATGGGAGTTGGTTTTACCTGAAGGCGGTGCGCTAACCCGCAAGGGAGGCAGCCGACCACGGTAGGGTCAGCGACTGGGGTGAAG >SNAD_NOB_1_4 [organism=uncultured Nitrobacter; Proteobacteria; Alphaproteobacteria; Environmental Samples] [mol_type=genomic DNA] [isolation_source=SNAD sludge treating anaerobic digester effluent] [clone= SNAD_NOB_1_4] [environmental_sample=TRUE] Uncultured Nitrobacter clone SNAD_NOB_1_4 16S ribosomal RNA gene, partial sequence TACCCCTAGCAAATCTCAAAAAACCGTCTCAGTTCGGATTGGGCTCTGCAACTCGAGCCCATGAAGTTGGAATCGCTAGTAATCGTGGATCAGCATGCCACGGTGAATACGTTCCCGGGCCTTGTACACACCGCCCGTCACACCATGGGAGTTGGTTTTACCTGAAGACGGTGCGCTAACCCGCAAGGGAGGCAGCCGGCCACGGTAGGGTCAGCGACTGGGGTGAAG >SNAD_NOB_1_5 [organism=uncultured bacterium; Rhodoblastus; Proteobacteria; Alphaproteobacteria; Environmental Samples] [mol_type=genomic DNA] [isolation_source=SNAD sludge treating anaerobic digester effluent] [clone= SNAD_NOB_1_5] [environmental_sample=TRUE] Uncultured bacterium clone SNAD_NOB_1_5 16S ribosomal RNA gene, partial sequence TACCCCTAGCAAATCTCAAAAAACCGTCTCAGTTCGGATTGTACTCTGCAACTCGAGTGCATGAAGGTGGAATCGCTAGTAATCGCAGATCAGCACGCTGCGGTGAATACGTTCCCGGGCCTTGTACACACCGCCCGTCACACCATGGGAGTTGGCTTTACCCGAAGGCGTTTCGCTAATCGCAAGGAGGCAGGCGACCACGGTAGGGTCAGCGACTGGGGTGAAG >SNAD_NOB_1_6 [organism=uncultured bacterium; Bradyrhizobium; Proteobacteria; Alphaproteobacteria; Environmental Samples] [mol_type=genomic DNA] [isolation_source=SNAD sludge treating anaerobic digester effluent] [clone= SNAD_NOB_1_6] [environmental_sample=TRUE] Uncultured bacterium clone SNAD_NOB_1_6 16S ribosomal RNA gene, partial sequence ACCCCTAGCAAATCTCAAAAAACCGTCTCAGTTCGGATTGTGCTCTGCAACTCGAGCACATGAAGTCGGAATCGCTAGTAATCGCAGATCAGCATGCTGCGGTGAATACGTTCCCGGGCCTTGTACACACCGCCCGTCACACCATGGGAGTTGGCTTTACCTGAAGGCGGTGCGCTAACCAGCAATGGAGGCAGCCGACCACGGTAGGGTCAGCGACTGGGGTGAAGA >SNAD_NOB_1_7 [organism=uncultured Nitrobacter; Proteobacteria; Alphaproteobacteria; Environmental Samples] [mol_type=genomic DNA] [isolation_source=SNAD sludge treating anaerobic digester effluent] [clone= SNAD_NOB_1_7] [environmental_sample=TRUE] Uncultured Nitrobacter clone SNAD_NOB_1_7 16S ribosomal RNA gene, partial sequence ACCCCTAGCAAATCTCAAAAAACCGTCTCAGTTCGGATTGGGCTCTGCAACTCGAGCCCATGAAGTTGGAATCGCTAGTAATCGTGGATCAGCATGCCACGGTGAATACGTTCCCGGGCCTTGTACACACCGCCCGTCACACCATGGGAGTTGGTTTTACCTGAAGACGGTGCGCTAACCCGCAAGGGAGGCAGCCGGCCACGGTAGGGTCAGCGACTGGGGTGAAGA >SNAD_NOB_1_8 [organism=uncultured bacterium; Bradyrhizobium; Proteobacteria; Alphaproteobacteria; Environmental Samples] [mol_type=genomic DNA] [isolation_source=SNAD sludge treating anaerobic digester effluent] [clone= SNAD_NOB_1_8] [environmental_sample=TRUE] Uncultured bacterium clone SNAD_NOB_1_8 16S ribosomal RNA gene, partial sequence TACCCCTAGCAAATCTCAAAAAACCGTCTCAGTTCGGATTGTACTCTGCAACTCGAGTGCATGAAGGTGGAATCGCTAGTAATCGCAGATCAGCACGCTGCGGTGAATACGTTCCCGGGCCTTGTACACACCGCCCGTCACACCATGGGAGTTGGCTTTACCTGAAGACGGTGCGCTAACCGCAAGGAGGCAGCCGGCCACGGTAGGGTCAGCGACTGGGGTGAAG
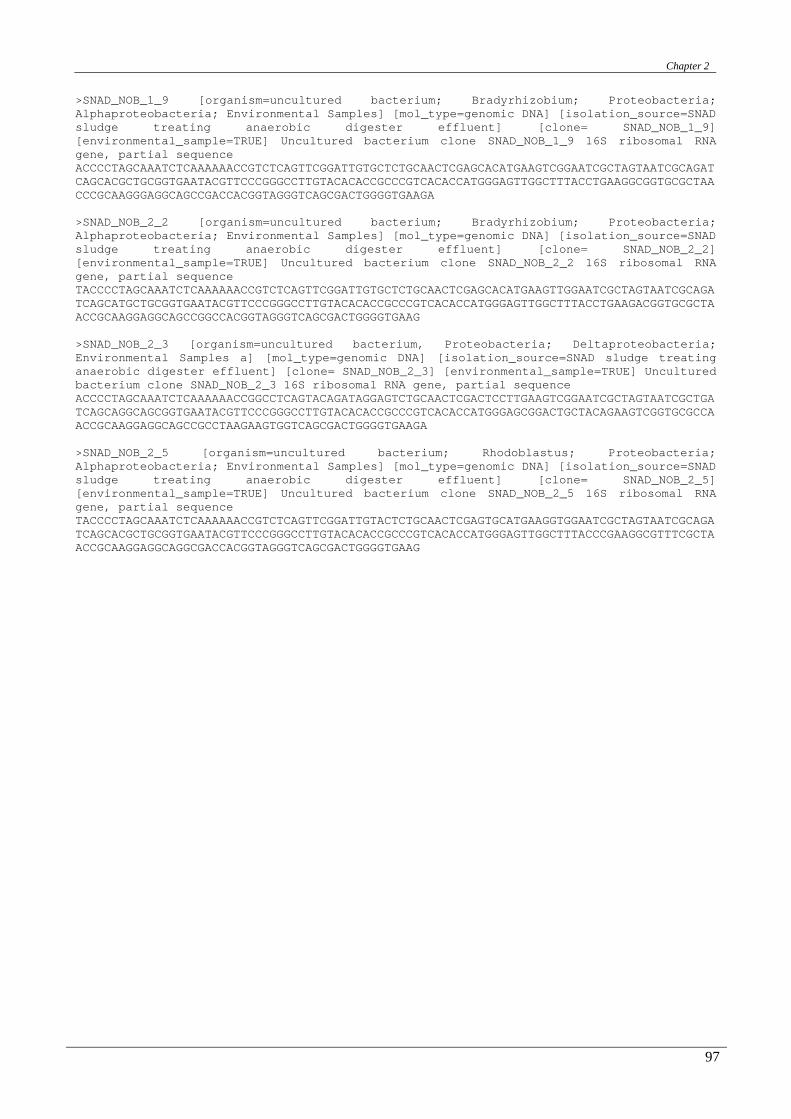
Chapter 2
97
>SNAD_NOB_1_9 [organism=uncultured bacterium; Bradyrhizobium; Proteobacteria; Alphaproteobacteria; Environmental Samples] [mol_type=genomic DNA] [isolation_source=SNAD sludge treating anaerobic digester effluent] [clone= SNAD_NOB_1_9] [environmental_sample=TRUE] Uncultured bacterium clone SNAD_NOB_1_9 16S ribosomal RNA gene, partial sequence ACCCCTAGCAAATCTCAAAAAACCGTCTCAGTTCGGATTGTGCTCTGCAACTCGAGCACATGAAGTCGGAATCGCTAGTAATCGCAGATCAGCACGCTGCGGTGAATACGTTCCCGGGCCTTGTACACACCGCCCGTCACACCATGGGAGTTGGCTTTACCTGAAGGCGGTGCGCTAACCCGCAAGGGAGGCAGCCGACCACGGTAGGGTCAGCGACTGGGGTGAAGA >SNAD_NOB_2_2 [organism=uncultured bacterium; Bradyrhizobium; Proteobacteria; Alphaproteobacteria; Environmental Samples] [mol_type=genomic DNA] [isolation_source=SNAD sludge treating anaerobic digester effluent] [clone= SNAD_NOB_2_2] [environmental_sample=TRUE] Uncultured bacterium clone SNAD_NOB_2_2 16S ribosomal RNA gene, partial sequence TACCCCTAGCAAATCTCAAAAAACCGTCTCAGTTCGGATTGTGCTCTGCAACTCGAGCACATGAAGTTGGAATCGCTAGTAATCGCAGATCAGCATGCTGCGGTGAATACGTTCCCGGGCCTTGTACACACCGCCCGTCACACCATGGGAGTTGGCTTTACCTGAAGACGGTGCGCTAACCGCAAGGAGGCAGCCGGCCACGGTAGGGTCAGCGACTGGGGTGAAG >SNAD_NOB_2_3 [organism=uncultured bacterium, Proteobacteria; Deltaproteobacteria; Environmental Samples a] [mol_type=genomic DNA] [isolation_source=SNAD sludge treating anaerobic digester effluent] [clone= SNAD_NOB_2_3] [environmental_sample=TRUE] Uncultured bacterium clone SNAD_NOB_2_3 16S ribosomal RNA gene, partial sequence ACCCCTAGCAAATCTCAAAAAACCGGCCTCAGTACAGATAGGAGTCTGCAACTCGACTCCTTGAAGTCGGAATCGCTAGTAATCGCTGATCAGCAGGCAGCGGTGAATACGTTCCCGGGCCTTGTACACACCGCCCGTCACACCATGGGAGCGGACTGCTACAGAAGTCGGTGCGCCAACCGCAAGGAGGCAGCCGCCTAAGAAGTGGTCAGCGACTGGGGTGAAGA >SNAD_NOB_2_5 [organism=uncultured bacterium; Rhodoblastus; Proteobacteria; Alphaproteobacteria; Environmental Samples] [mol_type=genomic DNA] [isolation_source=SNAD sludge treating anaerobic digester effluent] [clone= SNAD_NOB_2_5] [environmental_sample=TRUE] Uncultured bacterium clone SNAD_NOB_2_5 16S ribosomal RNA gene, partial sequence TACCCCTAGCAAATCTCAAAAAACCGTCTCAGTTCGGATTGTACTCTGCAACTCGAGTGCATGAAGGTGGAATCGCTAGTAATCGCAGATCAGCACGCTGCGGTGAATACGTTCCCGGGCCTTGTACACACCGCCCGTCACACCATGGGAGTTGGCTTTACCCGAAGGCGTTTCGCTAACCGCAAGGAGGCAGGCGACCACGGTAGGGTCAGCGACTGGGGTGAAG

98

Chapter 3
99
III. Chapter
Old landfill leachate characterization
using respirometric and physical-chemical
methods
This chapter was based on:
Langone M., Andreottola G. (2013). Old landfill leachate characterization using respirometric and physical-
chemical methods. Submitted

Chapter 3
100
Old landfill leachate characterization using respirometric and physical-chemical methods
Michela Langonea, Gianni Andreottolaa
a Department of Civil, Environmental and Mechanical Engineering, University of Trento, Via Mesiano 77, Trento 38123, Italy
ABSTRACT
Old landfill leachates have a complex chemical composition, characterized by the presence of inorganic compounds which make difficult a proper characterization. In this study, a thorough characterization of an old leachate from a municipal landfill located in Trento, Italy, has been performed. The interferences due to the complex leachate composition were taken into account during sampling, experimental analysis and data processing procedures. The COD fractions were divided based on solubility and biodegradability in order to perform a proper leachate COD fractionation, useful for biological process simulation models. Further, looking at the leachate composition, the applicability of a suitable treatment was discussed.
Independent physical - chemical methods (filtration at 0.45 µm, coagulation using ZnSO4 at pH 10.5 and sequential filtration) were conducted and compared to evaluate the truly total ammonia nitrogen (TAN) and the soluble organic carbon (COD) concentrations. Both respirometric techniques (multi-OUR and single OUR) and total biological oxygen demand method (TbOD) have been applied in order to assess the biodegradable organic fractions of the leachate.
Sequential filtration was the most appropriate method for the determination of both the TAN and the soluble COD content in leachates. The total COD was fractionated in two component: truly soluble (83.9%) and particulate (16.1%). The biodegradability depended on the biomass type utilized for the characterization. However, the slowly biodegradable COD was predominant in the old leachate, while the readily biodegradable COD was only a small fraction of the total organic content. The presence of both slowly biodegradable COD fractions and inhibiting compounds suggests the use of technologies such as Sequential Batch Reactors (SBRs) and granular biomass systems, while the low biodegradable COD/TAN ratio (0.2) makes the leachate suitable for the application of the Simultaneous partial Nitritation, Anammox and Denitrification (SNAD) process, an innovative cost-effectiveness nitrogen biological process. Keywords: biodegradable COD fractions, C/N, filtration, old landfill leachate, respirometry, soluble COD
1. Introduction
Wastewaters characterization is essential for design, modeling and control purposes of wastewater treatment
plants (WWTP). The interest for a thorough characterization is increased after the development of the simulation
models for the biological processes that do not use traditional parameters, i.e. COD and BOD5, such as the
Activated Sludge Models of IAWPRC Task Group (Henze et al. 2000), which require a proper organic matter
fractionation. In the case of old landfill leachates, the complex chemical composition, the low biodegradability,
the presence of biorefractory and inhibiting compounds make necessary to further improve the characterization
procedures. Further, recent innovative and performing biological processes, among them the Simulatneous
partial Nitritation, Anammox and Denitrification (SNAD) process in one single reactor, under oxygen limitation,
has been applied for treating wastewaters characterized by low biodegradability and low CODbio/N ratios, such
as old landfill leachates (Wang et al. 2010). The SNAD system design and modeling require specific information
about the wastewater composition, explecially in terms of nitrogen and organic matter content (Kumar and Lin
2010). The SNAD process comprises three simultaneous, interacting and sequential processes operated by
different bacteria, with opposite operative condition, co-existing in the same environment (Lan et al. 2011;
Langone et al. 2013b). The determination of the truly biodegradable COD content and the biodegradable
CODbio/N ratio is one of the most critical aspects in order to evaluate the applicability of the SNAD process and
to further model the biological processes. In particular the CODbio/N ratio directly affects microorganism

Chapter 3
101
populations, including autotrophic ammonium and nitrite oxidizer bacteria (AOB and NOB), heterotrophic
denitrifying and anammox bacteria (Kumar and Lin 2010). In a SNAD system, high concentrations of
biodegradable organic carbon in the influent wastewater may either cause a heterotrophic denitrifying bacteria
competition with anammox bacteria for nitrite (Molinuevo et al. 2009) or the activation of different anammox
metabolic pathways, which could inhibit the anammox bacteria activity, i.e., using organic matter rather than
ammonium and nitrite as a substrate (Güven et al. 2005; Kartal et al. 2007b). The biodegradable organic carbon
content (CODbio) of the system and the influent biodegradable CODbio/N ratio should be low in order to establish
a coupling between anammox and denitrifying bacteria (Ruscalleda et al. 2008).
The organic carbon and nitrogen content are usually determined using the traditional approach, which
consists in evaluating the COD, BOD5 and TAN after filtration at 0.45 µm, in order to distinguish the soluble
and particulate fractions. However, the soluble and particulate fractions evaluated using filtration at 0.45 µm not
always correspond to the truly soluble and particulate parts. Further, the soluble and particulate content do not
necessarily correspond to the readily and slowly biodegradable organic fractions (Henze et al. 2000). This makes
wastewater characterization by the filtration at 0.45 µm less suitable for design, model and control of biological
processes, expecially for SNAD process.
Further, attention must be paid to the characterization of some industrial wastewaters, among them old landfill
leachates, where the presence of chemical compounds may compromize the results of procedures usually adopted
for the wastewater characterization. An old leachate is generated from landfills, which are operating since more
than 10 years (Neczaj et al. 2005; Kurniawan et al. 2006b; Yan and Hu 2009). It generally contains a complex
mix of inorganic and organic pollutants in dissolved, colloidal or dispersed form: high ammonium nitrogen, low
biodegradable organic (CODbio), refractory compounds, heavy metals, alkalinity, hardness, salinity, chlorinated
organic xenobiotic compounds such as benzene and toluene and numerous other substances that can be
considered as pollutants (Kurniawan et al. 2006b). The composition and the ratio of various fractions organics,
nutrients, and inert materials in old landfill leachates is not similar to sewage and has been previously
investigated by several studies (Cecen and Gursoy 2000; Kjeldsen et al. 2002; Ozkaya et al. 2006; Ziyang and
Youcai 2007; Bilgili et al. 2008; Viet Yen 2009; Vedrenne et al. 2012). However, no studies are reported in
literature that specifically evaluate a complete COD fractionation characterization of old landfill leachates,
considering the influences of some inorganic electron donors, such Fe2+, Mn (II) and S2, on the carbon and
nitrogen analytical methods.
Abbreviations
BOD Biological Oxygen Demand AOB Ammonia-Oxidizing Bacteria COD Chemical Oxygen Demand NOB Nitrite-Oxidizing Bacteria CODtot Total Chemical Oxygen Demand SNAD Simultaneous partial Nitritation, Anammox, Denitrification CODfiltr Filtrate Chemical Oxygen Demand N Nitrogen CODsoluble Soluble Chemical Oxygen Demand TAN Total Ammonia Nitrogen CODbio Biodegradable Chemical Oxygen Demand TNN Total Nitrite Nitrogen RBCOD Readily biodegradable substrate NO3
--N Total Nitrate Nitrogen SBCOD Slowly biodegradable substrate TKN Total Kjeldahl Nitrogen S Total soluble substrate OUR Oxygen Uptake Rate X Total particulate substrate VSS Volatile Suspend Solid SB Soluble biodegradable substrate TSS Total Suspend Solid XB Particulate biodegradable substrate TbOD Total biological Oxygen Demand SU Soluble unbiodegradable substrate WWTP Wastewater Treatment Plant XU Particulate unbiodegradable substrate
The main aim of this study was to characterize an old landfill leachate from a municipal landfill located in
Trento, Italy, in order to provide an influent composition that could be used in biological simulation models.

Chapter 3
102
Further, looking at the leachate composition the applicability of a suitable treatment was discussed mainly to
verify the applicability of the SNAD process. Three independent physical – chemical methods (filtration at 0.45
µm, sequential filtration at 0.45 and 0.2 µm and coagulation using ZnSO4 at pH 10.5) were performed in order to
find out the proper analytical method for the determination of the total soluble (S) and particulate (X) COD and
N fractions of leachates. Chemical–biological methods, respirometric methods and total biological oxygen
demand methods, were used to fractionate the readily biodegradable (SB, RBCOD) and the slowly biodegradable
COD (XB, SBCOD). The interference on the biological oxygen consumption, due to chemical compounds present
in leachates, were taken into account.
2. Materials and Methods
2.1. Landfill leachate collection
In this study, the old landfill leachate was collected from a municipal landfill located in Trento, Italy. The
samples were collected for approximately one year in polyethylene bottles washed with deionized water before
use. Dissolved oxygen (DO) and oxidation-reduction potential (OUR) of the raw leachate were measured. A
careful sampling was performed in order to minimize the exposition of the samples to oxygen, preventing the Fe
(II) oxidation to Fe (III) and its following precipitation during sampling. The leachate samples were transported
to the laboratory and stored at 4°C prior to the characterization, in order to prevent the COD and nitrogen
degradation.
2.2. Analytical methods
Raw leachate samples were analyzed for total suspended solids (TSS) and volatile suspended solids (VSS)
according to the Standard Methods (APHA-AWWA-WPCF 2005). Ferrous ions (FeII) were determined using a
UV/Vis spectrophotometer, while Ferric ions (FeIII) through colorimetric analysis. Manganese was measured
using the inductively coupled plasma mass spectrometry (ICP-MS) (EN ISO 17294-2:2004). Dissolved sulphide
(S2−) and hydrogen sulfide (H2S) were measured according to APAT CNR IRSA, 2003.
In order to eliminate the chemical interference of inorganic constituents (i.e. ferrous ions Fe(II), manganese
ions Mn(II) and dissolved sulphide (S2−)) on the COD measurement, leachate samples were partially exposed to
oxygen prior to further characterizations. In this way the inorganic constituents may be oxidized, i.e. Fe (II) to
Fe (III), and precipitate. The resulting samples were then analyzed for the total chemical oxygen demand
(CODtot) according to the Standard Methods (APHA-AWWA-WPCF 2005), correcting chloride interferences.
Later, leachate samples were analyzed using the traditional approach, filtration at 0.45µm. The filtrate was
analyzed colorimetrically for total ammonium as nitrogen (TAN) and total nitrite as nitrogen (TNN), according
to APAT CNR IRSA, 2003. The nitrate as nitrogen (NO3--N), total Kjeldahl Nitrogen (TKN) and chemical
oxygen demand (CODfilt ) were measured according to the Standard Methods (APHA-AWWA-WPCF 2005). The
concentrations of the metallic ions were measured using a spectrometry ICP-MS (EN ISO 17294-2:2004). The
filtrate samples were checked again for dissolved sulphide (S2−), hydrogen sulfide (H2S), Ferrous, Ferric (Fe2+)
and Manganese Mn (II) ions, as previously described. Alkalinity determinations were conducted using the kit
USEPA Buret Titration Method 8221 (Hach Company). The means and standard deviations have been
determined for each parameter.

Chapter 3
103
2.3. Determination of CODsoluble and TAN
The leachate samples, previously partially exposed to oxygen, were analyzed for the truly soluble COD
(CODsol) and the total ammonia concentration (TAN) of the leachate. Different physical-chemical procedures
were used and compared for the separation of soluble (S) and particulate (X) compounds: filtration (0.45 µm
nominal pore size); sequential filtration (0.45 µm and 0.2 µm nominal pore size) (Roeleveld and Van Loosdrecht
2002); ZnSO4 coagulation at pH 10.5±0.3 (Mamais et al. 1993; Hu et al. 2002). The supernatant of each method
was analyzed for COD and TAN as described in the analytical methods section. The tests were carried out on
three samples of leachate, to representativeness of the leachate of the municipal landfill used in this study.
2.4. Determination of biodegradable COD fractions
The COD was divided into two fractions: biodegradable and undiodegradable COD. Further, based both on
biodegradability and on solubility four fractions were measured: the readily biodegradable COD (RBCOD, SB),
the slowly biodegradable (XB) COD, the soluble unbiodegradable COD (SU), the particulate unbiodegradable
(XU) COD.
The respirometric methods, based on the oxygen uptake rate (OUR) of heterotrophic biomass in batch vessels
were used to evaluate the biodegradable COD fractions (readily biodegradable, RBCOD and total biodegradable,
CODbio) of the leachate samples. The calculation of the other COD fractions was made according to the
following equations:
BS RBCOD= (Eq. III-1)
lubU so le BS COD S= − (Eq. III-2)
B bio BX SBCOD COD S= = − (Eq. III-3)
( )lubU tot so le BX COD COD X= − −
(Eq. III-4)
As the biodegradability is biomass-specific, the respirometric experiments were performed using both an
activated sludge from the municipal WWTP of Trento, Italy, and a SNAD biomass from a SBR of the WWTP of
Zürich, Switzerland (Joss et al. 2009), where aerobic ammonium oxidizing-, anammox and denitrifying bacteria
co-existed (Langone et al. 2013b). The respirometric tests were carried out using the same three leachate samples
used for CODsoluble and TAN determination. In addition, the total biological oxygen demand (TbOD) method had
been applied on respirometric assay in order to verify the total biodegradable organic matter fraction (CODbio) of
leachate measured by using the respirometric technique.
2.4.1. Respirometers
Respirometric experiments using leachate were conducted separately to obtain the DO profile with both the
activated sludge of the urban WWTP and the SNAD biomass. The respirometers consisted of 1.2 L reactors with
mechanical stirring and an air diffuser for experiments performed on the activated sludge, and of 0.2 L reactors
for experiments with the SNAD biomass. DO and temperature were measured in the liquid through the DO
probe. The pH was also monitored. The DO probe was connected through a RS-232 port to a computer, which
was used for storing and monitoring all data. Temperature was kept constant at 20°C and the pH between 7.5 and
8. The total solids concentration was in the range between 3-5 g TSSL-1. For all the experiments, thiourea
(20 mg L-1) was added to inhibit the nitrification process. The DO depletion in the vessel, due to the substrate
(organic carbon) utilization, was monitored over the time. The OUR values, expressed as mgO2 L-1h-1, were
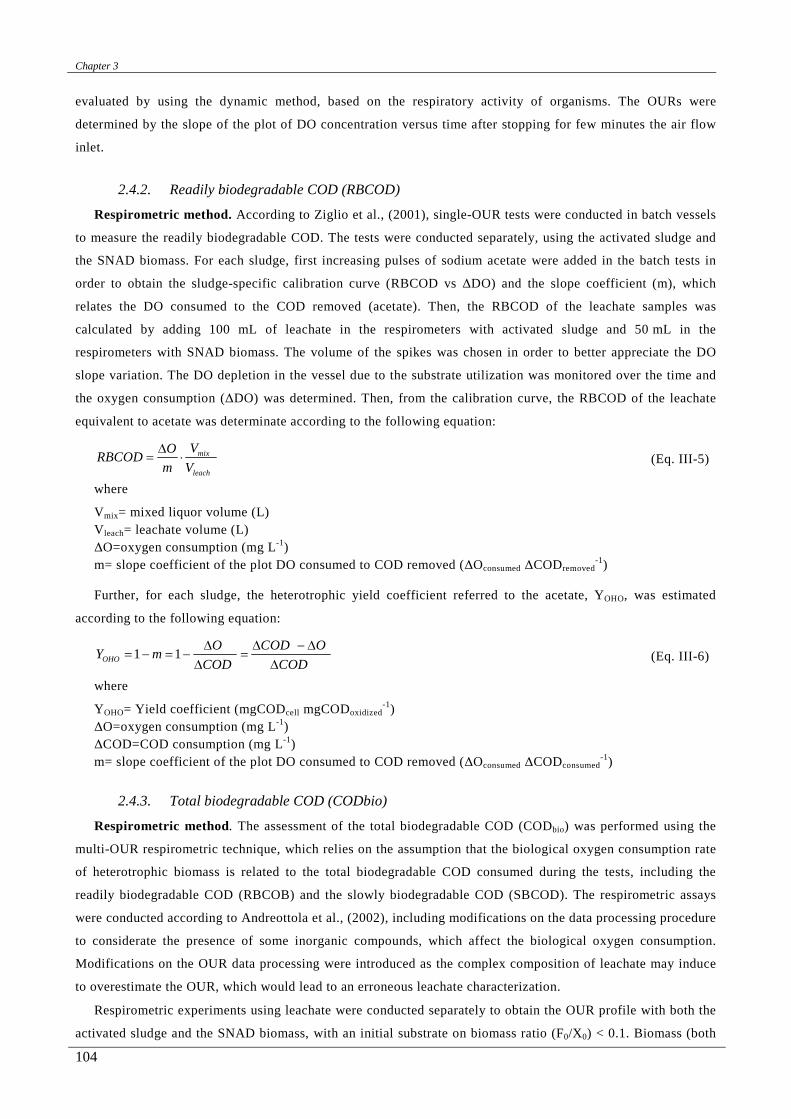
Chapter 3
104
evaluated by using the dynamic method, based on the respiratory activity of organisms. The OURs were
determined by the slope of the plot of DO concentration versus time after stopping for few minutes the air flow
inlet.
2.4.2. Readily biodegradable COD (RBCOD)
Respirometric method. According to Ziglio et al., (2001), single-OUR tests were conducted in batch vessels
to measure the readily biodegradable COD. The tests were conducted separately, using the activated sludge and
the SNAD biomass. For each sludge, first increasing pulses of sodium acetate were added in the batch tests in
order to obtain the sludge-specific calibration curve (RBCOD vs ∆DO) and the slope coefficient (m), which
relates the DO consumed to the COD removed (acetate). Then, the RBCOD of the leachate samples was
calculated by adding 100 mL of leachate in the respirometers with activated sludge and 50 mL in the
respirometers with SNAD biomass. The volume of the spikes was chosen in order to better appreciate the DO
slope variation. The DO depletion in the vessel due to the substrate utilization was monitored over the time and
the oxygen consumption (∆DO) was determined. Then, from the calibration curve, the RBCOD of the leachate
equivalent to acetate was determinate according to the following equation:
mix
leach
VORBCOD
m V
∆= ⋅ (Eq. III-5)
where
Vmix= mixed liquor volume (L) V leach= leachate volume (L) ∆O=oxygen consumption (mg L-1) m= slope coefficient of the plot DO consumed to COD removed (∆Oconsumed ∆CODremoved
-1)
Further, for each sludge, the heterotrophic yield coefficient referred to the acetate, YOHO, was estimated
according to the following equation:
1 1OHO
O COD OY m
COD COD
∆ ∆ − ∆= − = − =∆ ∆
(Eq. III-6)
where
YOHO= Yield coefficient (mgCODcell mgCODoxidized-1)
∆O=oxygen consumption (mg L-1) ∆COD=COD consumption (mg L-1) m= slope coefficient of the plot DO consumed to COD removed (∆Oconsumed ∆CODconsumed
-1)
2.4.3. Total biodegradable COD (CODbio)
Respirometric method. The assessment of the total biodegradable COD (CODbio) was performed using the
multi-OUR respirometric technique, which relies on the assumption that the biological oxygen consumption rate
of heterotrophic biomass is related to the total biodegradable COD consumed during the tests, including the
readily biodegradable COD (RBCOB) and the slowly biodegradable COD (SBCOD). The respirometric assays
were conducted according to Andreottola et al., (2002), including modifications on the data processing procedure
to considerate the presence of some inorganic compounds, which affect the biological oxygen consumption.
Modifications on the OUR data processing were introduced as the complex composition of leachate may induce
to overestimate the OUR, which would lead to an erroneous leachate characterization.
Respirometric experiments using leachate were conducted separately to obtain the OUR profile with both the
activated sludge and the SNAD biomass, with an initial substrate on biomass ratio (F0/X0) < 0.1. Biomass (both

Chapter 3
105
activated sludge and SNAD biomass) was left in starvation for several hours and then the endogenous OURs
were evaluated from data obtained during endogenous respiration. Next, a pulse of leachate was added in the
tests, 400 mL in the experiments with the activated sludge and 100 mL in the experiments with the SNAD
biomass. OUR values from this point to the substrate depletion comprised endogenous and exogenous
respiration. Hence, the exogenous oxygen consumption (∆O) was evaluated subtracting the contribution of the
endogenous respiration from the whole oxygen consumption (the area under the OUR curve). The exogenous
oxygen consumption was then converted to equivalent COD using the following expression based on a COD
mass balance (Ekama et al. 1986):
1 1
1 1mix mix
biocv OHO leach OHO leach
V VCOD O O
f y V Y V
= ⋅∆ ⋅ = ⋅∆ ⋅ − ⋅ − (Eq. III-7)
where
Vmix= mixed liquor volume (L) V leach= leachate volume (L) fcv= CODcell/VSS ratio (1.42) yOHO = Yield coefficient (mgVSS mgCODoxidized
-1) YOHO= Yield coefficient (mgCODcell mgCODoxidized
-1) ∆O=oxygen consumption (mg L-1)
Total biological oxygen demand (TbOD) method. According to Bilgili et al., (2008), the total biological
oxygen demand (TbOD) method was applied on the respirometric tests to evaluate the total biodegradable COD
and verify the respirometric results. The method assumes that the TbOD is equal to the biodegradable COD,
including soluble and particulate degradable COD, as the biodegradability particulate organic materials are
completely hydrolyzed when the biological oxidation process is completed. The COD concentration was
measured on the raw leachates (CODtot) and on the filtrate leachates (CODfilt ), passing through a 0.45-µm filter.
Samples of the sludge-leachate mixture were taken at the beginning and at the end of the respirometric assay and
analyzed for total and filtrate COD. The particulate COD was always calculated as difference of total and filtrate
COD. The TbOD values was calculated as follows:
( )( )initial mixture total COD - initial biomass COD - final mixture soluble COD mixbio
leach
VTbOD COD
V= = ⋅ (Eq. III-8)
where:
initial biomass COD initial mixture particulate COD - raw leachate particulate CODleach
mix
V
V
= ⋅
2.4.4. Chemical OUR
In order to consider the interference of the leachate composition on the biological oxygen consumption,
chemical OUR tests were performed. The experiments were conducted using raw leachate samples, partially
oxidized and used also in the respirometric assays, and tap water rather than sludge in a reactor of 1.2 L. The tap
water was oxygenated, achieving oxygen saturation levels. Next, a pulse (400 mL) of leachate was added. The
DO profile was monitored and the OURs were calculated.

Chapter 3
106
3. Results and Discussion
3.1 Conventional leachate characterization
In literature studies, the leachate samples are usually characterized by a set of traditional parameters, also
measured in this study and reported in Table III-1, together with relevant concentrations data from the literature
on old landfill leachates. Raw samples were analyzed using the traditional approach (filtration at 0.45 µm). The
average COD and BOD5 concentrations were 1307±193 mgCODfilt L-1and 70±17 mgO2 L -1, respectively.
Therefore, the leachate was characterized by a low BOD5/CODfilt (0.05) ratio, indicating a poor biodegradability.
Low BOD5/CODfilt ratios are characteristic of old landfill leachates, where mainly refractory compounds are
responsible for the high COD value. Old leachates are generally characterized by low concentrations of volatile
fatty acids and relatively higher amounts of humic and fulvic-like compounds. The high pH (pH 8.1±0.1) was
also indicative of the old landfill age (Kulikowska and Klimiuk 2008).
The COD values measured may be influenced by the presence of some inorganic constituents that could be
chemically oxidized. For instance, Kylefors et al., (1999) verified that Ferrous Fe (II) and Manganese Mn (II)
ions and dissolved sulphides (S2−) contributed up to one-third of the COD measured in the leachate used in their
experiments. Nevertheless, in our study, both prior and after the pre-oxidation step only trace level of Fe (II), Mn
(II) and H2S were detected, not influencing the organic matter analysis.
Table III-1 also indicates that ammonium was the prevalent nitrogen inorganic species. The leachate was
characterized by a high total ammonium nitrogen (TAN) concentration (1241±136 mg TAN L-1), resulting in a
very low CODfilt /N ratio (around 1.1). The low CODfilt /N measured indicates that conventional biological
processes are not appropriate to treat the landfill leachate, used in our study, while SNAD process could
represents a suitable process. Heavy metals were present at typical range concentrations for municipal landfill
leachates operating in methanogenic phase, as they were precipitated as sulphides and remained inside the
landfill (Morling 2010). Low contents of Fe (3.76±0.44 mgL-1), B (5.6±0.79 mgL-1), Al (0.42±0.09 mgL-1),
Ba (0.39±0.04 mgL-1) and Zn (0.18±0.14 mgL-1) were detected, while As and Cd were detected at trace levels
below 0.08 mg/L and 0.005 mgL-1, respectively. Low amounts of mercury were present (<3.0 mgL-1). Lead did
not appear. Cr (0.21±0.04mg L-1) and Ni (0.10±0.015 mg L-1), which are toxic and carcinogenic, were detected at
trace levels.

Chapter 3
107
Table III-1. Conventional old landfill leachates characterization. Parameter This study old landfill leachate **
CONDUCTIVITY [mS/cm] 10.7±1 -
REDOX [mV] 30±10 -
pH 8.1±0.1 7.5 - 9
TSS [mg L-1] 123 ± 129 -
CODfilt [mg L-1] (filtration at 0.45 µm) [mg L-1] 1307 ±193* 5.000-20.000
BOD5 [mg L-1] 70±17 20-1.000
TOTAL AMMONIUM NITROGEN (TAN filt ) [mg L-1] 1241±136* 400-5000
TOTAL NITRITE NITROGEN (TNN) [mg L-1] <0.04* -
NITRATE (NO3-N) [mg L-1] 10±2* -
TOTAL KJELDAHL NITROGEN (TKN) [mg L-1] 1288±169 -
ORGANIC NITROGEN (Norg) [mg L-1] 57±39 -
TOTAL PHOSPHORUS (P) [mg L-1] 14±2 6
SULFATE [mg L-1] 1200* 10-420
ALKALINITY (CaCO 3) [mg L-1] 7.000 – 15.000* -
HYDROGEN SULFIDE (H2S -) [mg L-1] 0.04* -
Fe(II) [mg L-1] 2,1* -
Fe(III) [mg L-1] 1,8*
Mn(II) [mg L-1] 0,9* -
ALUMINIUM [mg L -1] 0.42 0.1* -
ARSENIC (As) [mg L-1] <0.08* 0.01-1
BARIUM (Ba) [mg L-1] 0.39±0.036* -
BORON (Bo) [mg L-1] 5.6±0,79* -
CADMIUM (Cd) [mg L-1] <0.005* 0.005
CHROMIUM (Cr) [mg L-1] 0.21±0.04* 0.28
IRON (Fe) [mg L-1] 3.8±0.44* 3 - 280
LEAD (Pb) [mg L-1] <0.04* 0.09
MANGANESE (Mn) [mg L-1] 0.1±0.007* 0.03-45
MERCURY (Hg) [mg L-1] <3.0* 0.00005-0.16
NICKEL (Ni) [mg L-1] 0.1±0.015* 0.17
ZINC (Zn) [mg L-1] 0.18±0.15* 0.03-4
COPPER (Cu) [mg L-1] 0.01±0.002* 0.065
SELENIUM (Se) [mg L-1] <0.003* -
STANNUM (Sn) [mg L-1] 0.06±0.006* -
* values after filtration 0.45 µm, ** (Kjeldsen et al. 2002; Kurniawan et al. 2006b)
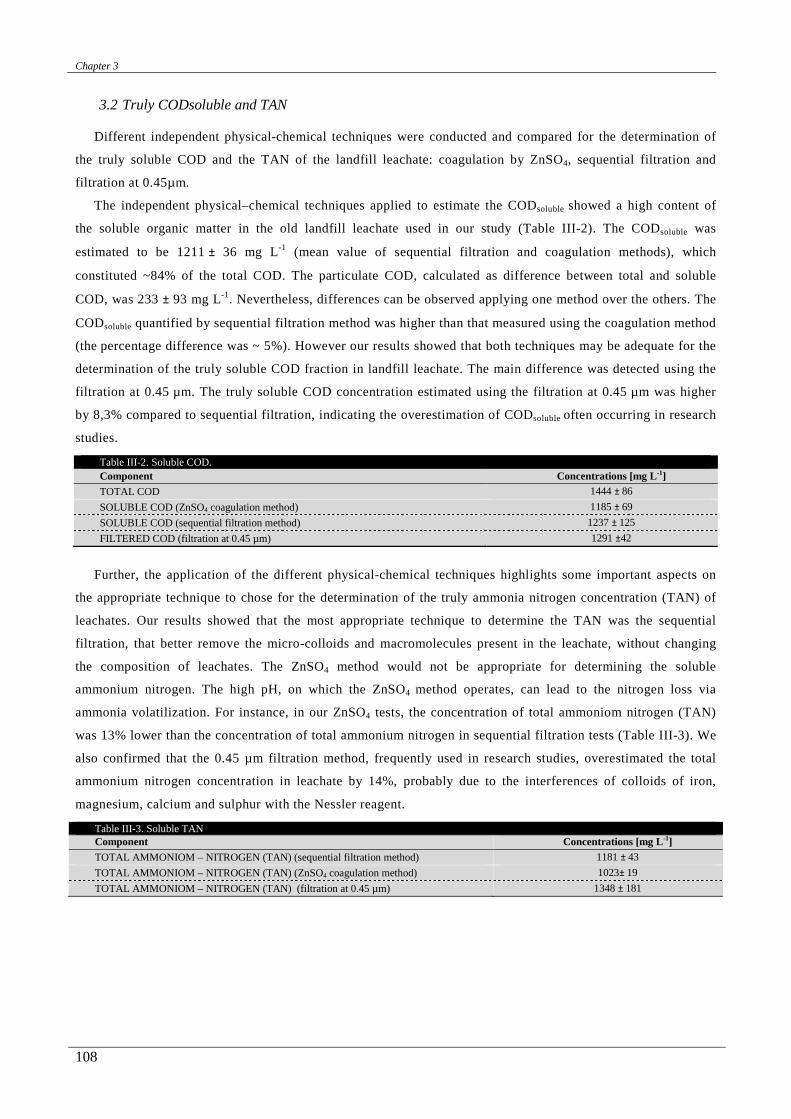
Chapter 3
108
3.2 Truly CODsoluble and TAN
Different independent physical-chemical techniques were conducted and compared for the determination of
the truly soluble COD and the TAN of the landfill leachate: coagulation by ZnSO4, sequential filtration and
filtration at 0.45µm.
The independent physical–chemical techniques applied to estimate the CODsoluble showed a high content of
the soluble organic matter in the old landfill leachate used in our study (Table III-2). The CODsoluble was
estimated to be 1211 ± 36 mg L-1 (mean value of sequential filtration and coagulation methods), which
constituted ~84% of the total COD. The particulate COD, calculated as difference between total and soluble
COD, was 233 ± 93 mg L-1. Nevertheless, differences can be observed applying one method over the others. The
CODsoluble quantified by sequential filtration method was higher than that measured using the coagulation method
(the percentage difference was ~ 5%). However our results showed that both techniques may be adequate for the
determination of the truly soluble COD fraction in landfill leachate. The main difference was detected using the
filtration at 0.45 µm. The truly soluble COD concentration estimated using the filtration at 0.45 µm was higher
by 8,3% compared to sequential filtration, indicating the overestimation of CODsoluble often occurring in research
studies.
Table III-2. Soluble COD. Component Concentrations [mg L-1]
TOTAL COD 1444 ± 86
SOLUBLE COD (ZnSO4 coagulation method) 1185 ± 69
SOLUBLE COD (sequential filtration method) 1237 ± 125
FILTERED COD (filtration at 0.45 µm) 1291 ±42
Further, the application of the different physical-chemical techniques highlights some important aspects on
the appropriate technique to chose for the determination of the truly ammonia nitrogen concentration (TAN) of
leachates. Our results showed that the most appropriate technique to determine the TAN was the sequential
filtration, that better remove the micro-colloids and macromolecules present in the leachate, without changing
the composition of leachates. The ZnSO4 method would not be appropriate for determining the soluble
ammonium nitrogen. The high pH, on which the ZnSO4 method operates, can lead to the nitrogen loss via
ammonia volatilization. For instance, in our ZnSO4 tests, the concentration of total ammoniom nitrogen (TAN)
was 13% lower than the concentration of total ammonium nitrogen in sequential filtration tests (Table III-3). We
also confirmed that the 0.45 µm filtration method, frequently used in research studies, overestimated the total
ammonium nitrogen concentration in leachate by 14%, probably due to the interferences of colloids of iron,
magnesium, calcium and sulphur with the Nessler reagent.
Table III-3. Soluble TAN Component Concentrations [mg L-1]
TOTAL AMMONIOM – NITROGEN (TAN) (sequential filtration method) 1181 ± 43
TOTAL AMMONIOM – NITROGEN (TAN) (ZnSO4 coagulation method) 1023± 19
TOTAL AMMONIOM – NITROGEN (TAN) (filtration at 0.45 µm) 1348 ± 181

Chapter 3
109
3.3 Biodegradable COD fractions using the activated sludge of the WWTP
In order to investigate the influence of the leachate composition on the observed oxygen respiration of the
heterotrophic biomass, and consequently on the COD measurement, chemical respirometric tests were
performed, using tap water and raw leachate in aerobic conditions. When the leachate was added to the water an
initial DO depletion was observed, but after 3-5 minutes, the DO values were spontaneously reported to the
initial DO value and no DO depletions were observed during the test (not showed).
Considering the low inorganic compounds concentrations, and considering that the possiblie interferences of
inorganic electron donors such as Fe2+, Mn (II) and S2, were partially avoided using raw leachate samples
previously exposed to oxygen, in order to make aerobic condition and allow the oxidation of chemical
compounds before the respirometric tests, we concluded that no chemical oxidation was obtained during
respirometric tests using the old landfill leaachate. However, the low biodegradable COD content in the raw
leachate requires a high volume of leachate (400 mL) to be added to the respirometric assays (800 mL). As
consequence the dilution effects on respirometric tests may induce to an erroneous calculation of the OUR values
in the first minutes of the respirometric tests, overestimating the DO depletion.
In order to characterize the old landfill leachate, respirometric analysis were carried out using the activated
sludge. At the beginning of the respirometric tests for the determination of both CODbio and RBCOD, a slope
variation in the DO curves was detected.
Fig. III.1 shows the single-OUR test, performed to measure the RBCOD using the activated sludge from the
municipal the WWTP of Trento. In Fig. III.1 is clearly illustrated the slope variation obtained measuring the
RBCOD. In this case, the slope variation was probably due to the dilution effect rather than the inorganic
compounds oxidations. Further, we also attributed the slope variation to the dilution effect rather than the
presence of rapidly hydrolysable organic fraction as previously reported by Ziglio et al. (2001). Thus, the
respirometric method described by Ziglio et al. (2001) for RBCOD calculation was adapted and the OUR values
at the beginning of the test were calculated not considering the first DO depletion slope. The single-OUR test
confirmed that only a little part of COD was readily biodegradable (21mgL-1), which corresponded to ~1.5 % of
the total COD and to ~ 1.7 % of the CODsoluble.
The conversion yield of heterotrophs (YOHO) measured in the activated sludge from the single-OUR tests was
0.73 gCODcellgCODoxidized at 20 °C, higher than the default value reported in literature for urban wastewater
(0.67 gCODcell gCODoxidized) (Henze et al. 2000). The default value is valuable for domestic wastewater, where a
large variety of carbon source (carbohydrates, proteins, alcohols, carboxylic acids) are present, while the YOHO
calculated in this study can be considered substrate-specific, as it was obtained with a single carbon source
(acetate). Its value is comparable to other study where acetate was used (Jiang et al. 2005).
Fig. III.2 illustrates the OUR profile of the multi–OUR respirometric experiment performed using the
activated sludge with the unfiltered leachate in order to determine the total biodegradable COD (CODbio). The
respirogram in Fig. III.2 is already corrected, modifying the method described by Andreottola et al. (2002) and
not considering the first DO depletion slope. The respirogram is characteristic of wastewaters with readily
biodegradable and slowly biodegradable COD. As can be seen in Fig. III.2, before the addition of the old landfill
leachate the endogenous respiration was achieved. After the leachate addition, the OUR values rapidly increased
to a peak depending on the amount of biodegradable organic matter initially present in the sample. During the
first minutes after leachate addition, the OUR decreased rapidly due to readily biodegradable COD depletion as

Chapter 3
110
well as the slowly biodegradable organic matter. The area delineated by the OUR curve above the endogenous
respiration level represents the amount of oxygen consumed at the expense of the total biodegradable COD.
The total biological oxygen demand (TbOD) method, used to verified the total biodegradable COD (CODbio),
confirmed the CODbio value measured by using the adapted respirometric method, confirming the assumption of
the influence of the dilution effect on the OUR measurements.
yend = -0,0043x + 7,1294R² = 0,9998
yend = -0,0043x + 7,7904R² = 0,9685
2
3
4
5
6
7
8
9
0 100 200 300 400 500 600 700
m
Time [s]
Slope variation due to dilution
Leachate addition
?DO yexog=0,005+7,6106R2=0,9978
0
5
10
15
20
25
0 2 4 6 8 10 12 14 16 18 20OU
R [mg
O 2L-1
h-1]
Time [h]
OUR Endogenous
OUR experimental
Leachate addition S0/X0<0.1
y end= 5,387e-0,018x
Fig. III.1 Single – OUR test, using activated sludge. Curve of the oxygen consumption related to the addition of 100 mL of landfill leachate in 1.2 L of the activated sludge of WWTP.
Fig. III.2 Multi-OUR test, using activated sludge. Respirogram of the activated sludge of WWTP, obtained after the addition of 400 mL of landfill leachate in 1.2 L of the activated sludge of WWTP.
Table III-4 gives the respirometric results. The CODbio (254 mg L-1) was only ~17% of the total COD while
the largest part of COD was mainly non-biodegradable (1194 mg L-1), which correspond to the ~83% of the total
COD, calculated as the difference between total COD and CODbio. The readily biodegradable COD (21mgL-1),
corresponded to ~1.5 % of the total COD and to ~ 1.7 % of the CODsoluble. The largest part of organic matter was
mainly slowly biodegradable and (hydrolyzed) COD. Furthermore, is important to underlined that the RBCOD
measured was significantly lower than the BOD5 value, meaning that BOD5 values overestimated the readily
biodegradable content.
3.4 Biodegradable COD fractions using the SNAD biomass
When the biodegradable COD fractions of the landfill leachate were evaluated using SNAD bliomass, the
CODbio and the RBCOD were lower than the value measured by using the activated sludge of WWTP, 47 mg L-1
and 4 mg L-1, respectively. The obtained mean value of YOHO of the SNAD biomass was 0.71 gCODcell
gCODoxidized, comparable with the value measured for the activated sludge. The lower biodegradable COD
fractions detected using the SNAD biomass, were probably due to inhibition effects of chemical compounds
present in the leachate on SNAD biomass, which was not acclimated to leachetes, while the activated sludge
used in this study was used to treat sporadically landfill leachate as well as municipal wastewater.
Fig. III.3 illustrates the DO depletion during the single-OUR test, performed to measure the RBCOD with
SNAD biomass. In Fig. III.3 can be observed a double slope due to the dilution effect as already seen in tests
using the activated sludge (Fig. III.1). The OUR data were calculated and the data analysis were performed
taking into account the dilution effects.
Table III-4. Biodegradable COD fractions. Component Concentrations [mg L-1]
TOTAL 1444 BIODEGRADABLE COD– TbOD method 251 BIODEGRADABLE COD– Respirometric method 254 READILY BIODEGRADABLE COD– Respirometric method 21
DO [m
gO2
L-1] ∆DO

Chapter 3
111
Fig. III.4 shows an OUR profile determined performing the multi–OUR respirometric experiment with the
SNAD biomass and the unfiltered leachate. The OUR profile confirmed the presence of both readily
biodegradable and slowly biodegradable COD.
yend = -0,0007x + 6,5911R² = 0,5354
y end= -0,0007x + 8,1069R² = 0,8137
4,55
5,56
6,57
7,58
8,59
0 100 200 300 400 500 600 700 800 900
DO [m
gO2
L-1]
Time [s]
yexog=0,0042+7,381R2=0,7764
Leachate addition
ΔDO
Slope variation due to dilution
0123456789
10
0 1 2 3 4 5 6
OUR [
mgDO
L-1h-1
]
Time [h]
OUR endogenousOUR experimental
Leachate addition S0/X0<0.1
yend = 0,3864e-4E-05x
Fig. III.3 Single – OUR test, using SNAD biomass. Curve of the oxygen consumption related to the addition of 50 mL of landfill leachate in 0.2 L of the SNAD biomass.
Fig. III.4 Multi-OUR test, using SNAD biomass. Respirogram of the SNAD biomass, obtained after the addition of 100mL of landfill leachate in 0.2 L of the SNAD biomass.
3.5 Landfill leachate COD characterization
Combining the results of the chemical analysis, used to measure total, soluble and particulate COD, and the
results of the respirometric analysis, performed to evaluate the biodegradable fractions, a complete landfill
leachate COD characterization was obtained both using the activated sludge and the SNAD biomass. The
schemes of the COD characterization for the activated sludge of WWTP and for the SNAD biomass are reported
in the Fig. III.5 A and Fig. III.5 B, respectively.
The COD fractions were divided based on solubility (S and X) and biodegradability (B and U). The readily
biodegradable COD (SB), the slowly biodegradable COD (XB), the soluble inert organic matter (SU) and the
particulate organic matter (XU) were measured. The lower biodegradable COD fractions detected using the
SNAD biomass were probably due to inhibition effects of chemical compounds present in the leachate on the
SNAD biomass. The obtained characterization could be useful for biological process simulation models, which
require a complete influent wastewater characterization.
TOTAL COD1444 (100%)
SOLUBLE COD
1211* (83.9%)
RBCOD(SB) 21 (1.5%)
NON-BIODEG. COD(SU) 1190 (82.4%)
PARTICULATE COD233 (16.1%)
BIODEG. COD
(XB) 229 (15.9%)NON-BIODEG COD
(XU) 4 (0.3%)
TOTAL COD1444 (100%)
SOLUBLE COD
1211* (83.9%)
RBCOD(SB) 4 (0.3%)
NON-BIODEG. COD(SU) 1207 (83.6%)
PARTICULATE COD233 (16.1%)
BIODEG. COD
(XB) 43 (3%)NON-BIODEG COD
(XU) 190 (13.2%)
Fig. III.5. COD fractionation of landfill leachate
COD fractionation using (A) an activated sludge of WWTP and (B) a SNAD biomass (mean [mg/L]) * mean of CODsoluble measured by sequential filtration and ZnSO4 coagulation methods.
A
B

Chapter 3
112
3.6 Landfill leachate C/N ratio
The low BOD5/CODfilt_0.45µm ratio (0.04) measured with traditional approach indicated that the leachate is
characterized by a low biodegradability. The biodegradable fractions measured using the respirometric tests
indicated a biodegradability even lower, as confirmed by the RBCOD/CODsoluble ratio calculated in this study,
around at 0.017.
Further, the results showed that the old landfill leachate is suitable for the applicability of a SNAD process,
due to the low biodegradable content compared to the high nitrogen concentration, as confirmed by the low
CODsoluble/N, CODbio/N and RBCOD/N ratios.
A summary of the characteristics of the leachate used in this study together with the characteristics reported
in literature of old landfill leachates treated with SNAD processes is given in Table III-5. As can be seen from
the Table III-5, the BOD5/N and CODfilt_0.45µm /N ratios measured in this study are comparable to the values
previously reported in study on SNAD process (Wang et al. 2010; Xu et al. 2010). However, the truly
biodegradable COD/N ratio and the truly RBCOD/N are even lower than the corresponding CODfilt_0.45µm /N and
BOD5/N, indicating the possible co-existence of anammox and denitrifiers bacteria (Kumar and Lin 2010) and
the applicability of the SNAD process to treat the old landfill leachate.
Table III-5. Characterization of old landfill leachates used in SNAD process and described in literature.
Traditional This study
Reference BOD5/CODfilt 0.45µm BOD5/N CODfilt 0.45µm /N Inert/COD tot RBBOD/CODsol CODsol/N CODbio/N RBCOD/N
Wang (2010) 0.1 0.09 0.87 - - - - -
Xu (2010) 0.14 0.38 2.67 - - - - -
This study 0.04 0.06 1.1 - 1.5 0.8 0.017 1 0.2 0.017
4. Conclusions
A complete characterization of leachate is fundamental both in choosing the most appropriate biological
treatment technologies and in modeling the biological processes.
In this study we showed that the combination of physical-chemical and respirometric methods is an
appropriate tool for the wastewater characterization. Nevertheless, when an old landfill leachate is analyzed, it is
important to (i) perform a careful sampling, (ii) chose the optimal technique to evaluate the soluble and
particulate organic and nitrogen matter and (iii) adopt the appropriate procedures for OUR data processing in
order to properly evaluate the biodegradable fractions. Concerning the soluble organic matter and the total
ammonia concentration we suggest the use of sequential filtration over the filtration at 0.45 µm and the
coagulation with ZnSO4 at pH 10.5. Regarding the biodegradable organic COD, the respirometric methods allow
to achieve good results. A suitable data processing procedure, especially at the beginning of respirometric tests,
is necessary in order to correct the dilution effect, due to the fact that a high volume of leachate over the volume
of sludge should be added to the respirometric tests in order to appreciate the biodegradable fractions. The
results of the respirometric tests showed that the biodegradability depends on the biomass type (activated sludge
or SNAD biomass). In fact the two biodegradable fractions measured, both the SB and the XB, were lower using
SNAD biomass compared to the values measured using the activated sludge. This implies that a proper
characterization is essential in modeling biological process which use different biomass type.
Further, as the choice of a biological treatment process is strictly related to the presence of ammonia and
biodegradable COD, a correct evaluation of COD components and of the CODbio/N ratio is essential to chose the
correct biological process and the technology to apply for treating leachates. In this study, the overall leachate

Chapter 3
113
characterization puts in evidence the presence of both slowly biodegradable COD fractions (XB) (16% of the
total COD) and inhibiting compounds for biological process, such as heavy metals. In order to increase the
capacity to degrade substrates usually not biodegraded in continuous conventional wastewater treatment plants
and to limit the inhibition effects of some compounds, the use of Sequential Batch Reactors (SBRs) and granular
biomass systems could be useful to treat old landfill leachates. Moreover, the analysis of the old leachate showed
a high total ammonium concentration and a low CODbio/N ratio which indicate the conventional nitrification
denitrification processes are not sustainable biological process. Due to the low readily biodegradable organic
matter, a co-existence of anammox and denitrifying bacteria would be possible, avoiding the heterotrophic
biomass proliferation, while the high ammonium concentration may allow the development, under oxygen
limiting condition, of ammonia oxidizing bacteria over the nitrite oxidizing bacteria, making the SNAD process
appropriate to treat old landfill leachates.
Acknowledgements
The Authors wish to thank Mr. Fontanari from WWTP of Rovereto, Trento, Italy, for providing the old
landfill leachate samples and Mrs Cadonna from the laboratory of ADEP, Trento, Italy for her precious advices.

114

Chapter 4
115
IV. Chapter
Application of the Simultaneous, partial
Nitritation, Anammox and Denitrification
(SNAD) process to Municipal Solid Waste
landfill leachate
This chapter was based on:
Langone M., Miotto V., Andreottola G., 2011. Innovative biological treatment of wastewater with high
nitrogen and low biodegradable matter concentration. in XIII International Waste Management and Landfill
Symposium, Padova: CISA-Environmental Sanitary Engineering Centre, 2011, p. [1-18]. - ISBN:
9788862650007. Proceedings of: Sardinia 2011,
Langone M., Andreottola G. (2013). Application of the Simultaneous, partial Nitritation, Anammox and
Denitrification (SNAD) process to Municipal Solid Waste landfill leachate. Submitted.

Chapter 4
116
Application of the SNAD process to Municipal Solid Waste landfill leachate
Michela Langonea, Gianni Andreottolaa
a Department of Civil, Environmental and Mechanical Engineering, University of Trento, Via Mesiano 77, Trento 38123, Italy
ABSTRACT
The Simultaneous partial Nitrification, Anammox and Denitrification (SNAD) process for municipal landfill leachate treatment is a new, innovative and significant approach that requires more research to identify and solve critical issues. In this work, the feasibility of the application of the SNAD process in a Sequencing Batch Reactor (SBR) to treat an old landfill leachate has been tested.
First, batch studies were conducted on a synthetic wastewater in order to evaluate a suitable SBR cycle configuration and the SNAD-SBR performances. With an initial total ammonium nitrogen concentration of 68 mg TAN L-1 and an initial carbon – nitrogen ratio of 1.5, a total ammonium nitrogen and a total nitrogen removal efficiencies of 100% and 92% were observed, respectively. A high carbon (COD) removal efficiency was achieved (~ 45%). Batch studies on the old landfill leachate were conducted, achieving a total ammonium
nitrogen and a total nitrogen removal in the range of 76-87% and 64-79%, respectively. The lower N removal efficiencies were mainly due to the high ammonia-oxidizing bacteria sensitivity to the inhibitors compounds present in the leachate. A lower COD removal was also observed (~ 34%) due to the presence of non-biodegradable or slowly biodegradable organic matter in the leachate.
Influent characteristics, biomass activities and the operative conditions (i.e. pH, DO, T) influenced the SBR cycle configuration set up in the SNAD process. In this study, treating leachate, a good relationship between the SBR cycle configuration and the nitrogen loading rate was determined, in order to achieve a suitable partial nitrification during the first reaction phase of the SBR cycle under oxygen limiting conditions followed by a proper anammox process during the second reaction phase under anoxic conditions.
Keywords: Anammox, Autotrophic Nitrogen Removal, Denitrification, Partial Nitritation, old landfill leachate, Sequencing Batch Reactor, SNAD.
1. Introduction
1.1. Old Landfill Leachate Pollution and treatments
Although the general concept of the sustainable waste management is being increasingly supported by
regulators and by the general public, landfilling of waste continues to be a significant waste management method
(Wagner 2011). One of the main problems in landfill disposal of Municipal Solid Wastes (MSW) is the
generation of leachate, which is a hazardous wastewater. The leachate generally contains a complex mix of
inorganic and organic pollutants in dissolved, colloidal or dispersed form (Paxéus 2000): high ammonium
nitrogen, variable biodegradable organic (volatile fatty acids) content, organic refractory compounds (humic and
fulvic acids), heavy metals, alkalinity, hardness, salinity, chlorinated organic xenobiotic compounds such as
benzene and toluene, and numerous other substances that can be considered as pollutants (Kurniawan et al.
2006b). Among them, the most potentially hazardous pollutant is ammonium nitrogen, due to the long-term
effects and to its acute and chronic toxicity in aquatic environments (Kurniawan 2009).
Landfill leachate treatment remains one of the greatest problems associated with environmental management of
sanitary landfills. A great variety of pre-treatments and combined treatments have been applied to landfill
leachates, in order to i) improve the biodegradability of refractory and non- biodegradable compounds, such as
advanced oxidation techniques (Zhang et al. 2006); ii) remove heavy metal ions performing physic-chemical
methods (chemical precipitation, ion-exchange, adsorption, membrane filtration, evaporation, reverse osmosis,

Chapter 4
117
coagulation-flocculation, and electrochemical methods) as recently reviewed by Fu and Wang (2011); iii)
achieve the nitrogen and carbon limit standards, by using physic-chemical methods (i.e. ammonia stripping,
chemical precipitation) (Kurniawan et al. 2006a) and biological treatment methods, such as the conventional
activated-sludge (Robinson and Maris 1983; Laitinen et al. 2006) and combinations of new innovative nitrogen
pathways (Ruscalleda et al. 2008; Xu et al. 2010; Lan et al. 2011).
In particular, many efforts have been made towards developing nitrogen removal processes. Due to their
simplicity and high cost-effectiveness, biological treatments are widely applied over physic-chemical methods
for nitrogen removal from ammonium rich wastewaters (Mulder 2003). However, the choice of the optimal
biological treatment depends on the leachate composition, which is, in turn, a function of several landfill
parameters (Deng and Englehardt 2006), such as the type of waste, local weather and climate conditions, age and
design of landfill and operation processes. Among them, the age of landfills mainly influences chemical
properties, in particular the content of total ammonium nitrogen (TAN), biodegradable chemical oxygen demand
(CODbio) and biological oxygen demand (BOD), and provides an important criterium to choose the most
adequate biological treatment (Renou et al. 2008). During landfill aging, the concentration of biodegradable
carbon and nitrogen organic compounds in leachates normally decreases, while the inorganic ammonium
concentration increases. Generally, a high ammonium nitrogen (400-5.000 mgTANL-1), a moderate total organic
carbon (5.000-20.000 mg COD L-1), and a low biodegradable organic carbon (20-1.000 mg BOD5 L-1)
characterize the old leachates, which are generated from 10 more years operating landfills (Neczaj et al. 2005;
Kurniawan et al. 2006b; Yan and Hu 2009). The resulting BOD5/COD (< 0.2) and BOD5/N (< 2.5) ratios are
rather low. In particular, the low biodegradable COD/N ratio makes old leachates difficult to be treated by
conventional biological process (thus, nitrification and denitrification), as a high oxygen supply should be
available for biological nitrification process and supplemental external biodegradable organics have to be added
for denitrification, causing a considerable increase in operational costs (Price et al. 2003; Kulikowska and
Klimiuk 2008). On the contrary, conventional biological treatments have shown to be very effective in removing
nitrogen and organic matter from young landfill leachates, which are generated from 5 less years operating
landfills (Laitinen et al. 2006), where the BOD5/COD and biodegradable COD/N ratios have high values, not
requiring an external carbon source to complete the nitrogen removal process. In this context, improved nitrogen
biological removal processes have been now implemented to treat old leachates. One of the most challenging
process is the Simultaneous partial Nitritation, Anammox and denitrification (SNAD) process in view of its
advantages in terms of costs saving (Sri Shalini and Joseph 2012).
The main aim of this study was to investigate the feasibility of the application of the SNAD process in a
Sequencing Batch Reactor (SBR) to treat an old landfill leachate, characterized by high ammonia concentration,
a low biodegradable COD/N ratio and inhibitory compounds. Simple batch tests were conducted simulating a
SBR cycle, evaluating the COD, TAN and TN removal efficiencies. First, batch studies were conducted on a
synthetic wastewater in order to evaluate a suitable SBR cycle configuration and the SNAD-SBR performances.
Then, the inhibition effects due to the landfill leachate composition on the SNAD biomass were investigated and
the optimal SBR configuration was evaluated.

Chapter 4
118
Abbreviations
Parameters Reactor Configurations BOD Biological Oxygen Demand AUSB Aerated Upflow Sludge Bed COD Chemical Oxygen Demand CSTR Continuous Stirred Tank Reactor CODtot Total Chemical Oxygen Demand FBBR Fixed Bed BioFilm Reactor CODfiltr Filtrate Chemical Oxygen Demand GSBR Granular Sequencing Batch Reactor CODsoluble Soluble Chemical Oxygen Demand HBR Hybrid Biofilm Reactor CODbio Biodegradable Chemical Oxygen Demand MBR Membrane Bioreactor FA Free Ammonia (NH3 -N) RBC Rotating Biological Contactors FNA Free Nitrous Acid (HNO2-N) SBBR Sequencing Batch Biofilm reactors N Nitrogen SBR Sequencing Batch Reactors NO3
--N Total Nitrate Nitrogen UASB Upflow Anaerobic Sludge Blanket OUR Oxygen Uptake Rate RBCOD Readily biodegradable substrate Bacteria SBCOD Slowly biodegradable substrate AOB Ammonia-Oxidizing Bacteria TAN Total Ammonia Nitrogen NOB Nitrite-Oxidizing Bacteria TNN Total Nitrite Nitrogen Anammox ANaerobic AMMonia -OXidizing Bacteria TKN Total Kjeldahl Nitrogen TSS Total Suspend Solid General VSS Volatile Suspend Solid MSW Municipal Solid Wastes WWTP Wastewater Treatment Plant Operative Conversion rates DO Dissolved Oxygen ν TAN aerobic aerobic total ammonia removal rate
HRT Hydraulic Retention Time ν TNN aerobic aerobic total nitrite removal rate
KLa Mass transfer coefficient for oxygen ν N-NO3- aerobic aerobic nitrate production rate
NLR Nitrogen Loading Rate ν TAN anoxic anoxic total ammonia removal rate
OLR Organic Loading Rate ν TNN anoxic anoxic total nitrite removal rate
ORP Oxidation-Reduction Potential VER exchange volume ratio ν N-NO3
- anoxic anoxic nitrate conversion rate
Process CANON Completely Autotrophic Nitrogen removal Over
Nitrite (CANON)
OLAND Oxygen-Limited Autotrophic Nitrification/Denitrification
SHARON Single reactor High activity Ammonia Removal Over Nitrite
SNAD Simultaneous partial Nitritation, Anammox, Denitrification
1.2. General overview: Innovative biological treatments for old landfill leachate
Since the discovery (Mulder et al. 1995) and the identification (Strous et al. 1997) of anammox bacteria, the
traditional theory of biological nitrogen removal has been extended to new nitrogen metabolic pathways.
Anaerobic ammonium oxidation (anammox) is an autotrophic process in which bacteria of the phylum
Planctomycetes combine, under anoxic conditions, ammonium and nitrite to yield di-nitrogen gas, producing
small amounts of nitrate (Strous et al. 1999b). As the anammox process requires nitrite, it should be coupled
with the first step of nitrification process (nitritation) in order to oxidize ammonia to nitrite (Hellinga et al.
1998). Nitritation and anammox processes built a shortcut in the nitrogen cycle, allowing time and economic
savings. Consequently, several nitrogen removal processes have been developed in wastewater treatment and
applied to old leachates, as recently reviewed by Sri Shalini and Joseph, (2012).
Different reactor configurations have been investigated to perform the anammox process treating old landfill
leachates: Rotating Biological Contactors (RBC) (Siegrist et al. 1998; Egli et al. 2001; Lv et al. 2011); Upflow
Anaerobic Sludge Blanket (UASB) reactor (Zhang and Zhou 2006); up-flow Fixed Bed Biofilm reactor (Liang
and Liu 2008) and Sequencing Batch Reactors (SBR) (Ruscalleda et al. 2008).

Chapter 4
119
Treating leachates with anammox process, due to the presence of biodegradable organic matter in the
influent, heterotrophic denitrification process could occur. However, as old leachates are characterized by a low
biodegradable COD/N ratio, denitrifiers will not outcompete anammox bacteria (Kumar and Lin 2010). The co-
existence between anammox and heterotrophic denitrifiers has been performed in different anaerobic reactor
configurations, such as the UASB reactor (Zhang and Zhou 2006) and the SBR (Ruscalleda et al. 2008, 2010).
The nitritation process was studied as well as implemented in leachate full scale applications. Different
strategies have been adopted to inhibit the second step of nitrification process (nitratation) in order to have the
nitrite accumulation: i) working at high ammonia concentrations (Anthonisen et al. 1976), ii) working under
oxygen-limited conditions (Wyffels et al. 2004) and iii) operating at temperatures above 25°C and without
retention sludge (Hellinga et al. 1998), which is the base of the Single reactor High activity Ammonia Removal
Over Nitrite (SHARON) process (Van Hulle et al., 2007). Several reactor configurations have been found to be
suitable to perform the nitritation process treating old leachates, among them the continuous stirred tank reactor
(CSTR) (Vilar et al. 2010), the Fixed Bed BioFilm Reactor (FBBR) (Liang and Liu 2008), the membrane
bioreactor (MBR) (Canziani et al. 2006) and the SBR (Ganigué et al. 2009, 2012; Gabarró et al. 2012; Li et al.
2012).
Moreover, innovative combinations of the biological processes were implemented for treating leachates, by
either using separate reactors in series or accomplish two or more processes in the same reactor (single reactor).
Separate reactors in series (Nitritation-Anammox/Denitrification). Xu et al., (2007a) treated a leachate with
the SHARON process carried out in a hybrid biofilm reactor (HBR) followed by the anammox process in an
anaerobic baffled reactor (ABR). Ruscalleda et al., (2008) studied an urban landfill leachate treatment by the
SHARON and anammox processes in two SBR systems. Liu et al., (2010) showed that organic matter in the
leachate can be degraded in an UASB reactor, then the effluent from this was passed into an aerated upflow
sludge bed (AUSB) reactor for the nitritation process and further into an ammonium oxidation upflow anaerobic
sludge reactor for anammox process. Liang and Liu, (2008) treated a leachate by setting two up-flow fixed bed
biofilm reactors to perform partial nitritation and anammox process followed by two underground soil
infiltration systems for the purification of the remaining pollutants. Later, the same authors showed that in the
anammox reactor a decomposition and mineralization of aquatic humic substances was obtained (Liang et al.
2009). Mangimbulude et al., (2012) investigated and proposed a complete removal of ammonium from a
leachate, through a two-stage treatment system at landfilling site, where the first aerated leachate pond could be
used for the nitritation process, while in the second pond the remaining ammonium and produced nitrate can be
converted by a combination of nitrate reduction to nitrite (denitrification) and anammox.
Single reactor (Nitritation/Denitrification/Anammox). Nitrification and denitrification via nitrite in a one-
single system was implemented for the leachate treatment in an SBR (Spagni et al. 2008; Spagni and Marsili-
Libelli 2009) and in a Granular Sequencing Batch Reactor (GSBR) (Wei et al. 2012). In a complete absence of
organics in leachates, Sun and Austin, (2007), demonstrated that the nitritation and anammox process took
simultaneously place in a subsurface vertical flow wetlands. The occurrence of Simultaneous partial
Nitrification, Anammox and Denitrification (SNAD) process in one single reactor, under oxygen limitation, was
observed in a single partially aerated full-scale bioreactor treating an old landfill leachate (Wang et al., 2010).
SNAD process is one of the most interesting performing nitrogen removal process. It is carried out by bacteria
with opposed environmental requirements and it comprises three simultaneous, interacting and sequential
processes: i) an oxygen-limited (micro-aerobic) process, partial nitritation Eq. V-1(Eq. IV-1), where 50% of

Chapter 4
120
ammonia is oxidized to nitrite; ii ) an anoxic process, anammox (Eq. IV-2), where ammonia and nitrite are
converted to nitrogen gas producing a small amount of nitrate (Strous et al. 1999b) and where a small amount of
organics could be oxidized to CO2 reducing nitrate or nitrite to di-nitrogen gas (Kartal et al. 2007b); iii ) another
one anoxic process, denitrification (Eq. IV-3) - (Eq. IV-4), where the biodegradable COD (CODbio ), as electron
donor, could deoxidize nitrate and nitrite to N2 gas.
b4 2 3 2 5 7 2 4 2 2 30.69 0.99 0.49 0.01 0.5 0.52 0.94
AOBautotrophic acteriaNH O HCO NO C H O N NH H O H CO+ − − ++ + → + + + + (Eq. IV-1)
b4 2 3 2 3 2 2 1.5 0.151.32 0.066 0.13 1.02 0.26 2.03 0.066
anammoxautotrophic acteriaNH NO HCO H N NO H O CH O N+ − − + −+ + + → + + + (Eq. IV-2)
b
3 2 2 3 25 2heterotrophic
acteriaC NO H O CO HCO N− −+ 4 + → + 4 + 2 (Eq. IV-3)
b
2 2 2 3 23heterotrophic
acteriaC NO H O CO HCO N− −+ 3.5 + → +2 +1.75 (Eq. IV-4)
In addition, in the SNAD process, secondary biological processes may take place, i.e. aerobic nitrite
oxidation (Wett et al. 2010), nitrite – dependent anaerobic methane oxidation (Luesken et al. 2011c), some of
them compromising the total nitrogen removal efficiency. As consequence, a well balance co-existence of
different microbial communities in the SNAD reactor is a necessary requirement to stable perform the biogical
nitrogen removal process. In that aspect, the reactor configuration and the operative conditions play an important
role. Only few studies have been carried out the SNAD process for landfill leachate treatments (Table IV-1). Xu
et al., (2007b) showed a cooperative denitrification mechanism with partial nitrification and anammox processes
in a Sequencing Batch Biofilm reactors (SBBR), treating landfill leachates, under an intermittently aeration, at
low oxygen dissolved concentration (DO < 1.2-1.4 mgL -1) and high temperatures (T = 32°C). Xiao et al., (2009)
confirmed, through molecular analysis, that the ammonia removal from the leachate in a sequencing batch
biofilm (SBBR) reactor was achieved thanks to the co-existence of nitrifiers, denitrifiers and anammox bacteria.
Wang et al., (2010) demonstrated the occurrence of simultaneous partial nitrification, anaerobic ammonium
oxidation and denitrification (SNAD) process in a leachate full-scale CSTR under oxygen-limited conditions
(DO = 0.3 mgL-1) and high temperatures (T = 30-33°C). The anammox process accompanied with autotrophic
nitrification and heterotrophic denitrification in one rotating biological contactor (RBC) was investigated at low
temperatures (T < 20°C) (Cema et al. 2007).
To perform the SNAD process, the Sequencing Batch Reactors (SBR) and the Granular Sequencing Batch
Reactors (GSBR) have some advantages over the other reactor configurations, as they require a lower space and
capital costs, and they are characterized by higher nitrogen removal efficiencies and shock resistances (Artan et
al. 2003; Mohan et al. 2005). The great process flexibility of the SBR is very important when considering
wastewaters as leachates, which have a high degree of variability (Kennedy and Lentz 2000) and a low COD/N
(Yan and Hu 2009). The SBR flexibility, optimizing the reaction phases over the total length of the cycle, allows
to regulate the biological processes, in order to achieve an acceptable nitrogen removal. Moreover, the granular
biomass, in the GSBR technology, has some advantages with respect to the suspended biomass, especially for
anammox-like systems which are characterized by extremely low growth rate (doubling time 11 days) and
inhibited by several compounds (oxygen dissolved, nitrite, inorganic compounds, etc). The granular biomass
allows both the accumulation of large biomass concentrations in reactors without carrier materials and the
existence of substrate gradients, preventing inhibitions and causing aerobic and anaerobic conditions favorable
for the coexistence of different microorganisms in one single system (Vázquez-Padín et al. 2010). Nevertheless,
experiences with SNAD process for the landfill leachate treatment carried out either in an SBR or in a GSBR are

Chapter 4
121
very few (Table IV-1). Lan et al., (2011) studied the simultaneous partial nitrification, anammox and
denitrification (SNAD) process for ammonia removal from a synthetic wastewater, characterized by a low
COD/N ratio, using a SNAD seed sludge collected from a biological treatment unit (aeration tank) of a full-scale
landfill-leachate. The authors investigated the influence of hydraulic retention times (HRT = 3-9 d) on the
performance of a GSBR, operating under high temperatures (T=35°C) and a low oxygen level (DO =0.5-
1.0 mgL-1).
Xu et al., (2010) showed that an integration of partial-nitrification process, anammox process and
heterotrophic denitrification process may be applied to the SBR system treating leachate with periodical air
supply (DO = 1.0-1.5 mgL-1) and high temperatures (T = 30°C).
Table IV-1 Overview of typical SNAD process applied to landfill leachate and synthetic wastewater
Reference Chen et al.
2009 Lan et
al. 2011 Xu el
al. 2010 Xu el
al. 2010 Xiao et al 2009
Wang et al. 2010
Wastewater Synthetic
wastewater Synthetic
wastewater Synthetic
wastewater Landfill Leachate
Landfill Leachate
Landfill Leachate
CODbio/N 1:2 1:2 0 1:2.6 nd 1:10
Reactor type NRBC SBR SBR SBR SBBR Aeration tank
Volume [L] small 18 L 3 L 3 L 3 L 384 m3
SBR configuration nd 24h cycle 12h cycle 12h cycle 24 h cycle
Fill nd continuous intermittent intermittent intermittent continuous
Aeration mode continuous continuous intermittent intermittent intermittent continuous
DO [mg L-1] 0.4 – 0.6 0.5 – 1.0 1.0 – 1.5 1.0 – 1.5 0.6 0.3
Inoculum
nitrifying biomass+ anammox
sludge
SNAD sludge active sludge+
anammox sludge
active sludge+ anammox
sludge active sludge active sludge
HRT 5-6 h 3 d 1.5 d 1.5 d 2-4 h 1.26 d
SRT [d] nd very high - - nd 12-18
pH nd 7-8 7.2-8 7.2-8 7.8-8.54 7.4
T [°C] 35 35 30 30 nd 30
VSS [g L-1] nd - 1.2 1.5 nd 1.5
OLR [g COD L -1 d-1 ] 0.69 0.033 0 2.6 - 0.44
NLR [g TN L -1 d-1 ] 0.34 0.066 0.187 0.961 - 0.5
Removal rate [g TN L -1 d-1 ]
nd 0.066* 0.140* 0.896* - 0.38*
TN tot removal [%] 70%
92,6% (85% PN+
Amx; 7,3% Den)
65% 92% -
75% (%68 PN+
Amx; 8% Den)
TAN removal [%] 79% 93% 70% 92% 97% 80%
COD removal [%] 94% 72% 0 95% BOD
(6,7% COD) 86% 28% (denitrify)
PN = Partial Pitritation, Amx = Anammox, Den = Denitrification *value calculated

Chapter 4
122
2. Materials and Methods
2.1. Feeding media and old landfill leachate
The synthetic wastewater was prepared according to Third et al., (2001) and optimized for the SNAD process,
as no nitrite was added while a carbon source and alkalinity were introduced in the medium. Its composition was
similar to that of old landfill leachates, in terms of total ammonia nitrogen (TAN = 900 mgL-1) and total soluble
organic matter (CODsoluble = 1000 mgL-1) content. Ammonium, as NH4Cl, was added to the medium in the
required amounts and alkalinity, as KHCO3, was added according to the nitritation stoichiometry. COD, as
CH3COONa, was added in a low soluble COD to N ratio (~1). The composition of the synthetic wastewater is
reported in the Supplementary Table IV-1.
The raw old landfill leachate was collected from a municipal landfill (Trento, Italy) and stored at 4°C in order
to prevent the COD and nitrogen degradation. The chemical characterization of the old landfill leachate was
obtained over a period of 1 year. The leachate was characterized by a moderately high total and soluble COD
content (1444 mgCODtotal L-1 and 1273±194 mgCODsoluble L
-1), by a high total ammonia concentration (1183 mg
TAN L -1), and by a low biodegradable and readily biodegradable COD content, 250 mg CODbio L-1 and 21 mg
RBCOD L-1, respectively. The leachate was characterized by very low C/N ratios: CODsoluble/N ~ 1;
biodegradable CODbio/N ~ 0.2, RBCOD/CODtotal = 0.02. The average values of the principal compounds
concentrations are summarized in the Supplementary Table IV-2.
2.2. Seed sludge
The SNAD seed sludge was collected from a biological treatment unit (SBR) of the full-scale Municipal
Wastewater Treatment Plant, Zürich (Switzerland). The SBR treated the digester supernatant, at high
temperature (T=30°C). The operating conditions of the SBR (1400 m3) were: DO < 0.8 mgL-1, pH ̴ 7.1±0.2,
T ̴ 30°C, MLSS ̴ 3.6 kg TSSm-3, N- load ̴ 0.625 kg Nm-3 d, HRT ̴ 1.45 d (Joss et al. 2009). In the Zürich SBR,
partial nitrification, anammox and denitrification process was full achieved (Joss et al. 2009). The seed sludge
contained granules surrounded by a matrix of brownish flocs. Two kinds of granules (red and brown) could be
distinguished. The granules had diameters between 0.5 and 2.0 mm. Molecular analysis of the original inoculum
showed the presence of ammonia-oxidizing bacteria of the Nitrosomonas europaea/eutropha group, anaerobic
ammonium-oxidizing bacteria of the “Candidatus Brocadia fulgida” type and denitrifying bacteria related to the
Thauera and Pseudomonas. Nitrite-oxidizing bacteria from the genus Nitrobacter were also detected (Langone et
al. 2013b). The authors showed long filamentous - shaped microorganisms were dominant in the outer layer of
the granules, while single cells as well as aggregates were trapped in a net of filamentous bacteria.

Chapter 4
123
2.3. Batch tests
Batch tests were carried out in a lab-bioreactor, equipped as a Sequence Batch Reactor (SBR) and inoculated
with the SNAD sludge harvested from the Zürich full-scale SBR. The experimental reactor with its
instrumentation and control system is schematized in Fig. IV.1. The cylindrical reactor (working height 0.22 m,
inner diameter 0.152 m) made of acrylic plastic had a total working volume of 4 L. The system was fitted with a
thermostatic jacket to maintained a fixed temperature of 30°C±1°C. The reactor was equipped with a mixer,
acid/base pumps and a set of two peristaltic pumps to introduce the feeding solution and to discharge the
effluent. Air was supplied by a Schego M2K3 350 air pump and the gas-flow was maintained constant at 20 nL
h-1 using a mass-flow meters.
AirCompressor
InfluentPump pH
O2,TORP
Effluent Pump
Sludge Extraction
Criostat
Tank
WL
Influent
Effluent
PC(Store data)
4 - 20 mA
Base/AcidPump
Mixer
Timer
controller
Field PointAcid/Alcaline
Tank
Tank
pH controllerDO
MassFlow meters
time control
Fig. IV.1 Schematic representation of the 4L lab-scale reactor used for batch tests..
Air was bubbled through n. 4 diffusers at the bottom of the reactor to promote the oxygen transfer into the
bulk liquid and to support a suitable mixing. The mass transfer coefficient for oxygen (KLa) was calculated and
fixed at a sufficiently high value (0.22 min-1 at 20°C), in order to ensure the dissolved oxygen set-point can be
attempted with the on/off control (Sin et al. 2004). The initial total suspended solids (TSS) concentration of the
whole sludge was 3-4 g TSS L-1. The volatile suspended solids (VSS) were about 70% of total suspended solids
(TSS). In the SBR, a high biomass retention was obtained by choosing a suitable settling time in order to have a
minimum biomass settling velocity of 0.7 m h-1, which is the ratio between the vertical distance from the water

Chapter 4
124
surface to the effluent discharge point and the settling time (Vlaeminck et al. 2009a). This value means that bio-
particles having a settling velocity less than 0.7 m h-1 could be withdrawn through the discharge effluent. The
exchange volume ratio (VER) and the hydraulic retention time (HRT) were variable depending on the nitrogen
loading rate (NLR) applied.
Each batch test lasted for 4 or 6 hours distributed according to the scheme described in Fig. IV.2, simulating
an SBR cycle time. Each cycle comprised an unaerated and short filling phase (tfill =3-5min), a micro-aeration
phase (tmicroaer = 1–4 h), an anoxic phase (tanoxic = 1.8–3.0 h), a settling phase (tsettle = 5–7 min) and a draw phase
(tdraw = 10-15 min). The filling phase was mixed and short, creating conditions under which the growth rate is
higher for floc-formers than for filaments (Artan and Orhon 2005). The short filling phase ensured that the
biomass was exposed initially to a high nitrogen load, and consequently to a high concentration of Free
Ammonia (FA), inhibiting the nitrite- oxidizing bacteria (NOB) (Anthonisen et al. 1976). Further, during the
mixed fill, heterotrophic bacteria may degrade the organics using either residual oxygen or alternative electron
acceptors, such as nitrite, nitrate and sulphate. The reaction phase of the SBR took place after the filling period.
A first reaction phase under oxygen-limited conditions (micro-aerobic phase) preceded a second anoxic reaction
phase (anoxic phase), as a partial nitritation step is necessary to supplies both NH4+-N and NO2
--N and attain a
suitable influent for anammox process. The micro-aeration phase took place at the end of the short filling phase
(when in the reactor it was supposed that the maximum ammonia concentration had been achieved). Further
micro-aerobic phase was conducted under oxygen limitation (DO < 0.3 mg L-1), in order to further inhibit the
NOB activity by low oxygen concentration, due to the lower oxygen affinity of NOB over the AOB (Wiesmann
1994). During the anoxic phase, anammox and denitrification processes occurred. After the micro-aerobic and
the anoxic phases (reaction phase), the stirrer was stopped and the biomass aggregates and granules were
allowed to settle for 5-7 minutes. In the remaining minutes of the cycle, the supernatant was removed. The length
of the SBR cycle and the length of micro-aerobic and anoxic phases depended on both the nitrogen loading rate
and the performances of the SNAD process. In this study the phases length of the single batch tests was manually
fixed and controlled by programmable timers.
Fill Anoxic
Micro-aerobic
Settle
Draw
Fig. IV.2 Schematic representation of the SBR cycle configuration
The monitoring system of the batch tests consisted in a data acquisition system (Field Point FP 1000,
National Instruments, Austin, TX, USA ) and our own software developed using LabVIEW 2010 software
(National Instruments, Austin, TX, USA) (Fig. IV.3). The acquisition software developed was able to acquire the
on-line parameters, presenting them in a graphical interface. The FP-1000 FieldPoint network module connected
an industrial RS-232 network to a FieldPoint analog input module with eight analog voltage or current input
channels, 16-bit resolution (FP-AI-110). The FP-AI-110 channel configuration is summarized in the
Supplementary Table IV-3. On-line data provided by pH, ORP, DO and temperature sensors were automatically
acquired and stored. The pH and ORP were measured using Hanna Instruments electrodes (Hanna Instruments,
Italy). The dissolved oxygen (DO) was measured using a polarographic cell (B&C Electronics, Italy). Alarms
TFill Tmicro-aer
Tanoxic
Tanoxic Tsettle Tdraw

Chapter 4
125
and protective modes were programmed into the system. A liquid detection sensor was installed in the reactor. In
case of leachate overflows and touch of the liquid detection sensor, a relay control could automatically stop the
influent pump.
A. Part of monitoring software code developed using LabVIEW 2010 software
B. Software for on-line monitoring developed using LabVIEW 2010 software
C. Acquisition hardware (Field Point FP 1000and FP-AI-110) D. Installation of data acquisition system Fig. IV.3 SBR monitoring and control system.
The SBR cycle was managed using a multiple programmable timers combined with a pH and a DO controller.
Timers and controllers were connected with the mechanical devices (pumps, mixer and air pump). During the
whole cycle, the pH was controlled using a biocontroller (Hanna Instruments, Italy) and it was allowed to vary in
the wide range of 7.1 - 8.5, by the addition of acid (1 N HCl) and alkaline (1 N NaOH) solutions. During the
micro-aerobic phase, the DO was controlled by a programmable logic controller system (B&C Electronics,
Italy), ensuing a low DO concentration around 0.1 – 0.3 mg/L. The ORP was left free to vary.
2.4. Experimental procedure
Subsequent batch tests, simulating one cycle of the operation of SBR, were conducted. The experiments were
divided into three periods. In the period I, a first run of assays was carried out to assess the performance of the
SNAD process for treating ammonium rich wastewaters with a low CODbio/N ratio. The batch tests were fed with
a synthetic medium, where inhibitors were not present, characterized by a COD and TAN concentration of 1000
and 900 mgL-1, respectively. The SBR cycle was modified in order to achieve a partial nitritation process during
the micro-aerobic phase and reach, at the beginning of the anoxic phase, a suitable remaining TAN and produced
TNN ratio for the later anammox process, assuring the maximum total nitrogen (TN) removal over the SBR
cycle. In this run, the biomass was gradually acclimatized to the high total ammonia concentration, by filling the
SBR with increasing volumes of synthetic wastewater at the beginning of each cycle. The initial total ammonium
nitrogen (TAN) concentration was gradually increased and a low (SW1) and a moderate (SW2) load tests were

Chapter 4
126
operated. At the beginning of the each SBR cycle, TAN concentrations in the reactor were 22.5 mg TAN L-1 in
SW1 and 66 mg TAN L-1 in SW2. The total (TSS) and volatile (VSS) suspended solids content in the reactor
were in the range of 3.3-3.5 gTSS L-1 and 2.3-2.5 gVSS L-1, respectively. Other details of the batch tests are
reported in Table IV-2.
During the period II, the reactor was fed with the raw leachate from a municipal landfill (Trento, Italy), in
order to study the applicability of the SNAD–SBR process to the treatment of landfill leachates, which could
inhibit the biological activity, as toxic compounds are present. The SNAD biomass, after the inoculation and the
start up period using the synthetic wastewater, was gradually acclimated to the old landfill leachate, by filling
the SBR with increasing volumes of the leachate at the beginning of each cycle. The raw leachate was
characterized by mean COD and TAN concentrations of 1273 mg CODsolubleL-1 and 1183 mg TANL-1,
respectively, and a low COD/N ratio. Starting from the results of the first run, three batch experiments (A, B,
and C) were performed in order to gradually reach the maximum nitrogen loading rate per cycle applied in the
Period I (0.067 kgTAN m-3 cycle-1). TAN concentrations in the reactor in the three preformed tests, at the
beginning of each SBR cycle, were 38, 66, and 81 mgTAN L -1, respectively. The length of the SBR cycle and the
duration of the micro-aerobic and anoxic phases were optimized, depending on the initial TAN concentration.
The total (TSS) and volatile (VSS) suspended solids content in the reactor were around at 2.7-3.3 gTSS L-1 and
1.9-2.3 gVSS L-1, respectively. The details of the batch tests are reported in Table IV-2.
Finally, in a third run, period III, the effects of the high total ammonia concentration on the SNAD
performance were investigated. Three high load batch tests (D, E, F) were conducted using increasing the
ammonia loading rate and consequently the total ammonia concentrations at the beginning of the 6 h SBR cycles
(Table IV-2). The high load tests were then compared with the moderate load tests, looking at the performance of
the SNAD process, in terms of nitrogen and carbon removal efficiency.
Table IV-2 Operative strategies during Period I, II and III
Synthetic wastewater Old landfill leachate
Period I Period 2 Period 3
Parameters u.m. SW.1 SW.2 A B C D E F
NLR per cycle [kgTAN m-3 cycle-1] 0.0125 0.0675 0.038 0.065 0.0825 0.105 0.128 0.167 OLR per cycle [kgCOD m-3 cycle-1] 0.015 0.075 0.040 0.070 0.085 0.11 0.135 0.175
V fill [L] 0.06 0.3 0.12 0.21 0.26 0.34 0.41 0.54
Duration of the different SBR cycles Total cycle length [h] 6 6 4 6 6 6 6 6
Filling time [min] 3-5 3-5 3-5 3-5 3-5 3-5 3-5 3-5 Micro-aeration time [h] 2.5 2.5 1.3 2.5 3.5 3.5 4.0 3.5 Anoxic time [h] 2.8-3.0 2.8-3.0 2.2-2.4 2.8-3.0 1.8-2.0 1.8-2.0 1.3-1.5 1.8-2.0
Settling time [min] 5-7 5-7 5-7 5-7 5-7 5-7 5-7 5-7 Effluent withdrawal [min] 10-15 10-15 10-15 10-15 10-15 10-15 10-15 10-15
After the addition of both the synthetic wastewater and the leachate, samples were taken, filtered, and
analyzed immediately at a certain interval (30-60 min). The carbon and nitrogen performances of the SNAD
process were investigated depending on the type of the wastewater and on the configuration of the SBR cycle.
2.5. Analytical methods
Total suspended solid (TSS), volatile suspended solid (VSS), chemical oxygen demand (COD) and total
Kjeldahl Nitrogen (TKN) were determined according to the Standard Methods (APHA-AWWA-WPCF 2005).

Chapter 4
127
The COD was analyzed taking into account the chloride interference and further recalculated considering the
interference due to the presence of nitrite (nitrite exerts a COD of 1.142 mgO2/mg TNN).
According to Langone and Andreottola (2013), the raw leachate samples were deeply analyzed for the truly
soluble COD (CODsoluble) and TAN concentrations by using the sequential filtration technique (0.45 and 0.2 µm
nominal pore size), for total biodegradable (CODbio) and readily biodegradable organic matter (RBCOD) by
using a combination of chemical and respirometric techniques. Ferrous ions (FeII) were determined using a
UV/Vis spectrophotometer, while Ferric ions (FeIII) through colorimetric analysis. Metallic ions, among them
Manganese, were measured using the inductively coupled plasma mass spectrometry (ICP-MS) (EN ISO 17294-
2:2004). Dissolved sulphide (S2−) and hydrogen sulfide (H2S) were measured according to APAT CNR IRSA,
2003. Alkalinity determinations were conducted using the kit USEPA Buret Titration Method 8221 (Hach
Company).
The reactor effluent and the samples of the batch tests were filtered through 0.45 filters, as this procedure
required lower amount of sample and was time saving over the sequential filtration. The filtrate was analyzed
colorimetrically for total ammonium as nitrogen (TAN) and total nitrite as nitrogen (TNN) (APAT CNR IRSA
2003). Nitrate as nitrogen (NO3--N) and chemical oxygen demand (CODfiltrate), were measured according to the
Standard Methods (APHA-AWWA-WPCF 2005).
The mass transfer coefficient for oxygen in the reactor (KLa) was estimated following the standard method of
measurement of the transfer of oxygen in clean water published by the American Society of Civil Engineering
(ASCE 1992).
2.6. Calculations
Concentrations of free ammonia (FA or NH3-N) and free nitrous acid (FNA or HNO2-N) were calculated
using the equations (Eq. IV-5) - (Eq. IV-7) derived from acid–base equilibrium, as a function of pH,
temperature and the sum of unionized and ionized forms, TAN and TNN, respectively (Anthonisen et al. 1976):
( )1
1 10 pH NHe
TANFA mgNL
K−
− + = + (Eq. IV-5)
( )1
1 10NO pHe
TNNFNA mgNL
K−
−
= + (Eq. IV-6)
( )6344 273 TNHeK e− += and ( )2300 273 TNO
eK e− += (Eq. IV-7)
The efficiency of total ammonia nitrogen (TAN), total nitrogen (TN) and organic matter (COD) removal were
estimated according to the following equation:
[%] 100ini eff
ini
C CEfficiency
C
− = ⋅ (Eq. IV-8)
where Cini is the concentration in the liquid after the instant fill phase and Ceff is the concentration in the
effluent at the end of the SBR cycle.

Chapter 4
128
3. Results
3.1 Period I – feasibility of SNAD process
The batch tests conducted using the synthetic wastewater indicated that a simultaneous carbon and nitrogen
removal in one single reactor, under oxygen limitation, from wastewater characterized by a low biodegradable
COD and N ratio (C/N = 0.2) was feasible. Fig. IV.4 shows the profiles of nitrogen species over the SBR cycles
of the SW1 and SW2 tests, distinguishing the micro-aerobic and the anoxic phases. The nitrogen conversion rate
in both the micro-aerobic and the anoxic conditions were evaluated and reported in Table IV-3, together with the
nitrogen and carbon removal efficiencies.
time [h]0 1 2 3 4 5 6
[mg N
L-1]
10
30
50
70
0
20
40
60
80
TANTNN
Low Load
microaerobic anoxicT aer = 2.50 h T anox = 3,50 h
Syntetic wastewater
time [h]0 1 2 3 4 5 6
[mg N
L-1]
10
30
50
70
0
20
40
60
80
TANTNNN-NO3
-
Moderate Load
microaerobic anoxicT aer = 2.50 h T anox = 3,50 h
Syntetic wastewater
Fig. IV.4 Evolution of nitrogen species over a 6 h SBR cycle using synthetic wastewater: (SW.1): NLR = 0.012 kgTAN m-3cycle-1 and (SW.2): NLR = 0.067 kgTAN m-3cycle -1
time [h]0 1 2 3 4 5 6
[mg C
OD L-1
]
10
30
50
70
90
110
0
20
40
60
80
100
120
CODfiltr
Moderate Load
microaerobic anoxicT aer = 2.50 h T anox = 3,50 h
Syntetic wastewater
Fig. IV.5 Evolution of COD over a 6 h SBR cycle using synthetic wastewater:
(S2):OLR=0.075 kgCOD m-3 cycle -1
It is clearly shows that during the micro-aerobic phase the nitritation process occurred, as TAN was removed
and simultaneously TNN was produced. During the micro-aerobic phase, the nitrate profiles and the low values
of the aerobic nitrate production rate (ν NO3-N aerobic) showed a low activity of the aerobic nitrite oxidizing
bacteria (NOBs), which were partially inhibited in the SNAD biomass. The aerobic total ammonia removal rate
(ν TAN aerobic), mainly related to the ammonia- oxidizing bacteria (AOBs) activity, was slighter higher during
the moderate load test SW2 (-0.163 g TAN g VSS-1 d -1) compared with the value measured in test SW1 (-0.136 g
TAN g VSS-1 d -1), as the AOBs activity are limited by the lower ammonia concentration reached in test SW1.
The length of micro-aeration phase was fixed at 2.50 h in both tests. A 100% oxidation of the initial total
ammonia (TAN) to nitrite (TNN) occurred in the low load test (SW1), achieving a complete nitritation process
SW.2
SW.2
SW.1

Chapter 4
129
(Fig. IV.4-SW1). On the contrary, a successful partial nitritation process, required for the SNAD process,
occurred in the moderate load test (SW2), where only the 50% of the initial TAN was converted into TNN,
ensuing an optimal remaining TAN and produced TNN ratio for the subsequent anammox process (Fig. IV.4-
SW2). The nitrogen profiles were further analyzed during the anoxic period. The simultaneous depletion of the
TAN and TNN was observed in the test SW2 and the anoxic total ammonia removal rate (ν TAN anoxic), which
is referred to the anammox activity, was measured (-0.091 gTAN gVSS-1d-1). On the contrary, any anammox
activity was detected in the test SW1, as there was no ammonia left to react with nitrite during the anoxic phase.
Further, from the COD profile over the SBR cycle, it can be deduced that the aerobic biodegradable organic
compounds oxidation was combined with nitritation during the micro-aerobic phase while the denitrification was
coupled with anaerobic ammonium oxidation during the anoxic phase (Fig. IV.5–SW2).
Looking at the total performance of the SNAD process, the efficiencies of the TAN removal were high for
both the tests (100%). Nevertheless, the total nitrogen (TN) efficiency removal of the low load test (SW1) was
extremely low, as during the micro-aerobic phase TAN was completely oxidized to TNN, making impossible to
perform the following anammox process during the anoxic phase. High TN (92%) and COD (45%) removal
efficiencies were calculated for the moderate load test (SW2).
In addition, the SNAD biomass used in this study showed good settling property, with a settling velocity of
0.9 m h-1, as both flocs and granules were present. Only small particles were discharged with the effluent while
the granules entrapped in a crosslinked network formed by flocs successful settled.
Table IV-3 Characteristics of nitrogen and carbon removal in period I Synthetic Wastewater
Parameters u.m. SW.1 SW.2
ν TAN aerobic [g TAN (g VSS d) -1] -0.136 -0.163
ν TNN aerobic [g TNN (g VSS d) -1] +0.132 +0.141
ν N-NO3- aerobic [g NO3-N (g VSS d) -1] ~0 +0.033
(TNN/TAN)aer - -0.97 -0.87
(NO3-N/TAN)aer - ~0 -0.18
ν TAN anoxic [g TAN (g VSS d) -1] -0.0006 -0.091
ν TNN anoxic [g TNN (g VSS d) -1] -0.0087 -0.137
ν N-NO3- anoxic [g NO3-N (g VSS d) -1] 0 -0.023
(TNN/TAN)anox - - +1.50 (NO3-N/TAN)anox - - +0.97 Total TAN efficiency removal % 100 100 Total TN efficiency removal % 0 92 Total COD efficiency removal % nd 45
The ionized (NH4+-N-and NO2
--N) and the unionized (FA/NH3-N and FNA/HNO2-N) nitrogen species were
calculated during both the batch tests, taking into account the pH on-line monitored in the time-course
experiments. In Fig. IV.6 the evolution of total nitrogen ammonia, free ammonia and pH is reported for the test
SW2. The batch tests conducted on the synthetic wastewater showed a good relationship between the on-line pH
measured and the development of the SNAD process. In SW2 test, the pH value was in the range of 7.6 – 8.5
with no external addition of base or acid, showing a step increase during the feeding event and a linear decrease
during the micro-aerobic phase, reaching the minimum value of 7.6 at the end of the micro-aerobic phase, due to
the proton production linked to the AOB activity. During the anoxic phase, the pH behavior was influenced by
denitrification and anammox process. The overall trend resulted in a pH increase due to the OH- contribution by
the denitrification process and to the H+ consumption by anammox reaction, while only a little amount of

Chapter 4
130
alkalinity is consumed during the anammox process. Further the FA concentration during the SBR cycle was
always lower than 10 mg NH3-NL -1.
time [h]0 1 2 3 4 5 6
pH
6,0
6,5
7,0
7,5
8,0
8,5
[mg N
L-1]
10
30
50
70
0
20
40
60
80
TANpH N-NH3
microaerobic anoxicT aer = 2.50 h T anox = 3,50 h
Syntetic wastewater
Fig. IV.6 Profiles of pH, TAN and FA in an SBR cycle using synthetic wastewater:
(S2) :NLR=0.27 kgTAN m-3 d-1
3.2 Period II–feasibility of SNAD process for treating old leachate and SBR phases optimization
Landfill leachates contained some inhibitory compounds, which may inhibit biological activity, such as heavy
metals and high salts concentration. Treating leachates and gradually increasing the nitrogen loading rate, it was
possible to achieve a good nitrogen and carbon removal efficiency performing the SNAD process. The profiles
of the nitrogen species over the SBR cycles of the batch tests performed are reported in the Fig. IV.7, while the
performance details of each tests are reported in Table IV-4.
time [h]0 1 2 3 4 5 6
[mg N
L-1]
10
30
50
70
0
20
40
60
80
TANTNNN-NO-
3
Moderate Load microaerobic anoxic T aer = 1.30 h T anox = 3,70 h
Leachate
time [h]0 1 2 3 4 5 6
[mg N
L-1]
10
30
50
70
0
20
40
60
80
TANTNNN-NO-
3
Moderate Load
microaerobic anoxicT aer = 2.50 h T anox = 3,50 h
Leachate
time [h]0 1 2 3 4 5 6
[mg N
L-1]
10
30
50
70
0
20
40
60
80
TANTNNN-NO-
3
Moderate Load
microaerobic anoxic T aer = 3.50 h T anox = 2,50 h
Leachate
Fig. IV.7 Evolution of nitrogen species over an SBR cycles using old landfill leachate: (A): NLR=0.038 kgTAN m-3 cycle-1, (B): NLR=0.065 kgTAN m-3 cycle -1, (C): NLR=0.082 kgTAN m-3 cycle -1
SW.2
C
B A

Chapter 4
131
The nitrate profiles during the micro-aerobic phase suggested a low NOBs activity (ν NO3-N aerobic), while
the total ammonia removal and nitrite profiles clearly showed the occurrence of the nitritation process during the
micro-aerobic phase and the anammox process during the anoxic phase.
High TAN removal efficiencies (76-87%) were observed in the moderate load tests. At the end of the cycles
residual TAN, TNN and NO3--N were found (lower than 10 mg L-1), resulting in TN (total ammonia) removal
efficiencies in the range of 64-79%. A mean COD removal efficiency of ~34% was measured.
Looking at the total efficiency of the SNAD process for the leachate treatment, the SBR cycle configurations
were compared: i) a 4.0 h SBR cycle and a 1.30 h micro-aeration phase was suitable for a loading rate of
0.038 kgTAN m-3 cycle-1, corresponding to an initial TAN concentration of 38 mg TAN L-1; ii ) a 6.0 h SBR with
2.5 h of micro-aeration phase was suitable for a loading rate of 0.065 kgTAN m-3cycle-1, corresponding to an
initial TAN concentration of 66 mg TAN L-1; iii ) finally, a micro-aeration phase of 3.5 h in a 6.0h SBR was
adequate for a loading rate of 0.0825 kgTAN m-3 cycle-1, corresponding to an initial TAN concentration of 81 mg
TAN L -1
Table IV-4 Characteristics of nitrogen and carbon removal in period II
Old landfill leachate
Parameters u.m. A B C
6 7 10
ν TAN aerobic [g TAN (g VSS d) -1] -0.139 -0.142 0.140
ν TNN aerobic [g TNN (g VSS d) -1] +0.097 +0.090 +0.107
ν NO3-N aerobic [g NO3-N (g VSS d) -1] +0.033 +0.036 +0.022
(TNN/TAN)aer - -0.7 -0.64 -0.77 (NO3-N/TAN)aer - -0.24 -0.25 -0.16
ν TAN anoxic [gTAN (g VSS d) -1] -0.073 -0.093 -0.117
ν TNN anoxic [gTNN (g VSS d) -1] -0.104 -0.112 -0.140
ν NO3-N anoxic [g NO3-N (g VSS d) -1] -0.003 -0.013 -0.003
(TNN/TAN)anox - +1.42 +1.20 +1.20 (NO3-N/TAN)anox - +0.035 +0.14 +0.024 Total TAN efficiency removal % 86 76 87 Total TN efficiency removal % 79 64 74 Total COD efficiency removal % 31 23 34
The SBR configuration plays an important role for the development of a stable SNAD process. In particular,
the length of micro-aerobic phase is one of the main factor to achieve high SNAD performances, as it dictates a
proper partial nitritation process, which is an essential step for the following anammox process.
NLR [kg TAN m-3 cycle-1]0,00 0,02 0,04 0,06 0,08 0,10
Time [
h]
1
3
5
7
0
2
4
6 Total cycle SBR lengthMicro-aeration SBR length
Moderate Load
tSBR minimum = 47,4 NLR + 2.40
R2 = 0.85
tSBR minimum = 49,0 NLR + 0.60
R2 = 0.85
Fig. IV.8 Optimal length of the total cycle length and the micro-aerobic phase in the SBR cycle

Chapter 4
132
Treating leachates, in this study we determined a good relation between the nitrogen loading rate per cycle
and both the total SBR cycle and the minimum length of micro-aeration phase, under oxygen limited conditions,
to achieve a partial nitritation process and a high TN removal efficiency (Fig. IV.8). The relation was validated
in the range of 0.035 – 0.085 kgTAN m-3 cycle-1. However, this finding were both wastewater and biomass
specific as the performance of the SNAD process depended on the activity of the each group of microorganisms
involved and on their interactions.
3.3 Period III –Effect of high total ammonia nitrogen on SNAD performance
The SNAD performance, in terms of nitrogen and carbon removal efficiency, significantly decreased when a
NLR higher than 0.08 kgTAN m-3 cycle-1, corresponding to an initial TAN concentration of 81 mg TAN L-1, was
applied (Fig. IV.9).
In the high load tests (D,E,F), the total ammonia nitrogen (TAN) removal efficiency decreased from values of
76 -87%, reached in the moderate load tests (A,B,C), to 30 – 50%. Considering the total nitrogen (TN) removal
efficiency, a decrease from 64-79% to 20-50% was observed.
We showed that the lower nitrogen efficiencies were mainly linked the lower AOBs activity (Fig. IV.10). In
fact, the aerobic ammonia removal rate started to decrease when a concentration of 105 mg TAN L-1 was reached
in the reactor at the beginning of the SBR cycle. As the pH at the beginning of the SBR was always a value
higher than 8, the corresponded FA concentration in the high load tests (D,E and F) was always higher than
10 mg NH3–NL-1, thus inhibiting the AOBs activity (Anthonisen et al. 1976).
From the analysis of the batch studies, we also concluded that acceptable anoxic ammonia removal rates were
measured ensuing, at the beginning of the anoxic phase, a maximum TNN concentration of 20-25 mg L-1. From
nitrogen species profiles, we observed that lower nitrite concentrations resulted a in substrate limitation for
anammox bacteria, while repeated nitrite concentrations higher than 20-25 mg L-1 caused losses of anammox
activity due to the nitrite long-term effect.
TAN [mg TAN L-1]0 20 40 60 80 100 120 140 160 180
Effici
ency
[%]
0,1
0,3
0,5
0,7
0,9
0,0
0,2
0,4
0,6
0,8
1,0
TAN %TN % COD %
(A) 4h (B) 6h C (6h) D(6h) E (6h) F (6h)
SBR SBR SBR SBR SBR SBR
0.038 0.066 0.081 0.105 0.128 0.167
NLR [kg TAN m-3 cycle -1] Fig. IV.9 Effect of high total ammonia concentration (TAN) on the SNAD performance.

Chapter 4
133
TAN [mg TAN L-1]0 20 40 60 80 100 120 140 160 180
Nitro
gen c
onve
rsion
rate
[g N g
VSS d
-1]
-0,125
-0,075
-0,025
0,025
0,075
0,125
-0,150
-0,100
-0,050
0,000
0,050
0,100
0,150
aerobic TAN consumption aerobic TNN productionaerobic TAN production
(A) 4h (B) 6h C (6h) D(6h) E (6h) F (6h)
SBR SBR SBR SBR SBR SBR
0.038 0.066 0.081 0.105 0.128 0.167
NLR [kg TAN m-3 cycle -1]
Fig. IV.10 Aerobic conversion rates during micro-aerobic phase related to the initial micro-aerobic TAN concentrations
4. Discussion
4.1 Feasibility of SNAD process
This research showed the possible application of the Simultaneous partial Nitritation, Anammox and
Denitrification process for treating both synthetic and industrial wastewaters, such as old landfill leachates,
containing COD and ammonium with a CODbiod/N ratio up to 1. In the batch tests conducted in this study, the
SNAD process successfully occurred and anammox process was combined with nitritation, anaerobic ammonium
oxidation, organic compounds oxidation and denitrification process.
Good results were achieved treating the synthetic wastewater, where no inhibitor compounds were present.
The chosen cycle of the SBR (tcycle=6h, taer=2,5h) was optimal to treat ammonium rich wastewaters, with a
loading rate of 0.067 kgTAN m-3 cycle-1, corresponding to an initial TAN concentration of 66 mg TAN L-1 (Test
SW2). A TAN removal of 100% was achieved, and at the end of the cycle very small quantities of TNN and N-
NO3- were found, resulting in a consistent TN removal (92%). Also a high COD removal was observed (around
at 45%) due to the totally biodegradable organic matter used in the synthetic influent (CH3COONa). The
alkalinity, expressed as CaCO3, and the TAN ratio, in the reactor, at the beginning of the micro-aeration phase
was 7.51, sufficiently high to carry on the nitritation reaction (stoichiometric ratio of nitritation:
CaCO3/TAN=7.07). The filtered COD and TAN ratio, in the reactor, at the beginning of anoxic phase was around
2, enough low to allow the co-existence of denitrifying and anammox bacteria. The overall total ammonia
removal rate (ν TAN aerobic), the total nitrite (ν TNN aerobic) and nitrate (ν NO3-N aerobic) production rate, in
the reactor, during micro-aerobic phase were 0.163gTAN gVSS-1d-1, 0.141TNN gVSS-1d-1 and 0.0033 gNO3-
NgTSS-1d-1 respectively. The resulting consumed TAN and produced TNN ratio was 0.87, instead of 1,
characteristic of nitritation process, as NOBs were not completely inhibited. During the anoxic phase, the overall
Chapter 4
134
total ammonia (ν N-NO3- anoxic) and nitrite (ν TNN aerobic) removal rate were 0.091 g TAN gVSS-1d-1 and
0.137 gTNN gVSS-1d-1 respectively, resulting in a consumed TNN to consumed TAN ratio of 1.5. The ratio
TNN/TAN was higher than the stoichiometric ratio of the anammox process (1.3). We explained these results
considering that denitrification via nitrite occurred during the anoxic phase. Due to the presence of the
biodegradable organic matter, denitrifiers competed with anammox bacteria for nitrite consumption, resulting in
a higher nitrite removal rate (ν TNN anoxic) compared to the anammox reaction. In addition, also denitrification
via nitrate occurred, as showed by both the COD efficiency (Table IV-3) and the NO3-N and COD profiles in the
anoxic phase (Fig. IV.4 - SW2 and Fig. IV.5 - SW2), resulting in a negative anoxic nitrate removal rate (ν NO3-
N - anoxic).
Applying a NLR maximum of 0.067 kg TANm-3cycle-1, at the beginning of the SBR cycle, when the TAN
concentration and the pH were the highest over the cycle, the FA concentrations reached its maximum value
(8 mg NH3-NL -1). The FA value reached was lower than the minimum ammonia inhibition threshold reported in
literature for AOB species. On the contrary, the FA value of 8 mg NH3-NL -1 may partially contribute to inhibit
the NOB species (Anthonisen et al. 1976), even if Kim et al. (2008a) reported different threshold for Nitrobacter
spp. (30 ~ 50 mg NH3-N L-1) and Nitrospira spp. (0.04 ~ 0.08 mg NH3-N L-1) and Turk and Mavinic (1989)
showed an adaptation of the nitrite oxidizing bacteria to NH3, confirmed also by other studies (Villaverde 2000).
During the experiment, the FNA were always lower than 0.0014 mg HNO2-N L-1, not inhibiting either AOB or
NOB.
4.2 SNAD process for treating old landfill leachate
In this study, we showed that despite feeding the reactor with the old leachate, the SNAD process was
feasible, achieving a satisfactory nitrogen and carbon removal when a NLR in the range of 0.038-0.08 kg TAN
m-3cycle-1 was applied. Nevertheless, an acclimatization period to the leachate was necessary, as landfill
leachates are characterized by higher conductivity and dissolved salts values compared to those measured for the
SNAD biomass as well as by the presence of heavy metals, which may inhibit the biological activity. Therefore,
sudden high filling volumes of leachates to the biological system may cause a drastic variation of the
environmental conditions of the biomass, having a negative impact on the microbial activity of nitrifying (Del
Borghi et al. 2003) and anammox bacteria (Dapena-Mora et al. 2007). This effect could be due to an increase of
the osmotic pressure in the medium surrounding the cells, affecting the transport system through the membrane
(Dapena-Mora et al. 2007). Nevertheless, several studies showed that biological systems may be acclimated
gradually to leachate characteristics (Ganigué et al. 2007; Ruscalleda et al. 2010; Xu et al. 2010).
The chosen cycle of the SBR (tcycle=6h, taer=2.5h) was optimal to the old landfill leachate, with a loading rate
of 0.065 kgTAN m-3 cycle-1, corresponding to an initial TAN concentration of 68 mg TAN L-1. However, lower
nitrogen removal efficiencies were achieved treating the landfill leachate compared to the efficiency measured
treating the synthetic wastewater. These findings were explained by the fact that in the raw leachate inhibitory
compounds were present, slightly inhibiting the biomass activities. In particular, the AOBs seems to be more
influenced by the leachate composition (Aktas and Çeçen 2001). The aerobic total ammonia removal rates
(ν TAN aerobic) were comparable in all the tests performed with leachate (A, B and C), but lower (mean values: -
0.140 g TAN gVSS-1d-1) than the values measured in the test SW2 using the synthetic wastewater (-0.163 g TAN
gVSS-1d -1), which had a similar initial TAN concentration in the reactor (65–80mg TANL-1). On the contrary,

Chapter 4
135
the anoxic total ammonia removal rates, after the biomass acclimation, were not negatively affected by the
leachate composition, probably as anammox bacteria were protected from inhibitors by the layer of nitrifiers and
denitrifiers that covers the granule. The nitrate profiles during micro-aerobic phase suggested a low NOBs
activity (ν NO3-N- aerobic). Furthermore, lower COD removal efficiencies were detected treating leachates. It can
be explained taking into account the presence of non-biodegradable or slowly biodegradable organic matter
present in the leachate. The alkalinity/TAN ratio at the beginning of the micro-aeration phase was sufficiently
high (8.8-12) to carry on the nitritation process. During the micro-aerobic phase, the mean produced TNN and
consumed TAN ratio was 0.70 and the produced N-NO3- and consumed TAN ratio was 0.2, as NOB were not
completely inhibited and a small amount of nitrite was converted into nitrate. The filtered COD/N ratio at the
beginning of anoxic phase, when denitrifiers may compete with anammox bacteria, was 3.4. However, we
consider the biodegradable CODbio/N ratio lower than 3.4, due to the low amount of biodegradable fraction
present in the old landfill leachate, thus not compromising the anammox activity. In fact, due to the lower
biodegradable organic matter present in the influent, over the anoxic phase the consumed TNN to consumed TAN
ratio was in the range of 1.2 -1.4. This value was close to the stoichiometry one reported for anammox process
(1.32), confirming the lower activity of the denitrifiers compared to the results obtained using the synthetic
wastewater.
4.3 SBR configuration for SNAD process
The SNAD performance, in terms of nitrogen and carbon removal efficiency, were significantly high
applying a loading nitrogen rate (NLR) in the range of 0.038-0.08 kg TAN m-3cycle-1, while decreased when a
NLR higher than to 0.08 kg TAN m-3 cycle-1, corresponding to an initial TAN concentration of 81 mg L-1, was
applied.
At initial TAN concentrations higher than 80 mg L-1, the lower nitrogen efficiencies were mainly linked the
lower AOBs activity, which were partially inhibited by the high FA concentration at the beginning of the SBR
cycle, when the pH and the TAN reached their maximum values. Concerning the anammox activity, we observed
that at the end of the micro-aerobic period, nitrite concentrations lower than 20 mg TNNL-1 resulted a in
substrate limitation, while repeated nitrite concentrations higher than 20-25 mg TNNL-1 caused losses of
anammox activity due to the nitrite long-term effect. This finding were confirmed in other studies. Bettazzi et al.
(2010) observed that repeated injections of nitrite higher than 30 mg TNNL-1 determined a loss of anammox
activity. The authors also found that the inhibition increased after each spike.
The SBR configuration plays an important role to perform a proper SNAD process. Applying a NLR in the
range of 0.038-0.08 kg TAN m-3cycle-1, the length of both the total SBR cycle and the micro-aerobic and anoxic
phase can be expressed as function of the nitrogen loading rate per cycle. The relation between the NLR and the
SBR configuration found in this study ensured to achieve a partial nitritation process during the micro-aerobic
phase and consequently reach, at the beginning of the anoxic phase, a suitable remaining TAN and produced
TNN ratio for the subsequent anammox process. Then, the anoxic period would be sufficiently long to allow the
depletion of the TAN and TNN by anammox process.

Chapter 4
136
5. Conclusions
This research evaluates the use of SNAD process to treat old landfill leachates. This study was carried out as
an initial step towards development of a continuous SNAD process performed in an SBR under oxygen limited
conditions. First of all, batch studies on synthetic wastewater showed that the simultaneous removal of carbon
and nitrogen from effluents with low C/N ratio was feasible in one single reactor. An integration of partial
nitritation, anammox and heterotrophic denitrification process was successfully achieved at high pH values (7.5
and 8.5) and high temperatures (T = 30°C) under oxygen limited conditions (DO < 0.5 mg L-1). This operative
condition were optimal to treat a nitrogen loading rate of 0.067 kg TANm-3cycle-1, achieving at the beginning of
the micro-aerobic phase a maximum FA concentration of 10 mg NH3-N L-1, which made sure the nitrification
process stopped at the ammonium oxidation step. Further, it was preferable to achieve a maximum nitrite
concentration of 20-25 mg TNNL-1 at the beginning of the anoxic phase, in order to prevent the anammox
bacteria inhibition, due to the nitrite long term effects. Using synthetic wastewaters, where no inhibition
compounds were present, a TAN and TN removal efficiencies of 100% and 92% were observed, respectively. A
high COD removal efficiency was achieved (45%) probably due to ready biodegradable organic matter used in
the synthetic influent (CH3COONa).
A progressive adaptation of biomass from the synthetic wastewater to the raw leachate was carried out via
increasing the filling volumes of the leachate in the SBR. Despite feeding the reactor with the old leachate,
which contained trace of inhibitory compounds and high conductivity values, both the aerobic ammonia
oxidizing - and anammox bacteria showed high microbial activity values after a biomass acclimatation to the
landfill. Acceptable SNAD performance, in terms of nitrogen and carbon removal efficiency, were achieved
applying a loading nitrogen rate (NLR) in the range of 0.038 – 0.08 kgTANm-3cycle-1. However, the overall
nitrogen and carbon removal efficiencies using leachate were lower compared to the efficiencies detected using
the synthetic wastewater. This could be explained taking into account both the high AOBs sensitivity to the
inhibitory compounds present in the leachates and the lower biodegradable organic matter present in the leachate
with respect to the synthetic wastewater, that also reduce the total nitrogen removal efficiency. Anammox
activity was found to be not negative affected by leachate treatment probably as anammox bacteria were
protected from inhibitors by the layer of nitrifiers and denitrifiers that covers the granule.
To design an optimal nitrogen and carbon removal in a SNAD-SBR systems, the characteristic of
wastewaters, the microbial activity and the reactor operative conditions (i.e. pH, T, DO, concentration of TAN,
FA and TNN) should be take into account. In this study, concerning the leachate treatment, a relation between
the nitrogen loading rate per cycle and the SBR configuration was determined in order to achieve a suitable
partial nitrification during the micro-aerobic phase followed by a proper anammox process during the anoxic
phase. However, this finding were wastewater and biomass specific as the performance of the SNAD process
depends on the activity of the each group of microorganisms involved and on their interactions. Similar tests
could be useful during the design and management of the SNAD-SBR, in order to apply the optimal SBR
configuration and achieve high nitrogen removal efficiencies in a continuous SNAD process.

Chapter 4
137
Acknowledgements
The authors gratefully acknowledge Adriano Joss from EAWAG (SWZ) and Mrs Sabine Burger from ERZ
Entsorgung + Recycling Zürich, (SWZ), for providing the SNAD sludge. The authors wish to thank Mr.
Fontanari from WWTP of Rovereto, Trento, Italy, for providing the old landfill leachate samples and Ms M.
Cadonna from the laboratory of ADEP, Trento, Italy for her precious advices in leachate chemical
characterization. The authors thanks C. Salomon, R. Graziola, L. Penasa and S. Pedrotti from the “Servizio
Elettronico e di Progettazione” for their practical assistance in developing the monitoring system and technical
support. Finally, the authors wish to thanks the master students V. Miotto and R. Burli from the University of
Trento, which worked on the biological leachate characterization and treatment.
Supplementary Material
Further details concerning the characteristic of the synthetic wastewater and the old landfill leachate as well
as the acquisition and control hardware and software.

Chapter 4
138
Supplementary Table
Supplementary Table IV-1 Characteristics of the synthetic wastewater Parameter This study
[g L -1]
NH4 Cl 3.41 KHCO3 8.50 CH3COONa 1.38
Medium Composition* CaCl2 2H2O 0.30
MgSO4 7H2O 0.20 FeSO4 0.00625
EDTA 0.00625
KH2PO4 0.0250 Trace elements solution* 1.25 mL L–1
Trace element composition (1L)* ZnSO4 · 7H2O 0.43 MnCl2 · 4H2O 0.99
CuSO4 · 5H2O 0.25 NaMoO4 · 2H2O 0.22 NiCl2 · 6H2O 0.19
H3BO4 0.014 * adapted by * Thirds et al. 2001

Chapter 4
139
Supplementary Table IV-2 Characteristics of the raw leachate from the municipal wastes landfill site of Trento city. (Italy)
Parameter This study old landfill leachate [mg L-1] (Kjeldsen et al. 2002; Kurniawan et al. 2006b)
CONDUCTIVITY [mS cm-1] 10.7±1 -
REDOX [mV] 30±10 -
pH 8.1±0.1 7.5 - 9
TSS [mg L-1] 123 ± 129 -
CODtotal [mg L-1] 1444 ± 86
CODfilt 0.45 µm [mg L-1] 1307 ±193* 5.000-20.000
CODtoluble* [mg L-1] 1237 ± 125+
CODbio** [mg L -1] 250**
BOD5 [mg L-1] 70±17 20-1.000
RBCOB [mg L-1] 21**
TOTAL AMMONIUM NITROGEN (TAN filt ) [mg L-1] 1241±136+ 400-5000
TOTAL NITRITE NITROGEN (TNN) [mg L-1] <0.04* -
NITRATE (NO3-N) [mg L-1] 10±2* -
TOTAL KJELDAHL NITROGEN (TKN) [mg L-1] 1288±169 -
ORGANIC NITROGEN (Norg) [mg L-1] 57±39 -
TOTAL PHOSPHORUS (P) [mg L-1] 14±2 6
SULFATE[mg L-1] 1200* 10-420 ALKALINITY (CaCO 3) [mg L-1] 7.000 – 15.000* -
HYDROGEN SULFIDE (H2S -)[mg L-1] 0.04* - Fe(II) [mg L-1] 2,1* - Fe(III) [mg L-1] 1,8*
Mn(II) [mg L-1] 0,9* - ALUMINIUM [mg L -1] 0.42 0.1* - ARSENIC (As) [mg L-1] <0.08* 0.01-1
BARIUM (Ba) [mg L-1] 0.39±0.03* -
BORON (Bo) [mg L-1] 5.6±0,79* -
CADMIUM (Cd) [mg L-1] <0.005* 0.005
CHROMIUM (Cr) [mg L-1] 0.21±0.04* 0.28
IRON (Fe) [mg L-1] 3.8±0.44* 3 - 280
LEAD (Pb) [mg L-1] <0.04* 0.09
MANGANESE (Mn) [mg L-1] 0.1±0.007* 0.03-45
MERCURY (Hg) [mg L-1] <3.0* 0.00005-0.16
NICKEL (Ni) [mg L-1] 0.1±0.015* 0.17
ZINC (Zn) [mg L-1] 0.18±0.15* 0.03-4
COPPER (Cu) [mg L-1] 0.01±0.002* 0.065
SELENIUM (Se) [mg L-1] <0.003* -
STANNUM (Sn) [mg L-1] 0.06±0.006* - *values after filtration 0.45 µm
**values determined by respirometric analysis
+values determined after ultrafiltration 0.45 µm and 0.2 µm
Supplementary Table IV-3 FP-AI-110 channel configuration FP – AI -110 - FieldPoint analog input module with eight analog voltage or current input channels, 16-bit resolution
Device Description Physical channel
Channel Name
output range Work range Work measure
pH sensor on-line reactor pH AI0 Numeric 1
pHr ±21.5 mA 4 – 20 mA 4 -10
DO sensor on-line reactor DO AI2 Numeric 2 DOr
±21.5 mA 4 – 20 mA 0-10 mg L-1
ORP sensor on-line reactor ORP AI3 Numeric 3
ORPr ±21.5 mA 4 – 20 mA -1000 - + 1000 mV
Temperature sensor
on-line reactor Temperature
combined with DO sensor AI4
Numeric 4 TDOr
±21.5 mA 4 – 20 mA 5 - 40 °C
free - AI4 ±21.5 mA
free - AI5 ±21.5 mA free - AI6 ±21.5 mA free - AI7 ±21.5 mA

140

Chapter 5
141
V. Chapter
Simultaneous partial Nitritation,
Anammox and Denitrification (SNAD)
process at moderate temperature treating
anaerobic digester effluent
This chapter was based on:
Langone M., Andreottola G., Cadonna M. (2013). Simultaneous partial Nitritation, Anammox and
Denitrification (SNAD) process at moderate temperature treating anaerobic digester effluent. Submitted

Chapter 5
142
Simultaneous partial Nitritation, Anammox and Denitrification (SNAD) process at moderate temperature treating anaerobic digester effluent
Michela Langonea, Gianni Andreottolaa , Maria Cadonnab
a Department of Civil, Environmental and Mechanical Engineering, University of Trento, Via Mesiano 77, Trento 38123, Italy b Servizio Opere Igienico-Sanitarie, Provincia Autonoma di Trento, via Pozzo 6, 38100, Italy
ABSTRACT
The integration of the nitritation, anammox and heterotrophic denitrification via nitrate and nitrite was investigated at moderate temperature (T=25°C). Treating a synthetic wastewater, a mean nitrogen removal rate of 0.14 g NL-1d-1 was registered and high total ammonium (97%), total nitrogen (93%) and organic matter (77%) removal efficiencies were obtained. High removal efficiencies were also achieved treating anaerobic digester effluent, but a higher nitrate accumulation occurred in the system, due to the lower biodegradable COD and pH in the influent. The influent carbon-nitrogen ratio governs the contribution of denitrification over the anammox process and the total nitrogen removal efficiency of the SNAD process. At moderate temperature, a proper control of the free ammonia levels, and thus of pH, seemed to be a key factors of the nitratation inhibition together with the oxygen limiting conditions. A new primer set, targeting the hao/hzo gene, was applied for the identification of the anammox bacteria.
Keywords:Anaerobic digester effluent, Anammox, hzo/hao gene; SNAD, Sequencing Batch Reactor, Temperature
Abbreviations Parameters Reactor Configurations and process Operative COD Chemical Oxygen Demand CANON Completely Autotrophic Nitrogen removal Over Nitrite DO Dissolved Oxygen CODtot Total COD CAS Conventional Activated Sludge HRT hydraulic retention times CODfiltr Filtrate COD DEMON Deammonification process KLa mass transfer coefficient for oxygen CODsoluble Soluble COD GSBR Granular Sequencing Batch Reactor NLR Nitrogen Loading Rate CODbio Biodegradable COD GSB-ANR Granular Sludge Bed reactor NRR Nitrogen Removal Rate CT cycle number PCR MAP Magnesium-Ammonia-Phosphate OLR Organic Loading Rate FA Free Ammonia (NH3- N) OLAND Oxygen-Limited Autotrophic Nitrification/Denitrification VER Volume Exchange Ratio FNA Free Nitrous Acid (HNO2-N) SHARON Single reactor High activity Amm. Removal Over Nitrite ORP Oxidation-Reduction Potential
MLSS ̴ Mixer Liquor Suspend Solid SNAD Simultaneous partial Nitritation, Anammox, Denitrification
EC Conductivity
N Nitrogen SND Simultaneous Nitrification and Denitrification SAUR Specific Ammonia Uptake Rate NO3
--N Total Nitrate Nitrogen RBC Rotating Biological Contactors SNUR Specific Nitrite Uptake Rate RBCOD Readily biodegradable COD SBBR Sequencing Batch Biofilm reactors SAA Specific Anammox Activity TAN Total Ammonia Nitrogen SBR Sequencing Batch Reactors SOUR Specific Oxygen Uptake Rate TNN Total Nitrite Nitrogen WWTP Wastewater Treatment Plant
TKN Total Kjeldahl Nitrogen PCR real time
Real-time polymerase chain reaction
TSS Total Suspend Solid AOB Ammonia-Oxidizing Bacteria TM melting temper NOB Nitrite-Oxidizing Bacteria VSS Volatile Suspend Solid Anammox ANaerobic AMMonia -OXidizing Bacteria
1. Introduction
Anaerobic digestion is widely applied throughout the world for the treatment of wastes and wastewaters and it is
the most sustainable approach for the sludge stabilization. In the anaerobic digester reactor, the biodegradable
organic carbon (COD) in the influent is converted to methane, which may be used for electricity and heat
purposes. Ammonium (TAN) is not removed and therefore the anaerobic digestion process generally yields an
ammonium-rich effluent (containing about 500-600 mg TANL -1), low in biodegradable COD content and
characterized by a low COD/N ratio. Those characteristics make anaerobic digester effluents more difficult to
apply a conventional way of nitrogen removal via the nitrification–denitrification processes.
Generally, the effluent of the anaerobic digestion plant is recirculated, after a dewatering treatment, to the
conventional activated sludge (CAS) tanks in the wastewater treatment plants (WWTPs). Although it is a

Chapter 5
143
consolidated practice, it has significant effects on the cost balance of the WWTPs. Indeed, digester effluent may
contain reducing and inhibitory compounds, which could compromise the whole efficiency of the CAS systems.
Then, the high nitrogen concentrations of the anaerobic digester effluent require, in the CAS system, a large
amount of electricity to provide enough oxygen for nitrification. Further, the amount of COD contained in these
anaerobic effluents is usually not enough to carry out the removal of nitrogen by the conventional nitrification-
denitrification processes and organic matter source should be added for the denitrification stage. A study of the
nitrogen balance of the urban WWTP of Trento, Italy, shows that a significant fraction of the inlet nitrogen load
(15-20%) is recycled with the return liquors from sludge dewatering to the main stream, even if it contributes
only a small amount (1%) to the influent water flow (Fig. V.1). The results of this study are also comparable to
the results of other researches (Mulder et al. 2001; Fux et al. 2002; Fux and Siegrist 2004).
0
500
1000
1500
2000
250010000
15000
20000Flow rate [m3 d-1]Nitrogen Load [kg N d-1]COD Load [kg COD d-1]
Influent WWTP Anaerobic digester effluent
15% 1%1%
Fig. V.1 N-balance without treatment of anaerobic digester effluent
In the last decades, many efforts have been made to optimize the anaerobic digestion output management. A
dewatering post–treatment is however required. Both a liquid and a solid stream, with different final pathway,
are obtained. According to national and local regulations, the solid fraction is generally disposed to landfill,
when it cannot be used in agriculture. The anaerobic digester supernatant is commonly directed back to the
WWTPs. Due to the high concentration of nitrogen, a separate treatment of the digester supernatant would
significantly reduce the nitrogen load of the main stream, improving the nitrogen elimination and reducing the
operative costs.
Chemical elimination of ammonium with Magnesium-Ammonia-Phosphate (MAP) precipitation, or with air
stripping are feasible but more expensive than conventional biological process, by means of nitrification and
denitrification with addition of an organic carbon source (Mulder 2003). To this end, several innovative
biological nitrogen removal processes and technologies have been developed, such as the simultaneous
nitrification and denitrification (SND) via nitrate (Collivignarelli and Bertanza 1999), simultaneous nitrification
and denitrification (SND) via nitrite (Zeng et al. 2004), the combined SHARON (single reactor system for high
activity ammonium removal over nitrite) and the anammox process in two independent units (Van Dongen et al.
2001b; Furukawa et al. 2009; Vázquez-Padín et al. 2009b). The possibility to combine the nitritation with the
anammox process for treating anaerobic digester effluents in one single stage has also been investigated: the
completely autotrophic nitrogen removal over nitrite process (CANON) (Vázquez-Padín et al. 2009c), the
deammonification process (DEMON) (Wett 2007), the simultaneous nitritation, anammox and denitrification

Chapter 5
144
(SNAD) process (Joss et al. 2009; Zhang et al. 2012). SNAD process consists in a biological innovative
treatment based on a partial biological autotrophic oxidation of ammonium to nitrite (nitritation) coupled and
followed by an autotrophic anaerobic ammonium oxidation via nitrite (anammox). Further, both the oxidation of
the biodegradable COD and the anoxic denitrification of NO2− or NO3
− to gaseous N2 by heterotrophic
microorganisms occur, using the small amount of the organic matter in the influent as carbon and energy source.
Recently, significantly high nitrogen removal rate (NRR) were achieved treating synthetic wastewater and using
a granular sludge bed reactor (GSB-ANR process) at high temperature (T=30°C) to perform the autotrophic
nitrogen removal processes in a single reactor (Wang et al. 2012). The authors reached a NRR of 2.57 kg N m-3d-
1, which was significantly higher than the level reported for the autotrophic nitrogen removal processes in “1
single reactor” systems. Nevertheless, the organic carbon in the synthetic wastewater was not present. Generally,
the presence of organic carbon could affect the anammox bacteria activity, either as organic carbon could be
inhibitory (Chamchoi 2008) or heterotrophic denitrifiers can be competitive with anammox bacteria for the
utilization of nitrite (Kumar and Lin 2010).
Different studies have been carried out in order to enhance the co-existence of different bacteria, which live
in different environmental conditions (Table IV-1). Lan et al., (2011) studied the simultaneous partial
nitrification, anammox and denitrification (SNAD) process for ammonia removal from a synthetic wastewater,
characterized by a low COD/N ratio, using a SNAD seed sludge collected from a biological treatment unit
(aeration tank) of a full-scale landfill-leachate. The authors investigated the influence of hydraulic retention
times (HRT = 3 - 9 d) on the performance of a granular sequencing batch reactor (GSBR), operating under high
temperatures (T=35°C) and oxygen limitation (DO = 0.5-1.0 mgL-1). De Clippeleir et al. (2009), treating
synthetic wastewater in a sequential batch reactor (SBR) showed that a low critical minimum settling velocity
(0.7 mh-1) and a low volumetric exchange ratio (25%) were essential to ensure a fast start-up of a simultaneous
nitritation, anammox denitrification process, reaching a nitrogen removal rate of 1.1 g N L-1d-1.
Vlaeminck et al. (2009b) showed the feasibility to treat digested black waters from vacuum in a lab-scale
oxygen-limited autotrophic nitrification/denitrification (OLAND) rotating biological contactor (RBC). Working
on the nitrite oxidizing bacteria inhibition at free ammonia levels above 3 mg N L−1, the authors achieved a
stable nitrogen removal rate. Zhang et al. (2012) applied a completely autotrophic nitrogen removal over nitrite
(CANON) process using a sequencing batch biofilm reactor (SBBR) at 30°C, to remove nitrogen and organic
carbon from a swine digester liquor reaching a nitrogen removal rate of about 0.1 kg Nm-3d-1, showing the
importance of a low C/N ratio (< 1.2).
Nevertheless, the sequencing batch reactor (SBR) is one of the most applied reactor configuration for treating
the anaerobic digester effluents. A first full-scale application of the nitritation, anammox and denitrification
process treating anaerobic digester effluents was implemented by Wett (2007). The author developed the
deammonification technology (DEMON) in an SBR treating the anaerobic digestion effluent at the WWTP Strass
(Austria) with a nitrogen load up to 0.68 kgN m-3 d-1 and high temperature (T=30°C). It consisted in a pH-
controlled process on the intermittent aeration phase. Ensuing a low DO concentration in the system, the pH-
controlled process simultaneously allowed both to repress the second oxidation step from nitrite to nitrate and to
develop the anammox process. The results showed a 40% saving on oxygen consumption with respect to a CAS
system and the specific energy demand was reduced from 2.9 kWh kgN-1 to 1.16 kWh kgN-1, comparing to about
6.5kWh kgN-1 of the mainstream treatment. The presence of anammox bacteria and the high microbial diversity
in this system had been later confirmed by Innerebner et al. (2007). In Zürich, Switzerland, the partial nitritation,

Chapter 5
145
anammox and denitrification process in an SBR, which relied on online measurements of ammonium,
conductivity, and oxygen and employed one feeding per cycle under oxygen limitation and high temperature
(T=30° C), was developed by Joss et al. (2009). The co-existence of nitrifying, anammox and denitrifying
bacteria had been then demonstrated (Langone et al. 2013b).
However, few studies are present at moderate temperature (Table V-1). Vázquez-Padín et al. (2009a) treated
the supernatant of an anaerobic digester at 20 °C in an one single stage granular SBR, with a mean granules
diameter of 3 mm. In an SBR working with an hydraulic retention time (HRT) of 0.25 d, operating at a dissolved
oxygen concentration of ~3 mg L-1 and a continuous feeding, a mean nitrogen removal rate of 1 kg Nm-3d-1 was
reached, achieving a total nitrogen removal efficiency of 60%. Vázquez-Padín et al. (2009b) treated an anaerobic
digester effluent by a CANON system, operating at room temperature (20–24°C) in an air pulsing reactor. The
biomass was composed by flocs and granules with an average diameter of 1.6 mm. The authors, working at
limiting dissolved oxygen conditions (DO=0.5 mg L-1) and HRT of 0.5 d, reached a maximum nitrogen removal
rate of 0.45 kgNm-3d-1 and a total nitrogen removal between 35 and 64%.
Table V-1 Overview of typical innovative nitrogen removal processes in SBR applied to anaerobic digester effluent and synthetic wastewater
Reference De Clippeleir et
al. 2009 Lan et
al. 2011 Wett 2007
Joss et al 2009
Vázquez-Padín et al 2009b
Vázquez-Padín et al 2009a
Wastewater Synthetic
wastewater Synthetic
wastewater Digester effluent
Digester effluent
Digester effluent
Digester effluent
CODbio/N 0 1:2 1:3 1:2 1:1.2 nd
Reactor type SBR GSBR SBR SBR SBR GSBR
Volume 2.5 L 18 L 500 m3 1400 m3 1.5L 1.5L
SBR configuration 1h cycle 24h cycle 8h cycle 6-8h cycle 5.75h cycle 3 h cycle
Fill instantaneous continuous continuous instantaneous continuous continuous
Aeration mode continuous continuous intermittent continuous Air pulsing Air pulsing
DO [mg L-1] 0.3-0.7 0.5 – 1.0 0.2-0.3 <0.8 0.1 -2 2.7
Inoculum OLAND biomass SNAD sludge
activated sludge
activated sludge + anammox
granular nitrifying + anammox
granular heterotrophic
HRT [d] 0.2 d 3 d 4* 1.45* 0.5 0.25
pH >7.4 7-8 7.0 - 7.1 7.1 ±0.1 7.5-7.9 -
T [°C] 33±1 35 27.8 ±1 30±3 20-24 20
VSS [g L-1] 2.3 - 3 3.6 1.5 – 4.5 5
OLR [g COD L -1 d-1 ] 0 0.033 0.14* 0.2* - -
NLR [g TN L -1 d-1 ] 1.5* 0.066 0.43* 0.45* 0.7 1.6*
Removal rate [g TN L -1 d-1 ]
1.1 0.061* 0.37* 0.42* 0.25-0.45 1.0
TN tot removal [%] 73%* 92,6%
(85% PN+ Amx; 7,3% Den)
85.8% 94.6* 35 - 64% 60%
TAN removal [%] - 93% 90.3% 95%* nd nd
COD removal [%] 0 72% 56%* 37%* nd nd
PN= Partial Nitritation, Amx= Anammox, Den= Denitrification
The present study aimed to determine the operational key factors so as to investigate the effect of the high
and moderate temperature on an SBR system performing a simultaneous nitritation, anammox and denitrification
process. Further, the feasibility of the application of the SNAD-SBR to the anaerobic digested liquor treatments
at moderate temperature (T=25°C) was investigated. A new primer set targeting the hao/hzo was used for the
identification of the anammox bacteria. During the experiment the biomass activities were monitored and the
contribution of each biological process involved in the SNAD-SBR was investigated.

Chapter 5
146
2. Materials and Methods
2.1. Feeding media and supernatant from anaerobic digester
In this study, the synthetic wastewater was prepared according to Third et al., (2001) and adapted for the
SNAD process, thus no nitrite was added while a carbon source and alkalinity were introduced in the medium.
The synthetic wastewater composition was similar to that of digester supernatants, in terms of total ammonia
nitrogen (TAN = 425±50 mgL-1) and total soluble organic matter (CODsoluble = 293±112 mgL-1) content.
Ammonium, as NH4Cl, was added to the medium in the required amounts and alkalinity, as KHCO3, was
introduced according to the nitritation stoichiometry. COD, as CH3COONa, was added in a low soluble COD to
N ratio (0.5). The total soluble COD was entirely biodegradable, as we used acetate as a carbon source. The
composition of the synthetic wastewater is reported in the Supplementary Table V-1.
The real wastewater used in this study was collected from the dewatering system treating the anaerobic
digesters sludge of the municipal Wastewater Treatment Plant (WWTP) in Trento, Italy, in the spring and
summer season of 2012. The supernatant was stored at 4°C in order to prevent the COD and nitrogen
degradation. The supernatant composition was characterized by a seasonal pattern with a higher biodegradability
during the spring period compared to the summer period. The total COD measured during the spring and the
summer period was 364 mg CODL-1 and 320 mg CODL-1, respectively, while the total ammonia concentration
was 384 mg TANL-1 and 480 mg TANL-1, respectively. Concerning the biodegradability, it was measured that
the biodegradable COD (CODbio) during the spring and the summer period was 175 mg L-1 and 145 mg L-1,
respectively, while the readily biodegradable COD (RBCOD) was 89 mg L-1 and 7 mg L-1, respectively. The
COD/N ratio was 0.5 – 0.6 during the summer time, when environmental temperatures of 30 degrees Celsius
were achieved, with peaks of 0.8 - 0.9 during the spring time, when the environmental temperature was about 25
degrees Celsius. The main characteristics of the supernatant used for the present study are given in the
Supplementary Table V-2.
2.2. Seed sludge
The SNAD seed sludge was collected from a biological treatment unit (SBR) of the full-scale Municipal
Wastewater Treatment Plant, Zürich (Switzerland). The SBR treated the digester supernatant, at high
temperature (T = 30°C). The operating conditions of the full scale SBR (V = 1400 m3) were: DO <0.8 mgL-1,
pH 7.1±0.2, T ̴ 30°C, MLSS ̴ 3.6 kg/m3, N- load ̴ 0.625 kg Nm-3 d, HRT ̴ 1.45 d. In the Zürich SBR, the
partial nitrification, anammox and denitrification process was full achieved (Joss et al. 2009). The seed sludge
contained granules surrounded by a matrix of brownish flocs. Two kinds of granules (red and brown) could be
distinguished. The granules had diameters between 0.5 and 2.0 mm. Molecular analysis of the original inoculum
showed the presence of ammonia-oxidizing bacteria of the Nitrosomonas europaea/eutropha group, anaerobic
ammonium-oxidizing bacteria of the “Candidatus Brocadia fulgida” type and denitrifying bacteria related to the
Thauera and Pseudomonas. Nitrite-oxidizing bacteria from the genus Nitrobacter were also detected (Langone et
al. 2013b). The authors showed long filamentous - shaped microorganisms were dominant in the outer layer of
the granules, while single cells as well as aggregates were trapped in a net of filamentous bacteria.

Chapter 5
147
2.3. Experimental lab scale reactor
SBR reactor. A lab scale (8 L) Sequence Batch Reactor (SBR) was inoculated with the SNAD sludge from
the SBR in Zürich that removed organic matter and nitrogen from an anaerobic digested plant at T = 30°C. In
this study, the 8 L SNAD-SBR was operated with first the synthetic wastewater and then the anaerobic digester
supernatant from the municipal WWTP of Trento, Italy. Fig. V.2 shows the reactor setup. The cylindrical reactor
(working height 0.295 m, inner diameter 0.189 m) made of acrylic plastic had a minimum and a maximum
operating volume of 7.0 and 8 L, respectively. It was water-jacketed, allowing the mixed liquor temperatures to
be controlled by a thermostated circulating water bath. The reactor was equipped with a mechanical stirrer to
ensure a complete but mild mixing, at low rpm (150), to minimize the size granule reductions. The reactor was
also equipped with acid/base pumps and a set of three peristaltic pumps to introduce the feeding solution and to
discharge the effluent and eventually the sludge. Aeration was carried out by n. 6 air diffusers placed at the
bottom part of the reactor. Air was supplied by a Schego M2K3 350 air pump and the gas-flow was maintained
constant at 50 nL h-1 using a mass-flow meters.
The mass transfer coefficient for oxygen (KLa) was calculated and fixed at a sufficiently high value
(0.15 min-1 at 20°C), in order to ensure the dissolved oxygen set-point can be attempted with the on/off control
(Sin et al. 2004). The DO set-point was fixed at a set point value of 0.2 ±0.1 mgO2 L-1, inhibiting the activity of
the nitrite oxidizing bacteria (NOBs) over the ammonia oxidizing bacteria (AOBs), due to the lower oxygen
affinity of NOBs (Wiesmann 1994). The pH was controlled, allowing to vary in a wide range (7.3 - 8.5) by the
addition of acid (1 N HCl) and alkaline (1 N NaOH) solutions.
During the experiment, the total suspended solids (TSS) concentration of the whole sludge varied between 3 -
4 g TSSL-1. The volatile suspended solids (VSS) were about 70% of the total suspended solids (TSS). In the
SBR, a high biomass retention was obtained by choosing a suitable settling time in order to have a minimum
biomass settling velocity of 0.7 m h-1, which is the ratio between the vertical distance from the water surface to
the effluent discharge point and the settling time (Vlaeminck et al. 2009a). This value means that bio-particles
having a settling velocity lower than 0.7 m h-1 could be withdrawn through the discharge effluent.
The pH and the ORP were measured using Crison Instruments electrodes, (mod. 53.35 and 53.55,
respectively, Crison Instruments Italy). The dissolved oxygen (DO) was measured using a polarographic cell
(mod. 60.50 Crison Instruments, Italy) while the conductivity was measured using a conductivity (EC) meters
(mod. 53.88 Crison Instruments, Italy). Finally, the temperature was measured both by the PT 100 included in
the DO sensor T(DO), and by the PT 1000 included in the conductivity meters T(CE).

Chapter 5
148
Airpump
InfluentPump pH
O2,TORP
Effluent Pump
Sludge Extraction
Criostat
Tank
WL
Influent
Effluent
PC(Store data and control)
Relè
Base/AcidPump
Mixer
CDAQAcid/Alcaline
Tank
Tank
MassFlow meters
4 - 20 mA
EC
Fig. V.2 Schematic representation of the 8L lab-scale SBR.
SBR cycle. The SBR was operated with three 8 h operational cycles per day, according to the scheme described
in Fig. V.3. The reactor was operated with a fixed residual volume of ~7.0 L, which resulted in a volumetric
exchange ratio of ~12% per cycle and a hydraulic residence time of 2.7 - 3 d.
Each cycle consisted of 480 min and of six different phases: filling, micro-aerobic reaction, anoxic reaction,
settling, drawing and idle. The cycle started with a short feeding (6.6 min) during a mixing period of 10-15 min
followed first by a 120-210 min micro-aeration and mixing phase and then by a 234-325 min anoxic and mixing
phase. After the completion of these 3 steps, the biomass was allowed to settle for 7 min. The cycle ended with a
12 min window for the effluent discharge and eventually for the sludge wastage. The sludge wastage phase could
be set by choosing how often, the volume and the mode of the sludge discharge: either at the end of the settling
phase, extracting a concentrated sludge or at the end of the last mixing phase, discharging a mixed sludge. A
final idle interval was optional. Both the filling and the drawing phases were considered to occur in an instant.
The filling phase was mixed and short, creating conditions under which the growth rate was higher for floc-
formers than for filaments (Artan and Orhon 2005), in order to improve the granulation process. The short filling
phase also ensured that the biomass was exposed initially to a high nitrogen load (NLR), and consequently to a
high concentration of Free Ammonia (FA), inhibiting the Oxidizing Bacteria (NOB) (Anthonisen et al. 1976),
which perform the aerobic oxidation of nitrite to nitrate. The filling phase was mixed and non-aerated and
inserted into a short idle period where no oxygen was added, in order to allow the consumption of i) residual
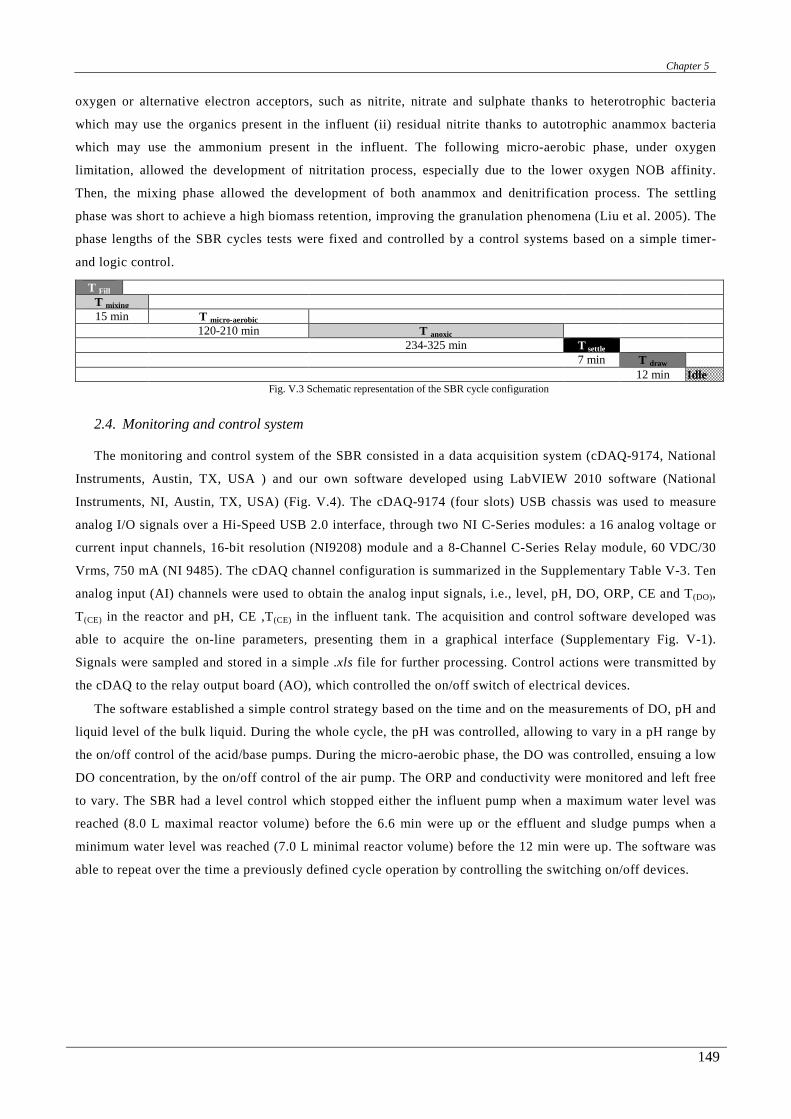
Chapter 5
149
oxygen or alternative electron acceptors, such as nitrite, nitrate and sulphate thanks to heterotrophic bacteria
which may use the organics present in the influent (ii) residual nitrite thanks to autotrophic anammox bacteria
which may use the ammonium present in the influent. The following micro-aerobic phase, under oxygen
limitation, allowed the development of nitritation process, especially due to the lower oxygen NOB affinity.
Then, the mixing phase allowed the development of both anammox and denitrification process. The settling
phase was short to achieve a high biomass retention, improving the granulation phenomena (Liu et al. 2005). The
phase lengths of the SBR cycles tests were fixed and controlled by a control systems based on a simple timer-
and logic control.
2.4. Monitoring and control system
The monitoring and control system of the SBR consisted in a data acquisition system (cDAQ-9174, National
Instruments, Austin, TX, USA ) and our own software developed using LabVIEW 2010 software (National
Instruments, NI, Austin, TX, USA) (Fig. V.4). The cDAQ-9174 (four slots) USB chassis was used to measure
analog I/O signals over a Hi-Speed USB 2.0 interface, through two NI C-Series modules: a 16 analog voltage or
current input channels, 16-bit resolution (NI9208) module and a 8-Channel C-Series Relay module, 60 VDC/30
Vrms, 750 mA (NI 9485). The cDAQ channel configuration is summarized in the Supplementary Table V-3. Ten
analog input (AI) channels were used to obtain the analog input signals, i.e., level, pH, DO, ORP, CE and T(DO),
T(CE) in the reactor and pH, CE ,T(CE) in the influent tank. The acquisition and control software developed was
able to acquire the on-line parameters, presenting them in a graphical interface (Supplementary Fig. V-1).
Signals were sampled and stored in a simple .xls file for further processing. Control actions were transmitted by
the cDAQ to the relay output board (AO), which controlled the on/off switch of electrical devices.
The software established a simple control strategy based on the time and on the measurements of DO, pH and
liquid level of the bulk liquid. During the whole cycle, the pH was controlled, allowing to vary in a pH range by
the on/off control of the acid/base pumps. During the micro-aerobic phase, the DO was controlled, ensuing a low
DO concentration, by the on/off control of the air pump. The ORP and conductivity were monitored and left free
to vary. The SBR had a level control which stopped either the influent pump when a maximum water level was
reached (8.0 L maximal reactor volume) before the 6.6 min were up or the effluent and sludge pumps when a
minimum water level was reached (7.0 L minimal reactor volume) before the 12 min were up. The software was
able to repeat over the time a previously defined cycle operation by controlling the switching on/off devices.
T Fill T mixing 15 min T micro-aerobic
120-210 min T anoxic 234-325 min T settle 7 min T draw
12 min Idle Fig. V.3 Schematic representation of the SBR cycle configuration

Chapter 5
150
A. Data acquisition hardware (cDAQ) B. Main set up parameters (DO, pH, Level)
C. Manual control D. Time control
Fig. V.4 SBR monitoring and control system. (A) Data acquisition and control hardware (cDAQ). From (B) to (D) Screenshots of the data acquisition and control software developed using LabVIEW 2010 software: (B) main control section: pH, DO and Level; (C) manual control; (D) time control.
2.5. Pilot-plant operation experimental set-up and operation
The experiment conducted on the SNAD-SBR was divided into two periods. In Period I the reactor was fed
with the synthetic wastewater and the effect of the temperature on the SNAD process was investigated at 30°C
(Step 1) and 25°C (Step 2). In Period II, the liquid temperature inside the SBR was maintained at 25°C and the
reactor was fed with a mixture of the synthetic wastewater (the concentration of total nitrogen ammonia and
biodegradable organic matter was maintained at around 425±50 mgL-1 = 293±112 mgL-1, respectively) and the
anaerobic digestion effluent from the urban WWTP in Trento, Italy. The proportion of the anaerobic digestion
effluent in the feed progressively increased during the whole period from 20%v/v until the 100%v/v of raw
digested effluent.
The nitrogen loading rate (NLR) was set at a value of 0.12 – 0.15 kgN m-3 d-1 during the whole experiment.
Lower NLRs were applied for a short period of time (< 5 days) at the beginning of the different reactor operating
conditions. During Period I, the reactor suspended solids concentration was about 3-3.5 g TSS L-1, while the
volatile suspended solids (VSS) were about 70% of total suspended solids (TSS). During Period II a low amount
of SNAD biomass was introduced in the reactor and the reactor suspended solids were 4.10 g TSS L-1. In each
period, concentrations of COD, TAN, total nitrite nitrogen (TNN) and nitrate (NO3-N) were measured per half
hour over some specific 8h cycles, to study in more detail the processes and the conversion of the C and N
species.
The maximum activity of aerobic and anaerobic ammonium oxidizing-, aerobic nitrite oxidizing- and
denitrifying bacteria were measured in the Period I. Moreover, in each period, concentrations of COD,

Chapter 5
151
ammonium, nitrite and nitrate were synchronously measured per half hour over some specific 8h cycles, to study
in more detail the processes and the conversion of the C and N species.
2.6. Potential specific activity assays
Activity assays were conducted in order to determine the potential activities of aerobic ammonia- and nitrite-
oxidizing bacteria (AOBs and NOBs), anaerobic ammonium oxidizing bacteria (anammox) and denitrifying
bacteria, considering both denitrification via nitrate and via nitrite. The activity assays were performed during
the reactor operations in Period I. Prior to the activity tests, the biomass, taken from the reactor, was washed 3-5
times with tap water, devoid of oxygen, to remove residual dissolved reactor compounds. The last sludge wash
was performed using HEPES 20 mM as a buffer solution at the desiderate pH. Activity was determined
performing specific batch tests for each biomass and by measurement of the rate of substrates consumption. To
this end, samples (5 mL) were taken at regular intervals from the batch tests, filtered through a 0.45 µm-pore-
size filter, and analyzed for TAN, TNN, NO3--N and COD. Measurements were performed as described below
over a time span of 3-4 h with a sampling interval of 30 min.
2.6.1. Aerobic activity assays
Aerobic experiments were conducted to evaluate the potential specific activity of AOBs and NOBs at 20°C.
The tests were performed with a respirometric assay in order to compare the experimental results in terms of
ammonia uptake rate (AUR), nitrite uptake rate (NUR) and oxygen uptake rate (OUR). A detailed description of
the procedure for OUR calculation using a respirometer can be found elsewhere (Spanjers et al. 1998). However,
the OUR reported in this work correspond to the exogenous OUR obtained subtracting the endogenous OUR
value to the total measured OUR. The dissolved oxygen (DO) consumption was recorded on-line. For each test,
the VSS concentration was evaluated and the specific AUR (SAUR), NUR (SNUR) and OUR (SOUR) were
obtained dividing the AUR, NUR and OUR by the VSS concentration in the assays. The batch assays were
performed in 250 mL glass flasks with a 200 mL working volume. The reactors were water-jacketed at 20°C
using a heated circulating water bath. All incubations were performed under a continuous mixing using a
mechanical device (150 rpm), rather than a magnetic stirrer, to avoid the granules abrasion. Dissolved oxygen
(DO) and temperature were measured in the liquid through the DO probe. The DO probe was connected through
a RS-232 port to a computer, which was used for storing and monitoring all data. The flasks were incubated
aerobically, aerobic conditions were maintained under active mixing and oxygen furniture thought an air pump.
The concentration of total ammonia, nitrite and nitrate was measured by taking samples.
AOB activity assays. This experiment was designed to evaluate the potential specific activity of AOBs at
20°C, minimizing the interference of NOBs during the respirometry in order to compare AUR and OUR results,
adapting the protocol proposed by Ciudad et al. (2006). Both high free ammonia and non-limiting DO
concentrations were used in order to inhibit NOB activity. As the real substrates of AOBs is the non-ionic form
of ammonium (NH3 or FA), which inhibits NOBs at concentration range of 1-10 mgN-NH3-NL -1, the AOBs
assays were conducted under pH 8 and sufficiently high FA levels, inhibiting NOBs and non limiting AOBs
activity. Substrate was added, from a sterile 10 g TANL -1 stock solution, to initial concentrations of 130 mg
TAN L -1, corresponding at about 5 mg NH3-NL -1. The DO was monitored and controlled to be in the range
between 2.5 – 3.5 mg L-1, in order to limit NOBs activity. The potential aerobic ammonia oxidation activity was
calculated from the slope of the total ammonia concentration over the time (AUR). The OURAOB was compared

Chapter 5
152
to the AUR, taking into account that the aerobic oxidation of ammonia to nitrite require 3.16 mg O2 per mg
NH4+-N-1 oxidized.
NOB activity assays. Non-limiting concentrations of nitrite and DO were used in order to measure the
potential aerobic nitrite activity at 20°C, according to the protocol proposed by Ciudad et al. (2006). As free
nitrous acid (HNO2 or FNA) inhibits NOBs at concentration higher than 0.01-0.07 mg HNO2-N L-1 , the assays
were conducted under pH 7.5 and non-limiting nitrite concentration and non-inhibiting free nitrous acid
concentration. Substrate was added, from a sterile 10 g TNN L-1 stock solution, to initial concentrations of 70 mg
TNN L-1, corresponding at about at 0.0056 mgN-HNO2 L-1. The dissolved oxygen concentrations were monitored
and controlled to be in the range between 4 – 6 mg L -1. Further, for all the experiments, thiourea (20 mg L-1) was
added to inhibit the AOB activity consuming the possible residual ammonia. The potential aerobic nitrite
oxidation activity was calculated from the slope of the total nitrite concentration over the time (NUR). The
OURNOB was compared to the NUR, taking into account that the aerobic oxidation of nitrite to nitrate require 1.1
mg O2 per mg NO2--N oxidized.
2.6.2. Anaerobic activity assays
Anaerobic experiments were conducted to evaluate the potential specific activity of anammox and
denitrifying bacteria at 23 ± 1°C. For the anaerobic batch tests, 100 mL glass flasks were used, containing 80 mL
of mixed liquor. Once the buffering solution (20 mM HEPES, pH 8) and substrates were added, the flasks were
closed with a silicone membrane cap. Directly hereafter, the bottles were made anaerobic by alternatingly
applying under-pressure and flushing with N2 gas, as no growing effect was investigated. An overpressure of
1 bar was maintained in the bottles. The flasks were incubated on a shaker at 23 ± 1°C. Liquid samples were
taken for ammonium, nitrite, nitrate and COD analyses.
Anammox activity assays. This experiment was designed to determined the potential specific activity of
anammox bacteria (SAA), minimizing the interference of denitrifiers. No COD was used. Non-limiting
concentrations of either total nitrogen ammonia or total nitrogen nitrite were used. Further non- inhibitory
concentration of total nitrogen nitrite were reached. Flushed substrate solutions of TAN and TNN, from sterile
10 mg L-1 stock solutions (NH4Cl and NaNO2), were supplemented by means of needled syringes. Initial
concentrations were 70 mg TANL-1 and 25 mg TNNL-1. For all the experiments, thiourea (20 mg L-1) was added
to inhibit the nitritation process if traces of DO were present. The potential specific anammox activity was
estimated from the slope of the curve of the ammonium concentration along the time, dividing by the biomass
(VSS) concentrations.
Denitrifiers activity assays. Potential denitrification activities via nitrite and nitrate of the biomass were
measured, according to the protocol proposed by Constantin and Fick (1997). Into each bottle, KNO3, from a
sterile 10 mg L-1 stock solutions, corresponding to 200 mg NO3--N L-1 in 80 mL solution, was added by means of
needled syringes. Then a flushed substrate solutions of CH3COONa (sterile 100 g L-1 stock solutions) was
supplemented to the bottles. The initial amount of the carbon substrate in the 80 mL solution corresponded to
approx. 2000 mg CODL-1. The same operation was repeated using nitrite. NaNO2, from a sterile 10 mg L-1 stock
solutions, corresponding to 200 mg TNN L-1 in 80 mL solution, was added followed by the addition of the
carbon substrates as done in the tests with nitrate. The potential denitrifiers activities via nitrate and nitrite were
estimated from the slope of the curve of the nitrate and nitrite concentration over the time, respectively. The
values measured were then referred to the biomass (VSS) concentrations.
Chapter 5
153
2.7. Molecular techniques
2.7.1 Sampling and genomic DNA extraction
To maximize the DNA extraction efficiency, representative samples (0.2 mL) with red and brown granules
and brownish flocs were taken from the SNAD-SBR. Granules and flocs were aseptically broken to separate the
single cells, by passing through a series of syringe needles (0.60 - 0.30 mm). Further, in order to investigate the
anammox distribution in the SNAD biomass, both the suspended biomass (0.2 mL) and total granular biomass
(0.02 g) were analyzed. In addition, brownish granules (0.02 g) were separated and further analyzed. Total
bacterial DNA was extracted from the SNAD biomass samples using QiAamp(R) DNA Stool (QIAGEN) Kit,
according to manufacturer’s instructions. The final DNA samples (0.2 mL) were diluted 100 times with DNA,
and RNase-free water and stored at - 20°C until further analysis.
2.7.2 SYBR Green Real-Time PCR
Although real-time polymerase chain reaction (PCR) amplification with 16S rRNA gene is widely used in
anammox bacteria detection, functional genes could also be used as biomarkers. In this study oligonucleotide
primers targeting the hao/hzo gene have been used as functional markers to detect anammox bacteria in the
SNAD sludge. Up to now, hao/hzo gene has been successfully used to detect anammox bacteria from various
environmental samples, including wastewater treatment plants, as recently reviewed by Li and Gu (2011).
It was already known that anammox bacteria converts ammonium and nitrite into dinitrogen gas. Hydrazine
(N2H4) is an intermediate. Anammox bacteria oxidize hydrazine to dinitrogen gas with a hydroxylamine-
oxidoreductase- like protein (hao). Thus, the pathway for anammox catabolism includes both hydrazine and
hydroxylamine (NH2OH) and more than 200 genes are involved (Strous et al. 2006). A key enzymes of anammox
process is the octahaem cytochrome c protein, which is responsible of the bright red colour of the anammox
biomass. It is related to the hao/hzo gene, which is capable of oxidizing hydrazine to N2 and of producing, under
anoxic conditions, NO and N2O from hydroxylamine.
In order to amplify a part of the hao/hzo gene of the anammox bacteria a new primer set has been designed.
The PCR oligonucleotide primers were designed by using the alignement (CLUSTAL W) of the published DNA
sequence of the hao/hzo gene of Ca. Brocadia sp. (GenBank accession number FM163628.1) and the hao/hzo
gene of Ca. Kuenenia sp. (GenBank accession number FM163630.1), using the Primer Express Software
(Applied Biosystems). The specificity of the primers was checked and confirmed using NCBI’s Advanced Blast
program. In addition, to test the specificity of the primer set, real time PCR amplifications with the newly
designed primers were performed with genomic DNAs that carried target and no target sequences which were
obtained in a previous study (Langone et al. 2013b).
The real-time PCR was performed in the 7500 Thermocycler real–time PCR system (Applied Biosystems)
using 1 x SYBER Green PCR Master Mix (Applied Biosystems). Amplification was carried out with the mixture
solution shown in Table V-2. The new primer set for anammox bacteria consisted of the forward primer (5’
GGTCTTCATGGTACGCTATATCAGG 3’) and the reverse primer (5’ GATCAGCCATCGACATACCCA 3’).
A DNA template of 5 µL was added to 20 µL of the mixture solution. The final concentration of each primer in
the final PCR solution (25 µL) was 300 nM. The PCR temperature program was initiated with 2 min at 50°C and
10 min at 95°C followed by 40 cycles of 15 s at 95°C and 1 min at 63°C. A melting curve analysis was done
after amplification to distinguish the targeted PCR product from the non- targeted PCR product. During the PCR

Chapter 5
154
experiments, negative controls were used to demonstrate any background contamination. Environmental samples
from conventional activated sludge of WWTPs and a template without DNA were used as negative controls.
Table V-2 Compositions of mixture solutions for real-time PCR for anammox bacteria
[µL]
SYBR® Green PCR Master Mix (Applied Biosystems) including: SYBR® Green I dye, AmpliTaq Gold® DNA Polymerase, dNTPs with dUTP, dye molecule and optimized buffer
12.5
Primer Forward (10 µM) 0.75 Primer Reverse (10 µM) 0.75
DNA, and RNase-free water 6
Total 20
2.7.3 Real-Time PCR data analysis
The 7500 Thermocycler real–time PCR system and software (Applied Biosystems) were used for data
analysis. The thermocycler real–time PCR system monitors the fluorescence of the reaction mixture just before
the denaturation step of each amplification cycle, and records the cycle number at which the fluorescence crosses
a specific threshold value (classified as the threshold cycle, CT). Thus, the CT is a measure of the quantity of the
transcript of interest, and target the DNA copy number. The CT values are inversely related to the DNA copy
number. Further, the real-time machine determines the melting point (TM) of the product at the end of the
amplification reactions, which depends on its base composition. The identity of the PCR product from a sample
can be confirmed performing a melting curve analysis comparing its melting temperature (TM) with the TM of the
product from the positive control. The TM peaks of the products were calculated based on initial fluorescence (F)
curves by plotting the negative derivative of fluorescence over temperature versus temperature (-dF/dT
versus T). As no a standard curve was constructed in this study, the real time PCR results should be considered
qualitative and can be used for the detection of anammox bacteria. A qualitative comparison of different samples
through the CT values can be only performed when a same quantity of the initial samples is analyzed.
2.8. Analytical methods
Total ammonium as nitrogen (TAN) and total nitrite as nitrogen (TNN) were measured colorimetrically
(APHA-AWWA-WPCF 2005). Total suspended solid (TSS), volatile suspended solid (VSS), nitrate as nitrogen
(NO3--N) and chemical oxygen demand (COD) were determined according to the Standard Methods (APHA-
AWWA-WPCF 2005). The COD was always analyzed taking into account the chloride interference and further
recalculated considering the interference due to the presence of nitrite (nitrite exerts a COD of 1.142 mgO2/mg
TNN). The truly soluble COD (CODsoluble) and TAN concentrations of the raw influent were analyzed by using
the sequential filtration technique (0.45 and 0.2 µm nominal pore size). The total biodegradable (CODbio) and
readily biodegradable organic matter (RBCOD) of the influent were measured by using a combination of
physical-chemical (sequential filtration (Roeleveld and Van Loosdrecht 2002) and coagulation using ZnSO4 at
pH 10.5 (Mamais et al. 1993; Hu et al. 2002)) and respirometric techniques (Ziglio et al. 2001; Andreottola et al.
2002).
Alkalinity determinations were conducted using the kit USEPA Buret Titration Method 8221 (Hach
Company). The KLa of the system was estimated following the standard method of measurement of the transfer
of oxygen in clean water published by the American Society of Civil Engineering (ASCE 1992).

Chapter 5
155
2.9. Calculations
Concentrations of free nitrous acid (FNA or HNO2-N) and free ammonia (FA or NH3-N) were calculated
using the equations Eq. V-1 - Eq. V-3, derived from acid –base equilibrium, as a function of pH, temperature and
the sum of unionized and ionized forms, TNN and TAN, respectively (Anthonisen et al. 1976):
( )1
1 10NO pHe
TNNFNA mgNL
K−
−
= + Eq. V-1
( )1
1 10 pH NHe
TANFA mgNL
K−
− + = + Eq. V-2
( )2300 273 TNOeK e− += and ( )6344 273 TNH
eK e− += Eq. V-3
The efficiency of total ammonia nitrogen (TAN), total nitrogen (TN) and organic matter (COD) removal were
estimated according to the Eq. V-4:
inf
inf
[%] 100effC CEfficiency
C
− = ⋅ Eq. V-4
where Cinf is the concentration in the influent and Ceff is the concentration in the effluent of the SBR.
The nitrogen loading rate (NLR) and organic loading rate (OLR) in each period were calculated by using the
Eq. V-5 and Eq. V-6, respectively:
3 1 inf [ ]TAN
NLR gN m dHRT
− −
= Eq. V-5
inf,3 1 [ ] filtrCODOLR gCOD m d
HRT− −
= Eq. V-6

Chapter 5
156
3. Results and discussion
3.1 Period I: temperature effect on the reactor performance
In Period I, the 8 L SNAD-SBR, inoculated with SNAD biomass from the SBR of Zürich, was operated using
synthetic wastewater at two different temperature, 30°C (Step 1) and 25°C (Step 2). In the influent, the carbon to
ammonium ratio was about 0.5 mg COD/mg TAN in period I at 30°C and 0.9 in period II at 25° in order to
simulate the seasonal pattern of the composition of the anaerobic digestion effluent. The alkalinity to ammonium
ratio was in the range 8-10 mgCaCO3/mg TAN, similar to the digester effluent characteristics. The CaCO3/TAN
was higher than the stoichiometry value for the complete nitritation reaction (7.8 mgCaCO3/mg TAN), and thus,
it was not possible to stop the nitritation exactly at 50% ammonia conversion using the alkalinity limitation, as
reported in other studies (Bagchi et al. 2010).
As Fig. V.5 shows, in Period I, the NLR was set within 0.13-0.15 kgN m-3 d-1. The HRT was ~3 d. A lower
NLR had been applied for a short period of time at the beginning of the two stages at different temperature. The
applied OLR was between 0.08 - 0.14 kgCOD m-3 d-1.
Time [day]0 10 20 30 40 50
Effi
cien
cy [%
]
0
20
40
60
80
100
NLR,
OLR [
Kg m
-3 d-1 ]
0,0
0,1
0,2
0,3
0,4
0,5
TAN removalTN removalNLRCOD removalOLR
Step 1)T = 30°C
Step 2)T = 25°C
system aeration problems
micro-aerationlenght adjustment
highC/N ratio
Fig. V.5 Evolution of NLR, OLR and SNAD-SBR performance during period I (step 1 at 30°C and step 2 at 25°C).
Fig. V.5 also shows the operational performance of the SNAD system, including the total ammonia (TAN),
the total nitrogen (TN) and the organic carbon (COD) removal efficiencies in the reactor during the whole Period
I. As can be seen, in the step 1, at 30°C, high nitrogen removals (%) were achieved almost immediately in the
system. Initially, operating the reactor with a duration of the micro-aerobic phase of 230 min , the
total ammonia removal and the total nitrogen efficiencies were higher than 98% and 93%, respectively. The
COD removal was also high (81%). The simultaneous nitrogen and carbon removal was successful achieved.
Nevertheless, as Fig. V.6 shows, after 7 days from the start of the experiment at 30°C, a nitrite (TNN)
accumulation in the reactor was detected, suggesting that nitritation process (NH3 → NO2-) occurred for more
than the 50%, due to the gradually AOB acclimatization to the SBR operative conditions (high Free Ammonia,
high temperature and low dissolved oxygen). As consequence the system was characterized by high TAN
removal efficiency but the TN removal started to decrease. Thus, the length of the micro-aerobic phase was

Chapter 5
157
progressively and manually adapted and reduced in order to achieve a partial nitritation (50%) and a suitable
influent for the following anammox process. The duration of the micro-aerobic phase had been decreased from
230 min of the first days to 210 min and then to 170 min (Fig. V.6). The concentrations of TNN gradually
decreased and the TN removal efficiency increased again. However, the NO3--N concentration in the effluent
suggested both the presence of NOB in the reactor and the not complete inhibition of their activity (nitratation
process, NO2- → NO3
-).
Time [day]0 10 20 30 40 50
SBR t
ime [
min]
0
100
200
300
400
500
TAN,
TNN,
N-N
O 3- eff [m
g L-1
]
0
50
100
150
200
250
TAN in
f [mg L
-1]
0
100
200
300
400
500
T SBR cycleT aeration TAN eff TNNeff
N-NO3 - eff TAN inf
Step 1)T = 30°C
Step 2)T = 25°C
system aeration problems
micro-aerationlenght adjustment
highC/N ratio
Fig. V.6 Evolution of nitrogen species during period I (step 1 at 30°C and step 2 at 25°C).
Time [day]0 10 20 30 40 50
SBR t
ime [
min]
0
100
200
300
400
500
COD [m
g L-1
]
0
100
200
300
400
500
T SBR cycleT aeration CODfiltr effCODfiltr inf
Step 1)T = 30°C
Step 2)T = 25°C
system aeration problems
micro-aerationlenght adjustment
highC/N ratio
Fig. V.7 Evolution of COD during period I (step 1 at 30°C and step 2 at 25°C).
When the reactor temperature was decreased to 25°C (step 2), the NLR was decreased to 0.05 kgN m-3d-1 for
few days and then reported to the previous value (NLR=0.13 – 0.15 kgN m-3d-1, HRT~3d).
The aeration duration was initially prolonged (180 min) due to lower rates of ammonia oxidation with the
decrease in temperature. After the biomass was acclimatized to the moderate temperature (T=25°C), the length
of the micro-aerobic phase was decreased again and finally optimized and fixed at 150 min. The system was

Chapter 5
158
stabilized to the new temperature after ~10 days ( 3-4 times of the HRT). At 25°C, the average of TAN and TN
removal efficiencies were 97% and 93%, respectively (Fig. V.5). The COD removal efficiency was 77%. The
SNAD sludge in the reactor was gradually adapted to the lower operating temperature, which seems did not
deteriorate the stable SNAD performance. In Period I, after a necessary acclimatization period, the reactor was
operated in a stable manner at both temperatures. Total ammonium nitrogen and total nitrogen were successful
removed at both 30° and 25°C. A high COD removal (%) was achieved in this experiment both at 30° and 25°C,
due to the COD oxidation and to the denitrification process via nitrite and nitrate (Fig. V.5 - Fig. V.7).
The Table V-3 summarizes the most important features of the reactor during Period I, after that a stable
SNAD process was achieved. Effluent characteristics were similar for both step 1) and step 2) (TAN < 10 mg
NL -1, TNN < 13 mg NL-1, NO3--N< 9 mg NL-1), and seem to be mainly governed, regardless of the temperature,
by the SBR configuration, and in particular by the length of the micro-aeration phase.
Table V-3 Characteristic of the nitrogen removal at step 1 (30°C) and step 2( 25°C) (mean values)
Parameter Period I - step 1) Period I - step 2)
Wastewater Synthetic wastewater Synthetic wastewater Temperature [°C] 30 25 Days [d] 1 - 16 28 – 53
VER [%] 12 12 HRT [d-1] 3 3 NLR [kgN m-3 d-1] 0.13 0.15
OLR [kgCOD m-3 d-1] 0.08 0.14 NRR[kgN m-3 d-1] 0.12 0.14 TAN influent [mgN L-1] 415 428
CODfiltr influent [mgCOD L-1] 231 319 TAN out [mgN L-1] 5 10 TNN out [mgN L-1] 13 9
NO3-N out [mgN L-1] 9 9 CODfiltr out [mgCOD L-1] 40 70
VSS [g L-1] 2.1±0.2 1.9±0.4
TAN removal rate [%] 98 97
TN removal rate [%] 93 93 COD removal rate [%] 81 77
Operative day –Period I 9 35
AOB activity assay (NH3 →NO2-)
SAUR [kgTANrem kgSSV-1 d-1] T=20°C -0.133* -0.178**
TNN prod/TAN rem 0.8* 0.9*
NOB activity assay (NO2-→NO3
-)
SNUR [kgTNNrem kgSSV-1 d-1] T=20°C -0.024* -0.015** SOURNOB_max [kgDO rem kgSSV-1 d-1] T=20°C -0.028* 0.017** Anammox activity assay(NH3 +1.32NO2
-→0.26 NO3- + N2)
SAA [kgTANrem kgSSV-1 d-1] T=23°C -0.035* -0.025** TNN/TAN 1.3 1.2
Denitrifiers activity assay via nitrate(NO3-→NO2
-) Potential specific denitrifiers activity via nitrate [kgN-NO3
- rem kgSSV-1 d-1] T=23°C -0.214* -0.429**
Potential nitrite production [kgN-NO2- prod kgSSV-1 d-1] T=23°C +0.183* +0.400** TNN prod/NO3
--N rem 0.85* 0.93 Denitrifiers activity assay via nitrite (NO2
-→N2)
Potential specific denitrifiers activity via nitrite [kgTNNrem kgSSV-1 d-1] T=23°C -0.119* -0.112** * activity assay performed after 9 days of operative reactor at 30°C ** activity assay performed after 35 days of operative reactor at 25°C

Chapter 5
159
3.2 Period I: C/N effect on the reactor performance
In period I, treating synthetic wastewater at 25°C (Step 2), first a C/N ratio of 0.5 (18 – 32 d) and then a C/N
ratio of 0.9 (34 – 52 d) were applied. When the C/N ratio of 0.9 was used in the synthetic wastewater, a higher
COD removal efficiency was measured together with a high TN removal efficiency, comparable to the TAN
removal efficiency (Fig.V 5). This means that at a C/N ratio of about 1, a higher contribution of denitrification
was measured, which contribute to improve the total nitrogen removal efficiency of the system. Nevertheless,
C/N ratios higher than 2 are considerate critical for anammox and denitrifying bacteria co-existence (Kumar and
Lin 2010).
3.3 Period I: DO shocking effect on the reactor performance
At the 13th day, a dissolved oxygen shock was induced, achieving a high DO concentration DO in the reactor
(2–3 mg L-1). The oxygen shock led to an increase of the NOB activity over the AOB activity. This was
confirmed by the complete depletion of nitrite and by a nitrate accumulation in the system from the 13th day.
Both the TAN and the TN removal efficiencies decreased. A DO increase may cause indeed both a higher nitrate
production over the nitrite production and an inhibition of the anammox process, affecting the overall SNAD
performance. After 5 days from the aeration system problems, the reactor recovered its performances.
3.4 Period I: microbial activities
The microbial activity of each bacteria involved in the SNAD process was measured performing the activity
assays and it is reported in Table V-3. The potential AOB activity at 20°C (SAUR, expressed in kg of TAN
removed per kg of reactor VSS per day) of the biomass samples taken from the reactor working at 25°C (step 2)
was higher compared with that measured when the reactor worked at 30°C (step 1), probably due to the fact that
the nitrifying microorganism community in the SBR got optimized by oxygen limited conditions for long-term
operation. Under oxygen limitation, the maximum specific growth rate of ammonia-oxidizing bacteria (AOB)
was higher than that of nitrite-oxidizing bacteria (NOB), determining an apparent higher SAUR in the batch
assays at 20°C, due to the higher dominance of the AOB over the NOB in the SNAD biomass compared to the
start of the experiment. According to the findings reported above, the potential NOB activity of the biomass at
20°C (SNUR, expressed in kg of TNN removed per kg of reactor VSS per day) taken from the reactor working at
25°C (step 2) was lower compared to the SNUR measured when the reactor worked at 30°C (step 1). This could
be due to (i) a slight wash-out of the NOB in the reactor, as NOB grow slowly than AOB under oxygen limiting
condition and at temperature higher than 25°C and (ii) an inhibition effect of Free Ammonia on NOB activity.
However, the NOB were present during the whole Period I and were active as confirmed by the NOB activity
assays. In addition, even if the AOB activity assays were specifically designed to measure the AOB activity, the
NOB influence in the AOB activity assay was detected. The produced TNN and the removed TAN ratio, was
indeed lower than the stoichiometric value of the complete nitritation process (1). As reported in the Table V-3,
a lower interference of the NOB activity was detected in the step 2 (TNNprod/TAN rem=0.9), which indicated the
gradually disappearance and/or inhibition of the NOB. The interference of the NOB in the AOB activity assays
was also confirmed by the SOURAOB value, which was, both in the step 1 and step 2, higher than the
corresponded SAUR value, as it was influenced by the oxygen consumption of both AOB and NOB (data not
showed). This last result indicated that the AOB activity in a SNAD process is preferable measured by the AUR
rather than respiromentric data analysis (OUR). On the contrary, the SOURNOB measured by respirometric
technique developed in this experiment were perfectly comparable to the corresponding SNUR, obtained

Chapter 5
160
considering the stoichiometry of nitratation process (1.11 g O2/gNO2--N). This implies that the NOB activity
assay was optimized for the NOB activity measurement. Thus, respirometric data analysis (OUR) can be
performed rather than the direct measurement of nitrite uptake rate (NUR), in order to evaluate the NOB activity,
saving time and reagents costs.
Concerning the anammox bacteria, as can be observed from the Table V-3, the potential anammox activity at
23°C (expressed in kg of TAN removed per kg of reactor VSS per day) of the biomass taken from the reactor
working at 30°C (step 1) was slightly higher than the value reported for the sludge sampled in step 2, at 25°C.
The lower activity detected in the step 2, could be due either to a lower abundance of anammox bacteria in
SNAD biomass, due to a wash-out of anammox bacteria present in the flocs or to a partial inhibition of anammox
bacteria, due to the lower reactor operative temperature (25°C) or to DO shocks. However, the TNNrem/TAN rem
ratios in both the anammox activity assays were close to the 1.32 required by the anammox process, meaning that
the assays was optimized for anammox bacteria and there were any interferences by other microorganisms.
Finally, as expected, denitrifiers were active in the SNAD biomass and both nitrate and nitrite removal
processes were observed in the activity tests for heterotrophic denitrification. While the denitrifiers which
perform the reduction of nitrite to dinitrogen gas seemed to be not influenced by the different working reactor
temperatures, the apparent denitrification activity via nitrate (expressed in kg of NO3−-N removed per kg of
reactor VSS per day) were higher in the step 2, when the reactor worked at 25°C. This could be due to a higher
abundance of the denitrifiers which perform denitrification via nitrate in the second step over the first, due to the
higher COD/N ratio (0.9) in the influent. Finally, we also observed that the TNNprod/NO3--Nrem ratios in the
denitrification via nitrate activity assays, were lower than 1, which is the stoichiometric value of the
denitrification via nitrite using acetate. This means that mainly nitrate were reduced to nitrite, but a low amount
of nitrate was directly converted to dinitrogen gas.
3.5 Period II: acclimatizing to the digester effluent at moderate temperature
In Period II, the SNAD-SBR was fed with a mixture of the raw digester effluent and the synthetic wastewater.
The temperature of the SBR was always controlled at 25°C. During the Period II, the carbon to nitrogen ratio
was about 0.5 while the alkalinity to ammonium ratio was variable but high, in the range of 8 - 15 mgCaCO3/mg
TAN. Fig. V.8 presents the evolution of the SNAD-SBR performance over the Period II. As observed, the NLR
was set between 0.12 – 0.15 kgN m-3 d-1, with the exception of a shock loading induced at 17th day, when the
digester effluent was adding in the proportion 20% v/v, followed by a lower NLR for a short period of time.
Moreover, a lower NLR had been applied for a short period of time at the beginning of the Period II. The mean
HRT was ~ 2.5 - 3 d. The OLR applied was about an half of the NLR, which is typical of the digester effluent
composition.
A low TAN and TN removal efficiencies were initially observed when the digester supernatant was started to
introduce into the system. Each time that a stable nitrogen conversion was observed, the digester effluent to
synthetic wastewater proportion in the influent was increased. After a period of 10 days (3-4 times of the HRT)
the system achieved high TAN and TN removal efficiencies, treating 50%v/v of digester supernatant in the
influent. After 14 days of operation, the SBR was operated with 100% of raw digester effluent and TAN and TN
removal efficiencies higher than 99% and 91% were respectively observed for few days. The COD removal was
in the range of 66-80%, lower compared to the Period I, where synthetic wastewater had been treated at 25°C.
The lower COD efficiency has been attributed to the lower biodegradable organic content of the anaerobic
digester effluent compared to the synthetic wastewater. Even if the total COD concentrations in anaerobic

Chapter 5
161
digester effluent were comparable with the total COD content in the synthetic wastewater, the biodegradable
COD of the digester liquor was only 50% of the total organic carbon content.
However, high mean values of TAN (96%), TN (88%) and COD (58%) removal efficiencies were obtained,
gradually treating the digester effluent.
Time [day]0 10 20 30
Effi
cien
cy [%
]
0
20
40
60
80
100
NLR,
OLR [
Kg m
-3 d-1 ]
0,0
0,1
0,2
0,3
0,4
0,5
TAN removalTN removalNLRCOD removalOLR
Digestate20% 50% 100% 80%
Digestate20% 100% 80% 50%
Fig. V.8 Evolution of NLR, OLR and SNAD performance during period IIat 25°C.
Table V-4 summarizes the most important features of the reactor over the Period II, after the stable process
was achieved treating 100% v/v anaerobic digester effluent at moderate temperature (T=25°C) and at a mean
NLR of 0.15 kg N m-3 d-1. High nitrogen removal efficiencies were measured. Nevertheless, a higher nitrate
concentration in the SBR effluent was observed compared to the synthetic wastewater, due to the lower
biodegradable COD in the digester effluent, reducing the denitrification contribution to the SNAD process.
Further, treating the digester effluent, a decrease in the pH of the system was detected, as detailed showed in the
next section, which entail that SBR, in Period II, worked at lower Free Ammonia concentration, allowing a NOB
reactivation and compromising the SNAD performances.
Table V-4 Characteristic of the nitrogen removal at 25°C , treating anaerobic digester effluent
Parameter Period II Wastewater Anaerobic digester effluent
Temperature [°C] 25 Days [d] 20 - 37 VER [%] 12
HRT [d-1] 3 NLR [kgN m-3 d-1] 0.15 OLR [kgCOD m-3 d-1] 0.08
NRR[kgN m-3 d-1] 0.14 TAN influent [mgN L-1] 417 CODfiltr influent [mgCOD L-1] 217
TAN out [mgN L-1] 15 TNN out [mgN L-1] 2 NO3-N out [mgN L-1] 35 CODfiltr out [mgCOD L-1] 92
VSS [g L-1] 3.6±0.2
TAN removal rate [%] 96 TN removal rate [%] 88
COD removal rate [%] 58

Chapter 5
162
Fig. V.9 and Fig. V.10 show the evolution of influent and effluent versus time, nitrite, nitrate and carbon
concentrations and the duration of the micro-aerobic phase, which ranged within 120 – 150 min. After a period
of 10 day, the complete TAN depletion can be observed with no nitrite accumulation. Nevertheless, compared to
the SNAD performance in the Period I, a higher nitrate accumulation in the reactor was detected, according to
the lower COD and TN removal efficiency measured.
Time [day]0 10 20 30
SBR t
ime [
min]
0
100
200
300
400
500
TAN,
TNN,
N-NO
3- eff [m
g L-1
]
0
50
100
150
200
250
TAN in
f [mg L
-1]
0
100
200
300
400
500
T SBR cycleT aeration TAN eff TNNeff
N-NO3 - eff TAN inf
Digestate20% 50% 100% 80%
Fig. V.9 SBR reactions phases and evolution of nitrogen species during period II at 25°C.
Time [day]0 10 20 30
SBR t
ime [
min]
0
100
200
300
400
500
COD [m
g L-1
]
0
100
200
300
400
500
T SBR cycleT aeration CODfiltr effCODfiltr inf
Digestate20% 50% 100% 80%
Fig. V.10 SBR reactions phases and evolution of COD during period II at 25°C.

Chapter 5
163
3.6 Period II: Load shocking effect on the reactor performance
At 17th day, the system lost its stability, due to an induced shock loading (0.44 kg N m-3 d-1) and dissolved
oxygen shock. After an immediate decrease of the applied NLR followed by 9-10 days (3-4 times of the HRT) of
stable influent ammonium concentration, the system recovered its performance, and the TAN and TN removal
efficiencies evolved towards 91–99% and 85-93%, respectively.
The shock loading affected the SNAD system, mainly due to a possible slow response of AOB to the
increased loading rate together with an unsuitable SBR configuration, which did not appeared to be appropriate
for the higher NLR applied. Further, the aeration failure caused a DO increase in the system, which also led to an
increase of the NOB activity and consequently to a high nitrate concentration in the reactor effluent. In addition,
the high DO levels could partially inhibit anammox bacteria. However, the SNAD-SBR quickly recovered its
efficiency, showing the high flexibility of the system under shock loading operations and shock intrusions of
oxygen.
3.7 Evolution of the nitrogen over a 6h SBR cycle
In order to study in more detail the SNAD process and the conversion of the nitrogen and carbon species, a
8 h cycle profile was analyzed at day 12 of Period I – step 1) at 30°C, at day 43 of period I – step 2) at 25°C,
treating synthetic wastewater (Fig. V.11 a - b) and at day 22 of Period II at 25°C, treating anaerobic digester
effluent (Fig. V.11 c).
a) Period I – step 1)
time [h]0 1 2 3 4 5 6 7 8
[mg N
L-1]
10
30
50
70
0
20
40
60
80
TANTNNN-NO-
3
T = 30 °C
microaerobic anoxicT aer = 2.60 h T anox = 5,30 h
Syntetic wastewaterPeriod I - step 1)
time [h]0 1 2 3 4 5 6 7 8
[mg N
L-1]
50
150
250
350
450
0
100
200
300
400
500
COD
T = 30 °C
microaerobic a noxicT aer = 2.60 h T ano x = 5,30 h
Syntetic wastewaterPeriod I - step 1)
b) Period I – step 2)
time [h]0 2 4 6 8
[mg N
L-1]
10
30
50
70
0
20
40
60
80
TANTNNN-NO-
3
T = 25 °C
microaerobic anoxicT aer = 2.70 h T anox = 5.25 h
Syntetic wastewaterPeriod I - step 2)
time [h]0 2 4 6 8
[mg C
OD L-1
]
50
150
250
350
450
0
100
200
300
400
500
COD
T = 25 °C
Syntetic wastewaterPeriod I - step 2)
microaerobic anoxicT aer = 2.70 h T anox = 5.25 h

Chapter 5
164
c) Period II
time [h]0 1 2 3 4 5 6 7 8
[mg N
L-1]
10
30
50
70
0
20
40
60
80
TANTNNN-NO-
3
T = 25 °C microaerobic anoxic T aer = 2.00 h T anox = 5,90 h
DigestatePeriod II
time [h]0 1 2 3 4 5 6 7 8
[mg
L-1]
50
150
250
350
450
0
100
200
300
400
500
COD
T = 25 °CDigestatePeriod II
microaerobic anoxic T aer = 2.00 h T anox = 5,90 h
Fig. V.11 Evolution of carbon and nitrogen species over a 8 h SBR cycle: (a) Period I- step 1); (b) Period I- step 2), c) Period II
The Fig. V.11 presents both the evolution of carbon and ammonium, nitrite and nitrate inside the reactor on
different days, characterized by different temperatures and different wastewaters. In general, in all nitrogen
profiles it was observed that TAN concentration gradually decreased with elapsed time under micro-aerobic
condition, from 50-60 to 20-30 mg TAN L-1, depending on the aerobic ammonia oxidation rate and on the
duration of the micro-aerobic phase. The TAN removal in the micro-aerobic stage could be also caused by other
processes. First, the aeration may resulted in an effect of air ammonium stripping. Second, the cell synthesis may
resulted in nitrogen requirements. Third, anammox process might be carried out with the simultaneous
consumption of ammonium and nitrite, as anaerobic micro-ecological environments would exist as well as
anammox process may be active under oxygen limitation, even if it would be inhibited by low concentration of
dissolved oxygen (Yan et al. 2012). On the contrary, an increase of TNN concentration due to nitritation process
was observed, reaching a maximum TNN concentration of 40 mg TNNL-1, depending both on the NOB washed
out or inhibition and on the nitrite accumulation of the previous cycles. Moreover, during the whole experiment,
a slightly increase of the NO-3–N in the micro-aerobic phase was detected, confirming the not completely wash-
out or inhibition of NOB and a possible interaction of anammox bacteria in micro-aerobic conditions.
The residual TAN and TNN at the micro-aerobic phase were consumed in the following anoxic phase, due to
the anammox process. TNN and NO-3–N were also utilized by heterotrophic bacteria. The depletion of the TAN
by anammox process depended on the concentration of TNN at the end of the micro-aerobic phase. However,
TNN could be also produced in the anoxic phase during the first step of the heterotrophic denitrification (NO3- to
NO2-), if biodegradable carbon source is available. The decreasing COD profiles in the anoxic phase showed that
heterotrophic denitrifiers are active during the anoxic phase, especially using synthetic wastewater where a
higher readily biodegradable organic matter was present.
In Fig. V.11, it is clearly shown the effect of the micro-aerobic phase length on the SNAD efficiency. In
Period I, both in the step 1 and 2, the duration of micro-aerobic phase (2.5 -2.7 h) led to reach high nitrite
concentration at the end of the aerobic phase. Thus, in the following anoxic phase, the nitrite produced by AOB
were sufficiently high to deplete the main part of the residual ammonia by anammox process. In Period II, the
shorter duration of the micro-aerobic phase (2 h), imposed to avoid further nitrate accumulation in the system
thanks to the long oxygen exposure, allowed to reach lower nitrite concentration, which were not enough to carry
Chapter 5
165
on the complete depletion of TAN by anammox process (Fig. V.11 c), which clearly stopped after 3 hours, when
the nitrite were completely depleted. Further, in the Period II, even if there was a nitrate accumulation in the
system, significant reduction of NO3- to NO2
- did not occurred by denitrification via nitrite process, as can be
also seen from the correspondent almost constant COD profile, due to the low amount of readily biodegradable
COD in the anaerobic digestion effluent. Thus, during the anoxic phase, no nitrite were produced to further
perform the anammox process. At the end of the anoxic phase, when TNN were completely depleted and nitrate
were present, a TAN production was also observed, probably as a result of sulfur-oxidizing DNRA (dissimilatory
nitrate reduction to ammonia) activity, reducing NO3- to NH4
+, in contrast to the conversion of nitrate to N2 by
denitrification (Sher et al. 2008).
To study the results in more depth and quantify the nitrogen conversion process during the SNAD process,
experimental data were analyzed and the consumption or production of ammonium, nitrite and nitrate at each
reaction stage were calculated, as shown in Table V-5. The ratios of the main consumed and produced substrates
at micro-aerobic and anoxic phases were calculated and also listed in Table V-5. The ratio values were compared
with the stoichiometry values of the corresponded reactions and could be used as an useful criteria to confirm the
extent of the different biological processes.
Under oxygen limited condition, when the reactor temperature decreased from 30 to 25°C, the aerobic
specific ammonia consumption rate measured in the SBR, mainly related to the AOB activity, decreased by 1.15
times from 0.130 to 0.113 g TAN gVSS−1 d−1, which was satisfactorily described using the Arrhenius expression
(� =1.035). This temperature coefficient is similar to that proposed by Guo et al. (2010) under temperature from
20 to 35°C (� = 1.051), according to the fact that the temperature coefficient should be considered separately in
different temperature intervals for the aerobic ammonium oxidation process. Further, the aerobic specific
ammonia consumption rate did not decreased treating digester effluent, most likely due to the gradually adaption
of the sludge to the real wastewater. However, the nitrate profiles during the micro-aerobic phase indicated that
NOB were active. This was also confirmed by the TNNprod/TAN rem ratio values, which were always lower than
the stoichiometry value of the nitritation process (1). The lower TNNprod/TAN rem ratio values indicated that a part
of nitrite were converted into nitrate by NOB as well as that anammox process could occurred under oxygen
limited conditions. Moreover, looking at the NO3--Nprod/TAN rem ratio, it can be observed a gradually increase of
the NOB contribution over the time, expecially treating the anaerobic digester effluent. The nitrate production
rate increased during the course of the experiment, as NOB were gradually reactivated, indicating that, working
at moderate temperature, in addition to the oxygen limiting conditions, other selective pressures (i.e. high FA
and FNA) should be provided to inhibit NOB bacteria. Finally, it is interesting to note that the
(TNN+N-NO3)prod/TAN rem ratio is about 0.9, indicating that other process, as reported above, may contribute to
the ammonia removal in during the micro-aerobic phase.
Concerning the anoxic period, as can be seen from the Table V-5, the anoxic specific ammonia consumption
rate was higher at 30°C than at 25°, while no difference were detected at 25 °C treating either synthetic
wastewater or digester effluent. When the temperature decreased from 30 to 25°C, the anoxic specific ammonia
consumption rate decreased by 1.2 times from 0.072 to 0.060 g TAN gVSS−1 d−1, due to the temperature
negatives effect on the anammox activity (Dosta et al. 2008). However, the anoxic specific ammonia
consumption rates were slightly lower than the values calculated by Dosta et al. (2008) using biofilm biomass or
granular anammox in a complete anoxic reactor. In the SNAD reactor the DO concentration inhibits anammox
bacteria, reducieng the the anoxic specific ammonia consumption rate. The temperature effect on anammox

Chapter 5
166
bacteria can also be detected looking at the potential SAA measured in the anammox activity assays at 23°C,
which is lower than the values detected during the working period of the SBR at 30° and 25°C.
Despite the anammox activity detected in the anoxic period, no nitrate production was measured during the
anoxic phase, but rather a decrease in nitrate concentration was always observed. This result was linked to the
heterotrophic denitrifiers activities which reduce the nitrate produced by NOB in the micro-aerobic phase and the
nitrate produced by anammox process into nitrite and N2. An apparent denitrification activity via nitrate (NO3- →
NO2-), about 0.006 - 0.011 kg NO3
--N kg VSS-1 d-1, was detected during both the Period I and II. Similar results
were reported by Xu et al. (2010) in their study on the SNAD process, using an influent with a low C/N ratio.
However the NO3--Nrem/CODrem ratio was lower compared to the stoichiometric value reported for denitrification
via nitrate, as nitrate were simultaneously produced by anammox process.
Table V-5 Characteristic of the nitrogen removal at 30°C and 25°C
Parameter Period I step 1)
Period I step 2)
Period II
Stoichiometry
Wastewater Synthetic
wastewater Synthetic
wastewater Digester effluent -
T [°C] 30 25 25 -
Operative day 9 43 22
Micro-aerobic phase
ammonia consumption rate [kgTANrem kgSSV-1 d-1] -0.134 -0.113 -0.111 - nitrite production rate [kgTNNprod kgSSV-1 d-1] +0.091 +0.076 +0.047 - nitrate production rate [kgNO3-N prod kgSSV-1 d-1] +0.025 +0.027 +0.045 -
TNNprod/TAN rem -0.68 -0.67 -0.42
-1 gTNN/gTAN nitritation
NO3-N -prod /TAN rem
-0.19 -0.24 -0.40 - 1 g NO3
-N /gTAN nitratation
NOx-N prod /TAN rem
-0.87 0.91 -0.83 - 1 g NOx
-N /gTAN nitrification
Anoxic phase ammonia consumption rate [kgTANrem kgSSV-1 d-1] -0.072 -0.060 -0.061 -
nitrite consumption rate [kgTNNrem kgSSV-1 d-1] -0.095 -0.055 -0.060 - nitrate conversion rate [kgN-NO3-prod kgSSV-1 d-1] -0.011 -0.009 -0.006 - COD consumption rate [kgCOD prod kgSSV-1 d-1] -0.080 -0.088 -0.060 -
TNNrem/TAN rem +1.32 +0.92 +0.98
+1.32 gTNN/gTAN anammox process
NO3-N /TAN rem
+0.15 +0.15 +0.10 -0.26 g NO3
-N gTAN anammox process
NO3-N rem/CODrem
+0.13 +0.102 +0.10 +0.87 g NO3
-N /g COD denitrification NO3
- → NO2-
TNN rem /COD rem +1.18 +0.62 +1.0
+0.58 gTNN /gCOD denitrification
NO2- →N2
NOx-N rem /COD rem
+1.32 +0.72 +1.1 0.35 g NOx
-N /gCOD denitrification
NO3-→ NO2
- → N2
In the period I, step 1), the TNNrem/TAN rem ratio in the anoxic phase maintained in a value of 1.32, commonly
assumed in literature for anammox reaction (Strous et al. 1999b). Nevertheless, this value is only apparent as
other simultaneous processes occurred, such as the reduction of NO3- to NO2
- and the reduction of NO2- to N2 by
heterotrophic denitrifying bacteria. Probably, in the period I, step 1), anammox process occurred and the overall
contribution of NO2- production and NO2
-consumption by denitrification was zero. In the other two SBR cycles
analyzed, the TNNrem/TAN rem ratio was lower than 1.32, probably due to either a higher activity of heterotrophic

Chapter 5
167
bacteria which reduce NO3- to NO2
- over the heterotrophic bacteria which reduce NO2- to N2
-, or a contribution of
DNRA which produce ammonium reducing NO3-.
In the anoxic phase, the co-existence of anammox bacteria and denitrifiers was also confirmed by the
(TNN+NO3-N)rem/CODrem ratio, which was higher than the stoichiometric value of the overall denitrification
(0.35), as anammox process together with denitrification contribute to the NO2 removal.
3.8 Stoichiometry model based evaluation of the SNAD system
The consumption of nitrogen compounds in partial nitrification and anammox processes and the consumption
of carbon and nitrogen in denitrification were modeled using the stoichiometric equations and the experimental
data (Wang et al. 2010; Lan et al. 2011). Unlike previous stoichiometric models reported in literature, which
consider only the influent and the effluent characteristics for modeling, in this study the nitrogen and carbon
profiles in the SBR were considered. The model was developed considering that simultaneous bioprocesses could
occur during the SBR cycle, in both the micro-aerobic and the anoxic phase. In particular, during micro-aerobic
phase the co-existence of the nitritation, nitratation and anammox process was considerate, while in the anoxic
phase anammox process, denitrification via nitrate and denitrification via nitrite were taken simultaneously into
account. Aerobic denitrification, DNRA and synthesis processes were not considered. The following
stoichiometric relationships were used for modeling the biological activities:
(i) in nitritation, the molar ratio TNNremoved:TAN removed of 1:1 (1 g TNN/g TAN) was utilized. During the
micro-aerobic phase, the nitrite produced by AOB could be utilized both in the nitratation and anammox
processes. The residual TAN could be used in anammox process during the following anoxic phase while
TNN could be used both in anammox and denitrification via nitrite processes.
(ii) in nitratation, the molar ratio NO3--Nproduced:TNNremoved of 1:1 (1 g NO3
--N/g TNN) was adopted. The
nitrate produced in micro-aerobic phase could be utilized in the denitrification via nitrate process during the
anoxic phase.
(iii) in anammox process, the TNNremoved:TAN removed molar ratio and the molar ratio of NO3--
Nproduced:TAN removed were 1.32:1 (1.32 g TNN/g TAN) and 0.26:1 (0.26 g TNN/g TAN), respectively. The
nitrate produced could be further utilized in denitrification via nitrate in the anoxic phase.
(iv) in denitrification via nitrate (NO3- → NO2
-) and in denitrification via nitrite (NO2- → N2), CH3COOH
was considered as the biodegradable organic matter. Theoretically, denitrification via nitrate utilize 4 mol of
NO3− per mole of CH3COOH consumed (0.87 g NO3
--N/g COD) producing 4 mol of NO2- (0.87 gNO2
--
N/gCOD). Further, in the SNAD system, it was assumed that the produced TNN could be used both in
anammox and denitrification via nitrite processes during the anoxic phase. Denitrification via nitrite can
utilize 8 mol of NO2− per 3 mole of CH3COOH consumed (0.58 g NO2
--N /g COD) producing N2.
Starting by the nitrogen and carbon concentrations in the reactor at the beginning of the SBR cycle, the
percentages in which nitritation and nitratation processes occurred in the micro-aerobic phase were fixed
according to the concentration of the nitrogen species measured at the end of the micro-aerobic phase. In the
anoxic phase it was supposed that anammox reaction occurred only if both TNN and TAN were present in the
suitable ratio (TNN:TAN=1.32:1), achieving the final TAN concentration measured at the end of the SBR cycle.
In the anoxic phase, if the nitrite concentration was not high enough to carry on the anammox process, first
denitrification via nitrate occurred, in order to produce nitrite. Finally, several steps of denitrification via nitrate
and nitrite occurred until the final concentrations of oxidized nitrogen compounds were achieved. The final
concentration of COD was verified. The contribution of each process in the SNAD system, based on the

Chapter 5
168
stoichiometric modeling, is shown in Table V-6 for each SBR cycle investigated in the different periods. The
detailed modeling concept and the outcomes at 30°C using synthetic wastewater (period I, step 1), based on the
evolution of carbon and nitrogen species over the 8 h SBR cycle, is shown in Fig. V.12.
Table V-6 Stoichiometry model results of the SNAD process in period I and II
Parameter T=30°C T=25°C T=25°C
Wastewater Synthetic
wastewater Synthetic
wastewater Digestate
Period I – step 1 I– step 2 II
day 12 36 T [°C] 30 25 25 Influent CODtot/N 0.5 0.9 0.9
Influent CODbio/N 0.5 0.9 0.5
Micro-aerobic phase Nitritation (aerobic ammonia-oxidizing bacteria) %TANin removed
56 45 38
Nitratation (aerobic nitrite-oxidizing bacteria) %TNNin removed and converted in NO3
--N 6 20 29
Anammox (anaerobic ammonia-oxidizing bacteria) %TANin removed
5.2 4.2 7.5
Anoxic phase
Anammox %TANin removed
23.3 35 18.7
Denitrification via nitrate (heterotrophic bacteria) %CODin removed
3 14 2.9
Denitrification via nitrite (heterotrophic bacteria) %CODin removed
3 0 0
The results of the stoichiometric modeling indicated that, during the micro-aerobic phase, nitritation was the
prevalent TAN removal process (40 – 56%). The anammox process was showed to contribute to the TAN
removal efficiency in very low percentage (5 – 7%) in micro-aerobic phase. On the contrary, during the anoxic
phase anammox process was the prevalent process, contributing 23 – 35 % to the total TAN removal. NO3-
produced in nitratation and in anammox process were utilized in denitrification along with COD further
producing NO2-. A low NO2
- consumption due to denitrification via nitrite was estimated. This reveals that the
SNAD system has the capability of acting as shortcut nitrification–denitrification (SND), however the removal
efficiency of the SND process in this system is far less than the SNAD efficiency. In our SNAD-SBR,
denitrification contributed lower than anammox process to the total nitrogen removal process.
Comparing the different periods, it can be observed that nitratation was active during the whole experiment
and its contribution was growing at 25°C compared to the 30°C, due to the long term effect of the moderate
temperature under oxygen limiting conditions. The role of nitratation process was even higher treating the
anaerobic digester effluent, as the pH of the system was lower and thus lower free ammonia levels were achieved
in the system. Regarding the denitrification process, its contribution was almost high at 25°C (14%) treating
synthetic wastewater characterized by a CODbio/TAN ratio of 0.9. Treating wastewaters with a lower
CODbio/TAN (< 0.5), the denitrification contribution was lower than 5% both at 30 and 25°C.
The stoichiometric modeling could be an useful tool to better understand the evolving of the SNAD process
and the contribution of each process involved under different shocking conditions, such as ammonia load, DO,
pH and temperature.

Chapter 5
169
Fig. V.12 Stoichiometry model based evaluation of the SNAD system over the 8h cycle SBR in Period I, step 1). * attempted values ** calculated values
END of the anoxic phase: Reactor concentration TAN = 8.24 mg L-1 TNN= 31 mg L-1 NO3
- -N= 14.7 mg L-1 COD= 220 mg L-1
END of the micro-aerobic phase: Reactor concentration TAN = 20.5 mg L-1 TNN= 45.8 mg L-1 NO3
- -N= 15.6 mg L-1 COD= 230 mg L-1
START of the SBR cycle: Initial reactor concentration TAN = 52.7 mg L-1 TNN= 22.5 mg L-1 NO3
- -N= 12.3 mg L-1 COD= 276 mg L-1
Denitrification NO3 -→ NO2-: 3%**
Consumed Reactor Produced TAN - 8.3 - TNN - 33.7 4.1 NO3
--N 4.1 14.7 - COD 4.6 225 -
Anammox: 23** Consumed Reactor Produced TAN 12.2 8.3 - TNN 16.2 29.6 - NO3
--N - 18.8 3.18 COD - 230 -
Denitrification NO2-→N2 : 3%**
Consumed Reactor Produced TAN - 8.3 - TNN 2.73 31 - NO3
--N - 14.7 - COD 4.70 220.1 -
Anammox: 5.2%** Consumed Reactor Produced TAN 2.72 20.5 - TNN 3.59 45.8 - NO3
--N - 15.6 0.71
Nitratation: 6%* Consumed Reactor Produced TAN - 23.2 - TNN 2.60 49.4 - NO3
--N - 14.9 2.60
Nitritation: 56%* Consumed Reactor Produced TAN 29.5 23.2 - TNN - 52.0 29.5 NO3
--N - 12.3 -
Micro-aerobic phase
Anoxic phase

Chapter 5
170
3.9 Microbial analysis
3.8.1. Specificity of PCR primer
To evaluate the specificity of the designed primer set, targeting the hao/hzo gene of anammox bacteria, the
extracted DNA from the SNAD biomass, previously analyzed with the conventional PCR method (Langone et al.
2013b), was examined as a template. Negative controls were also used. The SNAD biomass template was
positive in the real time PCR assay and produced a mean CT value of 27.3. Specific PCR products were
identified by melting curve analysis and a reproducible distinct melting point (TM) of 81.6°C was observed for
the SNAD biomass amplicon, containing anammox bacteria. The amplification of the DNA from the negative
control did not show peaks in TM that corresponded to 81.6 °C. The results of the real-time PCR analysis are
shown in the Supplementary Fig. V-2.
3.8.2. Anammox bacteria detection and distribution in the SNAD biomass
The whole SNAD biomass (0.2 mL) used as inoculums was analyzed using real-time PCR, confirming the
presence of anammox bacteria in the whole biomass, containing both red and brown granules and single cell in a
net of filamentous bacteria. In our study, separated analysis conducted on the granular and suspended fraction of
the SNAD biomass, showed that anammox bacteria were detected in the both fractions. The presence of
anammox bacteria in the granules is well reported in literature (Nielsen et al. 2005; Chen et al. 2009; Li et al.
2011b). The presence of anammox bacteria in the suspended flocs is probably due to the abrasion of the
granules, caused by the aeration and mixing system, as also previously demonstrated by De Clippeleir et al.
(2009) in their 2.5 L SBR performing the OLAND process. Ni et al. (2010) reported that even the brownish
sludge, which coexisted with the red granules in a granular anammox reactor, contained 31% anammox bacteria.
In the SNAD biomass two kinds of granules (red and brownish) could be distinguished (Fig. V.13). The two
kind of granules have been demonstrated different physical and microbial properties. In our study we showed
that the anammox bacteria were present in the granular biomass. Both the total-granule DNA samples and the
brownish-granule DNA samples were positive in the real-time PCR assays and a melting point of 81.6°C was
observed. However the total-granule DNA samples (extracted from 0.02 g of total granular biomass) produced a
mean CT value of 26, while the brown-granule DNA samples (extracted from 0.02 g of brownish granular
biomass) produced a mean CT value of 36. As the CT value is inversed related to the DNA number copy, in the
SNAD biomass samples analyzed, the anammox bacteria in the brownish granules were significantly lower in
respect to the total granules analyzed (Fig. V.14), confirming that anammox bacteria are more abundant in the
red granules. De Clippeleir et al. (2009) showed that while in the red granules an equilibrated AOB and
anammox activity can be detected, in the brownish granules a lower anammox activity can be detected.
Moreover, in this study after ~3 months of operation, the whole SNAD biomass (0.2 mL) was taken from the
reactor and further analyzed using the real-time PCR. The samples analyzed were positive. The produced mean
CT was comparable to the value measured at the beginning of the SBR operation, confirming the low growth rate
of anammox bacteria.

Chapter 5
171
Fig. V.13 Red and brownish SNAD granules. Fig. V.14 Real–time PCR amplification of hzo/hao gene of total granules and brownish
granules samples
3.10 Influence of FA and FNA
The values of free nitrous acid (FNA) and free ammonia (FA) within suitable ranges are of great importance
for the successful operation of the SNAD process, especially as FNA and FA could contribute to the inhibition of
the nitratation process. Anthonisen et al. (1976) determined the levels of FNA and FA that are inhibitory to AOB
and NOB. FNA became inhibiting to NOB between 0.22 and 2.8 mg HNO2-N L-1. Further, the author showed
that AOB became inhibited at FA levels of between 10 and 150 mg NH3-N L-1, while NOB became inhibited at
FA concentrations between 0.1 and 1.0 NH3-N L-1.
In this study, according to Eqs. Eq. V-1 and Eq. V-2, the FNA and FA concentrations in the effluent of the
SBR were calculated over the whole course of the experiment and presented in Fig. V.15 and Fig. V.16,
respectively. The concentrations of FNA in the effluent of the SBR were always lower than
0.006 mg HNO2-N L-1, not creating either AOB or NOB inhibition. Instead, the concentrations of FA in the
effluent were in the range of 0.003 – 1.3 mg NH3-N L-1, with few peaks. The AOB were not inhibited by such
low FA concentrations. On the contrary, FA higher than 0.1 mg NH3-N L-1 may be considered to be inhibitory or
partially inhibitory to NOB activity (Anthonisen et al. 1976).
Time [day]0 10 20 30 40 50 60 70 80 90
FNA [
mg L-1
]
0,000
0,002
0,004
0,006
0,008
0,010
T [°C
]
0
5
10
15
20
25
30
pH
5
6
7
8
9
FNA T
pH
T = 30°C T = 25°C
Period I Period I Period II step 1) step 2)
Time [day]
0 10 20 30 40 50 60 70 80 90
FA [m
gN L-1
]
0,000,150,300,450,600,750,901,051,201,351,501,651,801,952,102,252,402,552,702,853,003,153,303,453,603,753,90
T [°C]
0
5
10
15
20
25
30
pH
5
6
7
8
9
TAN [
mgN L
-1]
0
20
40
60
80
T = 30°C T = 25°C
Period I Period I Period II step 1) step 2)
FATpHTAN
Fig. V.15 FNA concentration in the effluent during period I and period II.
Fig. V.16 FA concentration in the effluent during period I and period II
However, the behavior of the FA in the effluent did not justify the NOB activity increase during the Period II
at 25°C, treating anaerobic digester effluent. To better study the evolution of FNA and FA concentration in the
system, the single 8 h SBR cycle was analyzed in each period investigated. The pH was continuously monitored
Total granules
Brownish granules

Chapter 5
172
and FA and FNA were calculated over the SBR cycle. Fig. V.17 shows the evolution of FNA and FA
concentrations as well as the pH in the mixed liquor over the 8 h SBR cycles in Period I and Period II.
The pH during the SBR cycle followed the biological process development. Generally, the highest pH values
(around 8) were reached after the filling phase due to the high alkalinity of the influent (4500 mg CaCO3 L-1).
Over the reaction phases in the SBR cycle, the pH first decreased during micro-aerobic phase achieving a
minimum value between 7.4 – 7.7, due to the nitritation process which consumed alkalinity and then the pH
increased due to the contribution of denitrification process, which produced alkalinity and of anammox process,
which consumed hydrogen ions.
Anthonisen et al. (1976) suggested that FA was the main inhibitor of NOB under high pH conditions (pH
~8.0), which were measured at the beginning and at the end of the SBR cycle. In the SBR cycle, at the beginning
of each cycle, when both the TAN concentration (50 – 70 mg L-1) and the pH value reached their maximum
value, the FA concentration also reached its maximum value. Further, Anthonisen et al. (1976) suggested that
FNA was the main inhibitor of NOB under low pH conditions (pH~7.5), which were reached at the end of the
micro-aerobic phase.
Over the Period I the concentration of FA was higher than 3.5 mg NH3-N L-1 both at 30 and 25°C, inhibiting
the NOB activity. In the Period II, even having the same amount of TAN, a lower level of FA was found at the
beginning of the SBR cycle (<2.0 mg NH3-N L-1) due to the lower pH in the reactor. The lower pH in the reactor
could be caused by the change of the influent, from the sinthetic wastewater to the anaerobic digester effluent.
The lower FA levels at the beginning of the SBR cycles in Period II could favour the reactivation of the NOB,
explaining the higher nitrate accumulation detected in the SBR treating anaerobic digester effluent at 25°C.
However, literature on FA inhibition on NOB shows disagreement about the threshold FA concentration and
its inhibition degree. Vadivelu et al., (2007) stated that the respiration (catabolism) of Nitrobacter spp. was
inhibited by FA concentrations in the range of 1 – 9 mg NH3-N L−1 at pH of 7.3 and 22°C (100 - 1000
mg TAN/L). However, this inhibitory effect was limited (only inhibited by 12 - 25%). Further, the authors found
the biosynthesis (anabolism) of NOBs ceased completely at a FA concentration of 7.5 mg NH3-N L−1. Kim et al.
(2008a) reported different thresholds for Nitrobacter spp. and Nitrospira spp.. In particular, Nitrobacter spp.
were inhibited at 30 ~ 50 mg NH3-N L−1 while Nitrospira spp. were inhibited at 0.04 ~ 0.08 mg NH3-N L−1. The
authors also showed that FA inhibition of nitrite oxidizing bacteria was reversible. Turk and Mavinic (1989)
showed an adaptation of the NOB to FA, confirmed also by other studies (Villaverde 2000).
On the contrary, FNA did seem not influence the SNAD process. At the end of the micro-aerobic phase, when
the TNN concentration was maximum and the pH was the lowest, the FNA concentration achieved its maximum
value. Over the all experiment, FNA reached values lower than 0.003 mg HNO2-N L-1. The concentration of
FNA never reached the FNA inhibition thresholds reported for NOB. It was indeed reported that FNA starts to
affect NOBs activity in the range of 0.011 - 0.07 mg HNO2-N/L, while the complete inhibition was observed at
0.023 - 0.22 mg HNO2-N/L (Anthonisen et al. 1976; Vadivelu et al. 2006; Zhang et al. 2010a).
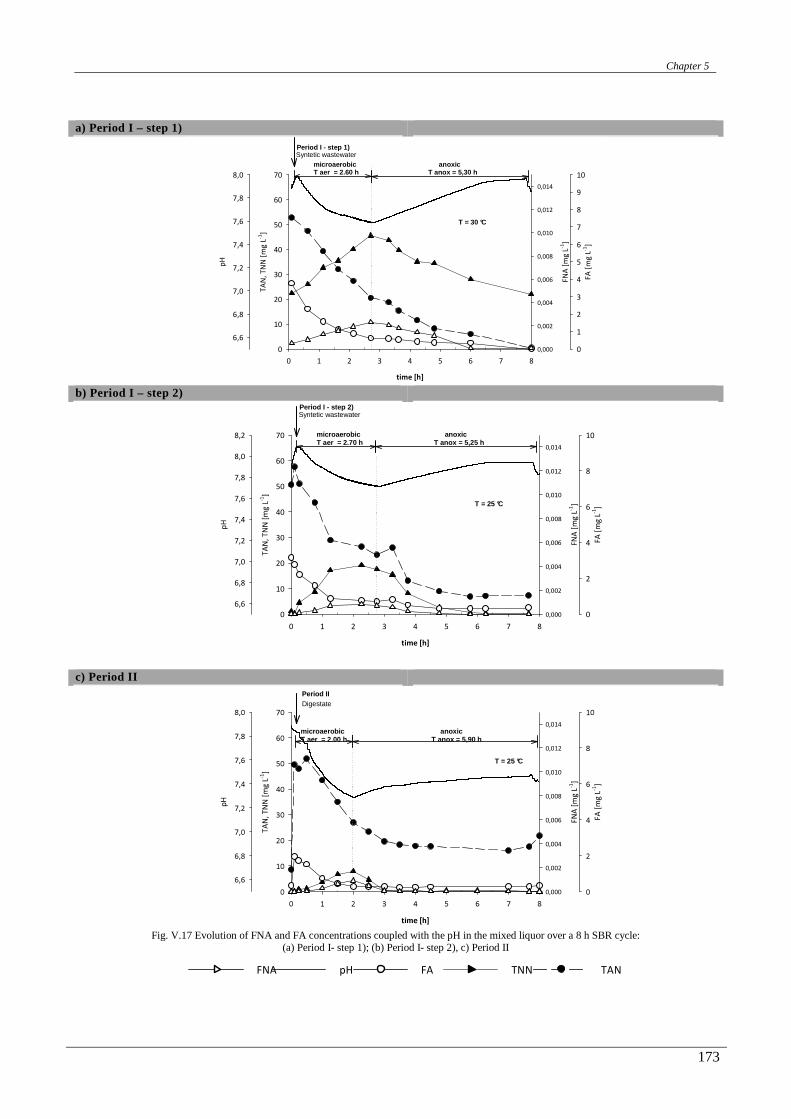
Chapter 5
173
a) Period I – step 1)
time [h]0 1 2 3 4 5 6 7 8
TAN,
TNN
[mg L
-1]
0
10
20
30
40
50
60
70
FA [m
g L-1
]
0
1
2
3
4
5
6
7
8
9
10
pH
6,6
6,8
7,0
7,2
7,4
7,6
7,8
8,0
FNA [
mg L-1
]
0,000
0,002
0,004
0,006
0,008
0,010
0,012
0,014
T = 30 °C
microaerobic anoxicT aer = 2.60 h T anox = 5,30 h
Syntetic wastewaterPeriod I - step 1)
b) Period I – step 2)
time [h]0 1 2 3 4 5 6 7 8
TAN,
TNN
[mg L
-1]
0
10
20
30
40
50
60
70
FA [m
g L-1
]0
2
4
6
8
10
pH
6,6
6,8
7,0
7,2
7,4
7,6
7,8
8,0
8,2
FNA [
mg L-1
]
0,000
0,002
0,004
0,006
0,008
0,010
0,012
0,014
T = 25 °C
microaerobic anoxicT aer = 2.70 h T anox = 5,25 h
Syntetic wastewaterPeriod I - step 2)
c) Period II
time [h]0 1 2 3 4 5 6 7 8
TAN,
TNN
[mg L
-1]
0
10
20
30
40
50
60
70
FA [m
g L-1
]
0
2
4
6
8
10
pH
6,6
6,8
7,0
7,2
7,4
7,6
7,8
8,0
FNA [
mg L-1
]
0,000
0,002
0,004
0,006
0,008
0,010
0,012
0,014
T = 25 °C
microaerobic anoxic T aer = 2.00 h T anox = 5,90 h
DigestatePeriod II
Fig. V.17 Evolution of FNA and FA concentrations coupled with the pH in the mixed liquor over a 8 h SBR cycle:
(a) Period I- step 1); (b) Period I- step 2), c) Period II
TANTNNFApHFNA

Chapter 5
174
4. Wastewater implications
The SNAD process will offer a great potential for the savings of energy and resource for an efficient nitrogen
and carbon removal from wastewater characterized by low C/N ratios at moderate temperature (T=25°C).
Treating ammonium rich-streams, the SNAD-SBR couples together the advantages of the autotrophic nitrogen-
removal over nitrite with the SBR system, achieving low capital and operative costs.
One of the keys of a properly working SNAD process is the development of suitable environmental
conditions which allow the co-existence of aerobic ammonia oxidizing, anammox and denitrifying bacteria. In
order to obtain such a suitable co-existence, in this study, experiments were carried out in a granular SNAD-
SBR, which represents one of the most appropriate reactor configurations, ensuing different micro- and macro-
environmental conditions, in both the bulk and the granules. The SBR cycle was conducted with two reaction
phases: a micro-aerobic and an anoxic one. In particular, in the micro-aerobic phase, performed under oxygen
limitation in order to inhibit the NOB, ammonium would be converted partly to nitrite by AOB ( partial
nitritation). Then in the anoxic phase, anammox bacteria would convert ammonia with nitrite to nitrogen gas.
Heterotrophic bacteria in aerobic conditions would oxidize the biodegradable organic matter while in anoxic
conditions would reduce both nitrate and nitrite to dinitrogen gas using the remain biodegradable organic matter
as carbon source.
Nevertheless, we showed that to maintain a long term stable SNAD process a high-rate and stable running
partial nitritation process is the critical point. Partial nitritation depends on both the SBR cycle configuration and
the SBR operative conditions. In particular, at moderate temperatures treating a real wastewater, besides the
effect of the the oxygen limitation on the nitritation reaction, a proper control of the FA is necessary to inhibit
NOB. Within the SBR cycle should be ensuing a tolerable FA range of 4-8 mg NH3-N L-1 (lower than the
minimum inhibition threshold reported for AOB and in the range of the inhibitory values reported for the NOB).
In this study, in particular it was found that, a regulation of the FA concentration at the beginning of the SBR
cycles may be a vital factor in inhibiting NOB and assuring a stable SNAD process. Thus, the pH value could be
adjusted at the beginning of each cycle to ensure a suitable FA level.
Further, during the anoxic phase denitrification occurred using the organic matter present in the influent,
removing either the residual nitrite and nitrate produced in the nitrification process or the produced nitrate of the
anammox process. Nevertheless, in order to avoid the anammox and denitrifying bacteria competition in the
anoxic phase, a suitable low C/N ratio should be guaranteed. To this end, wastewater with low C/N ratio (< 1)
are suitable for the SNAD process. The micro-aerobic phase in the SBR configuration is also useful to partially
oxidize the organic compounds and thus reduce the carbon content in the following anoxic phase.
According to the operation experience on the SNAD-SBR process, it is suggested that a suitable start-up
strategy to achieve the SNAD process at moderate temperatures could have two steps. The first one would be the
stable SNAD process at high temperature (T=30°C), in order to select the AOB over NOB by high temperature
and other optimized conditions, such as oxygen limitation and FA inhibition. Then, the second step would be the
adaptation of the SNAD biomass to the lower temperatures. Further, a gradual acclimatation of the SNAD
biomass to the treatment of real wastewater is proposed, by filling a mixtute (%v/v) of synthetic and real
wastewater, controlling the pH of the system in order to inhibit nitratation process.

Chapter 5
175
5. Conclusions
In this study, the SNAD process performed in an SBR was successful applied to treat anaerobic digestion
effluent characterized by low C/N ratio with high ammonium concentration at moderate temperature (T=25°C).
After a necessary acclimatization period to the moderate temperature and to the digester effluent, the reactor was
operated in a stable manner. The SNAD system shows high TAN (96%) and TN (88%) removal efficiency at
NLR of 0.15 kg m-3 d-1. The system was able to remove ~ 60% of COD at final stage. A nitrate accumulation
was observed in the system as low biodegradable COD was present in the digester effluent, minimizing the
denitrification effect on the overall SNAD efficiency. Further, at moderate temperature, besides the effect of DO
concentration on the NOB inhibition, a proper control of the FA within a favorable range is necessary, especially
at the beginning of the SBR cycles, when the TAN and the pH assume the highest value, in order to further
inhibit the NOB activity.
This study showed that, under steady-state condition, nitritation, anammox, denitrification and nitratation co-
existed in the SBR, synchronizing each other and establishing a relation, which depended on the operative
reactor conditions. The cooperation among these bacteria was considered to be responsible for simultaneous
nitrogen and COD removal. The shock in the operating temperature, DO, C/N, nitrite concentrations, nitrogen
loading rate of the SNAD system greatly affected the relation of these processes. This can be evidence from the
poor TAN and TN removal efficiency of the system when a shock occurred. However, the system was always
able to recover its efficiency after 3- 4 time the HRT. Finally, a new primer set targeting the hao/hzo gene of
anammox bacteria was successful designed and tested. The PCR results confirmed the presence of anammox
bacteria in the SBR, both in granules and in flocs.
Acknowledgements
The authors gratefully acknowledge Adriano Joss from EAWAG (SWZ) and Mrs Sabine Burger from ERZ
Entsorgung + Recycling Zürich, (SWZ), for providing the SNAD sludge and for their helpful information
concerning the SBR. We wish to thank Mr. Giuliano and Mr. Saverio from the WWTP of Trento, for providing
the anaerobic digester effluent. We thank V. Miotto and E. Sbrissa, master students of the University of Trento
for their precious contribution during experimental phases. The “Servizio Elettronico e Progettazione” and the
“Sevizio Meccanico” of the Department of Physic of the University of Trento are gratefully acknowledged for
their technical support for the reactor assembly and the acquisition and control software development.

Chapter 5
176
Author Contributions
All authors contributed extensively to the work presented in this paper. The acquisition and control software
was developed by M.L with the support of L. Penasa from the University of Trento. Experiments for the reactor
and the microbial activity were designed and conducted by M.L. G.A. and M.L. conceived the research. M.C.
performed the microbial analysis. M.L. wrote the paper with input from all other authors, discussing the results,
implications and commenting on the manuscript at all stages.
Supplementary Material
Further details concerning the characteristic of the synthetic wastewater and the anaerobic digested effluent,
the reactor equipment, the acquisition and control hardware and software as well as the primer set specificity.

Chapter 5
177
Supplementary Table
Supplementary Table V-1 Characteristics of the synthetic wastewater Parameter This study
[g L -1]
NH4 Cl 1.52 KHCO3 3.78 CH3COONa 0.56
Medium Composition* CaCl2 2H2O 0.30
MgSO4 7H2O 0.20 FeSO4 0.00625
EDTA 0.00625
KH2PO4 0.0250 Trace elements solution* 1.25 mL L–1
Trace element composition (1L)* ZnSO4 · 7H2O 0.43 MnCl2 · 4H2O 0.99
CuSO4 · 5H2O 0.25 NaMoO4 · 2H2O 0.22 NiCl2 · 6H2O 0.19
H3BO4 0.014 * adapted by * Thirds et al. 2001
Supplementary Table V-2 Characteristics of the anaerobic digestion supernatant from a municipal WWTP, Trento (Italy). Mean values during the whole study.
Parameter This study
[mg L -1]
pH 7.8±0.1
TSS [mg L-1] 260 ± 200
CODtotal [mg L-1] 338± 70
CODfilt 0.45 µm [mg L-1] 193 ±84 *
CODsoluble [mg L-1] 194 ± 27 +
CODbio [mg L-1] 158± 19 **
RBCOB [mg L-1] 48± 57 **
TOTAL AMMONIUM NITROGEN (TAN filt ) [mg L-1] 433±65 +
TOTAL NITRITE NITROGEN (TNN) [mg L-1] <0.08 * NITRATE (NO3-N) [mg L-1] 0.4±0.6 * TOTAL KJELDAHL NITROGEN (TKN) [mg L-1] 470±59 ORGANIC NITROGEN (Norg) [mg L-1] 49±23 TOTAL PHOSPHORUS (P) [mg L-1] 10±0.7
ORTHOPHOSPHATE (PO4-) [mg L-1] 4±1.5 * ALKALINITY (CaCO 3) [mg L-1] 5.360 ±460 * *values after filtration 0.45 µm
**values determined by respirometric analysis
+values determined after ultra filtration 0.45 µm and 0.2 µm

Chapter 5
178
Supplementary Table V-3 cDAQ channel configuration cDAQ – 9174 chassis (4 slot)
Device Description Control Physical
channel Channel Name
output range
Work range
Work measure
NI 9208 16-Channel Current Input Module
pH sensor on-line reactor
pH - AI0 Numeric 1
pHr ±21.5 mA 4 – 20 mA 4 -10
ORP sensor on-line reactor
ORP - AI1 Numeric 2
ORPr ±21.5 mA 4 – 20 mA -500 + 500 mV
Temperature sensor
on-line reactor Temperature
combined with DO sensor
- AI2 Numeric 3 TDOr
±21.5 mA 4 – 20 mA 5 – 40 °C
DO sensor on-line reactor
DO - AI3 Numeric 4
DOr ±21.5 mA 4 – 20 mA 0 – 10 mg L-1
pH sensor on-line influent
tank pH - AI4 Numeric 5
pHi ±21.5 mA 4 – 20 mA 4 -10
CE sensor on-line reactor Conductivity
- AI5 Numeric 6 CEr
±21.5 mA 4 – 20 mA 0-100 mS
CE sensor on-line influent
tank Conductivity - AI6 Numeric 7
CEi ±21.5 mA 4 – 20 mA 0-100 mS
free - AI7 ±21.5 mA
Temperature sensor
on-line reactor Temperature
combined with CE sensor
- AI8 Numeric 9 TCEr
±21.5 mA 4 – 20 mA 0 – 40 °C
Temperature sensor
on-line influent tank Temperature combined with
CE sensor
- AI9 Numeric 10 TCEi
±21.5 mA 4 – 20 mA 0 – 40 °C
Level sensor on-line reactor
level - AI10 Numeric 11
Levelr ±21.5 mA 0 – 20 mA 5 - 32 cm
free - - AI11 ±21.5 mA free - - AI12 ±21.5 mA
free - - AI13 ±21.5 mA free - - AI14 ±21.5 mA free - - AI15 ±21.5 mA
NI 9485 – 8 Channel C Series Relay, 60 VDC/30 Vrms, 750 mA
Influent Pump influent feeding
Time and level On-Off control
AO0 P01 relay for switching voltages up to 60 VDC
Effluent Pump effluent discharge
Time and level On-Off control
AO1 P02 relay for switching voltages up to 60 VDC
Sludge Pump sludge discharge
Operator, Time and level
On-Off control
AO2 P03 relay for switching voltages up to 60 VDC
Acid pump alkalinity and
basic condition pH
On-Off control AO3 Pacid relay for switching
voltages up to 60 VDC
Basic pump alkalinity and
basic condition pH
On-Off control AO4 Pbase relay for switching
voltages up to 60 VDC
Aerator aeration
conditions Time and DO On-Off control
AO5 BL01 relay for switching voltages up to 60 VDC
Mixer mixing
conditions Time
On-Off control AO6 MX01 relay for switching
voltages up to 60 VDC
free AO7 - relay for switching
voltages up to 60 VDC
NI 9472 - 8 Channel , 24 V Logic, 100 µs Sourcing C Series Digital Output Module
Over flow alarm In
Detect overflow from bioreactor,
safety tank
DIO Level 6 – 30 V
AI= analog input; AO= analog output; DO=digital input/output

Chapter 5
179
Supplementary Figures
Supplementary Fig. V-1 Graphical interface of the acquisition and control software developed using LabVIEW 2010 software. (A) DO signal [mg L-1]; (B) ORP signal [mV] ; (C) Conductivity signal [mS] ; (D) . pH signal.
Supplementary Fig. V-2 hzo/hao primer set specificity. (A) Real –time PCR amplification of hzo/hao gene. (B) Melting curve analysis of SYBR Green real-time PCR product of hzo/hao gene after 45 cycles.
BA
DC
SNAD biomass
Activated sludge samples
BSNAD biomass
Activated sludge samples
A

180

Chapter 6
181
VI. Chapter
Real time control strategy for
Simultaneous partial Nitritation, anammox
and Denitrification (SNAD) process in
SBR
This chapter was based on:
Langone M., Andreottola G. (2013). Correlating on-line monitoring parameters, conductivity, ORP pH, and
DO with the Simultaneous partial Nitritation, Anammox and Denitrification (SNAD) process in SBRs. Submitted

Chapter 6
182
Real time control strategy for Simultaneous partial Nitritation, Anammox and Denitrification (SNAD) pro cess in SBR
Michela Langonea, Gianni Andreottolaa
a Department of Civil, Environmental and Mechanical Engineering, University of Trento, Via Mesiano 77, Trento 38123, Italy
ABSTRACT
A simultaneous partial nitritation anammox (SNAD) process was successful performed in a sequencing batch reactor (SBR) treating a synthetic wastewater and an anaerobic digester effluent from an urban wastewater. The oxidation-reduction potential (ORP), pH, conductivity (EC) and dissolved oxygen (DO) signals were continuously monitored and recorded during the whole experiment. The on-line parameters profiles were well related to the ongoing biological processes and breaking and blending points were also detected, useful to monitor and control the SNAD process. With the beginning of the anoxic–mixed filling phase, EC and pH increased while ORP decreased. Then, with the beginning of the micro-aerobic phase, pH and EC exhibited a decreasing trend while the ORP increased gradually. When the aeration was switched off the ORP showed a sharp decrease whereas the pH increased steadily due to biological conversion processes. The EC continued to decrease slowly. A blending point in the ORP profile in the anoxic phase and the amplitude of the ORP after the blending point were correlated with the complete depletion of nitrite mainly by anammox process and with the denitrification process via nitrate, respectively.
The findings demonstrated that the status of the SNAD process in an SBR, and the ongoing nitritation, anammox and denitrification process, can be successfully monitored and controlled through pH, ORP and conductivity profiles. Further, a successful real-time control strategy has been applied to optimize the SBR cycle, treating anaerobic digester effluents and applying a nitrogen loading rate of 0.15 kg N m-3 d-1. Results showed that the average removal efficiencies of ammonium and nitrogen were more than 95% and 88%, respectively, preventing nitrite accumulation and substrates depletion.
Keywords: Anammox, conductivity, denitrification, dissolved ossigen, nitritation, on-line control, oxidation-reduction potential (ORP), pH, SBR cycle, SNAD.
Abbreviations Parameters Reactor Configurations and process Operative COD Chemical Oxygen Demand CAS Conventional Activated Sludge DO Dissolved Oxygen CODtot Total COD DEMON Deammonification process HRT hydraulic retention times CODfiltr Filtrate COD EBPR Enhanced Biological Phosphorus Removal KLa mass transfer coefficient for oxygen FA Free Ammonia (NH3- N) MBBR Moving Bed Biofilm Reactors NLR Nitrogen Loading Rate
N Nitrogen SNAD Simultaneous partial Nitritation, Anammox, Denitrification
NRR Nitrogen Removal Rate
NO3--N Total Nitrate Nitrogen SBR Sequencing Batch Reactors OLR Organic Loading Rate
TAN Total Ammonia Nitrogen WWTP Wastewater Treatment Plant VER Volume Exchange Ratio TNN Total Nitrite Nitrogen ORP Oxidation-Reduction Potential TKN Total Kjeldahl Nitrogen AOB Ammonia-Oxidizing Bacteria EC Conductivity TSS Total Suspend Solid NOB Nitrite-Oxidizing Bacteria VSS Volatile Suspend Solid Anammox ANaerobic AMMonia -OXidizing Bacteria
1. Introduction
The simultaneous partial nitritation, anammox and denitrification (SNAD) process has been studied as a
suitable and sustainable alternative nitrogen removal pathway for the treatment of high ammonium streams,
characterized by low biodegradable organic matter content, such as anaerobic digestion effluents (Joss et al.
2009), old landfill leachates (Wang et al. 2010) and industrial wastewaters (Daverey et al. 2012). In the SNAD
process, ammonium would be converted partly to nitrite by oxygen-limited aerobic ammonia oxidizers (AOB),
subsequently, the residual ammonium would be directly oxidized to di-nitrogen gas with nitrite as electron
acceptor by anammox bacteria, while the excess of nitrate and nitrite would be reduced to di-nitrogen gas by
denitrifiers bacteria, which can utilized the low content of organic biodegradable present in the influent.

Chapter 6
183
The SNAD process has specific peculiarities which concern (i) the coexistence in the same reactor of bacteria
with opposite environmental conditions (aerobic/anoxic) for which specific chemical compounds act both as
substrates and inhibitors and (ii) the presence of autotrophic bacteria, the main actors involved in the process,
which are characterized by low growth rates. Hence, reactor configurations based on the occurrence of opposite
environmental conditions and a high efficient retention of biomass have been mostly used, such as sequencing
batch reactors (SBRs) with granular and suspended biomass (Joss et al. 2009; Xu et al. 2010; Lan et al. 2011;
Daverey et al. 2012), sequencing batch biofilm reactors (SBBR) (Zhang et al. 2012), non-woven rotating
biological contactors (NRBC) (Chen et al. 2009), anoxic/aerobic granular SBR (Winkler et al. 2012a), moving
bed biofilm reactors (MBBR) (Rosenwinkel and Cornelius 2005), granular sludge processes (Abma et al. 2010),
granular continuous full-scale aeration tanks (Wang et al. 2010).
Biofilm and granular systems have been adopted, both to enhance the biomass retention in the systems and to
create opposite micro-environmental conditions over the granule/biofilm thickness. Among the configurations
reported above, the SBR with granular biomass has demonstrated a good potential in performing the SNAD
process, as it offer various advantages including: development of sequential and opposite macro-environments
where different bacteria can coexist; simultaneous development of micro-environmental conditions thanks to the
granular structure, minimal space requirements, low capital and operational costs, management ease and
flexibility, implementation of on-line control strategy.
The SNAD process is a very sensitive process, and the equilibrium of the biological processes involved in it
plays an important role. Thus, an on-line control of each biological process is crucial for a successful operation
strategy implementation, able to optimize the SNAD process in SBRs. Similarly to the conventional nitrification
- denitrification processes, the on-line monitoring of the SNAD process through direct real-time measurements
of process constituents (NH4+, NO2
−, NO3− and N2) is very difficult and costly to achieve with current sensors.
Usually, the lab-scale reactors performing the SNAD process are controlled by timers, while the adjustments of
the cycle duration are made after batch measurements of ammonium and nitrite in the effluent. Some
installations also include on-line measurement of ammonium and nitrite in granular nitritation/anammox reactor
(Abma et al. 2010).
Nevertheless, the biological processes occurrence and dynamic can easily and cheaply be monitored by
indirect real-time parameters such as DO (dissolved oxygen), ORP (Oxidation Reduction Potential), pH and
conductivity (EC) measurements. Several research groups have studied different SBR operation strategies to
carry on the SNAD process. Among them, Wett (2007) proposed an SBR configuration (8 h per cycle),
characterized by a continuous feeding over the entire reaction time and a DO set point of 0.3 mg L-1 in order to
prevent rapid nitrite accumulations and to maintain a continuous aerobic nitrite oxidizing bacteria (NOB)
inhibition, thanks to the low DO concentrations and the high temperature. The duration of aeration intervals were
ruled by very tight pH-bandwidth (0.01). Until now, several large scale implementation have been developed
applying the DEMON process patent filed by Wett (2009) (e.g. Strass in Austria; Heidelberg, Plettenberg in
Germany; Thun, Glarnerland in Switzerland, Trento in Italy).
Szatkowska et al. (2007a), conducting an one-stage system with partial nitritation and anammox processes in
the moving-bed biofilm reactor (MBBR), showed a strong correlation between removed nitrogen, removed
alkalinity and pH value in the effluent. Also conductivity turned out to be a suitable tool for the process
monitoring.

Chapter 6
184
Degremont et al. (2009) filed a patent (2/23-FAMPAT-©Questel) on the simultaneous nitritation-anammox
process in an SBR (6-8 h per cycle). Each cycle was constituted by a fraction filling phase and two reaction
stages: a first aerated stage followed by a non ventilated second phase. In the aerated phase a part (40-60%) of
the ammonium (TAN), flow supplied by a volume of influent, was transformed into nitrites (TNN), and the
remainder part of the ammonium flow was sufficient to ensure that the produced nitrites and non oxidized
ammonium during the first step were converted into gaseous nitrogen. The supply time of influent to be treated
was 7-10% of the total duration of the treatment cycle. The inventors introduced a conductivity concentration
strategy in order to control the first aerated step (DO= 0.1-0.6 mgL-1). The air supply was stopped if a threshold
value in conductivity was reached before one fixed duration, and further an additional filling phase (between
50% and 110% of the volume of initial influent) was introduced at the beginning of the non-ventilated phase in
order to ensure a TNN:TAN ratio between 0.9 and 1.5. The inventors measured the concentration of nitrogen
ammonium in the system both indirectly by a conductivity (EC) sensor in the tank and directly by a specific
ammoniacal sensor. Further, they calculated the nitrogen load to be treated by measuring conductivity (EC) and
the flow (Q) in the influent. The on-line measures of the ammonia concentration and conductivity in the tank
were taken into account like indicators of conversion of ammonium during the phases of ventilation and not-
ventilation in order to control the course of the biological process during each phase and determine their
duration. The data were also analyzed in order to calculate the volume of the influent to add at the beginning of
the non-ventilated phase.
Joss et al. (2009) successful developed a partial nitritation, anaerobic ammonium oxidation process and
denitrification control strategies in an SBR (6-8h per cycle), using on-line measurements of oxygen, ammonium
(ion-selective ammonium electrode) or alternatively conductivity. The nitrate concentration was also monitored.
The authors combined a discontinuous and short feed at the beginning of each cycle, regulated by a maximum
ammonium/conductivity threshold, and an intermittent or continuous aeration controlled by the ammonium or
alternatively by the conductivity signal. The aeration phases were under oxygen limitation (DO < 0.5mgO2·L-1),
allowing the occurrence of the anammox process also in aerobic conditions. The aeration was terminated either
after a fixed time interval, chosen to avoid high nitrite concentration, or after a minimum
ammonium/conductivity threshold. Finally an anaerobic stirring period was performed in order to remove both
the remaining nitrite by anammox process and the N2 bubbles formed.
Only recently, the oxidation–reduction potential (ORP) profiles have been investigated as process monitoring
parameter of the nitritation-anammox process performance in an SBR (Lackner and Horn 2012) and as indicator
parameter for a control strategy of SBR, through a combination of interval feeding with interval aeration
(Lackner et al. 2012). According to Lackner and Horn (2012), the ORP signal was the most suitable parameter
for monitoring a single stage nitritation–anammox process, where denitrification only occur at the beginning of
the SBR cycle, during the anoxic feed. The ORP signal was able to detect easily the substrates depletion
(ammonium and oxygen). The authors suggested that a control strategy for a full scale plants
nitritation/anammox should also include other parameters beside the ORP to monitor the process performance,
support failure diagnostic.
However, when denitrification occurs over the process, other on-line parameters should further used to
interpret the denitrification contribution. Therefore, the major objective of this research was to correlate the
variation in ORP, EC, pH and DO profiles with the biological nitrogen and carbon removal in a SNAD process
performed in an SBR system. The influence of different type of wastewaters on the indirect on-line parameters

Chapter 6
185
was also investigated. The experiment was performed using a “fixed time control” strategy to control the SBR
and all the on-line parameters were registered. Further, analysing the results of the “fixed time control” strategy
it was possible to implement a new “real-time control” strategy, mainly based on the EC and ORP signal in order
to achieve a stable SNAD-SBR process. In this contribution the “real time control” strategy is presented, which
special focus on the ORP and EC signal as indicator parameters, in order to optimize the SBR cycle pattern for
process stability and removal efficiency.
1.1 Meaning of indirect parameters
Dissolved Oxygen (DO) level clearly indicates how well the water is aerated and it is a commonly measured
parameter because it is an immediate indicator of the biological processes that could occur, distinguishing
between aerobic biological processes and anoxic/anaerobic biological processes.
ORP is related to the concentration of oxidizers or reducers present in the water system. It can successfully
indicate the oxidative state of the wastewater, providing information on the variations in DO concentrations,
oxidized compounds (such as nitrites, nitrates or sulphates). ORP behaviors in the time could provide useful
information both on microorganism activity and bioprocess inhibition, which can be caused by an insufficient
chemical oxygen demand (COD) to total Kjeldhal nitrogen (TKN) ratio (COD/TKN) or by the presence of some
toxic compound in the influent (De la Vega et al. 2012). Further, ORP may provide information about some
operational conditions such as over-loading, under-loading, over- and under-aeration (Tanwar et al. 2008). ORP
was used as a monitoring and controlling parameter to manage the conventional biological nitrogen removal
pocess in SBR systems (Andreottola et al. 2001; Obaja et al. 2003).
The pH describes the degree of acidity or alkalinity of a water system and it is directly related to the
hydrogen ion (H+) and the hydroxyl ion (OH-) consumption or production. It is a good indicator of ongoing
biological reactions, increasing for ammonification, denitrification and anammox processes and decreasing for
nitrification (Chang and Hao 1996; Gut et al. 2007).
Conductivity (EC) variations in wastewater have been found difficult to understand. EC is a general indicator
related to the amount of dissolved salts, to cations and anions (mostly inorganic) present in the wastewater. In
the case of release of high concentrations of ions (bases, acids, salts), the conductivity variations could be used
to monitor processes that causes changes in total ion content, i.e H +, OH- and many nutrients, such as NH4+,
NO3-, NO2
-, H2PO4- and HPO4
2- (Levlin 2009). It has been observed that the conductivity correlates very well
with and P-release and P-uptake in the enhanced biological phosphorus removal processes (Maurer and Gujer
1995). Further, has been recently demonstrated that conductivity measurements also correlate well with the
ammonium concentration (Levlin 2009) and could be used to monitor the partial nitritation/anammox system for
nitrogen removal (Gut et al. 2007).
1.2 pH, DO,ORP and EC variations in a conventional nitrification- denitrification SBR
In general, sequencing batch reactor (SBR) systems have been widely applied to the conventional nitrification
and denitrification process and many researches had applied a control method based on indirect parameters to
optimize the nitrogen, phosphorous and carbon removal efficiencies (Andreottola et al. 2001; Cui et al. 2009).
Usually the SBR configuration used in the conventional nitrogen removal is characterized by step-feed and either
by the alternation of aerobic and anoxic stage in order to obtain nitrification and denitrification, or by the
alternation of short anoxic and aerobic stages, in order to obtain pre-denitrification and nitrification in sequence.

Chapter 6
186
The behavior of pH, DO and ORP can be used to identify specific control points of the biological processes
(Andreottola et al. 2001). The indirect parameters have been studied also for monitoring combined nitrogen and
phosphorus removal processes (Chang and Hao 1996). Conductivity has been used to monitor an SBR operated
for enhanced biological phosphorus removal (EBPR) (Aguado et al. 2006) and further for controlling nutrient
removal processes (Levlin 2009). Thus, typical pH, DO, ORP and EC profiles, characterized by several well
defined control points, have been identified carrying on conventional nitrification- denitrification in an SBR
(Fig. VI.1).
In a conventional activated sludge (CAS), AI-Ghusain and Hao (1995) showed that, according to the
nitrification reaction, the pH value decreases converting ammonia to nitrate, as hydrogen ions are produced. The
first step of nitrification, the oxidation of ammonia to nitrite, actually produces hydrogen ions. However in a
CAS system, NOBs are not inhibited and the growth rate of NOBs is always higher than AOBs, always achiving
a complete nitrification process (nitritation + nitratation) (Wiesmann 1994). Therefore in a CAS system the pH
decrease is usually related to the complete nitrification process. When ammonia depletion is achieved, a
minimum appears in the pH profile and then the pH value starts to increase due to the CO2 stripping, also
depending on the aeration system energy. The end of ammonia oxidation (nitrification) is known as “ammonia
valley”. By detecting the breaking point in the pH profile, the duration of aerobic phase could be controlled and
optimized, avoiding excess of oxygen furniture. After the ammonia valley, in the anoxic phase, the pH increases
due to the additional alkalinity produced through ammonification, denitrification or phosphate uptake, and
reaches a plateau value. Usually, in denitrification process the complete depletion of NOx corresponds to an
apex in the pH profile, called the “nitrate apex” and can be used to signal the end of the anoxic cycle.
When aeration is run continuously, a DO blending point can be observed in the DO curve, related to the
depletion of ammonia as well as nitrite in the nitrification process (DO Elbow). The DO blending point is a flex
with a positive slope in the DO curve and corresponds to a decrease in bacterial respiratory activity due to the
depletion of substrates (Pavgelj et al. 2001). Thus, in continuous aeration systems where a complete nitrification
is required, DO concentration may also be used for the detection of the aerobic phase termination. Nevertheless,
not always the DO blending point can be detected at the end of ammonia depletion (Akın and Ugurlu 2005),
probably due to a residual nitrite consumption.
Concerning the ORP, according to Peddie et al. (1990) a characteristic and reproducible ORP profile can be
associated with the cycled operation of a conventional nitrification – denitrification in an SBR. A first bending
point corresponds to the beginning of the aerobic phase when the aeration is switched on. During the aerobic
phase, ORP increase as NOx are produced. When the aeration is run continuously, an ORP blending point
(nitrogen break point) can be observed, coinciding with the DO blending point (DO Elbow), due to the dissolved
oxygen increase caused by ammonia depletion. When the aeration is switched off, the ORP will decrease
quickly, reaching negative values. In anoxic conditions, the ORP is dominated by NOx concentration. Due to
nitrate and nitrite consumption, ORP starts to decrease at a slow rate initially, but it falls steeply when the
process reaches a blending point, known as ‘‘nitrate knee’’ of the ORP profile. The “nitrate knee” coincides
with the “nitrate apex” in the pH profile and indicates the end of anoxic phase (denitrification) and the beginning
of the anaerobic phase in the enhanced biological phosphorus removal process. Recognizing this trend, it is
possible to reduce the anoxic period, resulting in time saving with respect to the fixed-timing switching scheme.

Chapter 6
187
Fig. VI.1 pH and Oxidation–Reduction Potential in an Alternating Aerobic–Anoxic System (Kim and Hao 2001)
Conductivity shows a correlation with P-release and P-uptake in a sequencing batch reactor (SBR) operated
for enhanced biological phosphorus removal (EBPR), in both anaerobic and aerobic stages, increasing or
decreasing when phosphorus is released or taken up, respectively (Aguado et al. 2006). Spagni et al. (2001),
showed that it was difficult, in their experiment, to correlate conductivity decrease and P-uptake in aerobic
conditions, due to the stripping of carbon dioxide. On the contrary, over the denitrification process, the
conductivity was stable as a result of two opposite and simultaneous phenomena: nitrate removal and P-release.
As soon as the denitrification was over, conductivity increased and a plateau was reached when P-release ended.
Levlin (2009) showed different changes in conductivity in biological nitrogen removal processes, depending on
the alkalinity content of the system. Ammonium, nitrite and nitrate have almost the same molar conductivity.
Thus, in nitrification process, if the amount of the available alkalinity is high enough (one mole alkalinity per
mole ammonia), biological N-removal through nitrification will give a decrease of conductivity, mainly due to
the alkalinity consumption and to the transfer of hydrogen carbonate to carbon dioxide. On the contrary, even if
in denitrification process alkalinity is produced, the conductivity decreases due to nitrate and nitrite
consumption.
However, the trends of the aforementioned indirect parameters (ORP, pH, DO and EC), the blending and
breaking points in ORP, pH and DO curves and their relations with the biological processes depend on the
nitritation, nitratation and denitrification rate and can vary from one biological system to another and from one
wastewater to another.
As recently pointed out by Guo et al. (2009) in the nitrification process, the pH decrease in the aerobic phase
is only related to the ammonia conversion into nitrite (nitritation), while over the nitrite oxidation to nitrate
(nitratation) there is no hydrogen ion production and, thus, any further pH decrease. Moreover, the presence of
organic matter and other chemical compounds, such as sulphates or nitrates, in raw wastewaters, could determine
different behaviors in DO and ORP profiles (Ra et al. 1996). Usually, for low COD/N ratios in the influent, in a
conventional nitrification/denitrification process the ‘‘nitrate knee’’ or the ‘‘nitrate apex’’ are unlikely to appear,
due to the carbon limitation (De la Vega et al. 2012). Furthermore, the effects of the residual oxygen and the
over-aeration have been proved to cause problems when using the ORP to provide an on-line control of the
biological system (Han et al. 2008).

Chapter 6
188
2. Materials and Methods
2.1 Reactor set up
SBR reactor. A lab scale Sequencing Batch Reactor (SBR) with a maximum working volume of 8 L was
operated with the SNAD sludge from the full-scale SBR in Zürich, Switzerland (Joss et al. 2009). The seed
sludge contained granules surrounded by a matrix of brownish flocs. Two kinds of granules (red and brown)
could be distinguished. The initial total suspended solids (TSS) concentration of the whole sludge was 3 - 4 g
TSSL-1. The volatile suspended solids (VSS) were about 70% of the total suspended solids (TSS).
The SBR was first fed with a synthetic wastewater, prepared as reported in the Chapter V (Langone et al.
2013a). Then, the feed was switched to the anaerobic digester effluent from the wastewater treatment plant
(WWTP) of Trento, Italy. Fig. VI.2 shows the lab-scale reactor setup. The anaerobic digester effluent was store
in a 20 L storage tank and pumped into the SBR automatically at the start of each interval. Aeration was
provided by a air pump (Schego M2K3 350) with an air flow rate of 50 nL h-1, through n. 6 air diffusers placed
at the bottom part of the reactor. The air flow rate was manually fixed and adjusted in order to achieve a mass
transfer coefficient for oxygen (KLa) of 0.15 min-1 at 20°C. The DO set-point was fixed at a value of 0.2 ±0.1
mgO2 L-1. The reactor was equipped with a mechanical stirrer to ensure a complete but mild mixing, at low rpm
(150) to avoid size granule reduction. Further, the reactor was also equipped with acid/base pumps and a set of
two peristaltic pumps to introduce the feeding solution and to discharge the effluent. The reactor was water-
jacketed and the operative temperature was maintained at 30 and 25°C. The pH and ORP were measured using
Crison Instruments electrodes, (mod. 53.35 and 53.55, respectively, Crison Instruments Italy). The dissolved
oxygen (DO) was measured using a polarographic cell (mod. 60.50 Crison Instruments, Italy). The conductivity
(EC) was monitored by using a conductivity meters (mod. 53.88 Crison Instruments, Italy). Finally, the
temperature was measured both by the PT 100 included in the DO sensors T(DO), and by the PT 1000 included in
the conductivity meters T(CE).
Airpump
InfluentPump pH
O2,TORP
Effluent Pump
Sludge Extraction
Criostat
Tank
WL
Influent
Effluent
PC(Store data and control)
Relè
Base/AcidPump
Mixer
CDAQAcid/Alcaline
Tank
Tank
MassFlow meters
4 - 20 mA
EC
Fig. VI.2 Schematic representation of the 8L lab-scale SBR.

Chapter 6
189
2.2 SBR operation
The SBR technology operates from a sequence of fill, reactions, settle and draw phases which define a cycle to
be repeated over the time. A typical cycle of these characteristics was defined by a previous lab-scale study
(Langone et al. 2013a) in order to achieve a SNAD process (Fig. VI.3).
Filling phase. A short one time feed strategy was adopted. Thus, the filling phase was carried out under mixing
and anoxic conditions in order to create a suitable environment under which the growth rate was higher for floc-
formers than for filaments (Artan and Orhon 2005), in order to improve the granulation process. The short filling
phase ensured that the biomass was exposed initially to a high nitrogen load, and consequently to a high
concentration of Free Ammonia (FA), inhibiting the nitrite oxidizing bacteria (NOB) (Anthonisen et al. 1976).
The filling phase was mixed and non aerated and inserted into a short idle period where no oxygen was added, in
order to allow the consumption of (i) residual oxygen or alternative electron acceptors, such as nitrite, nitrate and
sulphate thanks to heterotrophic bacteria which may use the organics present in the influent (ii) residual nitrite
thanks to autotrophic anammox bacteria which may use the ammonium present in the influent. The filling was
considered to occur in an instant.
Reaction phase. The reaction phase consists of either one aeration/mixing phase per cycle or multiple
aeration/mixing phases per cycle in order to permit a complete nitrogen and carbon removal. The micro-aerobic
phase, under oxygen limitation, allowed the developed of nitritation process, inhibiting the activity of the nitrite
oxidizing bacteria (NOB) over the ammonia oxidizing bacteria (AOB), due to the lower oxygen affinity of NOB
(Wiesmann 1994). The length of the micro-aerobic phase should be chosen in order to oxidize only the 50% of
the ammonium present at the beginning of each cycle to nitrite, achieving a suitable TNN/TAN ratio for the
following anammox process. The length of the mixing phase should be enough long to deplete the residual
ammonium and nitrire by anammox process and any residual nitrate and nitrite by denitrification.
Settling phase. After the completion of the reaction phase, the biomass was allowed to settle. In order to obtain
a high biomass retention, a low minimum biomass settling velocity of 0.7 m h-1 was fixed, which is the ratio
between the vertical distance from the water surface to the effluent discharge point and the settling time
(Vlaeminck et al. 2009a). Depending on the pilot plant configuration, a short settling phase (7 min) was fixed,
also to improve the granulation phenomena (Liu et al. 2005).
Draw phase. The cycle ended with a window for the effluent discharge and eventually for the sludge wastage.
The sludge wastage phase could be set by choosing how often, the volume and the mode of the sludge discharge:
either at the end of the settling phase, as a concentrated sludge or at the end of the last mixing phase as a mixed
sludge. Idle. A final idle interval was optional.
∆t in,mix ∆t settle ∆t draw Idle
∆t in,mix ∆t settle ∆t draw Idle
∆t mixing ∆t micro-aeration Fill Draw
Fig. VI.3 Schematic representation of the possible SBR cycle configurations. (A) one aeration/mixing phase (B) multiple aeration/mixing phases
(A)
(B)

Chapter 6
190
2.3 Monitoring and control system.
The monitoring and control systems of the SBR consisted in a data acquisition system (cDAQ-9174, National
Instruments, Austin, TX, USA ) and our own software developed using LabVIEW 2010 software (National
Instruments, NI, Austin, TX, USA) (Fig. VI.4). The cDAQ-9174 (four slots) USB chassis was used to measure
analog I/O signals over a Hi-Speed USB 2.0 interface, through two NI C Series modules: a 16 analog voltage or
current input channels, 16-bit resolution (NI9208) and a 8 Channel C Series Relay, 60 VDC/30 Vrms, 750 mA
(NI 9485). The cDAQ channel configuration is summarized in the Supplementary Table VI-1.
Ten analog input (AI) channels were used to obtain the analog input signals, i.e., level, pH, DO, ORP, CE and
T(DO), T(CE) in the reactor and pH, CE ,T(CE) in the influent tank. The acquisition and control software developed
was able to acquire the on-line parameters, presenting them in a graphical interface. Signals were recorded and
stored in a simple .xls file for further processing. Control actions were transmitted by the cDAQ connected to the
relay output board (AO), which controlled the on/off switch of the electrical devices.
A. Data acquisition hardware (cDAQ) B. Main set up parameters
C. Fixed time control D. Real time control
Fig. VI.4 SBR monitoring and control system. (A) Data acquisition and control hardware (cDAQ). From (B) to (D) Screenshots of the data acquisition and control software developed using LabVIEW 2010 software: (B) main control section: pH, DO and Level; (C) “fixed time control” strategy; (D) “real time control” strategy.
7,3

Chapter 6
191
2.4 Control strategies
Two different control strategies were applied in this experiment to control the duration time of each phase of
the SBR cycle: a “fixed time control” and a “real-time control” strategy. The “fixed time control” strategy served
to evaluate the suitability of the SBR cycle pattern and the performance of the SNAD process. When the fixed
time control was adopted, the correlations of nitrogen and carbon removal with pH, ORP, EC and DO profiles
were investigated. During the fixed time control both the synthetic wastewater and the anaerobic digester
effluent were treated in order to see the influence of different wastewaters on the indirect parameters. Then, the
implementation of a “real-time control” strategy based on indirect parameters for a continuous SNAD-SBR
operation was examinated. The acquisition and control software developed was able to repeat over the time a
previously defined cycle operation by controlling the switching on/off devices.
In both strategies, the same control approach on the pH, DO and level was adopted. The pH was controlled,
allowing to vary in the wide pH range of 7.3 - 8.5 by the addition of acid (1 N HCl) and alkaline (1 N NaOH)
solutions through the on/off control of the acid/base pumps. The CO2 stripping phenomena and the inorganic
carbon limitation in micro-aerobic phase were reduced both by working at pH higher than 7.3 (Wett and Rauch
2003) and by using a low aeration energy system. During the micro-aerobic phase, the DO was controlled (DO =
0.2 ±0.1 mgO2 L-1), ensuing a low DO concentration by the on/off control of the aerator. The SBR had a level
control, which stopped either the influent pump, when a maximum water level was reached (8.0 L maximal
reactor volume) before the stop criteria of the influent pump had not yet been occurred, or the effluent and
sludge pumps, when a minimum water level was reached (7.0 L minimal reactor volume) before the stop criteria
of the effluent pumps had not yet been occurred.
2.4.1. Fixed time control.
Initially, a control strategy of the SBR operation based on the timers and on a simple on-line measurements of
DO, pH and liquid level of the bulk liquid was implemented (Fig. VI.4 -C). The lenght of the whole cycle and
the duration of each single phase within the time SBR cycle were fixed and adjusted manually in order to
achieve a stable SNAD process and high nitrogen removal efficiencies.
The SBR was operated with three 8 h operational cycles per day, regulated by a timer. The reactor was operated
with a fixed residual volume of ~7.0 L, which resulted in a volumetric exchange ratio (VER) of ~12% per cycle
and a hydraulic residence time (HRT) of 2.7 - 3 d. Each cycle consisted of 480 min and of six different phases:
fill, micro-aerobic react, anoxic react, settle, draw and idle. The cycle started with a short feeding (6.6 min)
during a mixing period for 10-15 min followed by a 120 - 210 min of micro-aeration and mixing phase and a 234
- 325 min of anoxic and mixing phase. After the completion of these 3 intervals the biomass was allowed to
settle for seven minutes. The cycle ended with a 12 min window for the effluent discharge. A final idle interval
was optional. During the whole cycle the on-line parameters were monitored, stored and further analyzed. The
pH was controlled in a wide range (7.3 – 8.5); the DO was fixed during the micro-aerobic phase (0.2 ±0.1
mgO2 L-1) while ORP and EC were completely left free to vary.

Chapter 6
192
2.4.2. Real-time control.
In a second step of the experiment, thanks to the results of the first step, it was possible to implemented a
“real-time control” strategy, mainly based on the on-line measurements of CE and ORP (Fig. VI.4 -D). The real-
time strategy was able to automatically adjust the lenght of the whole cycle and the duration of each single phase
within the time cycle. Further, the control on DO during the microareobic phase, on pH and level was always
present. The logic of the “real-time control” strategy is following described.
Feeding. The feeding started at the beginning of the cycle and ended either i) when a maximal conductivity
value has been reached, CEmax, corresponding to the maximum ammonium threshold: (i.e. 80 mgTAN·L-1) or ii)
when the maximal fill level of the reactor has been reached (8 L). The stirring unit was switched on during the
feeding.
Initial pause. An initial non aerated idle phase, prior to the aeration stage, had been designed both to avoid
aerating without the presence of sufficient ammonium substrate in the reactor according to Joss et al. (2009) and
to eventually remove the excess of nitrate and nitrite of the previous cycle, through anammox and denitrification
processes, being both NH4+ and COD present in the influent.
Aeration. The start of the first aeration phase occured either when a set conductivity value (CE1< CEmax) has
been reached or after a fixed delay has occurred. During the micro-aerobic phase, the DO was controlled,
ensuing a low DO concentration by the on/off aerator controling. The DO set-point was fixed at a value of 0.2
±0.1 mgO2 L-1. The aeration phase stopped either when the conductivity value decreased of a fixed ∆CE with
respect to its value at the beginning of the aeration phase or alternatively when the ORP control limit (ORP max)
has been reached. The ∆CE was chosen in order to have only a part of ammonium oxidation (i.e. 50%, partial
nitritation) while the maximum ORP value (ORPmax) was set in order to avoid high nitrite concentrations in the
reactor (i.e. maximum 20 – 30 mg TNNL-1), preventing the short and long effect of nitrite inhibition on
anammox bacteria (Bettazzi et al. 2010). A suitable TNN/TAN ratio for the sequent anammox process should be
achieved. An additional timer control of the aeration phase (∆taer) has been defined to ensure a continuous
operational SBR cycle, avoiding problems due to the malfunction of the conductivity or ORP sensor. Thus after a
fixed maximum duration (∆taer), the aeration terminated even if the other stop criteria had not yet been occurred.
Due to the low airflow rate, the stirring unit was switched on during the aeration in order to ensure a suitable
mixing inside the SBR.
Mixing . A mixing phase followed the aeration phase, where both anammox and denitrification processes
occured. The mixing phase stopped when a minimum ORP (ORPmin < ORPmax) control limits has been reached.
Also in this case, an additional timer control of the mixing phase has been defined (∆tmix) to ensure a continuous
operational SBR cycle.
Number of repetitions. The software had been developed taking into account that SBR configuration could
be characterized either by one aeration/mixing phase per cycle or by multiple aeration/mixing phases per cycle.
The number of repetitions depended on the conductivity value measured at the end of the mixing phase. The
cycle terminated when the set minimal conductivity value has been reached (CEmin< CE1 < CEmax). The number
of repetition implicitly depended on the ∆CE or ORPmax chosen in the aeration setting. Small ∆CE or low ORPmax
easily implied multiple aeration/mixing phases per cycle. For an increased operating reliability, a timer control
of the total reaction phase (aeration + mixing) has been defined, after which the cycle proceeded to settling phase
even if the other stop criteria had not yet been reached.
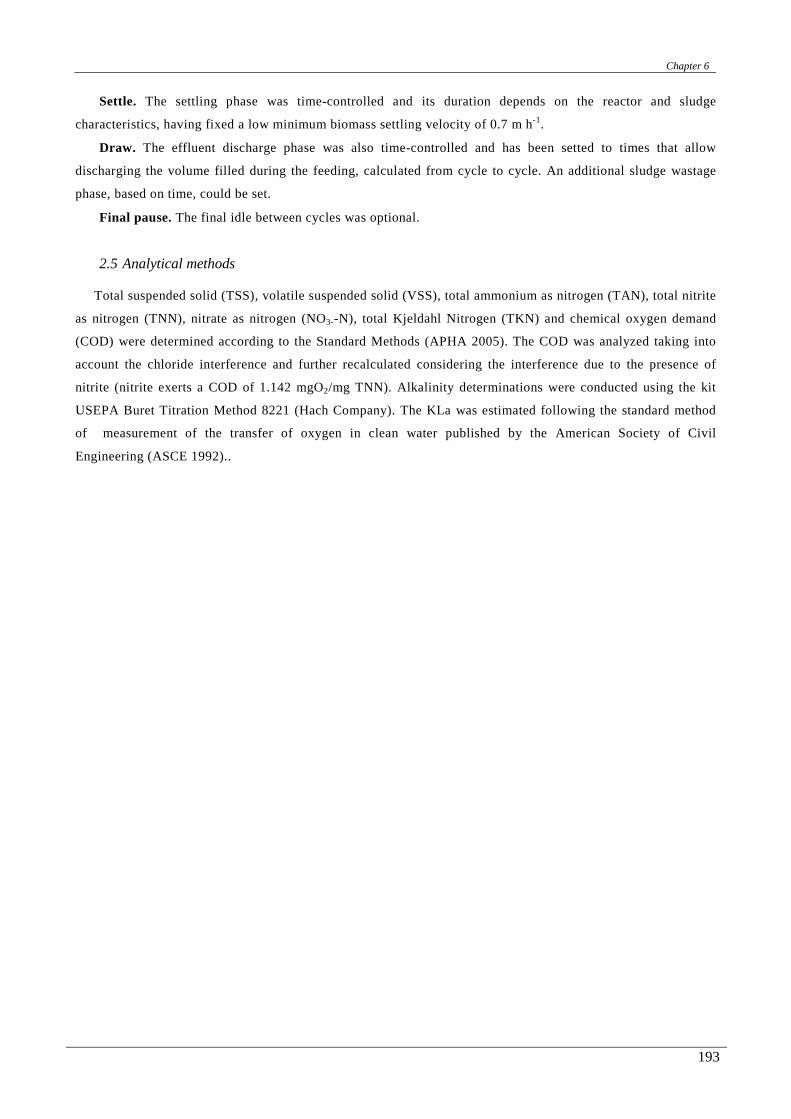
Chapter 6
193
Settle. The settling phase was time-controlled and its duration depends on the reactor and sludge
characteristics, having fixed a low minimum biomass settling velocity of 0.7 m h-1.
Draw. The effluent discharge phase was also time-controlled and has been setted to times that allow
discharging the volume filled during the feeding, calculated from cycle to cycle. An additional sludge wastage
phase, based on time, could be set.
Final pause. The final idle between cycles was optional.
2.5 Analytical methods
Total suspended solid (TSS), volatile suspended solid (VSS), total ammonium as nitrogen (TAN), total nitrite
as nitrogen (TNN), nitrate as nitrogen (NO3--N), total Kjeldahl Nitrogen (TKN) and chemical oxygen demand
(COD) were determined according to the Standard Methods (APHA 2005). The COD was analyzed taking into
account the chloride interference and further recalculated considering the interference due to the presence of
nitrite (nitrite exerts a COD of 1.142 mgO2/mg TNN). Alkalinity determinations were conducted using the kit
USEPA Buret Titration Method 8221 (Hach Company). The KLa was estimated following the standard method
of measurement of the transfer of oxygen in clean water published by the American Society of Civil
Engineering (ASCE 1992)..

Chapter 6
194
3. Results and discussion
3.1 Reactor performance (fixed time control)
The concentration of nitrogen species and carbon in the influent and in the effluent of the SBR, over the
entire experimental period using the fixed time control, as described in the section 2.4.1, are shown in Fig. VI.5
and Fig. VI.6 respectively. The SBR cycle pattern defined in the section 2.2 was able to achieve high nitrogen
and carbon removal performances treating synthetic wastewater at 30°C. High nitrogen removal efficiencies
were also achieved at moderate temperature (T=25°C). Finally, after a gradual acclimatation to the anaerobic
digester effluent, good results were achieved treating anaerobic digester effluent at 25°C. Our results showed
that the SBR cycle pattern defined was suitable for a SNAD process. However, the control strategy based on the
“fixed time control” required a constant supervision of the process and manual adjustments of the SBR cycle
confifuration. Further, often indesiderable situation occurred, such as the accumulation of nitrite and nitrate in
the system as well as the complete depletion of ammonium.
Time [day]0 5 10 15 20 25 30 35 40 45 50 55 60 65 70 75
SBR t
ime [
min]
0
100
200
300
400
500
TAN,
TNN,
N-NO
3- eff [m
g L-1
]
0
50
100
150
200
250
TAN in
f [mg L
-1]
0
100
200
300
400
500
T SBR cycleT aeration TAN eff TNNeff
N-NO3 - eff TAN inf
T = 30°C T = 25°Csynthetic wastewater digestate mixture
Fig. VI.5 Concentration of the nitrogen species in the influent and effluent of the SBR during the fixed time control strategy.
Time [day]0 5 10 15 20 25 30 35 40 45 50 55 60 65 70 75
SBR t
ime [
min]
0
100
200
300
400
500
COD [m
g L-1
]
0
100
200
300
400
500
T SBR cycleT aeration CODfiltr effCODfiltr inf
T = 30°C T = 25°Csynthetic wastewater digestate mixture
Fig. VI.6 Concentration of the COD in the influent and effluent of the SBR during the fixed time control strategy.
Influent and effluent characteristics are presented in Table VI-1. With an average hydraulic retention time
(HRT) of 3 d and a reactor TSS concentration of 3-4 g L-1, the achieved nitrogen removal rate (NRR) was 0.125

Chapter 6
195
kg-N m-3 d-1 at maximum. The total ammonia and the total nitrogen removal efficiencies were comparable to the
efficiencies of other SBR systems performing the SNAD process at 30°C, achieving values of 93% and 81%
respectively. The nitrogen removal efficiencies at 25°C achieved in this study were significantly higher than
other studies at moderate temperatures. The C/N ratio in the influent was lower than 1, between 0.4 - 0.9. The
COD removal was in the range of 70 – 80%, suggesting that nitrogen removal via denitrification occurred. A
summary of several experimental studies described in literature is given in Table VI-2.
Table VI-1 Characteristic of the nitrogen removal over the fixed time control experiment Average influent and effluent specifications of the SBR
Parameter Period I Period II Period III
Influent Effluent Influent Effluent Influent Effluent Wastewater Synthetic wastewater Synthetic wastewater Digester effluent
Period [d] 1-17 18-53 68-77 Temperature reactor [°C] 30 25 25 NLR [kgN m-3 d-1] 0.134±0.026 0.136±0.036 0.131±0.011
OLR [kgCOD m-3 d-1] 0.077±0.019 0.11±0.05 0.06±0.03 TAN removal rate [%] 98.5±1.7 96.1±3 98.4±2 TN removal rate [%] 93.2±4.2 91.8±5 88.6±4
COD removal rate [%] 81.7±11.9 77.0±2.1 70.1±12 NRR[kgN m-3 d-1] 0.125 0.125 0.116
TAN [mgN L-1] 415±36 5±6 428±55 15±14 374±27 6±8 TNN [mgN L-1] 0 13±14 0 9±12 0 6±15 NO3-N [mgN L-1] 0 9±5 0 10±9 0 37±21 COD tot[mgCOD L-1] 236±44 44±23 319±100 93±82 323±73 93±73
CODfiltr [mgCOD L-1]] 231±40 40±18 310±90 68±57 156±85 73±36 TSS [g L-1] - 0.05 - 0.09 - 0.08
During the “fixed time control” experiment, the length of each phase of the SBR cycle was manually adapted
in order to achieve high nitrogen and carbon removal efficiencies in the SNAD process. In particular, the
duration of the micro-aeration phase, key factor to achieve a partial nitritation over the whole cycle, was
regulated cycle by cycle after batch analysis on the SBR effluent, requiring time and chemical costs.

Chapter 6
196
Table VI-2 Overview of typical innovative nitrogen removal processes
Wastewater CODbio/N Reactor
type Volume
SBR configuration
Fill Aeration
mode DO
[mg L -1] Inoculum HRT [d] pH T [°C]
VSS [gL -1]
OLR [gCOD L -1d-1]
NLR [gTN
L -1d-1 ]
Removal rate
[g TN L -1d-1]
%TAN % TN %COD Reference
Synthetic wastewater
0 SBR 2.5 L 1h cycle instantaneous beginning cycle continuous 0.3-0.7 OLAND biomass 0.2 >7.4 33±1 2.3 0 1.5* 1.1 73%* - 0
De Clippeleir et al. 2009
Synthetic wastewater
1:2 GSBR 18 L 24h cycle continuous continuous 0.5 – 1.0 SNAD sludge
3 7-8 35 - 0.033 0.066 0.061*
92,6% (85% PN+
Amx; 7,3% Den)
93% 72% Lan
et al. 2011
Synthetic wastewater
0 SBR 3 L 12h cycle intermittent intermittent 1.0 – 1.5 active sludge+
anammox biomass 1.5 7.2-8 30 1.2 0 0.187 0.140* 65% 70% 0
Xu et al. 2010
Synthetic wastewater
1:1.8 SBR 8 L 8 h cycle instantaneous beginning cycle
intermittent 0.2-0.3 SNAD sludge
3 7.5-8.3 25 1.9 0.11 0.136 0.125 96% 91.8% 77% This study
Synthetic wastewater
1:2 NRBC small nd nd continuous 0.4 – 0.6 nitrifying biomass+
anammox biomass 0.25 nd 35 nd 0.34 0.69 70% 79% 94%
Chen et al. 2009
Digester effluent
1:1.2 SBR 140L 8 h cycle interval continuous 0.3-0.5 SNAD sludge
2.5* - 30 -26 3.3* 0.31 0.4 0.36* 95% 90% 71-74% Lackner, et al
2012 Digester effluent
1:3 SBR 500 m3 8h cycle continuous intermittent 0.2-0.3 activated sludge
- 7 -7.1 28 ±1 3 0.14* 0.43* 0.37* 85.8% 90.3% 56%* Wett 2007
Digester effluent
1:2 SBR 1400 m3 6-8h cycle instantaneous beginning cycle continuous <0.8
activated sludge + anammox biomass
1.45* - 30±3 3.6 0.2* 0.45* 0.42* 94.6* 95%* 37%* Joss
et al 2009 Digester effluent
1:1.2 SBR 1.5L 5.75h cycle continuous Air pulsing 0.1 -2 granular nitrifying + anammox biomass
0.5 7.5-7.9 20-24 1.5-4.5 - 0.7 0.25-0.45 35 - 64% nd nd Vázquez-Padín
et al 2009b Digester effluent
nd GSBR 1.5L 3 h cycle continuous Air pulsing 2.7 granular
heterotrophic 0.25 - 20 5 - 1.6* 1.0 60% nd nd
Vázquez-Padín et al 2009a
Digester effluent
1:2.5 SBR 8 L 8 h cycle instantaneous beginning cycle intermittent 0.2-0.3
SNAD sludge
3 7.3-8.3 25 1.9 0.08 0.15 0.14 96% 88% 58% This study
Landfill Leachate
1:2.6 SBR 3 L 12h cycle intermittent beginning cycle intermittent 1.0 – 1.5
active sludge+ anammox biomass
1.5 7.2-8 30 1.5 0.36* 0.961 0.896* 92% 92%
95% BOD
(6,7% COD)
Xu et al. 2010
Landfill Leachate
nd SBBR 3 L 24h cycle intermittent beginning cycle intermittent 0.6 active sludge 0.16 7.8-8.54 25-30 nd - - - 97% 86% -
Xiao et al 2009
Landfill Leachate
1:10 Aeration tank 384 m3 nd continuous continuous 0.3 active sludge 1.26 7.4 30 1.5 0.44 0.5 0.38*
75% (%68 PN+
Amx; 8% Den)
80% 28%
(Den) Wang
et al. 2010
Landfill Leachate 1:1.15 SBR 4 L 6 h cycle instantaneous
beginning cycle intermittent 0.2-0.3 SNAD sludge 3.8 7.3-8.3 30 1.9-2.3 0.33 0.34 0.24 87% 74% 34% This Study
Opto-electric 1:5 SBR 2.5 L 24h cycle continuous 12h continuous 0.1 SNAD sludge
2.5 7.8-8.0 25 2.3 0.04 0.23 0.197 85% 90% 70% Daverey
et al. 2012 PN=Partial Nitritation, Amx= Anammox, Den = Denitrification
*value calculated

Chapter 6
197
3.2 Variation of CE, pH, DO and ORP over a SNAD-SBR cycle (fixed time control)
During the “fixed time control” strategy, the variation of nitrogen species for the typical cycle pattern of the
SBR, performing the SNAD process, have been studied and compared to the profile of pH, ORP, DO, EC in
order to define a correlation with the ongoing biological processes.
In an SBR cycle, it was observed that TAN concentration gradually decreased with elapsed time under micro-
aerobic conditions, while a corresponding increase of nitrite was detected. During the micro-aerobic phase, an
increase of nitrate concentration can be observed both due to the not complete washout/inhibition of nitrite
oxidized and to the low contribution of the anammox process under oxygen limited conditions (Yan et al. 2012).
At the end of the micro-aerobic phase a consistent nitrite concentration and a residual ammonia content was
measured. Then, in the mixed-anoxic phase a decrease of both ammonia and nitrite was observed, which was
referred to the anammox activity. Further, analyzing the COD profiles over the SBR cycle (data not shown), it
can be deduced that the aerobic biodegradable organic compounds oxidation was combined with the nitritation
process during the micro-aerobic phase while the denitrification was coupled with the anaerobic ammonium
oxidation during the anoxic phase. Denitrification could both reduce nitrate to nitrite and nitrite to di-nitrogen
gas, if biodegradable carbon source is available. The decreasing COD profiles in the anoxic phase showed that
heterotrophic denitrifiers are active during the anoxic phase, especially using synthetic wastewater where more
biodegradable organic matter was present.
CE, pH, DO and ORP over typical cycles were on-line monitored in a time-course experiment and a complete
set of the on-line data is provided in the following sections. Each signal was analyzed, in order to monitor the
SNAD process in an SBR and further to establish a “real-time control” strategy. An in-depth understanding of
the relation between degradation and conversion of NH4+/NO2
-/NO3- with variations of the indirect on-line
measurements was detected. A good relation between the on-line parameters and the development of the SNAD
process has been observed in the fixed time control strategy, treating both the synthetic wastewater and the
anaerobic digester effluent,
3.2.1 pH correlation
As the pH was left free to vary in a wide pH range (7.3 - 8.5), it follows the processes behavior over the SBR
cycle (Fig. VI.7). During the whole experiment, the pH value remained stable in the range of 7.3 – 8.3 with no
external addition of base or acid. The pH value in the reactor was mainly determined by the balance of the added
alkaline influent, the hydrogen ions production during nitritation, the hydrogen ions consumption during
anammox processes and OH- production during denitrification process. In the normal operative conditions, the
pH increased towards the upper pH set-point during the feeding event, due to the high alkalinity content in the
influent and a possible denitrification in the short anoxic fill period, reaching a maximum value (αpH) at the end
of the filling phase. According to the nitritation process, during the micro-aerobic phase, the pH decreased
linearly in the course of converting ammonia to nitrite as hydrogen ions are produced until the aerator was
switch off, and a minimum pH value (βpH) was measured at the end of the micro-aeration phase. On the contrary
of the nitritation process (aerobic oxidation of ammonia to nitrite), the nitratation process (aerobic oxidation of
nitrite to nitrate) does not produce hydrogen ions. Thus, any pH variation in micro-aerobic phase can be
associated with the nitratation process. When a maximum concentration of nitrite of 20-40 mg L-1 was achieved
in the reactor, ensuing a proper TNN/TAN ratio for anammox process, the aeration was turn off manually. As
consequence of the switch off of the aerator, an increase in pH was observed in the next anoxic phase. The pH

Chapter 6
198
increase depends (i) on the OH- production by the denitrification process, which depends on the availability of
biodegradable organic matter; and (ii) on the H+ consumption by anammox process during cell synthesis.
In this experiment performing the SNAD process, a minimum of the pH profile (βpH) appeared but it did not
occurred spontaneously. The minimum βpH occurred when the aeration was turn off, as programmed in the “fixed
time control” strategy. At the end of the micro-aeration phase in the SNAD-SBR, only a part of ammonia was
removed, while a residual part was available for the anammox process in the following mixing phase. As
consequence, the breaking point in the pH profile cannot be interpreted as the breaking point known as
“ammonia valley” in the convetional nitrification/denitrification SBR, which is related to the complete depletion
of ammonia. The minimum in the pH profile may be used to monitor the development of the whole SNAD
process rather than to control and adjust the duration of the micro-aerobic phase.
At the end of the anoxic phase, another breaking point in the pH profile can be observed (γpH), which was
related to the complete depletion of NO2-, while nitrates were still present in the system. This breaking point
recalls the apex in the pH profile in conventional nitrification/denitrification SBR, even if “nitrate apex” was
related to the nitrate depletion. However, γpH similarly to the “nitrate apex” could be used to signal the end of
the anoxic phase. In the SNAD system, γpH can be associated with the end of anammox reaction due to nitrite
depletion. After the occurrence of the breaking point (γpH), pH continued to increase with a lower slope, which
depends on the ongoing denitrification process.
Hence, the pH behaviors could be used mainly to monitoring the end of the micro-aerobic and anoxic phases.
In addition, the pH profile after the breaking point (γpH) could be also used to regulate the length of anoxic phase
in order to deplete nitrite through anammox process and further nitrate through denitrification process, if CODbio
is available.
3.2.2 ORP correlation
In the normal operative conditions, after the filling period, the ORP decreased reaching a minimum (αORP), as
a result of sludge mixing with the influent to treat, and, probably, also due to the consumption by anammox or
denitrification process of residual nitrite and nitrate in the systems, accumulated from the previous cycle. When
the aeration was switched on, the ORP value sharply increased and reached a maximum value (βORP), due both to
the presence of the dissolved oxygen in the systems and to the progressively oxidation of ammonium to nitrite,
and eventually to nitrate, as nitrates were also produced during the aeration phase as reported above. During the
SBR micro-aeration phase, the ORP value increased reaching maximum values between + 50 - +100 mV,
depending on the nitrite and nitrate concentration achieved in the bulk liquid. In Fig. VI.8, a maximum ORP
(βORP) of + 50 mV was achieved correspondent to about 20 mg TNN L-1 and 8 mg NO3--N L-1. When anoxic
period started, the ORP value quickly decreased due to the aeration switch-off and to the complete oxygen
depletion. Then, the ORP showed a sharp decrease reaching negative values whereas nitrite were consumed
mainly by anammox process and nitrate by denitrification process.
In the anoxic phase, when nitrite were depleted, a blending point could be detected (γORP), corresponding to
the breaking point in the pH profile (γpH). The blending point (γORP) could be related to the ‘‘nitrate knee’’ of the
ORP profile of the conventional SBR. However, unlike in the conventional SBR, here, the γORP indicates the
depletion of nitrite, rather than nitrate, and, thus, the end of anammox process due to nitrite limitation.
As nitrate were still present in the system (5 mg NO3--N L-1), after this blending point a further decrease of
ORP can be detected. The amplituted of the further ORP decrease (∆ORPden) depended on the availability of
biodegradable COD, necessary to carry on the reduction of nitrate by denitrification process. The ORP reached a

Chapter 6
199
minimum value at the end of the anoxic phase (-100 mV). A complete depletion of nitrate and nitrite was
observed at around – 300 to -400 mV (Ra et al., 1998).
Recognizing this trend, it is possible to reduce the micro-aerobic and the anoxic period, resulting in time
saving with respect to the fixed-timing switching scheme. Under stable SNAD conditions, the maximum ORP
value could be used as indicator of high nitrite concentrations. Further, the minimum value of the ORP signal,
could be used to signal the end of the anoxic cycle, due to the nitrite and nitrate depletion, either prior to another
aerobic phase or prior to the end of the cycle, depending on the residual ammonia concentration.
time [h:mm]
10 :1 1
11 :1 1
12 :1 1
13 :1 1
14 :1 1
15 :1 1
16 :1 1
17 :1 1
18 :1 1
[mg N
L-1]
10
30
50
70
0
20
40
60
80
pH
7,2
7,4
7,6
7,8
8,0
8,2
TANTNNNO3
--NpH
microaerobic ano xic set
tle
Fill
Dis
char
ge
Fig. VI.7 On line data of the pH and nitrogen species over an SBR cycle
time [h:mm]
10:11
11:11
12:11
13:11
14:11
15:11
16:11
17:11
18:11
[mg N
L-1]
10
30
50
70
0
20
40
60
80
ORP [
mV]
-250
-200
-150
-100
-50
0
50
100ORP
microaerobic ano xic set
tle
Fill
Dis
char
ge
Fig. VI.8 On line data of the ORP and nitrogen species over an SBR cycle
αpH
βpH
γpH
αORP
βORP γORP
∆ORP_den
∆ OR
P_a
nox
∆ OR
P_a
er

Chapter 6
200
3.2.3 CE correlation
At the beginning of each cycle, influent was fed and a sharp increase of conductivity was observed (αEC), as a
result of sludge mixing with a high salinity influent. Then, the aeration was switched on and the EC decreased
due to the biological conversion. The EC value takes into account both the decrease of salinity due to the
ammonia consumption and increase of the salinity due to the nitrite and nitrate production. Ammonium, nitrite
and nitrate have almost the same molar conductivity. However, if in a system there is enough alkalinity, the
biological N-removal through nitrification will give a decrease of conductivity, mainly due to the alkalinity
consumption, according to Levlin (2009). When the aeration was switched off, the EC again decrease reaching a
minimum (γEC) at the end of the anoxic phase due to the anammox and denitrification processes. Even if
denitrification process produces alkalinity, conductivity profile decreased due to ammonium and nitrite
consumption by anammox process and nitrate and nitrite consumption by denitrification. The amount of nitrate
produced in the anammox process is only a little part of the ammonium anaerobically oxidized, thus the overall
effect was an EC decrease in the anoxic phase. At the end of the anoxic phase, in the time fixed control strategy,
the EC value was constant, as no anammox and denitrification processes occured. Over the whole SBR cycle a
decrease in EC can be detected from a maximum value (αEC) at the end of the filling phase to a minimum value
(γEC) at the end of the anoxic phase. The EC value, at the beginning and at the end of the SBR cycle, indirectly
follows the ammonium profile. EC could be used as an useful signal to detect both the end of the filling phase
and the end of the anoxic phase.
3.2.4 DO and OUR correlation
As a DO set point was fixed during the micro-aerobic phase, using the on/off control on the aerator, the
classical DO profile is reported in Fig. VI.10. The DO signal was only detectable during the micro-aerobic phase
and concentration were an overage around 0.2 – 0.4 mg L-1. During the anoxic phase no oxygen was detected. A
DO breaking point (βDO) occurred as consequence of the aerator switch off, corresponding to the minimum of the
pH value (βpH) and to the maximum of the ORP value (βORP). Also in this case like for the pH, the breaking point
in the DO profile cannot be effectively used to adjust the duration of the micro-aerobic phase, but only as a
monitoring parameter, indicating the turn off of the aeration and the passage from the micro-aerobic to the
anoxic phase.
Further, in this experiment the slopes of the decrease in DO concentration during the micro-aerobic period of
the SBR (during the aeration off period of the DO control) were measured by determining the oxygen uptake rate
(OUR, mg O2 L-1h-1) (Fig. VI.11). According to Andreottola et al., (2002), the OURs were calculated from the
on-line DO drop measurements when no air flow was supplied. The OUR values indicated the biological activity
in the reactor during micro-aerobic step. In the micro-aerobic phase, the DO concentration available in the
system is utilized to oxidize both COD and ammonia, by aerobic heterotrophic and autotrophic bacteria,
respectively. This is confirmed by the COD and TAN decrease in micro-aerobic phase. The OUR assumed a
lower value at the beginning of the micro-aerobic phase, then it increased and it was approximately constant (15
mgO2 L-1 h-1) until the end of the micro-aerobic phase. Nevertheless, as also previously reported in other studies
(Blackburne et al. 2008c), it was difficult to find an easily implementable correlation between the OUR value
and the length of the micro-aerobic phase of a SNAD-SBR system, as partial nitritation and carbon oxidation
occurred simultaneously.
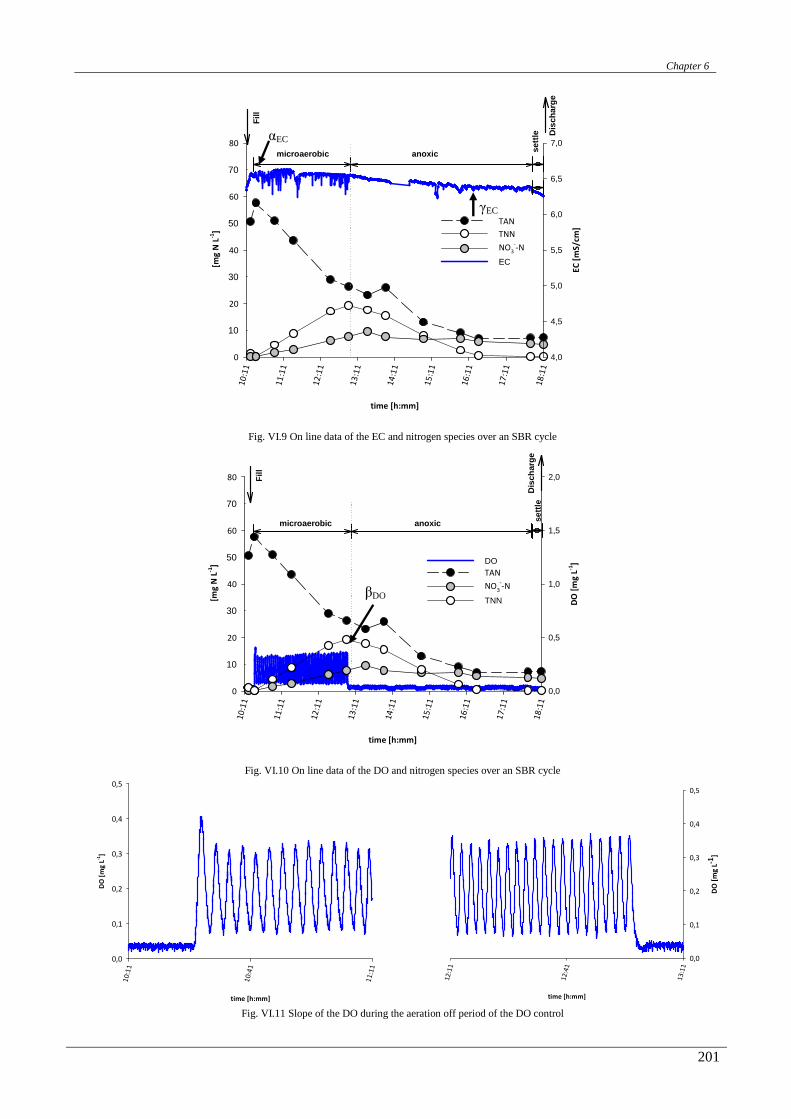
Chapter 6
201
time [h:mm]
10 :1 1
11 :1 1
12 :1 1
13 :1 1
14 :1 1
15 :1 1
16 :1 1
17 :1 1
18 :1 1
[mg N
L-1]
10
30
50
70
0
20
40
60
80
EC [m
S/cm]
4,0
4,5
5,0
5,5
6,0
6,5
7,0
TANTNNNO3
--NEC
microaerobic ano xic set
tle
Fill
Dis
char
ge
Fig. VI.9 On line data of the EC and nitrogen species over an SBR cycle
time [h:mm]
10 :1 1
11 :1 1
12 :1 1
13 :1 1
14 :1 1
15 :1 1
16 :1 1
17 :1 1
18 :1 1
DO [m
g L-1
]
0,0
0,5
1,0
1,5
2,0
[mg N
L-1]
10
30
50
70
0
20
40
60
80
DO TANNO3
--NTNN
Fill
Dis
char
gemicroaerobic ano xic s
ettle
Fig. VI.10 On line data of the DO and nitrogen species over an SBR cycle
time [h:mm]
10 :1 1
10 :4 1
11 :1 1
DO [m
g L-1
]
0,0
0,1
0,2
0,3
0,4
0,5
time [h:mm]
12 :1 1
12 :4 1
13 :1 1
DO [m
g L-1 ]
0,0
0,1
0,2
0,3
0,4
0,5
Fig. VI.11 Slope of the DO during the aeration off period of the DO control
αEC
γEC
βDO
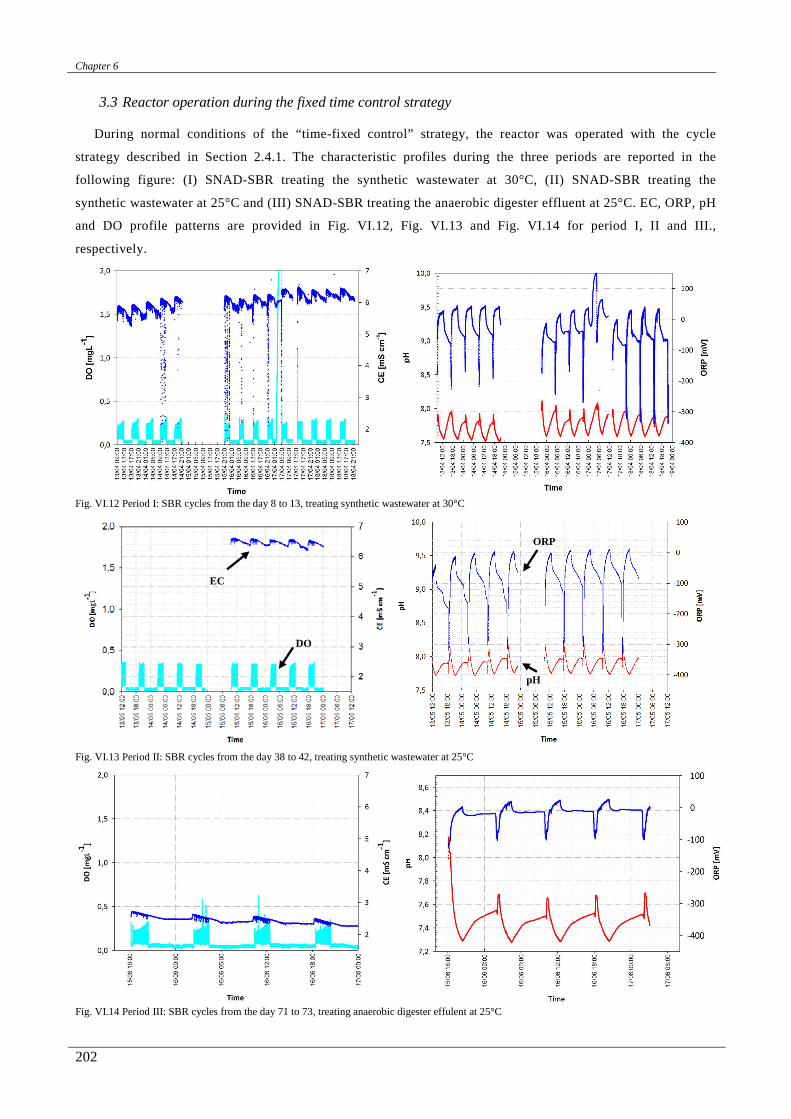
Chapter 6
202
3.3 Reactor operation during the fixed time control strategy
During normal conditions of the “time-fixed control” strategy, the reactor was operated with the cycle
strategy described in Section 2.4.1. The characteristic profiles during the three periods are reported in the
following figure: (I) SNAD-SBR treating the synthetic wastewater at 30°C, (II) SNAD-SBR treating the
synthetic wastewater at 25°C and (III) SNAD-SBR treating the anaerobic digester effluent at 25°C. EC, ORP, pH
and DO profile patterns are provided in Fig. VI.12, Fig. VI.13 and Fig. VI.14 for period I, II and III.,
respectively.
Fig. VI.12 Period I: SBR cycles from the day 8 to 13, treating synthetic wastewater at 30°C
Fig. VI.13 Period II: SBR cycles from the day 38 to 42, treating synthetic wastewater at 25°C
Fig. VI.14 Period III: SBR cycles from the day 71 to 73, treating anaerobic digester effulent at 25°C
DO
EC
ORP
pH

Chapter 6
203
In the whole experiment the on-line parameters patterns were reproducible. The anoxic filling phase followed
by a short mixed-anoxic idle, determined an increase of EC and pH and a decrease of ORP. When the aeration
was switched on, the ORP showed a sharp increase whereas the pH and EC decreased steadily due to biological
conversion processes. During the anoxic phase, EC continued to decrease slowly, and whereas the pH increased
the ORP decreased due to denitrification and anammox processes.
Fig. VI.12 and Fig. VI.13 shows examples of the characteristic profiles patterns of the indirect parameters
from the day 8 to 13 and from the day 38 to 42, treating the synthetic wastewater at 30°C and 25°C, with 3 cycle
per day (Period I and Period II). Treating the synthetic wastewater, conductivity values were in the range of 6.5
– 5.5 mS cm-1. Each cycle starts with the addition of synthetic wastewater to the reactor under anoxic condition.
The conductivity reaches its maximum value (αCE) due to the addition of ammonium. Then, the conductivity
decreased both in micro-aerobic phase and anoxic phase. At the end of the cycle the conductivity values were
constant, mainly indicating the end of anammox process and a minimum EC value was reached (γCE). However,
the values of conductivity in the system are wastewater specific. Treating the anaerobic digester effluent, the
conductivity gradually decreased. When stable conditions were achieved (day 71-73) the conductivity values
varied between 3 – 2 mS cm-1 (Fig. VI.14). However, appliying similar nitrogen loading rates (NLR), Fig. VI.15
shows that, even if the value of conductivity depends on the kind of wastewater, the delta values of conductivity
obtained during the micro-aerobic and anoxic phase are constant over the whole experiment. A constant
difference (∆EC) of 0.3 mS cm-1 was measured over a complete SBR cycle, whereas a ∆ECaer of 0.1 mS cm-1 was
detected during the microaerobic phase and a ∆ECmix of 0.2 mS cm-1 during the anoxic phase.
time [day]0 10 20 30 40 50 60 70
EC [m
S cm-1 ]
0,00,31,0
2,0
3,0
4,0
5,0
6,0
7,0
T = 30°C T = 25°Csynthetic wastewater digestate mixture
Fig. VI.15 Breaking and Blending points in EC profile during the whole experiment
α point(black circle); β point (white rumble); γ point (gray square); ∆EC in micro-aeration phase (cross); ∆EC in anoxic phase (star)
The pH in period I and II varied between 7.5 and 8 (Fig. VI.16). The maximum value was reached at the
beginning of the micro-aerobic phase, when the ammonium concentration was the highest. As consequence, the
nitrite oxidizing bacteria (NOB) were partially inhibited by the Free Ammonia (Anthonisen et al. 1976). In
period III, treating the digester effluent, when a stable nitrogen removal was achieved, the pH naturally
decreased and varied between 7.3 and 7.6. This implied that the inhibition of NOB was lower compared to the
period I and II, due to the lower pH at the beginning of SBR cycles, and thus to the lower Free Ammonia

Chapter 6
204
concentrations. A nitrate accumulation in the system in period III confirmed the higher activity of nitrite
oxidizing bacteria.
Also in this case a constant difference (∆pH) in micro-aerobic and anoxic phases can be detected,
independent of the initial and final pH values. An average ∆pHaer of 0.3 was detected during the microaerobic
phases whereas a ∆pHmix of |-0.1| during the anoxic phases.
time [day]0 10 20 30 40 50 60 70
pH
-1
0
16
7
8
T = 30°C T = 25°Csynthetic wastewater digestate mixture
Fig. VI.16 Breaking and Blending points in pH profile during the whole experiment
α point (black circle); β point (white rumble); γ point (gray square); ∆pH in micro-aeration phase (cross); ∆pH in anoxic phase (star)
The ORP signal followed each phase of the SBR cycle. The ORP always increased during micro-aerobic
phase and a maximum ORP value could be imposed in the micro-aerobic phase to avoid high nitrite
concentrations in the system, which could inhibit anammox bacteria. Further, during the anoxic phase, the ORP
decreased and the deplete of nitrite (thus the end of anammox process) can be detected observing the ORP
profile and the occurrence of a blending point (γORP). After γORP has been achieved, the ORP could further
decrease. Fig. VI.17 shows the breaking and blending points in the ORP profiles during the whole experiment
and the amplitude of the ORP during both the microaerobic (∆ORP_AER) and anoxic phases (∆ORP_ANOX). In the
aerobic phase the amplitude of the ORP depended on the occurrence of nitritation and nitratation process and the
nitrite and nitrate accumulation in the system. On the contrary the amplitude of ORP during the anoxic period
depended both on anammox and denitrification processes. In particular, the amplitude of the ORP in the anoxic
phase after the blending point γORP (∆ORP_denitrification) depended on the denitrification process. In period III,
treating the anaerobic digester effluent, the denitrification contribution was lower than that measured treating the
synthetic wastewater, due to the lower COD content and the amplitude of the ORP in the anoxic phase after the
blending point (γORP) was very small (Fig. VI.14).
In Fig. VI.17 can be seen that, treating the sysntetic wastewater, the lower nitrite and nitrate accumulation in
the effluent, were achieved when the ORP value at the end of the microaerobic phase (βORP) was about + 30 mV
and at the end of anoxic phase reached a minimum of -80 ÷ -100 mV. Treating the anaerobic digester effluent,
the ORP at the end of the anoxic phase was higher (- 30 ÷ -10 mV), as nitrate accumulation occurred, due to the
lower biodegradable organic content in the digestate effluent and the reactivation of NOB bacteria.
According to Lackner and Horn (2012), the ORP is one of the best parameters to control the development of
biological process, especially in pH controlled systems, as both pH and EC are strongly influenced by the pH
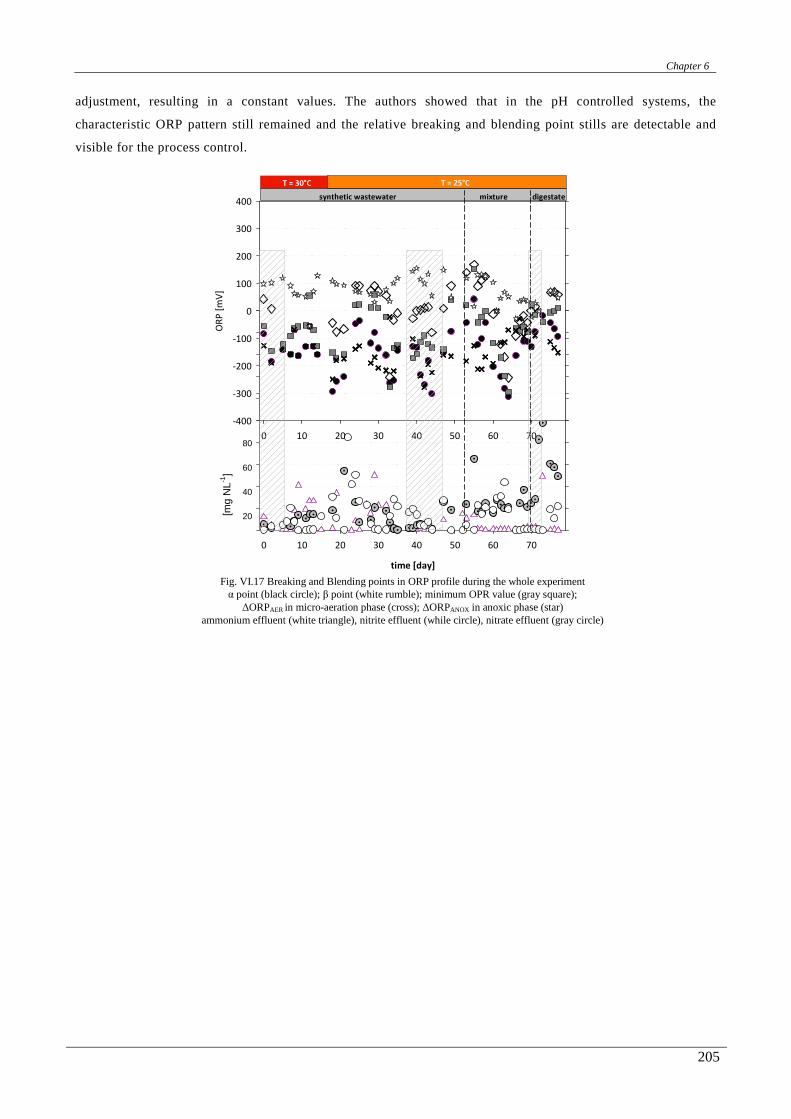
Chapter 6
205
adjustment, resulting in a constant values. The authors showed that in the pH controlled systems, the
characteristic ORP pattern still remained and the relative breaking and blending point stills are detectable and
visible for the process control.
time [day]0 10 20 30 40 50 60 70
[mg
NL-1
]
0 10 20 30 40 50 60 70
ORP [
mV]
-400
-300
-200
-100
0
100
200
300
400
20
40
60
80
T = 30°C T = 25°Csynthetic wastewater digestate mixture
Fig. VI.17 Breaking and Blending points in ORP profile during the whole experiment α point (black circle); β point (white rumble); minimum OPR value (gray square);
∆ORPAER in micro-aeration phase (cross); ∆ORPANOX in anoxic phase (star) ammonium effluent (white triangle), nitrite effluent (while circle), nitrate effluent (gray circle)

Chapter 6
206
3.4 Reactor operation and cycle optimization (real-time control)
After the study of the relevant points in the ORP, EC, pH and DO profiles, the overall treatment was
optimized implementing a “real-time control strategy”, as described in the section 2.4.2. The “real-time control”
strategy was validated for 10 days, after more than two months of a stable SNAD process.
During the real time control strategy, the total ammonia and nitrogen removal efficiencies stayed high, 96,5%
and 88.6% respectively (Fig. VI.18). Inhibition due to high nitrite accumulation in the system was prevented.
The COD efficiency was comparable with the efficiency obtained in the “time fixed control” strategy.
Time [day]0 2 4 6 8
mg N
L-1
050
100
400
500
600
700
Effici
ency
[%]
0
20
40
60
80
100
TAN eff TNNeff NO-
3-N effTAN inf %TAN %TN %COD
T = 25°C digestate
Fig. VI.18 Concentration of the nitrogen species in the influent and effluent of the SBR during the real time control strategy
The optimization allowed to achieve the high results measured in the “fixed time control” strategy,
preventing any critical situations in the reactor: (i) the risk of high Free Ammonia inhibition for AOB at the end
of the filling phase were minimized by fixing a maximal EC value (αEC) during the feed; (ii) the anammox
inhibition by high nitrite concentrations in the system was minimized by fixing a maximal ORP value (βORP) at
the end of the micro-aerobic phase (iii) a high degree of ammonium removal was ensured by fixing a proper
minimum EC (γEC) and ORP (ORPmin) thresholds at the end of the process.
For a specific wastewater, the maximum EC value (αEC) was correlated with the ammonium concentration at
the beginning of the SBR cycle whereas the minimum EC value (γEC) was correlated with the ammonium
concentration at the end of the anoxic phase. Thus, a maximum and minimum values of conductivity (αEC and
γEC) were fixed treating anaerobic digester effluent: 2.2 mS cm-1 and 2.0 mS cm-1, respectively. The maximum
value was used to control the end of the filling phase while the minimum value was used to control the length of
the whole reaction phase (aerobic+ anoxic) of the SBR.
The maximum ORP value in the SBR cycle was correlated at the nitrite concentration in the reactor at the end
of the micro-aerobic phase. Thus, the aeration length was regulated by a maximum ORP value (βORP). A value of
+30 mV was fixed, avoiding to reach high nitrite concentration at the end of the micro-aerobic phase. Further, at
the end of the anoxic phase, an additional minimum ORP threshold was fixed (-40 mV) to ensure the complete
depletion of nitrite by anammox process and the depletion of nitrate by denitrification process, if organic carbon
is available in the system. The control strategy considered that if the minimum ORP value was achieved in the
system, but the EC was still higher than γEC, a micro-aerobic phase restarted, in order to have a partial nitritation,
followed by another anoxic period.

Chapter 6
207
The imposed thresholds in the SBR cycle, automatically optimized the performance of the SBR cycle
compared to the “time fixed control” strategy. In particular, the “real-time control” strategy allowed to optimize
the lengh of the cycle, avoiding inhibitions and wastes of time. Further, a lower supervision of the systems was
required, thus, reducing the operational costs.
The “real-time control” strategy naturally developed a pattern characterized by multiple aeration/mixing
phases per cycle. Fig. VI.19 and Fig. VI.20 show the on line data of two SBR cycles. Within a single SBR cycle,
from the DO profile can be observed two micro-aerobic phases, as at the end of the first anoxic phase the
minimum ORP value was achieved but the conductivity value was still higher than the minimum conductivity
threshold. The EC profiles decreased with different slope during the micro-aerobic and the anoxic phases. The
pH profile nicely followed the ongoing biological processes.
Time [hh:mm]
18:
00
20:
00
22:
00
00:
00
02:
00
04:
00
06:
00
08:
00
10:
00
DO [m
gL-1 ]
0,0
0,5
1,0
1,5
2,0
CE [m
S cm-1
]
1,0
1,2
1,4
1,6
1,8
2,0
2,2
2,4
DO CE DO
CE
Fill Fill Draw Draw
Time [hh:mm]
18:
00
20:
00
22:
00
00:
00
02:
00
04:
00
06:
00
08:
00
10:
00
pH
7,6
7,8
8,0
8,2
8,4
ORP [
mV]
-250
-200
-150
-100
-50
0
50
100
pHORP pH
ORP
Fill Fill Draw Draw
Fig. VI.19 On line data of the EC and DO for the cycles controlled by the real time control strategy
Fig. VI.20 On line data of the ORP and pH for the cycles controlled by the real time control strategy
4. Conclusion
In this work the suitability of a “real-time control” strategy in an SBR system for the simultaneous partial
nitritation, anammox and denitrification (SNAD) process has been analyzed for the nitrogen and carbon
biological removal from wastewaters with high ammonia concentration and low biodegradable organic content.
The continuous monitoring of pH, ORP, DO and EC allowed the analysis of the dynamic of the nitrogen forms.
Similarly to the conventional nitrification/denitrification in an SBR, the pH, ORP, DO and EC profiles followed
the ongoing biological processes. Results of this study showed that:
- conductivity value was correlated with the maximum ammonium concentration at the beginning of the SBR
cycle and with the minimum ammonium concentration at the of the SBR cycle;
- conductivity value depended on the type of wastewaters treated, but as a stable process occurred, the EC
values are reproducible over the time;
- ORP value was correlated to nitritation process and to the nitrite accumulation during the micro-aerobic
phase;
- a ORP blending point in the anoxic period was detected and it was related to the nitrite depletion mainly by
anammox bacteria, while the OPR amplitude after the blending poit was correlated with the contribution of
denitrification process via nitrate in the SNAD process.
- pH nicely followed the ongoing processes, however it is preferable to set the pH in the range of 7.5 – 8.5.

Chapter 6
208
Nevertheless, the control strategy based on the “fixed time control” required a constant supervision of the
process and manual adjustments of the SBR cycle configuration. The length of each phase of the SBR cycle was
manually adapted in order to achieve high nitrogen and carbon removal efficiencies in the SNAD process. In
particular, the duration of the micro-aeration phase, key factor to achieve a partial nitritation over the whole
cycle, was regulated cycle by cycle after batch analysis on the SBR effluent, requiring time and chemical costs.
We showed that indirect on-line paramenters could be used to implement a “real time control” strategy to
automatically determine the length of each phase in a SBR cycle. Adjudgments on the ending of micro-aerobic
and anoxic phase can be based on the breaking and blending points on the curve of ORP, EC, pH, throughout
each SBR cycle rather than manually regulations. A “real-time control” strategy based mainly on the ORP and
EC measurements was designed and applied in this study. High nitrogen and carbon removal efficiencies were
obstained, comparable to the efficiency measured during the “fixed time control” strategy. Nevertheless, the
“real-time control” strategy has some advantages compared to a “fixed time control” strategy. It allowed the
optimization of the lengh of the reaction phases of the SBR cycle, thus, reducing aeration and mixing time for
saving energy source. Further, it allowed to avoid inhibition of the process, due to nitrite accumulation, high
loads, complete substrate depletion, by saving time and by treating higher nitrogen load. Finilly, the real-time
control strategy required a lower supervision of the systems and thus operational costs saving.
This study reveales that the SNAD process in a SBR allowed the implementation of a control strategy, mainly
based on the EC and ORP signals to determine the duration of the filling and reaction phases of the SNAD-SBR.
The SNAD process performed in an SBR allows energy saving, low cost operation. A easy control strategy
makes SNAD- SBR an interesting option for the biological treatment of ammonium rich streams, such as old
landfill leachates and anaerobic digester effluents, to name a few. Interesting future wastewaters implication
would be the implementation of the SNAD-SBR control strategy besed on the on-line direct parameters, such as
ammonium, nitrite and nitrate.
Acknowledgements
The authors gratefully acknowledge Claudio Salomon, Luca Penasa, Roberto Graziola, Massimo Gennara,
Luca Pichenstein, Sandro Pedrotti of “Servizio Elettronico e Progettazione” and Pierino Gennara of the “Sevizio
Meccanico” of the Department of Physic of the University of Trento for their technical support for the reactor
assembly and the acquisition and control software development. We thank E. Sbrissa, master student of the
University of Trento for her precious contribution during experimental phases.
Author Contributions
All authors contributed extensively to the work presented in this paper. The acquisition and control software
was developed by M.L with the support of L. Penasa, from the University of Trento. Control strategies and
experiments for reactor were designed and conducted by M.L. G.A. and M.L. conceived the research. M.L. wrote
the paper with input of G.A. discussing the results, implications and commenting on the manuscript at all stages.
Supplementary Material
Further details concerning the acquisition and control hardware and software.

Chapter 6
209
Supplementary Table
Supplementary Table VI-1 cDAQ channel configuration cDAQ – 9174 chassis (4 slot)
Device Description Control Physical
channel Channel Name
output range
Work range
Work measure
NI 9208 16-Channel Current Input Module
pH sensor on-line reactor pH
- AI0 Numeric 1 pHr
±21.5 mA 4 – 20 mA 4 -10
ORP sensor on-line reactor
ORP - AI1 Numeric 2
ORPr ±21.5 mA 4 – 20 mA -500 + 500 mV
Temperature sensor
on-line reactor Temperature
combined with DO sensor
- AI2 Numeric 3 TDOr
±21.5 mA 4 – 20 mA 5 – 40 °C
DO sensor on-line reactor DO
- AI3 Numeric 4 DOr
±21.5 mA 4 – 20 mA 0 – 10 mg L-1
pH sensor on-line influent
tank pH - AI4 Numeric 5
pHi ±21.5 mA 4 – 20 mA 4 -10
CE sensor on-line reactor Conductivity
- AI5 Numeric 6 CEr
±21.5 mA 4 – 20 mA 0-100 mS
CE sensor on-line influent tank Conductivity
- AI6 Numeric 7 CEi
±21.5 mA 4 – 20 mA 0-100 mS
free - AI7 ±21.5 mA
Temperature sensor
on-line reactor Temperature
combined with CE sensor
- AI8 Numeric 9 TCEr
±21.5 mA 4 – 20 mA 0 – 40 °C
Temperature sensor
on-line influent tank Temperature combined with
CE sensor
- AI9 Numeric 10 TCEi
±21.5 mA 4 – 20 mA 0 – 40 °C
Level sensor on-line reactor level
- AI10 Numeric 11 Levelr
±21.5 mA 0 – 20 mA 5 - 32 cm
free - - AI11 ±21.5 mA
free - - AI12 ±21.5 mA free - - AI13 ±21.5 mA free - - AI14 ±21.5 mA
free - - AI15 ±21.5 mA
NI 9485 – 8 Channel C Series Relay, 60 VDC/30 Vrms, 750 mA
Influent Pump influent feeding
Time and level On-Off control
AO0 P01 relay for switching voltages up to 60 VDC
Effluent Pump effluent discharge
Time and level On-Off control
AO1 P02 relay for switching voltages up to 60 VDC
Sludge Pump
sludge discharge
Operator, Time and level
On-Off control
AO2 P03 relay for switching voltages up to 60 VDC
Acid pump alkalinity and basic condition
pH On-Off control
AO3 Pacid relay for switching voltages up to 60 VDC
Basic pump alkalinity and basic condition
pH On-Off control
AO4 Pbase relay for switching voltages up to 60 VDC
Aerator aeration conditions
Time and DO On-Off control
AO5 BL01 relay for switching voltages up to 60 VDC
Mixer mixing conditions
Time On-Off control
AO6 MX01 relay for switching voltages up to 60 VDC
free
AO7 - relay for switching voltages up to 60 VDC
NI 9472 - 8 Channel , 24 V Logic, 100 µs Sourcing C Series Digital Output Module
Over flow alarm In
Detect overflow from bioreactor,
safety tank
DIO Level 6 – 30 V
AI= analog input; AO= analog output; DO=digital input/output

210

Summury and outlook
211
Summary and outlook

Summury and outlook
212
Summary and outlook
Different features of the Simultaneous partial Nitritation, Anammox and Denitrification (SNAD) process are
described in this thesis. Literature review and experimental work carried out in this research confirmed the
suitability and sustainability of the SNAD process for the treatment of ammonium-rich wastewaters,
characterized by a low biodegradable organic matter content, such as anaerobic digester effluents and old landfill
leachate.
The community composition and spatial distribution of the SNAD biomass, used as inoculums of lab-scale
reactors, were evaluated. The SNAD seed sludge, investigated in this study, was collected from an SBR for the
digester supernatant treatment at the WWTP of Zürich, Switzerland, where a successful nitrogen and carbon
removal was achieved. The SNAD sludge contained granules surrounded by a matrix of brownish flocs. Two
kinds of granules (red and brown) could be distinguished with diameters between 0.5 and 2.0 mm.
The 16S rRNA gene and functional gene approach suggested this SNAD biomass had a diverse microbial
community. The main groups of microorganisms were found to be ammonia-oxidizing bacteria of the
Nitrosomonas europaea/eutropha group, anaerobic ammonium-oxidizing bacteria of the “Candidatus Brocadia
fulgida” type and denitrifying bacteria related to the betaproteobacteria Thauera, Pseudomonas, Dechloromonas
aromatic and Aromatoleum aromaticum. Nitrite-oxidizing bacteria from the genus Nitrobacter were detected
while no nitrite-dependent anaerobic methane oxidizing bacteria were found. The high microbial diversity
detected, expecially in the ammonia-oxidizing- and denitrifying bacteria species, supported the hypothesis that in
the SNAD process, carried out in an SBR, different macro- and micro-environments strongly affected the
population structure, which contribute to the stability of the SNAD process.
FISH analysis of SNAD biomass samples clearly showed that long filamentous microorganisms were
dominant in the outer layer of the granules, with single cells as well as aggregates trapped in a net of these
filamentous bacteria. Filamentous microorganisms are considered to be responsible for the construction of web-
like structures while bacteria such as Thauera spp. may contributes to the granular process, thanks to their
abundant production of extracellular polymeric substances (EPS). Aerobic nitrifiers were located at the outside
of the aggregates as single cells and in clusters, while anammox bacteria were abundant in the inner part of the
granules in agreement with the expectation that the interior of the aggregates would be anoxic.
Then, a thorough characterization of the ammonium-rich wastewaters has been performed. The COD
fractions were divided based on the solubility and the biodegradability in order to perform a proper COD
fractionation, useful for biological process simulation models and evaluate the truly biodegradable COD to
Nitrogen (CODbio/N) ratio. The CODbio/N is one of the key parameters to the applicability of the SNAD process,
in order to allow an equilibrated co-existence of anammox and denitrifiers bacteria. In particular, due to its
complex composition, the characterization of old landfill leachates required the combination of appropriate
physical-chemical and respirometric methods. In this study the interference due to chemical compounds, present
in the leachate, were taken into account during sampling, experimental analysis and data processing procedures.
The SNAD process was validated to treat both old landfill leachates and anaerobic digester effluents in a
Sequencing Batch Reactor (SBR) under a sequence of micro-aerobic (oxygen-limiting) and anoxic conditions.
Referring to the characteristics of the reactor, the SBR configuration was chosen to carry on the SNAD
process, as it provides efficient biomass retention (over 90% of biomass retention), ensuring the enrichment of
very slow-growing microbial community, such as the aerobic and anaerobic autotrophic nitrifiers (AOB and

Summury and outlook
213
anammox bacteria). Further, both the SBR technology and granular biomass allow the co-existence of several
bacterial populations. The dynamic operative conditions of SBRs can dictate different metabolic activity by
sequencing each phase of the mixing, aeration and non-mixing/non-aeration pattern during each cycle, ensuring
different macro-environmental conditions for bacteria (aerobic/anoxic conditions or high/low loading). On the
other hand, bio-granulation technology have a compact microbial structure and a strong microbial stratification
that develop different micro-environments from the outer to the inner layer of aggregates. Both of these
technologies create substrate gradients that improve the system resistance to shock and toxic loadings,
preventing inhibition effects.
With regards to operational conditions, special attention must be paid to SBR cycle pattern. In this study, the
SBR cycle was conducted with a short filling phase, two reaction phases (a micro-aerobic and an anoxic one) and
a short settling phase. From experimental results over the whole research, a stable and high-rate running partial
nitritation process has been found to be the critical point of the SNAD process. Several conclusions on SBR
cycle pattern have been drawn which lead to practical suggestions for the SNAD process implementation.
Subsequent batch tests at high temperature (T=30°C), simulating one cycle of the operation of the SBR, were
conducted on synthetic wastewater and leachate with a nitrogen loading rate of 0.27 kgTAN m-3d-1 and organic
loading rate of 0.30 kg CODfiltrate m-3d-1. Treating leachate (CODbio/N=0.2), a total ammonium nitrogen and a
total nitrogen removal efficiencies respectively of 76-87% and 64-79% were observed. A carbon (COD) removal
efficiency of 34% was achieved. The efficiencies were lower than the values obtained using the synthetic
wastewater, due to the presence of inhibitors compounds in the leachate for the aerobic ammonia oxidizing
bacteria and to the lower biodegradable organic carbon content which reduces the overall total nitrogen and COD
efficiencies removal. This study was carried out as an initial step towards development of a continuous SNAD
process performed in an SBR under oxygen limited conditions for treating old landfill leachates. Influent
characteristics, biomass activities and the operative reactor conditions (i.e. pH, DO, T) influenced the SBR
configuration set up. In this study, a good relation between the SBR reaction phases lenght and the nitrogen
loading rates was determined, in order to achieve a suitable partial nitrification during the micro-aerobic phase
followed by a proper anammox process during the anoxic phase.
Then, the integration of the partial aerobic ammonia oxidation (nitritation), anaerobic ammonium oxidation
(anammox) and heterotrophic denitrification via nitrate and nitrite was successfully developed in a lab-scale
sequencing batch reactor (SBR) treating a syntetic wastewater with a CODbio/N in the range of 0.4 -0.9.
The effects of high (T=30°C) and moderate (T= 25°C) temperature were evaluated. The Nitrogen Loading
Rate (NLR) was set within 0.13-0.15 kgNm-3d-1 while the applied Organic Loading Rate (OLR) was between
0.08-0.14 kgCODm-3d-1. The HRT was ~3 d. At 30°C, the total ammonia removal and the total nitrogen
efficiencies were higher than 98% and 93%, respectively. The COD removal was also high (81%). When the
lower temperature was applied, the system was stabilized after ~10 days (3-4 times of the HRT). At 25°C, after a
necessary acclimatization period to the lower temperature, the reactor was operated in a stable manner, achieving
nitrogen and carbon removal efficiency comparable to the performance of the SNAD process at 30°C.
Then, the feasibitilty to treat anaerobic digester effluents at moderate temperature (T=25°C), was
investigated. An ammonium conversion efficiency of 96%, a total nitrogen removal efficiency of 88% and COD
removal efficiency of 58% were obtained with the nitrogen and COD loading rate of 0.15 kg Nm-3 d-1 and 0.08
kg m-3d-1, respectively. A mean nitrogen removal rate of 0.13 g NL-1d-1 was registered. The SNAD sludge in the
Summury and outlook
214
reactor was gradually adapted to the anaerobic digester effluent. Nevertheless, treating the anaerobic digester
effluent at moderate temperature, the contribution of the nitrite oxidizing bacteria (NOB) increased. Under those
conditions, both the oxygen-limiting conditions and a proper control of the Free Ammonia (FA) levels seemed to
be the key factors of the NOB inhibition. Thus, in order to achieve a stable partial nitritation in a SNAD process,
besides the effect of DO concentration on the nitritation reaction, a proper control of the FA would be necessary,
considering a tolerable FA range of 4-8 mg NH3-N L-1 (lower than the minimum inhibition threshold reported for
AOB and in the range of the inhibitory values reported for the NOB). In this study it was found that, a regulation
of the FA concentration at the beginning of the SBR cycles within a favorable range may be a vital factor in
inhibiting NOB and assuring a stable SNAD process, even at moderate temperature.
A stoichiometric model was developed in order to evaluate the contribution of each biological process
involved in the SNAD process during the micro-aerobic and anoxic phases of the SBR. The results of the
stoichiometric modeling indicated that, during the micro-aerobic phase, nitritation was the prevalent TAN
removal process (40 – 56%). The anammox process was showed to contribute to the TAN removal efficiency in
very low percentage (5 – 7%) in micro-aerobic phase. On the contrary, during the anoxic phase, anammox
process was the prevalent process, contributing 23 – 35 % to the total TAN removal. The influent carbon-
nitrogen ratio governed the contribution of denitrification over the anammox process in the anoxic phase.
During the whole experiment, the oxidation-reduction potential (ORP), pH, conductivity (EC) and dissolved
oxygen (DO) signals were continuously monitored and recorded. The on-line parameters profiles were well
related to the ongoing biological processes in the SNAD reactor. Breaking point and blending points were also
detected in the on-line parameters profiles, useful to monitor and control the SNAD process. With the beginning
of the anoxic–mixed filling phase, EC and pH increased while ORP decreased. Then, with the beginning of the
micro-aerobic phase, pH and EC exhibited a decreasing trend while the ORP increased gradually. When the
aeration was switched off, the ORP showed a sharp decrease whereas the pH increased steadily due to biological
conversion processes. The EC continued to decrease slowly. A blending point in the ORP profile in the anoxic
phase and the amplitude of the ORP after the blending point were correlated with the complete depletion of
nitrite mainly by anammox process and with the denitrification process via nitrate, respectively.
The analysis of the on-line parameters profiles allowed to develop and successfully applied a “real-time
control” strategy mainly based on the conductivity and oxidation-reduction potential signal. The “real-time
control” strategy can automatically determine the duration of the filling and reaction phases of the SNAD-SBR,
optimizing and reducing the aeration and mixing time for saving energy source. The “real-time control” strategy
allowed to reach high nitrogen and carbon removal efficiency, comparable to the efficiency measured during the
“fixed time control” strategy. Further, it allowed to avoid inhibition of the process, due to nitrite accumulation,
high load, complete substrates depletion. A low supervision was required, thus reducing operational costs.
Experimental procedures to investigate the potential activity of each processes involved were defined.
Activity assays were conducted in order to determine the potential activities of aerobic ammonia- and nitrite-
oxidizing bacteria (AOB and NOB), anaerobic ammonium oxidizing bacteria (anammox) and denitrifying
bacteria, considering both denitrification via nitrate and via nitrite. The procedures were employed to evaluate
the activity of the single biological processes involved in the SNAD process, minimizing the interference of
other biological processes that could simoultaneously occurr. The results of these assays can be useful to monitor
the SNAD biomass activity during a running experiments. Further, a new primer set targeting the hao/hzo gene
was designed and successful applied for the identification of the anammox bacteria.

Summury and outlook
215
The findings of this research showed that, under steady-state condition, nitritation, anammox, denitrification
and nitratation co-existed in the SBR, synchronizing each other and establishing a relation, which depended on
the operative reactor conditions. The cooperation among differen bacteria, with opposite environmental
conditions, was considered to be responsible for simultaneous nitrogen and COD removal. The shock in the
operating temperature, DO, C/N, nitrogen loading rate of the SNAD system greatly affected the relation of these
processes. However, the system is characterized by a high resistance and after short-term shock events always
restored its performance after 3-4 times of the HRT.
According to the operation experience on the SNAD-SBR process, it is suggested that a suitable start-up
strategy to achieve the SNAD process at moderate temperatures could have two steps. The first one would be the
stable SNAD process at high temperature (T=30°C), in order to select the AOB by high temperature or other
optimized conditions, such as oxygen limitation and other NOB inhibitors (FA). Then, the second step would be
the adaptation of the SNAD biomass to the lower temperatures. Further, a gradual acclimatation of the SNAD
process to the treatment of the real wastewater is proposed, by filling a mixtute (%v/v) of a synthetic and a real
wastewater.
The SNAD process is a sustainable process for the treatment of ammonium-rich wastewater, characterized by
a low biodegradable organic matter content and represents an interesting solution to enhance the treatment of the
urban wastewater streams (Verstraete and Vlaeminck 2011; Winkler et al. 2012a) as well as side-streams (Jetten
et al. 1997; Joss et al. 2009; Wang et al. 2010; Daverey et al. 2012).

216

217
List of Figures & Tables

List of Figures
218
List of Figures
FIG. I.1 CLASSICAL NITROGEN-CYCLE. .......................................................................................................................................... 5
FIG. I.2 OVERALL NITROGEN CYCLE ............................................................................................................................................. 6
FIG. I.3 NITROGEN CYCLE COUPLED WITH CARBON CYCLE ................................................................................................................ 6
FIG. I.4 16S RIBOSOMAL RNA PHYLOGENETIC TREE FOR THE CLUSTER OF BETA- PROTEOBACTERIAL AOB, BASED ON HIGH QUALITY SEQUENCES (>1200 BP) FROM ISOLATES ........................................................................................................................................... 12
FIG. I.5 16S RIBOSOMAL RNA PHYLOGENETIC TREE FOR THE CLUSTER OF GAMMA- PROTEOBACTERIAL AOB, BASED ON HIGH QUALITY SEQUENCES (>1200 BP) FROM ISOLATES. .......................................................................................................................... 12
FIG. I.6: PHYLOGENETIC TREE, BASED ON PROTEIN SEQUENCES SHOWING THE PHYLOGENETIV AFFILIATION OF THE CURRENTLY KNOW NOB. .. 13
FIG. I.7 NH3/NH4+ EQUILIBRIUM (CALCULATED FROM WIESMANN ET AL., 1994) ............................................................................. 15
FIG. I.8 HNO2/NO2- EQUILIBRIUM (CALCULATED FROM WIESMANN ET AL., 1994) ........................................................................... 17
FIG. I.9 MAXIMUM GROWTH RATE OF AOBS AND NOBS AT DIFFERENT TEMPERATURE ...................................................................... 19
FIG. I.10 MAXIMUM GROWTH RATE OF AOBS AND NOBS AT DIFFERENT TEMPERATURES. .................................................................. 21
FIG. I.11 PAST POSTULATED MECHANISM OF ANAEROBIC AMMONIUM OXIDATION. ............................................................................ 35
FIG. I.12 CURRENT BIOCHEMICAL PATHWAY AND ENZYMATIC MACHINERY OF K. STUTTGARTIENSIS. ....................................................... 35
FIG. I.13. A 16S RIBOSOMAL RNA-GENE-BASED PHYLOGENETIC TREE OF ANAMMOX BACTERIA, ........................................................... 36
FIG. II.1 SCHEMATIC REPRESENTATION OF MAIN AND POSSIBLE SECONDARY BIOLOGICAL PROCESSES INVOLVED IN THE SNAD PROCESS WITH THE CORRESPONDING GENES TARGETED AND PRIMER SETS USED IN THIS STUDY. .............................................................................. 69
FIG. II.2 PHYLOGENETIC TREE, REFLECTING AMOA GENE DIVERSITY IN SNAD SLUDGE. ........................................................................ 74
FIG. II.3 PHYLOGENETIC TREE, BASED ON 16S RRNA GENE SEQUENCES USING ANAMMOX-SPECIFIC PRIMERS .......................................... 75
FIG. II.4 PHYLOGENETIC TREE, BASED ON NITRITE REDUCTASE (NIRS) FUNCTIONAL GENE SEQUENCES OBTAINED WITH THE NIRS1F/6R PRIMERS. ................................................................................................................................................................................. 76
FIG. II.5 PHYLOGENETIC TREE, BASED ON 16S RRNA GENE SEQUENCES OF AEROBIC NITRITE OXIDIZING BACTERIA..................................... 77
FIG. II.6 FLUORESCENCE IMAGES OF HOMOGENIZED SNAD BIOMASS. ............................................................................................. 78
FIG. II.7 POTENTIAL AOB AND ANAMMOX ACTIVITY ..................................................................................................................... 79
FIG. III.1 SINGLE – OUR TEST, USING ACTIVATED SLUDGE. .......................................................................................................... 110
FIG. III.2 MULTI-OUR TEST, USING ACTIVATED SLUDGE. ............................................................................................................. 110
FIG. III.3 SINGLE – OUR TEST, USING SNAD BIOMASS. .............................................................................................................. 111
FIG. III.4 MULTI-OUR TEST, USING SNAD BIOMASS. ................................................................................................................. 111
FIG. III.5. COD FRACTIONATION OF LANDFILL LEACHATE ............................................................................................................. 111
FIG. IV.1 SCHEMATIC REPRESENTATION OF THE 4L LAB-SCALE SBR. .............................................................................................. 123
FIG. IV.2 SCHEMATIC REPRESENTATION OF THE SBR CYCLE CONFIGURATION ................................................................................... 124
FIG. IV.3 SBR MONITORING AND CONTROL SYSTEM. .................................................................................................................. 125
FIG. IV.4 EVOLUTION OF NITROGEN SPECIES OVER A 6 H SBR CYCLE USING SYNTHETIC WASTEWATER: .................................................. 128
FIG. IV.5 EVOLUTION OF COD OVER A 6 H SBR CYCLE USING SYNTHETIC WASTEWATER: .................................................................. 128
FIG. IV.6 PROFILES OF PH, TAN AND FA IN AN SBR CYCLE USING SYNTHETIC WASTEWATER: ............................................................. 130
FIG. IV.7 EVOLUTION OF NITROGEN SPECIES OVER AN SBR CYCLES USING OLD LANDFILL LEACHATE: ..................................................... 130
FIG. IV.8 OPTIMAL LENGTH OF THE TOTAL CYCLE LENGTH AND THE MICRO-AEROBIC PHASE IN THE SBR CYCLE ....................................... 131
FIG. IV.9 EFFECT OF HIGH TOTAL AMMONIA CONCENTRATION (TAN) ON THE SNAD PERFORMANCE. .................................................. 132
FIG. IV.10 AEROBIC CONVERSION RATES DURING MICRO-AEROBIC PHASE RELATED TO THE INITIAL MICRO-AEROBIC TAN CONCENTRATIONS 133
FIG. V.1 N-BALANCE WITHOUT TREATMENT OF ANAEROBIC DIGESTER EFFLUENT .............................................................................. 143
FIG. V.2 SCHEMATIC REPRESENTATION OF THE 8L LAB-SCALE SBR. ............................................................................................... 148
FIG. V.3 SCHEMATIC REPRESENTATION OF THE SBR CYCLE CONFIGURATION .................................................................................... 149
FIG. V.4 SBR MONITORING AND CONTROL SYSTEM. ................................................................................................................... 150
FIG. V.5 EVOLUTION OF NLR, OLR AND SNAD-SBR PERFORMANCE DURING PERIOD I (STEP 1 AT 30°C AND STEP 2 AT 25°C). ............... 156
FIG. V.6 EVOLUTION OF NITROGEN SPECIES DURING PERIOD I (STEP 1 AT 30°C AND STEP 2 AT 25°C). ................................................. 157
FIG. V.7 EVOLUTION OF COD DURING PERIOD I (STEP 1 AT 30°C AND STEP 2 AT 25°C). .................................................................. 157
FIG. V.8 EVOLUTION OF NLR, OLR AND SNAD PERFORMANCE DURING PERIOD IIAT 25°C. .............................................................. 161
FIG. V.9 SBR REACTIONS PHASES AND EVOLUTION OF NITROGEN SPECIES DURING PERIOD II AT 25°C. ................................................. 162

List of Figures
219
FIG. V.10 SBR REACTIONS PHASES AND EVOLUTION OF COD DURING PERIOD II AT 25°C. ................................................................. 162
FIG. V.11 EVOLUTION OF CARBON AND NITROGEN SPECIES OVER A 8 H SBR CYCLE: (A) PERIOD I- STEP 1); (B) PERIOD I- STEP 2), C) PERIOD II ............................................................................................................................................................................... 164
FIG. V.12 STOICHIOMETRY MODEL BASED EVALUATION OF THE SNAD SYSTEM OVER THE 8H CYCLE SBR IN PERIOD I, STEP 1). ................. 169
FIG. V.13 RED AND BROWNISH SNAD GRANULES. ..................................................................................................................... 171
FIG. V.14 REAL–TIME PCR AMPLIFICATION OF HZO/HAO GENE OF TOTAL GRANULES AND BROWNISH GRANULES SAMPLES ....................... 171
FIG. V.15 FNA CONCENTRATION IN THE EFFLUENT DURING PERIOD I AND PERIOD II. ........................................................................ 171
FIG. V.16 FA CONCENTRATION IN THE EFFLUENT DURING PERIOD I AND PERIOD II ........................................................................... 171
FIG. V.17 EVOLUTION OF FNA AND FA CONCENTRATIONS COUPLED WITH THE PH IN THE MIXED LIQUOR OVER A 8 H SBR CYCLE: ............. 173
FIG. VI.1 PH AND OXIDATION–REDUCTION POTENTIAL IN AN ALTERNATING AEROBIC–ANOXIC SYSTEM (KIM AND HAO 2001) ............... 187
FIG. VI.2 SCHEMATIC REPRESENTATION OF THE 8L LAB-SCALE SBR. .............................................................................................. 188
FIG. VI.3 SCHEMATIC REPRESENTATION OF THE POSSIBLE SBR CYCLE CONFIGURATIONS. .................................................................... 189
FIG. VI.4 SBR MONITORING AND CONTROL SYSTEM. .................................................................................................................. 190
FIG. VI.5 CONCENTRATION OF THE NITROGEN SPECIES IN THE INFLUENT AND EFFLUENT OF THE SBR DURING THE FIXED TIME CONTROL STRATEGY. ................................................................................................................................................................. 194
FIG. VI.6 CONCENTRATION OF THE COD IN THE INFLUENT AND EFFLUENT OF THE SBR DURING THE FIXED TIME CONTROL STRATEGY. ......... 194
FIG. VI.7 ON LINE DATA OF THE PH AND NITROGEN SPECIES OVER AN SBR CYCLE ............................................................................. 199
FIG. VI.8 ON LINE DATA OF THE ORP AND NITROGEN SPECIES OVER AN SBR CYCLE .......................................................................... 199
FIG. VI.9 ON LINE DATA OF THE EC AND NITROGEN SPECIES OVER AN SBR CYCLE ............................................................................. 201
FIG. VI.10 ON LINE DATA OF THE DO AND NITROGEN SPECIES OVER AN SBR CYCLE .......................................................................... 201
FIG. VI.11 SLOPE OF THE DO DURING THE AERATION OFF PERIOD OF THE DO CONTROL .................................................................... 201
FIG. VI.12 PERIOD I: SBR CYCLES FROM THE DAY 8 TO 13, TREATING SYNTHETIC WASTEWATER AT 30°C ............................................. 202
FIG. VI.13 PERIOD II: SBR CYCLES FROM THE DAY 38 TO 42, TREATING SYNTHETIC WASTEWATER AT 25°C .......................................... 202
FIG. VI.14 PERIOD III: SBR CYCLES FROM THE DAY 71 TO 73, TREATING ANAEROBIC DIGESTER EFFULENT AT 25°C ................................ 202
FIG. VI.15 BREAKING AND BLENDING POINTS IN EC PROFILE DURING THE WHOLE EXPERIMENT ........................................................... 203
FIG. VI.16 BREAKING AND BLENDING POINTS IN PH PROFILE DURING THE WHOLE EXPERIMENT ........................................................... 204
FIG. VI.17 BREAKING AND BLENDING POINTS IN ORP PROFILE DURING THE WHOLE EXPERIMENT ........................................................ 205
FIG. VI.18 CONCENTRATION OF THE NITROGEN SPECIES IN THE INFLUENT AND EFFLUENT OF THE SBR DURING THE REAL TIME CONTROL STRATEGY .................................................................................................................................................................. 206
FIG. VI.19 ON LINE DATA OF THE EC AND DO FOR THE CYCLES CONTROLLED BY THE REAL TIME CONTROL STRATEGY ............................... 207
FIG. VI.20 ON LINE DATA OF THE ORP AND PH FOR THE CYCLES CONTROLLED BY THE REAL TIME CONTROL STRATEGY ............................. 207

List of Figures
220
SUPPLEMENTARY FIG. I-1 THE PHYLOGENETIC TREE OF LIFE AS DEfiNED BY COMPARATIVE RRNA GENE SEQUENCING. ............................................ 60 SUPPLEMENTARY FIG. I-2 SOME MAJOR PHYLA OF BACTERIA BASED ON 16S RIBOSOMAL RNA GENE SEQUENCE COMPARISONS. ............................ 60 SUPPLEMENTARY FIG. I-3 PHYLOGENETIC TREE OF SOME KEY GENERA OF PROTEOBACTERIA. ............................................................................ 61 SUPPLEMENTARY FIG. II-1 RESULTS OF 1% AGAROSE GEL ELECTROFORESIS OF PCR AMPLIFICATES. ................................................................... 86 SUPPLEMENTARY FIG. II-2 FLUORESCENCE MICROSCOPY IMAGES OF SNAD SLUDGE. ..................................................................................... 87 SUPPLEMENTARY FIG. II-3 SNAD BIOMASS STAINED WITH DAPI AND LABELED WITH DIFFERENT SPECIFIC PROBES. ............................................... 88 SUPPLEMENTARY FIG. V-1 GRAPHICAL INTERFACE OF THE ACQUISITION AND CONTROL SOFTWARE DEVELOPED USING LABVIEW 2010 SOFTWARE. .. 179 SUPPLEMENTARY FIG. V-2 HZO/HAO PRIMER SET SPECIFICITY. ................................................................................................................. 179

List of Tables
221
List of Tables
TABLE I-1 FA INHIBITION THRESHOLDS. THE CORRESPONDING NITRITE CONCENTRATIONS AT PH 7.5 ARE ALSO SHOWN ......................................... 16 TABLE I-2 FNA INHIBITION THRESHOLDS. THE CORRESPONDING NITRITE CONCENTRATIONS AT PH 7 AND T=30°C ARE ALSO SHOWN ....................... 17 TABLE I-3 ACTIVATION ENERGY OF AMMONIA- NITRITE OXIDATION ............................................................................................................ 19 TABLE I-4 EFFECTS OF SALINITY ON THE NITRIFICATION PROCESSES. ............................................................................................................. 22 TABLE II-1 INFLUENT AND EFFLUENT CHARACTERISTICS OF REJECT WATER OF ZÜRICH PLANT (CH) (JOSS ET AL. 2009)........................................... 67 TABLE II-2 SBR OPERATIVE CONDITIONS OF ZÜRICH PLANT (JOSS ET AL. 2009). ........................................................................................... 67 TABLE II-3 PRIMERS USED FOR PCR AMPLIFICATIONS AND SEQUENCING ...................................................................................................... 70 TABLE II-4 OLIGONUCLEOTIDE PROBES FOR FISH ................................................................................................................................... 72 TABLE III-1. CONVENTIONAL OLD LANDFILL LEACHATES CHARACTERIZATION. ............................................................................................... 107 TABLE III-2. SOLUBLE COD. ............................................................................................................................................................ 108 TABLE III-3. SOLUBLE TAN .............................................................................................................................................................. 108 TABLE III-4. BIODEGRADABLE COD FRACTIONS. ................................................................................................................................... 110 TABLE III-5. CHARACTERIZATION OF OLD LANDFILL LEACHATES USED IN SNAD PROCESS AND DESCRIBED IN LITERATURE. ...................................... 112 TABLE IV-1 OVERVIEW OF TYPICAL SNAD PROCESS APPLIED TO LANDFILL LEACHATE AND SYNTHETIC WASTEWATER ............................................ 121 TABLE IV-2 OPERATIVE STRATEGIES DURING PERIOD I, II AND III.............................................................................................................. 126 TABLE IV-3 CHARACTERISTICS OF NITROGEN AND CARBON REMOVAL IN PERIOD I ....................................................................................... 129 TABLE IV-4 CHARACTERISTICS OF NITROGEN AND CARBON REMOVAL IN PERIOD II ...................................................................................... 131 TABLE V-1 OVERVIEW OF TYPICAL INNOVATIVE NITROGEN REMOVAL PROCESSES IN SBR APPLIED TO ANAEROBIC DIGESTER EFFLUENT AND SYNTHETIC
WASTEWATER ...................................................................................................................................................................... 145 TABLE V-2 COMPOSITIONS OF MIXTURE SOLUTIONS FOR REAL-TIME PCR FOR ANAMMOX BACTERIA ................................................................ 154 TABLE V-3 CHARACTERISTIC OF THE NITROGEN REMOVAL AT STEP 1 (30°C) AND STEP 2( 25°C) (MEAN VALUES) ............................................... 158 TABLE V-4 CHARACTERISTIC OF THE NITROGEN REMOVAL AT 25°C , TREATING ANAEROBIC DIGESTER EFFLUENT ................................................. 161 TABLE V-5 CHARACTERISTIC OF THE NITROGEN REMOVAL AT 30°C AND 25°C ............................................................................................ 166 TABLE V-6 STOICHIOMETRY MODEL RESULTS OF THE SNAD PROCESS IN PERIOD I AND II ............................................................................... 168 TABLE VI-1 CHARACTERISTIC OF THE NITROGEN REMOVAL OVER THE FIXED TIME CONTROL EXPERIMENT ........................................................... 195 TABLE VI-2 OVERVIEW OF TYPICAL INNOVATIVE NITROGEN REMOVAL PROCESSES ....................................................................................... 196
SUPPLEMENTARY TABLE IV-1 CHARACTERISTICS OF THE SYNTHETIC WASTEWATER ....................................................................................... 138 SUPPLEMENTARY TABLE IV-2 CHARACTERISTICS OF THE RAW LEACHATE FROM THE MUNICIPAL WASTES LANDFILL SITE OF TRENTO CITY. (ITALY) ........ 139 SUPPLEMENTARY TABLE IV-3 FP-AI-110 CHANNEL CONFIGURATION ....................................................................................................... 139 SUPPLEMENTARY TABLE V-1 CHARACTERISTICS OF THE SYNTHETIC WASTEWATER ........................................................................................ 177 SUPPLEMENTARY TABLE V-2 CHARACTERISTICS OF THE ANAEROBIC DIGESTION SUPERNATANT FROM A MUNICIPAL WWTP, TRENTO (ITALY). ......... 177 SUPPLEMENTARY TABLE V-3 CDAQ CHANNEL CONFIGURATION CDAQ – 9174 CHASSIS (4 SLOT) .................................................................. 178 SUPPLEMENTARY TABLE VI-1 CDAQ CHANNEL CONFIGURATION CDAQ – 9174 CHASSIS (4 SLOT) ................................................................. 209

222

References
223
References

References
224
Reference
Abeling U., Seyfried C.F. 1992. Anaerobic-aerobic treatment of high strength ammonium wastewater: nitrogen removal over nitrite. Water science and technology: a journal of the International Association on Water Pollution Research. 26:1007–1015.
Abma W.R., Driessen W., Haarhuis R., Van Loosdrecht M.C.M. 2010. Upgrading of sewage treatment plant by sustainable and cost-effective separate treatment of industrial wastewater. Water science and technology: a journal of the International Association on Water Pollution Research. 61:1715–22.
Adav S.S., Lee D.-J., Lai J.Y. 2010. Enhanced biological denitrification of high concentration of nitrite with supplementary carbon source. Applied microbiology and biotechnology. 85:773–8.
Aguado D., Montoya T., Ferrer J., Seco A. 2006. Relating ions concentration variations to conductivity variations in a sequencing batch reactor operated for enhanced biological phosphorus removal. Environmental Modelling & Software. 21:845–851.
Ahn Y. 2006. Sustainable nitrogen elimination biotechnologies: A review. Process Biochemistry. 41:1709–1721. Ahn Y.H., Hwang I.S., Min K.S. 2004. ANAMMOX and partial denitritation in anaerobic nitrogen removal from piggery waste.
Water Science and Technology. 49:145–53. AI-Ghusain I., Hao O.. 1995. Use of pH as control parameter for aerobic/anoxic sludge digestion. Journal of Environmental
Engineering © ASCE. 121:225–235. Aktan C.K., Yapsakli K., Mertoglu B. 2012. Inhibitory effects of free ammonia on Anammox bacteria. Biodegradation. 23:751–62. Aktas Ö., Çeçen F. 2001. Nitrification inhibition in landfill leachate treatment and impact of activated carbon addition.
Biotechnology Letters. 23:1607–1611. Akunna J., Bizeau C., Moletta R. 1993. Nitrate and nitrite reductions with anaerobic sludge using various carbon sources: Glucose,
glycerol, acetic acid, lactic acid and methanol. Water Research. 27:1303–1312. Akunna J.C., Bizeau C., Molleta R. 1994. Nitrate reduction by anaerobic sludge using glucose at various nitrate concentrations:
ammonification, denitrification and methanogenic activities. Environ. Technol. 15:41–49. Akın B.S., Ugurlu A. 2005. Monitoring and control of biological nutrient removal in a Sequencing Batch Reactor. Process
Biochemistry. 40:2873–2878. Alawi M., Lipski A., Sanders T., Spieck E. 2007. Cultivation of a novel cold-adapted nitrite oxidizing betaproteobacterium from the
Siberian Arctic. The ISME Journal. 1:256–264. Alifano P., Bruni C.B., Carlomagno M.S. 1994. Control of mRNA processing and decay in prokaryotes. Genetica. 94:157–72. Alleman J.E. 1984. Elevated nitrite occurrence in treatment systems. Water Science & Technology. 17:409–419. Altschul S.F., Madden T.L., Schaffer A., Zhang J., Zhang Z., Miller W., Lipman D.J. 1997. Gapped BLAST and PSI-BLAST: a new
generation of protein database search programs. Nucleic Acids Research. 25:3389–3402. Amann R.I., Krumholz L.E.E., Stahl D.A. 1990. Fluorescent-Oligonucleotide Probing of Whole Cells for Determinative,
Phylogenetic, and Environmental Studies in Microbiology. Journal of Bacteriology. 172:762. Ambus P., Mosier A.R., Christensen S.. 1992. Nitrogen turnover rates in a riparian fen determined by 15N dilution. Biol. Fertil. Soil.
14:230–236. Andreottola G., Foladori P., Ferrai M., Ziglio G. 2002. Respirometria applicata alla depurazione delle acque: Principi e metodi. II Ed.
Quaderni di Dipartimento. . Andreottola G., Foladori P., Ragazzi M. 2001. On-line control of a SBR system for nitrogen removal from industrial wastewater.
Water science and technology: a journal of the International Association on Water Pollution Research. 43:93–100. Anthonisen A.C., Loehr R.C., Prakasam T.B.S., Srinath E.G. 1976. Inhibition of nitrification by ammonia and nitrous acid. Journal
of Water Pollution Control Federation. 48:835–852. Aoi Y., Shiramasa Y., Masaki Y., Tsuneda S. 2004. Expression of amoA mRNA in wastewater treatment processes examined by
competitive RT-PCR. Journal of Biotechnology. 111:111–120. APAT CNR IRSA 2003. Metodi Analitici per le Acque. Manuali e Linee Guida 29/2003. APHA-AWWA-WPCF 2005. Standard Methods for the Examination of Water and Wastewater. 21st ed. American Public Health
Association, Washington, DC, USA. . Arp D.J., Bottomley P.J. 2006. Nitrifiers: More than 100 Years from Isolation to Genome Sequences. Microbe magazine ASM.
1:229–234. Arp D.J., Chain P.S.G., Klotz M.G. 2007. The impact of genome analyses on our understanding of ammonia-oxidizing bacteria.
Annu. Rev. Microbiol. 61:503–528. Artan N., Orhon D. 2005. Mechanism and design of Sequencing Batch Reactor for Nutrient removal. Scientific and Technical Report
No. 19. IWA Publishing, ISBN 1843390825. Artan N., Yagci N.O., Artan S.R., Orhon D. 2003. Design of Sequencing Batch Reactors for Biological Nitrogen Removal from High
Strength Wastewaters. Journal of Environmental Science and Health, Part A: Toxic/Hazardous Substances and Environmental Engineering. 30:
ASCE 1992. Measurement of Oxygen Transfer in Clean water. American Society of Civil Engineers, New York. Aslan S., Simsek E. 2012. Influence of salinity on partial nitrification in a submerged biofilter. Bioresource technology. 118:24–9. Bagchi S., Biswas R., Nandy T. 2010. Alkalinity and dissolved oxygen as controlling parameters for ammonia removal through
partial nitritation and ANAMMOX in a single-stage bioreactor. Journal of industrial microbiology & biotechnology. 37:871–6. Barrit 1933. The nitrification process in soils and biological filters. Ann. Appl. Biol. 20:165–184. Baumann B., Van Der Meer J.R., Snozzi M., Zehnder A.J.B. 1997. Inhibition of denitrification activity but not of mRNA induction in
Paracoccus denitrificans by nitrite at a suboptimal pH. Antonie van Leeuwenhoek. 72:183–189. Bazylinski D., Blakemore R. 1983. Denitrification and assimilatory nitrate reduction in Aquaspirillum magnetotacticum. Appl
Environ Microbiol 1983;46:1118–24. 46:1118–1124. Bedmar E.J., Robles E.F., Delgado M.J. 2005. The complete denitrification pathway of the symbiotic, nitrogen-fixing bacterium
Bradyrhizobium japonicum. Biochemical Society Transactions. 33:141–144.

References
225
Beijerinck M. 1920. Chemosynthesis at denitrification with sulfur as source of energy. Koninklijke Nederlandsche Akademie van Wetenschappen Proceedings. 22:899–908.
Beijerinck M.W. 1888. Die Bakterien der Papilionaceen-Knöllchen. Botanische Zeitung. 46:725– 735, 741–750, 757–771, 781–790, 797–804.
Bell L.C., Richardson D.J., Ferguson S.J. 1990. Periplasmic and membrane-bound respiratory nitrate reductases in Thiosphaera pantotropha: the periplasmic enzyme catalyzes the first step in aerobic denitrification. FEBS Letters. 265:85–87.
Berks B.C., Ferguson S.J., Moir J.W.B., Richardson D.J. 1995. Enzymes and associated electron transport systems that catalyse the respiratory reduction of nitrogen oxides and oxyanions. Biochimica et Biophysica Acta (BBA) Bioenergetics. 1232:97–173.
Betlach M.R., Tiedje J.M. 1981. Kinetic Explanation for Accumulation of Nitrite, Nitric Oxide, and Nitrous Oxide During Bacterial Denitrification. Applied and environmental microbiology. 42:1074–1084.
Bettazzi E., Caffaz S., Vannini C., Lubello C. 2010. Nitrite inhibition and intermediates effects on Anammox bacteria: A batch-scale experimental study. Process Biochemistry. 45:573–580.
Bilanovic D. 1999. Denitrification under high nitrate concentration and alternating anoxic conditions. Water Research. 33:3311–3320.
Bilgili M.S., Demir A., Akkaya E., Ozkaya B. 2008. COD fractions of leachate from aerobic and anaerobic pilot scale landfill reactors. Journal of Hazardous Materials. 158:157–163.
Blackburne R., Vadivelu V.M., Yuan Z., Keller J. 2007. Kinetic characterisation of an enriched Nitrospira culture with comparison to Nitrobacter. Water Research. 41:3033–42.
Blackburne R., Yuan Z., Keller J. 2008a. Demonstration of nitrogen removal via nitrite in a sequencing batch reactor treating domestic wastewater. Water Research. 42:2166–76.
Blackburne R., Yuan Z., Keller J. 2008b. Partial nitrification to nitrite using low dissolved oxygen concentration as the main selection factor. Biodegradation. 19:303–312.
Blackburne R., Yuan Z., Keller J. 2008c. Partial nitrification to nitrite using low dissolved oxygen concentration as the main selection factor. Biodegradation (2008). 19:303–312.
Blöthe M., Roden E.E. 2009. Composition and activity of an autotrophic Fe(II)-oxidizing, nitrate-reducing enrichment culture. Applied and environmental microbiology. 75:6937–40.
Bock E. 1978. Lithotrophic and chemoorganotrophic growth of nitrifying bacteria. In: Schlessinger D (Ed), Microbiology American Society of Microbiology, Washington, DC. p. 310–314.
De Boer W., Gunnewiek P.A.K., Laanbroek H.J. 1995. Ammonium-oxidation at low ph by a chemolithotrophic bacterium belonging to the genus Nitrosospira. Soil Biology & Biochemistry. 27:127–132.
De Boer W., Gunnewiek P.J.A.K., Veenhuis M., Bock E., Laanbroek H.J. 1991. Nitrification at Low pH by Aggregated Chemolithotrophic Bacteria. Applied and environmental microbiology. 57:3600–3604.
Bollmann A., Laanbroek H.J. 2002. Influence of oxygen partial pressure and salinity on the community composition of ammonia-oxidizing bacteria in the Schelde estuary. Aquat. Microb. Ecol. 28:239–247.
Bonin P. 1996. Anaerobic nitrate reduction to ammonium in two strains isolated from coastal marine sediment: A dissimilatory pathway. FEMS Microbiology Ecology. 19:27–38.
Boon B., Laudelout H. 1962. Kinetics of nitrite oxidation by Nitrobacter winogradskyi. The Biochemical Journal. 85:440–447. Del Borghi A., Binaghi L., Converti A., Del Borghi M. 2003. Combined Treatment of Leachate from Sanitary Landfill and
Municipal Wastewater by Activated Sludge. Chem. Biochem. Eng. Q. 17:277–283. Braker G., Fesefeldt A., Witzel K.-P. 1998. Development of PCR Primer Systems for Amplification of Nitrite Reductase Genes (nirK
and nirS) To Detect Denitrifying Bacteria in Environmental Samples. Applied and environmental microbiology. 64:3769. Brdjanovic D., Van Loosdrecht M.C.M., Versteeg P., Hooijmans C.M., Alaerts G.J., Heijen J. 2000. Modeling COD, N and P
Removal in a Full-Scale WWTP Haarlem Waanderpolder. Water Res. 34:846. Brettar I., Labrenz M., Flavier S., Botel J., Kuosa H., Christen R., Hofle M.G. 2006. Identification of a Thiomicrospira denitrificans-
like epsilonproteobacterium as a catalyst for autotrophic denitrification in the central Baltic Sea. Appl. Environ. Microbiol. 72:1364–1372.
Broda E. 1977. Two kinds of lithotrophs missing in nature. Z Allg Mikrobiol. 17:491–493. Brooks M., Smith R., Macalady D. 1992. Inhibition of existing denitrification enzyme activity by chloramphenicol. Appl Environ
Microbiol. 58:1746–1753. Brosius J., Dull T., Sleeter D., Noller H. 1981. Gene organization and primary structure of a ribosomal RNA operon from
Escherichia coli. J Mol Biol. 148:107–27. Brown&Caldwell 1975. Process design manual for nitrogen control. U.S. Environ. Prot. Agency Technology Transfer, EPA/625/1-
75-007, PB-259 149/3BE. De Bruijn P., Van de Graaf A.A., Jetten M., Robertson L., Kuenen J. 1995. Growth of Nitrosonomas europaea on hydroxylamine.
FEMS Microbiol Lett. 125:179–84. Brunet R.C., Garcia-Gill L.J. 1996. Sulfide-induced dissimilatory nitrate reduction to ammonia in anaerobic freshwater sediments.
FEMS Microbiology Ecology. 21:131–138. Bulow S.E., Francis C.A., Jackson G.A., Ward B.B. 2008. Sediment denitrifier community composition and nirS gene expression
investigated with functional gene microarrays. Environmental Microbiology . 10:3057–3069. Burford J.R., Bremner J.M. 1975. Relationships between the denitrification capacities of soils and total, water-soluble and readily
decomposable soil organic matter. Soil Biol Biochem. 7:389–394. Burgmann H., Jenni S., Vazquez F., Udert K.M. 2011. Regime Shift and Microbial Dynamics in a Sequencing Batch Reactor for
Nitrification and Anammox Treatment of Urine. Applied and environmental microbiology. 77:5897–5907. Byrne N., Strous M., Crepeau V., Kartal B., Birrien J., Schmid M., Lesongeur F., Schouten S., Jaeschke A., Jetten M., Prieur D.,
Godfroy A. 2009. Presence and activity of anaerobic ammoniumoxidizing bacteria at deep-sea hydrothermal vents. ISME J. 3:117– 123.
Cabello P., Roldan M.D., Moreno-Vivian C. 2004. Nitrate reductionandthe nitrogen cycle in archaea. Microbiology. 150:3527–3546. Camargo J.A., Alonso Á. 2006. Ecological and toxicological effects of inorganic nitrogen pollution in aquatic ecosystems: A global
assessment. Environment International. 32:831–849.
References
226
Campos J.L., Arrojo B., Vázquez-Padín J.R., Mosquera-Corral A., Méndez R. 2009. N2O Production by Nitrifying Biomass Under Anoxic and Aerobic Conditions. Applied biochemistry and biotechnology. 152:189–198.
Campos J.L., Mosquera-Corral A., Sanchez M., Mendez R., Lema J.M. 2002. Nitrification in saline wastewater with high ammonia concentration in an activated sludge unit. Water Research. 36:2555–2560.
Canziani R., Emondi V., Garavaglia M., Malpei F., Pasinetti E., Buttiglieri G. 2006. Effect of oxygen concentration on biological nitrification and microbial kinetics in a cross-flow membrane bioreactor (MBR) and moving-bed biofilm reactor (MBBR) treating old landfill leachate. Journal of Membrane Science. 286:202–212.
Cao H., Li M., Hong Y., Gu J.D. 2011. Diversity and abundance of ammonia-oxidizing archaea and bacteria in polluted mangrove sediment. Systematic and Applied Microbiology. 34:513–523.
Carrera J., Jubany I., Carvallo L., Chamy R., Lafuente J. 2004. Kinetic models for nitrification inhibition by ammonium and nitrite in a suspended and an immobilised biomass systems. Process Biochemistry. 39:1159–1165.
Carucci A., Cappai G., Piredda M. 2006. Biodegradability and toxicity of pharmaceuticals in biological wastewater treatment plants. Journal of Environmental Science and Health Part A. 41:1831–1842.
Castignetti D., Hollocher T.C. 1984. Heterotrophic nitrification among denitrifiers. Applied and environmental microbiology. 47:620–3.
Cecen F., Gursoy G. 2000. Characterization of landfill leachates and studies on heavy metal removal. J. Envirin. Monit. 2:436–442. Cecen F., Semerci N., Geyik A.G. 2010. Inhibitory effects of Cu, Zn, Ni and Co on nitrification and relevance of speciation. Journal
of Chemical Technology & Biotechnology. 85:520–528. Cema G., Wiszniowski J., Żabczyński S., Zabłocka-Godlewska E., Raszka a., Surmacz-Górska J. 2007. Biological nitrogen removal
from landfill leachate by deammonification assisted by heterotrophic denitrification in a rotating biological contactor (RBC). Water Science & Technology. 55:35.
Chain P., Lamerdin J., Larimer F., Regala W., Lao V., Land M., Hauser L., Hooper A., Klotz M., Norton J., Sayavedra-Soto L., Arciero D., Hommes N., Whittaker M., Arp D. 2003. Complete Genome Sequence of the Ammonia-Oxidizing Bacterium and Obligate Chemolithoautotroph Nitrosomonas europaea. Journal of Bacteriology. 185:2759–2773.
Chamchoi N. 2008. Inactivation of ANAMMOX communities under concurrent operation of anaerobic ammonium oxidation (ANAMMOX) and denitrification. Bioresource Technology. 99:3331–3336.
Chang C.H., Hao O.J. 1996. Sequencing Batch Reactor System for Nutrient Removal: ORP and pH Profiles. Journal of Chemical Technology & Biotechnology. 67:27–38.
Chen G.-H., Wong M.-T., Okabe S., Watanabe Y. 2003. Dynamic response of nitrifying activated sludge batch culture to increased chloride concentration. Water research. 37:3125–35.
Chen H., Liu S., Yang F., Xue Y., Wang T. 2009. The development of simultaneous partial nitrification, ANAMMOX and denitrification (SNAD) process in a single reactor for nitrogen removal. Bioresource Technology. 100:1548–54.
Chen J., Ji Q., Zheng P., Chen T., Wang C. 2010. Floatation and control of granular sludge in a high-rate anammox reactor. Water Research. 44:3321–3328.
Cho S., Fujii N., Lee T., Okabe S. 2011. Development of a simultaneous partial nitrification and anaerobic ammonia oxidation process in a single reactor. Bioresource Technology. 102:652–659.
Cho S., Takahashi Y., Fujii N., Yamada Y., Satoh H., Okabe S. 2010. Nitrogen removal performance and microbial community analysis of an anaerobic up-flow granular bed anammox reactor. Chemosphere. 78:1129–35.
Choi E., Rhu D., Yun Z., Lee E. 1998. Temperature effect on biological nutrient removal system with weak municipal wastewater. Water Science and Technology. 37:219–226.
Ciudad G., Werner A., Bornhardt C., Muñoz C., Antileo C. 2006. Differential kinetics of ammonia- and nitrite-oxidizing bacteria: A simple kinetic study based on oxygen affinity and proton release during nitrification. Process Biochemistry. 41:1764–1772.
Civelekoglu G., Perendeci A., Yigit N.O., Kitis M. 2007. Modeling Carbon and Nitrogen Removal in an Industrial Wastewater Treatment Plant Using an Adaptive Network-Based Fuzzy Inference System. CLEAN – Soil, Air, Water. 35:617–625.
De Clippeleir H., Siegfried E.V., Carballa M., Verstraete W. 2009. A low volumetric exchange ratio allows high autotrophic nitrogen removal in a sequencing batch reactor. Bioresource Technology. 100:5010–5015.
Cole J. 1996. Nitrate reduction to ammonia by enteric bacteria: redundancy, or a strategy for survival during oxygen starvation? FEMS microbiology letters. 136:1–11.
Cole J.A., Brown C.M. 1980. Nitrite reduction to ammonia by fermentative bacteria – short circuit in the biological nitrogen cycle. FEMS Microbiology Letters. 7:65–72.
Colliver B.B., Stephenson T. 2000. Production of nitrogen oxide and dinitrogen oxide by autotrophic nitrifiers. Biotechnol. Adv. 18:, 219–232.
Collivignarelli C., Bertanza G. 1999. Simultaneous nitrification-denitrification process in activated sludge plants: performance and applicability. Water science and technology: a journal of the International Association on Water Pollution Research. 40:187–194.
Constantin H., Fick M. 1997. Influence of C-sources on the denitrification rate of a high-nitrate concentrated industrial wastewater. Water Research. 31:583–589.
Corominas L.L., Rieger L., Takács I., Ekama G., Hauduc H., Vanrolleghem P. a, Oehmen A., Gernaey K. V, Van Loosdrecht M.C.M., Comeau Y. 2010. New framework for standardized notation in wastewater treatment modelling. Water science and technology: a journal of the International Association on Water Pollution Research. 61:841–57.
Cuhel J., Simek M., Laughlin R.J., Bru D., Chèneby D., Watson C.J., Philippot L. 2010. Insights into the Effect of Soil pH on N2O and N2 Emissions and Denitrifier Community Size and Activity. Applied and environmental microbiology. 76:1870–1878.
Cui Y., Wang S., Li J. 2009. On-line Monitoring for Phosphorus Removal Process and Bacterial Community in Sequencing Batch Reactor. Chinese Journal of Chemical Engineering. 17:484–492.
Dahl C., Kristenses G.H., Vredenbregt L.H.J. 1997. Combined biological nitrification and denitrification of high-salinity wastewater. Water Science & Technology. 36:345–352.
Daims H., Lucker S., Le Paslier D., Wagner M. 2011. Diversity, Environmental Genomics, and Ecophysiology od Nitrite-Oxidizing Bacteria. In: Ward BB, Arp DJ, Klotz MG, (ed.). Nitrification, ASM press, Washington, DC. p. 295–322. ISBN 9781555814816.
Daims H., Purkhold U., Bjerrum L., Arnold E., Wilderer P., Wagner M. 2001. Nitrification in sequencing biofilm batch reactors: lessons from molecular approaches. Water science and technology. 43:9–18.

References
227
Dalsgaard T., Thamdrup B., Canfield D.E. 2005. Mini-review: anaerobic ammonium oxidation (anammox) in the marine environment,. Res. Microbiol. 156:457–464.
Dannenberg S., Kroder S.M., Dilling W., Cypionka H. 1992. Oxidation of H2 , organic compounds and inorganic sulfur compounds coupled to reduction of O2 or nitrate by sulfate-reducing bacteria. Arch Microbiol. 158:93–99.
Dapena-Mora A., Fernández I., Campos J.L., Mosquera-Corral A., Méndez R., Jetten M.S.M. 2007. Evaluation of activity and inhibition effects on Anammox process by batch tests based on the nitrogen gas production. Enzyme and Microbial Technology. 40:859–865.
Dapena-Mora A., Van Hulle S.W., Luis Campos J., Mendez R., Vanrolleghem P.A., Jetten M. 2004. Enrichment of Anammox biomass from municipal activated sludge: experimental and modelling results. Journal of Chemical Technology & Biotechnology. 79:1421–1428.
Dapena-Mora A., Vázquez-Padín J.R., Campos J.L., Mosquera-Corral A., Jetten M.S.M., Méndez R. 2010. Monitoring the stability of an Anammox reactor under high salinity conditions. Biochemical Engineering Journal. 51:167–171.
Date Y., Isaka K., Ikuta H., Sumino T., Kaneko N., Yoshie S., Tsuneda S., Inamori Y. 2009. Microbial diversity of anammox bacteria enriched from different types of seed sludge in an anaerobic continuous-feeding cultivation reactor. Journal of bioscience and bioengineering. 107:281–6.
Daverey A., Su S., Huang Y., Lin J. 2012. Nitrogen removal from opto-electronic wastewater using the simultaneous partial nitrification , anaerobic ammonium oxidation and denitrification (SNAD) process in sequencing batch reactor. Bioresource Technology. 113:225–231.
Degremont, GONZALEZ O.A. 2009. Method and plant for the treatment of effluents containing nitrogen in a sequencing batch reactor. 2/23-FAMPAT-©Questel. Patent Number FR2921917. p. 1–90.
Dempsey J.A.F., Cannon J.G. 1994. Locations of genetic markers on the physical map of the chromosome of Neisseria gonorrhoeae FA1090. J. Bacteriol. 176:2055–2060.
Deng Y., Englehardt J.D. 2006. Treatment of landfill leachate by the Fenton process. Water Research. 40:3683–3694. Dijkman H., Strous M. 1999. Process for ammonia removal from wastewater. PCT/NL/99/00446. Dincer A.R., Kargi F. 2001. Salt inhibition kinetics in nitrification of synthetic saline wastewater. Enzyme and Microbial
Technology. 28:661–665. Dionisi H.M., Layton A.C., Harms G., Gregory I.R., Robinson K.G., Sayler G.S. 2002. Quantification of Nitrosomonas oligotropha-
Like Ammonia-Oxidizing Bacteria and Nitrospira spp. from Full-Scale Wastewater Treatment Plants by Competitive PCR. Applied and environmental microbiology. 68:245–253.
Dold P.L., Ekama G.A., Marais G. v. R. 1980. A general model for the activated sludge process. Prog. Water Technol. 12:47–77. Van Dongen L.G.J.M., Jetten M.S.M., Van Loosdrecht M.C.M. 2001a. The Combined Sharon/Anammox Process. A sustainable
method for N-removal from sludge water. STOWA Report, IWA publishing, London, UK. . Van Dongen U., Jetten M.S.M., Van Loosdrecht M.C.M. 2001b. The SHARON-Anammox process for treatment of ammonium rich
wastewater. Water Science & Technology. 44:153–160. Dosta J., Fernández I., Vázquez-Padín J.R., Mosquera-Corral a, Campos J.L., Mata-Alvarez J., Méndez R. 2008. Short- and long-
term effects of temperature on the Anammox process. Journal of hazardous materials. 154:688–93. Downing A.L., Painter H.A., Knowles G. 1964. Nitrification in the activated sludge process. J. Proc. Inst. Sewage Purif. 130–153. Egli K., Fanger U., Alvarez P.J.J., Siegrist H., Van der Meer J.R., Zehnder A.J.B. 2001. Enrichment and characterization of an
anammox bacterium from a rotating biological contactor treating ammonium-rich leachate. Archives of Microbiology. 175:198–207.
Eilersen A.M., Henze M., Kloft L. 1994. Effect of volatile fatty acids and trimethylamine on nitrification in activated sludge. Water Research. 28:1329–1336.
Ekama G.A., Dold P.L., Marais G. v R. 1986. Procedures for determining influent COD fractions and the maximum specific growth rate of heterotrophs in activated sludge systems. Water Science & Technology. 18:91–114.
Ekama G.A., Wentzel M.C. 2008. Nitrogen Removal. In: “Biological wastewater treatment: Principles, Modeling, and Design” Editor(s): M. Henze, M. C. M. van Loosdrecht, G.A. Ekama and D. Brdjanovic.
Elefsiniotis P., Wareham D.G., Smith M.O. 2004. Use of volatile fatty acids from an acid-phase digester for denitrification. Journal of Biotechnology. 114:289–97.
Etterer T., Wilderer P.A. 2001. Generation and properties of aerobic granular sludge. Water science and technology: a journal of the International Association on Water Pollution Research. 43:19–26.
Ettwig K.F. 2010. Nitrite-dependent methane oxidation. 121. Ettwig K.F., Van Alen K.., Van de Pas-Schoonen K.T., Jetten M.S.M., Strous M. 2009. Enrichment and molecular detection of
denitrifying methanotrophic bacteri of the NC10 phylum. Appl. Environ. Microbiol. 75:3656–62. Ettwig K.F., Butler M.K., Le Paslier D., Pelletier E., Mangenot S., Kuypers M.M.M., Schreiber F., Dutilh B.E., Zedelius J., De Beer
D., Gloerich J., Wessels H.J.C.T., Van Alen T., Luesken F., Wu M.L., Van de Pas-Schoonen K.T., Op den Camp H.J.M., Janssen-Megens E.M., Francoijs K.-J., Stunnenberg H., Weissenbach J., Jetten M.S.M., Strous M. 2010. Nitrite-driven anaerobic methane oxidation by oxygenic bacteria. Nature. 464:543–8.
Ettwig K.F., Shima S., Van de Pas-Schoonen K.T., Kahnt J., Medema M.H., Op den Camp H.J.M., Jetten M.S.M., Strous M. 2008. Denitrifying bacteria anaerobically oxidize methane in the absence of Archaea. Environmental microbiology. 10:3164–73.
Fernández I., Dosta J., Fajardo C., Campos J.L., Mosquera-Corral a, Méndez R. 2012. Short- and long-term effects of ammonium and nitrite on the Anammox process. Journal of environmental management. 95 Suppl:S170–4.
Fernández I., Mosquera-Corral a., Campos J.L., Méndez R. 2009. Operation of an Anammox SBR in the presence of two broad-spectrum antibiotics. Process Biochemistry. 44:494–498.
Fernández I., Vázquez-Padín J.R., Mosquera-Corral a., Campos J.L., Méndez R. 2008. Biofilm and granular systems to improve Anammox biomass retention. Biochemical Engineering Journal. 42:308–313.
Fiencke C., Spieck E., Bock E. 2005. Nitrifying Bacteria. Nitrogen Fixation in Agriculture, Forestry, Ecology, and the Environment. 2005. D.Werner andW.E. Newton (eds.). p. 167.
Focht D., Verstraete W. 1977. Biochemical ecology of nitrification and denitrification. In Alexander M (Ed) Advances in Microbial Ecology, vol. 1 Plenum Press, New York. p. 135–214.

References
228
Francis C. a, Beman J.M., Kuypers M.M.M. 2007. New processes and players in the nitrogen cycle: the microbial ecology of anaerobic and archaeal ammonia oxidation. The ISME journal. 1:19–27.
Fred E.B., Baldwin I.L., McCoy E. 1932. Root Nodule Bacteria and Leguminous Plants. Madison,WI: University of Wiscons in Press. .
Frette L., Gejlsbjerg B., Westermann P. 1997. Aerobic denitrifiers isolated from an alternating activated sludge system. FEMS Microbiol. Ecol. 24:363–370.
Fu F., Wang Q. 2011. Removal of heavy metal ions from wastewaters: A review. Journal of Environmental Management. 92:407–418.
Furukawa K., Inatomi Y., Qiao S., Quan L., Yamamoto T., Isaka K. 2009. Innovative treatment system for digester liquor using anammox process. Bioresource Technology. 100:5437–5443.
Furukawa K., Lieu P.K., Tokitoh H., Fujii T. 2006. Development of single-stage nitrogen removal using anammox and partial nitritation (SNAP) and its treatment performances. Water Science & Technology. 53:83.
Fux C., Boehler M., Huber P., Brunner I., Siegrist H. 2002. Biological treatment of ammonium-rich wastewater by partial nitritation and subsequent anaerobic ammonium oxidation (anammox) in a pilot plant. Journal of Biotechnology. 99:295–306.
Fux C., Marchesi V., Brunner I., Siegrist H. 2004. Anaerobic ammonium oxidation of ammonium-rich waste streams in fixed-bed reactors. Water science and technology: a journal of the International Association on Water Pollution Research. 49:77–82.
Fux C., Siegrist H. 2004. Nitrogen removal from sludge digester liquids by nitrification/denitrification or partial nitritation/anammox: environmental and economical considerations. Water science and technology: a journal of the International Association on Water Pollution Research. 50:19–26.
Gabarró J., Ganigué R., Gich F., Ruscalleda M., Balaguer M.D., Colprim J. 2012. Effect of temperature on AOB activity of a partial nitritation SBR treating landfill leachate with extremely high nitrogen concentration. Bioresource technology. 126C:283–289.
Ganigué R., Gabarró J., Sànchez-Melsió A., Ruscalleda M., López H., Vila X., Colprim J., Balaguer M.D. 2009. Long-term operation of a partial nitritation pilot plant treating leachate with extremely high ammonium concentration prior to an anammox process. Bioresource Technology. 100:5624–32.
Ganigué R., López H., Balaguer M.D., Colprim J. 2007. Partial ammonium oxidation to nitrite of high ammonium content urban landfill leachates. Water Research. 41:3317–26.
Ganigué R., Volcke E.I.P., Puig S., Balaguer M.D., Colprim J. 2012. Impact of influent characteristics on a partial nitritation SBR treating high. Bioresource Technology. 111:62–69.
Gao D.-W., Tao Y. 2011. Versatility and application of anaerobic ammonium-oxidizing bacteria. Applied microbiology and biotechnology. 91:887–94.
Gao H., Schreiber F., Collins G., Jensen M.M., Kostka J.E., Lavik G., De Beer D., Zhou H. -y., Kuypers M.M.M. 2009. Aerobic denitrification in permeable Wadden Sea sediments. The ISME Journal. 4:417–426.
Gaudy A.F., Gaudy E.T. 1980. Microbiology for Environmental Scientists and Engineers. McGraw-Hill: New York. Gayon U., Dupetit G. 1882. Sur la fermentation des nitrates. Comptes Rendus Hebdomadaires des séances de l’ Academie des
Sciences. 95:644–646. Gayon U., Dupetit G. 1886. Recherches sur la reduction des nitrates par les infiniment petits. Mem Sot Sci Phys Nat Bordeaux Ser.
3:201–307. Gieseke A., Bjerrum L., Wagner M., Amann R. 2003. Structure and activity of multiple nitrifying bacterial populations co-existing in
a biofilm. Environmental microbiology. 5:355–69. Ginestet P., Audic J., Urbain V., Block J. 1998. Estimation of nitrifying bacterial activities by measuring oxygen uptake in the
presence of the metabolic inhibitors allylthiourea and azide. Appl Environ Microbiol. 64:2266–2268. Giusti E., Marsili-libelli S., Spagni A. 2011. Modelling microbial population dynamics in nitritation processes. Environmental
Modelling and Software. 26:938–949. Glass C., Silverstein J. 1998. Denitrification kinetics of high nitrate concentration water: pH effect on ihnibition and nitrite
accumulation. Water Research. 32:831–839. Glass C., Silverstein J., Oh J. 1997. Inhibition of denitrification in activated sludge by nitrite. Water Environ Res. 69:1086–1093. Gong Z., Yang F., Liu S., Bao H., Hu S., Furukawa K. 2007. Feasibility of a membrane-aerated biofilm reactor to achieve single-
stage autotrophic nitrogen removal based on Anammox. Chemosphere. 69:776–84. Gorra R., Coci M., Ambrosoli R., Laanbroek H.J. 2007. Effects of substratum on the diversity and stability of ammonia-oxidizing
communities in a constructed wetland used for wastewater treatment. Journal of applied microbiology. 103:1442–52. Van de Graaf A.A., De Bruijn P., Robertson L.A., Jetten M.S.M., Kuenen J.G. 1996. Autotrophic growth of anaerobic ammonium-
oxidizing microorganisms in a fluidized bed reactor. Microbiology. 142:2187–2196. Van de Graaf A.A., De Bruijn P., Robertson L.A., Jetten M.S.M., Kuenen J.G. 1997. Metabolic pathway of anaerobic ammonium
oxidation on the basis of N-15 studies in a fuidized bed reactor. Microbiology UK 143,. 2415–2421. Graham D.W., Knapp C.W., Van Vleck E.S., Bloor K., Lane T.B., Graham C.E. 2007. Experimental demonstration of chaotic
instability in biological nitrification. The ISME journal. 1:385–93. Griess-Romijn van Eck E. 1996. Physiological and chemical tests for drinking water. In: NEN 1056, IV-2. Nederlands Normalisatie
Instituut, Rijswijk, the Netherlands. . Griffin B.M., Schott J., Schink B. 2007. Nitrite, an electron donor for anoxygenic photosynthesis. Science (New York, N.Y.).
316:1870. Grunditz C., Gumaelius L., Dalhammar G. 1998. Comparison of inhibition assays using nitrogen removing bacteria: application to
industrial wastewater. Water research. 32:2995–3000. Gujer W., Henze M., Mino T., Van Loosdrecht M.C.M. 1999. Activated Sludge Model No. 3. Water science and technology. 39:183. Guo J., Peng Y., Huang H., Wang S., Ge S., Zhang J., Wang Z. 2010. Short- and long-term effects of temperature on partial
nitrification in a sequencing batch reactor treating domestic wastewater. Journal of Hazardous Materials. 179:471–479. Guo J.H., Peng Y.Z., Wang S.Y., Zheng Y.N., Huang H.J., Ge S.J. 2009. Effective and robust partial nitrification to nitrite by real-
time aeration duration control in an SBR treating domestic wastewater. Process Biochemistry. 44:979–985. Gut L., Płaza E., Hultman B. 2007. Assessment of a two-step partial nitritation/Anammox system with implementation of
multivariate data analysis. Chemometrics and Intelligent Laboratory Systems. 86:26 – 34.

References
229
Güven D., Dapena A., Kartal B., Markus C., Maas B., Van de Pas-Schoonen K.T., Sozen S., Mendez R., Op Den Camp H.J.M., Jetten M.S.M., Strous M., Schmidt I. 2005. Propionate Oxidation by and Methanol Inhibition of Anaerobic Ammonium-Oxidizing Bacteria. Applied and environmental microbiology. 71:1066.
Hajaya M.G., Tezel U., Pavlostathis S.G. 2011. Effect of temperature and benzalkonium chloride on nitrate reduction. Bioresource technology. 102:5039–47.
Hallam S., Konstantinidis K., Putnam N., Schleper C., Watanabe Y., Sugahara J., Preston C., De la Torre J., PM R., DeLong E. 2006. Genomic analysis of the uncultivated marine crenarchaeote Cenarchaeum symbiosum. Proc Natl Acad Sci USA. 103:18296–18301.
Hamaki T., Suzuki M., Fudou R., Jojima Y., Kajiura T., Tabuchi A., Sen K., Shibai H. 2005. Isolation of novel bacteria and actinomycetes using soil-extract agar medium. Journal of bioscience and bioengineering. 99:485–92.
Hamersley M.R. et al. 2007. Anaerobic ammonium oxidation in the Peruvian oxygen minimum zone. Limnol. Oceanogr. 52:923–933.
Han Z., Wu W., Zhu J., Chen Y. 2008. Oxidization–reduction potential and pH for optimization of nitrogen removal in a twice-fed sequencing batch reactor treating pig slurry. Biosystems Engineering. 99:273–281.
Hanson R.S., Hanson T.E.H. 1996. Methanotrophic bacteria. Microbiol. Rev. 60:439–471. Hao X., Heijnena J.J., Van Loosdrecht M.C.M. 2002. Model-based evaluation of temperature and inflow variations on a partial
nitrification–ANAMMOX biofilm process. Water Research. 36:4839–4849. Harper W.F., Terada A., Poly F., Le Roux X., Kristensen K., Mazher M., Smets B.F. 2009. The effect of hydroxylamine on the
activity and aggregate structure of autotrophic nitrifying bioreactor cultures. Biotechnology and Bioengineering. 102:714–24. Hatzenpichler R., Lebedeva E., Spieck E., Stoecker K., Richter A., Daims H., Wagner M. 2008. A moderately thermophilic
ammonia-oxidizing crenarchaeote from a hot spring. Proc Natl Acad Sci USA. 105:2134–2139. Heinen M. 2006. Simplified denitrification models: Overview and properties. Geoderma. 133:444–463. Hellinga C., Van Loosdrecht M.C.M., Heijnen J.J. 1999. Model Based Design of a Novel Process for Nitrogen Removal from
Concentrated Flows. Mathematical and Computer Modelling of Dynamical Systems. 5:351–371. Hellinga C., Schellen A.A.J.C., Mulder J.W., Van Loosdrecht M.C.M., Heijnen J.J. 1998. The SHARON process an innovative
method for nitrogen removal from ammonium-rich waste water. Water Science and Technology. 37:135–142. Henze M. 1991. Capabilities of biological nitrogen removal processes from wastewater. Water Science and Technology. 23:669–679. Henze M., Grady J.P.L.C., Gujer W., Marais T., R. M.G. V. 1987. Activated Sludge Model No.1. IAWQ Scientific and Technical
Report No. 1, London. . Henze M., Gujer W., Mino T., Van Loosdrecht M. 2000. Activated Sludge Models ASM1, ASM2, ASM2d and ASM3. IWA
Publishing. London. . Henze M., Gujer W., Mino T., Matsuo T., M. W.M.C., R. M.G. V. 1995. Activated Sludge Model No. 2. IWA Scientific and
Technical Report No. 3, London. . Hermansson A., Lindgren P. 2001. Quantification of Ammonia-Oxidizing Bacteria in Arable Soil by Real-Time PCR. Applied and
environmental microbiology. 67:972–976. Herndl G., Reinthaler T., Teira E., Van Aken H., Veth C., Pernthaler A., Pernthaler J. 2005. Contribution of archaea to total
prokaryotic production in the deep atlantic ocean. Appl Environ Microbiol 71: 2303–2309. 71:2303–2309. Heylen K., Vanparys B., Wittebolle L., Verstraete W., Boon N., De Vos P. 2006. Cultivation of Denitrifying Bacteria: Optimization
of Isolation Conditions and Diversity Study. Applied and environmental microbiology. 72:2637. Hiatt W., Grady CP J. 2008. An updated process model for carbon oxidation, nitrification, and denitrification. Water Environ Res.
80:2145–56. Hidaka T., Yamada H., Kawamura M., Tsuno H. 2002. Effect of dissolved oxygen conditions on nitrogen removal in continuously
fed intermittent-aeration process with two tanks. Water Science & Technology. 45:181–188. Hirsch M.D., Long Z.T., Song B. 2011. Anammox bacterial diversity in various aquatic ecosystems based on the detection of
hydrazine oxidase genes (hzoA/hzoB). Microbial ecology. 61:264–76. Holloway B.W., Römling U., Tümmler B. 1994. Genomic mapping of Pseudomonas aeruginosa PAO. Microbiology. 140:2907–
2929. Holmes A.J., Costello A., Lidstrom M.E., Murrell J.C. 1995. Evidence that particulate methane monooxygenase and ammonia
monooxygenase may be evolutionarily related. FEMS Microbiol. Lett. 132:203–208. Hooper A.B., Vannelli T., Bergmann D.J., Arciero D.M. 1997. Enzymology of the oxidation of ammonia to nitrite by bacteria.
Antonie van Leeuwenhoek. 71:59–67. Hoshino T., Noda N., Tsuneda S., Hirata A., Inamori Y. 2001. Direct Detection by In Situ PCR of the amoA Gene in Biofilm
Resulting from a Nitrogen Removal Process. Applied and environmental microbiology. 67:5261–5266. Hu B.-L., Zheng P., Tang C.-J., Chen J.-W., Van der Biezen E., Zhang L., Ni B.-J., Jetten M.S.M., Yan J., Yu H.-Q., Kartal B. 2010.
Identification and quantification of anammox bacteria in eight nitrogen removal reactors. Water Research. 44:1252–1259. Hu S.H., Zeng R.J., Burow L.C., Lant P., Keller J., Yuan Z.G. 2009. Enrichment of denitrifying anaerobic methane oxidizing
microorganisms. Environmental Microbiology Reports. 1:377–384. Hu Z., Chandran K., Smets B.F., Grasso D. 2002. Evaluation of a rapid physical-chemical method for the determination of extant
soluble COD. Water research. 36:617–24. Van Hulle S.W.H., Dapena-Mora A.N.A., Campos J.L., Mendez R., Jetten M.S.M., Vanrolleghem P.A. 2003. Modelling start-up and
operation of an anammox sequencing batch reactor. Med. Fac. Landbouww. Univ. Gent. 68:295–298. Van Hulle S.W.H., Vandeweyer H.J.P., Meesschaert B.D., Vanrolleghem P.A., Dejans P., Dumoulin A. 2010. Engineering aspects
and practical application of autotrophic nitrogen removal from nitrogen rich streams. Chemical Engineering Journal. 162:1–20. Van Hulle S.W.H., Volcke E.I.P., Teruel J.L., Donckels B., Van Loosdrecht M.C.M., Vanrolleghem P.A. 2007. Influence of
temperature and pH on the kinetics of the Sharon nitritation process. Journal of Chemical Technology and Biotechnology. 82:471–480.
Huygens D., Rutting T., Boeckx P., Van Cleemput O., Godoy R., Muller C. 2007. Soil nitrogen conservation mechanisms in a pristine south Chilean Nothofagus ecosystem. Soil Biol. Biochem. 39:2448–2458.

References
230
Iacopozzi I., Innocenti V., Marsili-Libelli S., Giusti E. 2007. A modified Activated Sludge Model No. 3 (ASM3) with two-step nitrification - denitrification. Environmental Modelling & Software. 22:847–861.
Innerebner G., Insam H., Franke-whittle, Ingrid H., Wett B. 2007. Identification of anammox bacteria in a full-scale deammonification plant making use of anaerobic ammonia oxidation. Systematic and Applied Microbiology. 30:408–412.
Insel G., Sin G., Lee D.S., Nopens I., Vanrolleghem P. a 2006. A calibration methodology and model-based systems analysis for SBRs removing nutrients under limited aeration conditions. Journal of Chemical Technology & Biotechnology. 81:679–687.
Isaka K., Sumino T., Tsuneda S. 2007. High Nitrogen Removal Performance at Moderately Low Temperature Utilizing Anaerobic Ammonium Oxidation Reactions. Journal of bioscience and bioengineering. 103:486–490.
Isaka K., Suwa Y., Kimura Y., Yamagishi T., Sumino T., Tsuneda S. 2008. Anaerobic ammonium oxidation (anammox) irreversibly inhibited by methanol. Applied microbiology and biotechnology. 81:379–85.
Itokawa H., Hanaki K., Matsuo T. 2001. Nitrous oxide production in high-loading biological nitrogen removal process under low COD/N ratio condition. Water Research. 35:657–664.
Jaroszynski L.W., Cicek N., Sparling R., Oleszkiewicz J.A. 2011. Importance of the operating pH in maintaining the stability of anoxic ammonium oxidation ( anammox ) activity in moving bed biofilm reactors. Bioresource Technology. 102:7051–7056.
Jensen M.M., Thamdrup B., Dalsgaard T. 2007. Effects of specific inhibitors on Anammox and denitrification in marine sediments. Appl. Environ. Microbiol. 73 (:3151–3158.
Jetten M.S.M. 2008. The microbial nitrogen cycle. Environmental Microbiology. 10:2903–2909. Jetten M.S.M., Horn S.J., Van Loosdrecht M.C.M. 1997. Towards a more sustainable municipal wastewater treatment system. Water
Science & Technology. 35:171–190. Jetten M.S.M., Niftrik L. Van, Strous M., Kartal B., Keltjens J.T., Op den Camp H.J.M. 2009. Biochemistry and molecular biology
of anammox bacteria. Critical reviews in biochemistry and molecular biology. 44:65–84. Jetten M.S.M., Strous M., Van de Pas-Schoonen K.T., Schalk J., Van Dongen U.G.J.M., va de Graaf A.A., Logemann S., Muyzer G.,
Van Loosdrecht M.C.M., Kuenen J.G. 1999. The anaerobic oxidation of ammonium. FEMS Microbiology reviews. 22:421–437. Jetten M.S.M., Wagner M., Fuerst J., Van Loosdrecht M.C.M., Kuenen J.G., Strous M. 2001. Microbiology and application of the
anaerobic ammonium oxidation (’anammox') process. Current opinion in biotechnology. 12:283–8. Jiang T., Liu X., Kennedy M.D., Schippers J.C., Vanrolleghem P.A. 2005. Calibrating a side-stream membrane bioreactor using
Activated Sludge Model No . 1. Water Science & Technology. 52:359–367. Jiménez E., Giménez J.B., Ruano M. V, Ferrer J., Serralta J. 2011. Effect of pH and nitrite concentration on nitrite oxidation rate.
Bioresource Technology. 102:8741–7. Jiménez E., Giménez J.B., Seco a, Ferrer J., Serralta J. 2012. Effect of pH, substrate and free nitrous acid concentrations on
ammonium oxidation rate. Bioresource technology. 124:478–84. Jin R.-C., Ma C., Mahmood Q., Yang G.-F., Zheng P. 2011. Anammox in a UASB reactor treating saline wastewater. Process Safety
and Environmental Protection. 89:342–348. Jin R.-C., Yang G.-F., Yu J.-J., Zheng P. 2012. The inhibition of the Anammox process: A review. Chemical Engineering Journal.
197:67–79. Jones R.D., Hood M.A. 1980. Effects of temperature, pH, salinity, and Inorganic Nitrogen on the rate of ammonium oxidation by
Nitrifiers Isolated from Wetland Environments. Microb. Ecol. 6:339 – 347. Joss A., Salzgeber D., Eugster J., Konig R., Rottermann K., Burger S., Fabijan P., Leumann S., Mohn J., Siegrist H. 2009. Full-Scale
Nitrogen Removal from Digester Liquid with Partial Nitritation and Anammox in One SBR. Environmental Science & Technology. 43:5301–5306.
Jubany I., Carrera J., Lafuente J., Baeza J.A. 2008. Start-up of a nitrification system with automatic control to treat highly concentrated ammonium wastewater : Experimental results and modeling. Chemical Engineering Journal. 144:407–419.
Jukes T.H., Cantor C.. 1969. Evolution of protein molecules. In: Munro, HN (ed). Mammalian Protein Metabolism. Academic Press, New York. p. 21–132.
Jung J.Y., Kang S.H., Chung Y.C., Ahn D.H. 2007. Factors affecting the activity of anammox bacteria during start up in the continuous culture reactor. Water Science and Technology. 55:459–468.
Juretschko S., Timmermann G., Schmid M., Schleifer K.H., Pommerening-Röser A., Koops H., Wagner M. 1998. Combined molecular and conventional analyses of nitrifying bacterium diversity in activated sludge: Nitrosococcus mobilis and Nitrospira-like bacteria as dominant populations. Applied and environmental microbiology. 64:3042–51.
Jørgensen K.S. 1989. Annual pattern of denitrification and nitrate ammonification in estuarine sediment. Appl Environ Microbiol. 55:1841–1847.
Kaelin D., Manser R., Rieger L., Eugster J., Rottermann K., Siegrist H. 2009. Extension of ASM3 for two-step nitrification and denitrification and its calibration and validation with batch tests and pilot scale data. Water Research. 43:1680–1692.
Kalyuhznaya M., Martens-Habbena W., Wang T., Hackett M., Stolyar S.M., Stahl D.A., Lidstrom M.E., Chistoserdova L. 2009. Methylophilaceae link methanol oxidation to denitrification in freshwater lake sediment as suggested by stable isotope probing and pure culture analysis. Environmental Microbiology Reports. 1:385–392.
Kalyuzhnyi S., Gladchenko M., Mulder A., Versprille B. 2006. DEAMOX — New biological nitrogen removal process based on anaerobic ammonia oxidation coupled to sulphide-driven conversion of nitrate into nitrite. Water Research. 40:3637 – 3645.
Kampschreur M.J., Temmink H., Kleerebezem R., Jetten M.S.M., Van Loosdrecht M.C.M. 2009. Nitrous oxide emission during wastewater treatment. Water Research. 43:4093–4103.
Kartal B., Koleva M., Arsov R., Van der Star W., Jetten M.S.M., Strous M. 2006. Adaptation of a freshwater anammox population to high salinity wastewater. Journal of biotechnology. 126:546–53.
Kartal B., Kuenen J.G., Van Loosdrecht M.C.M. 2010. Sewage Treatment with Anammox. Science. 328:702–702. Kartal B., Kuypers M.M.M., Lavik G., Schalk J., Op den Camp H.J.M., Jetten M.S.M., Strous M. 2007a. Anammox bacteria
disguised as denitrifiers: nitrate reduction to dinitrogen gas via nitrite and ammonium. Environmental microbiology. 9:635–42. Kartal B., Maalcke W.J., De Almeida N.M., Cirpus I., Gloerich J., Geerts W., Op den Camp H.J.M., Harhangi H.R., Janssen-Megens
E.M., Francoijs K.-J., Stunnenberg H.G., Keltjens J.T., Jetten M.S.M., Strous M. 2011. Molecular mechanism of anaerobic ammonium oxidation. Nature. 479:127–30.

References
231
Kartal B., Van Niftrik L., Rattray J., Van de Vossenberg J.L.C.M., Schmid M.C., Sinninghe Damsté J., Jetten M.S.M., Strous M. 2008. Candidatus “Brocadia fulgida”: an autofluorescent anaerobic ammonium oxidizing bacterium. FEMS microbiology ecology. 63:46–55.
Kartal B., Rattray J., Van Niftrik L., Van de Vossenberg J., Schmid M., Webb R., Schouten S., Fuerst J., Damsté J., Jetten M., Strous M. 2007b. Candidatus “Anammoxoglobus propionicus” a new propionate oxidizing species of anaerobic ammonium oxidizing bacteria. Syst. Appl. Microbiol. 30:39–49.
Kartal M.B. 2008. Ecophysiology of the anammox bacteria. Ph.D. Thesis. University of Nijmegen, Nijmegen, NL. 101. Kelly J.J., Siripong S., McCormack J., Janus L.R., Urakawa H., El Fantroussi S., Noble P. a, Sappelsa L., Rittmann B.E., Stahl D. a
2005. DNA microarray detection of nitrifying bacterial 16S rRNA in wastewater treatment plant samples. Water research. 39:3229–38.
Kempher M.L., Madigan M.T. 2012. Phylogeny and photoheterotrophy in the acidophilic phototrophic purple bacterium Rhodoblastus acidophilus. Archives of microbiology. 194:567–74.
Kennedy K.J., Lentz E.M. 2000. Treatment of landfill leachate using sequencing batch and continuous flow upflow anaerobic sludge blanket (UASB) reactors. Water Res. 34:3640–3656.
Khataee A.R., Kasiri M.B. 2011. Modeling of Biological Water and Wastewater Treatment Processes Using Artificial Neural Networks. CLEAN - Soil, Air, Water. 39:742–749.
Kim D., Lee D., Cha G., Keller J. 2008. Analysis of Free Ammonia Inhibition of Nitrite Oxidizing Bacteria Using a Dissolved Oxygen Respirometer. Environ. Eng. Res. 13:125–130.
Kim H., Hao O.J. 2001. pH and oxidation-reduction potential control strategy for optimization of nitrogen removal in an alternating aerobic-anoxic system. Water environment research: a research publication of the Water Environment Federation. 73:95–102.
Kim Y.M., Cho H.U., Lee D.S., Park D., Park J.M. 2011. Comparative study of free cyanide inhibition on nitrification and denitrification in batch and continuous flow systems. Desalination. 279:439–444.
Kimura Y., Isaka K., Kazama F., Sumino T. 2010. Effects of nitrite inhibition on anaerobic ammonium oxidation. Applied microbiology and biotechnology. 86:359–65.
Kindaichi T., Ito T., Okabe S. 2004. Ecophysiological interaction between nitrifying bacteria and heterotrophic bacteria in autotrophic nitrifying biofilms as determined by microautor- adiography-fluorescence in situ hybridization. Appl. Environ. Microbiol. 70:1641–1650.
Kirstein K., Bock E. 1993. Close genetic relationship between Nitrobacter hamburgensis nitrite oxidoreductase and Escherichia coli nitrate reductases. Archives of Microbiology. 160:447–453.
Kjeldsen P., Barlaz M.A., Rooker A.P., Baun A., Ledin A., Christensen T.H. 2002. Present and Long-Term Composition of MSW Landfill Leachate: A Review. Critical Reviews in Environmental Science and Technology. 32:297–336.
Kluyver A., Donker H. 1926. Die Einheit in der Biochemie. Chem. Zelle u. Gewebe. 13:134–190. Knowles R. 1982. Denitrification. Microbiological Reviews. 46:43–70. Kobayashi M., Matsuo Y., Takimoto A., Suzuki S., Maruo F., Shoun. H. 1996. Denitrification, a novel type of respiratory
metabolism in fungal mitochondrion. J. Biol. Chem. 271:16263–16267. Koch G., Egli K., Van der Meer J.R., Siegrist H. 2000a. Mathematical modelling of autotrophic denitrification in a nitrifying biofilm
of a rotating biological contactor. Water Sci Technol. 41:191–198. Koch G., Kuhni W., Gujer W., Siegrist H. 2000b. Calibration and validation of activated sludge model No.3 for Swiss municipal
wastewater. Water Research. 34:3580–3590. Koops H.-P., Böttcher B., Möller U.C., Pommerening-Röser A., Stehr G. 1991. Classification of eight new species of ammonia-
oxidizing bacteria: Nitrosomonas communis sp. nov., Nitrosomonas ureae sp. nov., Nitrosomonas aestuarii sp. nov., Nitrosomonas marina sp. nova, Nitrosomonas nitrosa sp. nov., Nitrosomonas eutropha sp. nov., N. Journal of General Microbiology. 137:1689–1699.
Koops H.P., Purkhold U., Pommerening-Röser, A., Timmermann G., Wagner M. 2003. The lithoautotrophic ammonia oxidizers. In The Prokaryotes: An Evolving Elec- tronic Resource for the Microbiological Community, 3rd edn. release, 3.13. Dworkin, M., Falkow, S., Rosenberg, E., Schleifer, K.-H., and Stackebrandt, E. (eds). New York, NY, USA: Springer Verlag.
Kowalchuk G. a, Stephen J.R., De Boer W., Prosser J.I., Embley T.M., Woldendorp J.W. 1997. Analysis of ammonia-oxidizing bacteria of the beta subdivision of the class Proteobacteria in coastal sand dunes by denaturing gradient gel electrophoresis and sequencing of PCR-amplified 16S ribosomal DNA fragments. Applied and environmental microbiology. 63:1489–97.
Kraft B., Strous M., Tegetmeyer H.E. 2011. Microbial nitrate respiration - Genes, enzymes and environmental distribution. Journal of Biotechnology. 155:104–117.
De Kreuk M.K., Van Loosdrecht M.C.M. 2004. Selection of slow growing organisms as a means for improving aerobic granular sludge stability. Water science and technology: a journal of the International Association on Water Pollution Research. 49:9–17.
Krul J.M., Veeningen R.. 1977. The synthesis of the dissimilatory nitrate reductase under aerobic conditions in a number of denitrifying bacteria, isolated from activated-sludge and drinking water. Water Res. 11:39–43.
Kuai L., Verstraete W. 1998. Ammonium removal by the oxygen-limited autotrophic nitrification-denitrification system. Applied and environmental microbiology. 64:4500–6.
Kuenen J.G. 2008. Anammox bacteria : from discovery to application. Nature. 6:320–326. Kulikowska D., Klimiuk E. 2008. The effect of landfill age on municipal leachate composition. Bioresource Technology. 99:5981–
5985. Kumar M., Lin J.-G. 2010. Co-existence of anammox and denitrification for simultaneous nitrogen and carbon removal-Strategies
and issues. Journal of Hazardous Materials. 178:1–9. Kurniawan T.A. 2009. Landfill Leachate: Persistent Threats to Aquatic Environment. SciTopics. Retrieved April 1, 2012, from
http://www.scitopics.com (accessed March 2012). . Kurniawan T.A., Chan G.Y.S., Lo W.-H., Babel S. 2006a. Physico–chemical treatment techniques for wastewater laden with heavy
metals. Chemical Engineering Journal. 118:83–98. Kurniawan T.A., Lo W., Chan G.Y.S. 2006b. Radicals-catalyzed oxidation reactions for degradation of recalcitrant compounds from
landfill leachate. Chemical Engineering Journal. 125:35–57.

References
232
Kuypers M., Sliekers A., Lavik G., Schmid M., Jørgensen B., Kuenen J., Sinninghe Damsté J., Strous M., Jetten M. 2003. Anaerobic ammonium oxidation by anammox bacteria in the Black Sea. Nature. 422(6932:608–11.
Kuypers M.M. et al. 2005. Massive nitrogen loss from the Benguela upwelling system through anaerobic ammonium oxidation. Proc. Natl Acad. Sci. USA. 102:6478–6483.
Kylefors K., Ecke H., Lagerkvist A. 1999. Relevancy of discharge limit of COD for landfill leachates. Sardinia 99, Seventh International Waste Management and Landfill Symposium, 4-8 Octo- ber, S. Margherita di Pula, Cagliari, Sardinia, Italy. Proceedings, Vol. IV,. .
Könneke M., Bernhard A.E., De la Torre J.R., Walker C.B., Waterbury J.B., Stahl D. a 2005. Isolation of an autotrophic ammonia-oxidizing marine archaeon. Nature. 437:543–6.
Kündig C., Hennecke H., Göttfert M. 1993. Correlated physical and genetic map of the Bradyrhizobium japonicum 110 genome. J. Bacteriol. 175:613–622.
De la Vega M.P.T., De Salazar M.E., Jaramillo M. a, Cros J. 2012. New contributions to the ORP & DO time profile characterization to improve biological nutrient removal. Bioresource technology. 114:160–7.
Lackner S., Horn H. 2012. Evaluating operation strategies and process stability of a single stage nitritation-anammox SBR by use of the oxidation-reduction potential (ORP). Bioresource Technology. 107:70–7.
Lackner S., Lindenblatt C., Horn H. 2012. “Swinging ORP” as operation strategy for stable reject water treatment by nitritation–anammox in sequencing batch reactors. Chemical Engineering Journal. 180:190–196.
Laitinen N., Luonsi A., Vilen J. 2006. Landfill leachate treatment with sequencing batch reactor and membrane bioreactor. Desalination. 191:86–91.
Lam P., Lavik G., Jensen M., Van de Vossenberg J., Schmid M., Woebken D., Gutierrez D., Amann R., Jetten M., Kuypers M. 2009. Revising the nitrogen cycle in the Peruvian oxygen minimum zone. Proc Natl Acad Sci USA. 106:4752–4757.
Lan C., Kumar M., Wang C., Lin J. 2011. Development of simultaneous partial nitrification, anammox and denitrification (SNAD) process in a sequential batch reactor. Bioresource Technology. 102:5514–5519.
Langone M., Andreottola G. 2013. Old landfill leachate characterization using respirometric and physical-chemical methods. Waste Management. submitted.
Langone M., Cadonna M., Andreottola G. 2013a. Simultaneous partial nitrification, anammox and denitrification (SNAD) process at moderate temperature treating anaerobic digester effluent. Bioresource Technology. submitted.
Langone M., Yan J., Haaijer S.C.M., Op den Camp H.J.M., Jetten, M. S. M., Andreottola G. 2013b. Coexistence of Nitrifying, Anammox and Denitrifying bacteria in a sequencing batch reactor. Syst. Appl. Microbiol. submitted.
Lau G.N., Sharma K.R., Chen G.H., Van Loosdrecht M.C.M. 2006. Integration of sulphate reduction, autotrophic denitrification and nitrification to achieve low-cost excess sludge minimisation for Hong Kong sewage. Water Science and Technology. 53:227.
Layne E. 1957. Spectrophotometric and Turbidimetric Methods for Measuring Proteins. Methods in Enzymology. 10:447–455. Van de Leemput I.A., Veraart A.J., Dakos V., De Klein J.J.M., Strous M., Scheffer M. 2011. Predicting microbial nitrogen pathways
from basic principles. Environmental microbiology. 13:1477–87. Leininger S., Urich T., Schloter M., Schwark L., Qi J., Nicol G.W., Prosser J.I., Schuster S.C., Schleper C. 2006. Archaea
predominate among ammonia-oxidizing prokaryotes in soils. Nature. 442:806– 809. Levlin E. 2009. Conductivity measurements for controlling municipal wastewater treatment. Research and application of new
technologies in wastewater treatment and municipal solid waste disposal in Ukraine, Sweden and Poland: Proceedings of a Polish-Swedish-Ukrainian seminar. Joint Polish - Swedish reports, ISSN 1650-8610; 15. 51–62.
Li B., Irvin S. 2007. The comparison of alkalinity and ORP as indicators for nitrification sbr and denitrification in a sequencing batch reactor (SBR). Biochemical Engineering Journal. 34:248–255.
Li H., Zhou S., Huang G., Xu B. 2012. Partial nitritation of landfill leachate with varying influent composition under intermittent aeration conditions. Process Safety and Environmental Protection, http://dhttp://dx.doi.org/10.1016/j.psep.2012.05.009. .
Li J.-Y., Hu B.-L., Zheng P., Qaisar M., Mei L.-L. 2008. Filamentous granular sludge bulking in a laboratory scale UASB reactor. Bioresour. Technol. 99:3431–3438.
Li M., Ford T., Li X., Gu J.-D. 2011a. Cytochrome cd1-containing nitrite reductase encoding gene nirS as a new functional biomarker for detection of anaerobic ammonium oxidizing (Anammox) bacteria. Environ. Sci. Technol.,. 45:3547–3553.
Li M., Gu J.-D. 2011. Advances in methods for detection of anaerobic ammonium oxidizing (anammox) bacteria. Applied microbiology and biotechnology. 90:1241–52.
Li M., Hong Y., Klotz M., Gu J.-D. 2010. A comparison of primer sets for detecting 16S rRNA and hydrazine oxidoreductase genes of anaerobic ammonium-oxidizing bacteria in marine sediments. Appl Microbiol Biotechnol. 86:781–790.
Li X., Du B., Fu H., Wang R., Shi J., Wang Y., Jetten M.S.M., Quan Z. 2009. The bacterial diversity in an anaerobic ammonium-oxidizing (anammox) reactor community. Systematic and applied microbiology. 32:278–289.
Li X., Xiao Y., Liao D., Zheng W., Yi T., Yang Q., Zeng G. 2011b. Granulation of Simultaneous Partial Nitrification and Anammox Biomass in One Single SBR System. Applied biochemistry and biotechnology. 163:1053–65.
Li Z., Ma Y., Hira D., Fujii T., Furukawa K. 2011c. Factors affecting the treatment of reject water by the anammox process. Bioresource technology. 102:5702–8.
Liang Z., Liu J. 2008. Landfill leachate treatment with a novel process: Anaerobic ammonium oxidation (Anammox) combined with soil infiltration system. Journal of Hazardous Materials. 151:202–212.
Liang Z., Liu J.-X., Li J. 2009. Decomposition and mineralization of aquatic humic substances (AHS) in treating landfill leachate using the Anammox process. Chemosphere. 74:1315–20.
Liao D., Li X., Yang Q., Zeng G., Guo L., Yue X. 2008. Effect of inorganic carbon on anaerobic ammonium oxidation enriched in sequencing batch reactor. Journal of environmental sciences (China). 20:940–4.
Lieu P.K., Hatozaki R., Homan H., Furukawa K. 2005. Single-Stage Nitrogen Removal Using Anammox and Partial Nitrification (SNAP) for Treatment of Synthetic Landfill Leachate. Japanese Journal of Water Treatment Biology. 41:103–112.
Liu J., Zuo J., Yang Y., Zhu S., Kuang S., Wang K. 2010. An autotrophic nitrogen removal process : Short-cut nitrification combined with ANAMMOX for treating diluted effluent from an UASB reactor fed by landfill leachate. Journal of Environmental Sciences. 22:777–783.
Liu Y., Tay J.-H. 2004. State of the art of biogranulation technology for wastewater treatment. Biotechnology advances. 22:533–563.

References
233
Liu Y., Wang Z.-W., Qin L., Liu Y.-Q., Tay J.-H. 2005. Selection pressure-driven aerobic granulation in a sequencing batch reactor. Applied microbiology and biotechnology. 67:26–32.
Van Loosdrecht M.C.M., Henze M. 1999. Maintenance endogeneous respiration, lysis, decay and predation. Water Science and Technology. 39:107–117.
Lotti T., Cordola M., Kleerebezem R., Caffaz S., Lubello C., Van Loosdrecht M.C.M. 2012a. Inhibition effect of swine wastewater heavy metals and antibiotics on anammox activity. Water science and technology: a journal of the International Association on Water Pollution Research. 66:1519–26.
Lotti T., Van der Star W.R.L., Kleerebezem R., Lubello C., Van Loosdrecht M.C.M. 2012b. The effect of nitrite inhibition on the anammox process. Water research. 46:2559–69.
Loy A., Maixner F., Wagner M., Horn M. 2007. probeBase-an online resource for rRNA-targeted oligonucleotide probes: new features 2007. Nucleic acids research. 35:D800–4.
Lu H., Chandran K. 2010. Factors promoting emissions of nitrous oxide and nitric oxide from denitrifying sequencing batch reactors operated with methanol and ethanol as electron donors. Biotechnology and Bioengineering. 106:390–398.
Ludwig W., Mittenhuber G., Friedrich C. 1993. Transfer of Thiosphaera pantotropha to Paracoccus denitrificans. Int J Syst Bacteriol. 43:363–367.
Luesken F. a, Zhu B., Van Alen T. a, Butler M.K., Diaz M.R., Song B., Op den Camp H.J.M., Jetten M.S.M., Ettwig K.F. 2011a. pmoA Primers for detection of anaerobic methanotrophs. Applied and environmental microbiology. 77:3877–80.
Luesken F., Van Alen T., Van der Biezen E., Frijters C., Toonen G., Kampman C., Hendrickx T.L.G., Zeeman G., Temmink H., Strous M., Op den Camp H.J.M., Jetten M.S.M. 2011b. Diversity and enrichment of nitrite-dependent anaerobic methane oxidizing bacteria from wastewater sludge. Applied microbiology and biotechnology. 92:845–54.
Luesken F.A., Sanchez J., Van Alen T.A., Sanabria J., Op den Camp H.J.M., Jetten M.S.M., Kartal B. 2011c. Simultaneous nitrite-dependent anaerobic methane and ammonium oxidation. Appl. Environ. Microbiol. 77:6802–6807.
Lv Y., Wang L., Wang X., Yang Y., Wang Z., Li J. 2011. Macroscale and microscale analysis of Anammox in anaerobic rotating biological contactor. Journal of Environmental Sciences. 23:1679–1683.
Ma J., Yang Q., Wang S., Wang L., Takigawa A., Peng Y. 2010. Effect of free nitrous acid as inhibitors on nitrate reduction by a biological nutrient removal sludge. Journal of Hazardous Materials. 175:518–523.
Madigan M.T., Martinko J.M. 2006. Brock Biology of Microorganisms, 11th edn, Upper Saddle River, NJ: Pearson Prentice Hall. Magrí A., Corominas L., López H., Campos E., Balaguer M., Colprim J., Flotats X. 2007. A Model for the Simulation of the
SHARON Process: pH as a Key Factor. Environment Technology. 28:255–265. Maixner F., Nogurea D.R., Anneser B., Stoecker K., Wegl G., Wagner M., Daims H. 2006. Nitrite concentration influences the
population structure on Nitrospira-like bacteria. Environ. Microbiol. 8:8:1487–1495. Mamais D., Jenkins D., Pitt P. 1993. A rapid physical–chemical method for the determination of readily biodegradable soluble COD
in municipal wastewater. Water Research. 27:195–7. Mangimbulude J.C., Van Straalen N.M., Röling W.F.M. 2012. Microbial nitrogen transformation potential in surface run-off leachate
from a tropical landfill. Waste management. 32:77–87. Manz W., Amann R., Ludwig W., Wagner M., Schleifer K.-H. 1992. Phylogenetic oligodeoxynucleotide probes for the major
subclasses of Proteobacteria: problems and solutions. Syst. Appl. Microbiol. 15:593 – 600. Marietou A., Griffiths L., Cole J. 2009. Preferential reduction of the thermodynamically less favorable electron acceptor, sulfate, by a
nitrate-reducing strain of the sulfate-reducing bacterium Desulfovibrio desulfuricans 27774. Journal of Bacteriology. 191:882–889.
Martens-Habbena W., Berube P.M., Urakawa H., De la Torre H.J.R., Stahl D.A. 2009. Ammonia oxidation kinetics determine niche separation of nitrifying Archaea and Bacteria. Nature. 461:976–978.
Matheson F.E., Nguyen M.L., Cooper A.B., Burt T.P. 2003. Short-term nitrogen transformation rates in riparian wetland soil determined with nitrogen-15. Biol. Fertil. Soils. 38:129–136.
Matějů V., Čižinská S., Krejčí J., Janoch T. 1992. Biological water denitrification-a review. Enzyme Microb Technol. 14:170–183. Maurer M., Gujer W. 1995. Monitoring of microbial phosphorus release in batch experiments using electric conductivity. Wat. Res.,.
29:2613–2617. Mckenney D.J., Johnson G.P., Findlay W.I. 1984. Effect of Temperature on Consecutive Denitrification Reactions in Brookston
ClaV and Fox Sandy Loam. Applied and Environment Microbiology. 47:919–926. McTavish H., Fuchs J. a, Hooper a B. 1993. Sequence of the gene coding for ammonia monooxygenase in Nitrosomonas europaea.
Journal of bacteriology. 175:2436–44. Mehta M.P., Baross J.A. 2006. Nitrogen Fixation at 92°C by a Hydrothermal Vent Archaeon. Science. 314:1783–1786. Meusel E. 1875. De la putrefaction produite par les batteries, en presence des nitrates alcalins. C. R. Hebd. Seances Acad. Sci.
81:533–534. Mincer T., Church M., Taylor L., Preston C., Karl D., DeLong E. 2007. Quantitative distribution of presumptive archaeal bacterial
nitrifiers in Monterey Bay the North Pacific Subtropical Gyre. Environ. Microbiol. 9:1162–1175. Miura Y., Okabe S. 2008. Quantification of cell specific uptake activity of microbial products by uncultured Chloroflexi by
microautoradiography combined with fluorescence in situ hybridization. Environ. Sci. Technol. 42:7380–7386. Miura Y., Watanabe Y., Okabe S. 2007. Significance of Chloroflexi in performance of submerged membrane bioreactors (MBR)
treating municipal wastewater. Environ. Sci. Technol. 41:7787–7794. Mobarry B.K., Wagner M., Urbain V., Rittmann B.E., Stahl D.A. 1996. Phylogenetic Probes for Analyzing Abundance and Spatial
Organization of Nitrifying Bacteria. Applied and environmental microbiology. 62:2156–2162. Modin O., Fukushi K., Yamamoto K. 2007. Denitrification with methane as external carbon source. Water research. 41:2726–38. Mohan S.V., Rao N.C., Prasad K.K., Madhavi B.T.V., Sharma P.N. 2005. Treatment of complex chemical wastewater in a
sequencing batch reactor (SBR) with an aerobic suspended growth configuration. Process Biochemistry. 40:1501–1508. Molinuevo B., García M.C., Karakashev D., Angelidaki I. 2009. Anammox for ammonia removal from pig manure effluents: effect
of organic matter content on process performance. Bioresource technology. 100:2171–5. Morling S. 2010. Nitrogen removal and heavy metals in leachate treatment using SBR technology. Journal of Hazardous Materials.
174:679–686.

References
234
Mosquera-Corral A., González F., Campos J.L., Méndez R. 2005. Partial nitrification in a SHARON reactor in the presence of salts and organic carbon compounds. Process Biochemistry. 40:3109–3118.
Moussa M.S., Sumanasekera D.U., Ibrahim S.H., Lubberding H.J., Hooijmans C.M., Gijzen H.J., Van Loosdrecht M.C.M. 2006. Long term effects of salt on activity, population structure and floc characteristics in enriched bacterial cultures of nitrifiers. Water research. 40:1377–88.
Mulder A. 1992. Anoxic ammonia oxidation. US Patent 5,078,884. Mulder A. 2003. The quest for sustainable nitrogen removal technologies. Water Science and Technology. 48:67–75. Mulder A., Van de Graaf A.A., Robertson L.A., Kuenen J.G. 1995. Anaerobic ammonium oxidation discovered in a denitrifying
fluidized bed reactor. FEMS Microbiology ecology. 16:177–184. Mulder J.-W., Van Loosdrecht M.C.M., Hellinga C., Van Kempen R. 2001. Full-scale application of the SHARON process for
treatment of rejection water of digested sludge dewatering. Water Science and Technology. 43:127–34. Murnleitner E., Kuba T., Van Loosdrecht M.C.M., Heijnen J.J. 1997. An Integrated Metabolic Model for the Aerobic and
Denitrifying Biological Phosphorus Removal. Biotechnology and bioengineering. 54:434–450. Mühling M., Woolven-Allen J., Murrell J.C., Joint I. 2008. Improved group-specific PCR primers for denaturing gradient gel
electrophoresis analysis of the genetic diversity of complex microbial communities. The ISME journal. 2:379–92. Münch E. V., Lant P., Keller J. 1996. Simultaneous nitrification and denitrification in bench-scale sequencing batch reactors. Water
Research. 30:277–284. Neczaj E., Okoniewska E., Kacprzak M. 2005. Treatment of landfill leachate by sequencing batch reactor. Desalination. 185:357–
362. Neef A., Amann R., Schlesner H., Schleifer K.H. 1998. Monitoring a widespread bacterial group: in situ detection of planctomycetes
with 16S rRNA-targeted probes. Microbiology. 144:3257–3266. Ni B.-J., Chen Y.-P., Liu S.-Y., Fang F., Xie W.-M., Yu H.-Q. 2009. Modeling a granule-based anaerobic ammonium oxidizing
(ANAMMOX) process. Biotechnology and bioengineering. 103:490–9. Ni S., Fessehaie A., Lee P., Gao B., Xu X., Sung S. 2010. Interaction of anammox bacteria and inactive methanogenic granules under
high nitrogen selective pressure. Bioresource Technology. 101:6910–6915. Ni S.-Q., Ni J.-Y., Hu D.-L., Sung S. 2012. Effect of organic matter on the performance of granular anammox process. Bioresource
technology. 110:701–5. Nicol G.W., Leininger S., Schleper C. 2011. Distribution and activity of ammonia-oxidizing Archaea in natular environments. In:
Ward BB, Arp DJ, Klotz MG, (ed.). Nitrification, ASM press, Washington, DC. p. pp. 295–178. ISBN 9781555814816. Van Niel E.W.J., Arts P.A.M., Wesselink B.J., Robertson L.A., Kuenen J.G. 1993. Competition between heterotrophic and
autotrophic nitrifiers for ammonia in chemostat cultures. FEMS Microbiol.Ecol. 102:109– 118. Nielsen M., Bollmann A., Sliekers O., Jetten M.S.M., Schmid M., Strous M., Schmidt I., Larsen L.H., Nielsen L.P., Revsbech N.P.
2005. Kinetics, diffusional limitation and microscale distribution of chemistry and organisms in a CANON reactor. FEMS Microbiology Ecology. 51:247–56.
Noda N., Kaneko N., Mikami M., Kimochi Y., Tsuneda S., Hirata A., Mizuochi M., Inamori Y. 2003. Effects of SRT and DO on N2O reductase activity in an anoxic-oxic activated sludge system. Water Science & Technology. 48:363–370.
Nogales B., Timmis K.N., Nedwell D.B., Osborn A.M. 2002. Detection and diversity of expressed denitrification genes in estuarine sediments after reverse transcription-PCR amplification from mRNA. Applied and Environment Microbiology. 68:5017–5025.
Norton J.M. 2011. Diversity and environmental distribution of ammonia-oxidizing bacteria. In: Ward BB, Arp DJ, Klotz MG, (ed.). Nitrification, ASM press, Washington, DC. p. 39–52. ISBN 9781555814816.
Novotny V., Jones H., Feng X., Capodaglio A. 1990. Time Series Analysis Models of Activated Sludge Plants. Water Science and Technology. 23:1107–1116.
Obaja D., Macé S., Costa J., Sans C., Mata-Alvarez J. 2003. Nitrification, denitrification and biological phosphorus removal in piggery wastewater using a sequencing batch reactor. Bioresource Technology. 87:103–111.
Offre P., Prosser J.I., Nicol G.W. 2009. Growth of ammonia- oxidizing archaea in soil microcosms is inhibited by acetylene. FEMS Microbiology Ecology. 70:99–108.
Oguz M.T., Robinson K.G., Layton A.C., Sayler G.S. 2007. Concurrent Nitrite Oxidation and Aerobic Denitrification in Activated Sludge Exposed to Volatile Fatty Acids. Biotechnology and Bioengineering. 97:1562–1572.
Okabe S., Satoh H., Watanabe Y. 1999. In situ analysis of nitrifying biofilms as determined by in situ hybridization and the use of microelectrodes. Applied and environmental microbiology. 65:3182–91.
Oshiki M., Shimokawa M., Fujii N., Satoh H., Okabe S. 2011. Physiological characteristics of the anaerobic ammonium-oxidizing bacterium “Candidatus Brocadia sinica”. Microbiology (Reading, England). 157:1706–13.
Ozkaya B., Demir A., Bilgili M.S. 2006. Soluble substrate concentrations in leachate from field scale MSW test cells. Journal of Hazardous Materials. 134:19–26.
Painter H.A., Loveless J.E. 1983. Effect of Temperature and pH Value on the Growth Rate Constants of Nitrifying Bacteria in the Activated Sludge Process. Water Research. 17:237–248.
Pambrun V., Paul E., Spérandio M. 2006. Modeling the Partial Nitrification in Sequencing Batch Reactor for Biomass Adapted to High Ammonia Concentrations. Biotechnology and Bioengineering. 95:120–131.
Panswad T., Anan C. 1999. Specific oxygen, ammonia, and nitrate uptake rates of a biological nutrient removal process treating elevated salinity wastewater. Bioresource Technology. 70:237–243.
Paredes D., Kuschk P., Mbwette T.S.A., Stange F., Müller R.A., Köser H. 2007. New Aspects of Microbial Nitrogen Transformations in the Context of Wastewater Treatment – A Review. Eng. Life Sci. 7:13–25.
Park H., Rosenthal A., Ramalingam K., Fillos J., Chandran K. 2008. Comparison study of the effects of temperature and free ammonia concentration on nitrification and nitrite accumulation. Process Biochemistry. 43:154–160.
Park H., Rosenthal A., Ramalingam K., Fillos J., Chandran K. 2010. Linking community profiles, gene expression and N-removal in anammox bioreactors treating municipal anaerobic digestion reject water. Environ Sci Technol. 44:6110–6.
Park H.-D., Regan J.M., Noguera D.R. 2002. Molecular analysis of ammonia-oxidizing bacterial populations in aerated-anoxic Orbal processes. Water science and technology: a journal of the International Association on Water Pollution Research. 46:273–80.

References
235
Park H.-D., Wells G.F., Bae H., Criddle C.S., Francis C. a 2006. Occurrence of ammonia-oxidizing archaea in wastewater treatment plant bioreactors. Applied and environmental microbiology. 72:5643–7.
Park S., Bae W. 2009. Modeling kinetics of ammonium oxidation and nitrite oxidation under simultaneous inhibition by free ammonia and free nitrous acid. Process Biochemistry. 44:631–640.
Park S., Bae W., Chung J., Baek S.-C. 2007. Empirical model of the pH dependence of the maximum specific nitrification rate. Process Biochemistry. 42:1671–1676.
Pavgelj N.B., Hvala N., Kocijan J., Ros M., Subelj M., Music G., Strmcnik S. 2001. Experimental design of an optimal phase duration control strategy used in batch biological wastewater treatment. ISA transactions. 40:41–56.
Paxéus N. 2000. Organic compounds in municipal landfill leachates. Water Science and Technology. 42:323–333. Payne W. 1973. Reduction of nitrogenous oxides by microorganisms. Bacteriol. Rev. 37:409–452. Peddie C.C., Mavinic D.S., Jenkins C.J. 1990. Use og ORP for monitoring and control of aerobic sludge digestion. Journal of
Environmental Engineering © ASCE. 116:461–471. Peng Y., Zhu G. 2006. Biological nitrogen removal with nitrification and denitrification via nitrite pathway. Applied microbiology
and biotechnology. 73:15–26. Philippot L. 2002. Denitrifying genes in bacterial and Archaeal genomes. Biochimica et Biophysica Acta. 1577:355–376. Philippot L., Mirleau P., Mazurier S., Siblot S., Hartmann A., Lemanceau P., Germon J.C. 2001. Characterization and transcriptional
analysis of Pseudomonas fluorescens denitrifying clusters containing the nar, nir, nor and nos genes. Biochimica et Biophysica Acta. 1517:436–440.
Philips S., Laanbroek H.J., Verstraete W. 2002a. Origin, causes and effects of increased nitrite concentrations in aquatic environments. Re/Views in Environmental Science & Bio/Technology. 1:115–141.
Philips S., Wyffels S., Sprengers R., Verstraete W. 2002b. Oxygen-limited autotrophic nitrification/denitrification by ammonia oxidisers enables upward motion towards more favourable conditions. Applied microbiology and biotechnology. 59:557–66.
Pollice A., Tandoi V., Lestingi C. 2002. Influence of aeration and sludge retention time on ammonium oxidation to nitrite and nitrate. Water Research. 36:2541–2546.
Poly F., Wertz S., Brothier E., Degrange V. 2008. First exploration of Nitrobacter diversity in soils by a PCR cloning-sequencing approach targeting functional gene nxrA. FEMS Microbiology Ecology. 63:132–40.
Poth M. 1986. Dinitrogen Production from Nitrite by a Nitrosomonas Isolate. Applied and environmental microbiology. 52:957–959. Poth M., Focht D.D. 1985a. 15N Kinetic Analysis of N2O Production by Nitrosomonas europaea: an Examination of Nitrifier
Denitrification. Applied and environmental microbiology. 49:1134–1141. Poth M., Focht D.D. 1985b. 15N Kinetic Analysis of N2O Production by Nitrosomonas europaea: an Examination of Nitrifier
Denitrification. Applied and environmental microbiology. 49:1134–1141. Pratscher J., Stichternoth C., Fichtl K., Schleifer K.-H., Braker G. 2009. Application of recognition of individual genes fluorescence
in situ hybridization (RING- FISH) to detect nitrite reductase genes (nirK) of denitrifiers in pure cultures and environmental samples. Applied and Environmental Microbiology. 75:802–810.
Price G.A., Barlaz M.A., Hater G.R. 2003. Nitrogen management in bioreactor landfills. Waste Manag. 23:675–688. Prince R.C., George G.N. 1997. The remarkable complexity of hydroxylamine oxidoreductase. Nature Structural & Molecular
Biology. 2:247 – 250. Purkhold U., Pommerening-Röser A., Juretschko S., Schmid M.C., Koops H.P., Wagner M. 2000. Phylogeny of all recognized
species of ammonia oxidizers based on comparative 16S rRNA and amoA sequence analysis: implications for molecular diversity surveys. Applied and environmental microbiology. 66:5368–82.
Pynaert K., Smets B.F., Wyffels S., Beheydt D., Siciliano S.D., Verstraete W. 2003. Characterization of an Autotrophic Nitrogen-Removing Biofilm from a Highly Loaded Lab-Scale Rotating Biological Contactor. Applied and environmental microbiology. 69:3626–3635.
Quan Z.-X., Rhee S.-K., Zuo J.-E., Yang Y., Bae J.-W., Park J.R., Lee S.-T., Park Y.-H. 2008. Diversity of ammonium-oxidizing bacteria in a granular sludge anaerobic ammonium-oxidizing (anammox) reactor. Environmental microbiology. 10:3130–9.
Quinlan A. 1984. Prediction of the optimum-pH for ammonia-N Oxidation by Nitrosomonas - Europaea in well-aerated natural and domestic-waste waters. Water Research. 18:561–566.
Ra C.S., Lo K.V., Mavinic D.S. 1996. Control of a swine manure treatment using a specific feature of oxidation. Biosour. Technol. 70:117–127.
Rabus R., Widdel F. 1995. Anaerobic degradation of ethylbenzene and other aromatic hydrocarbons by new denitrifying bacteria. Arch Microbiol. 163:96–103.
Rabus R., Widdel F. 1996. Utilization of alkylbenzenes during anaerobic growth of pure cultures of denitrify- ing bacteria on crude oil. Appl Environ Microbiol 71: 2303–2309. 62:1238–1241.
Raghoebarsing A.A., Pol A., Van De Pas-schoonen K.T., Smolders A.J.P., Ettwig K.F., Rijpstra W.I.C., Schouten S., Damsté J.S.S., Op den Camp H.J.M., Jetten M.S.M., Strous M. 2006. A microbial consortium couples anaerobic methane oxidation to denitrification. Nature, Letters. 440:10–13.
Rainey P.B., Bailey M.J. 1996. Physical and genetic map of the Pseudomonas fluorescens SBW25 chromosome. Mol. Microbiol. 19:521– 533.
Ralt D., Gomez R.F., Tannerbaum S.R. 1981. Conversion of acetohydroxamate and hydroxylamine to nitrite by intestinal microorganisms. European journal of applied microbiology and biotechnology. 12:226–230.
Renou S., Givaudan J.G., Poulain S., Dirassouyan F., Moulin P. 2008. Landfill leachate treatment: Review and opportunity. Journal of Hazardous Materials. 150:468–493.
Richardson D., Felgate H., Watmough N., Thomson A., Baggs E. 2009. Mitigating release of the potent greenhouse gas N(2)O from the nitrogen cycle - could enzymic regulation hold the key? Trends in biotechnology. 27:388–97.
Rieger L., Koch G., Kuhni W., Gujer W., Siegrist H. 2001. The EAWAG BIO-P module for activated sludge model No.3. Water Research. 35:3887–3903.
Risgaard-Petersen N., Langezaal A.M., Ingvardsen S., Schmid M.C., Jetten M.S.M., Camp H.J.M.O. den, Derksen J.W.M., Pina-Ochoa E., Eriksson S.P., Nielsen L.P., Revsbech N.P., Cedhagen T., Van der Zwaan G.J. 2006. Evidence for complete denitrification in a benthic foraminifer. Nature, Letters. 443:93–96.

References
236
Ritchie G.A., Nicholas D.J. 1972. Identification of the sources of nitrous oxide produced by oxidative and reductive processes in Nitrosomonas europaea. Biochemical Journal. 126:1181–1191.
Robertson L.A., Kuenen J. 1984. Aerobic denitrification: a controversy revived. Arch Microbiol. 139:351–354. Robertson L.A., Kuenen J.G. 1988. Heterotrophic nitrification in Thiosphaera pantotropha: oxygen uptake and enzyme studies. J.
Gen. Microbiol. 134:857–863. Robinson H.D., Maris P.J. 1983. The treatment of leachates from domestic wastes in landfills—I: Aerobic biological treatment of a
medium-strength leachate. Water Research. 17:1537–1548. Roeleveld P.J., Van Loosdrecht M.C.M. 2002. Experience with guidelines for wastewater characterisation in The Netherlands. Water
science and technology: a journal of the International Association on Water Pollution Research. 45:77–87. Rosenwinkel K.H., Cornelius A. 2005. Deammonification in the Moving-Bed Process for the Treatment of Wastewater with High
Ammonia Content. Chemical Engineering & Technology. 28:49–52. Rotthauwe J.H., Witzel K.P., Liesack W. 1997. The ammonia monooxygenase structural gene amoA as a functional marker:
molecular fine-scale analysis of natural ammonia-oxidizing populations. Applied and environmental microbiology. 63:4704–12. Ruiz G., Jeison D., Rubilar O., Ciudad G., Chamy R. 2006. Nitrification–denitrification via nitrite accumulation for nitrogen removal
from wastewaters. Bioresource Technology. 97:330–335. Ruiz-Rueda O., Hallin S., Bañeras L. 2009. Structure and function of denitrifying and nitrifying bacterial communities in relation to
the plant species in a constructed wetland. FEMS microbiology ecology. 67:308–19. Ruscalleda M., López H., Ganigué R., Puig S., Balaguer M.D., Colprim J. 2008. Heterotrophic denitrification on granular anammox
SBR treating urban landfill leachate. Water science and technology: a journal of the International Association on Water Pollution Research. 58:1749–55.
Ruscalleda M., Puig S., Mora X., López H., Ganigué R., Balaguer M.D., Colprim J. 2010. The effect of urban landfill leachate characteristics on the coexistence of anammox bacteria and heterotrophic denitrifiers. Water science and technology: a journal of the International Association on Water Pollution Research. 61:1065–71.
Rysgaard S., Glud R.N., Risgaard-Petersen N., Dalsgaard T. 2004. Denitrification and Anammox activity in Arctic marine sediments,. Limnol. Oceanogr. 49:1493–1502.
Rütting T., Boeckx P., Müller C., Klemedtsson L. 2011. Assessment of the importance of dissimilatory nitrate reduction to ammonium for the terrestrial nitrogen cycle. Biogeosciences. 8:1779–1791.
Sabumon P.C. 2007. Anaerobic ammonia removal in presence of organic matter : A novel route. Journal of Hazardous Materials. 149:49–59.
Saitou N., Nei M. 1987. The neighbor-joining method: A new method for reconstructing phylogenetic trees. Molecular Biology and Evolution. 4:406–425.
Salinero K.K., Keller K., Feil W.S., Feil H., Trong S., Di Bartolo G., Lapidus A. 2009. Metabolic analysis of the soil microbe Dechloromonas aromatica str. RCB: indications of a surprisingly complex life-style and cryptic anaerobic pathways for aromatic degradation. BMC genomics. 10:351.
Samie G., Bernier J., Rocher V., Lessard P. 2011. Modeling nitrogen removal for a denitrification biofilter. Bioprocess Biosyst Eng. 34:747–755.
Scaglione D., Caffaz S., Bettazzi E., Lubello C. 2009. Experimental determination of Anammox decay coefficient. Journal of Chemical Technology & Biotechnology. 84:1250–1254.
Scaglione D., Ruscalleda M., Ficara E., Balaguer M.D., Colprim J. 2012. Response to high nitrite concentrations of anammox biomass from two SBR fed on synthetic wastewater and landfill leachate. Chemical Engineering Journal. 209:62–68.
Schalk J., De Vries S., Kuenen J.G., Jetten M.S. 2000. Involvement of a novel hydroxylamine oxidoreductase in anaerobic ammonium oxidation. Biochemistry. 2000:5405–5412.
Schmid M., Schmitz-Esser S., Jetten M., Wagner M. 2001. 16S-23S rDNA intergenic spacer and 23S rDNA of anaerobic ammonium-oxidizing bacteria: implications for phylogeny and in situ detection. Environmental microbiology. 3:450–9.
Schmid M., Twachtmann U., Klein M., Strous M., Juretschko S., Jetten M., Metzger J.W., Schleifer K.H., Wagner M. 2000. Molecular evidence for genus level diversity of bacteria capable of catalyzing anaerobic ammonium oxidation. Systematic and Applied Microbiology. 23:93–106.
Schmid M., Walsh K., Webb R., Rijpstra W.I.C., Van de Pas-schoonen K.T., Verbruggen M.J., Hill T., Moffett B., Fuerst J., Schouten S., Damsté J.S.S., Harris J., Shaw P., Jetten M.S.M., Strous M. 2003. Candidatus “Scalindua brodae”, sp. nov., Candidatus “ Scalindua wagneri ”, sp . nov ., Two New Species of Anaerobic Ammonium Oxidizing Bacteria. Systematic and applied microbiology. 26:529–538.
Schmid M.C., Hooper A.B., Klotz M.G., Woebken D., Lam P., Kuypers M.M.M., Pommerening-Roeser A., Op den Camp H.J.M., Jetten M.S.M. 2008. Environmental detection of octahaem cytochrome c hydroxylamine/hydrazine oxidoreductase genes of aerobic and anaerobic ammonium-oxidizing bacteria. Environmental microbiology. 10:3140–9.
Schmidt I., Bock E. 1997a. Anaerobic ammonia oxidation with nitrogen dioxide by Nitrosomonas eutropha. Archives of microbiology. 167:106–111.
Schmidt I., Bock E. 1997b. Anaerobic ammonia oxidation with nitrogen dioxide by Nitrosomonas eutropha. Archives of microbiology. 167:106–111.
Schmidt I., Bock E. 1998. Anaerobic ammonia oxidation by cell-free extracts of Nitrosomonas eutropha. Antonie van Leeuwenhoek. 73:271–8.
Schmidt K.D., Tümmler B., Römling U. 1996. Comparative genome mapping of Pseudomonas aeruginosa PAO with P. aeruginosa C, which belongs to a major clone in cystic fibrosis patients and aquatic habitats. J. Bacteriol. 178:85–93.
Schott J., Griffin B.M., Schink B. 2010. Anaerobic phototrophic nitrite oxidation by Thiocapsa sp. strain KS1 and Rhodopseudomonas sp. strain LQ17. Microbiology. 156:2428–37.
Schramm A., De Beer D., Van den Heuvel J.C., Ottengraf S., Amann R. 1999. Microscale distribution of populations and activities of Nitrosospira and Nitrospira spp. along a macroscale gradient in a nitrifying bioreactor: quantification by in situ hybridization and the use of microsensors. Applied and environmental microbiology. 65:3690–6.

References
237
Schramm A., Larsen L.H., Revsbech N.P., Ramsing N.B., Amann R., Schleifer K.H. 1996. Structure and function of a nitrifying biofilm as determined by in situ hybridization and the use of microelectrodes. Applied and environmental microbiology. 62:4641–7.
Schreiber F., Loeffler B., Polerecky L., Kuypers M.M.M., Beer D. De 2009. Mechanisms of transient nitric oxide and nitrous oxide production in a complex biofilm. The ISME Journal. 3:1301–1313.
Schubert C.J. et al. 2006. Anaerobic ammonium oxidation in a tropical freshwater system (Lake Tanganyika). Environ. Microbiol. 8:1857–1863 .
Von Schulthess R., Wild D., Gujer W. 1994. Nitric and nitrous oxides from denitrifying activated sludge at low oxygen concentration. Water Science and Technology. 30:123–132.
Schwarz R., Dayhoff M. 1979. Matrices for detecting distant relationships. In Dayhoff M., editor, Atlas of protein sequences, National Biomedical Research Foundation. 353–58.
Seyfried C.F., Hippen A., Helmer C., Kunst S., Rosenwinkel K.H. 1998. One-stage deammonification : nitrogen elimination at low costs. Water Science and Technology. 1:71–80.
Sher Y., Schneider K., Schwermer C.U., Van Rijn J. 2008. Sulfide-induced nitrate reduction in the sludge of an anaerobic digester of a zero-discharge recirculating mariculture system. Water research. 42:4386–92.
Shimamura M., Nishiyama T., Shigetomo H., Toyomoto T., Kawahara Y., Furukawa K., Fujii1 T. 2007. Isolation of a multiheme protein with features of a hydrazine-oxidizing enzyme from an anaerobic ammonium-oxidizing enrichment culture. Appl. Environ. Microbiol. 73:1065–1072.
Siegrist H., Gujer W. 1987. Demonstration of mass-transfer and pH effects in a nitrifying biofilm. Water Research. 21:1481–1487. Siegrist H., Reithaar S., Lais P. 1998. Nitrogen loss in a nitrifying rotating contactor treating ammonium rich leachate without
organic carbon. Water Science and Technology. 37:589–591. Silva C.D., Cuervo-Lòpez F.M., Gómez J., Texier A.C. 2011. Nitrite effect on ammonium and nitrite oxidizing processes in a
nitrifying sludge. World. 27:1241–1245. Sims A., Horton J., Gajaraj S., McIntosh S., Miles R.J., Mueller R., Reed R., Hu Z. 2012. Temporal and spatial distributions of
ammonia-oxidizing archaea and bacteria and their ratio as an indicator of oligotrophic conditions in natural wetlands. Water research. 46:4121–9.
Sin G., Insel G., Lee D.S., Vanrolleghem P.A. 2004. Optimal but robust N and P removal in SBRs: a model-based systematic study of operation scenarios. Water science and technology: a journal of the International Association on Water Pollution Research. 50:97–105.
Sin G., Kaelin D., Kampschreur M.J., Takács I., Wett B., Gernaey K. V, Rieger L., Siegrist H., Van Loosdrecht M.C.M. 2008. Modelling nitrite in wastewater treatment systems: a discussion of different modelling concepts. Water science and technology: a journal of the International Association on Water Pollution Research. 58:1155–71.
Sin G., Vanrolleghem P. a. 2006. Evolution of an ASM2d-like model structure due to operational changes of an SBR process. Water Science and Technology. 53:237.
Sinigalliano C.D., Kuhn D.N., Jones R.D. 1995. Amplification of the amoA Gene from Diverse Species of Ammonium-Oxidizing Bacteria and from an Indigenous Bacterial Population from Seawater. Applied and environmental microbiology. 61:4140.
Sliekers A.O., Derwort N., Campos Gomez J.L., Strous M., Kuenen J.G., Jetten M.S.M. 2002. Completely autotrophic nitrogen removal over nitrite in one single reactor. Water Research. 36:2475–82.
Sliekers A.O., Third K.A., Abma W.R., Kuenen J.G., Jetten M.S.M. 2003. CANON and Anammox in a gas-lift reactor. FEMS Microbiology Letters. 218:339–344.
Spagni A., Buday J., Ratini P., Bortone G. 2001. Experimental considerations on monitoring ORP, pH, conductivity and dissolved oxygen in nitrogen and phosphorus biological removal processes. Water science and technology: a journal of the International Association on Water Pollution Research. 43:197–204.
Spagni A., Marsili-Libelli S. 2009. Nitrogen removal via nitrite in a sequencing batch reactor treating sanitary landfill leachate. Bioresource technology. 100:609–14.
Spagni A., Marsili-Libelli S., Lavagnolo M.C. 2008. Optimisation of sanitary landfill leachate treatment in a sequencing batch reactor. Water science and technology: a journal of the International Association on Water Pollution Research. 58:337–43.
Spanjers H., Vanrolleghem P., Olsson G., Dold P.L. 1998. Respirometry in Control of the Activated Sludge Process: Principles. in Scientific and technical report no. 7. IWA Publishing, London.
Sri Shalini S., Joseph K. 2012. Nitrogen management in landfill leachate: Application of SHARON, ANAMMOX and combined SHARON-ANAMMOX process. Waste management (New York, N.Y.). http://dx.doi.org/10.1016/j.wasman.2012.06.006. .
Stanford G., Legg J.O., Dzienia S., Simpson E.C. 1975. Denitrification and associated nitrogen transformations in soils. Soil Science. 120:147–152.
Stanford G., Smith S.L. 1972. Nitrogen mineralization potentials of soils. Soil Sci. Soc. Am. Proc. 36:465–470. Van Der Star W.R.L., Abma W.R., Blommers D., Mulder J.-W., Tokutomi T., Strous M., Picioreanu C., Van Loosdrecht M.C.M.
2007. Startup of reactors for anoxic ammonium oxidation: experiences from the first full-scale anammox reactor in Rotterdam. Water Research. 41:4149–63.
Van Der Star W.R.L., Miclea A.I., Van Dongen U.G.J.M., Muyzer G., Picioreanu C., Van Loosdrecht M.C.M. 2008. The Membrane Bioreactor: A Novel Tool to Grow Anammox Bacteria as Free Cells. Biotechnology and Bioengineering. 101:286–294.
Starkenburg S.R., Larimer F.W., Stein L.Y., Klotz M.G., Chain P.S.G., Sayavedra-Soto L., Poret-Peterson A.T., Gentry M.E., Arp D.J., Ward B., Bottomley P.J. 2008. Complete genome sequence of Nitrobacter hamburgensis X14 and comparative genomic analysis of species within the genus Nitrobacter. Applied and environmental microbiology. 74:2852–63.
Starkenburg S.R., Spieck E., Bottomley P.J. 2011. Metabolism and genomics of nitrite-oxidizing bacteria: emphasis on studies of pure cultures and of nitrobacter species. In: Ward BB, Arp DJ, Klotz MG, (ed.). Nitrification, ASM press, Washington, DC. p. 267–294. ISBN 9781555814816.
Stein L.Y. 2011. Heterotrophic nitrification and nitrifiers denitrification. In: Ward BB, Arp DJ, Klotz MG, (ed.). Nitrification, ASM press, Washington, DC. p. 95–114. ISBN 9781555814816.
Stephen J.R., McCaig A.E., Smith Z., Prosser J.I., Embley T.M. 1996. Molecular Diversity of Soil and Marine 16S rRNA Gene Sequences Related to beta-Subgroup Ammonia-Oxidizing Bacteria. Applied and environmental microbiology. 62:4147–4154.
References
238
Straub K., Benz M., Schink B., Widdel F. 1996. Anaerobic, nitrate-dependent microbial oxidation of ferrous iron. Appl Environ Microbiol. 62:1458–60.
Strohm T.O., Griffin B., Zumft W.G., Schink B. 2007. Growth yields in bacterial denitrification and nitrate ammonification. Applied and environmental microbiology. 73:1420–4.
Strous M., Fuerst J., Kramer E., Logemann S., Muyzer G., Van de Pas K., Webb R., Kuenen J., Jetten M. 1999a. Missing lithotroph identified as new planctomycete. Nature. 400:446– 449.
Strous M., Van Gerven E., Zheng P., Kuenen J.G., Jetten M.S.M. 1997. Ammonium removal from concentrated waste streams with the anaerobic ammonium oxidation (Anammox) process in different reactor configurations. Water Research. 31:1955–1962.
Strous M., Heijnen J.J., Kuenen J.G., Jetten M.S.M. 1998. The sequencing batch reactor as a powerful tool for the study of slowly growing anaerobic ammonium-oxidizing microorganisms. Applied Microbiology and Biotechnology. 50:589–596.
Strous M., Jetten M.S.M. 2004. Anaerobic oxidation of methane and ammonium. Annu. Rev. Microbiol. 58:99–117. Strous M., Kuenen J.G., Jetten M.S.M. 1999b. Key Physiology of Anaerobic Ammonium Oxidation. Applied and environmental
microbiology. 65:3248–3250. Strous M., Pelletier E., Mangenot S., Rattei T., Lehner A., Taylor M.W., Fonknechten N., Horn M., Daims H., Bartol-mavel D.,
Wincker P., Schenowitz-truong C., Me C., Collingro A., Vallenet D., Snel B., Dutilh B.E., Camp H.J.M.O. Den, Van Der Drift C., Cirpus I., Van De Pas-schoonen K.T., Harhangi H.R., Niftrik L. Van, Schmid M., Keltjens J., Van De Vossenberg J., Kartal B., Meier H., Frishman D., Huynen M.A., Mewes H., Weissenbach J., Jetten M.S.M., Wagner M., Le Paslier D. 2006. Deciphering the evolution and metabolism of an anammox bacterium from a community genome. Nature. 440:790–794.
Su J., Liu B., Liu C. 2001. Comparison of aerobic denitrification under high oxygen atmosphere by Thiosphaera pantotropha ATCC35512 and Pseudomonas stutzeri SU2 newly isolated from the activated sludge of piggery wastewater treatment system. J Appl Microbiol. 90:457–62.
Sudarno U., Winter J., Gallert C. 2011. Effect of varying salinity, temperature, ammonia and nitrous acid concentrations on nitrification of saline wastewater in fixed-bed reactors. Bioresource technology. 102:5665–73.
Sun G., Austin D. 2007. Completely autotrophic nitrogen-removal over nitrite in lab-scale constructed wetlands: evidence from a mass balance study. Chemosphere. 68:1120–8.
Suzuki I., Dular U., Kwok S.C. 1974. Ammonia or Ammonium Ion Ammonia or Ammonium Ion as Substrate for Oxidation by Nitrosomonas europaea Cells and Extracts. Journal of Bacteriology. 120:556–558.
Szatkowska B., Cema G., Plaza E., Trela J., Hultman B. 2007a. A one-stage system with partial nitritation and Anammox processes in the moving-bed biofilm reactor. Water Science and Technology. 55:19.
Szatkowska B., Plaza E., Trela J. 2007b. Partial nitritation/anammox and CANON – nitrogen removal systems followed by conductivity measurements. In: Integration and optimisation of urban sanitation systems. Plaza, Levlin, (Editors), TRITA-LWR.REPORT 3018, Report No 13. p. 109–117.
Sørensen J. 1978. Capacity for denitrification and reduction of nitrate to ammonia in a coastal marine sediment. Appl. Environ. Microb. 35:301–30.
Tal Y., Watts J.E.M., Schreier S.B., Sowers K.R., Schreier H.J. 2003. Characterization of the microbial community and nitrogen transformation processes associated with moving bed bioreactors in a closed recirculated mariculture system. Aquaculture. 215:187–202.
Tallec G., Garnier J., Billen G., Gousailles M. 2008. Nitrous oxide emissions from denitrifying activated sludge of urban wastewater treatment plants, under anoxia and low oxygenation. Bioresource technology. 99:2200–9.
Tamura K., Peterson D., Peterson N., Stecher G., Nei M., Kumar S. 2011. MEGA5: Molecular Evolutionary Genetics Analysis using Maximum Likelihood, Evolutionary Distance, and Maximum Parsimony Methods. Molecular Biology and Evolution. doi: 10.10:
Tanaka Y., Fukumori Y., Yakamaka T. 1893. Purification of cytochrome a1c1 from Nitrobacter agilis and characterization of nitrite oxidation system of the bacterium. Archives of microbiology. 135:265–271.
Tang C., Zheng P., Wang C., Mahmood Q. 2010a. Suppression of anaerobic ammonium oxidizers under high organic content in high-rate Anammox UASB reactor. Bioresource Technology. 101:1762–1768.
Tang C.-J., Zheng P., Zhang L., Chen J.-W., Mahmood Q., Chen X.-G., Hu B.-L., Wang C.-H., Yu Y. 2010b. Enrichment features of anammox consortia from methanogenic granules loaded with high organic and methanol contents. Chemosphere. 79:613–9.
Tanwar P., Nandy T., Ukey P., Manekar P. 2008. Correlating on-line monitoring parameters, pH, DO and ORP with nutrient removal in an intermittent cyclic process bioreactor system. Bioresource technology. 99:7630–5.
Taylor S., Ninjoor V., Dowd D.M., Tappel A.L. 1974. Cathepsin B2 measurement by sensitive fluorometric ammonia analysis. Anal. Biochem. 60:153–162.
Templer P.H., Silver W.L., Pett-Ridge J., DeAngelis K.M., Firestone M.K.. 2008. Plant and microbial controls on nitrogen retention and loss in a humid tropical forest. Ecology. 89:3030–3040.
Third K.A., Sliekers A.O., Kuenen J.G., Jetten M.S.M. 2001. The CANON system (Completely Autotrophic Nitrogen-removal Over Nitrite) under ammonium limitation: interaction and competition between three groups of bacteria. Systematic and applied microbiology. 24:588–96.
Throbäck I.N., Enwall K., Jarvis Å., Hallin S. 2004. Reassessing PCR primers targeting nirS, nirK and nosZ genes for community surveys of denitrifying bacteria with DGGE. FEMS Microbiology Ecology. 49:401–417.
Tiedje J.M. 1988. Ecology of denitrification and dissimilatory nitrate reduction to ammonium. in: Biology of Anaerobic Microorganisms. edited by: Zehnder, A. J. B., John Wiley & Sons, New York, USA,. p. 179–244.
Torà J. a, Lafuente J., Baeza J. a, Carrera J. 2010. Combined effect of inorganic carbon limitation and inhibition by free ammonia and free nitrous acid on ammonia oxidizing bacteria. Bioresource technology. 101:6051–8.
Trevors J.T. 1985. The influence of oxygen concentrations on denitrification in soil. Applied Microbiology and Biotechnology. 23:152–155.
Trevors J.T., Starodub M.E. 1987. Effect of oxygen concentration on denitrification in freshwater sediment. Journal of Basic Microbiology . 27:387–391.
Trimmer M., Engstrom P. 2011. Distribution, activity, and ecology of anammox bacteria in acquatic environments. In: Ward BB, Arp DJ, Klotz MG, (ed.). Nitrification, ASM press, Washington, DC. p. 201–235. ISBN 9781555814816.
Turk O., Mavinic D.S. 1989. Maintaining nitrite build-up in a system acclimated to free ammonia. Water Research. 23:1383–1388.

References
239
Vadivelu V.M., Keller J., Yuan Z. 2006. Effect of Free Ammonia and Free Nitrous Acid Concentration on the Anabolic and Catabolic Processes of an Enriched Nitrosomonas Culture. Biotechnology and Bioengineering. 95:830–839.
Vadivelu V.M., Keller J., Yuan Z. 2007. Effect of free ammonia on the respiration and growth processes of an enriched Nitrobacter culture. Water Research. 41:826–34.
Vanparys B., Spieck E., Heylen K., Wittebolle L., Geets J., Boon N., De Vos P. 2007. The phylogeny of the genus Nitrobacter based on comparative rep-PCR, 16S rRNA and nitrite oxidoreductase gene sequence analysis. Systematic and applied microbiology. 30:297–308.
Vedrenne M., Vasquez-Medrano R., Prato-Garcia D., Frontana-Uribe B.A., Ibanez J.G. 2012. Characterization and detoxification of a mature landfill leachate using a combined coagulation–flocculation/photo Fenton treatment. Journal of Hazardous Materials. 205-206:208–215.
Van Veldhuizen H.M., Van Loosdrecht M.C.M., Heijnen J.J. 1999. Modeling Biological Phosphourus and Nitrogen Removal in a Full Scale Activated Sludge Process. Water Res. 33:3459.
Verstraete W., Alexander M. 1972. Heterotrophic Nitrification by Arthrobacter sp. Journal of Bacteriology. 110:955–961. Verstraete W., Vlaeminck S.E. 2011. ZeroWasteWater: short-cycling of wastewater resources for sustainable cities of the future.
International Journal of Sustainable Development &World Ecology. 18:253–264. Viet Yen H. 2009. Optimization of partial nitrification and denitrification processes in landfill leachate treatment using sequencing
batch reactor technique. 254. Vilar a, Eiroa M., Kennes C., Veiga M.C. 2010. The SHARON process in the treatment of landfill leachate. Water science and
technology: a journal of the International Association on Water Pollution Research. 61:47–52. Villaverde S. 2000. Nitrifying biofilm acclimation to free ammonia in submerged biofilters. Start-up influence. Water Research.
34:602–610. Vlaeminck S.E., Cloetens L.F.F., Carballa M., Boon N., Verstraete W. 2009a. Granular biomass capable of partial nitritation and
anammox. Water Science and Technology. 58:1113–1120. Vlaeminck S.E., Terada A., Smets B.F., De Clippeleir H., Schaubroeck T., Bolca S., Demeestere L., Mast J., Boon N., Carballa M.,
Verstraete W. 2010. Aggregate Size and Architecture Determine Microbial Activity Balance for One-Stage Partial Nitritation and Anammox. Applied and environmental microbiology. 76:900–909.
Vlaeminck S.E., Terada A., Smets B.F., Van der Linden D., Boon N., Verstraete W., Carballa M. 2009b. Nitrogen removal from digested black water by one-stage partial nitritation and anammox. Environ. Sci. Technol.,. 43:5035–5041.
Volcke E.I.P., Picioreanu C., De Baets B., Van Loosdrecht M.C.M. 2012. The granule size distribution in an anammox-based granular sludge reactor affects the conversion-implications for modeling. Biotechnology and bioengineering. 109:1629–36.
Van de Vossenberg J., Woebken D., Maalcke W.J., Wessels H.J.C.T., Dutilh B.E., Kartal B., Janssen-Megens E.M., Roeselers G., Yan J., Speth D., Gloerich J., Geerts W., Van der Biezen E., Pluk W., Francoijs K.-J., Russ L., Lam P., Malfatti S. a, Tringe S.G., Haaijer S.C.M., Op den Camp H.J.M., Stunnenberg H.G., Amann R., Kuypers M.M.M., Jetten M.S.M. 2012. The metagenome of the marine anammox bacterium “Candidatus Scalindua profunda” illustrates the versatility of this globally important nitrogen cycle bacterium. Environmental microbiology. doi:10.1111/j.1462-2920.2012.02774.x. .
Vredenbregt L.H.J., Nielsen K., Potma A.A., Kristenses G.H., Sund C. 1997. Fluid bed biological nitrification and denitrification in high salinity wastewater. Water Science & Technology. 36:93–100.
Vázquez-Padín J.R., Fernández I., Figueroa M., Mosquera-Corral A., Campos J.L., Méndez R. 2009a. Applications of Anammox based processes to treat anaerobic digester supernatant at room temperature. Bioresource Technology. 100:2988–2994.
Vázquez-Padín J.R., Figueroa M., Fernández I., Mosquera-Corral A., Campos J.L., Méndez R. 2009b. Post-treatment of effluents from anaerobic digesters by the Anammox process. Water Science and Technology. 60:1135–43.
Vázquez-Padín J.R., Mosquera-Corral A., Campos J.L., Méndez R., Revsbech N.P. 2010. Microbial community distribution and activity dynamics of granular biomass in a CANON reactor. Water Research. 44:4359–70.
Vázquez-Padín J.R., Pozo M.J., Jarpa M., Figueroa M., Franco A. 2009c. Treatment of anaerobic sludge digester effluents by the CANON process in an air pulsing SBR. Journal of Hazardous Materials. 166:336–341.
Wagner J. 2011. Incentivizing sustainable waste management. Ecological Economics. 70:585–594. Wagner M., Rath G., Amann R., Koops H.-P., Schleife K.-H. 1995. In situ Identification of Ammonia-oxidizing Bacteria. Systematic
and Applied Microbiology. 18:251–264. Wagner M., Rath G., Koops H.-P., Flood J., Amann R. 1996. In situ analysis of nitrifying bacteria in sewag treatment plants. Water
Science and Technology. 34:237–244. Waki M., Tokutomi T., Yokoyama H., Tanaka Y. 2007. Nitrogen removal from animal waste treatment water by Anammox
enrichment,. Bioresour. Technol. 98:2775–2780. Wallenstein M.D.., Myrold A.D., Firestone M., Voytek M. 2006. Environmental controls on denitrifying communities and
denitrification rates : insights from molecular methods. Ecological Applications. 16:2143–2152. Walsh D.A., Zaikova E., Howes C.L., Song Y., Wright J., Tringe S.G., Tortell P.D., Hallam S.J. 2009. Metagenome of a Versatile
Chemolithoautotroph from Expanding Oceanic Dead Zones. Science. 326:578–582. Wang C.-C., Lee P.-H., Kumar M., Huang Y.-T., Sung S., Lin J.-G. 2010. Simultaneous partial nitrification, anaerobic ammonium
oxidation and denitrification (SNAD) in a full-scale landfill-leachate treatment plant. Journal of Hazardous Materials. 175:622–8. Wang L., Zheng P., Chen T., Chen J., Xing Y., Ji Q., Zhang M. 2012. Performance of autotrophic nitrogen removal in the granular
sludge bed reactor. Bioresource technology. 123:78–85. Wang S., Wang Y., Feng X., Zhai L., Zhu G. 2011a. Quantitative analyses of ammonia-oxidizing Archaea and bacteria in the
sediments of four nitrogen-rich wetlands in China. Applied microbiology and biotechnology. 90:779–87. Wang T., Zhang H., Gao D., Yang F., Yang S., Jiang T., Zhang G. 2011b. Enrichment of Anammox bacteria in seed sludges from
different wastewater treating processes and start-up of Anammox process. Desalination. 271:193–198. Ward B.B., Devol A.H., Rich J.J., Chang B.X., Bulow S.E., Naik H., Pratihary A., Jayakumar A. 2009. Denitrification as the
dominant nitrogen loss process in the Arabian Sea. Nature. 461:78–81. Wei Y., Ji M., Li R., Qin F. 2012. Organic and nitrogen removal from landfill leachate in aerobic granular sludge sequencing batch
reactors. Waste Management. 32:448–455.

References
240
Welander U., Mattiasson B. 2003. Denitrification at low temperatures using a suspended carrier biofilm process. Water research. 37:2394–8.
Wertz S., Poly F., Le Roux X., Degrange V. 2008. Development and application of a PCR-denaturing gradient gel electrophoresis tool to study the diversity of Nitrobacter-like nxrA sequences in soil. FEMS microbiology ecology. 63:261–71.
Wett B. 2007. Development and implementation of a robust deammonification process. Water Science and Technology. 56:81–8. Wett B. 2009. Method for the treatment of ammonia -containing wastewater. United States Patent Application publication. . No.: US
2009/0272690 Al. p. 1–7. Wett B., Hell M., Nyhuis G., Puempel T., Takacs I., Murthy S. 2010. Syntrophy of aerobic and anaerobic ammonia oxidisers. Water
Science and Technology. 61:1915–22. Wett B., Rauch W. 2003. The role of inorganic carbon limitation in biological nitrogen removal of extremely ammonia concentrated
wastewater. Water Research. 37:1100–10. Wett B., Rostek R., Rauch W., Ingerle K. 1998. pH-controlled reject-water-treatment. Water Science and Technology. 37:165–172. Whittaker M., Bergmann D.J., Arciero D., Hooper A.B. 2000. Electron transfer during the oxidation of ammonia by the
chemolithotrophic bacterium Nitrosomonas europaea. Biochimica et Biophysica Acta. 1459:346–355. Wiesmann U. 1994. Biological nitrogen removal from wastewater. Adv.Biochem.Eng.Biotech. 51:113–154. Willers H.C., Derikx P.J.L., Ten Have P.J.W., K V.T. 1998. Nitrification limitation in animal slurries at high temperature.
Bioresource Technology. 64:47–54. Windey K., Bo I.D., Verstraete W. 2005. Oxygen-limited autotrophic nitrification– denitrification (OLAND) in a rotating biological
contactor treating high-salinity wastewater. Water Res. 39:4512–4520. Winkler M.K.H., Kleerebezem R., Van Loosdrecht M.C.M. 2012a. Integration of anammox into the aerobic granular sludge process
for main stream wastewater treatment at ambient temperatures. Water Research. 46:136–144. Winkler M.K.H., Yang J., Kleerebezem R., Plaza E., Hultman B., Van Loosdrecht M.C.M. 2012b. Nitrate reduction by
organotrophic Anammox bacteria in a nitritation/anammox granular sludge and a moving bed biofilm reactor. Bioresource Technology. 114:217–23.
Winogradsky S.N. 1890. Sur les organismes de la nitrification. Compt Rend Acad Sci. 110:1013–1016. Wiszniowski J., Robert D., Surmacz-Gorska J., Miksch K., Weber J. V. 2006. Landfill leachate treatment methods: A review.
Environmental Chemistry Letters. 4:51–61. Woods D.D. 1938. The reduction of nitrate to ammonia by Clostridium welchii. Biochem. J.,. 32:2000–2012. Wu C., Chen Z., Liu X., Peng Y. 2007. Nitrification–denitrification via nitrite in SBR using real-time control strategy when treating
domestic wastewater. Biochemical Engineering Journal. 36:87–92. Wu M., Ettwig K., Jetten M., M S., Keltjens J., Niftrik L. 2011. A new intra-aerobic metabolism in the nitrite-dependent anaerobic
methane-oxidizing bacterium Candidatus “Methylomirabilis oxyfera”. Biochem Soc Trans. 39:243–248. Wunderlin P., Mohn J., Joss A., Emmenegger L., Siegrist H. 2012. Mechanisms of N2O production in biological wastewater
treatment under nitrifying and denitrifying conditions. Water Research. 46:1027–37. Wyffels S., Van Hulle S.W.H., Boeckx P., Volcke E.I.P., Van Cleemput O., Vanrolleghem P. a, Verstraete W. 2004. Modeling and
simulation of oxygen-limited partial nitritation in a membrane-assisted bioreactor (MBR). Biotechnology and Bioengineering. 86:531–42.
Xiao Y., Zeng G.M., Yang Z.H., Liu Y.S., Ma Y.H., Yang L., Wang R.J., Xu Z.Y. 2009. Coexistence of nitrifiers, denitrifiers and Anammox bacteria in a sequencing batch biofilm reactor as revealed by PCR-DGGE. Journal of applied microbiology. 106:496–505.
Xie W.-M., Ni B.-J., Li W.-W., Sheng G.-P., Yu H.-Q., Song J. 2012. Formation and quantification of soluble microbial products and N2O production by ammonia-oxidizing bacteria (AOB)-enriched activated sludge. Chemical Engineering Science. 71:67–74.
Xu G., Xu X., Yang F., Liu S. 2011. Selective inhibition of nitrite oxidation by chlorate dosing in aerobic granules. Journal of hazardous materials. 185:249–54.
Xu M., Fang W., Zhang L., Liang Y., Sun G. 2007a. Application of new biological nitrogen removal technologies in full-scale treatment of landfill leachate. Huan Jing Ke Xue. 28:607–12.
Xu Z., Yang Z., Zeng G., Xiao Y., Deng Y. 2007b. Mechanism studies on nitrogen removal when treating ammonium-rich leachate by sequencing batch biofilm reactor. Frontiers of Environmental Science & Engineering in China. 1:43–48.
Xu Z.-Y., Zeng G.-M., Yang Z.-H., Xiao Y., Cao M., Sun H.-S., Ji L.-L., Chen Y. 2010. Biological treatment of landfill leachate with the integration of partial nitrification, anaerobic ammonium oxidation and heterotrophic denitrification. Bioresource Technology. 101:79–86.
Yan J., Haaijer S.C.M., Op den Camp H.J.M., Van Niftrik L., Stahl D. a, Könneke M., Rush D., Sinninghe Damsté J.S., Hu Y.Y., Jetten M.S.M. 2012. Mimicking the oxygen minimum zones: stimulating interaction of aerobic archaeal and anaerobic bacterial ammonia oxidizers in a laboratory-scale model system. Environmental microbiology. 14:3146–3158.
Yan J., Hu Y.Y. 2009. Partial nitrification to nitrite for treating ammonium-rich organic wastewater by immobilized biomass system. Bioresource Technology. 100:2341–2347.
Yan J., Op den Camp H.J.M., Jetten M.S.M., Hu Y.Y., Haaijer S.C.M. 2010. Induced cooperation between marine nitrifiers and anaerobic ammonium-oxidizing bacteria by incremental exposure to oxygen. Systematic and applied microbiology. 33:407–415.
Yan Y., Yang J., Chen L., Yang F., Dong J., Xue Y., Xu X., Zhu Y., Yao Z., Lin M., Wang Y., Jin Q. 2005. Structural and functional analysis of denitrification genes in Pseudomonas stutzeri A1501. Science in China Series C Life Science. 48:585–592.
Yang J., Zhang L., Hira D., Fukuzaki Y., Furukawa K. 2011. Anammox treatment of high-salinity wastewater at ambient temperature. Bioresource technology. 102:2367–72.
Yang L., Alleman J.E. 1992. Investigation of batchwise nitrite build-up by an enriched nitrification culture. Water Science and Technology. 26:997–1005.
Yang W., Vollertsen J., Hvitved-Jacobsen T. 2003. Nitrite accumulation in the treatment of wastewaters with high ammonia concentration. Water Science & Technology. 48:135–141.
Yang Z., Zhou S., Sun Y. 2009. Start-up of simultaneous removal of ammonium and sulfate in an anaerobic ammonium oxidation (anammox) process in an anaerobic upflow bioreactor. Journal of Hazardous Materials. 169:113–118.

References
241
Ye L., Zhang T. 2011. Ammonia-oxidizing bacteria dominates over ammonia-oxidizing archaea in a saline nitrification reactor under low DO and high nitrogen loading. Biotechnology and bioengineering. 108:2544–52.
Yeung C.-H., Francis C.A., Criddle C.S. 2013. Adaptation of nitrifying microbial biomass to nickel in batch incubations. Applied microbiology and biotechnology. 97:847–57.
Yevdokimov I.V., Blagodatsky S.A. 1993. Nitrogen immobilization and remineralization by microorganisms and nitrogen uptake by plants: Interactions and rate calculations. Geomicrobiology Journal. 11:185–193.
Yin S.X., Chen D., Chen L.M., Edis R. 2002. Dissimilatory nitrate reduction to ammonium and responsible microorganisms in two Chinese and Australian paddy soils. Soil Biol. Biochem. 34:1131–113.
Yoo H., Ahn K.-H., Lee H.-J., Lee K.-H., Kwak Y.-J., Song K.-G. 1999. Nitrogen removal from synthetic wastewater by simultaneous nitrification and denitrification (SND) via nitrite in an intermittently-aerated reactor. Water Research. 33:145–154.
You J., Das A., Dolan E.M., Hu Z. 2009a. Ammonia-oxidizing archaea involved in nitrogen removal. Water research. 43:1801–9. You S.-J., Tsai Y.-P., Huang R.-Y. 2009b. Effect of heavy metals on nitrification performance in different activated sludge process.
Journal of Hazardous Materials. 165:987–994. Young P. 1992. Phylogenetic classification of nitrogen-fixing organisms. In: Stacey G, Burris RH, Evans HJ (eds) Biological
nitrogen fixation. Chapman and Hall Inc, New York,. p. 43–86. Yu R., Kampschreur M.J., Van Loosdrecht M.C.M., Chandran K. 2010. Mechanisms and specific directionality of autotrophic
nitrous oxide and nitric oxide generation during transient anoxia. Environmental Science & Technology. 44:1313–1319. Zafiriadis I., Ntougias S., Nikolaidis C., Kapagiannidis A.G., Aivasidis A. 2011. Denitrifying polyphosphate accumulating organisms
population and nitrite reductase gene diversity shift in a DEPHANOX-type activated sludge system fed with municipal wastewater. Journal of bioscience and bioengineering. 111:185–92.
Zeng R.J., Lemaire R., Yuan Z., Keller J. 2004. A novel wastewater treatment process: simultaneous nitrification, denitrification and phosphorus removal. Water science and technology: a journal of the International Association on Water Pollution Research. 50:163–70.
Zepeda A., Texier A.-C., Razo-Flores E., Gomez J. 2006. Kinetic and metabolic study of benzene, toluene and m-xylene in nitrifying batch cultures. Water research. 40:1643–9.
Zhang H., Zhang D., Zhou J. 2006. Removal of COD from landfill leachate by electro-Fenton method. Journal of hazardous materials. 135:106–11.
Zhang H., Zhou S. 2006. Treating leachate mixture with anaerobic ammonium oxidation technology. J. Cent. South Univ. Technol. 2:663–667.
Zhang L., Yang J., Furukawa K. 2010a. Stable and high-rate nitrogen removal from reject water by partial nitrification and subsequent anammox. Journal of bioscience and bioengineering. 110:441–8.
Zhang T., Jin T., Yan Q., Shao M., Wells G., Criddle C., Fang H.H.P. 2009. Occurrence of ammonia-oxidizing Archaea in activated sludges of a laboratory scale reactor and two wastewater treatment plants. Journal of applied microbiology. 107:970–7.
Zhang Z., Chen S., Wu P., Lin L., Luo H. 2010b. Start-up of the Canon process from activated sludge under salt stress in a sequencing batch biofilm reactor (SBBR). Bioresource Technology. 101:6309–14.
Zhang Z., Li Y., Chen S., Wang S., Bao X. 2012. Simultaneous nitrogen and carbon removal from swine digester liquor by the Canon process and denitrification. Bioresource Technology. 114:84–89.
Zhou J.Z., Bruns M.A., Tiedje J.M. 1996. DNA recovery from soils of diverse composition. Appl. Environ. Microbiol. 62:316–322. Zhou Y., Oehmen A., Lim M., Vadivelu V., Ng, Jern W. 2011. The role of nitrite and free nitrous acid (FNA) in wastewater
treatment plants. Water Research. 45:4672–4682. Zhu G., Wang S., Feng X., Fan G., Jetten M., Yin C. 2011. Anammox bacterial abundance, biodiversity and activity in a constructed
wetland. Environ Sci Technol. 45:9951–8. Ziglio G., Andreottola G., Foladori P., Ragazzi M. 2001. Experimental validation of a single-OUR method for wastewater RBCOD
characterisation. Water science and technology: a journal of the International Association on Water Pollution Research. 43:119–26.
Ziyang L., Youcai Z. 2007. Size-fractionation and characterization of refuse landfill leachate by sequential filtration using membranes with varied porosity. Journal of Hazardous Materials. 147:257–264.
Zuckerkandl E., Pauling L. 1965. Evolutionary divergence and convergence in proteins. In: Bryson, V. and Vogel H.J. (Eds). Evolving Genes and Proteins, Academic Press, New York. p. pp. 97–166.
Zumft W.G. 1997. Cell Biology and Molecular Basis of Denitrification. Microbiology and Molecular Biology Reviews. 61:553–616. Zumft W.G. 2005. Nitric oxide reductases of prokaryotes with emphasis on the respiratory, heme–copper oxidase type. Journal of
Inorganic Biochemistry. 99:194–215.

242

Acknoledgements
243
Acknoledgements – Ringraziamenti

Acknoledgements
244
This thesis would have been impossible without the practical help, the ideas, the enthusiasm, the support from
many mentors, colleagues, friends and family members over the past three years and I am grateful to have the
chance to express my gratitude to them to the extend which is possible through words.
First and foremost, I am deeply grateful to my supervisor for giving me the opportunity to work in his group.
Gianni, thank you for the freedom (with all the mistakes and the good thinks) and guidance throughout my
research work and for leaving your office door always open for any question and doubt I had. From the day I
first met you on the visit day of 2009 till today, you have provided me with continuous encouragement and
support. I am grateful for all the time that you invested in me: endless discussion, presentation, deadlines,
experiments and, last but not least, the Italy – Switzerland “SNAD-sludge” trip. Because of that, thank you!
I would also like to thank my panel members, Francesco Pirozzi and Mike Jetten. It has been a great pleasure
for me to discuss my research progress with you. Thanks for your ideas and advises on my work during all those
years. I gratefully acknowledge Adriano Joss from EAWAG (SWZ) and Mrs Sabine Burger from ERZ
Entsorgung + Recycling Zürich, (SWZ), for providing the SNAD sludge. Thanks Adriano for your helpful
advices on how to take care of all those bacteria.
I wish to thanks the students who worked in the lab over the three years of my research, for their valuable
contribution. Thank you Valentina for your enthusiastic work at running the pilot reactor and batch tests dealing
with a “challenging” nitrogen removal process. Thanks for your effort, even when I was in Netherland. Thanks
Elisa for your great work to set-up the (8L) SNAD pilot reactor and taking care of all the start up period. Thanks
also for your contagious good humor and for your effort at keeping the anammox biomass alive. Robert thanks
for respirometric tests to characterize the leachate… no so easy to characterize, thanks for your well organized
work. I would like to thank Roberta for her help in the lab and the nice and intensive discussion that we had on
all kind of analytical methods. Thanks for the effort that you always make in the lab! Thanks to all the
researchers of the group of sanitary engineering of the UNITN, Marco, Marco, Angela, Elena, Paola, Eleonora,
Jenny, Veronica. A big thanks to Loris and Giuseppe, for their support and their pratical advices, even if they are
no more in the University.
A warm thank to my “PhD colleagues” of XXV cycle, Sara, Lavinia, Laura, Angela, Matilde, Marika,
Sebastian, Daniele, Diego, and Giuseppe. Thank for the support and for having shared with me the hard work
and moments of fun. Thanks you Sara, thanks you Lavinia for your good friendship, and your encouragement
and support. Thanks to the “guys” of the tea room… thank you for this beautiful idea and for the good talks we
had. I still think that a kitchen in the department would be a good idea. Thanks to Oscar, Alessandra, Sara,
Lavinia, Lorenzo, Francesca my lunch friend at 12.00 o’clock and to Elena, Roberta, Chiara, Carlos, Carlo my
lunch friend at 2.00 o’clock.
Thanks to the people that met around during my PhD’s Trip. Thank you Sara P. to host me in Utrecht when
the 2010 eruption of Eyjafjallajökull bloked me in Netherland, after our biological course in Wageningen. Thank
you for the beautiful friendship. Thank you Costel, good flat met for a week. Thank to the italian anammox guys,
among them Davide and Tommaso. Thank you Luigi and Ludo for the warm and the useful discussion on
nitritation process at the university of Naples.
Treating nitrogen cycle and anammox bacteria, I searched for help in Nijmegen, at the department of
Microbiology, Radboud University, where the research on anammox is one of the main projects. Mike thanks for
accepting me in your department..… working on microbial characterization. My gratitude is to all of you that I
met in Nijmegen, for the advice and the support in a so short time (only three months)…and of course for the

Acknoledgements
245
funny time we spent together, drinking and eating. Mike, Huub, Suzanne it was a great privilege to be supervised
during my experience in Nijmegen by experts like you. Suzanne, Jennifer thanks for introducing me in the lab:
three little girls with glasses in the lab!! Huub thanks for your phylogenetic supervision, without you I would be
lost. Mike thanks for the opportunity that you give me to work with you. Thanks for the beautiful time in the lab
and for the goodbye party. Suzanne, I really appreciate all your advises and your great help during the last period
writing the paper. Jennifer, thank for introducing me in the microbial word. There is not enough space to write
down all the support and help from you in understanding the microbial composition of the SNADDE biomass.
Thanks for all the enthusiasm and all the encouragement, for all the patient explanations and the practical
training. I enjoyed the time spent together working, eating chinese and having fun. Good luck for your post-doc
in China. Francisca, Theo thanks for all the help looking for n-damo bacteria in my sludge. Arjan thanks for the
good discussion we had, thanks for “offering” accommodation in Nijmegen when I needed. I really admire your
dedication to the research and your hard work. Thank you Margjie, Wouther, Naomi & Daan, Arjan, Boran,
Khatarina, Zyie, Baoli, Lina, Jan, Laura, Harry, Katinka, Sarah, Ming, Zyie, Ke, Muriel Olivia, Christina.
Thanks for helpful discussion not only on bacteria and microbiology. Boran, Khatarina… “by sure”… thanks for
our “generic” talk, “generic” songs, without Nijmegen would not be the same. Naomi, Cri, Olivia thanks for
organizing so many beautiful and funny things. I enjoyed a lot with you. Muriel thanks for the helpful english
test ;). Ke thank you to take care of me in Nijmegen. We should organize another italian-chinese dinner. Thanks
to all football players, Wouter, Boran, Ahmad, even if I was the third choice.
My acknowledgements are also for the “Centro di calcolo” of Engineering Faculty, the “Servizio Elettronico
di Progettazione” and “Servizio Meccanico” of the Department of Physic, Trento. Thank you Mirko to
introducing me to the Labview word and thank you Luca for following in all my crazy idea to monitor the
SNAD-SBR using Labview. Claudio and Roberto thanks for the help and the opportunity to work with you,
building the hardware for my experiments. Thanks to Sandro, Luca & Luca, Massimo, for the good time and
practical help. Thank you Pierino for helping me to arrange the reactor equipment. Claudio thank for your
infinite patience and your willingness, thanks for the personal support, the spirit of cooperation and above
everything, the friendship.
I would like to thanks all the people of the Laboratory of Province of Trento, among them Francesca,
Stefania, Laura, for the coffe time and your help when I was around in the Province Lab! A special thanks to
you, Maria, for your interest on anammox bacteria, on my project and your great work with PCR. I hope that you
have enjoyed this experience as much as I did. I wish to thank the people of the wastewater treatment plant of
Trento. Thank you Giuliano for your enthusiasm and your kindness and to find a solution for everything. Thanks
to Saverio for sampling a “good digester effluent” and for our discussion at coffe time in the WWTP. Walter,
Marco, Alberto thanks for your help in electric and mechanic problems and for the good time spent in the
WWTP.
Good support and help I received from the secretaries: Laura, Elena, Marina and Claudia. Laura and Elena
special thanks to you for your precious advices and support during the PhD. Thank you Gianfranco for your
printing performance and your availability. Thanks to all the people of the administration, for your infinite
patience when I need to solve some practical problems, purchases, research missions and contracts.
During those years, many people walked beside me and shared with me moments of happiness, sadness,
sorrow and joy. Few words are not enough to express how thankful and devoted I am to them. Making a list of
all the people is barely impossible, and my gratitude is for all who I forget.

Acknoledgements
246
Special thanks to Roberta, Chiara, Silvia, Elisa, Sara, Lavinia, Daniele who actually supported through the
good and bad times, for the friendship, the comprehension, the chatting, the drink and all the fun we had
together. With you, I have always spent a good time in Trento. Thank you Silvia, Roberta and Elisa, my
flatemates, during those years. Thanks for the nice time spent together, the nice trips and dinners. Elisa thank for
the support during the last days of my writing period and to always have a good word for me when I need. The
next PhD will be you!!
A particular mention goes to the friends of the “Coro”, Elena, Roberta, Giacomo, Fernanda, Michele, Anil,
Lorenzo, Sara, Elisa, Irene. Roberta and Elena thanks to introduce me in a beautiful world of Ragoli… where the
“Maestro” lives. Your friendship have been precious and important for me. Thank you all guys of ADI…
Alexander, Viola, Lavinia, Marco, Pamela, Gio & Gio, Fabrizio, Claudio, Giuseppe thank you to share an
important aim: to value the PhDs!!! Thank you for the trust in your treasures! Thanks to my long time friends,
Lucia, Teresa, Daniele, Roberta, Pasquale, Dino, Sara R., Luisa, Nello who are always close to me… even if
there I am far away. I feel lucky to have friends like you.
Grazie Raffaele per il tuo amore, per aver affrontato con me quest’esperienza e soprattutto per la pazienza di
questi ultimi mesi. Grazie per i bei momenti trascorsi insieme, sono sicura che tanti altri ci stanno già
aspettando… e di sicuro con molti chilometri in meno di distanza. Cominciamo con una vacanza?
Infine, una dedica speciale alla mia famiglia, per essere stata sempre al mio fianco. Mamma, papà è
soprattutto grazie al vostro sostegno ed amore che oggi sono qui. So che, indipendentemente dalle mie scelte,
posso sempre contare su di voi. Grazie zio Romolo per essere semplicemente così come sei… grazie per le
infinite discussioni di vita quotidiana, dalla mia tesi di dottorato alla politica. Spero che tu abbia votato bene
questa volta. Grazie fratellone, per tutto il supporto, il conforto e l’aiuto che mi hai sempre dato in questi anni.
Ti ammiro tanto!!
Grazie!

Acknoledgements
247

Curriculum vitae
248
Curriculum vitae
NO3-
O2N2
NH2OH
NO2-
NO
N2O
O2
Organic N
NH3/NH4
+
N2H4
O2
CH4
Organic CO2
CO2

Curriculum vitae
249
Michela Langone was born on the 5th of April 1982 in Cava dei Tirreni, Italy. In
2006, she received the master’s degree in Environmental Engineering from the
University of Naples, Italy. During her master, she worked at Italian National Agency
for New Technologies, Energy and Sustainable Economic Development (ENEA).
Here, she studied the Microbial Fuel Cell, a new approach of wastewater treatment
with electric power generation, under the supervision of dr. eng. Andrea Giordano
and dr. Roberto Farina (ENEA) and Prf. Francesco Pirozzi (University of Naples).
She spent the following years in an environmental engineering company, Envis Srl, where she worked as a
consultant engineer. In 2009, Michela Langone started her PhD research at the University of Trento under the
supervision of Prof. dr. eng. Gianni Andreottola, at the department of Environmental Engineering. Her research
focuses mainly on the interactions between nitrifying, denitrifying and anammox communities and the
application of those processes in the nutrient and carbon removal from wastewater streams. She has presented
and discussed the results obtained during her research at various national and international scientific meetings.

Publication & relevant work
250
Publications & relevant work

Publication & relevant work
251
Journal Articles
Langone M., Yan J., Haaijer S. C.M., Op den Camp H. J. M., Jetten, M. S. M., Andreottola G. (2013).
Coexistence of nitrifying, anammox and denitrifying bacteria in a sequencing batch reactor. Submitted.
Langone M., Andreottola G. (2013). Old landfill leachate characterization using respirometric and physical-
chemical methods. Submitted
Langone M., Andreottola G. (2013). Application of the Simultaneous, partial Nitritation, Anammox and
Denitrification (SNAD) process to Municipal Solid Waste landfill leachate. Submitted
Langone M., Andreottola G., Cadonna M. (2013). Simultaneous partial Nitritation, Anammox and
Denitrification (SNAD) process at moderate temperature treating anaerobic digester effluent. Submitted
Langone M., Andreottola G. (2013). Correlating on-line monitoring parameters, conductivity, ORP pH, and
DO with the Simultaneous partial Nitritation, Anammox and Denitrification (SNAD) process in SBRs. Submitted
Book Chapters
Andreottola G., Guglielmi G., M. Langone M., (2013). Membrane Biological Reactors: Modeling studies. In
Hai F.I., Yamamoto K. and Lee C.-H. (Eds). Membrane Biological Reactors: Theory, Modelling, Design,
Management and Applications to Wastewater Reuse. IWA Publishing. Alliance House. 12 Caxton Street. London
SW1H OQS, UK. In Press.
GenBank Submission
Langone M., Yan J., Haaijer S. C.M., Op den Camp H. J. M., Jetten, M. S. M., Andreottola G. (2013). AmoA
SBR clones SNAD_amoA ammonia monooxygenase (amoA) gene, partial cds. Direct submission GenBank
Accession no. KC569470 - KC569477. Submitted 5/02/2013.
Langone M., Yan J., Haaijer S. C.M., Op den Camp H. J. M., Jetten, M. S. M., Andreottola G. (2013).
Uncultured planctomycete clones SNAD_Amx 16S ribosomal RNA gene, partial sequence. Direct submission.
GenBank Accession no. KC569478 - KC569483. Submitted 5/02/2013.
Langone M., Yan J., Haaijer S. C.M., Op den Camp H. J. M., Jetten, M. S. M., Andreottola G. (2013).
Uncultured bacterium clones SNAD_Nirs dissimilatory nitrite reductase (nirS) gene, partial cds. Direct
submission GenBank Accession no. KC569496 - KC569503. Submitted 5/02/2013.
Langone M., Yan J., Haaijer S. C.M., Op den Camp H. J. M., Jetten, M. S. M., Andreottola G. (2013).
Uncultured Nitrobacter clones SNAD_NOB 16S ribosomal RNA gene, partial sequence. Direct submission
GenBank Accession no. KC569485, KC569487, KC569490, KC569486 KC569484. Submitted 5/02/2013.
Langone M., Yan J., Haaijer S. C.M., Op den Camp H. J. M., Jetten, M. S. M., Andreottola G. (2013).
Uncultured bacterium clone SNAD_NOB16S ribosomal RNA gene, partial sequence. Direct submission
GenBank Accession no. KC569489, KC569492, KC569493 KC569491 KC569488, KC569495 KC569494.
Submitted 5/02/2013.
Journal Reviewer
2011: Reviews in Environmental Science and Bio/technology

Publication & relevant work
252
Proceeding
Langone M., Andreottola G. “Application of the SNAD process to Municipal Solid Waste leachates” in IX
International Symposium of Sanitary and Environmental Engineering. Milano: ANDIS, 2012. p. [1-11]- ISBN:
9788890355714. Proceedings of the International IWA Conference on Autotrophic nitrogen removal: from
research to applications: SIDISA2012, Milano, 26-29 giugno 2012.
Andreottola G., Ragazzi M., Foladori P., Villa R., Langone M., Rada E.C.,”The UNITN integrated approch
for OFMSW treatment” in Scientific bulletin - "Politehnica" University of Bucharest. series C, electrical
engineering, v. 2012, vol. 74, n. 1 (2012), p. 19-26.
http://www.scientificbulletin.upb.ro/rev_docs_arhiva/reza29_370412.pdf
Andreottola G., Langone M., Rada E.C., Ragazzi M., “New energy saving concept in the integrated sewage
sludge and organic fraction of solid waste treatment” in XIII International Waste Management and Landfill
Symposium, Padova: CISA-Environmental Sanitary Engineering Centre, 2011, p. [1-18]. - ISBN:
9788862650007. Proceedings of the International symposium on waste management and landfill:
SARDINIA2011, S. Margherita di Pula (Cagliari), 3 - 7 October 2011. - a cura di: Cossu, He, Kjeldsen,
Matsufuji, Reinhart, Stegmann.
Langone M., Andreottola G., 2011. “Innovative biological treatment of wastewater with high nitrogen and
low biodegradable matter concentration” in XIII International Waste Management and Landfill Symposium,
Padova: CISA-Environmental Sanitary Engineering Centre, 2011, p. [1-18]. - ISBN: 9788862650007.
Proceedings of the International symposium on waste management and landfill: SARDINIA2011, S. Margherita
di Pula (Cagliari), 3 - 7 October 2011. - a cura di: Cossu, He, Kjeldsen, Matsufuji, Reinhart, Stegmann.
Invited speaker
Langone M., Andreottola G. May 2011. “Trattamenti innovativi per la rimozione dell’azoto”. Conference
“Soluzioni e tecnologie Ladurner per il territorio”, organized by Durner. 19 May 2011, Torino (IT).
Andreottola G., Langone M., 2011. “Processi Biologici Innovativi per la rimozione dell’azoto dai surnatanti
della digestione anaerobica”. Rapporti G.S.I.S.R. N. 251 – 02/11. Conference “Settimana Ambiente 2011 -
Depurazione delle Acque e Trattamento dei Fanghi Aspetti gestionali e nuove tecnologie”. Milano (IT), 25
February 2011.
Master Thesis Co-Supervisor
Completed
Burli, R. 2013. (Environmental Engineering). Trattamento del percolato di discariche mediante il processo di
Simultanea parziale Nitritazione, Anammox e Denitrificazione. Supervisor: Andreottola G.
Sbrissa, E. 2012. (Environmental Engineering). Rimozione dell’azoto dal surnatante della digestione
anaerobica mediante il processo innovativo SNAD (Simultanea parziale Nitritazione, Anammox e
Denitrificazione). Supervisor: Andreottola G.
Miotto, V. 2011. (Environmental Engineering). Indagine sperimentale sull’applicazione del processo
ANAMMOX per il trattamento di reflui ad alto carico di azoto. Supervisor: Andreottola G.

![Aerobic sludge granulation facilitated by activated carbon ...hub.hku.hk/bitstream/10722/202687/1/Content.pdf · (anammox) or other similar processes [3,4]. Partial nitrification](https://img.dokumen.tips/doc/110x75/5e39f269c9f5a25fcb5be0fc/aerobic-sludge-granulation-facilitated-by-activated-carbon-hubhkuhkbitstream107222026871.jpg)