Embed Size (px)
Citation preview

Brit. J. Ophthal. (1962) 46, 536.
MANOMETIRIC STUDIES OF THE PRESSURE-VOLUMERELATIONSHIP IN LIVING AND ENUCLEATED EYES OF
INDIVIDUAL HUMAN SUBJECTS*tBY
JOHN E. EISENLOHR, M. E. LANGHAM, AND A. E. MAUMENEEFrom the Wilmer Institute, Johns Hopkins University Medical School, Baltimore, Maryland
IN a previous investigation a significant difference was found in the pressureresponse of the living and dead eyes of individual rabbits when a givenvolume of fluid was injected into the eye (Eisenlohr and Langham, 1962).An increase in the intra-ocular pressure of living animals was found to forceblood from the eye and the amount lost per unit pressure increase was foundto reach a maximum as the pressure approached the arterial blood pressure.The observations were made by recording manometrically the response ofthe intra-ocular pressure either to a sudden injection of a predeterminedvolume of fluid given in ascending and descending pressure steps or to acontinuous infusion of saline at a rate greatly exceeding the outflow ofaqueous humour. The latter method gave a continuous function of thepressure response of the eye and had the merit that observations over awide range of pressures could be completed within 10 to 15 seconds. It isthe purpose of this study to apply these techniques to the living and freshlyenucleated eyes of individual subjects to determine whether vascular changeswithin the human eye significantly modify its pressure-volume relationship.
Since this work was begun, Ytteborg (1960a,b) has investigated thisproblem in a somewhat different manner. The results and conclusions to bereported in this paper agree in some but not in all respects with those ofYtteborg, and the reasons for the differences are discussed.
MethodOf the six eyes available for study:, five were enucleated because of choroidal
melanomata and one normal eye was removed in the course of an orbital exentera-tion. The anterior segment of each eye was normal to slit-lamp examination andnone of the eyes was glaucomatous. Except for one eye examined under Xylo-caine retrobulbar anaesthesia, all studies were carried out with the patients asleep.Non-explosive general anaesthetic agents were employed so that unshieldedelectronic recording instruments could be brought into the operating room.
* Received for publication November 24, 1961.t This work was supported in part by Special Fellowship BT-627, National Institutes of Health to J. E. Eisenlohr
and by Research Grant B-2591, National Institutes of Health, Bethesda, Maryland.: We wish to thank Drs. Wm. Newby, C. E. Iliff, and R. Day for kindly making three of the patients reported in this
study available to us.536
copyright. on D
ecember 5, 2021 by guest. P
rotected byhttp://bjo.bm
j.com/
Br J O
phthalmol: first published as 10.1136/bjo.46.9.536 on 1 S
eptember 1962. D
ownloaded from
PRESSURE-VOLUME RELATIONSHIP
After the patient was anaesthetized a 23-gauge needle attached to 50 polyethylenetubing was passed into the anterior chamber at the temporal limbus. Thiscannula was in turn attached to a lucite block fitted with self-contained taps aspreviously described by Langham (1959). To this same block were also attacheda saline reservoir, the pressure transducer, and the infusion apparatus. The useof this block made infusion into the eye and pressure recordings possible throughone needle only. Preliminary studies on rabbits had confirmed the accuracy ofpressures recorded in this manner (Eisenlohr and Langham, 1962). By means ofthe saline reservoir, the intra-ocular pressure could be established at any levelbefore an infusion.The infusion of saline was of two types, rapid and continuous. For the rapid
technique an Agla micrometer syringe fitted with a mechanical "stop" was used,permitting predetermined amounts of normal saline (about 10 PI) to be injectedinto the eye with one rapid twist of the micrometer screw. The accuracy of thesyringe was determined independently and found to be within ±005 per cent. of themanufacturer's stated calibration. The plunger of the syringe was lubricatedwith silicone stopcock grease to prevent leakage. For continuous infusions thedevice previously described by Langham (1959) was fitted with a 5-ml. syringecoated internally with silicone grease. The machine with this syringe was cali-brated and found to deliver at its maximum rate 197 ,ul. min.-'.
Pressure measurements and recording were made by means of a Sanborn267B pressure transducer, 150-1100 AS carrier pre-amplifier, and 154-IOOB directwriting pen-recorder. Before an experiment the entire apparatus was cleaned and,except in two cases, sterilized in either P-propriolactone or ethylene oxide. It wasassembled in the operating room, filled with boiled physiological saline, andexamined for leaks and trapped air bubbles. The recording system was balancedand calibrated to give a deflection of 1 mm. mm. Hg-1 for the continuous and 2mm. mm. Hg-1 for the rapid method of infusion.
Because a small volume of saline was required to raise the pressure in thepolyethylene tubing and the transducer, this volume had to be subtracted from thetotal amount injected to obtain the net volume of saline entering the eye. Thecorrection was found to be linear with respect to pressure and to have an averagevalue of 0l021 ,ul. mm.'Hg-1 (range -005 to '065 ,l. mm. Hg-1) for the rapid, and amean value of 0-023 ,ul. mm. Hg-1 (range *015 to *040 ,ul. mm. Hg-1) for the contin-uous technique. In addition, a correction had to be applied in the case of thecontinuous infusions for the volume of aqueous lost through the usual outflowchannels during the 15 to 20 seconds required for an infusion. This was done byusing the values for ocular rigidity calculated from the rapid injections to analyseindividual pressure decay curves in the living and the enucleated eyes in steps of 10mm. Hg as described by Grant and Trotter (1955). At its maximum the outflowcorrection derived in this fashion was 18 per cent. of the total volume infused, butfor most pressure ranges was considerably less than this. Alternatively, thefacility of outflow was calculated for each eye separately from pre-operativeapplanation and tonographic data as described by Moses and Becker (1958).Assuming this facility of outflow to remain constant with increasing pressure, anoutflow correction was determined which altered the calculated values for ocularrigidity less than 10 per cent.
537
copyright. on D
ecember 5, 2021 by guest. P
rotected byhttp://bjo.bm
j.com/
Br J O
phthalmol: first published as 10.1136/bjo.46.9.536 on 1 S
eptember 1962. D
ownloaded from

538 JOHN E. EISENLOHR, M. E. LANGHAM, AND A. E. MAUMENEE
The resistance to flow offered by the cannula was largely responsible for apressure overshoot which obscured the earliest portion of the rapid infusionrecords (Eisenlohr and Langham, 1962). To obtain a measure of what the intra-ocular pressure would have been if equilibration throughout the eye and infusionsystem had been instantaneous, the slope of the pressure decay curve one secondafter the injection was extrapolated back to zero time. The resistance to flow witha 23-gauge needle also resulted in a constant 2 mm. Hg pressure gradient betweenthe plastic block and the eye during the continuous infusion of 197 PI. min.-' ofsaline. While this gradient could be abolished by the use of larger cannulas, itwas considered desirable to disturb the living eye as little as possible. Thus allinfusions in vivo were made through 23-gauge needles, and a 2 mm. Hg adjust-ment was made in the continuous infusion records.The technique of making individual measurements was the same for both the
living and the enucleated eyes. All taps in the plastic block were opened and theintra-ocular pressure brought to the desired level by means of the saline reservoir.The tap to the reservoir was then closed and either the rapid or the continuousinfusion was started at once. In the case of the rapid injections, the lowestpressure levels were studied first and the intra-ocular pressure was increased step-wise in increments of 10 to a maximum of 55 mm. Hg. Starting at 50 mm. Hg, themeasurements were continued as the initial intra-ocular pressure was lowered insteps of 10 mm. Hg. Thus the entire range from 15 to 55 mm. Hg was covered insteps of 5 mm. Hg. Ordinarily at least three injections were made at each pressurelevel and the values reported represent the arithmetic mean of these determina-tions. In the case of the continuous records, the intra-ocular pressure wasbrought to 15 mm. Hg and a series of three or more continuous saline infusionswas made covering a range of pressure similar to that of the rapid technique.The values reported for ocular rigidity from a given eye are mean values from allthe continuous recordings done on that eye.The measurements on the living eye required about 30 minutes. Immediately
after enucleation, the globe was supported in saline-moistened cotton and all studieswere repeated. The rapid technique was used with all six eyes before and afterenucleation, and the continuous method with three patients. For the first two eyesstudied, the cannula was left in place as the globe was removed. However, theanterior lens capsule of the second eye was inadvertently ruptured by the cannuladuring surgery, so for the remainder of the studies the needle was withdrawn aftercompleting the initial measurements. The enucleated globe was recannulatedthrough the original puncture site with a needle of larger diameter than that origin-ally used in order to prevent leakage.
Results
Tables I and II (opposite) summarize the clinical, tonometric, and tono-graphic measurements made on patients whose eyes were used in this study.The effect on the intra-ocular pressure of an infusion of 197 ,l1. min.-1
saline into the anterior chamber of a human eye before and immediately afterenucleation is shown in Fig. 1 (opposite). The observations could be repro-duced accurately in any given eye and are typical of all the eyes examined.
copyright. on D
ecember 5, 2021 by guest. P
rotected byhttp://bjo.bm
j.com/
Br J O
phthalmol: first published as 10.1136/bjo.46.9.536 on 1 S
eptember 1962. D
ownloaded from

PRESSURE-VOLUME RELATIONSHIP
TABLE ISUMMARY OF CLINICAL FINDINGS IN SIX PATIENTS USED IN THIS STUDY
Case No. Age Sex Pathology(yrs)
1 57 F. Malignant melanoma of the choroid, spindle celltype A and B, measuring 5 x 3 x 2 mm.
2 39 F. Malignant melanoma of the choroid, spindle celltype A and B, measuring 5 x 4 x 2 mm.
3 57 M. Malignant melanoma of the choroid, mixed celltype, measuring 7 x 7 x 5 mm.
4 66 M. Normal eye
5 46 M. Malignant melanoma of the choroid, spindle celltype A and B, measuring 6 x 0 x 0 mm.
6 57 M. Malignant melanoma of the choroid, spindle celltype A.
TABLE IIRESULTS OF PRE-OPERATIVE STUDIES IN FIVE PATIENTS.
The case numbers correspond to those in Table I. The eye studied is indicated in the first column.
Intra-ocular Pressure (mm. Hg) Coefficient of OutflowEye (id. min.-1mm. Hg-1)
Case No. Studied Applanation Schiotz
Right { Left Right Left Right Left
1 Left 14-0 13 0 12-2 11-2 0-29 0 332 Left 13-0 14-0 11-4 12 4 0-27 0-173 Left 15-0 15-0 15-2 10-6 0-46 0-294 Right 16-0 19-0 18-2 17 4 0-26 0 436 Right 17-3 17-3
LIVING EYE ENUCLEATED EYE
0
3
MM, . .... ....
20
TIME (sec.)FIG. 1.-Typical tracing from the same human eye during the continuous infusion of 197,Ld. min.-l saline before and after enucleation. The ocular rigidity was calculated from theserecords by determining in steps of 10 mm. Hg the volume of saline infused. The blood pressure
was 95/60 mm. Hg.
a,
£
cx
ES
%-p
L.=0
06
L.
539
I
copyright. on D
ecember 5, 2021 by guest. P
rotected byhttp://bjo.bm
j.com/
Br J O
phthalmol: first published as 10.1136/bjo.46.9.536 on 1 S
eptember 1962. D
ownloaded from

540 JOHN E. EISENLOHR, M. E. LANGHAM, AND A. E. MAUMENEE
The pressure curves observed on the enucleated eyes were found to increasein slope with an increase in pressure over the whole range ofpressures studied.In contrast, the mean pressure curves on living eyes were found to be of amore complex nature; thus the slope of the curve increased over the range 20to 50 mm. Hg, and then decreased continuously as the intra-ocular pressureapproached more and more closely to the arterial blood pressure (see Fig. 1).A further change in slope was found as the intra-ocular pressure exceededthe blood pressure, at which point the slope began to increase again andbecame indistinguishable from that of the dead eye (see Fig. 2).
LIVING EYEI....'i ....l''l''''''''l....'''RI 00
L. 30z 0 20 40 60
z ~~ENUCLEATED~EYE
<~~~~~~~~~~~~~~~~~01 ,.-... .... ..-... ......
1 .... .... .... ...ta-ocuar pressure of.. .. ....the ivng and freshly enucleated
F __ _ _ _- _ i . .-. . human eye during the infusion of___Z.-.__..............~..._ 104 ,ul.min.-l saline into the.anterior chamber. The blood
6 - +n. .. . .2e .... pressure was 10/6 mm. Hg.
w ,.,, S , ... .... ..
30 g ... .-_ .... ... . .__.__ .
0 e 20es0rn 2
Aayeoftepressurelee a ihrtandtavofum thanesliing teye. erupoeeFruiedeinwahid (1937 analysumaiedthe explerImeta reppsulte)addtisofseeaapeiu
ocularrgidityasfoun ....I...T..wit ... FiGncrease tiancuapressurei both~~~~~~~~~~~~~~~~the living and freshly enucleatedee vrtepesr ag f2 o6
investigators and concluded that the relationship between pressure andvolume changes of the eye approximated to the equation P1=PueKoVwhere P0 and P1 were the initial and final pressures for a change of volume
copyright. on D
ecember 5, 2021 by guest. P
rotected byhttp://bjo.bm
j.com/
Br J O
phthalmol: first published as 10.1136/bjo.46.9.536 on 1 S
eptember 1962. D
ownloaded from

PRESSURE-VOLUME RELATIONSHIP
TABLE III
AVERAGE COEFFICIENT OFOCULAR RIGIDITYOFTHELIVINGANDENUCLEATEDEYE OF THREE PATIENTS FOR A SERIES OF PRESSURE RANGES
Intra-ocular Pressure Range (mm. Hg)Patient No. Eye
23-33 33-43 43-53 53-63
1 Living 0-0137 0-0102 0 0076 0 0064Enucleated 0-0184 0-0129 0-0140 0-0102
2 Living 0-0149 0-0113 0{0079 010064Enucleated 0-0182 0-0140 0-0127 0-0124
3 Living 0-0140 0-0112 0 0075 0 0076Enucleated 0-0119 0-0112 0-0106 0-0101
TABLE IV
CALCULATION OF THE COEFFICIENT OF OCULAR RIGIDITY (K) OF THE LIVINGAND ENUCLEATED HUMAN EYE (PATIENT 2) BY THE CONTINUOUS TECHNIQUE
The volume capacity of the system was 0-014 ,ul. mm. Hg-'.
ResultsEyeF
Pressure Range 230-33 0 330-43 0 430-53 0 530-63-0
Total Volume 10-86 10-53 12-00 12*67Living Outflow Volume 0-18 0-21 0 40 0-77
aV 10-54 10-18 11-46 11-76K 0-0149 0-0113 0-0079 0 0064
Total Volume 8-82 8-42 7-37 6-32Dead Outflow Volume 0-08 0 09 0.11 0-13
azv 8 60 8-19 7-12 6-05K 0-0182 0-0140 0-0127 0-0124
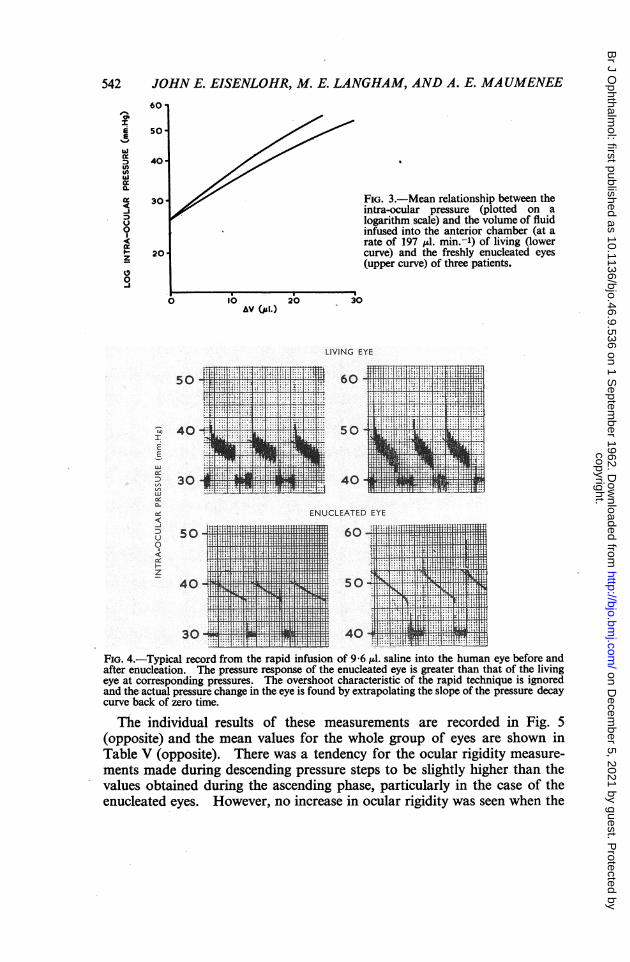
Al V and K was the proportionality constant; thus he found that a graph oflog P1 against J V was approximately linear. A more detailed examinationof his figure for dead human eyes, however, reveals that the distribution ofthe calculated points was not symmetrical about the mean straight line.This is exactly what has been found in the present studies where the contin-uous nature of the observations brings out very clearly the change in slope ofthe curve (see Fig. 3, overleaf). It is this slow bending of the curve thatcauses K the slope to decrease continuously over the pressure range of 20 to70 mm. Hg in the dead and living eyes.The rapid injection of a given volume of saline into the eye produced,
records of which Fig. 4 (overleaf) is a typical example. Again the pressureresponse of the enucleated eye was greater than in the living eye whenequivalent volumes of saline were infused.
541
copyright. on D
ecember 5, 2021 by guest. P
rotected byhttp://bjo.bm
j.com/
Br J O
phthalmol: first published as 10.1136/bjo.46.9.536 on 1 S
eptember 1962. D
ownloaded from
542 JOHN E. EISENLOHR, M. E. LANGHAM, AND A. E. MAUMENEE
60
soz
E 501/
ixD 40uiixa.i 30 FIG. 3.-Mean relationship between the_j intra-ocular pressure (plotted on ao < logarithm scale) and the volume of fluid0 infused into the anterior chamber (at a
rate of 197 uL. min.-') of living (lowerF20 curve) and the freshly enucleated eyes
(upper curve) of three patients.
0 lb 20 30AV (ja!.)
LIVING EYE
i*1s'.|s* *h h* t I6 ....................... .. IC X
* .... -.......
406--05 _
3^_MS;,.XW4O- 50it 1 n7E
U) 30- nr4 40 , !E,L LE
ENUCLEATED EYE
0
- 40
40 so3u4 fi1li.l l z_4 Xt..XX*a -E F1
FIG. 4.-Typical record from the rapid infusion of 9 6 d. saline into the human eye before andafter enucleation. The pressure response of the enucleated eye is greater than that of the livingeye at corresponding pressures. The overshoot characteristic of the rapid technique is ignoredand the actual pressure change in the eye is found by extrapolating the slope of the pressure decaycurve back of zero time.
The individual results of these measurements are recorded in Fig. 5(opposite) and the mean values for the whole group of eyes are shown inTable V (opposite). There was a tendency for the ocular rigidity measure-ments made during descending pressure steps to be slightly higher than thevalues obtained during the ascending phase, particularly in the case of theenucleated eyes. However, no increase in ocular rigidity was seen when the
copyright. on D
ecember 5, 2021 by guest. P
rotected byhttp://bjo.bm
j.com/
Br J O
phthalmol: first published as 10.1136/bjo.46.9.536 on 1 S
eptember 1962. D
ownloaded from

0-02
0.01.
0-02
0*01
002
0-02
0-01
PRESSURE-VOLUME
00
0
0 0 0
* 0
0 G0
0 o0*.
0 00.0 0
*~~*0~~~~~
9 0 G)~~0'0
RELATIONSHIP
0 0
* 000 0 ** 000
0.0
0.00
0 0E0
0 . *
00 00 00°0
0
*0 00
0 00
0 O
10 20 iO i0 SO 6'010 20 30 40 SO 60
INTRA-OCULAR PRESSURE (mm.Hg)
FIG. 5.-Coefficient of ocular rigidity of the living (@-@) and freshly enucleated (0-0) eyesof individual patients studied by the rapid infusion technique.
TABLE V
COEFFICIENT OF SCLERAL RIGIDITY IN THE LIVING AND ENUCLEATED EYESOF THE SIX PATIENTS STUDIED BY THE RAPID INFUSION TECHNIQUE
EyesInitial Pressure (mm. Hg)
Living Enucleated
15.0 0-0136±0 0021 (6) 0-0152±0-0020 (6)20 0 0-0146±0{0013 (6) 0-0164±0'0016 (6)25*0 0'0128 0O0011 (6) 0-0142±0-0015 (6)30 0 0-0117 0±0006 (6) 0.0139 0O0013 (5)35-0 0*0104±0-0008 (6) 0.0128 ±0-0011 (6)40-0 0.0098 ±00007 (5) 0-0125 ±0-0012 (5)45-0 0 0083 +0 0009 (6) 0-0115 0O0011 (6)50.0 0-0077 ± 0009 (5) 0-0113 ±0-0011 (5)55 0 0-0076 ±0-0009 (6) 0-0106±0-0012 (6)
543
0* .
copyright. on D
ecember 5, 2021 by guest. P
rotected byhttp://bjo.bm
j.com/
Br J O
phthalmol: first published as 10.1136/bjo.46.9.536 on 1 S
eptember 1962. D
ownloaded from

544 JOHN E. EISENLOHR, M. E. LANGHAM, AND A. E. MAUMENEE
infusion studies were repeated several times. In three out of the six subjectsthe rigidity at any pressure level was higher in the living eye, whereas in thethree remaining eyes the differences were variable.The results of the rapid and continuous methods are in close agreement;
thus ocular rigidity decreased with increasing pressure and at differentrates for the living and enucleated eye. Statistically, the difference betweenthe living and dead eyes from this small group was found to be significantat the 5 per cent. level at 45 mm. Hg and highly significant at pressures above45 mm. Hg.
DiscussionIt should be pointed out that none of the patients experienced any operative
or post-operative complications. There was some discussion initiallywhether the elevation of the intra-ocular pressure to levels approaching 70mm. Hg would in any way increase the risk ofmetastatic spread ofthe tumour.In this regard it is interesting to note that, in the.first eye studied, the intra-ocular pressure, monitored throughout the surgical procedure of enucleation,reached 200 mm. Hg as the surgeon clamped the optic nerve. It seems un-likely that the comparatively modest pressure rise associated with theexperimental procedure would increase the risk of tumour spread any morethan the enucleation itself.The results on enucleated eyes are in general agreement with recent studies
in which the pressure-volume relationship of enucleated human eyes hasbeen measured by a direct manometric technique. McBain (1958) observeda progressive decrease in the coefficient of ocular rigidity as the pressureincreased from 5 to 94 mm. Hg, and proposed an alternative expression torelate pressure and volume changes of the eye,
p035 DO-35
namely that E VP2-PAlVApplication of this expression to the present results is shown in Fig. 6, and itwill be seen that, while there is good agreement with McBain for freshlyenucleated eyes, the pressure-volume relationship of the living eye could notbe described in this manner.
0-04-
0-03
FIG. 6.-Pressure-volume rela-tionship of living (@-0) and
0-02 __________________________ enucleated human eyes (0-0)l0 20 30 io so 60 calculated according to the for-INTRA-OCULAR PRESSURE (DnnHg) mula proposed by McBain (1958).
copyright. on D
ecember 5, 2021 by guest. P
rotected byhttp://bjo.bm
j.com/
Br J O
phthalmol: first published as 10.1136/bjo.46.9.536 on 1 S
eptember 1962. D
ownloaded from

PRESSURE-VOLUME RELATIONSHIP
In similar studies on enucleated human eyes, Prijot (1958) noted a decreasein the coefficient of ocular rigidity of approximately 30 per cent. when theintra-ocular pressure was increased from 15 to 55 mm. Hg. Gloster andPerkins (1959) also found the coefficient of ocular rigidity of human eyes todecrease with pressure, and the studies of Macri, Wanko, and Grimes (1958)indicated a similar response although this was less consistent in individualeyes. On the other hand, Grant and Trotter (1955), in manometric deter-minations of the ocular rigidity of enucleated eyes, reported no change inthe value of the coefficient in individual eyes when the pressure was changedfrom 10 to 45 mm. Hg. Unfortunately, they do not state how many eyeswere examined in this way and it is therefore not possible to concludewhether their results differ significantly from the present ones. Thus, whilein this study K was found to decrease with pressure in all eyes, the changewas only 22 per cent. over the pressure range of 20 to 40 mm. Hg.The results of the manometric studies on living eyes show that the coefficient
of ocular rigidity for an individual eye varies with pressure and at physio-logic pressures has a value lower than the generally accepted value of 0-0215.Similar conclusions were reported by Ytteborg (1960b) on the basis of mano-metric and tonometric determinations of ocular rigidity in twelve subjects.He found the coefficient of ocular rigidity to decrease from a mean value of0-013 at 15 mm. Hg to 0 0082 at 60 mm. Hg. On the other hand, Prijot andWeekers (1959) made manometric determinations of ocular rigidity in twoeyes that were to be removed because of tumour and concluded that thevalues were independent of pressure. However, examination of their results(Fig. 4 of their paper) shows that the values in one eye are completely con-sistent with the results and conclusions reported in this study. In the secondeye examined by these investigators, the ocular rigidity varied greatly atdifferent pressures and the effect of pressure is not discernible. It is ofinterest that they also found the coefficient of ocular rigidity to be significantlybelow 0-0215 in these eyes.The same problem has been tackled by alternative techniques by several
investigators. Moses and Tarkkanen (1959) recorded the pressure change innormal and pathological eyes for different areas of applanation usingapplana-tion tonometry, and concluded that the semilogarithmic plot of pressure andthe volume of corneal indentation was approximately linear and appeared toconfirm Friedenwald's formulation. However, in at least five of the eyesexamined (see Fig. 2 of their paper), the results lay along a convex curvea fact which is consistent with the conclusions of this study that ocularrigidity decreases as intra-ocular pressure increases. In other tonometricstudies, Draeger (1959) calculated the coefficient of ocular rigidity in 72 eyesfrom applanation and Schi6tz tonometry and concluded that there was novariation with pressure; whereas, in a similar study on 560 patients, Goodside(1959) concluded that the coefficient of ocular rigidity decreased as the pres-sure of the eye rose.36
545
copyright. on D
ecember 5, 2021 by guest. P
rotected byhttp://bjo.bm
j.com/
Br J O
phthalmol: first published as 10.1136/bjo.46.9.536 on 1 S
eptember 1962. D
ownloaded from

546 JOHN E. EISENLOHR, M. E. LANGHAM, AND A. E. MAUMENEE
The difference in the reaction of the living and enucleated eyes of individualsubjects to an injection of fluid is consistent with the hypothesis that a changein pressure causes a change in blood volume in the living eye. This explana-tion is supported by the observation that the discrepancy between the livingand dead eye increased as the intra-ocular pressure approached the generalblood pressure but then disappeared when the general blood pressure wasexceeded. This finding is analogous to the results of similar experimentsperformed on rabbits (Eisenlohr and Langham, 1962) where a significantdifference between the ocular rigidity of the living and dead eye was found ineach of the animals studied. Furthermore, this difference could be abolishedat any pressure level by reducing the blood pressure to a level below that ofthe intra-ocular pressure. In the same study, the inequality between thevolume of fluid entering the eye and the volume change of the eye was mostgraphically demonstrative when the intra-ocular pressure and the meanblood pressure were nearly the same. At this point, the infusion of 197,ul. min.-l into the anterior chamber of the living rabbit eyes caused littleif any pressure change and consequently blood must have left the eye almostas fast as the fluid entered.On the assumption that the difference in ocular rigidity of the living and
dead eye is due to vascular changes it is possible to calculate its magnitudefrom the difference in the value of the coefficient of ocular rigidity of the livingand dead eye at any given pressure; the results of this calculation (shown inTable VI) indicate that the volume change is small for pressures below 50mm. Hg and, in this pressure range, is only a very small fraction of the totalocular blood volume of 200 to 300 ,tl. (Ridley, 1930). On the other hand,these calculations may be criticised on the basis that the perfusions of thedead eyes were not made with the eyes in situ. This aspect has been studiedin rabbit eyes by comparing the results of perfusion experiments on deadeyes before and after enucleation and it was found that ocular rigidity was
TABLE VICHANGE IN BLOOD VOLUME OF INDIVIDUAL EYES FOR VARIATIONS IN THE
INTRA-OCULAR PRESSUREThe results have been calculated from the volumes needed to increase the intra-ocular pressure
by 10 mm. Hg in living and enucleated eyes.
Intra-ocular Pressure Range (mm. Hg)Patient No.
25-35 35-45 45-55 J 55-65
1 3-29 3-51 4-91 3-262 1-95 2-71 5 87 8-103 1-24 2-73 5-31 5-254 1-04 1-59 0-55 0-675 1-57 0-79 0.0 1-636 2-92 2-78 1-63 0 49
copyright. on D
ecember 5, 2021 by guest. P
rotected byhttp://bjo.bm
j.com/
Br J O
phthalmol: first published as 10.1136/bjo.46.9.536 on 1 S
eptember 1962. D
ownloaded from

PRESSURE-VOLUME RELATIONSHIP
somewhat higher in the enucleated eye (unpublished experiments). Con-sequently, if this is also true for human eyes, the vascular changes are evensmaller than the above calculations indicate.These conclusions do not agree either in kind or in magnitude with those
recently reported by Ytteborg (1960a), who noted in manometric studies onhuman eyes that, when a tonometer was taken off the living eye, the intra-ocular pressure fell rapidly below its equilibrium level and then bouncedback to normal, but that this response was not found in enucleated eyes.He suggested that the rebound phenomenon was due to blood refilling the eyeand calculated the volumetric effect from the extent of the pressure changeassociated with the rebound. The calculated volumes were found to decreasewith increase in pressure and to be much greater in magnitude than thosereported in this paper. The validity of his interpretation must be seriouslyquestioned, for the manometric recording system used by Ytteborg was filledwith saline and it is known that sudden volumetric displacements will them-selves cause a pressure overshoot unless damped by use of viscous fluid in therecording system (see Eisenlohr and Langham, 1962).The practical significance of the present findings to the measurement of the
outflow facility by tonography may be assessed from a consideration of atonogram of one ofthe patients used in this study. In the eye the total volumeincrement of aqueous humour leaving the eye when the intra-ocular pressuredecreases from a pressure Pt, at time t1 to a pressure Pt2 at time t2 duringtonography is given by the sum of three terms, namely,
V= (Klog Pt) +(VC2 - VC1) + (VB2 -BB1)-
The first term is Friedenwald's pressure-volume relationship of the deadeye, the second term represents the- change in the volume of corneal indenta-tion due to application of the tonometer, and the third term represents thechange in blood volume of the eye. From an analysis of the tonogram re-corded on the first patient the change in volume of the aqueous humour wasgiven by (4.2 + 9 0 + 2 0) pl , where the three values correspond in order tothe terms in the above expression. It is evident from this calculation thatA Vis determined principally by the change in the volume of corneal indenta-tion, whereas the vascular change accounts for only 13 per cent. of the total.Correction of the first term for the observed alteration of K with pressurealtered A Vless than 5 per cent. Withd Vknown, the outflowfacility is expres-sed as the rate of loss of this volume per unit of increased pressure gradient.Using the conventional method for the analysis of tonograms, the outflowfacility of this eye was 0-29 jul. min.1 mm. Hg-1; this increased to a valueof 0-40 ,ul. min.-' mm. Hg-1 when Friedenwald's K of 0-0215 was replacedby the value of 0-0104 which had been determined experimentally on thiseye and increased to a value of 0-44 pl. min.-' mm. Hg' when correctionwas made for the change in blood volume during tonography. Thus the
547
copyright. on D
ecember 5, 2021 by guest. P
rotected byhttp://bjo.bm
j.com/
Br J O
phthalmol: first published as 10.1136/bjo.46.9.536 on 1 S
eptember 1962. D
ownloaded from

548 JOHN E. EISENLOHR, M. E. LANGHAM, AND A. E. MAUMENEE
total correction was 52 per cent. and this was typical of the results on thegroup of patients. Recognition of these sources of error in tonography isof importance both for the evaluation of the accuracy of this techniqueand for improving the means of differentiating between normal and glauco-matous eyes.
Summary(1) The relationship between pressure and volume changes in six human
eyes has been studied both before and immediately after enucleation. Theobservations were made by recording manometrically the intra-ocular pres-sure either to a sudden injection of a predetermined volume of saline or to acontinuous infusion of saline.
(2) A continuous infusion of 197 [lI. min.-1 of saline was found to give adifferent pressure response in the living and dead eye. In the dead eye theslope of the curve increased continuously, whereas in the living eye the slopeincreased to approximately 60 mm. Hg and then reversed until the intra-ocular pressure exceeded the mean blood pressure, at which level the slopebegan to increase again. Reasons are given for associating these changeswith loss of blood from the eye.
(3) Calculations of the coefficient of ocular rigidity for 5 mm. Hg pressuresteps over the pressure range of 20 to 65 mm. Hg were made from the resultsof the two techniques and the values were essentially the same. Further-more, they confirmed the conclusions of recent investigators that thecoefficient decreases in value with an increased pressure in the eye.
(4) In individual eyes the coefficient of ocular rigidity was significantlygreater in the enucleated than in the living eye at corresponding pressures inthree out of the six eyes studied. In the remaining three eyes the differencewas either small or insignificant.
(5) The significance of these results is discussed in relation to recentinvestigations and to tonographic analysis.
REFERENCESDRAEGER, J. (1959). Docum. ophthal. (Den Haag), 13, 431.EISENLOHR, J., and LANGHAM, M. E. (1962). Invest. Ophthal., 1, 63.FRIEDENWALD, J. S. (1937). Amer. J. Ophthal., 20, 985.GLOSTER, J., and PERKINS, E. S. (1959). Brit. J. Ophthal., 43, 97.GOODSIDE, V. (1959). A.M.A. Arch. Ophthal., 62, 839.GRANT, W. M., and TROTTER, R. R. (1955). Ibid., 53, 191.LANGHAM, M. E. (1959). Brit. J. Ophthal., 43, 705.MACRI, F. J., WANKO, T., and GRimEs, P. A. (1958). A.M.A. Arch. Ophthal., 60, 1021.McBmN, E. H. (1958). Ibid., 60, 1080.MosEs, R. A., and BECKER, B. (1958). Amer. J. Ophthal., 45, 196.
and TARKKANEN, A. (1959). Ibid., 47, No. 1, Pt 2, p. 557.PRIJOT, E. (1958). Acta ophthal. (Kbh.), 36, 865.
- and WEEKERS, R. (1959). Ophthalmologica (Basel), 138, 1.RIDLEY, F. (1930). Brit. J. exp. Path., 11, 217.YTTEBORG, J. (1960a). Acta ophthal. (Kbh.), 38, 410.
(1960b). Ibid., 38, 548.
copyright. on D
ecember 5, 2021 by guest. P
rotected byhttp://bjo.bm
j.com/
Br J O
phthalmol: first published as 10.1136/bjo.46.9.536 on 1 S
eptember 1962. D
ownloaded from