Embed Size (px)
Citation preview
Focused On Core Values
ANNUAL REPORT
2016Manitowoc Public Utilities
TABLE OF CONTENTSLETTER FROM MANAGEMENT 1
KEY ACCOMPLISHMENTS IN 2016 2
RELIABILITY STATISTICS 3
GREEN INITIATIVES 3
CORE VALUES 4
PLANS FOR 2017 6
2016 FINANCIAL HIGHLIGHTS 7
2016 FINANCIAL STATEMENTS 9
INDEPENDENT AUDITORS’ REPORT 30
2016 COMMISSIONERS 33
OUR MISSION: MPU is dedicated to providing
customer focused utility services.
OUR VISION: To be a community owned regional
utility that exceeds customer expectations.
ANNUAL REPORT
2016

Focus on Core Values
Encouraging and receiving ideas is easy; strategy is hard and even harder is to be focused on what’s truly
important. However, ideas provide the needed motivation and being focused will deliver the necessary
results and success. At Manitowoc Public Utilities the basis of all we do is guided by three insightful core
values for the long term sustained success of our customers and the organization.
The three core values that set and align the directional path for the MPU Commission and employees are:
• Delivery of reliable utility services through competitive rates
• Fair and ethical treatment of customers, employees and partners
• Promote environmental awareness and safe drinking water
For decades MPU’s focus was on taking care of wires and the generating plant to ensure reliability and
cost effective rates. In recent history the electric industry has been changing with the advent of new
technologies: distributed generation with solar, battery storage, two way communication between utility
and customers through automated meter infrastructure; and, in some parts of the nation, third parties
interacting with customers on metering and distributed generation. All of these changes are not expected
to happen in the near term. The core values allows us to be truly focused on issues that are relevant to our
customers and will allow MPU to remain flexible and nimble as we face these challenges in the coming years.
2016 was dedicated to focusing on our core values and the following are some of the key
accomplishments:
• Honoring the best at MPU: For the first time in the history of MPU we honored three employees
who were nominated by their peers. These three employees demonstrated our culture of
thoughtfulness, reliability and customer focused service. Congratulations to Phil Platteter, Gina
Sampe and Daryl Kliment.
• The commitment to community led the MPU Commission to approve a donation policy for
community events that will have a positive impact to a large portion of our Citizens.
• A 3.5% electric rate decrease was implemented effective October 1, 2016 – our third consecutive rate decrease.
• To encourage economic development in the City – two customer loan programs were approved: 1) an economic development loan
program that provides low interest loans up to $1.0 million a year for either expansion of existing facilities or new facilities and
2) a Shared Savings loan program which provides up to $500,000 a year for Focus on Energy approved energy efficiency projects.
• The MPU website was completely revamped to be more customer focused and user friendly.
Your support is appreciated as we continue to charter the unknown challenges of changes in our industry in ways that exceed your
expectations, support community development and improve quality of life for the Citizens of Manitowoc. We will accomplish this working
together to deliver reliable and cost effective utility services. Through collaboration with our rate payers, employees and governing bodies,
we will shape our future for a better tomorrow.
We look forward to serving you in 2017 and beyond.
LETTER FROM MANAGEMENT
“ Sharpen your view point on what’s truly important and keep everything else a blur.”
– Rachel Snyder
Nilaksh Kothari
General Manager
David P. Luckow
Commission President
2 MANITOWOC PUBLIC UTILITIES
In 2016, MPU began implementation of a new three-year
strategic plan calling for many projects, updates and upgrades
across the electric, water and broadband utilities through the
six organizational departments: Business Services, Electric
Distribution Operations, Power Production, Water, Engineering
and Power Supply. Following are some of our key accomplishments:
Business Services The MPU website at www.mpu.org was redesigned to become
more user-friendly and provide additional information about
MPU services. The new website offers customers many self-
service features and online forms, money saving offers from both
MPU and Focus on Energy for energy efficient household items
and mobile device accessibility.
In the lobby of the MPU main office, a kiosk was added to allow
customers to pay bills with debit and credit cards for convenience.
In addition, a Key Accounts Program was created to enhance
and develop relationships with MPU’s key customers. Finally,
a company-wide effort was kicked off to improve internal
processes and eliminate waste utilizing the tools and techniques
of Lean Six Sigma.
Electric Distribution OperationsThe Electric Distribution Supervisory Control and Data
Acquisition (SCADA) hardware and software was completely
replaced with a new Open Systems International (OSI) software
operating system and Schweitzer Engineering Laboratories (SEL)
communications hardware and processors. Replacement was
necessary as the system was over 30 years old and availability
of parts was an issue.
Also in 2016, 17,200 feet of fiber optic cable to connect six
additional facilities to the MPU network were installed. In
addition, 2,700 feet of underground primary and 2,000 feet
of overhead primary line were replaced to improve reliability.
Power ProductionThe design, installation and commissioning of Dry Sorbent
Injection systems for hydrogen chloride (HCl) removal
and pollutant control was completed to meet regulatory
requirements. The installation, testing and commissioning
of a coal yard runoff filtration system was also completed to
meet regulatory requirements. A security plan for receiving
vessels at the North Dock was developed with Coast Guard
approval of the plan. Finally, a study was conducted for
replacement of the 70 year old 4kV switchgear to improve
reliability and address safety concerns.
Water SystemsThe replacement of 1,750 feet of water main infrastructure on
Michigan Avenue and Hillcrest Drive was completed to improve
reliability by decreasing the water delivery interruptions from
reoccurring water main breaks. A new water main was also
installed on STH 42 to provide water to a new assisted-living
facility.
The Wisconsin Department of Natural Resources (WDNR)
conducted a Sanitary Survey to evaluate the source, facilities,
equipment, operation, maintenance and management as they
relate to providing safe drinking water. The sanitary survey is
also an opportunity to identify potential risks that may adversely
affect drinking water quality. No deficiencies were discovered in
this review.
EngineeringA utility-wide asset management program with Kayuga Solutions
was initiated to assess existing infrastructure and provide
ongoing recommendations to optimize the life cycle cost of the
infrastructure and develop a long term replacement plan. This
program started with the water systems and will expand to
incorporate all MPU assets, with completion in 2018.
The conversion of the Electric Distribution maps from drawing
files (paper maps) into GIS (Geographic Information System)
files was completed. The GIS files are in the same format as MPU
Water Distribution files and City of Manitowoc files and allows all
utilities to be viewed on a similar GIS format. The GIS model will
be used as a basis for electric system modeling software to model
proposed additional loads, future growth scenarios or identify
system deficiencies.
Power Supply and ITA New Load Market Pricing (NLMP) tariff to promote economic
development in the City of Manitowoc was developed and
approved. The NLMP tariff will provide potential new customers
or existing customers that expand operations an incentive
through market-based electrical rates. The market-based pricing
mechanism is applicable to incremental load growth above
500kW per month.
The City and MPU’s telephone technology was replaced with a
new IP-based phone system. The reliability of the IT systems were
improved by upgrading the existing corporate network storage
system with the addition of SSD memory and completing the
setup of the Operations Data Center along with the segregation
of all network traffic.
KEY ACCOMPLISHMENTS IN 2016

3FOCUSED ON CORE VALUES
RELIABILITY STATISTICSMPU’s System Average Interruption Duration Index (SAIDI) – the
average number of minutes a customer can expect to be without
power in a given year due to outages – was 33 minutes in 2016 as
compared to a rolling 5 year average of 27 minutes.
Our Customer Average Interruption Duration Index (CAIDI) – the
average outage restoration time – was 66 minutes as compared to
a rolling 5 year average of 80 minutes.
MPU’s System Average Interruption Frequency Index (SAIFI) – the
average outage frequency – was 0.51 as compared to a rolling 5
year average of 0.33.
GREEN INITIATIVES• Implemented the Residential Customer LED Light Bulb
Rebate Program for MPU residential customers to
encourage the installation of cost-effective, energy
efficient and renewable lighting in their homes. The program
ran from June 1 – December 31, 2016 and provided a
rebate of up to $20 per customer household/account
(on their utility bill) for the purchase of LED light bulbs.
• The LED Holiday Lighting Instant Rebate Program provided
customers with two (2) strings of LED holiday lights at no
charge when they signed up for electronic billing and/or direct
bill payment. Participating customers benefit from lower
energy bills due to lower energy consumption and reduced
utility overhead costs for billing and payment processing.
• In October, MPU partnered with Focus on Energy and the
local Meals on Wheels organization in the Energy Star
Change the World Tour. Energy Star donated 750 100-watt
LED bulbs, Focus on Energy delivered the light bulbs in bulk
to MPU, MPU repackaged the bulbs into bags of five each,
and Meals on Wheels delivered the bulbs to the 150
MPU customers who participated in this program.
• In 2016, MPU launched its Shared Savings Loan Program
(SSLP) which is designed to provide low interest loans of
between $5,000 and $50,000 to new and existing utility
commercial customers for installing energy efficiency
electrical equipment. Applicants are required to meet with
Focus on Energy and provide MPU with a written Focus
Certification document stating the facilities are energy efficient.
Customers benefit from this program by reduced financing
costs, lower energy consumption and lower utility bills.
• On behalf of MPU, the National Theatre for Children presented
Showdown at Conservation Canyon in nine elementary
schools during the spring of 2016. A reported 1,955 students
participated in one of the 14 performances. The program
focused its educational messages on energy education
including how electricity and energy are made, the uses of
energy, ways energy is wasted and how to conserve energy.
3FOCUSED ON CORE VALUES

4 MANITOWOC PUBLIC UTILITIES
For over 100 years, community-owned Manitowoc Public Utilities
has been a provider of utility services to the City of Manitowoc.
MPU is one of the country’s more than 2,000 public power
utilities — a not-for-profit utility owned by the residents and the
community it serves. MPU recognizes its responsibility to provide
reliable service at a competitive cost and will continue to build on
this foundation in the future.
The Manitowoc Public Utilities finalized a three-year strategic
plan in late 2015. This plan is a road map that will help guide
the organization through the next few years. The core values
provide a framework for the Commission and employees to make
operational decisions. The plan identifies numerous strategic
initiatives that support each of the three core values of MPU:
• Delivery of reliable utility services through competitive
rates;
• Fair and ethical treatment of customers, employees and
partners; and
• Promote environmental awareness and safe drinking water.
Delivery of Reliable Utility Services through Competitive RatesIn 2016, MPU implemented a third consecutive electric rate
decrease, a result of a team effort in making short and long-term
efficiency improvements within the electric utility, along with
planned efforts to lower fuel and purchased power costs. MPU’s
electric rates are some of the lowest in the state of Wisconsin,
falling in the bottom quartile. Water rates remained steady in 2016
and are in the lowest 15% of water utility rates in Wisconsin.
MPU also kicked off a project in 2016 to develop an electric
utility integrated resource plan to assess long-term power
supply requirements and alternative solutions to meet those
requirements. These prospective solutions include not only
traditional supply-side alternatives (e.g. power supply contracts,
new generation) but also possible demand-side approaches
(e.g. energy storage, demand response) as well. By including the
potential impacts of new and emerging technologies (e.g. solar;
distributed generation), MPU will be better able to navigate
the terrain of the future and to provide reliable service for its
ratepayers for years to come.
Also in 2016 MPU earned the Reliable Public
Power Provider Platinum (RP3®) designation
from the American Public Power Association
for providing reliable and safe electric service.
The RP3 designation recognizes public power
utilities that demonstrate proficiency in four key
disciplines: reliability, safety, workforce development and system
improvement. Criteria within each category are based on sound
business practices and represent a utility-wide commitment
to safe and reliable delivery of electricity. The RP3 designation
lasts for three years. MPU is one of 29 utilities that earned the
designation this year. In total, 219 of the more than 2,000 public
power utilities nationwide hold the RP3 designation.
Fair and Ethical Treatment of Customers, Employees and Partners MPU is dedicated to creating and sustaining long-lasting
relationships with our customers, partners and the communities
we serve. As a customer-owned entity, MPU is committed to the
engagement and satisfaction of our customers. MPU continues
to work towards the betterment of our customer service through
the use of technology to provide increased efficiencies and
customer experience. MPU also acknowledges the benefits of an
engaged and talented workforce. Our employees are critical to
the success of our systems, ensuring customers receive reliable
and quality services in a safe and economically-efficient manner.
In 2016, we kicked off a company-wide succession planning effort
with the help of a consulting firm to ensure continuity in operations
as our long-term employees retire.
CORE VALUES

5FOCUSED ON CORE VALUES
As we look to the future, MPU’s growth and evolution is tied directly
to that of our customers. In recognition of this, MPU rolled out a new
Economic Development Loan Program in 2016 that provides low
interest rate loans to new and existing commercial and industrial
customers. These loans will be used for the installation of new
energy efficient equipment and facilities which will assist customers
in managing energy costs while promoting economic development
and expansion in the City of Manitowoc.
MPU procured and completed installation of two Package Firetube
Boilers to provide steam for heat and process use to Steam Utility
Customers. This project was the result of a win-win partnership
with a large industrial customer and provides the customer with a
low-cost option to receive process steam if the power generation
units are not dispatched into the Mid-Continent Independent
System Operator (MISO) power market. This was a large scale
project resulting in an additional 100,000 pounds per hour of gas-
fired steam generation capability.
MPU continues to develop and nurture the partnerships cultivated
over the last several years. Our collaboration with Great Lakes
Utilities has allowed us to invest in renewable energy through
the purchase of output from the Lakeswind 50 MW wind farm in
Western Minnesota, helping us meet state-mandated renewable
energy requirements. GLU also provides its members low-cost
wholesale power supply, helping us keep our rates down. We
continue to provide potable water to six communities via our
partnership with the Central Brown County Water Authority.
MPU is working diligently to foster our newest partnership with
the Village of Reedsville by providing operations of their water and
wastewater systems. Finally, MPU partnered with the Village of
Cleveland in 2016 to provide operational support of their water and
wastewater systems. All of these partnerships have been win-win
situations for MPU, our customers and employees.
Promote Environmental Awareness and Safe Drinking Water As a producer and provider of electricity and drinking water to our
customers, MPU recognizes the importance of being a steward
of the environment. A healthy environment and safe drinking
water is essential for the wellbeing of our customers, employees
and the communities we serve. MPU takes great pride in ensuring
compliance with all environmental laws and regulations. While
providing safe, reliable electric and water services to our
customers, MPU has undertaken several initiatives within the
strategic plan to support our commitment to this core value.
MPU applied and qualified for the 2017 WDNR Private Lead Service
Line Replacement Funding Program through the Safe Drinking
Water Loan Program (SDWLP), a $300,000 grant. Grant funds will
be provided to customers to eliminate private lead water services
in the water system, which are owned entirely by the property
owner from the water main to the house. Since the mid-1990s,
MPU has safely treated its water with ortho-phosphate to reduce
the risk of lead leaching into water from plumbing materials and be
in compliance with EPA’s lead action level. However, the best way
to eliminate lead in drinking water is to eliminate the source. MPU
is currently working on a program to distribute the grant funds to
customers for replacement of lead services.

6 MANITOWOC PUBLIC UTILITIES
$0 $5,000 $10,000 $15,000 $20,000 $25,000 $30,000 $40,000 $35,000
Power Generation
Purchased Power
Distribution
Customer Accounts
Administrative
Taxes
Depreciation
Net Operating Income 2016
2015
2014
(x 1,000)
Pumping
Water Supply
Water Treatment
Water Distribution
Customer Accounts
Administrative
Taxes
Depreciation
Net Operating Income
(x 1,000) 0 $200 $400 $600 $800 $1000 $1200 $1400
2016
2015
2014
PLANS FOR 2017The following are some of the projects, updates and upgrades slated for year two of the strategic plan in 2017 under the respective Core Value:
DELIVERY OF RELIABLE UTILITY SERVICES THROUGH COMPETITIVE RATES
• Convert 2000 feet of overhead line to underground cable to
improve reliability.
• Replace 13 deteriorated concrete light poles on North 13th
and North 8th streets.
• Replace 1600 feet of degraded underground primary cable in
the 1500 block of South 35th Street.
• Continue to replace underground transformer vaults in the
800 block of Franklin Street.
• Conduct an overhaul of turbine #5.
• Replace the 4kV switchgear equipment serving both City
and power plant loads.
• Replace F cubical switchgear equipment serving 480 volt
plant loads.
• Perform phase 2 of the generation reliability study to focus
on life cycle cost analysis with sensitivity analysis for various
future scenarios.
• Upgrade the power plant’s outdated Distributed Control
System to Symphony Plus.
• Replace 3,600 feet of water main throughout the City to
improve reliability.
• Update the disaster plan to address natural, technological
and manmade emergencies.
• Conduct a comprehensive security review to identify gaps
and plan for necessary physical security upgrades.
• Upgrade the Revere Substation relays to install new
equipment at the substation.
• Install backup power to the entire Main Office Building to
ensure network, phone system and resource availability
during an outage.
• Upgrade Raw Water Pump Station #1 ventilation and HVAC
equipment.
• Purchase a new MISO Market Interface Software package
to comply with a recent FERC Order requiring the shift from
60-minute to 5-minute settlements.
• Install additional storage and server capacity for the main
office.
• Complete security and data backup upgrades.
• Continue to develop the utility wide asset management
program to be completed in 2018.
FAIR AND ETHICAL TREATMENT OF CUSTOMERS, EMPLOYEES AND PARTNERS
• Kickoff the upgrade of the Customer Information System to
the latest version. The upgrade will improve functionality,
increase customer service response times, and allow for
future modifications that will no longer be available with the
current version. This is a two-year project that will carryover
into 2018.
• Implement the Key Accounts Management program.
• Complete the development of a sustainable succession plan.
• Conduct an Employee Satisfaction Survey.
• Conduct the biennial Residential Customer Survey.
PROMOTE ENVIRONMENTAL AWARENESS AND SAFE DRINKING WATER
• Install a wind fence extending from the northeast corner of
the pet coke storage pile perimeter for a total length of 160
feet, per EPA request to enhance fugitive dust control.
• Develop a program to distribute DNR funds received for
replacement of lead services to MPU customers.
• Create an IT governance framework to aid in the development
of IT policies with emphasis on implementing best IT practices
including cyber security.
7FOCUSED ON CORE VALUES
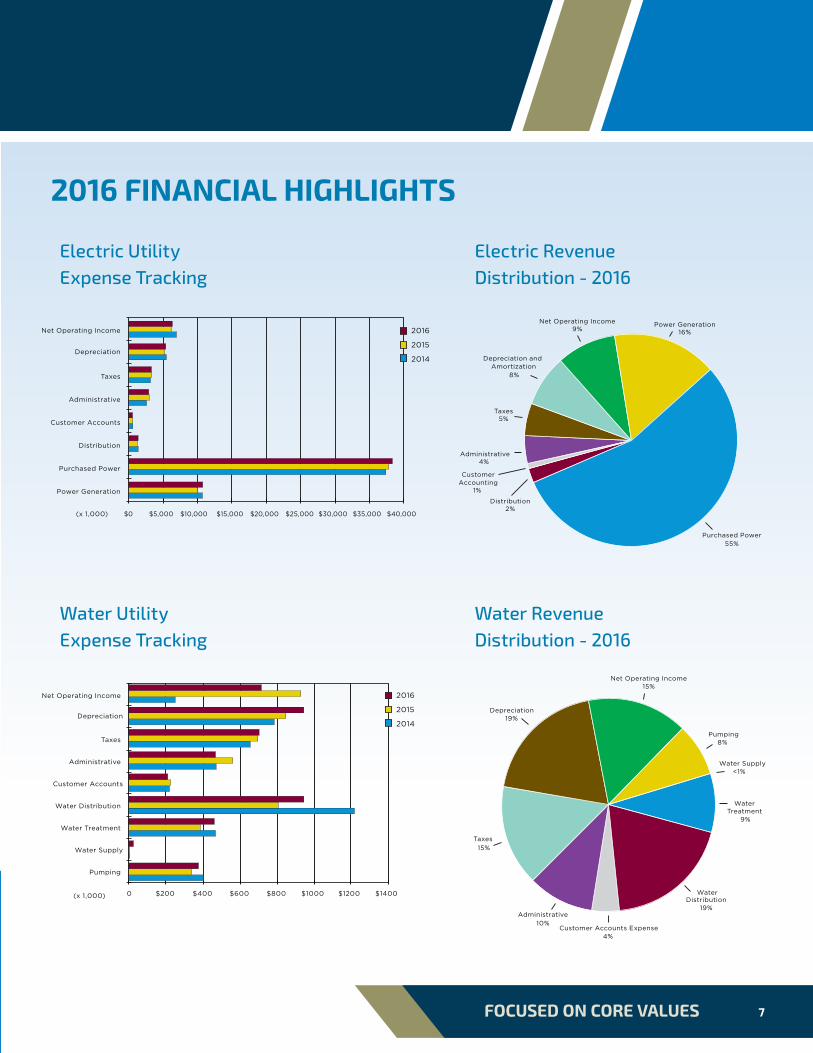
Water Revenue Distribution - 2016
Electric Revenue Distribution - 2016
Electric Utility Expense Tracking
Water Utility Expense Tracking
Power Generation 16%
Purchased Power 55%
Distribution 2%
CustomerAccounting
1%
Taxes 5%
Depreciation and Amortization
8%
Net Operating Income 9%
Administrative4%
$0 $5,000 $10,000 $15,000 $20,000 $25,000 $30,000 $40,000 $35,000
Power Generation
Purchased Power
Distribution
Customer Accounts
Administrative
Taxes
Depreciation
Net Operating Income 2016
2015
2014
(x 1,000)
Pumping8%
Water Supply<1%
Water Treatment
9%
WaterDistribution
19%
Customer Accounts Expense4%
Administrative 10%
Taxes
15%
Depreciation19%
Net Operating Income 15%
Pumping
Water Supply
Water Treatment
Water Distribution
Customer Accounts
Administrative
Taxes
Depreciation
Net Operating Income
(x 1,000) 0 $200 $400 $600 $800 $1000 $1200 $1400
2016
2015
2014
2016 FINANCIAL HIGHLIGHTS
8 MANITOWOC PUBLIC UTILITIES
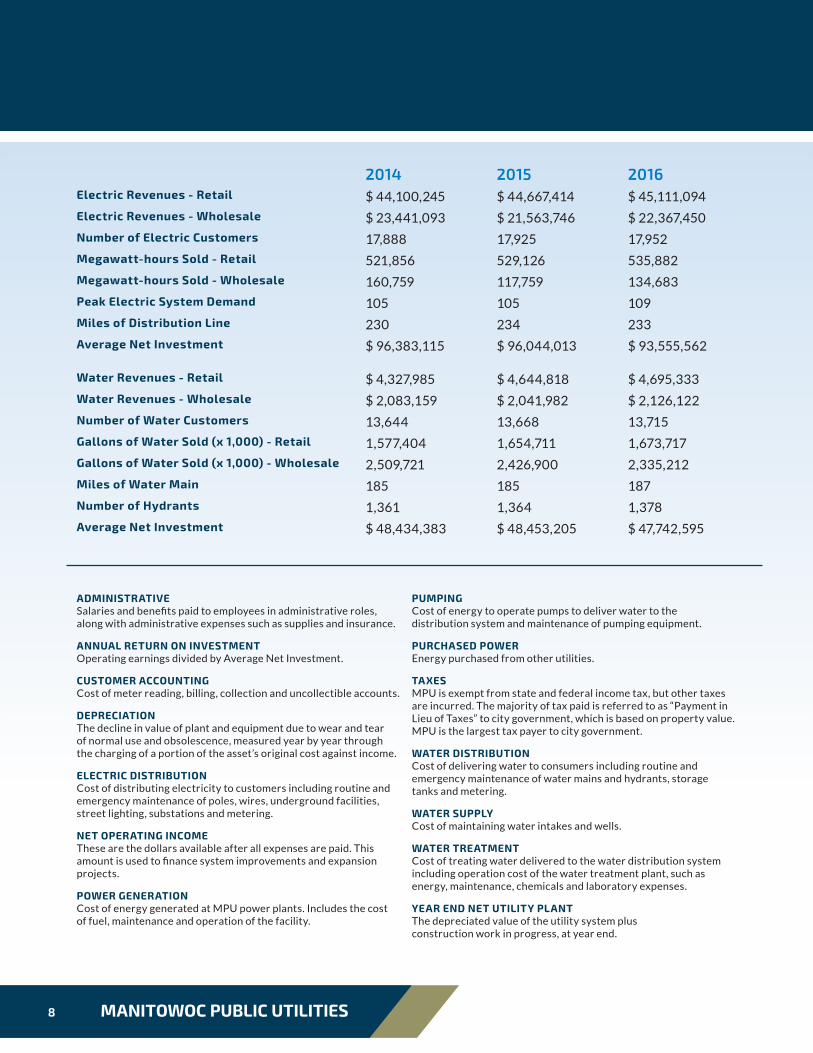
ADMINISTRATIVE Salaries and benefits paid to employees in administrative roles, along with administrative expenses such as supplies and insurance.
ANNUAL RETURN ON INVESTMENT Operating earnings divided by Average Net Investment.
CUSTOMER ACCOUNTING Cost of meter reading, billing, collection and uncollectible accounts.
DEPRECIATION The decline in value of plant and equipment due to wear and tear of normal use and obsolescence, measured year by year through the charging of a portion of the asset’s original cost against income.
ELECTRIC DISTRIBUTION Cost of distributing electricity to customers including routine and emergency maintenance of poles, wires, underground facilities, street lighting, substations and metering.
NET OPERATING INCOME These are the dollars available after all expenses are paid. This amount is used to finance system improvements and expansion projects.
POWER GENERATION Cost of energy generated at MPU power plants. Includes the cost of fuel, maintenance and operation of the facility.
PUMPING Cost of energy to operate pumps to deliver water to the distribution system and maintenance of pumping equipment.
PURCHASED POWER Energy purchased from other utilities.
TAXES MPU is exempt from state and federal income tax, but other taxes are incurred. The majority of tax paid is referred to as “Payment in Lieu of Taxes” to city government, which is based on property value. MPU is the largest tax payer to city government.
WATER DISTRIBUTION Cost of delivering water to consumers including routine and emergency maintenance of water mains and hydrants, storage tanks and metering.
WATER SUPPLY Cost of maintaining water intakes and wells.
WATER TREATMENT Cost of treating water delivered to the water distribution system including operation cost of the water treatment plant, such as energy, maintenance, chemicals and laboratory expenses.
YEAR END NET UTILITY PLANT The depreciated value of the utility system plus construction work in progress, at year end.
2014 2015 2016Electric Revenues - Retail $ 44,100,245 $ 44,667,414 $ 45,111,094
Electric Revenues - Wholesale $ 23,441,093 $ 21,563,746 $ 22,367,450
Number of Electric Customers 17,888 17,925 17,952
Megawatt-hours Sold - Retail 521,856 529,126 535,882
Megawatt-hours Sold - Wholesale 160,759 117,759 134,683
Peak Electric System Demand 105 105 109
Miles of Distribution Line 230 234 233
Average Net Investment $ 96,383,115 $ 96,044,013 $ 93,555,562
Water Revenues - Retail $ 4,327,985 $ 4,644,818 $ 4,695,333
Water Revenues - Wholesale $ 2,083,159 $ 2,041,982 $ 2,126,122
Number of Water Customers 13,644 13,668 13,715
Gallons of Water Sold (x 1,000) - Retail 1,577,404 1,654,711 1,673,717
Gallons of Water Sold (x 1,000) - Wholesale 2,509,721 2,426,900 2,335,212
Miles of Water Main 185 185 187
Number of Hydrants 1,361 1,364 1,378
Average Net Investment $ 48,434,383 $ 48,453,205 $ 47,742,595

with comparative totals for 2015
FINANCIAL STATEMENTS
2016Manitowoc Public Utilities
9

MANITOWOC PUBLIC UTILITIESCity of Manitowoc, Wisconsin
Statement of Net Position December 31, 2016
With summarized financial information as of December 31, 2015ASSETS 2016 2015
Utility PlantElectric $ 176,245,777 $ 173,770,991 Water 71,142,175 70,157,686Steam 4,697,561 2,568,360Broadband 1,429,681 1,243,293Information technology -- 1,191,576Total 253,515,194 248,931,906Less: Accumulated depreciation (112,112,927) (105,483,703)Net Utility Plant 141,402,267 143,448,203
Current AssetsCash and investments 35,738,683 32,749,418Accounts receivable, net 7,023,207 6,871,912Accrued interest -- 64,388Inventory 2,721,062 2,401,649Prepaid items 1,510,134 2,474,104Notes receivable - City of Manitowoc 712,504 684,595Total Current Assets 47,705,590 45,246,066
Restricted Assets Cash and investments 7,946,117 7,662,117
Non-current AssetsNotes receivable 920,000 920,000Notes receivable - City of Manitowoc 686,310 686,310Ownership interest in American Transmission Company, LLC 10,044,744 10,044,744Rate stabilization deposit 4,000,000 --Other 1,127,822 1,128,529Net pension asset -- 1,074,795Total non-current assets 16,987,885 13,854,378
TOTAL ASSETS 214,041,859 210,210,764DEFERRED OUTFLOWS OF RESOURCES
Deferred outflows related to pension 3,907,043 1,150,302LIABILITIES
Current Liabilities Accounts payable 4,455,411 4,617,816Due to City of Manitowoc 905,160 930,252Accrued expenses 3,922,157 4,095,581Accrued interest 140,714 167,971Deposits 436,523 384,741Compensated absences and other payroll liabilities 2,840,499 2,869,694Total Current Liabilities 12,700,464 13,066,055
Long-term ObligationsDue within one year
Land contract 96,000 96,000Unamortized premium 133,347 133,347Revenue bonds payable 3,095,000 2,975,000
Due in more than one year Land contract 272,000 376,000Other post employment benefits 289,891 274,949Unamortized premium 596,856 730,203Revenue bonds payable 10,945,000 14,040,000Net pension liability 689,549 --
Total Non-current Liabilities 16,117,643 18,625,499TOTAL LIABILITIES 28,818,107 31,691,554
DEFERRED INFLOWS OF RESOURCESUnamortized gain on debt refinancing 1,908,603 2,058,297Deferred inflows related to pensions 1,451,144 --
TOTAL DEFERRED INFLOWS OF RESOURCES 3,359,747 2,058,297NET POSITION
Net investment in capital assets 124,355,461 123,511,356Restricted for debt service 2,777,631 3,005,477Restricted for plant replacement 5,027,772 4,488,669Restricted for pension benefits -- 1,074,795Unrestricted 53,610,184 45,530,918TOTAL NET POSITION $ 185,771,048 $ 177,611,215
The notes to the financial statements are an integral part of this statement.
11FOCUSED ON CORE VALUES
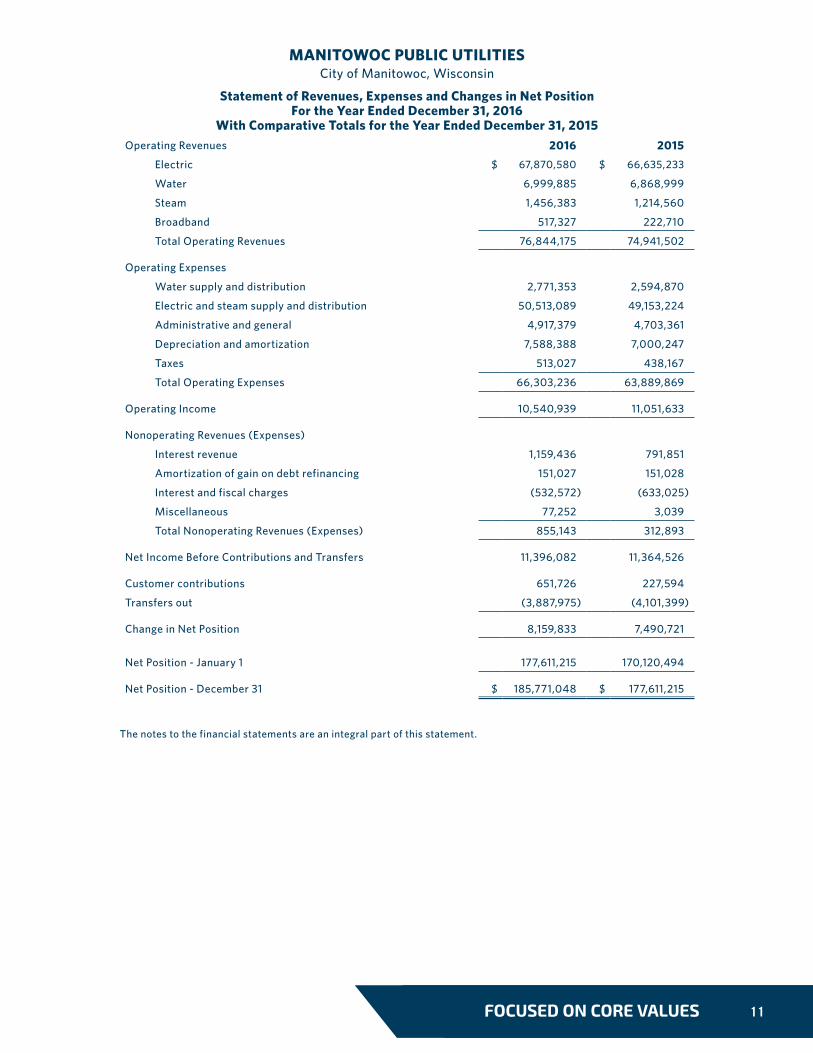
MANITOWOC PUBLIC UTILITIESCity of Manitowoc, Wisconsin
Statement of Revenues, Expenses and Changes in Net Position For the Year Ended December 31, 2016
With Comparative Totals for the Year Ended December 31, 2015Operating Revenues 2016 2015
Electric $ 67,870,580 $ 66,635,233
Water 6,999,885 6,868,999
Steam 1,456,383 1,214,560
Broadband 517,327 222,710
Total Operating Revenues 76,844,175 74,941,502
Operating Expenses
Water supply and distribution 2,771,353 2,594,870
Electric and steam supply and distribution 50,513,089 49,153,224
Administrative and general 4,917,379 4,703,361
Depreciation and amortization 7,588,388 7,000,247
Taxes 513,027 438,167
Total Operating Expenses 66,303,236 63,889,869
Operating Income 10,540,939 11,051,633
Nonoperating Revenues (Expenses)
Interest revenue 1,159,436 791,851
Amortization of gain on debt refinancing 151,027 151,028
Interest and fiscal charges (532,572) (633,025)
Miscellaneous 77,252 3,039
Total Nonoperating Revenues (Expenses) 855,143 312,893
Net Income Before Contributions and Transfers 11,396,082 11,364,526
Customer contributions 651,726 227,594
Transfers out (3,887,975) (4,101,399)
Change in Net Position 8,159,833 7,490,721
Net Position - January 1 177,611,215 170,120,494
Net Position - December 31 $ 185,771,048 $ 177,611,215
The notes to the financial statements are an integral part of this statement.
12 MANITOWOC PUBLIC UTILITIES
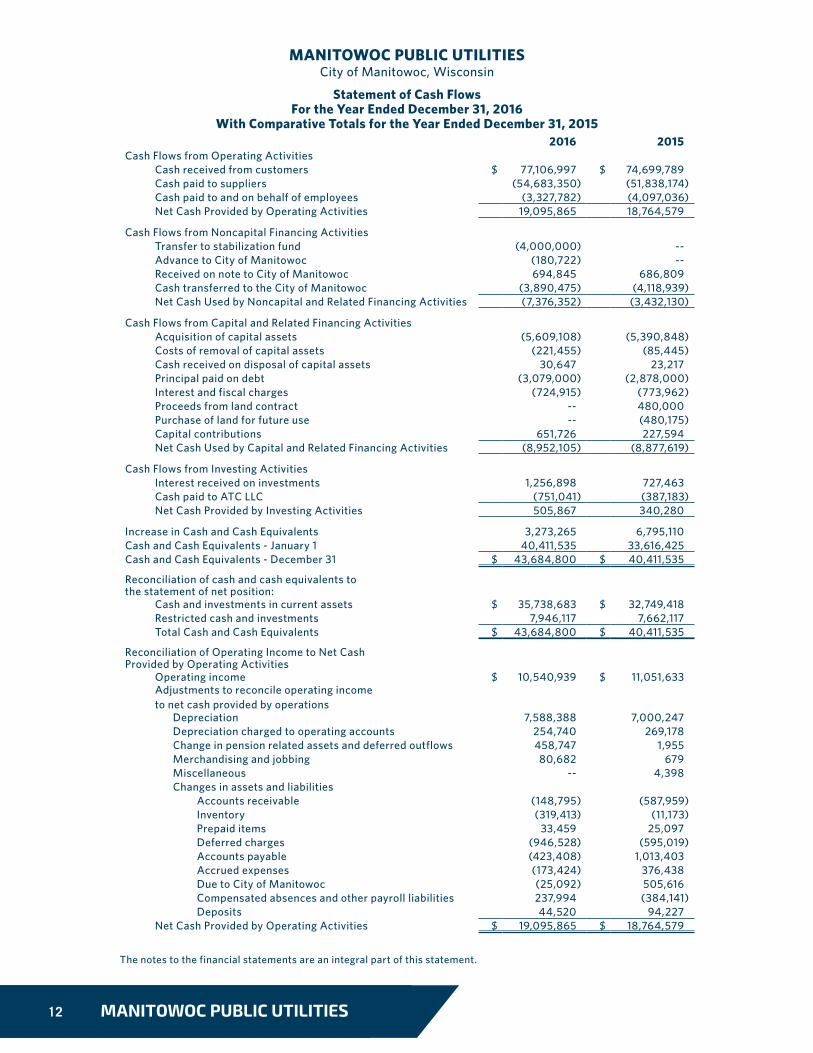
MANITOWOC PUBLIC UTILITIESCity of Manitowoc, Wisconsin
Statement of Cash Flows For the Year Ended December 31, 2016
With Comparative Totals for the Year Ended December 31, 20152016 2015
Cash Flows from Operating Activities Cash received from customers $ 77,106,997 $ 74,699,789Cash paid to suppliers (54,683,350) (51,838,174)Cash paid to and on behalf of employees (3,327,782) (4,097,036)Net Cash Provided by Operating Activities 19,095,865 18,764,579
Cash Flows from Noncapital Financing ActivitiesTransfer to stabilization fund (4,000,000) --Advance to City of Manitowoc (180,722) --Received on note to City of Manitowoc 694,845 686,809Cash transferred to the City of Manitowoc (3,890,475) (4,118,939)Net Cash Used by Noncapital and Related Financing Activities (7,376,352) (3,432,130)
Cash Flows from Capital and Related Financing ActivitiesAcquisition of capital assets (5,609,108) (5,390,848)Costs of removal of capital assets (221,455) (85,445)Cash received on disposal of capital assets 30,647 23,217Principal paid on debt (3,079,000) (2,878,000)Interest and fiscal charges (724,915) (773,962)Proceeds from land contract -- 480,000Purchase of land for future use -- (480,175)Capital contributions 651,726 227,594Net Cash Used by Capital and Related Financing Activities (8,952,105) (8,877,619)
Cash Flows from Investing ActivitiesInterest received on investments 1,256,898 727,463Cash paid to ATC LLC (751,041) (387,183)Net Cash Provided by Investing Activities 505,867 340,280
Increase in Cash and Cash Equivalents 3,273,265 6,795,110Cash and Cash Equivalents - January 1 40,411,535 33,616,425Cash and Cash Equivalents - December 31 $ 43,684,800 $ 40,411,535
Reconciliation of cash and cash equivalents to the statement of net position:
Cash and investments in current assets $ 35,738,683 $ 32,749,418Restricted cash and investments 7,946,117 7,662,117Total Cash and Cash Equivalents $ 43,684,800 $ 40,411,535
Reconciliation of Operating Income to Net Cash Provided by Operating Activities
Operating income $ 10,540,939 $ 11,051,633 Adjustments to reconcile operating income to net cash provided by operations
Depreciation 7,588,388 7,000,247Depreciation charged to operating accounts 254,740 269,178Change in pension related assets and deferred outflows 458,747 1,955Merchandising and jobbing 80,682 679Miscellaneous -- 4,398Changes in assets and liabilities
Accounts receivable (148,795) (587,959)Inventory (319,413) (11,173)Prepaid items 33,459 25,097Deferred charges (946,528) (595,019)Accounts payable (423,408) 1,013,403Accrued expenses (173,424) 376,438Due to City of Manitowoc (25,092) 505,616Compensated absences and other payroll liabilities 237,994 (384,141)Deposits 44,520 94,227
Net Cash Provided by Operating Activities $ 19,095,865 $ 18,764,579
The notes to the financial statements are an integral part of this statement.
13FOCUSED ON CORE VALUES
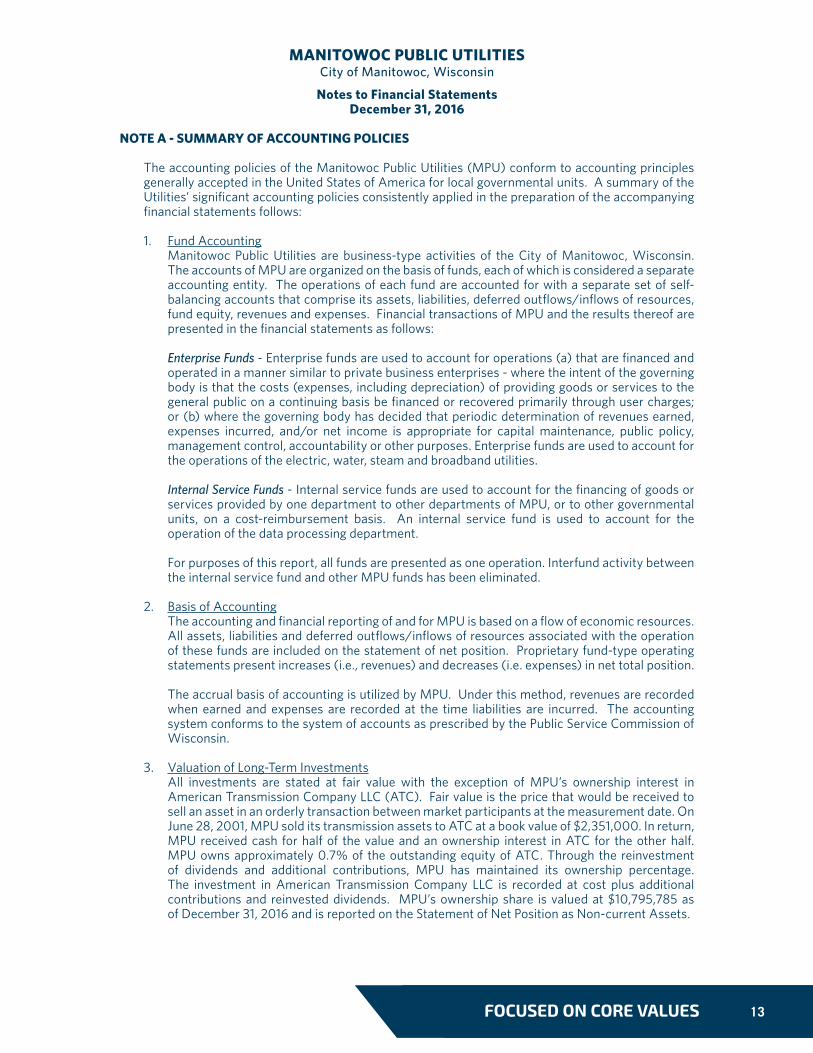
MANITOWOC PUBLIC UTILITIES City of Manitowoc, Wisconsin
Notes to Financial Statements December 31, 2016
NOTE A - SUMMARY OF ACCOUNTING POLICIES
The accounting policies of the Manitowoc Public Utilities (MPU) conform to accounting principles generally accepted in the United States of America for local governmental units. A summary of the Utilities’ significant accounting policies consistently applied in the preparation of the accompanying financial statements follows:
1. Fund AccountingManitowoc Public Utilities are business-type activities of the City of Manitowoc, Wisconsin. The accounts of MPU are organized on the basis of funds, each of which is considered a separate accounting entity. The operations of each fund are accounted for with a separate set of self-balancing accounts that comprise its assets, liabilities, deferred outflows/inflows of resources, fund equity, revenues and expenses. Financial transactions of MPU and the results thereof are presented in the financial statements as follows:
Enterprise Funds - Enterprise funds are used to account for operations (a) that are financed and operated in a manner similar to private business enterprises - where the intent of the governing body is that the costs (expenses, including depreciation) of providing goods or services to the general public on a continuing basis be financed or recovered primarily through user charges; or (b) where the governing body has decided that periodic determination of revenues earned, expenses incurred, and/or net income is appropriate for capital maintenance, public policy, management control, accountability or other purposes. Enterprise funds are used to account for the operations of the electric, water, steam and broadband utilities.
Internal Service Funds - Internal service funds are used to account for the financing of goods or services provided by one department to other departments of MPU, or to other governmental units, on a cost-reimbursement basis. An internal service fund is used to account for the operation of the data processing department.
For purposes of this report, all funds are presented as one operation. Interfund activity between the internal service fund and other MPU funds has been eliminated.
2. Basis of AccountingThe accounting and financial reporting of and for MPU is based on a flow of economic resources. All assets, liabilities and deferred outflows/inflows of resources associated with the operation of these funds are included on the statement of net position. Proprietary fund-type operating statements present increases (i.e., revenues) and decreases (i.e. expenses) in net total position.
The accrual basis of accounting is utilized by MPU. Under this method, revenues are recorded when earned and expenses are recorded at the time liabilities are incurred. The accounting system conforms to the system of accounts as prescribed by the Public Service Commission of Wisconsin.
3. Valuation of Long-Term InvestmentsAll investments are stated at fair value with the exception of MPU’s ownership interest in American Transmission Company LLC (ATC). Fair value is the price that would be received to sell an asset in an orderly transaction between market participants at the measurement date. On June 28, 2001, MPU sold its transmission assets to ATC at a book value of $2,351,000. In return, MPU received cash for half of the value and an ownership interest in ATC for the other half. MPU owns approximately 0.7% of the outstanding equity of ATC. Through the reinvestment of dividends and additional contributions, MPU has maintained its ownership percentage. The investment in American Transmission Company LLC is recorded at cost plus additional contributions and reinvested dividends. MPU’s ownership share is valued at $10,795,785 as of December 31, 2016 and is reported on the Statement of Net Position as Non-current Assets.
14 MANITOWOC PUBLIC UTILITIES
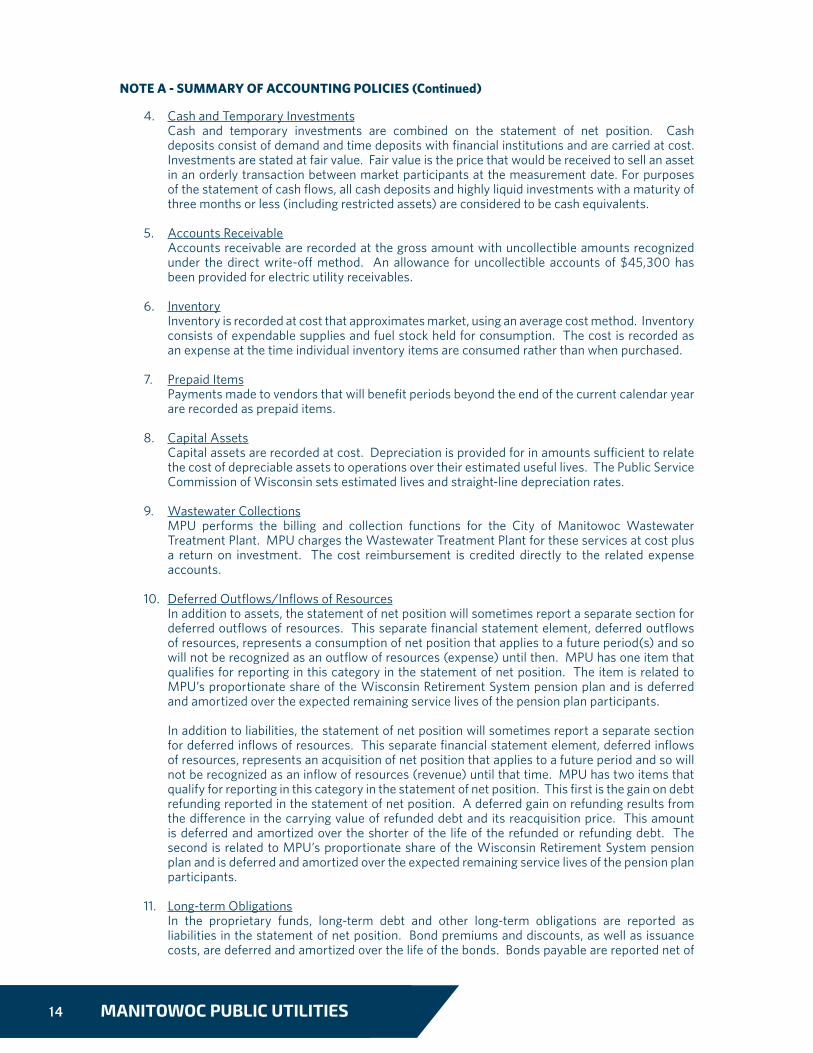
4. Cash and Temporary InvestmentsCash and temporary investments are combined on the statement of net position. Cash deposits consist of demand and time deposits with financial institutions and are carried at cost. Investments are stated at fair value. Fair value is the price that would be received to sell an asset in an orderly transaction between market participants at the measurement date. For purposes of the statement of cash flows, all cash deposits and highly liquid investments with a maturity of three months or less (including restricted assets) are considered to be cash equivalents.
5. Accounts ReceivableAccounts receivable are recorded at the gross amount with uncollectible amounts recognized under the direct write-off method. An allowance for uncollectible accounts of $45,300 has been provided for electric utility receivables.
6. InventoryInventory is recorded at cost that approximates market, using an average cost method. Inventory consists of expendable supplies and fuel stock held for consumption. The cost is recorded as an expense at the time individual inventory items are consumed rather than when purchased.
7. Prepaid ItemsPayments made to vendors that will benefit periods beyond the end of the current calendar year are recorded as prepaid items.
8. Capital AssetsCapital assets are recorded at cost. Depreciation is provided for in amounts sufficient to relate the cost of depreciable assets to operations over their estimated useful lives. The Public Service Commission of Wisconsin sets estimated lives and straight-line depreciation rates.
9. Wastewater CollectionsMPU performs the billing and collection functions for the City of Manitowoc Wastewater Treatment Plant. MPU charges the Wastewater Treatment Plant for these services at cost plus a return on investment. The cost reimbursement is credited directly to the related expense accounts.
10. Deferred Outflows/Inflows of ResourcesIn addition to assets, the statement of net position will sometimes report a separate section for deferred outflows of resources. This separate financial statement element, deferred outflows of resources, represents a consumption of net position that applies to a future period(s) and so will not be recognized as an outflow of resources (expense) until then. MPU has one item that qualifies for reporting in this category in the statement of net position. The item is related to MPU’s proportionate share of the Wisconsin Retirement System pension plan and is deferred and amortized over the expected remaining service lives of the pension plan participants.
In addition to liabilities, the statement of net position will sometimes report a separate section for deferred inflows of resources. This separate financial statement element, deferred inflows of resources, represents an acquisition of net position that applies to a future period and so will not be recognized as an inflow of resources (revenue) until that time. MPU has two items that qualify for reporting in this category in the statement of net position. This first is the gain on debt refunding reported in the statement of net position. A deferred gain on refunding results from the difference in the carrying value of refunded debt and its reacquisition price. This amount is deferred and amortized over the shorter of the life of the refunded or refunding debt. The second is related to MPU’s proportionate share of the Wisconsin Retirement System pension plan and is deferred and amortized over the expected remaining service lives of the pension plan participants.
11. Long-term ObligationsIn the proprietary funds, long-term debt and other long-term obligations are reported as liabilities in the statement of net position. Bond premiums and discounts, as well as issuance costs, are deferred and amortized over the life of the bonds. Bonds payable are reported net of
NOTE A - SUMMARY OF ACCOUNTING POLICIES (Continued)
15FOCUSED ON CORE VALUES
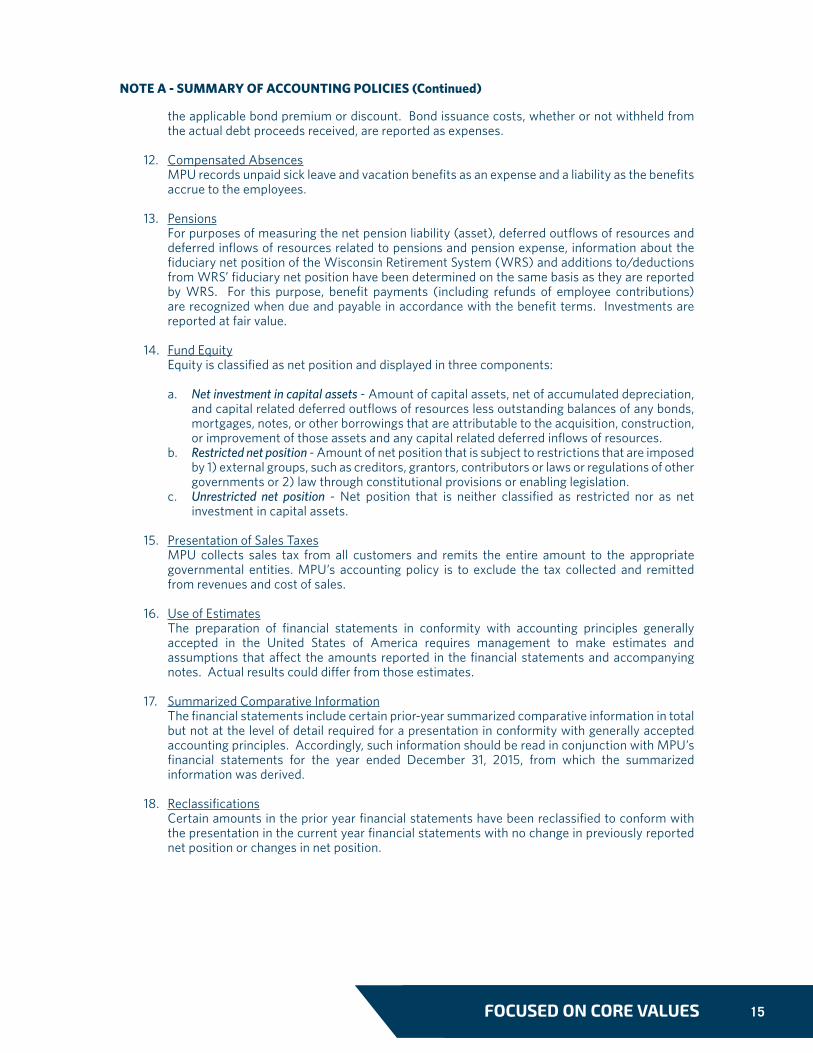
the applicable bond premium or discount. Bond issuance costs, whether or not withheld from the actual debt proceeds received, are reported as expenses.
12. Compensated AbsencesMPU records unpaid sick leave and vacation benefits as an expense and a liability as the benefits accrue to the employees.
13. PensionsFor purposes of measuring the net pension liability (asset), deferred outflows of resources and deferred inflows of resources related to pensions and pension expense, information about the fiduciary net position of the Wisconsin Retirement System (WRS) and additions to/deductions from WRS’ fiduciary net position have been determined on the same basis as they are reported by WRS. For this purpose, benefit payments (including refunds of employee contributions) are recognized when due and payable in accordance with the benefit terms. Investments are reported at fair value.
14. Fund EquityEquity is classified as net position and displayed in three components:
a. Net investment in capital assets - Amount of capital assets, net of accumulated depreciation, and capital related deferred outflows of resources less outstanding balances of any bonds, mortgages, notes, or other borrowings that are attributable to the acquisition, construction, or improvement of those assets and any capital related deferred inflows of resources.
b. Restricted net position - Amount of net position that is subject to restrictions that are imposed by 1) external groups, such as creditors, grantors, contributors or laws or regulations of other governments or 2) law through constitutional provisions or enabling legislation.
c. Unrestricted net position - Net position that is neither classified as restricted nor as net investment in capital assets.
15. Presentation of Sales TaxesMPU collects sales tax from all customers and remits the entire amount to the appropriate governmental entities. MPU’s accounting policy is to exclude the tax collected and remitted from revenues and cost of sales.
16. Use of EstimatesThe preparation of financial statements in conformity with accounting principles generally accepted in the United States of America requires management to make estimates and assumptions that affect the amounts reported in the financial statements and accompanying notes. Actual results could differ from those estimates.
17. Summarized Comparative InformationThe financial statements include certain prior-year summarized comparative information in total but not at the level of detail required for a presentation in conformity with generally accepted accounting principles. Accordingly, such information should be read in conjunction with MPU’s financial statements for the year ended December 31, 2015, from which the summarized information was derived.
18. ReclassificationsCertain amounts in the prior year financial statements have been reclassified to conform with the presentation in the current year financial statements with no change in previously reported net position or changes in net position.
NOTE A - SUMMARY OF ACCOUNTING POLICIES (Continued)

16 MANITOWOC PUBLIC UTILITIES
NOTE B - CASH AND INVESTMENTS
MPU maintains various cash and investment accounts, including pooled funds, which are available for use by all funds. Each fund’s portion of these accounts is displayed on the statement of net position as “Cash and Investments.”
Invested cash consists of deposits and investments that are restricted by Wisconsin Statute 66.04(2) and local policy to the following:
Time deposits; repurchase agreements; securities issued by federal, state and local governmental entities; statutorily authorized commercial paper and corporate securities; Wisconsin local government investment pool and Wisconsin investment trust.
The carrying amount of MPU’s cash and investments totaled $43,684,800 on December 31, 2016 as summarized below:
Reconciliation to the financial statements:
Fair Value MeasurementsMPU implemented GASB Statement No. 72, Fair Value Measurement and Application, for the year ending December 31, 2016. MPU categorizes its fair value measurements within the fair value hierarchy established by generally accepted accounting principles. The hierarchy is based on the valuation inputs used to measure the fair value of the asset. Level 1 inputs are quoted prices in active markets for identical assets; Level 2 inputs are significant observable inputs; Level 3 inputs are significant unobservable inputs. MPU has the following fair value measurements as of December 31, 2016:
Deposits and investments of MPU are subject to various risks. Presented on the following page is a discussion of the specific risks and MPU’s policy related to the risk.
Petty cash funds $ 750
Financial institutions 8,670,221
Investments 35,013,829
$ 43,684,800
Statement of Net Position
Cash and investments $ 35,738,683
Restricted cash and investments 7,946,117
$ 43,684,800
Fair Value Measurements Using:
Level 1 Level 2 Level 3
Money Market Funds $ 2,920,504 $ $
US Treasury Notes -- 14,131,242 --
Federal National Mortgage -- 5,719,129 --
Federal Home Loan Mortgage -- 995,105 --
Corporate bonds -- 11,247,849 --
Total investments by fair value level $ 2,920,504 $ 32,093,325 $ --
17FOCUSED ON CORE VALUES
Custodial Credit RiskCustodial credit risk for deposits is the risk that, in the event of the failure of a depository financial institution, a government will not be able to recover its deposits or will not be able to recover collateral securities that are in the possession of an outside party. The custodial credit risk for investments is the risk that, in the event of the failure of the counterparty (e.g., broker-dealer) to a transaction, a government will not be able to recover the value of its investment or collateral securities that are in the possession of another party. Wisconsin statutes require repurchase agreements to be fully collateralized by bonds or securities issued or guaranteed by the federal government or its instrumentalities. MPU does not have an additional custodial credit risk policy.
Deposits with financial institutions located within the State of Wisconsin are insured by the Federal Deposit Insurance Corporation (FDIC) in the amount of $250,000 for the combined amount of all time and savings deposits and $250,000 for interest-bearing and noninterest-bearing demand deposits per official custodian per insured depository institution. Deposits with financial institutions located outside the State of Wisconsin are insured by the FDIC in the amount of $250,000 for the combined amount of all deposit accounts per official custodian per depository institution. Also, the State of Wisconsin has a State Guarantee Fund which provides a maximum of $400,000 per public depository above the amount provided by an agency of the U.S. Government. However, due to the relatively small size of the State Guarantee Fund in relation to the Fund’s total coverage, total recovery of insured losses may not be available.
As of December 31, 2016, $8,097,750 of MPU’s deposits with financial institutions were in excess of federal and state depository insurance limits. Of this total, $8,075,442 was collateralized with securities held by the pledging financial institution’s agent.
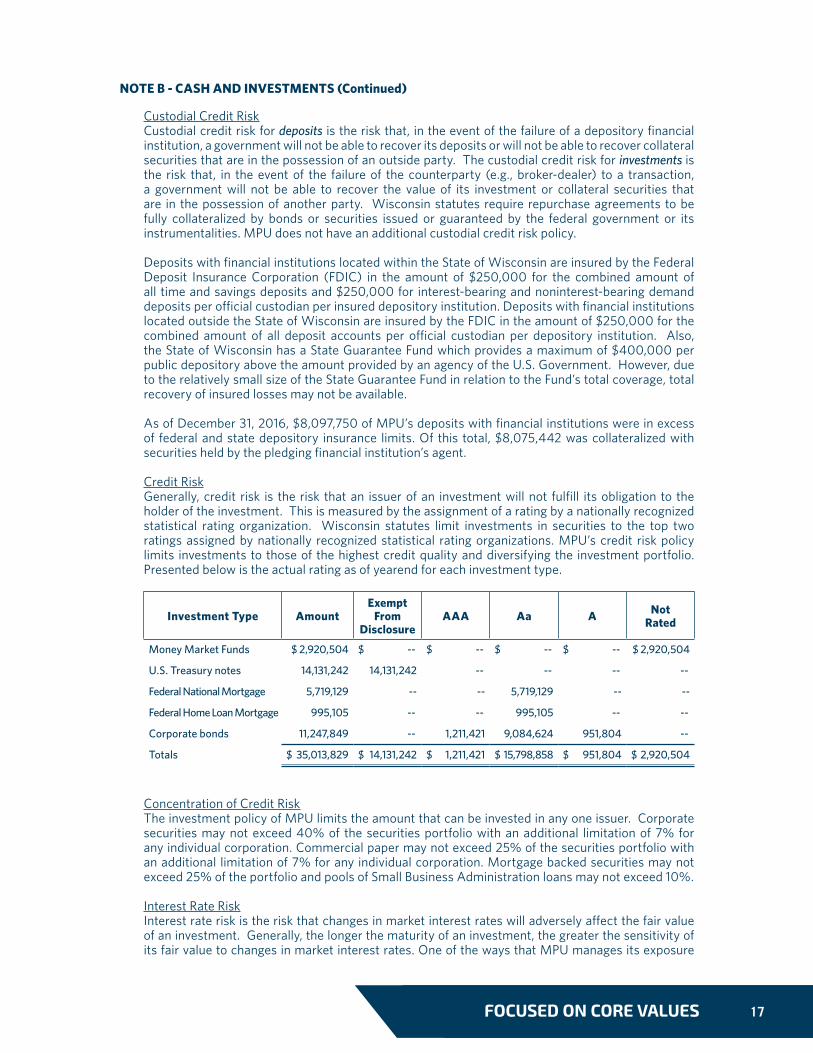
Credit RiskGenerally, credit risk is the risk that an issuer of an investment will not fulfill its obligation to the holder of the investment. This is measured by the assignment of a rating by a nationally recognized statistical rating organization. Wisconsin statutes limit investments in securities to the top two ratings assigned by nationally recognized statistical rating organizations. MPU’s credit risk policy limits investments to those of the highest credit quality and diversifying the investment portfolio. Presented below is the actual rating as of yearend for each investment type.
Concentration of Credit RiskThe investment policy of MPU limits the amount that can be invested in any one issuer. Corporate securities may not exceed 40% of the securities portfolio with an additional limitation of 7% for any individual corporation. Commercial paper may not exceed 25% of the securities portfolio with an additional limitation of 7% for any individual corporation. Mortgage backed securities may not exceed 25% of the portfolio and pools of Small Business Administration loans may not exceed 10%.
Interest Rate RiskInterest rate risk is the risk that changes in market interest rates will adversely affect the fair value of an investment. Generally, the longer the maturity of an investment, the greater the sensitivity of its fair value to changes in market interest rates. One of the ways that MPU manages its exposure
Investment Type AmountExempt
From Disclosure
AAA Aa A Not Rated
Money Market Funds $ 2,920,504 $ -- $ -- $ -- $ -- $ 2,920,504
U.S. Treasury notes 14,131,242 14,131,242 -- -- -- --
Federal National Mortgage 5,719,129 -- -- 5,719,129 -- --
Federal Home Loan Mortgage 995,105 -- -- 995,105 -- --
Corporate bonds 11,247,849 -- 1,211,421 9,084,624 951,804 --
Totals $ 35,013,829 $ 14,131,242 $ 1,211,421 $ 15,798,858 $ 951,804 $ 2,920,504
NOTE B - CASH AND INVESTMENTS (Continued)
18 MANITOWOC PUBLIC UTILITIES
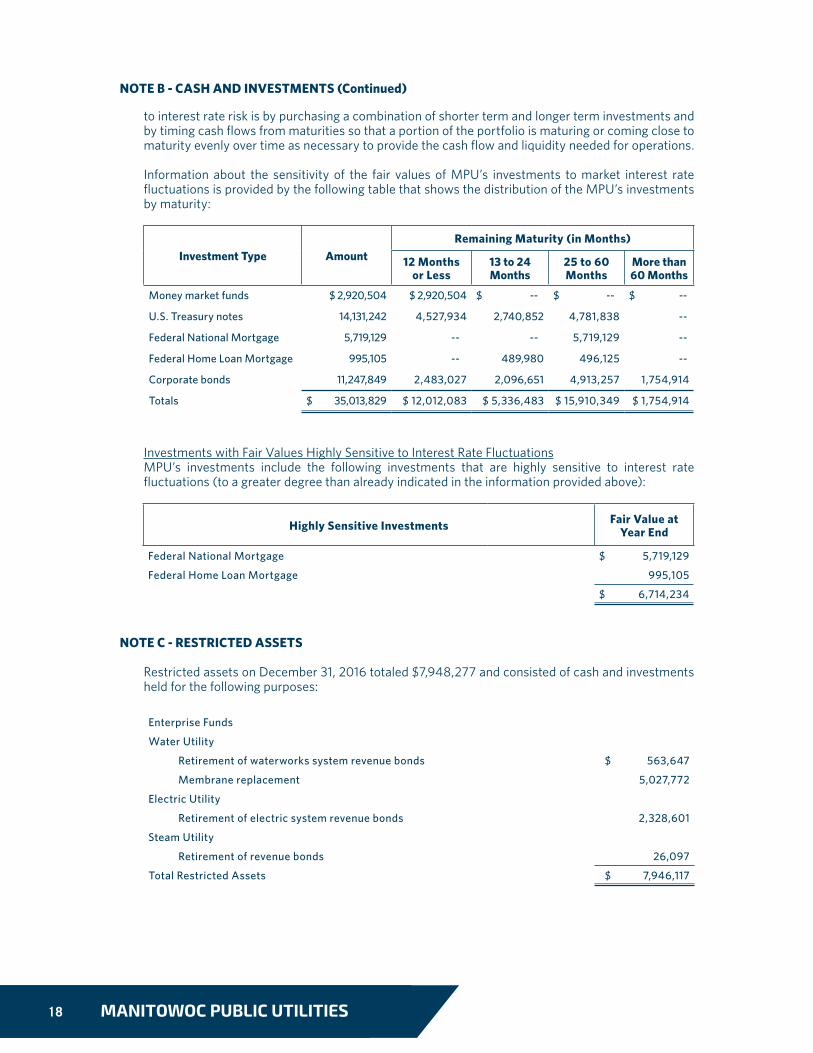
to interest rate risk is by purchasing a combination of shorter term and longer term investments and by timing cash flows from maturities so that a portion of the portfolio is maturing or coming close to maturity evenly over time as necessary to provide the cash flow and liquidity needed for operations.
Information about the sensitivity of the fair values of MPU’s investments to market interest rate fluctuations is provided by the following table that shows the distribution of the MPU’s investments by maturity:
Investments with Fair Values Highly Sensitive to Interest Rate FluctuationsMPU’s investments include the following investments that are highly sensitive to interest rate fluctuations (to a greater degree than already indicated in the information provided above):
NOTE C - RESTRICTED ASSETS
Restricted assets on December 31, 2016 totaled $7,948,277 and consisted of cash and investments held for the following purposes:
Investment Type AmountRemaining Maturity (in Months)
12 Months or Less
13 to 24 Months
25 to 60 Months
More than 60 Months
Money market funds $ 2,920,504 $ 2,920,504 $ -- $ -- $ --
U.S. Treasury notes 14,131,242 4,527,934 2,740,852 4,781,838 --
Federal National Mortgage 5,719,129 -- -- 5,719,129 --
Federal Home Loan Mortgage 995,105 -- 489,980 496,125 --
Corporate bonds 11,247,849 2,483,027 2,096,651 4,913,257 1,754,914
Totals $ 35,013,829 $ 12,012,083 $ 5,336,483 $ 15,910,349 $ 1,754,914
Highly Sensitive Investments Fair Value at Year End
Federal National Mortgage $ 5,719,129
Federal Home Loan Mortgage 995,105
$ 6,714,234
Enterprise Funds
Water Utility
Retirement of waterworks system revenue bonds $ 563,647
Membrane replacement 5,027,772
Electric Utility
Retirement of electric system revenue bonds 2,328,601
Steam Utility
Retirement of revenue bonds 26,097
Total Restricted Assets $ 7,946,117
NOTE B - CASH AND INVESTMENTS (Continued)
19FOCUSED ON CORE VALUES
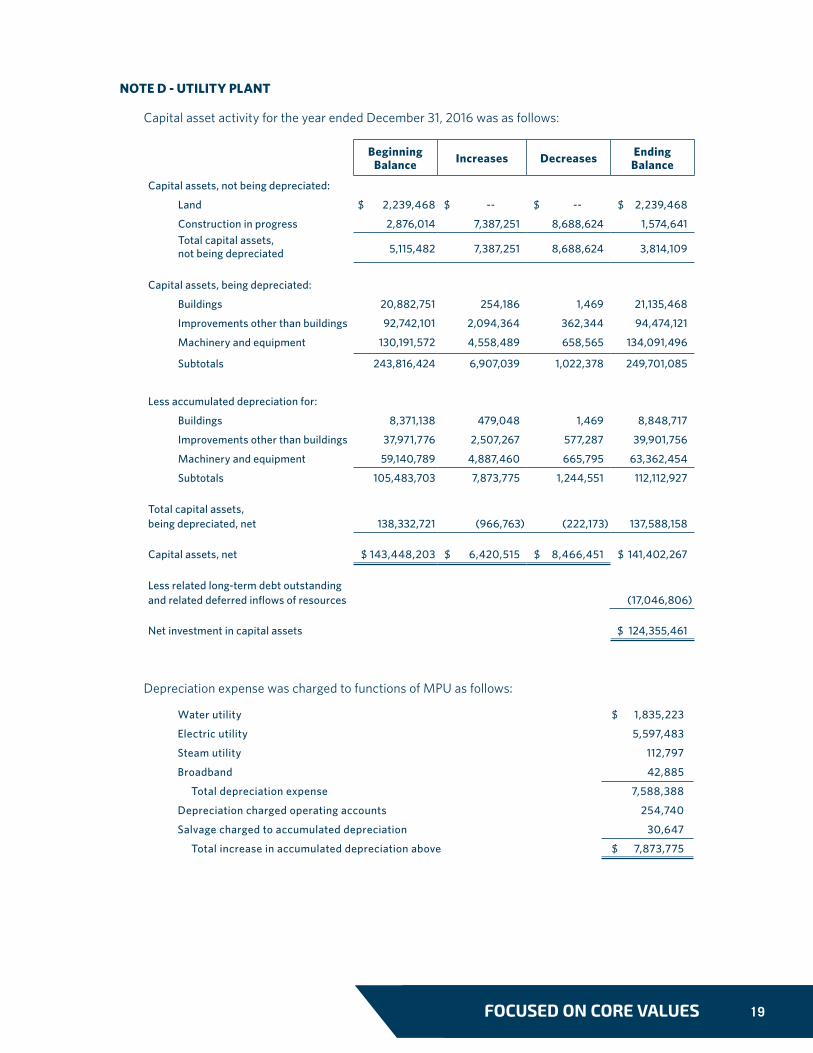
NOTE D - UTILITY PLANT
Capital asset activity for the year ended December 31, 2016 was as follows:
Depreciation expense was charged to functions of MPU as follows:
Beginning Balance Increases Decreases Ending
Balance
Capital assets, not being depreciated:
Land $ 2,239,468 $ -- $ -- $ 2,239,468
Construction in progress 2,876,014 7,387,251 8,688,624 1,574,641Total capital assets, not being depreciated 5,115,482 7,387,251 8,688,624 3,814,109
Capital assets, being depreciated:
Buildings 20,882,751 254,186 1,469 21,135,468
Improvements other than buildings 92,742,101 2,094,364 362,344 94,474,121
Machinery and equipment 130,191,572 4,558,489 658,565 134,091,496
Subtotals 243,816,424 6,907,039 1,022,378 249,701,085
Less accumulated depreciation for:
Buildings 8,371,138 479,048 1,469 8,848,717
Improvements other than buildings 37,971,776 2,507,267 577,287 39,901,756
Machinery and equipment 59,140,789 4,887,460 665,795 63,362,454
Subtotals 105,483,703 7,873,775 1,244,551 112,112,927
Total capital assets, being depreciated, net 138,332,721 (966,763) (222,173) 137,588,158
Capital assets, net $ 143,448,203 $ 6,420,515 $ 8,466,451 $ 141,402,267
Less related long-term debt outstanding and related deferred inflows of resources (17,046,806)
Net investment in capital assets $ 124,355,461
Water utility $ 1,835,223
Electric utility 5,597,483
Steam utility 112,797
Broadband 42,885
Total depreciation expense 7,588,388
Depreciation charged operating accounts 254,740
Salvage charged to accumulated depreciation 30,647
Total increase in accumulated depreciation above $ 7,873,775
20 MANITOWOC PUBLIC UTILITIES
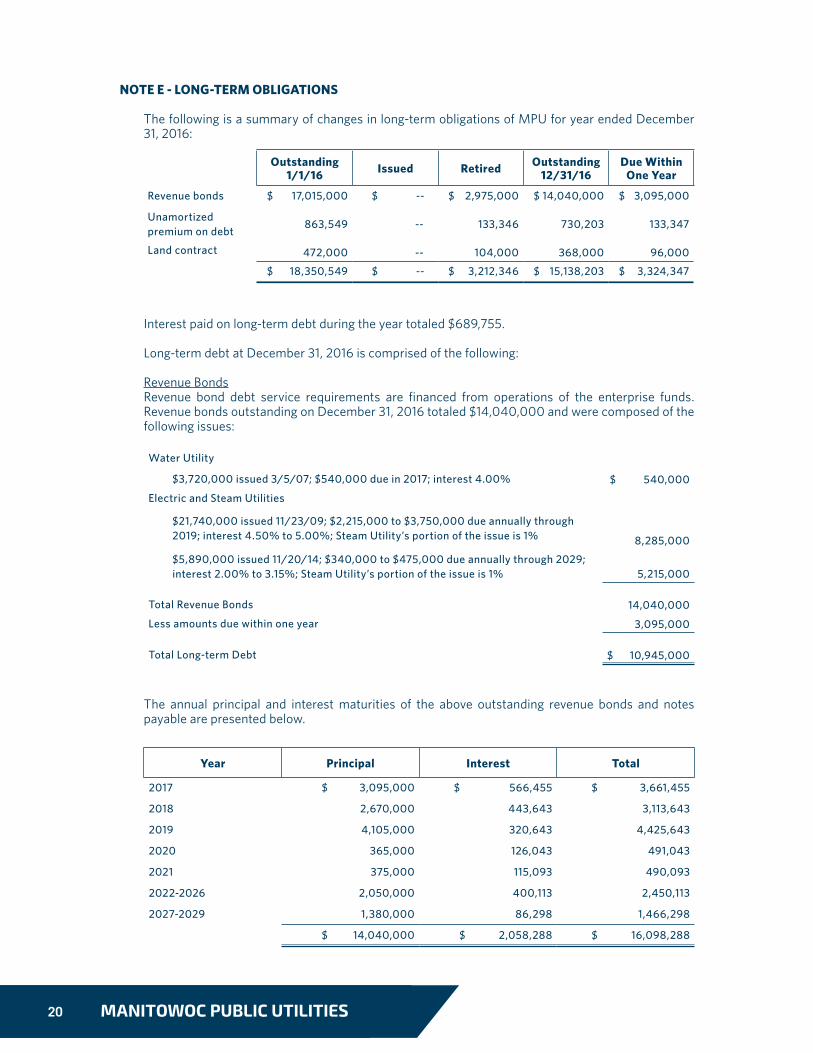
NOTE E - LONG-TERM OBLIGATIONS
The following is a summary of changes in long-term obligations of MPU for year ended December 31, 2016:
Interest paid on long-term debt during the year totaled $689,755.
Long-term debt at December 31, 2016 is comprised of the following:
Revenue BondsRevenue bond debt service requirements are financed from operations of the enterprise funds. Revenue bonds outstanding on December 31, 2016 totaled $14,040,000 and were composed of the following issues:
The annual principal and interest maturities of the above outstanding revenue bonds and notes payable are presented below.
Outstanding 1/1/16 Issued Retired Outstanding
12/31/16Due Within
One Year
Revenue bonds $ 17,015,000 $ -- $ 2,975,000 $ 14,040,000 $ 3,095,000
Unamortized premium on debt
863,549 -- 133,346 730,203 133,347
Land contract 472,000 -- 104,000 368,000 96,000
$ 18,350,549 $ -- $ 3,212,346 $ 15,138,203 $ 3,324,347
Water Utility
$3,720,000 issued 3/5/07; $540,000 due in 2017; interest 4.00% $ 540,000
Electric and Steam Utilities
$21,740,000 issued 11/23/09; $2,215,000 to $3,750,000 due annually through 2019; interest 4.50% to 5.00%; Steam Utility’s portion of the issue is 1% 8,285,000
$5,890,000 issued 11/20/14; $340,000 to $475,000 due annually through 2029; interest 2.00% to 3.15%; Steam Utility’s portion of the issue is 1% 5,215,000
Total Revenue Bonds 14,040,000
Less amounts due within one year 3,095,000
Total Long-term Debt $ 10,945,000
Year Principal Interest Total
2017 $ 3,095,000 $ 566,455 $ 3,661,455
2018 2,670,000 443,643 3,113,643
2019 4,105,000 320,643 4,425,643
2020 365,000 126,043 491,043
2021 375,000 115,093 490,093
2022-2026 2,050,000 400,113 2,450,113
2027-2029 1,380,000 86,298 1,466,298
$ 14,040,000 $ 2,058,288 $ 16,098,288
21FOCUSED ON CORE VALUES
MPU has pledged future customer revenues, net of specified operating expenses, to repay the water and electric system revenue bonds. Proceeds from the bonds provided financing for the construction or acquisition of capital assets used by MPU. The bonds are payable solely from customer net revenues and are payable as detailed above. The total principal and interest remaining to be paid on the water bonds is $550,800. Principal and interest paid for the current year and customer net revenues were $552,000 and $3,277,379 respectively. The total principal and interest to be paid on the electric and steam bonds is $15,547,488. Principal and interest paid for the current year and customer net revenues were $3,112,755 and $15,515,811, respectively.
NOTE F - PENSION PLAN
1. Pension PlanMPU participates in the Wisconsin Retirement System (WRS) through its fiscal agent, the City of Manitowoc. As a result, required contributions of MPU are included with the City’s WRS contributions. MPU’s proportionate share of the net pension liability (asset) and corresponding deferred outflows/inflows of the City of Manitowoc are reported in MPU’s financial statements.
a. Plan Description
The WRS is a cost-sharing, multiple-employer, defined benefit pension plan. WRS benefits and other plan provisions are established by Chapter 40 of the Wisconsin Statutes. Benefit terms may only be modified by the legislature. The retirement system is administered by the Wisconsin Department of Employee Trust Funds (ETF). The system provides coverage to all eligible State of Wisconsin, local government and other public employees. All employees, initially employed by a participating WRS employer on or after July 1, 2011, and expected to work at least 1200 hours a year (880 hours for teachers and school district educational support employees) and expected to be employed for at least one year from employee’s date of hire are eligible to participate in the WRS.
For employees beginning participation on or after January 1, 1990, and no longer actively employed on or after April 24, 1998, creditable service in each of five years is required for eligibility for a retirement annuity. Participants employed prior to 1990 and on or after April 24, 1998, and prior to July 1, 2011, are immediately vested. Participants who initially became WRS eligible on or after July 1, 2011, must have five years of creditable service to be vested.
Employees who retire at or after age 65 (54 for protective occupation employees, 62 for elected officials and State executive participants) are entitled to receive an unreduced retirement benefit. The factors influencing the benefit are: (1) final average earnings, (2) years of creditable service, and (3) a formula factor.
Final average earnings is the average of the participant’s three highest years’ earnings. Creditable service is the creditable current and prior service expressed in years or decimal equivalents of partial years for which a participant receives earnings and makes contributions as required. The formula factor is a standard percentage based on employment category.
Employees may retire at age 55 (50 for protective occupation employees) and receive reduced benefits. Employees terminating covered employment before becoming eligible for a retirement benefit may withdraw their contributions and forfeit all rights to any subsequent benefits.
The WRS also provides death and disability benefits for employees.
b. Post-Retirement Adjustments
The Employee Trust Funds Board may periodically adjust annuity payments from the retirement system based on annual investment performance in accordance with s. 40.27, Wis. Stat. An increase (or decrease) in annuity payments may result when investment gains (losses), together with other actuarial experience factors, create a surplus (shortfall) in the reserves, as determined by the system’s consulting actuary. Annuity increases are not based on cost of
NOTE E - LONG-TERM OBLIGATIONS (Continued)
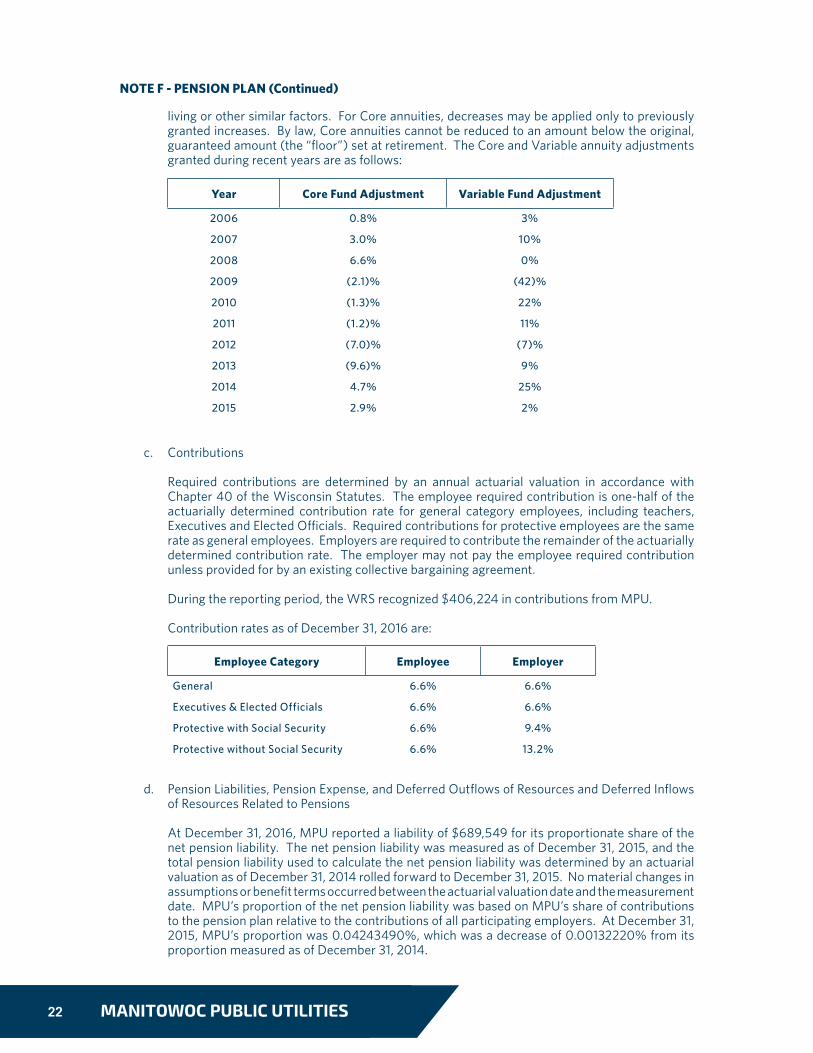
22 MANITOWOC PUBLIC UTILITIES
living or other similar factors. For Core annuities, decreases may be applied only to previously granted increases. By law, Core annuities cannot be reduced to an amount below the original, guaranteed amount (the “floor”) set at retirement. The Core and Variable annuity adjustments granted during recent years are as follows:
c. Contributions
Required contributions are determined by an annual actuarial valuation in accordance with Chapter 40 of the Wisconsin Statutes. The employee required contribution is one-half of the actuarially determined contribution rate for general category employees, including teachers, Executives and Elected Officials. Required contributions for protective employees are the same rate as general employees. Employers are required to contribute the remainder of the actuarially determined contribution rate. The employer may not pay the employee required contribution unless provided for by an existing collective bargaining agreement.
During the reporting period, the WRS recognized $406,224 in contributions from MPU.
Contribution rates as of December 31, 2016 are:
d. Pension Liabilities, Pension Expense, and Deferred Outflows of Resources and Deferred Inflows of Resources Related to Pensions
At December 31, 2016, MPU reported a liability of $689,549 for its proportionate share of the net pension liability. The net pension liability was measured as of December 31, 2015, and the total pension liability used to calculate the net pension liability was determined by an actuarial valuation as of December 31, 2014 rolled forward to December 31, 2015. No material changes in assumptions or benefit terms occurred between the actuarial valuation date and the measurement date. MPU’s proportion of the net pension liability was based on MPU’s share of contributions to the pension plan relative to the contributions of all participating employers. At December 31, 2015, MPU’s proportion was 0.04243490%, which was a decrease of 0.00132220% from its proportion measured as of December 31, 2014.
Year Core Fund Adjustment Variable Fund Adjustment
2006 0.8% 3%
2007 3.0% 10%
2008 6.6% 0%
2009 (2.1)% (42)%
2010 (1.3)% 22%
2011 (1.2)% 11%
2012 (7.0)% (7)%
2013 (9.6)% 9%
2014 4.7% 25%
2015 2.9% 2%
Employee Category Employee Employer
General 6.6% 6.6%
Executives & Elected Officials 6.6% 6.6%
Protective with Social Security 6.6% 9.4%
Protective without Social Security 6.6% 13.2%
NOTE F - PENSION PLAN (Continued)

23FOCUSED ON CORE VALUES
For the year ended December 31, 2016, MPU recognized pension expense of $860,562.
At December 31, 2016, the MPU reported deferred outflows of resources and deferred inflows of resources related to pensions from the following sources:
$400,608 reported as deferred outflows related to pension resulting from MPU’s contributions subsequent to the measurement date will be recognized as a reduction of the net pension liability in the year ended December 31, 2017. Other amounts reported as deferred outflows of resources related to pension will be recognized in pension expense as follows:
e. Actuarial Assumption
The total pension liability in the December 31, 2014, actuarial valuation was determined using the following actuarial assumptions, applied to all periods included in the measurement:
* No post-retirement adjustment is guaranteed. Actual adjustments are based on recognized investment return, actuarial experience and other factors. 2.1% is the assumed annual adjustment based on the investment return assumption and the post-retirement discount rate.
Deferred Outflows of Resources
Deferred Inflows of Resources
Differences between expected and actual experience $ 116,652 $ 1,451,114
Net differences between projected and actual earnings on pension plan investments 482,439 --
Changes in proportion and differences between employer contributions and proportionate share of contributions 84,133 --
Employer contributions subsequent to the measurement date 400,608 --
Total $ 3,907,043 $ 1,451,144
Year ended December 31
Deferred Outflows of Resources
Deferred Inflows of Resources
2016 $ 912,037 $ 351,180
2017 912,037 351,180
2018 912,037 351,180
2019 754,065 351,180
2020 16,259 46,424
Total $ 3,506,435 $ 1,451,144
NOTE F - PENSION PLAN (Continued)
Actuarial Valuation Date: December 31, 2014
Measurement Date of Net Pension Asset: December 31, 2015
Actuarial Cost Method: Entry Age
Asset Valuation Method: Fair Value
Long-Term Expected Rate of Return: 7.2%
Discount Rate: 7.2%
Salary Increases:
Inflation 3.2%
Seniority/Merit 0.2 – 5.6%
Mortality: Wisconsin 2012 Mortality Table
Post-retirement Adjustments* 2.1%
24 MANITOWOC PUBLIC UTILITIES
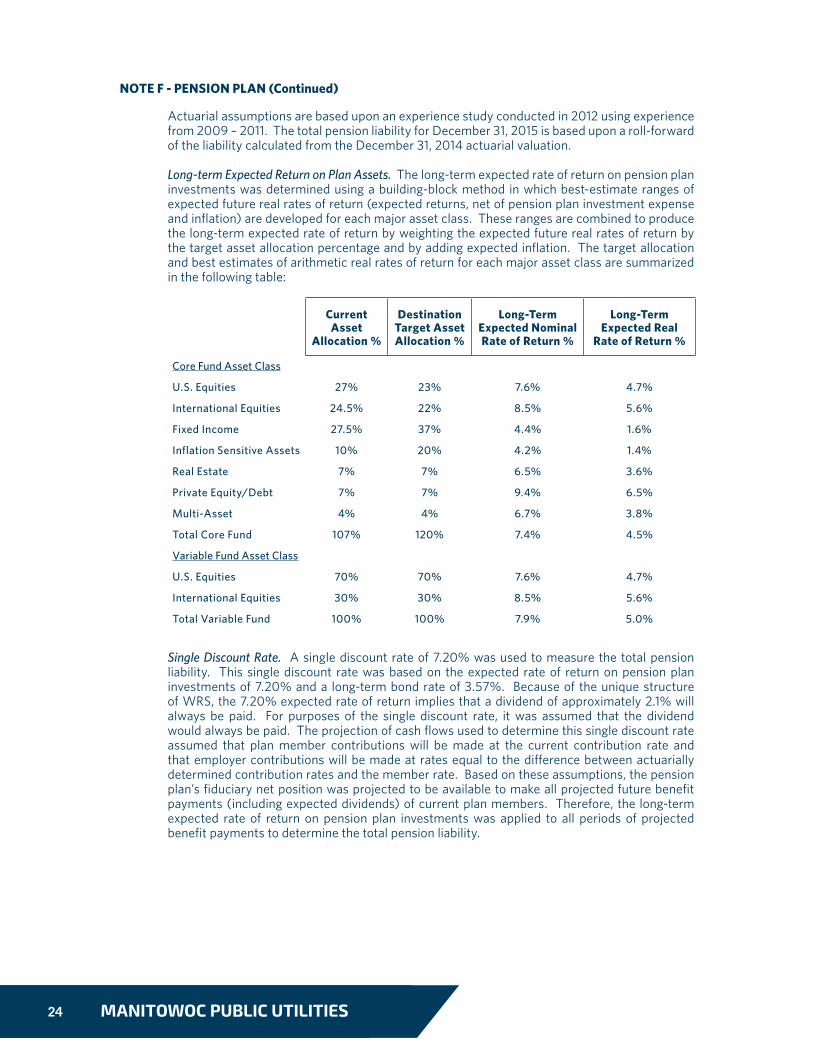
Actuarial assumptions are based upon an experience study conducted in 2012 using experience from 2009 – 2011. The total pension liability for December 31, 2015 is based upon a roll-forward of the liability calculated from the December 31, 2014 actuarial valuation.
Long-term Expected Return on Plan Assets. The long-term expected rate of return on pension plan investments was determined using a building-block method in which best-estimate ranges of expected future real rates of return (expected returns, net of pension plan investment expense and inflation) are developed for each major asset class. These ranges are combined to produce the long-term expected rate of return by weighting the expected future real rates of return by the target asset allocation percentage and by adding expected inflation. The target allocation and best estimates of arithmetic real rates of return for each major asset class are summarized in the following table:
Single Discount Rate. A single discount rate of 7.20% was used to measure the total pension liability. This single discount rate was based on the expected rate of return on pension plan investments of 7.20% and a long-term bond rate of 3.57%. Because of the unique structure of WRS, the 7.20% expected rate of return implies that a dividend of approximately 2.1% will always be paid. For purposes of the single discount rate, it was assumed that the dividend would always be paid. The projection of cash flows used to determine this single discount rate assumed that plan member contributions will be made at the current contribution rate and that employer contributions will be made at rates equal to the difference between actuarially determined contribution rates and the member rate. Based on these assumptions, the pension plan’s fiduciary net position was projected to be available to make all projected future benefit payments (including expected dividends) of current plan members. Therefore, the long-term expected rate of return on pension plan investments was applied to all periods of projected benefit payments to determine the total pension liability.
Current Asset
Allocation %
Destination Target Asset Allocation %
Long-Term Expected Nominal Rate of Return %
Long-Term Expected Real
Rate of Return %
Core Fund Asset Class
U.S. Equities 27% 23% 7.6% 4.7%
International Equities 24.5% 22% 8.5% 5.6%
Fixed Income 27.5% 37% 4.4% 1.6%
Inflation Sensitive Assets 10% 20% 4.2% 1.4%
Real Estate 7% 7% 6.5% 3.6%
Private Equity/Debt 7% 7% 9.4% 6.5%
Multi-Asset 4% 4% 6.7% 3.8%
Total Core Fund 107% 120% 7.4% 4.5%
Variable Fund Asset Class
U.S. Equities 70% 70% 7.6% 4.7%
International Equities 30% 30% 8.5% 5.6%
Total Variable Fund 100% 100% 7.9% 5.0%
NOTE F - PENSION PLAN (Continued)
25FOCUSED ON CORE VALUES
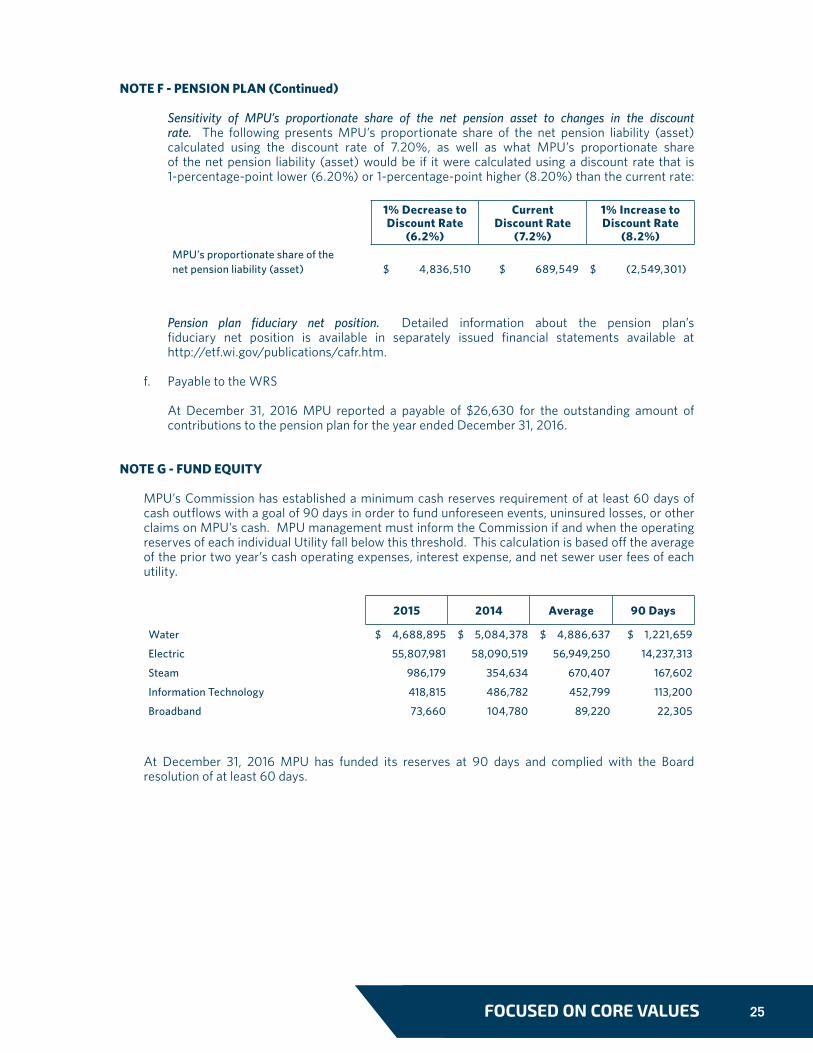
Sensitivity of MPU’s proportionate share of the net pension asset to changes in the discount rate. The following presents MPU’s proportionate share of the net pension liability (asset) calculated using the discount rate of 7.20%, as well as what MPU’s proportionate share of the net pension liability (asset) would be if it were calculated using a discount rate that is 1-percentage-point lower (6.20%) or 1-percentage-point higher (8.20%) than the current rate:
Pension plan fiduciary net position. Detailed information about the pension plan’s fiduciary net position is available in separately issued financial statements available at http://etf.wi.gov/publications/cafr.htm.
f. Payable to the WRS
At December 31, 2016 MPU reported a payable of $26,630 for the outstanding amount of contributions to the pension plan for the year ended December 31, 2016.
NOTE G - FUND EQUITY
MPU’s Commission has established a minimum cash reserves requirement of at least 60 days of cash outflows with a goal of 90 days in order to fund unforeseen events, uninsured losses, or other claims on MPU’s cash. MPU management must inform the Commission if and when the operating reserves of each individual Utility fall below this threshold. This calculation is based off the average of the prior two year’s cash operating expenses, interest expense, and net sewer user fees of each utility.
At December 31, 2016 MPU has funded its reserves at 90 days and complied with the Board resolution of at least 60 days.
2015 2014 Average 90 Days
Water $ 4,688,895 $ 5,084,378 $ 4,886,637 $ 1,221,659
Electric 55,807,981 58,090,519 56,949,250 14,237,313
Steam 986,179 354,634 670,407 167,602
Information Technology 418,815 486,782 452,799 113,200
Broadband 73,660 104,780 89,220 22,305
1% Decrease to Discount Rate
(6.2%)
Current Discount Rate
(7.2%)
1% Increase to Discount Rate
(8.2%)MPU’s proportionate share of the net pension liability (asset) $ 4,836,510 $ 689,549 $ (2,549,301)
NOTE F - PENSION PLAN (Continued)
26 MANITOWOC PUBLIC UTILITIES
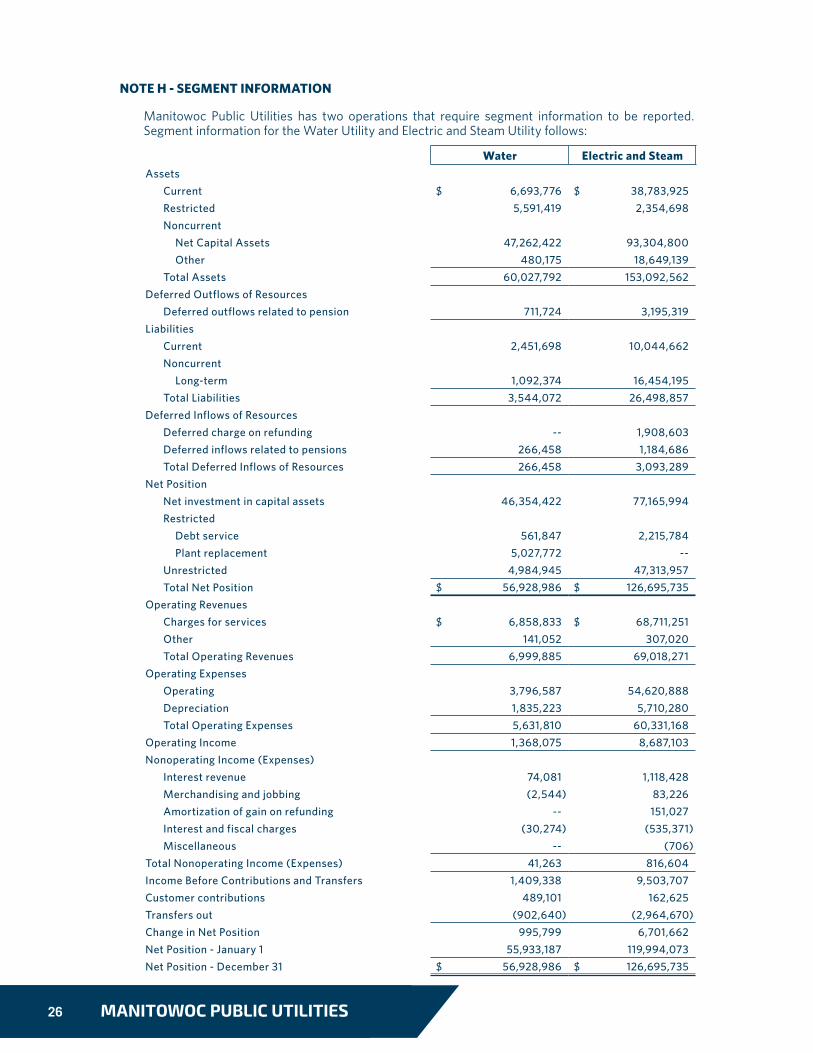
Manitowoc Public Utilities has two operations that require segment information to be reported. Segment information for the Water Utility and Electric and Steam Utility follows:
Water Electric and SteamAssets
Current $ 6,693,776 $ 38,783,925Restricted 5,591,419 2,354,698Noncurrent
Net Capital Assets 47,262,422 93,304,800Other 480,175 18,649,139
Total Assets 60,027,792 153,092,562Deferred Outflows of Resources
Deferred outflows related to pension 711,724 3,195,319Liabilities
Current 2,451,698 10,044,662Noncurrent
Long-term 1,092,374 16,454,195Total Liabilities 3,544,072 26,498,857
Deferred Inflows of ResourcesDeferred charge on refunding -- 1,908,603Deferred inflows related to pensions 266,458 1,184,686Total Deferred Inflows of Resources 266,458 3,093,289
Net PositionNet investment in capital assets 46,354,422 77,165,994Restricted
Debt service 561,847 2,215,784Plant replacement 5,027,772 --
Unrestricted 4,984,945 47,313,957Total Net Position $ 56,928,986 $ 126,695,735
Operating RevenuesCharges for services $ 6,858,833 $ 68,711,251Other 141,052 307,020Total Operating Revenues 6,999,885 69,018,271
Operating ExpensesOperating 3,796,587 54,620,888Depreciation 1,835,223 5,710,280Total Operating Expenses 5,631,810 60,331,168
Operating Income 1,368,075 8,687,103Nonoperating Income (Expenses)
Interest revenue 74,081 1,118,428Merchandising and jobbing (2,544) 83,226Amortization of gain on refunding -- 151,027Interest and fiscal charges (30,274) (535,371)Miscellaneous -- (706)
Total Nonoperating Income (Expenses) 41,263 816,604Income Before Contributions and Transfers 1,409,338 9,503,707Customer contributions 489,101 162,625Transfers out (902,640) (2,964,670)Change in Net Position 995,799 6,701,662Net Position - January 1 55,933,187 119,994,073Net Position - December 31 $ 56,928,986 $ 126,695,735
NOTE H - SEGMENT INFORMATION
27FOCUSED ON CORE VALUES
NOTE I - OTHER POST-EMPLOYMENT BENEFITS
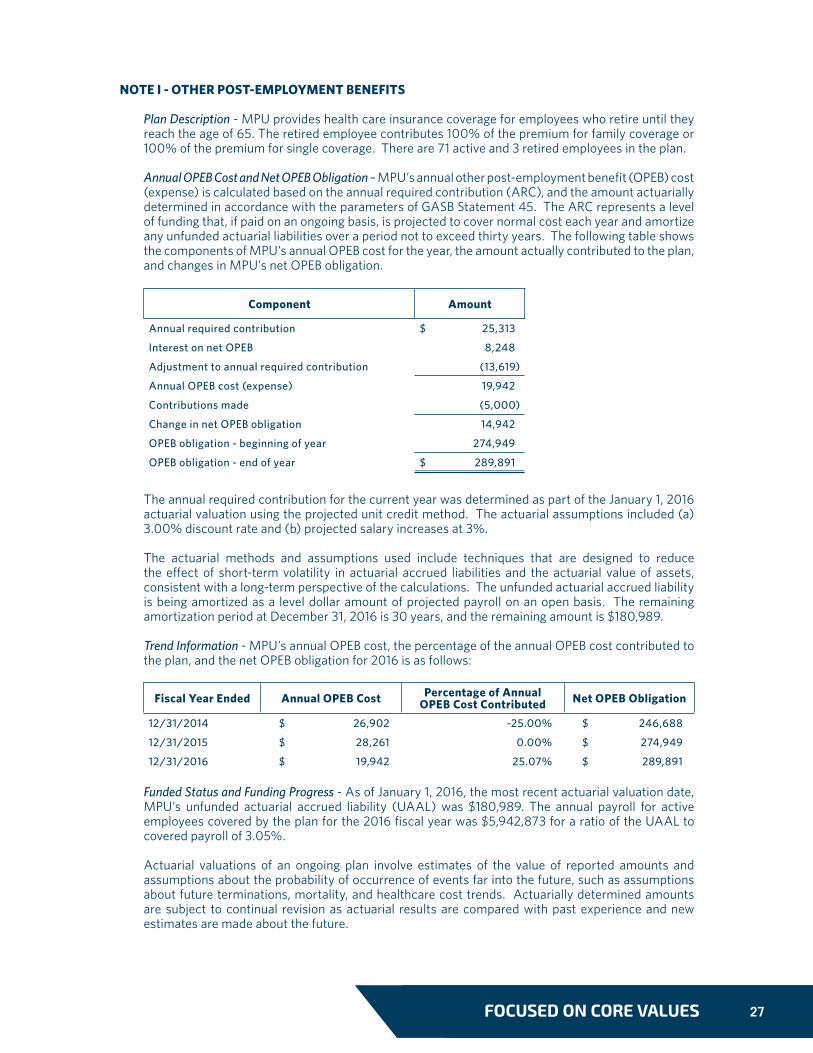
Plan Description - MPU provides health care insurance coverage for employees who retire until they reach the age of 65. The retired employee contributes 100% of the premium for family coverage or 100% of the premium for single coverage. There are 71 active and 3 retired employees in the plan.
Annual OPEB Cost and Net OPEB Obligation – MPU’s annual other post-employment benefit (OPEB) cost (expense) is calculated based on the annual required contribution (ARC), and the amount actuarially determined in accordance with the parameters of GASB Statement 45. The ARC represents a level of funding that, if paid on an ongoing basis, is projected to cover normal cost each year and amortize any unfunded actuarial liabilities over a period not to exceed thirty years. The following table shows the components of MPU’s annual OPEB cost for the year, the amount actually contributed to the plan, and changes in MPU’s net OPEB obligation.
The annual required contribution for the current year was determined as part of the January 1, 2016 actuarial valuation using the projected unit credit method. The actuarial assumptions included (a) 3.00% discount rate and (b) projected salary increases at 3%.
The actuarial methods and assumptions used include techniques that are designed to reduce the effect of short-term volatility in actuarial accrued liabilities and the actuarial value of assets, consistent with a long-term perspective of the calculations. The unfunded actuarial accrued liability is being amortized as a level dollar amount of projected payroll on an open basis. The remaining amortization period at December 31, 2016 is 30 years, and the remaining amount is $180,989.
Trend Information - MPU’s annual OPEB cost, the percentage of the annual OPEB cost contributed to the plan, and the net OPEB obligation for 2016 is as follows:
Funded Status and Funding Progress - As of January 1, 2016, the most recent actuarial valuation date, MPU’s unfunded actuarial accrued liability (UAAL) was $180,989. The annual payroll for active employees covered by the plan for the 2016 fiscal year was $5,942,873 for a ratio of the UAAL to covered payroll of 3.05%.
Actuarial valuations of an ongoing plan involve estimates of the value of reported amounts and assumptions about the probability of occurrence of events far into the future, such as assumptions about future terminations, mortality, and healthcare cost trends. Actuarially determined amounts are subject to continual revision as actuarial results are compared with past experience and new estimates are made about the future.
Component Amount
Annual required contribution $ 25,313
Interest on net OPEB 8,248
Adjustment to annual required contribution (13,619)
Annual OPEB cost (expense) 19,942
Contributions made (5,000)
Change in net OPEB obligation 14,942
OPEB obligation - beginning of year 274,949
OPEB obligation - end of year $ 289,891
Fiscal Year Ended Annual OPEB Cost Percentage of Annual OPEB Cost Contributed Net OPEB Obligation
12/31/2014 $ 26,902 -25.00% $ 246,688
12/31/2015 $ 28,261 0.00% $ 274,949
12/31/2016 $ 19,942 25.07% $ 289,891
28 MANITOWOC PUBLIC UTILITIES
Actuarial Methods and Assumptions - Projections of benefits for financial reporting purposes are based on the substantive plan (the plan as understood by the employer and plan members) and include the types of benefits provided at the time of each valuation and the historical pattern of sharing of benefit costs between the employer and plan members to that point. The actuarial methods and assumptions used include techniques that are designed to reduce the effect of short-term volatility in actuarial accrued liabilities and the actuarial value of assets, consistent with the long-term perspective of the calculations.
In the January 1, 2016 actuarial valuation, the projected unit credit method was used. The actuarial assumptions included a rate of 3.00% to discount expected liabilities to the valuation date. The initial healthcare trend rate was 6.60%, reduced by decrements to an ultimate rate of 4.00% in 2085. The UAAL is being amortized as a level percentage of projected payrolls on an open basis. The remaining amortization period at December 31, 2016 was 30 years.
NOTE J - RISK MANAGEMENT
MPU has purchased commercial insurance policies for various risks of loss related to torts; theft, damage or destruction of assets; errors or omissions; injuries to employees; or acts of God. Payment of premiums for these policies is recorded as expenses of the Utilities.
NOTE K - MAJOR POWER SUPPLY CONTRACT ACTIVITIES
MPU is a summer peaking utility. Starting October 1, 2011, MPU entered into a new 10 year contract with Great Lakes Utilities (GLU) where MPU received up to 77MW’s of capacity and associated energy. As part of this contract, MPU also sold the capacity and associated energy from its steam generation units to GLU..
NOTE L - CONTINGENT LIABILITIES
From time to time, MPU is party to various pending claims and legal proceedings. Although the outcome of such matters cannot be forecast with certainty, it is the opinion of management that the likelihood is remote that any such claims or proceedings will have a material adverse effect on MPU’s financial position or results of operations.
NOTE I - OTHER POST-EMPLOYMENT BENEFITS (Continued)
29FOCUSED ON CORE VALUES
NOTE M - RELATED PARTY TRANSACTIONS
Great Lakes Utilities (GLU) has contracted with MPU, one of its members, to provide management, secretarial, accounting and technical support services. GLU is charged for these services based upon actual time spent by MPU personnel on GLU operations. GLU is then billed for these services based upon contracted hourly rates.
NOTE N - CUMULATIVE EFFECT OF CHANGE IN ACCOUNTING PRINCIPLES
In June 2015, the GASB issued two new standards addressing accounting and financial reporting for post-employment benefits other than pensions (OPEB). GASB Statement No. 74, Financial Reporting for Post-employment Benefit Plans Other Than Pension Plans, addresses reporting by OPEB plans whereas GASB Statement No. 75, Accounting and Financial Reporting for Post-employment Benefits Other Than Pensions, addresses accounting and reporting by employer governments that provide OPEB benefits to their employees. MPU will, after adoption of GASB No. 75, recognize on the face of the financial statements its net OPEB liability. GASB No. 74 is effective for fiscal years beginning after June 15, 2016 whereas GASB No. 75 is effective one year later. MPU is currently evaluating the impact these standards will have on the financial statements when adopted.
30 MANITOWOC PUBLIC UTILITIES
INDEPENDENT AUDITOR’S REPORT To the Board of Commissioners Manitowoc Public Utilities Manitowoc, Wisconsin
Report on the Financial Statements
We have audited the accompanying financial statements of Manitowoc Public Utilities (“MPU”) as of and for the year ended December 31, 2016, and the related notes to the financial statements, as listed in the table of contents.
Management’s Responsibility for the Financial Statements
Management is responsible for the preparation and fair presentation of these financial statements in accordance with accounting principles generally accepted in the United States of America; this includes the design, implementation, and maintenance of internal control relevant to the preparation and fair presentation of financial statements that are free from material misstatement, whether due to fraud or error.
Auditors’ Responsibility
Our responsibility is to express an opinion on these financial statements based on our audit. We conducted our audit in accordance with auditing standards generally accepted in the United States of America and the standards applicable to financial audits contained in Government Auditing Standards, issued by the Comptroller General of the United States. Those standards require that we plan and perform the audit to obtain reasonable assurance about whether the financial statements are free of material misstatement.
An audit involves performing procedures to obtain audit evidence about the amounts and disclosures in the financial statements. The procedures selected depend on the auditors’ judgment, including the assessment of the risks of material misstatement of the financial statements, whether due to fraud or error. In making those risk assessments, the auditors consider internal control relevant to MPU’s preparation and fair presentation of the financial statements in order to design audit procedures that are appropriate in the circumstances, but not for the purpose of expressing an opinion on the effectiveness of MPU’s internal control. Accordingly, we express no such opinion. An audit also includes evaluating the appropriateness of accounting policies used and the reasonableness of significant accounting estimates made by management, as well as evaluating the overall presentation of the financial statements.
We believe that the audit evidence we have obtained is sufficient and appropriate to provide a basis for our audit opinion.
Opinion
In our opinion, the financial statements referred to above present fairly, in all material respects, the financial position of the MPU as of December 31, 2016 and the changes in financial position and cash flows thereof for the year then ended in accordance with accounting principles generally accepted in the United States of America.
Emphasis of Matters
As described in Note A, the financial statements present only the Manitowoc Public Utilities of the City of Manitowoc, Wisconsin, and do not purport to, and do not present fairly the financial position of the City of Manitowoc, Wisconsin, as of December 31, 2016 and the changes in

31FOCUSED ON CORE VALUES
its financial position or its cash flows for the year then ended in accordance with accounting principles generally accepted in the United States of America. Our opinion is not modified with respect to this matter.
Change in Accounting Principal
As discussed in Note B to the financial statements, in 2016 MPU adopted new accounting guidance, GASB Statement No. 72, Fair Value Measurement and Application. Our opinion is not modified with respect to this matter.
Other Matters
Required Supplementary Information
Accounting principles generally accepted in the United States of America require that the management’s discussion and analysis on pages 3 through 12 and the schedules relating to pensions and other post-employment benefits on pages 36 through 38 be presented to supplement the financial statements. Such information, although not part of the financial statements, is required by the Governmental Accounting Standards Board, who considers it to be an essential part of financial reporting for placing the financial statements in an appropriate operational, economic, or historical context. We have applied certain limited procedures to the required supplementary information in accordance with auditing standards generally accepted in the United States of America, which consisted of inquiries of management about the methods of preparing the information and comparing the information for consistency with management’s response to our inquiries, the financial statements, and other knowledge we obtained during our audit of the financial statements. We do not express an opinion or provide any assurance on the information because the limited procedures do not provide us with sufficient evidence to express an opinion or provide any assurance.
Report on Summarized Financial Information
We have previously audited the Manitowoc Public Utilities’ 2015 financial statements, and our report dated March 30, 2016, expressed an unmodified opinion on those financial statements. In our opinion, the summarized comparative information presented herein as of and for the year ended December 31, 2015, is consistent, in all material respects, with the audited financial statements from which it has been derived.
Other Reporting Required by Government Auditing Standards
In accordance with Government Auditing Standards, we have also issued our report dated March 17, 2017, on our consideration of MPU’s internal control over financial reporting and on our tests of its compliance with certain provisions of laws, regulations, contracts and grant agreements and other matters. The purpose of that report is to describe the scope of our testing of internal control over financial reporting and compliance and the results of that testing, and not to provide an opinion on the internal control over financial reporting or on compliance. That report is an integral part of an audit performed in accordance with Government Auditing Standards in considering MPU’s internal control over financial reporting and compliance.
Certified Public Accountants Green Bay, Wisconsin March 17, 2017


33FOCUSED ON CORE VALUES 33FOCUSED ON CORE VALUES
2016 Commissioners
David Diedrich
Eric Sitkiewitz
Daniel R. Hornung
(Vice President)
David P. Luckow
(President)
Alex Allie
Mayor Justin Nickels
Mark R. Seidl
(Secretary)

Manitowoc Public Utilities 1303 South 8th Street | P.O. Box 1090 | Manitowoc, WI 54221-1090
920.683.4600 | Fax 920.686.4348
www.mpu.org