Embed Size (px)
Citation preview
California Advanced Services Fund
Annual Report January 2013 – December 2013
Issued April 2014
1
Table of Contents
I. EXECUTIVE SUMMARY 2
II. CASF PROGRAM BACKGROUND 4
III. PROGRAM ACCOMPLISHMENTS 6
IV. PROGRAM RESULTS 9
A. AMOUNT AND RECIPIENTS OF FUNDS EXPENDED FROM THE CASF IN 2013 9 B. BENEFITS DERIVED AND BROADBAND ADOPTION LEVELS FROM FUNDS EXPENDED IN 2013 11 C. LEVERAGING PROGRAM FUNDS WITH FEDERAL FUNDS 15 D. BROADBAND AVAILABILITY ESTIMATES 16 E. VARIABILITY IN MOBILE BROADBAND AND ANALYSIS IMPROVEMENTS 27 F. PROJECTED SURCHARGE COLLECTION EACH YEAR THROUGH 2020 TO FUND APPROVED PROJECTS 30
VI. PROGRAM FOCUS FOR 2014 31
ATTACHMENT A – MAP OF COMMISSION APPROVED CONSORTIA GRANTS 33
ATTACHMENT B – SUMMARY OF CASF PROJECT PROPOSALS FUNDING REQUESTS 34
ATTACHMENT C – FEBRUARY 1, 2013 CASF PROJECT PROPOSALS APPROVED 38
ATTACHMENT D – CASF INFRASTRUCTURE GRANTS/LOAN AWARDS 39
ATTACHMENT E - CASF INFRASTRUCTURE GRANT ACCOUNT PROJECT PAYMENTS DETAILS 42
ATTACHMENT F – CASF CONSORTIA GRANT ACCOUNT PROJECT PAYMENTS DETAILS 43
ATTACHMENT G – CONSORTIA ACCOUNT GRANTEE 2013 ANNUAL OUTCOMES 44
ATTACHMENT H – BROADBAND AVAILABILITY PAPER SURVEY 54
ATTACHMENT I – BROADBAND AVAILABILITY VALIDATION METHODS 55
2
I. Executive Summary
The California Public Utilities Commission (CPUC) submits this annual report (pursuant to
California Public Utilities Code Section 281(g)(1)) to summarize accomplishments in calendar year
2013 of the CPUC’s California Advanced Services Fund (CASF) program.1
This report will highlight the amount of funds expended from the CASF in the prior year; the
recipients of funds expended from the CASF;
the geographic regions of the State affected by
funds expended from the CASF; the expected
benefits to be derived from the funds expended
from the CASF; actual broadband adoption
levels from the funds expended from the CASF; the amount of funds expended from the CASF used to
match federal funds; an update on the expenditures from CASF and broadband adoption levels; an
accounting of remaining unserved and underserved areas of the State; and the status of the CASF
balance and the projected amount to be collected in each year through 2020 to fund approved projects.
The CPUC is pleased to report that it continues to make progress toward closing the digital
divide. As of December 31, 2013, a cumulative total of 2,691 new households, 151 businesses, and
208 anchor institutions have broadband access thanks to the CASF. In addition, the regional Consortia
continue to advance initiatives aimed at increasing broadband deployment, access, and adoption in the
geographic regions they represent that include unserved and underserved areas.
Key activities toward helping close the digital divide in 2013 included:
- Review of 30 new Infrastructure Grant Account applications targeting unserved and
underserved areas for the February 1, 2013, application window;
- Approval of Infrastructure Grant Account funding for 11 broadband projects extending high-
speed Internet service to communities in Fresno, Humboldt, Imperial, Kern, Madera,
Mendocino, Placer, San Benito, and Shasta counties;
1 The CPUC’s Communications Division (CD) staff prepared this report.
The CASF promotes deployment
of broadband infrastructure in
unserved and underserved areas
through grants and loans to help
fund eligible projects.
3
- Approval of additional Infrastructure Grant Account funding to complete the Digital 395
Project;
- Rescission of four previously awarded
infrastructure grants to AT&T, thereby
releasing $386,463 of CASF funds for other
applications;
- Monitoring and grant administration of
previously approved awards, 30 from the
Infrastructure Grant Account and 14 from
the Consortia Grant Account2;
- Solicitation of additional comments on issues identified in Order Instituting Rulemaking (R.12-
10-012) to consider the expansion of applicant eligibility for the CASF Infrastructure Grant
and Revolving Loan Accounts to non-Certificate of Public Convenience and Necessity (CPCN)
or Wireless ID Registration (WIR) holders;
- Analysis of Senate Bill (SB) 740 and Assembly Bill (AB) 1299, both pertaining to
enhancements to the CASF program and signed by Governor Edmund G. Brown Jr. on October
3, 2013;
- Solicitation of new CASF Regional Consortia grant applications to award remaining available
funds from the Consortia Account;
As of December 31, 2013, the cumulative total CASF award funding is as follows:
Broadband Infrastructure Grant Account:
The CPUC authorized $80.37 million for 41 projects3 that will benefit up to 278,119
households when completed. Of these households, 15,741 were previously unserved and
262,378 were underserved.
Regional Broadband Consortia Grant Account:
The CPUC authorized $2.85 million for 14 consortia grantees in 2013, and has provided said
grantees with a three-year budget allowance of $8.55 million.
Broadband Infrastructure Revolving Loan Account:
The CPUC authorized $40,977 for one loan awardee in 2013 and continues to review a
remaining $1.5 million in loan applications.
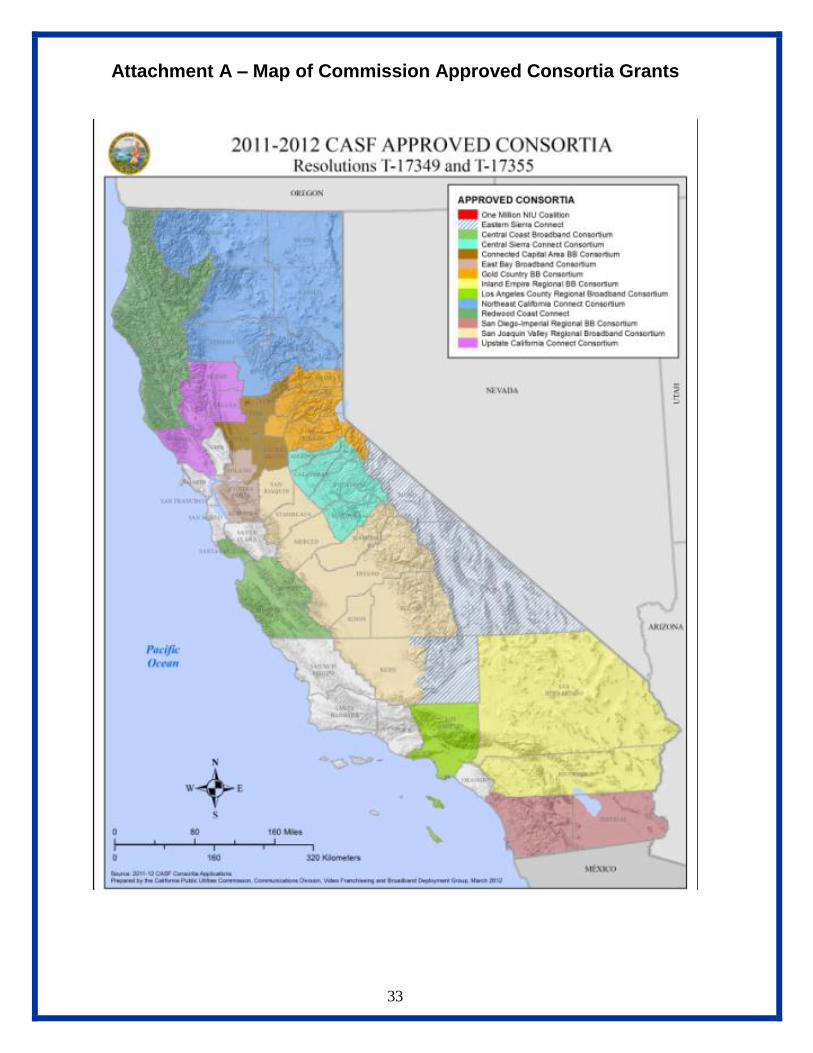
2 Attachment A shows a map of the 14 Consortia approved to date.
3 The Interim Performance Audit Report (Volume I) that the CPUC submitted to the Legislature on April 2011 reported a total
of 41 projects funded under CASF. The CPUC approved three additional projects and rescinded a total of 11 projects in 2011
bringing the total to 33 CASF projects. In 2012, the CPUC approved one additional project netting 34 CASF Infrastructure
Grant Account project. In 2013, the CPUC rescinded a total of 4 projects and approved a total of 11 new projects to date
netting 41 CASF Infrastructure Grant Account projects to date.
Thanks to the CASF, 2,691 new
households, 151 businesses,
and 208 anchor institutions
have broadband access.
4
The following table shows the total funds awarded and expended as of end of calendar year 20134
for each of the CASF sub-accounts:
CASF Sub-Accounts Total Funds Awarded
Total Funds
Expended
(as of 12/31/2013)
Broadband Infrastructure Grant
Account $ 80,374,760 $ 40,714,613
Rural and Urban Regional
Broadband Consortia Grant
Account
$8,546,476
(14 consortia over 3
years)
$ 3,782,025
Broadband Infrastructure Revolving
Loan Account $40,977 $0
Total CASF Funds Awarded $ 88,962,213 $ 44,496,638
CPUC program improvements for 2014 will include:
Identification of priority areas in California;
Implementation of AB 1299 and SB 740 statutory mandates;
Implementation of lowest cost technology to serve priority areas.
II. CASF Program Background
The CASF promotes the deployment of broadband infrastructure in unserved and underserved
areas of the State by providing grants to help fund eligible broadband projects. The CPUC established
the CASF program in Decision (D.) 07-12-054. Senate
Bill 1193 (Stats. 2008, c.393) affirmed the CASF as a
new universal service program geared towards the
deployment of broadband infrastructure in unserved
and underserved areas of California.
On September 25, 2010, Governor Schwarzenegger signed SB 1040 (Stats. 2010, c. 317,
codified at P.U. Code § 281), which extended the CASF indefinitely and expanded it to include three
accounts: 1) the Infrastructure Grant Account, 2) the Consortia Grant Account, and 3) the Revolving
4 Henceforth, reference to 2013 means calendar year 2013 (January 1, 2013 – December 31, 2013).
CASF Accounts:
Infrastructure Grant Account
Consortia Grant Account
Revolving Loan Account
5
Loan Account. The latter two accounts are intended to address the needs that were unmet under the
original CASF program. In particular, the purpose of the Consortia Grant Account is “to fund the cost
of broadband deployment activities other than the capital cost of facilities, as specified by the
Commission.” (P.U. Code § 281(d).) The purpose of the Revolving Loan Account is “to finance capital
costs of broadband facilities not funded by a grant from the Broadband Infrastructure Grant Account.”
(P.U. Code § 281(e).) SB 1040 also expanded the CASF fund from $100 million to $225 million. It
increased the Infrastructure Grant Account with an additional $100 million, and allocated funding of
$10 million and $15 million to the Consortia Grant Account and the Revolving Loan Account,
respectively. (P.U. Code § 281(b)(1).)
Accordingly, in December 2010, the CPUC opened Rulemaking (R.) 10-12-008 to implement
SB 1040 and to enhance the program based on the CPUC’s three-years’ experience in implementing
and administering it. The Rulemaking was divided into two phases: Phase I - Implementation of the
Consortia Grant Account; and Phase II - Implementation of the Revolving Loan Account and
improving the existing Infrastructure Grant Account. The CPUC concluded Phase I of R.10-12-008 in
June 2011 by adopting D.11-06-038, which set eligibility criteria and rules for CASF Consortia Grant
Account. In August 2011, the CPUC launched Phase II of
R.10-12-008 by issuing a ruling soliciting comments on
draft proposals covering proposed revisions to the
application requirements and guidelines of the
Infrastructure Grant Account and proposed implementation
plan for the Revolving Loan Account. After consideration of comments, the Assigned Commissioner
issued a proposed decision in December 2011 and the CPUC adopted D.12-02-015 in February 2012 to
implement new guidelines for the Infrastructure Grant and Revolving Loan Accounts.
6
In October 2012, the CPUC issued R.12-10-
012 proposing to change the CASF eligibility rules to
allow non-CPCN/WIR holders to apply for CASF
grants and loans. The Rulemaking considers what
safeguards should be applied to non-CPCN/WIR
holders given that they are not subject to the CPUC’s
regulatory authority. The CPUC recognized that the change proposed requires legislative action
because the current eligibility requirements are defined by statute. The CPUC planned to seek such
legislation in 2013 and initiated the Rulemaking in anticipation of that effort.
III. Program Accomplishments Throughout 2013, the CASF continued to promote deployment of broadband infrastructure and
advance broadband adoption in unserved and underserved areas of California. The following is a
summary of the CPUC’s key procedural accomplishments in 2013:
The CPUC received 30 project applications for the CASF Broadband Infrastructure Grant
Program and the Revolving Loan Program. February 1, 2013, marked the deadline for
project applications located in underserved areas not previously funded by the CASF and
hybrid projects that cover both unserved and underserved areas. The CPUC received 30
CASF broadband project proposals5 by the deadline. Attachment B provides a list of the
CASF project proposals received. The CPUC’s Communications Division (CD) staff is
completing the review of applications to determine if the projects comply with the
requirements of D.12-02-015. Approval of CASF funding for projects that qualify and meet
the program requirements will be through a CPUC Resolution(s). To date, seven project
applications are on hold or no longer under consideration, the CPUC has approved and
5 CASF project proposal summaries can be found at
http://www.cpuc.ca.gov/PUC/Telco/Information+for+providing+service/Proposed+Areas.htm.
7
adopted 11 projects for CASF funding via CPUC Resolutions, one is currently pending
CPUC vote, and 11 remain under CD staff review6.
The CPUC approved $9,928,715 Infrastructure Grant funding for the Digital 395 Middle
Mile Project. On September 5, 2013, the CPUC approved Resolution T-17408 granting
additional funding to complete the Digital 395 project. This project is a 530-mile, 150-
gigabit high-capacity fiber optic middle mile/backhaul route following U.S. Highway 395
from Barstow to the Nevada State line at Topaz Lake and contains an estimated 28,127
households, 2,571 businesses, and 168 community anchor institutions.
The CPUC approved $30 million in Infrastructure Grant funding for 11 new projects
advancing broadband speeds in unserved and underserved areas of California. From
October to December 2013, the CPUC approved 11 Resolutions awarding Infrastructure
Grant funding to projects bringing high-speed Internet access to 9,837 households in
unserved and underserved areas of the State. The counties benefiting from such projects
include Fresno, Humboldt, Imperial, Kern, Madera, Mendocino, Placer, San Benito, and
Shasta. Attachment C provides a summary of project proposals approved to date.
The CPUC participated in the legislative process that resulted in SB 7407 and AB 1299.
8
During the 2013-14 legislative sessions, the CPUC sought and received a legislative
amendment through SB 740 to expand eligibility for CASF infrastructure grants/loans to
non-telephone corporations. The CPUC also participated in the passage of AB 1299.
Governor Brown signed both SB 740 and AB 1299 on October 3, 2013. SB 740 authorized
the collection of an additional $90 million to be deposited in the Infrastructure Grant
Account, established the goal of the CASF program to approve funding for infrastructure
6 Status of CASF Project Proposals as of December 2013: http://www.cpuc.ca.gov/NR/rdonlyres/CD12A1D1-C220-4448-8370-
A128E82D76F1/0/StatusofCASFApplicationstoOfferBroadband1.docx.
7 SB 740 (Padilla) Stats. 2013 Ch. 522, amending P.U. Code § 281.
8 SB 1299 (Bradford) Stats. 2013 Ch. 507, amending P.U. Code § 281.
8
projects that will provide broadband access to no less than 98 percent of California
household by no later than December 31, 2015, and expanded CASF applicant eligibility to
allow any entity that is not a telephone corporation to apply for CASF grants and loan.9 AB
1299 created an additional account under the CASF called the Broadband Public Housing
Account to support the deployment of broadband networks and adoption programs in
eligible publicly supported communities. These efforts will be funded through $20 million
from the CASF Broadband Infrastructure Grant Account and $5 million from the Broadband
Revolving Loan Account, respectively. The CPUC will undertake activities in 2014 to
implement these new CASF requirements.
The CPUC solicited additional comments on issues identified in R.12-10-012. On March 18,
2013, the CPUC issued a Ruling soliciting additional comments on the issues identified in
R.12-10-012 that include adopting a bifurcated bond requirement: a bond covering the
construction phase of the project (performance bond) and a bond covering the post-
construction phase of the project (compliance bond). The Ruling also sought comments on
how the CPUC might structure the bifurcated bond
requirement and whether it is necessary to require non-
CPCN/WIR grantees to maintain a bond equal to the full
amount of a CASF award once a funded project has been
completed. Comments received from parties, however,
did not address how the CPUC might structure a
bifurcated bond requirement or if in fact an entity would
be able to obtain such a bond from a surety company,
regardless of the amount. Due to concerns about whether
9 The applicant must satisfy the CASF’s eligibility requirements, any other requirements as defined by the CPUC, and all
requirements identified in SB 740.
9
entities could in fact obtain a post-construction phase compliance bond from a surety
company, CD staff conducted independent research by reaching out to two surety
companies10
to discuss the requirements of a post-construction phase bond. Consequently,
on January 6, 2014, the Assigned Commissioner issued a proposed decision that implements
the revised eligibility rules for the CASF program given the passage of SB 740 and with it,
additional safeguards for non-telephone corporations applying for CASF funding to ensure
ratepayer funds are protected, which the Commission adopted on February 27, 2014 (D.14-
02-018).
IV. Program Results
The following section presents the data required from the CASF in accordance with Section
281(g)(1) of the Public Utilities Code.
A. Amount and Recipients of Funds Expended from the CASF in 2013
Through the end of 2013, the CPUC has collected an estimated total of $157.79 million
from the CASF surcharges11
on revenues collected by carriers from end-users for intrastate
telecommunications services. The following table summarizes the CASF program revenues and
expenditures:
10
The surety companies have in the past engaged with unregulated American Recovery and Reinvestment Act grantees that
received CASF awards to try to fulfill a similar bond requirement and therefore are somewhat familiar with the CASF program
and its requirements. 11
The CPUC established a 0.25 percent CASF surcharge effective January 2008 to fund $100 million to the CASF program.
On December 17, 2009, the CPUC approved Resolution T-17248, which reduced the CASF surcharge from 0.25 percent to 0
effective January 1, 2010. In September 2011, the CPUC issued Resolution T-17343 to re-establish the surcharge collection to
fund the CASF as a result of the SB 1040 expansion of the program from $100 million to $225 million. In February 2013 the
CPUC approved Resolution T-17386, which increased the CASF surcharge from 0.14 percent to 0.164 percent. The current
CASF surcharge is established at 0.164 percent effective April 1, 2013.
10
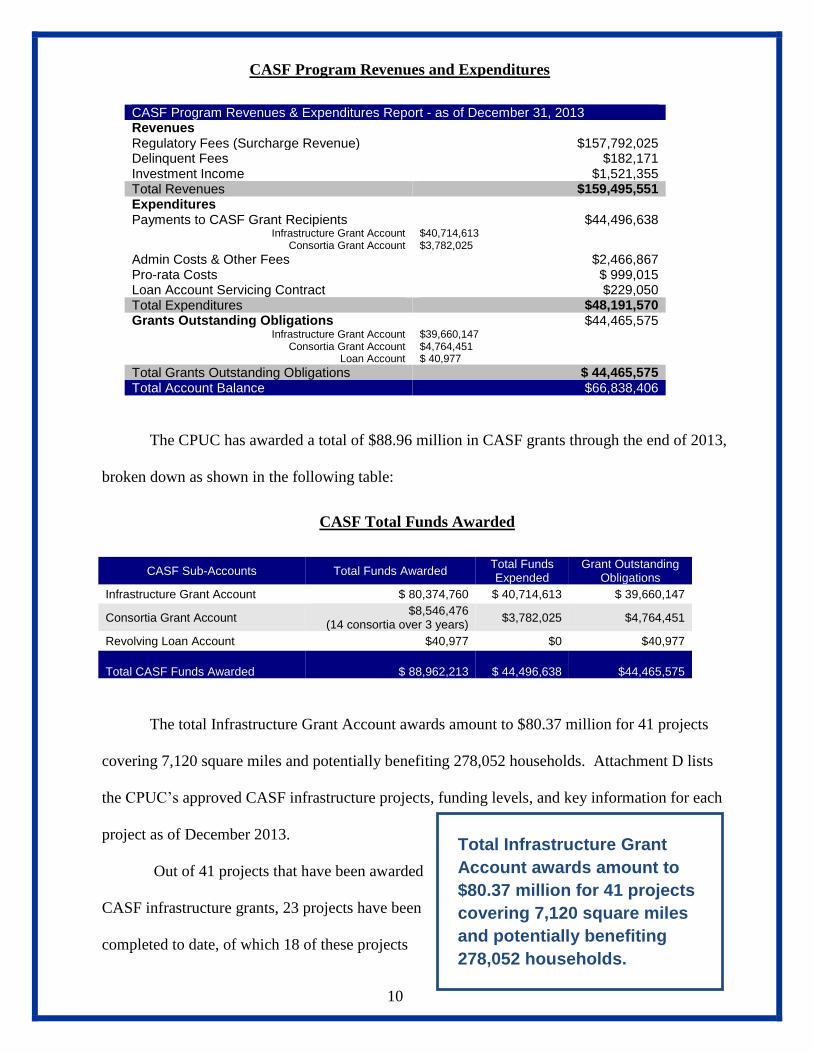
CASF Program Revenues and Expenditures
CASF Program Revenues & Expenditures Report - as of December 31, 2013 Revenues Regulatory Fees (Surcharge Revenue) $157,792,025 Delinquent Fees $182,171 Investment Income $1,521,355 Total Revenues $159,495,551 Expenditures Payments to CASF Grant Recipients
Infrastructure Grant Account Consortia Grant Account
$44,496,638 $40,714,613 $3,782,025
Admin Costs & Other Fees $2,466,867 Pro-rata Costs $ 999,015 Loan Account Servicing Contract $229,050 Total Expenditures $48,191,570 Grants Outstanding Obligations
Infrastructure Grant Account Consortia Grant Account
Loan Account
$44,465,575 $39,660,147 $4,764,451 $ 40,977
Total Grants Outstanding Obligations $ 44,465,575 Total Account Balance $66,838,406
The CPUC has awarded a total of $88.96 million in CASF grants through the end of 2013,
broken down as shown in the following table:
CASF Total Funds Awarded
CASF Sub-Accounts Total Funds Awarded Total Funds Expended
Grant Outstanding Obligations
Infrastructure Grant Account $ 80,374,760 $ 40,714,613 $ 39,660,147
Consortia Grant Account $8,546,476
(14 consortia over 3 years) $3,782,025 $4,764,451
Revolving Loan Account $40,977 $0 $40,977
Total CASF Funds Awarded $ 88,962,213 $ 44,496,638
$44,465,575
The total Infrastructure Grant Account awards amount to $80.37 million for 41 projects
covering 7,120 square miles and potentially benefiting 278,052 households. Attachment D lists
the CPUC’s approved CASF infrastructure projects, funding levels, and key information for each
project as of December 2013.
Out of 41 projects that have been awarded
CASF infrastructure grants, 23 projects have been
completed to date, of which 18 of these projects
Total Infrastructure Grant
Account awards amount to
$80.37 million for 41 projects
covering 7,120 square miles
and potentially benefiting
278,052 households.
11
have requested payment from the CASF. In addition, three projects that are in-progress have
requested payment from the fund, netting to a total of 21 projects for which CASF has expended
funds in the amount of $40.71 million. Specifically in 2013, six out of the 21 projects have
requested payment from the fund amounting to $25.90 million. The actual project costs for 12
completed projects were lower than projected; hence, the CASF payments for these projects were
below the awarded amounts. As a result, the CPUC can disencumber those funds12
and make them
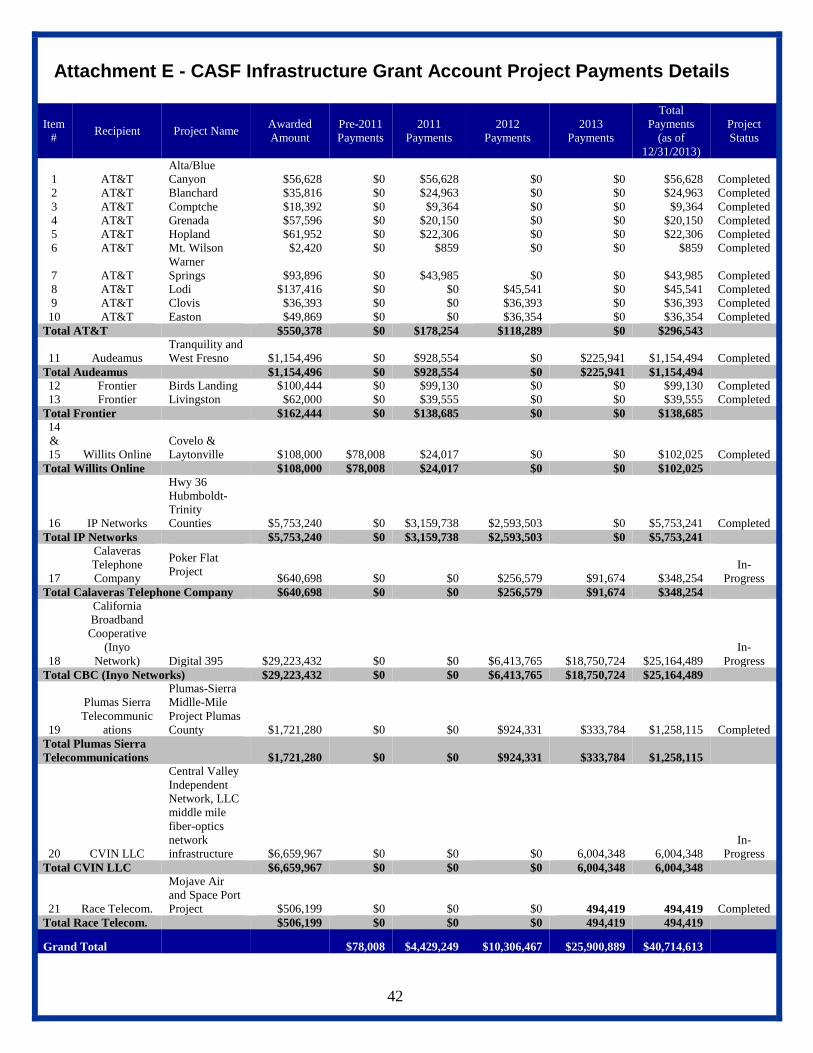
available for future eligible broadband projects and applicants. Attachment E provides detail
information on the amounts and recipients of funds expended from the Infrastructure Grant
Account through 2013.
The total Consortia Grant Account awards amount to $8.55 million13
for 14 consortia
groups advancing broadband deployment, access and adoption in counties throughout the State
from January 2012 through February 2015. To date, payment from the fund amounts to a total of
$3.78 million, of which $2.62 million represents payments made in 2013. Attachment F provides
detailed information on the amounts and recipients of funds expended from the Consortia Grant
Account through 2013.
B. Benefits Derived and Broadband Adoption Levels From Funds Expended in 2013
Out of the 21 projects for which the CPUC expended CASF Infrastructure Grant funds
through 2013, 18 are completed and three are in progress towards delivering broadband
connectivity benefits to the following counties: Amador, Calaveras, Colusa, El Dorado, Fresno,
Humboldt, Inyo, Kern, Kings, Lassen, Los Angeles, Madera, Mariposa, Mendocino, Merced,
Mono, Nevada, Placer, Plumas, San Bernardino, San Diego, San Joaquin, Sierra, Siskiyou, Solano,
Sonoma, Stanislaus, Sutter, Tranquility, Trinity, Tulare, Tuolumne, and Yuba. Additionally, eight
12
A total of $295,348 amounted in CASF fund savings from 12 projects that were completed under-budget. 13
The total funding includes budget allowances over a three-year funding period and supplemental funding to attend the annual
Regional Consortia Learning Community Summit.
12
projects (five completed and three in progress) have not yet submitted payment request(s) to CASF
are delivering broadband connectivity benefits to the following counties: Alpine, Del Norte, Mono,
Monterey, Plumas, Riverside, San Bernardino, and Sonoma.
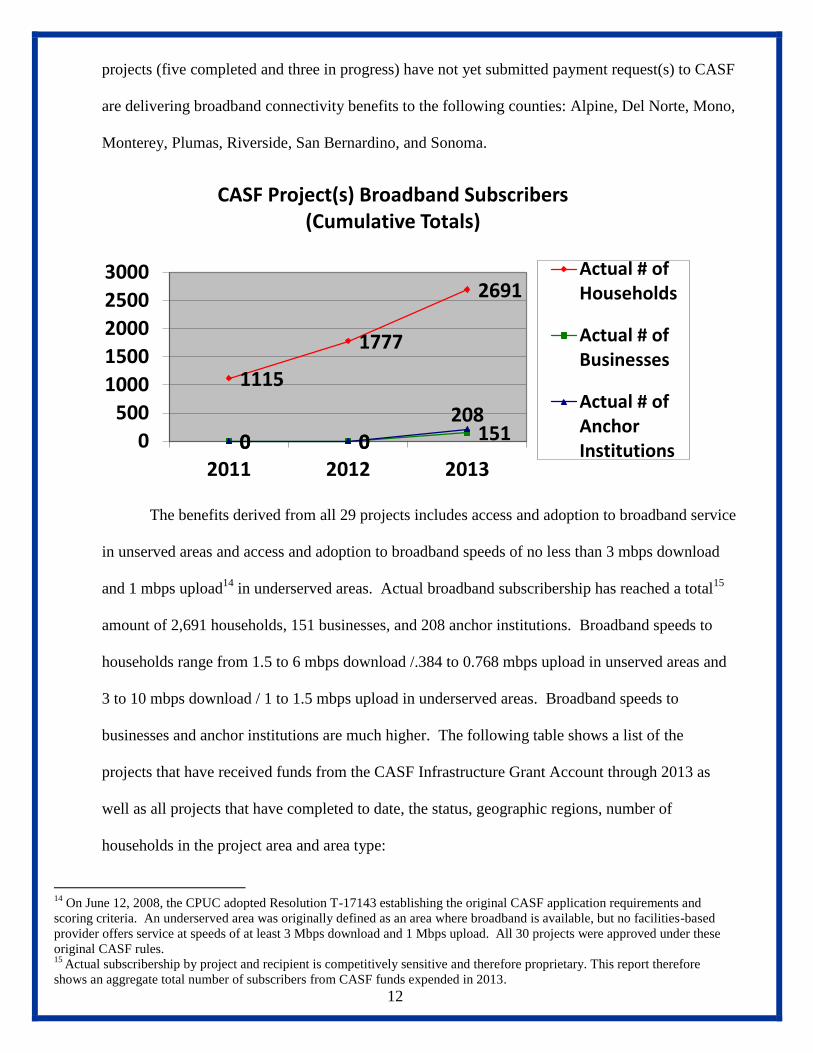
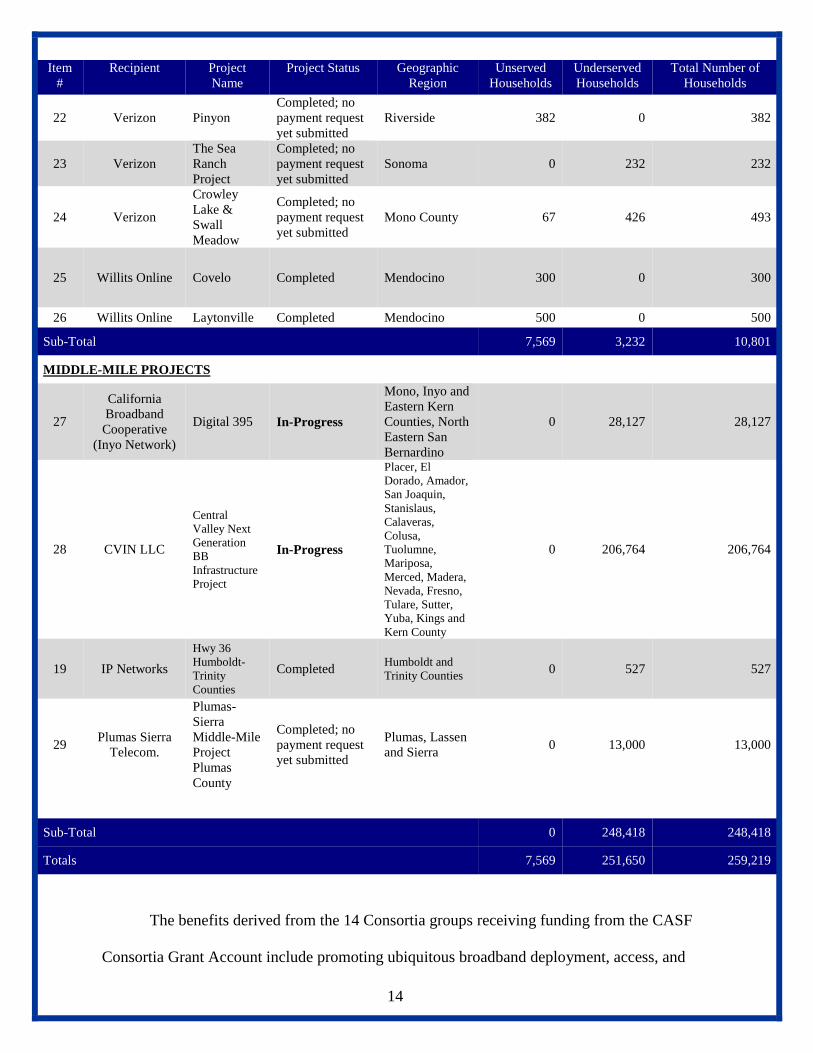
The benefits derived from all 29 projects includes access and adoption to broadband service
in unserved areas and access and adoption to broadband speeds of no less than 3 mbps download
and 1 mbps upload14
in underserved areas. Actual broadband subscribership has reached a total15
amount of 2,691 households, 151 businesses, and 208 anchor institutions. Broadband speeds to
households range from 1.5 to 6 mbps download /.384 to 0.768 mbps upload in unserved areas and
3 to 10 mbps download / 1 to 1.5 mbps upload in underserved areas. Broadband speeds to
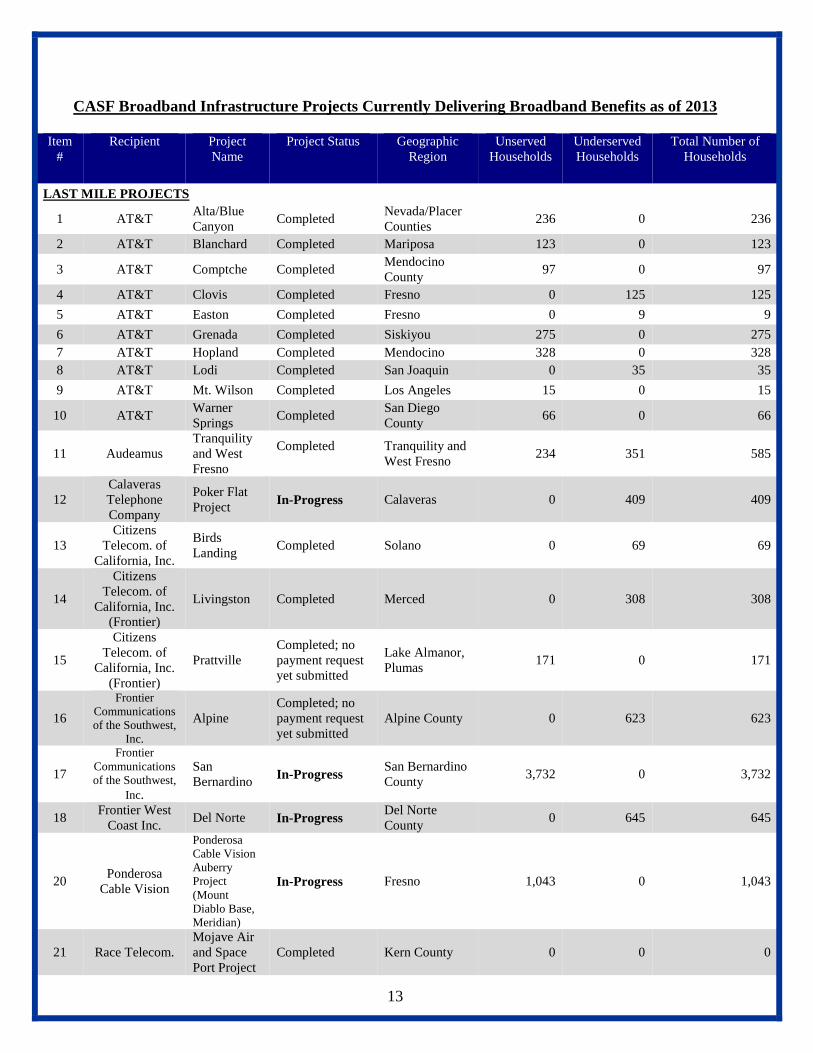
businesses and anchor institutions are much higher. The following table shows a list of the
projects that have received funds from the CASF Infrastructure Grant Account through 2013 as
well as all projects that have completed to date, the status, geographic regions, number of
households in the project area and area type:
14
On June 12, 2008, the CPUC adopted Resolution T-17143 establishing the original CASF application requirements and
scoring criteria. An underserved area was originally defined as an area where broadband is available, but no facilities-based
provider offers service at speeds of at least 3 Mbps download and 1 Mbps upload. All 30 projects were approved under these
original CASF rules. 15
Actual subscribership by project and recipient is competitively sensitive and therefore proprietary. This report therefore
shows an aggregate total number of subscribers from CASF funds expended in 2013.
1115
1777
2691
0 0 151 0 0 208
0
500
1000
1500
2000
2500
3000
2011 2012 2013
CASF Project(s) Broadband Subscribers (Cumulative Totals)
Actual # ofHouseholds
Actual # ofBusinesses
Actual # ofAnchorInstitutions
13
CASF Broadband Infrastructure Projects Currently Delivering Broadband Benefits as of 2013
Item
#
Recipient Project
Name
Project Status Geographic
Region
Unserved
Households
Underserved
Households
Total Number of
Households
LAST MILE PROJECTS
1 AT&T Alta/Blue
Canyon Completed
Nevada/Placer
Counties 236 0 236
2 AT&T Blanchard Completed Mariposa 123 0 123
3 AT&T Comptche Completed Mendocino
County 97 0 97
4 AT&T Clovis Completed Fresno 0 125 125
5 AT&T Easton Completed Fresno 0 9 9
6 AT&T Grenada Completed Siskiyou 275 0 275
7 AT&T Hopland Completed Mendocino 328 0 328
8 AT&T Lodi Completed San Joaquin 0 35 35
9 AT&T Mt. Wilson Completed Los Angeles 15 0 15
10 AT&T Warner
Springs Completed
San Diego
County 66 0 66
11 Audeamus
Tranquility
and West
Fresno
Completed
Tranquility and
West Fresno 234 351 585
12
Calaveras
Telephone
Company
Poker Flat
Project In-Progress Calaveras 0 409 409
13
Citizens
Telecom. of
California, Inc.
Birds
Landing Completed Solano 0 69 69
14
Citizens
Telecom. of
California, Inc.
(Frontier)
Livingston Completed Merced 0 308 308
15
Citizens
Telecom. of
California, Inc.
(Frontier)
Prattville
Completed; no
payment request
yet submitted
Lake Almanor,
Plumas 171 0 171
16
Frontier
Communications
of the Southwest,
Inc.
Alpine
Completed; no
payment request
yet submitted
Alpine County 0 623 623
17
Frontier
Communications
of the Southwest,
Inc.
San
Bernardino In-Progress
San Bernardino
County 3,732 0 3,732
18 Frontier West
Coast Inc. Del Norte In-Progress
Del Norte
County 0 645 645
20 Ponderosa
Cable Vision
Ponderosa
Cable Vision
Auberry
Project
(Mount
Diablo Base,
Meridian)
In-Progress Fresno 1,043 0 1,043
21 Race Telecom.
Mojave Air
and Space
Port Project
Completed Kern County 0 0 0
14
Item
#
Recipient Project
Name
Project Status Geographic
Region
Unserved
Households
Underserved
Households
Total Number of
Households
22 Verizon Pinyon
Completed; no
payment request
yet submitted
Riverside 382 0 382
23 Verizon
The Sea
Ranch
Project
Completed; no
payment request
yet submitted
Sonoma 0 232 232
24 Verizon
Crowley
Lake &
Swall
Meadow
Completed; no
payment request
yet submitted
Mono County 67 426 493
25 Willits Online Covelo Completed Mendocino 300 0 300
26 Willits Online Laytonville Completed Mendocino 500 0 500
Sub-Total 7,569 3,232 10,801
MIDDLE-MILE PROJECTS
27
California
Broadband
Cooperative
(Inyo Network)
Digital 395 In-Progress
Mono, Inyo and
Eastern Kern
Counties, North
Eastern San
Bernardino
0 28,127 28,127
28 CVIN LLC
Central
Valley Next
Generation
BB
Infrastructure
Project
In-Progress
Placer, El
Dorado, Amador,
San Joaquin,
Stanislaus,
Calaveras,
Colusa,
Tuolumne,
Mariposa,
Merced, Madera,
Nevada, Fresno,
Tulare, Sutter,
Yuba, Kings and
Kern County
0 206,764 206,764
19 IP Networks
Hwy 36
Humboldt-
Trinity
Counties
Completed Humboldt and
Trinity Counties 0 527 527
29 Plumas Sierra
Telecom.
Plumas-
Sierra
Middle-Mile
Project
Plumas
County
Completed; no
payment request
yet submitted
Plumas, Lassen
and Sierra 0 13,000 13,000
Sub-Total 0 248,418 248,418
Totals 7,569 251,650 259,219
The benefits derived from the 14 Consortia groups receiving funding from the CASF
Consortia Grant Account include promoting ubiquitous broadband deployment, access, and
15
adoption in 49 out of 58 counties in California. Each regional Consortium delivers unique
activities to the counties they represent that focus on the needs of their communities. These
activities are intended to:
Increase sustainability of broadband infrastructure and projects;
Promote broadband deployment (availability) for residences in California;
Promote broadband access and adoption (knowledge of service options and ability to
utilize services as well as subscription of services) for residences in California;
Increase the rate of broadband adoption by facilitating the impact of consumer
education, outreach, and training;
Support those community-based parties, especially anchor institutions, who are working
to increase deployment, access, and adoption.
Attachment G describes the accomplishments achieved by each regional Consortium in 2013.
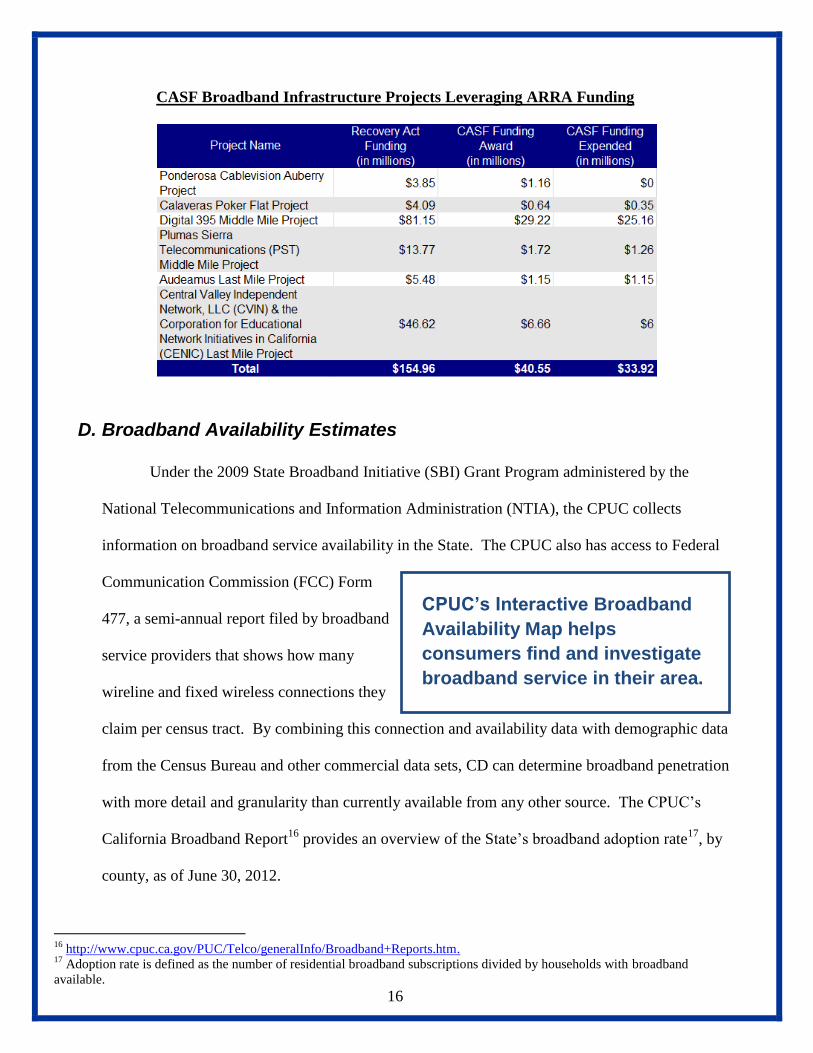
C. Leveraging Program Funds with Federal Funds
With an investment of about $41 million in CASF funds, California has been able to
leverage almost $155 million in federal matching funds from the American Recovery and
Reinvestment Act of 2009 (Recovery Act) for broadband deployment in the State. Out of the six
projects that successfully secured Recovery Act funding, five projects have received payment from
the CASF totaling $33.92 million. The remaining project that has not yet submitted payment
requests from their CASF funding award has started and continues to make progress towards
completion. The following table shows the amount of funds expended from the CASF for projects
obtaining federal funds:
16
CASF Broadband Infrastructure Projects Leveraging ARRA Funding
D. Broadband Availability Estimates
Under the 2009 State Broadband Initiative (SBI) Grant Program administered by the
National Telecommunications and Information Administration (NTIA), the CPUC collects
information on broadband service availability in the State. The CPUC also has access to Federal
Communication Commission (FCC) Form
477, a semi-annual report filed by broadband
service providers that shows how many
wireline and fixed wireless connections they
claim per census tract. By combining this connection and availability data with demographic data
from the Census Bureau and other commercial data sets, CD can determine broadband penetration
with more detail and granularity than currently available from any other source. The CPUC’s
California Broadband Report16
provides an overview of the State’s broadband adoption rate17
, by
county, as of June 30, 2012.
16
http://www.cpuc.ca.gov/PUC/Telco/generalInfo/Broadband+Reports.htm. 17
Adoption rate is defined as the number of residential broadband subscriptions divided by households with broadband
available.
CPUC’s Interactive Broadband
Availability Map helps
consumers find and investigate
broadband service in their area.
17
In addition to the collected and analyzed data on broadband availability and subscriptions
in the State that is available from the CPUC online, the CPUC has developed and maintains an
Interactive Broadband Availability Map (Map). The Map allows users to visualize data the CPUC
collects every six months from broadband service providers in California, as well as any of those
areas that have failed CD staff’s validation process.18
In addition, the Map allows access to
virtually all available data needed to analyze broadband deployment and adoption in the State. The
data currently displayed on the Map represents broadband availability as of June 30, 2013. The
Map will be updated in June 2014 with data representing the period up to December 31, 2013, after
thorough validation and analysis.
At its most basic, the Map contains a search icon that Californians can use to find and
investigate broadband service in their area by showing
broadband availability near a particular address. The
Map also supports more sophisticated uses, and also
contains tools created to assist CASF Infrastructure
Grant applicants to complete their CASF applications
and by CPUC staff to evaluate applications and
challenges to determine if areas are grant-eligible.
Additionally, the Map is used to provide an initial estimate of broadband availability in the
State, based primarily on industry-provided data, following the NTIA data collection guidelines;
and according to the CASF definitions of unserved and underserved areas in D.12-02-015.19
In
keeping with NTIA’s guidelines, however, broadband service providers do not submit data in a
18
The validation procedure includes review of broadband usage, geo-location data purchased from 3rd
party providers, wireless
testing, and county parcel map data. The full list of current validation resources is shown in Appendix I. Improved validation
techniques are being developed and deployed, such as specialized tests of actual broadband speed and quality as received by the
consumer. 19
An “unserved” area is an area that is not served by any form of wireline or wireless facilities-based broadband, such that
Internet connectivity is available only through dial-up service. An “underserved” area is an area where broadband is available,
but no wireline or wireless facilities-based provider offers service at advertised speeds of at least 6 mbps download and 1.5
mbps upload.
18
more granular level other than the census tract or census block level. As a result, a census block
may be categorized as served when a broadband provider serves at least one household within that
census block, though the verification process can reverse such categorization. Thus, it is important
to understand that the Map is not capable of providing a 100 percent accurate representation of
broadband availability down to the individual household level. This is particularly an issue for
rural areas of the State, where population is less dense and census blocks cover a larger area.20
Thus, through the administration of the CASF program, the review of broadband infrastructure
project proposals, and the investigation of numerous
challenges received on project areas throughout the State,
it has become apparent that the percentage of households
served, underserved, and unserved as shown in the Map
is not precise. Consequently, CD staff does not rely
solely on information submitted by broadband providers
as reflected in the Map, but instead closely reviews each project proposal to determine if the
proposed area is served, underserved, or unserved. CASF applicants or interested parties,
particularly broadband providers in the proposed project areas, have the opportunity to challenge
an area as not served or served where the maps show otherwise.21
Further, CD staff is
implementing additional methods in 2014 that will improve the accuracy of the map and data
analysis. These efforts are described later in the report. Despite the limitations of census block
data reporting, the Map is a valuable tool to the CPUC to track broadband availability in the State.
20
The presumption of considering a census block as served based on one subscriber within that block may be reasonable in
urban areas where a census block area is small - service to one neighbor likely implies availability to the next. However, for
rural areas, such is not a reasonable presumption given known geographic variability and low household density. 21
Information on what is required on a challenge can be found at:
http://www.cpuc.ca.gov/PUC/Telco/Information+for+providing+service/CASF/CASF+Application+FAQs.htm.
19
Based on data provided to the NTIA, California ranks 14 out of all States in the Nation at
97.2% of housing units22
having access to broadband by wireline technology23
. This percentage is
not a direct comparison to the remaining unserved/underserved households in the State since it
does not account for the served speeds threshold adopted by the State nor is it a number based on
households; rather, it is housing units.
To better measure the remaining households that are not served in California, below are
three tables and maps that show the estimate of households having broadband availability at served
and underserved speeds; and those that are unserved by wireline, fixed-wireless, and mobile
wireless broadband technologies.24
The presentation reflects data as of June 30, 2013, as
submitted to the CPUC and validated by CD to the census block level.
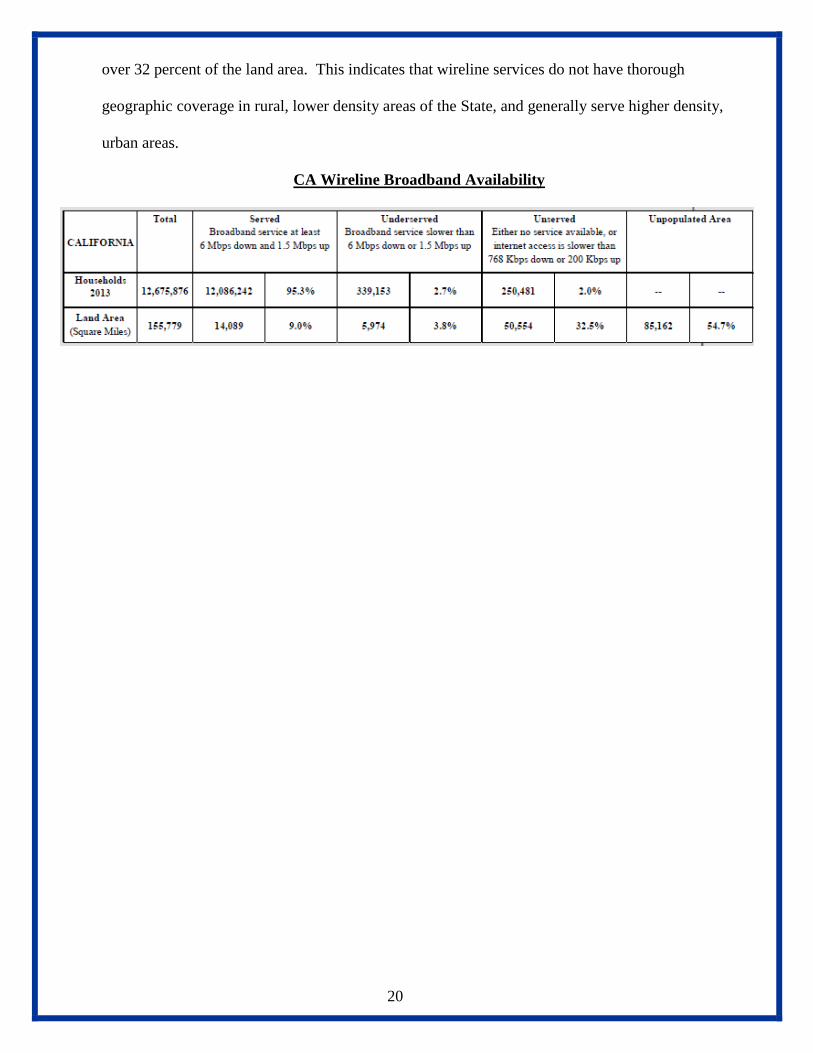
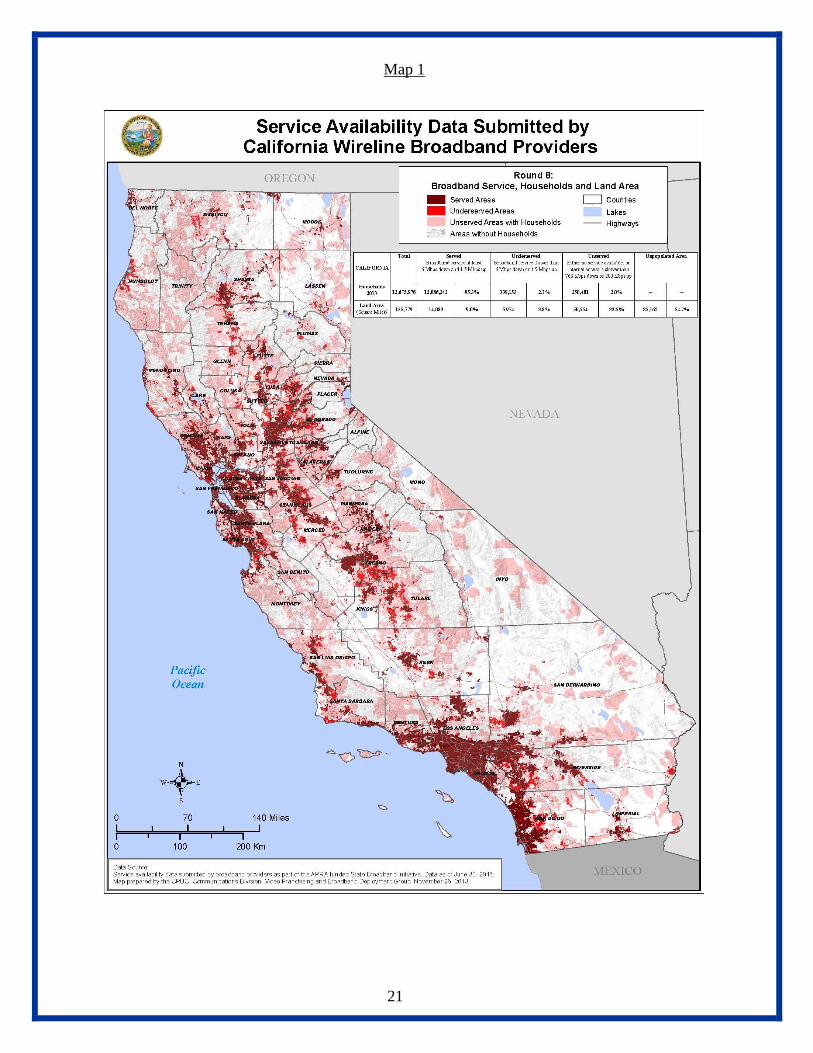
Map 1 and the table below, show broadband availability utilizing wireline broadband
technologies. They show that in California, 95.3 percent of households (12,086,242) have served
speeds availability, 2.7 percent of households (339,153) have only underserved speeds
availability, and 2 percent of households (250,481) have service so slow, if at all, that they are
considered unserved.
Instructive in the data table and apparent on the map below is the relatively small
geographic area where wireline broadband is available at served speeds. For wireline broadband,
only 9 percent of the land area in California contains 95 percent of the households having served
speeds available. In contrast, 2 percent of the households that are unserved are associated with
22
Census Definition: A house, an apartment or other group of rooms, or a single room, is regarded as a housing unit when it is
occupied or intended for occupancy as separate living quarters; that is, when the occupants do not live with any other persons in
the structure and there is direct access from the outside or through a common hall. 23
Metrics can be found at: http://www.broadbandmap.gov/rank/all/state/percent-household-units/within-nation/technology-
wireline-any/ascending 24
The CPUC broadband availability map separates broadband services into several categories: fixed, fixed-wireless, mobile and
satellite. The “fixed” category includes all those services which are delivered to a particular, stationary location. Such services
are provided using several different technologies, including “wireline” technologies such as xDSL, Cable Modem, or Fiber to
the Home. These technologies use wires or cables that make a physical connection from the provider to the user. However,
“fixed wireless” solutions use wireless radio waves at a particular frequency, such as Wi-Fi, to make a “point-to-point”
connection between the provider and the user at a fixed location. By contrast, the “mobile” category includes “wireless”
technologies, such as 2G, 3G, or 4G LTE to provide service to users who can receive a broadband signal while the user is in
motion. The “satellite” category includes those providers who use a connection via satellite to the customer to provide service.
20
over 32 percent of the land area. This indicates that wireline services do not have thorough
geographic coverage in rural, lower density areas of the State, and generally serve higher density,
urban areas.
CA Wireline Broadband Availability
21
Map 1
22
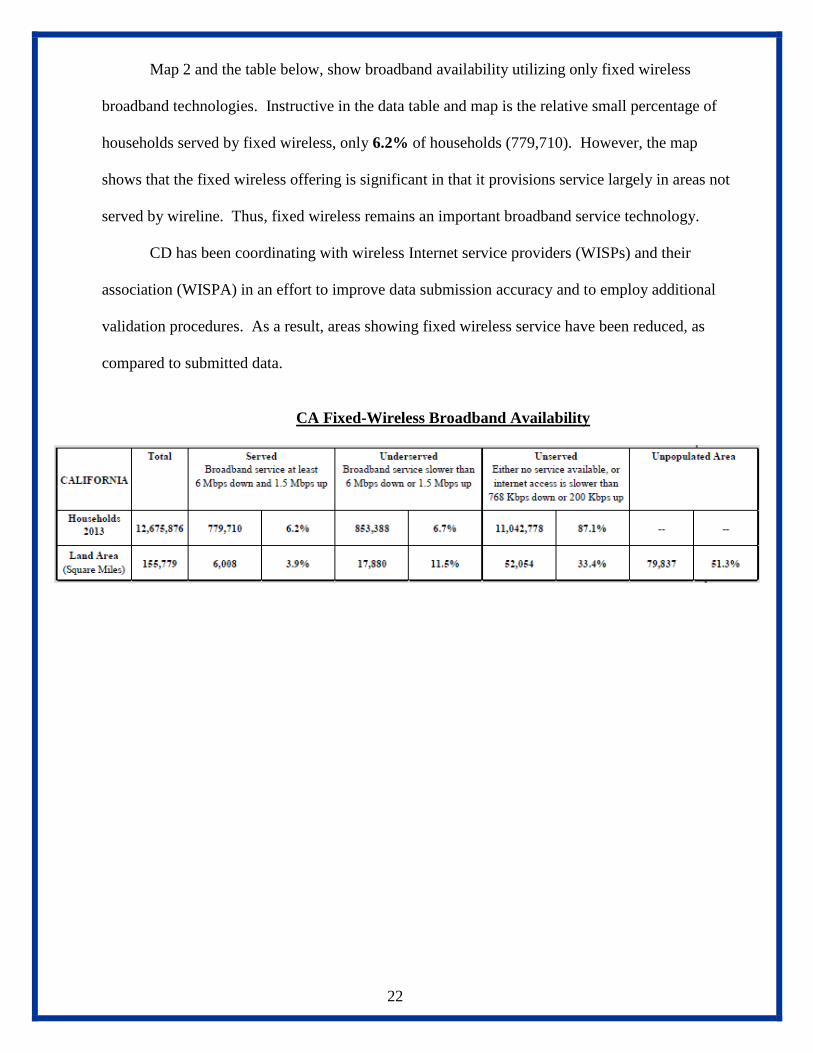
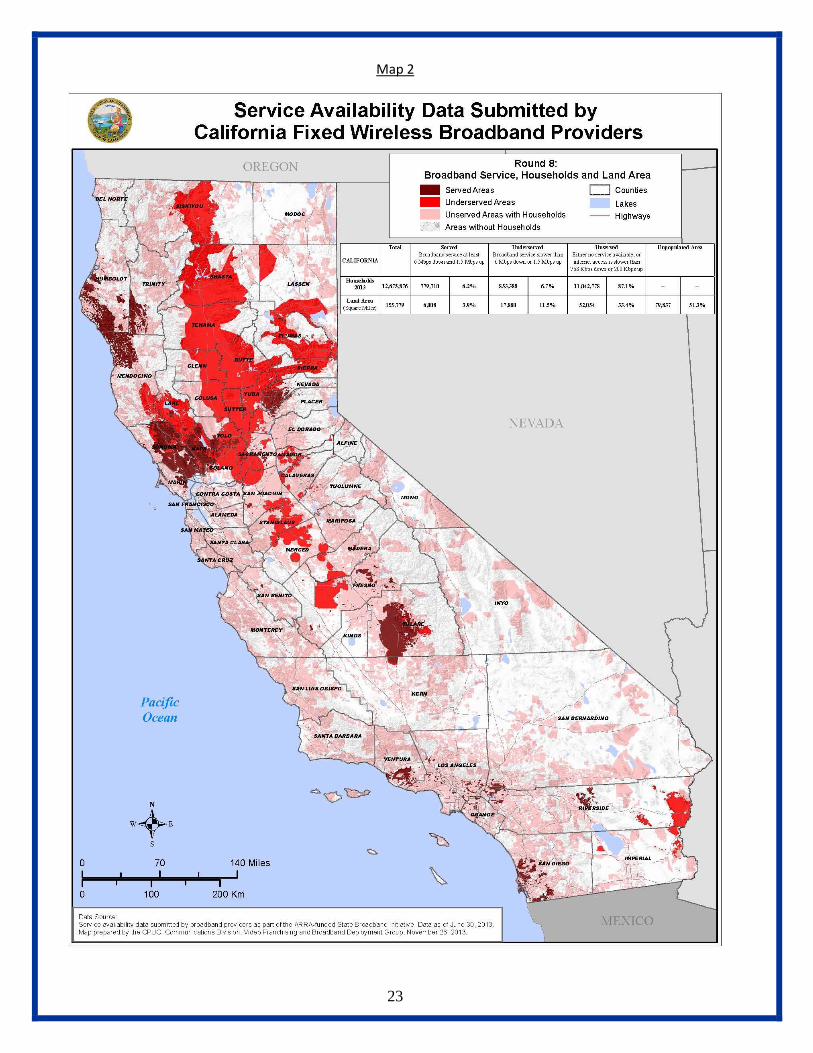
Map 2 and the table below, show broadband availability utilizing only fixed wireless
broadband technologies. Instructive in the data table and map is the relative small percentage of
households served by fixed wireless, only 6.2% of households (779,710). However, the map
shows that the fixed wireless offering is significant in that it provisions service largely in areas not
served by wireline. Thus, fixed wireless remains an important broadband service technology.
CD has been coordinating with wireless Internet service providers (WISPs) and their
association (WISPA) in an effort to improve data submission accuracy and to employ additional
validation procedures. As a result, areas showing fixed wireless service have been reduced, as
compared to submitted data.
CA Fixed-Wireless Broadband Availability
23
Map 2
24
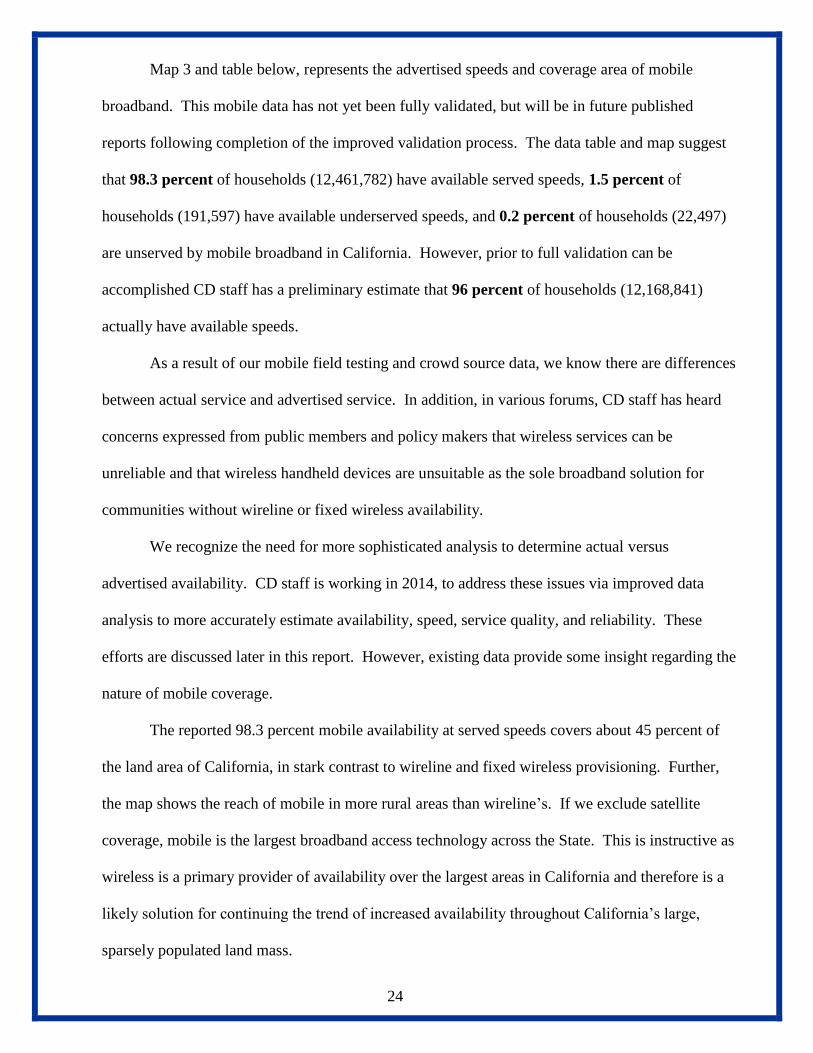
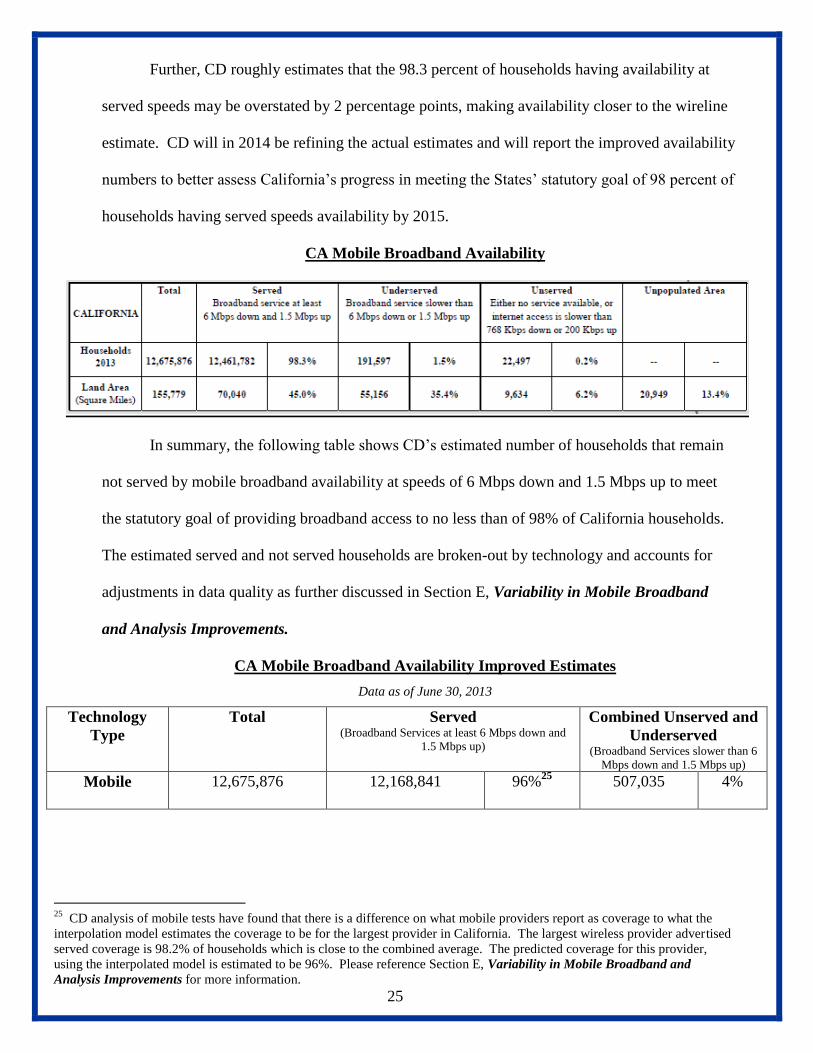
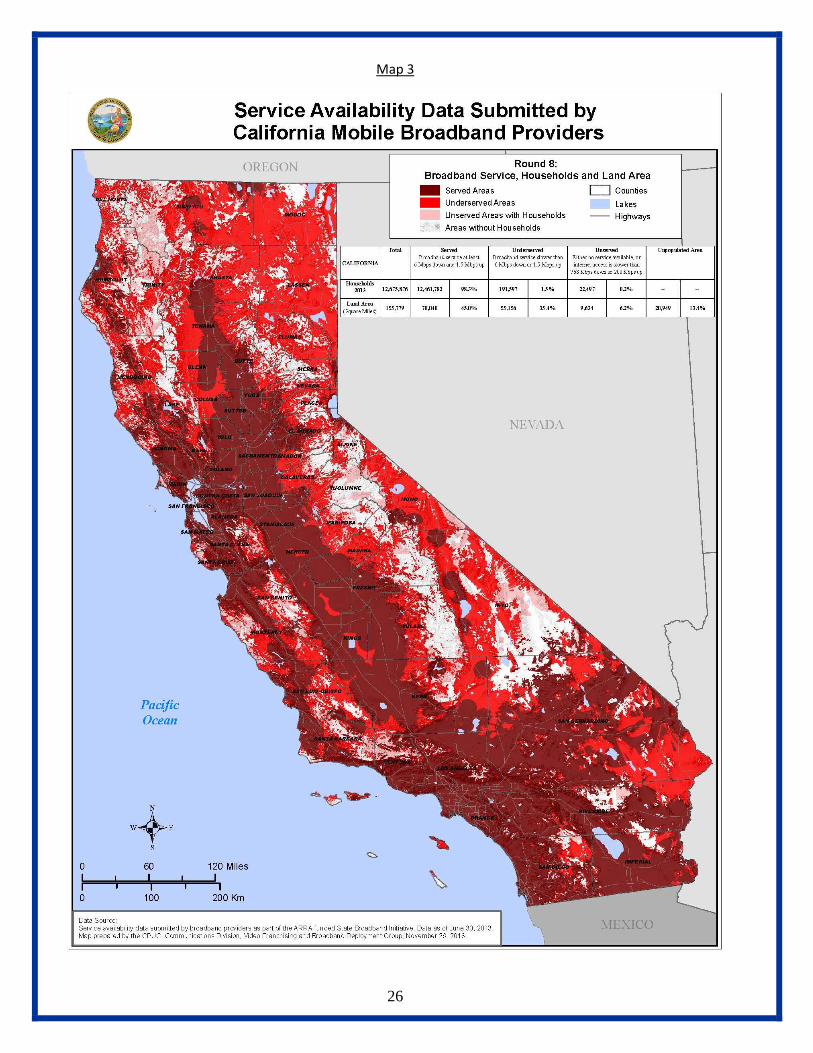
Map 3 and table below, represents the advertised speeds and coverage area of mobile
broadband. This mobile data has not yet been fully validated, but will be in future published
reports following completion of the improved validation process. The data table and map suggest
that 98.3 percent of households (12,461,782) have available served speeds, 1.5 percent of
households (191,597) have available underserved speeds, and 0.2 percent of households (22,497)
are unserved by mobile broadband in California. However, prior to full validation can be
accomplished CD staff has a preliminary estimate that 96 percent of households (12,168,841)
actually have available speeds.
As a result of our mobile field testing and crowd source data, we know there are differences
between actual service and advertised service. In addition, in various forums, CD staff has heard
concerns expressed from public members and policy makers that wireless services can be
unreliable and that wireless handheld devices are unsuitable as the sole broadband solution for
communities without wireline or fixed wireless availability.
We recognize the need for more sophisticated analysis to determine actual versus
advertised availability. CD staff is working in 2014, to address these issues via improved data
analysis to more accurately estimate availability, speed, service quality, and reliability. These
efforts are discussed later in this report. However, existing data provide some insight regarding the
nature of mobile coverage.
The reported 98.3 percent mobile availability at served speeds covers about 45 percent of
the land area of California, in stark contrast to wireline and fixed wireless provisioning. Further,
the map shows the reach of mobile in more rural areas than wireline’s. If we exclude satellite
coverage, mobile is the largest broadband access technology across the State. This is instructive as
wireless is a primary provider of availability over the largest areas in California and therefore is a
likely solution for continuing the trend of increased availability throughout California’s large,
sparsely populated land mass.
25
Further, CD roughly estimates that the 98.3 percent of households having availability at
served speeds may be overstated by 2 percentage points, making availability closer to the wireline
estimate. CD will in 2014 be refining the actual estimates and will report the improved availability
numbers to better assess California’s progress in meeting the States’ statutory goal of 98 percent of
households having served speeds availability by 2015.
CA Mobile Broadband Availability
In summary, the following table shows CD’s estimated number of households that remain
not served by mobile broadband availability at speeds of 6 Mbps down and 1.5 Mbps up to meet
the statutory goal of providing broadband access to no less than of 98% of California households.
The estimated served and not served households are broken-out by technology and accounts for
adjustments in data quality as further discussed in Section E, Variability in Mobile Broadband
and Analysis Improvements.
CA Mobile Broadband Availability Improved Estimates
Data as of June 30, 2013
Technology
Type
Total Served (Broadband Services at least 6 Mbps down and
1.5 Mbps up)
Combined Unserved and
Underserved (Broadband Services slower than 6
Mbps down and 1.5 Mbps up) Mobile 12,675,876 12,168,841 96%
25 507,035 4%
25
CD analysis of mobile tests have found that there is a difference on what mobile providers report as coverage to what the
interpolation model estimates the coverage to be for the largest provider in California. The largest wireless provider advertised
served coverage is 98.2% of households which is close to the combined average. The predicted coverage for this provider,
using the interpolated model is estimated to be 96%. Please reference Section E, Variability in Mobile Broadband and
Analysis Improvements for more information.
26
Map 3
27
E. Variability in Mobile Broadband and Analysis Improvements
As noted earlier, the estimate of unserved and underserved households based on the Map
have margins of error, which most likely overestimates broadband speeds and geographic coverage
by providers, and therefore underestimates the number
of unserved and underserved households in the State.
Specifically for mobile broadband, CD validates
advertised speeds by conducting drive tests at 1,200
points26
within the State. The data tests are input into
an interpolation model to predict speeds in areas
outside the drive tests. The mobile broadband availability as of June 30, 2013 shows that 98.3
percent of households are served, however the number is likely overstated for the following three
reasons.
1) CD analysis of mobile tests (conducted in the spring of 2013) have found that there is a
difference on what mobile providers report as coverage to what the interpolation model
estimates the coverage to be for the largest provider. The largest wireless provider
advertised served coverage is 98.2 percent of households which is close to the
combined average. The predicted coverage for this provider, using the interpolated
model is estimated to be 96 percent.27
Thus, the combined mobile availability at served
speeds value can be estimated as being overstated by about 2 percentage points.28
26
The Fall 2013 Mobile Field Test increased test points from 1200 to nearly 2000, thereby increasing the predictive power of
the interpolation model. 27
The interpolation model analysis here uses the Fall 2013 Mobile Field Test and CalSPEED crowd source data. Future
representations of the statewide map will reflect post interpolation analysis. 28
See Mobile Field Testing Report - April 2013, issued December 2013. The report provides an analysis of mobile speed,
variability, and coverage of broadband in the State and explains the interpolation and testing methodology:
ftp://ftp.cpuc.ca.gov/Telco/BB%20Mapping/Field%20Testing/Mobile%20Field%20Testing%20Report%20-
%20April%202013.pdf.
28
2) CD staff has found that some CASF project proposal areas29
where the Map shows
served by mobile broadband, are in fact not served after the applicant conducted
CalSPEED30
tests and/or the CPUC mobile field tests show actual speeds below the
served threshold.
3) In addition, as stated in the FCC’s consumer guide in understanding wireless telephone
coverage area31
, “there is no guarantee that your phone will work in an area, even if it is
included on a wireless service provider’s published coverage map”.
The CPUC recognizes the need to provide a better accounting of broadband availability in
the State. Essential to the existing data gathering tools the CPUC has implemented, the next step is
to better assess service quality- to take into consideration variability of service.32
Additionally,
essential is to gather and fully consider “ground truth” information provided directly from the
public. The CPUC has expanded its efforts to validate the availability of broadband, or lack
thereof, by increasing outreach to the public throughout the State. The following are the methods
for the public to provide feedback regarding broadband availability in their areas:
1) Online-Map Feedback: Community members having broadband access may provide
feedback directly via the online map, www.broadbandmap.ca.gov/map and inputting an
address. A list of broadband providers that report they provide service in the area will
appear on the screen, along with the type of broadband service and speeds they offer.
When this list appears, community members will find in the upper left corner a link,
labeled ‘Send Feedback.’ By clicking on this link, a survey will appear on the screen.
The public is encouraged to answer the questions and submit the survey when done.
29
Please reference Resolutions T-17410, T-17411, T-17415, T-17416, and T-17424, approving CASF infrastructure grant
funding for a number of CASF project applications submitted in February 2013. 30
CalSPEED is a free mobile Android application created by the CPUC, which is available on Google Play. Users can
download the app on their mobile devices and run a mobile speed test. The CPUC displays the CalSPEED test results in a layer
on the Map. 31
http://transition.fcc.gov/cgb/consumerfacts/cellcoverage.pdf. 32
The results of the CPUC’s CalSPEED and mobile field tests are showing that while the mean interpolated speeds indicate the
area may be receiving acceptable service, other factors, such as jitter and latency, affect the variability and quality of service
experienced by consumers. For example, an area could on average have 10 mbps of service, however speeds may vary between
18 mbps to 2 mbps of service. In future iterations of the map and analysis, the CPUC will adjust reported speeds based on
results of the interpolation model, which may shrink the areas that would otherwise be shown without verification analysis.
29
CD staff incorporates the survey responses and displays the information on the map’s
consumer feedback layer. The data will also be used to validate or invalidate providers’
service availability information.
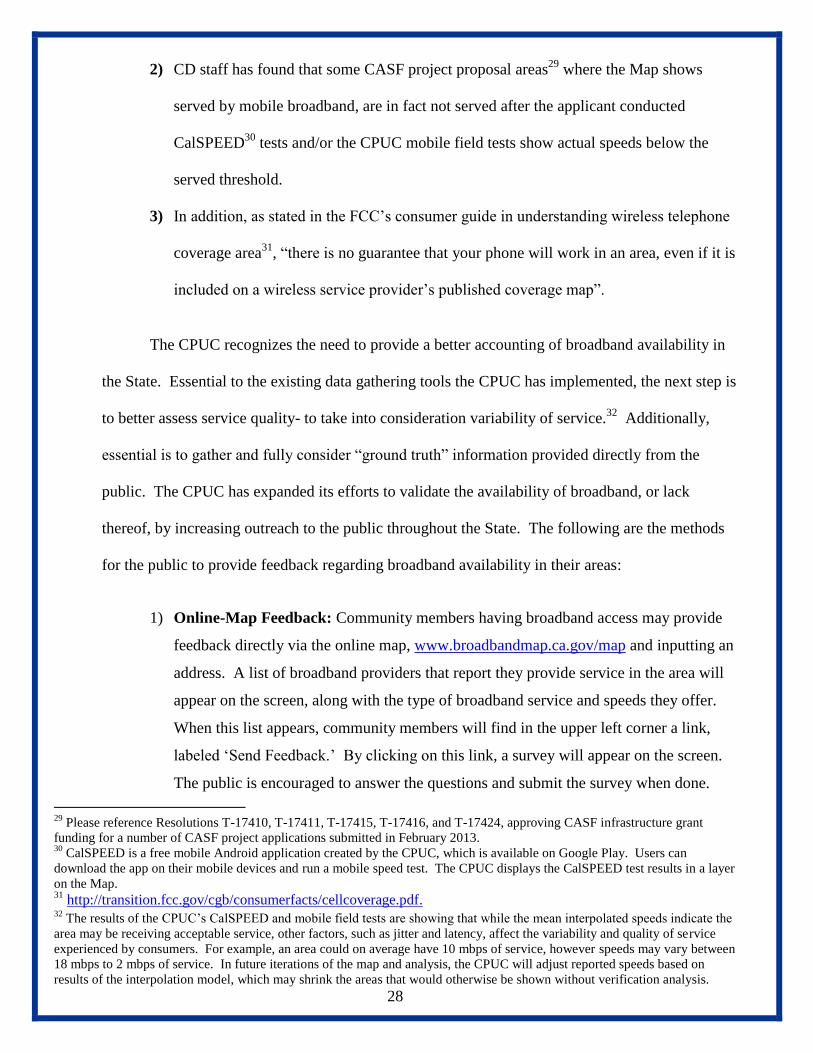
2) CalSPEED Mobile App: If any member of the public has an LTE-capable Android
smartphone or tablet, they may download the CPUC’s CalSPEED mobile testing app
from the Google Play app store and test the quality of the service actually available at a
location at the time of the test. Tests done in
areas with no service will be reported to the
CPUC automatically the next time the tester
enters an area with service. The results will be
shown on the California Interactive Broadband
Map, and be used to validate or invalidate that
provider’s service. While CalSPEED is currently
only available for Android phones, CD staff is
working on publishing an iOS version as well.
Testing must be done while stationary, in an outdoor location.
3) Paper Feedback Form: For households having no access to the Internet, a paper
option feedback form is available. Attachment H provides this form which can also be
obtained at http://www.broadbandmap.ca.gov by clicking the “Broadband Survey” link.
In order for these survey responses to be useful, the CPUC needs actual street address
information in order to indicate the feedback on the map. CD staff has coordinated
with CASF Consortia and other groups organizing local feedback to use this form and
to offer suggestions for improving the survey.
The CPUC’s CD staff in 2014 is improving the mobile drive test data analysis to better
evaluate combined mobile broadband
availability in California in addition to
reporting individual provider
In 2013, CPUC testers logged more
than 80,000 miles behind the wheel
testing broadband availability in the
most rural areas of the State.
30
availability.33
Such analysis will require CD staff to test and implement service quality standards
regarding wireless speed, jitter and latency. If speed, jitter, or latency is highly variable, service
quality is diminished and an area subject to such should be excluded from being identified as
served. It is expected that the combined services and improved quality analysis will provide a
more accurate measure of availability than the service provider data alone. The data will be
reflected on the published map and provide better estimates of how the CPUC is meeting its 98
percent broadband availability goal.
F. Projected Surcharge Collection Each Year Through 2020 to Fund Approved Projects
The CASF is funded by a surcharge rate on revenues collected by telecommunications
carriers from end-users for intrastate telecommunication services. Per Public Utilities Code Section
281(d)(3), the CPUC may collect a total of $315 million to fund the CASF program; where $100
million was collected prior to January 1, 2011, and $215
million may be collected on and after January 1, 2011,
and continuing through calendar year 2020, in an
amount not to not to exceed $25 million per year. An
amount higher than $25 million per year may be
collected if it does not result in an increase in the total
amount of all surcharges collected from telephone customers that year. CD staff has determined
that the CASF must collect an amount higher than the $25 million cap per year for calendar years
2014 through 2016 to make up the under collections from years 2011 to 201334
and to have funds
available to meet the new requirements imposed on the program with the enactment of SB 740 and
33
In 2013, testers logged more than 80,000 miles behind the wheel, seeking out the most remote rural areas of the State, as well
as urban areas and Tribal lands. The resulting data is available online, at http://www.broadbandmap.ca.gov and has been shared
with other State agencies. 34
Between years 2011 and 2013, the CASF under-collected $17 million due to a decreasing billing base. On January 28, 2014,
the CPUC issued Resolution T-17434 for public comment resetting the CASF surcharge rate.
31
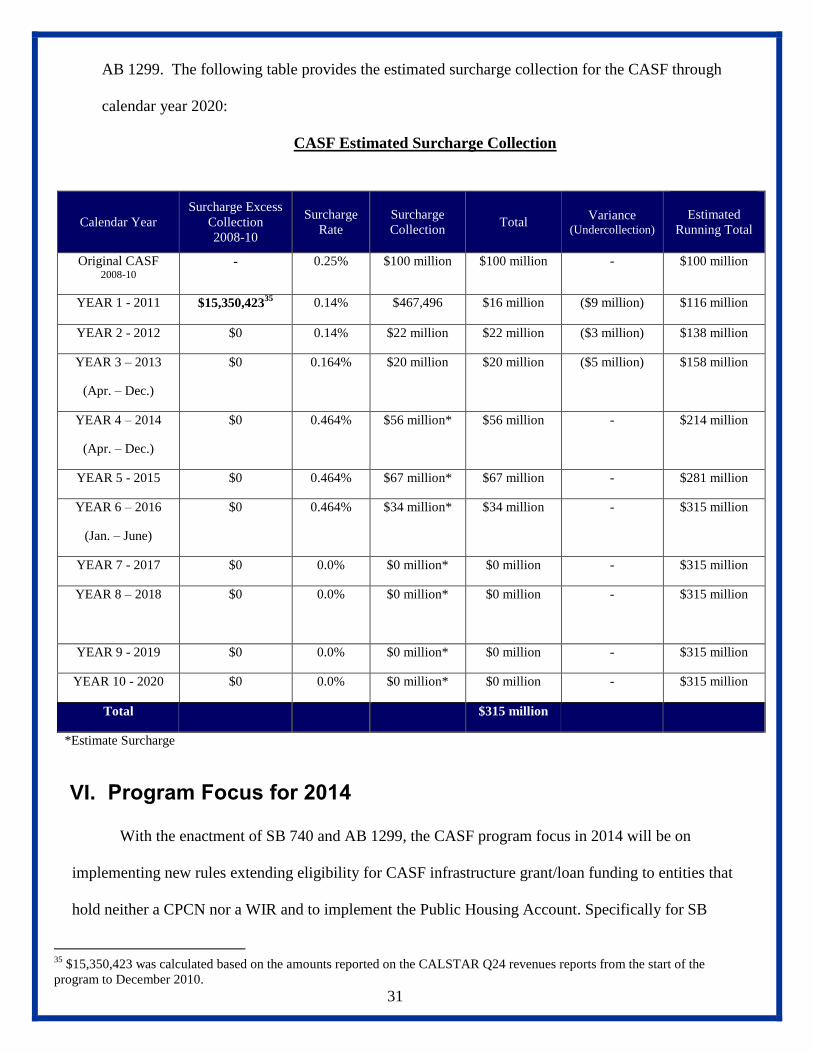
AB 1299. The following table provides the estimated surcharge collection for the CASF through
calendar year 2020:
CASF Estimated Surcharge Collection
VI. Program Focus for 2014
With the enactment of SB 740 and AB 1299, the CASF program focus in 2014 will be on
implementing new rules extending eligibility for CASF infrastructure grant/loan funding to entities that
hold neither a CPCN nor a WIR and to implement the Public Housing Account. Specifically for SB
35
$15,350,423 was calculated based on the amounts reported on the CALSTAR Q24 revenues reports from the start of the
program to December 2010.
Calendar Year
Surcharge Excess
Collection
2008-10
Surcharge
Rate
Surcharge
Collection Total
Variance (Undercollection)
Estimated
Running Total
Original CASF 2008-10
- 0.25% $100 million $100 million - $100 million
YEAR 1 - 2011 $15,350,42335
0.14% $467,496 $16 million ($9 million) $116 million
YEAR 2 - 2012 $0 0.14% $22 million $22 million ($3 million) $138 million
YEAR 3 – 2013
(Apr. – Dec.)
$0 0.164% $20 million $20 million ($5 million) $158 million
YEAR 4 – 2014
(Apr. – Dec.)
$0 0.464% $56 million* $56 million - $214 million
YEAR 5 - 2015 $0 0.464% $67 million* $67 million - $281 million
YEAR 6 – 2016
(Jan. – June)
$0 0.464% $34 million* $34 million - $315 million
YEAR 7 - 2017 $0 0.0% $0 million* $0 million - $315 million
YEAR 8 – 2018
$0 0.0% $0 million* $0 million - $315 million
YEAR 9 - 2019 $0 0.0% $0 million* $0 million - $315 million
YEAR 10 - 2020 $0 0.0% $0 million* $0 million - $315 million
Total $315 million
*Estimate Surcharge
32
740, on January 6, 2014, the Assigned Commissioner issued a Proposed Decision for public comment
to implement the eligibility requirements and adopt safeguards requirements proposed through R.12-
10-012, which the Commission adopted on February 27, 2014 (D.14-02-018). The Assigned
Commissioner issued in early 2014 a scoping memo expanding the scope of the Rulemaking to
implement the additional issues raised in SB 740 and AB 1299. Specifically for AB 1299, the CPUC
will be seeking parties to comment on a numbers of topics associated with the implementation of the
Public Housing Account. CD staff also plans to hold a number of workshops during the March to April
2014 timeframe for parties and interested public to participate in and provide comments.
Finally, on March 3-4, 2014, CD staff hosted its 2nd
annual Regional Consortia Learning
Summit36
. The focus of the summit was to discuss and identify priority areas throughout the State in
need of broadband infrastructure deployment in order to create a list of priority areas for which CASF
project proposals will be sought. Such approach will focus the CASF program to invest in areas that
are in real need of broadband infrastructure. It is our hope that the enhancements made to the CASF
program will spur interest from applicants to apply for funding from the CASF and continue to
encourage the deployment of high-speed broadband Internet service to all Californians.
36
The CPUC in D.11-06-038 directed CD to schedule and host on at least an annual basis a Regional Consortia Learning
Community Summit. All consortia receiving CASF grants shall be required to attend the Summit. The purpose of the Summit
is to provide a forum for all consortia to gather and exchange information and ideas on best practices to enhance the
effectiveness of consortia programs.
33
Attachment A – Map of Commission Approved Consortia Grants
34
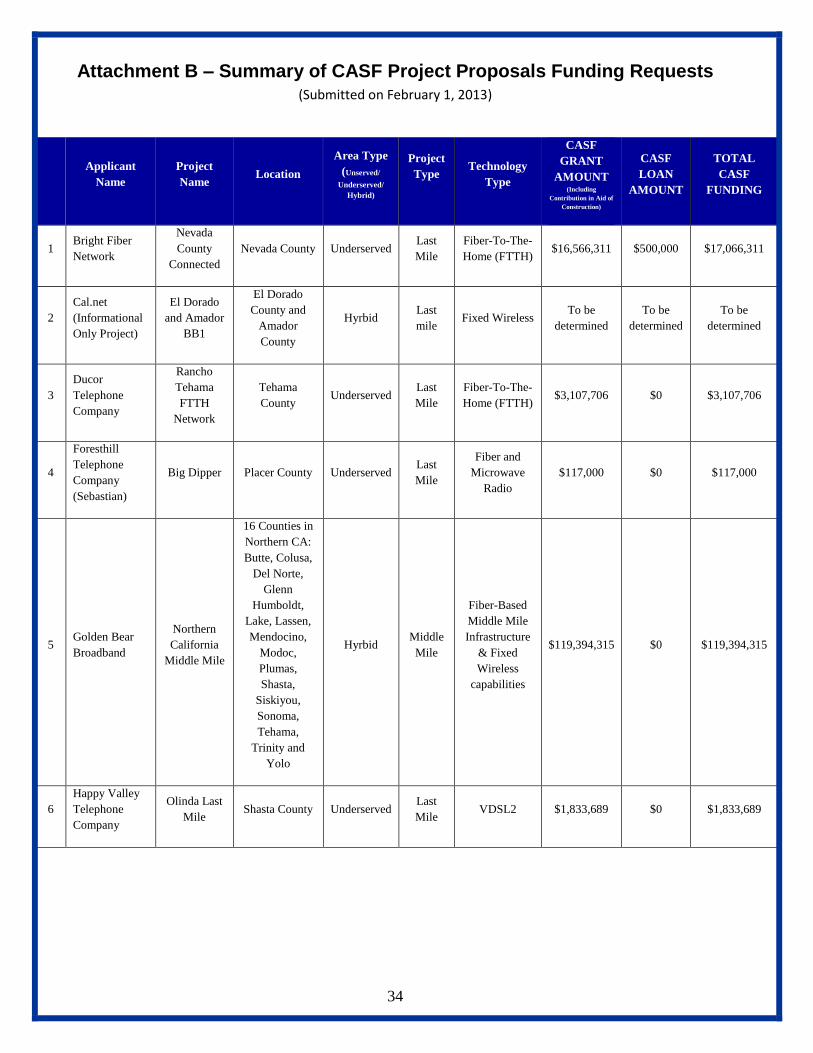
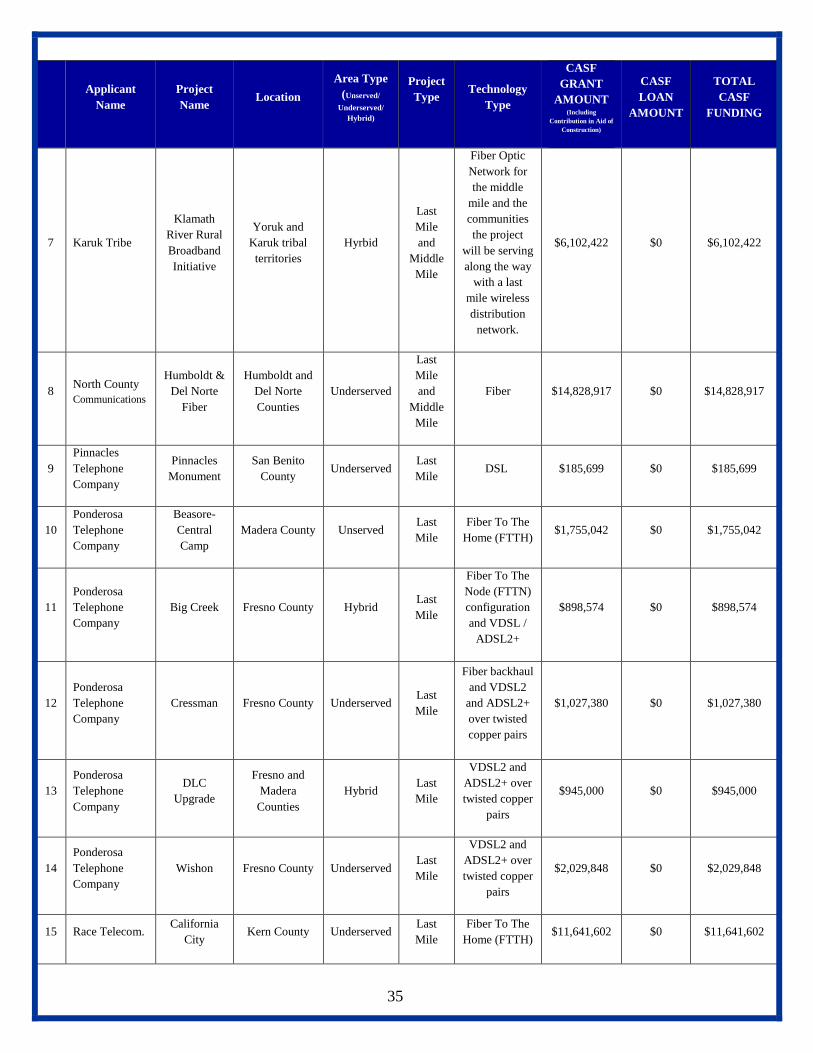
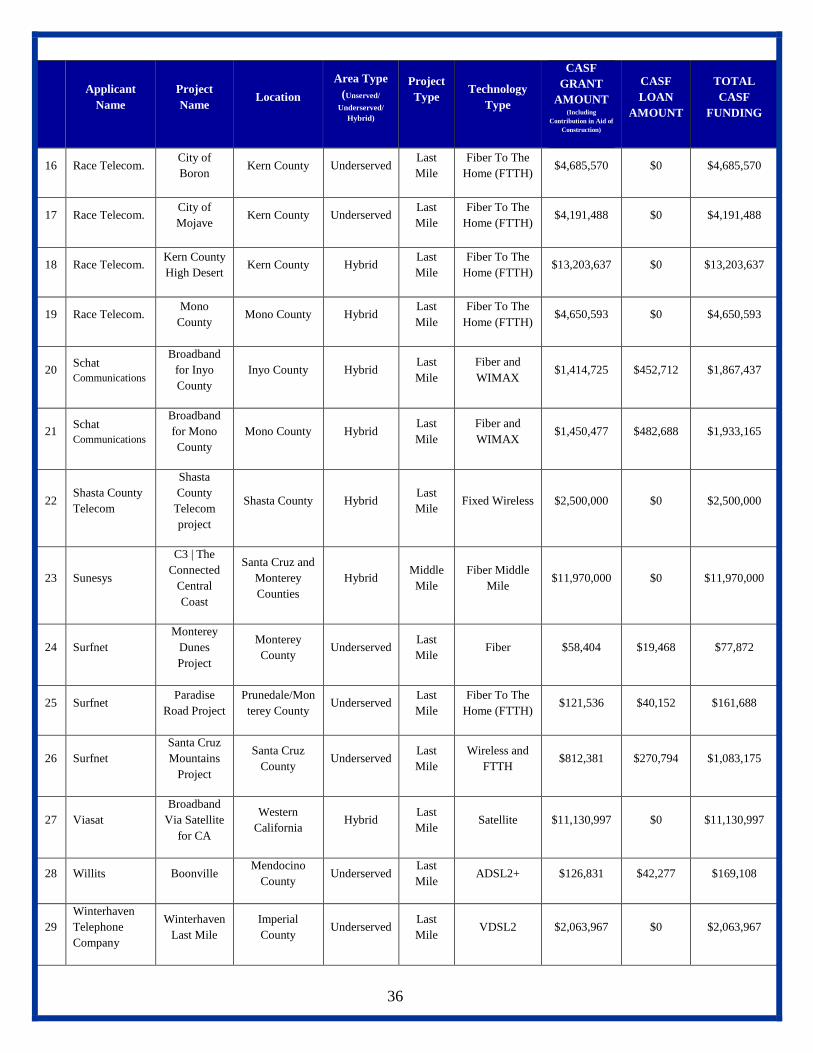
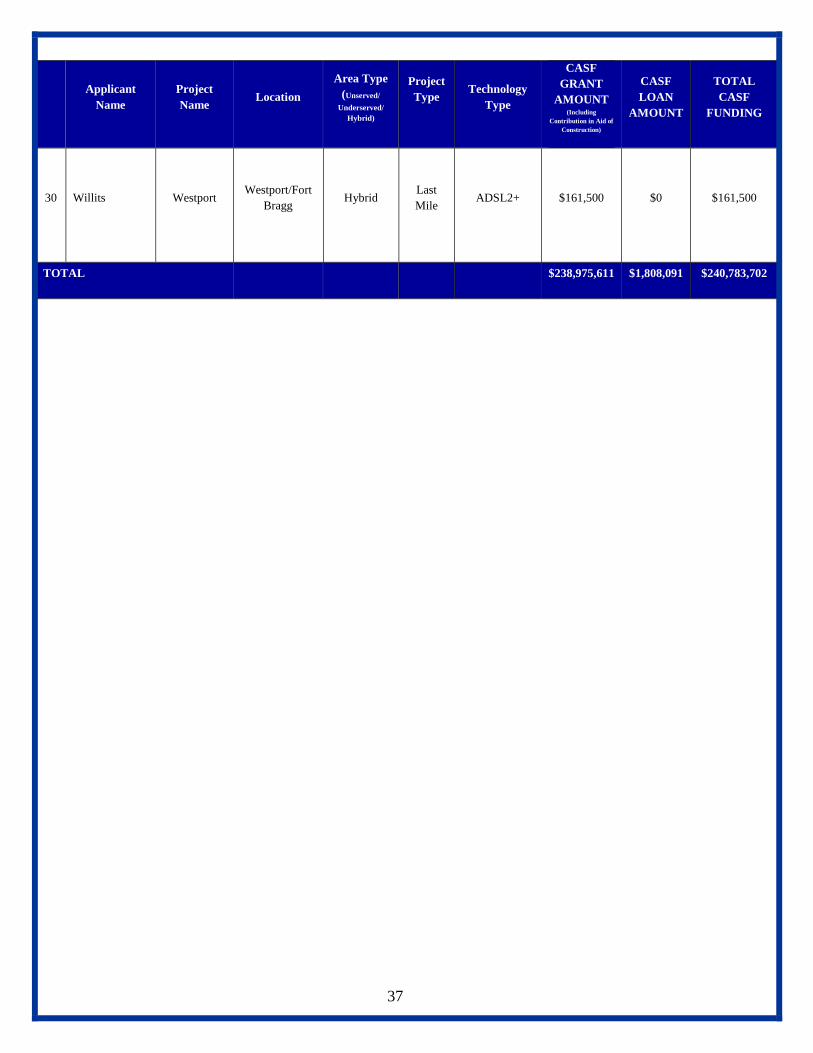
Attachment B – Summary of CASF Project Proposals Funding Requests
(Submitted on February 1, 2013)
Applicant
Name
Project
Name Location
Area Type
(Unserved/
Underserved/
Hybrid)
Project
Type
Technology
Type
CASF
GRANT
AMOUNT (Including
Contribution in Aid of
Construction)
CASF
LOAN
AMOUNT
TOTAL
CASF
FUNDING
1 Bright Fiber
Network
Nevada
County
Connected
Nevada County Underserved Last
Mile
Fiber-To-The-
Home (FTTH) $16,566,311 $500,000 $17,066,311
2
Cal.net
(Informational
Only Project)
El Dorado
and Amador
BB1
El Dorado
County and
Amador
County
Hyrbid Last
mile Fixed Wireless
To be
determined
To be
determined
To be
determined
3
Ducor
Telephone
Company
Rancho
Tehama
FTTH
Network
Tehama
County Underserved
Last
Mile
Fiber-To-The-
Home (FTTH) $3,107,706 $0 $3,107,706
4
Foresthill
Telephone
Company
(Sebastian)
Big Dipper Placer County Underserved Last
Mile
Fiber and
Microwave
Radio
$117,000 $0 $117,000
5 Golden Bear
Broadband
Northern
California
Middle Mile
16 Counties in
Northern CA:
Butte, Colusa,
Del Norte,
Glenn
Humboldt,
Lake, Lassen,
Mendocino,
Modoc,
Plumas,
Shasta,
Siskiyou,
Sonoma,
Tehama,
Trinity and
Yolo
Hyrbid Middle
Mile
Fiber-Based
Middle Mile
Infrastructure
& Fixed
Wireless
capabilities
$119,394,315 $0 $119,394,315
6
Happy Valley
Telephone
Company
Olinda Last
Mile Shasta County Underserved
Last
Mile VDSL2 $1,833,689 $0 $1,833,689
35
Applicant
Name
Project
Name Location
Area Type
(Unserved/
Underserved/
Hybrid)
Project
Type
Technology
Type
CASF
GRANT
AMOUNT (Including
Contribution in Aid of
Construction)
CASF
LOAN
AMOUNT
TOTAL
CASF
FUNDING
7 Karuk Tribe
Klamath
River Rural
Broadband
Initiative
Yoruk and
Karuk tribal
territories
Hyrbid
Last
Mile
and
Middle
Mile
Fiber Optic
Network for
the middle
mile and the
communities
the project
will be serving
along the way
with a last
mile wireless
distribution
network.
$6,102,422 $0 $6,102,422
8 North County
Communications
Humboldt &
Del Norte
Fiber
Humboldt and
Del Norte
Counties
Underserved
Last
Mile
and
Middle
Mile
Fiber $14,828,917 $0 $14,828,917
9
Pinnacles
Telephone
Company
Pinnacles
Monument
San Benito
County Underserved
Last
Mile DSL $185,699 $0 $185,699
10
Ponderosa
Telephone
Company
Beasore-
Central
Camp
Madera County Unserved Last
Mile
Fiber To The
Home (FTTH) $1,755,042 $0 $1,755,042
11
Ponderosa
Telephone
Company
Big Creek Fresno County Hybrid Last
Mile
Fiber To The
Node (FTTN)
configuration
and VDSL /
ADSL2+
$898,574 $0 $898,574
12
Ponderosa
Telephone
Company
Cressman Fresno County Underserved Last
Mile
Fiber backhaul
and VDSL2
and ADSL2+
over twisted
copper pairs
$1,027,380 $0 $1,027,380
13
Ponderosa
Telephone
Company
DLC
Upgrade
Fresno and
Madera
Counties
Hybrid Last
Mile
VDSL2 and
ADSL2+ over
twisted copper
pairs
$945,000 $0 $945,000
14
Ponderosa
Telephone
Company
Wishon Fresno County Underserved Last
Mile
VDSL2 and
ADSL2+ over
twisted copper
pairs
$2,029,848 $0 $2,029,848
15 Race Telecom. California
City Kern County Underserved
Last
Mile
Fiber To The
Home (FTTH) $11,641,602 $0 $11,641,602
36
Applicant
Name
Project
Name Location
Area Type
(Unserved/
Underserved/
Hybrid)
Project
Type
Technology
Type
CASF
GRANT
AMOUNT (Including
Contribution in Aid of
Construction)
CASF
LOAN
AMOUNT
TOTAL
CASF
FUNDING
16 Race Telecom. City of
Boron Kern County Underserved
Last
Mile
Fiber To The
Home (FTTH) $4,685,570 $0 $4,685,570
17 Race Telecom. City of
Mojave Kern County Underserved
Last
Mile
Fiber To The
Home (FTTH) $4,191,488 $0 $4,191,488
18 Race Telecom. Kern County
High Desert Kern County Hybrid
Last
Mile
Fiber To The
Home (FTTH) $13,203,637 $0 $13,203,637
19 Race Telecom. Mono
County Mono County Hybrid
Last
Mile
Fiber To The
Home (FTTH) $4,650,593 $0 $4,650,593
20 Schat
Communications
Broadband
for Inyo
County
Inyo County Hybrid Last
Mile
Fiber and
WIMAX $1,414,725 $452,712 $1,867,437
21 Schat
Communications
Broadband
for Mono
County
Mono County Hybrid Last
Mile
Fiber and
WIMAX $1,450,477 $482,688 $1,933,165
22 Shasta County
Telecom
Shasta
County
Telecom
project
Shasta County Hybrid Last
Mile Fixed Wireless $2,500,000 $0 $2,500,000
23 Sunesys
C3 | The
Connected
Central
Coast
Santa Cruz and
Monterey
Counties
Hybrid Middle
Mile
Fiber Middle
Mile $11,970,000 $0 $11,970,000
24 Surfnet
Monterey
Dunes
Project
Monterey
County Underserved
Last
Mile Fiber $58,404 $19,468 $77,872
25 Surfnet Paradise
Road Project
Prunedale/Mon
terey County Underserved
Last
Mile
Fiber To The
Home (FTTH) $121,536 $40,152 $161,688
26 Surfnet
Santa Cruz
Mountains
Project
Santa Cruz
County Underserved
Last
Mile
Wireless and
FTTH $812,381 $270,794 $1,083,175
27 Viasat
Broadband
Via Satellite
for CA
Western
California Hybrid
Last
Mile Satellite $11,130,997 $0 $11,130,997
28 Willits Boonville Mendocino
County Underserved
Last
Mile ADSL2+ $126,831 $42,277 $169,108
29
Winterhaven
Telephone
Company
Winterhaven
Last Mile
Imperial
County Underserved
Last
Mile VDSL2 $2,063,967 $0 $2,063,967
37
Applicant
Name
Project
Name Location
Area Type
(Unserved/
Underserved/
Hybrid)
Project
Type
Technology
Type
CASF
GRANT
AMOUNT (Including
Contribution in Aid of
Construction)
CASF
LOAN
AMOUNT
TOTAL
CASF
FUNDING
30 Willits Westport Westport/Fort
Bragg Hybrid
Last
Mile ADSL2+ $161,500 $0 $161,500
TOTAL $238,975,611 $1,808,091 $240,783,702
38
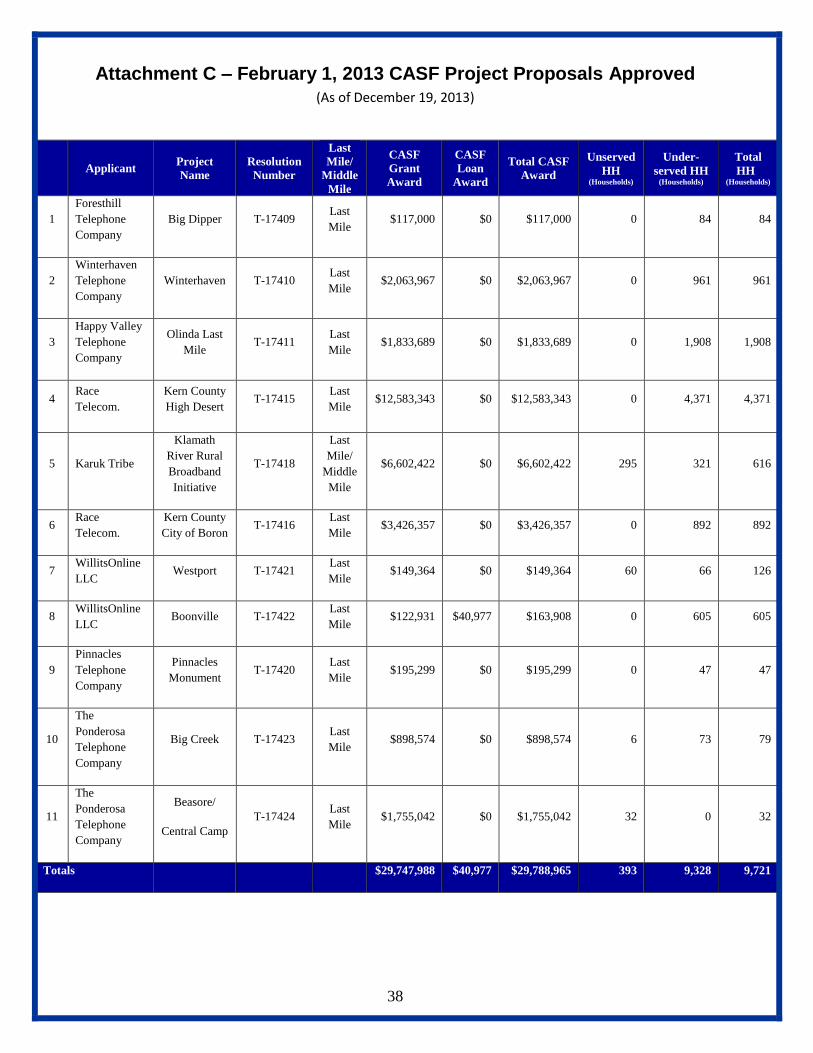
Attachment C – February 1, 2013 CASF Project Proposals Approved
(As of December 19, 2013)
Applicant Project
Name
Resolution
Number
Last
Mile/
Middle
Mile
CASF
Grant
Award
CASF
Loan
Award
Total CASF
Award
Unserved
HH (Households)
Under-
served HH (Households)
Total
HH (Households)
1
Foresthill
Telephone
Company
Big Dipper T-17409 Last
Mile $117,000 $0 $117,000 0 84 84
2
Winterhaven
Telephone
Company
Winterhaven T-17410 Last
Mile $2,063,967 $0 $2,063,967 0 961 961
3
Happy Valley
Telephone
Company
Olinda Last
Mile T-17411
Last
Mile $1,833,689 $0 $1,833,689 0 1,908 1,908
4 Race
Telecom.
Kern County
High Desert T-17415
Last
Mile $12,583,343 $0 $12,583,343 0 4,371 4,371
5 Karuk Tribe
Klamath
River Rural
Broadband
Initiative
T-17418
Last
Mile/
Middle
Mile
$6,602,422 $0 $6,602,422 295 321 616
6 Race
Telecom.
Kern County
City of Boron T-17416
Last
Mile $3,426,357 $0 $3,426,357 0 892 892
7 WillitsOnline
LLC Westport T-17421
Last
Mile $149,364 $0 $149,364 60 66 126
8 WillitsOnline
LLC Boonville T-17422
Last
Mile $122,931 $40,977 $163,908 0 605 605
9
Pinnacles
Telephone
Company
Pinnacles
Monument T-17420
Last
Mile $195,299 $0 $195,299 0 47 47
10
The
Ponderosa
Telephone
Company
Big Creek T-17423 Last
Mile $898,574 $0 $898,574 6 73 79
11
The
Ponderosa
Telephone
Company
Beasore/
Central Camp
T-17424 Last
Mile $1,755,042 $0 $1,755,042 32 0 32
Totals $29,747,988 $40,977 $29,788,965 393 9,328 9,721
39
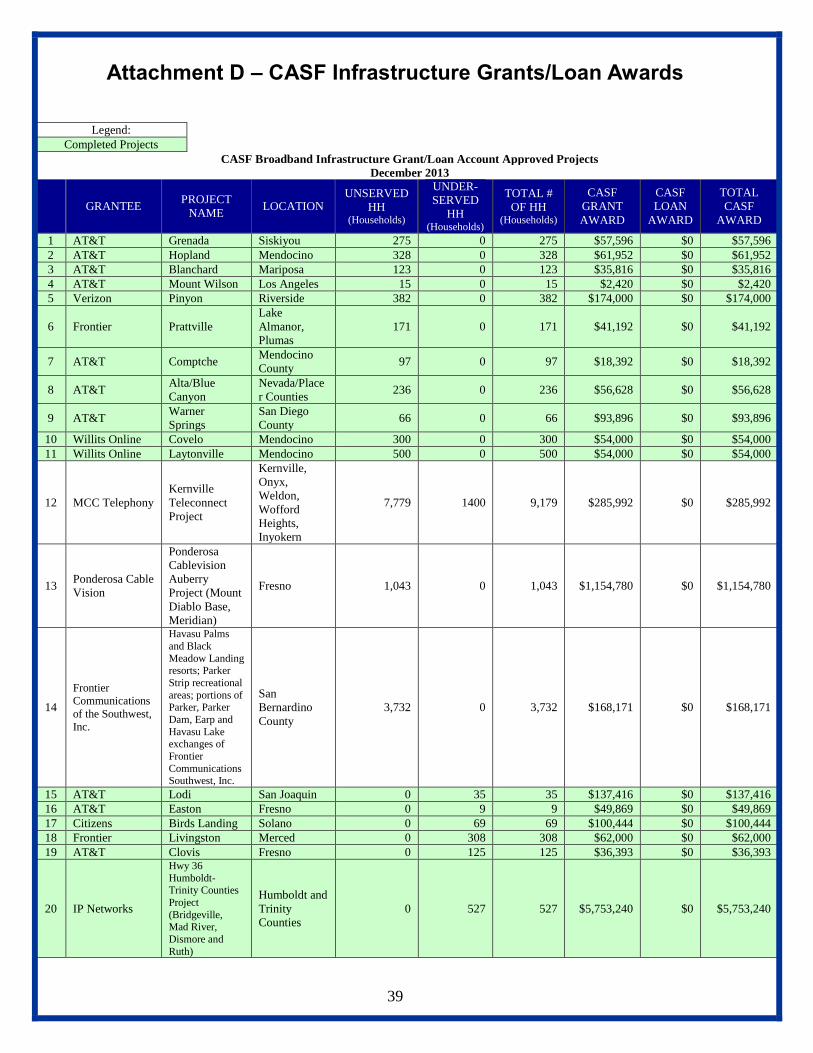
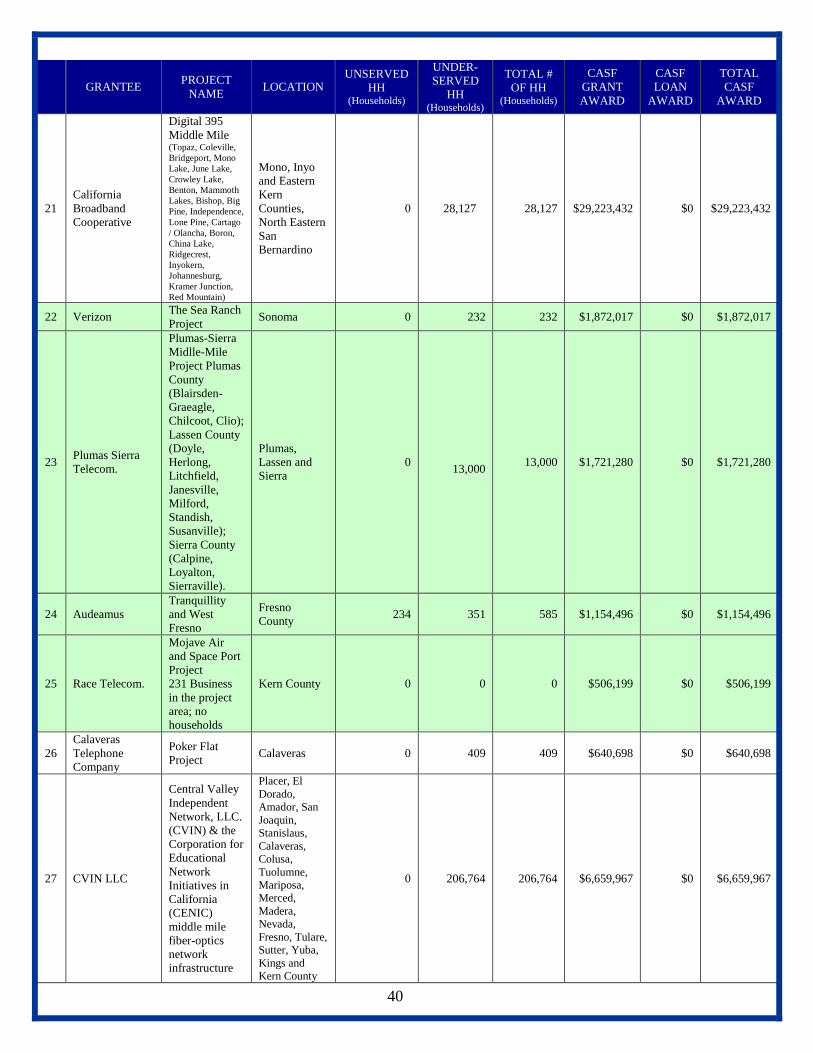
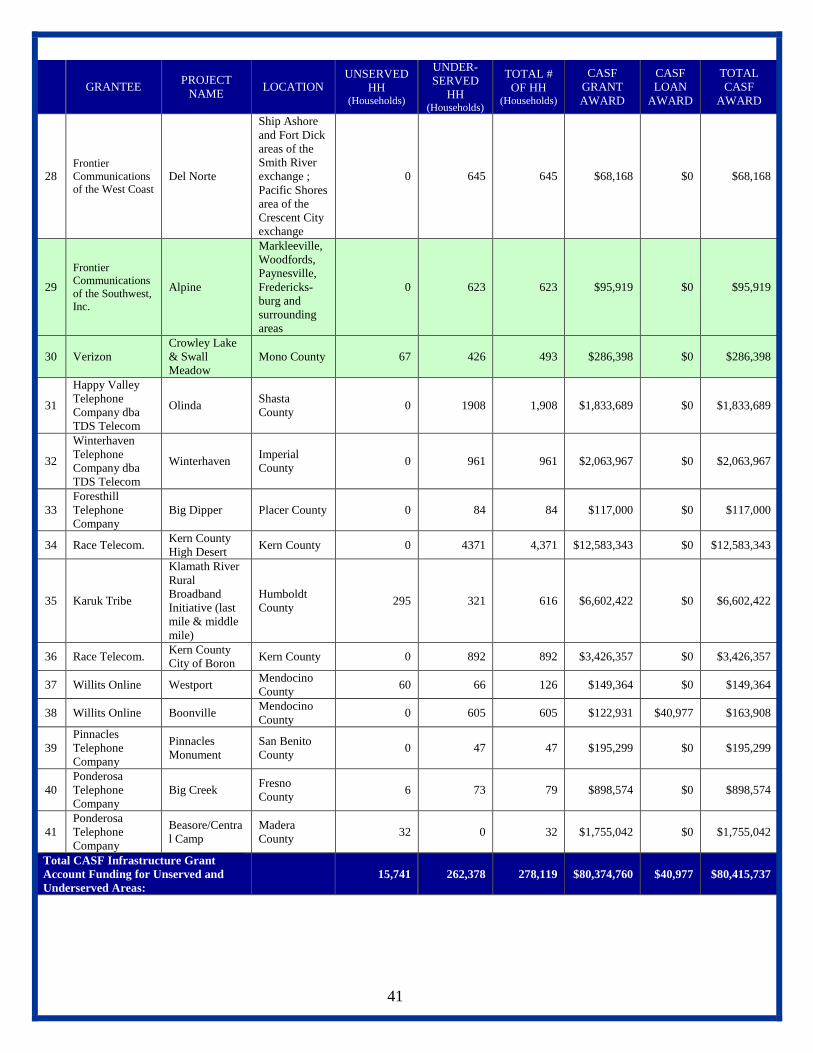
Attachment D – CASF Infrastructure Grants/Loan Awards
Legend:
Completed Projects
CASF Broadband Infrastructure Grant/Loan Account Approved Projects
December 2013
GRANTEE PROJECT
NAME LOCATION
UNSERVED
HH (Households)
UNDER-
SERVED
HH (Households)
TOTAL #
OF HH (Households)
CASF
GRANT
AWARD
CASF
LOAN
AWARD
TOTAL
CASF
AWARD
1 AT&T Grenada Siskiyou 275 0 275 $57,596 $0 $57,596
2 AT&T Hopland Mendocino 328 0 328 $61,952 $0 $61,952
3 AT&T Blanchard Mariposa 123 0 123 $35,816 $0 $35,816
4 AT&T Mount Wilson Los Angeles 15 0 15 $2,420 $0 $2,420
5 Verizon Pinyon Riverside 382 0 382 $174,000 $0 $174,000
6 Frontier Prattville
Lake
Almanor,
Plumas
171 0 171 $41,192 $0 $41,192
7 AT&T Comptche Mendocino
County 97 0 97 $18,392 $0 $18,392
8 AT&T Alta/Blue
Canyon
Nevada/Place
r Counties 236 0 236 $56,628 $0 $56,628
9 AT&T Warner
Springs
San Diego
County 66 0 66 $93,896 $0 $93,896
10 Willits Online Covelo Mendocino 300 0 300 $54,000 $0 $54,000
11 Willits Online Laytonville Mendocino 500 0 500 $54,000 $0 $54,000
12 MCC Telephony
Kernville
Teleconnect
Project
Kernville,
Onyx,
Weldon,
Wofford
Heights,
Inyokern
7,779 1400 9,179 $285,992 $0 $285,992
13 Ponderosa Cable
Vision
Ponderosa
Cablevision
Auberry
Project (Mount
Diablo Base,
Meridian)
Fresno 1,043 0 1,043 $1,154,780 $0 $1,154,780
14
Frontier
Communications
of the Southwest,
Inc.
Havasu Palms
and Black
Meadow Landing resorts; Parker
Strip recreational
areas; portions of Parker, Parker
Dam, Earp and
Havasu Lake exchanges of
Frontier
Communications Southwest, Inc.
San
Bernardino
County
3,732 0 3,732 $168,171 $0 $168,171
15 AT&T Lodi San Joaquin 0 35 35 $137,416 $0 $137,416
16 AT&T Easton Fresno 0 9 9 $49,869 $0 $49,869
17 Citizens Birds Landing Solano 0 69 69 $100,444 $0 $100,444
18 Frontier Livingston Merced 0 308 308 $62,000 $0 $62,000
19 AT&T Clovis Fresno 0 125 125 $36,393 $0 $36,393
20 IP Networks
Hwy 36
Humboldt-Trinity Counties
Project
(Bridgeville, Mad River,
Dismore and
Ruth)
Humboldt and
Trinity
Counties
0 527 527 $5,753,240 $0 $5,753,240
40
GRANTEE PROJECT
NAME LOCATION
UNSERVED
HH (Households)
UNDER-
SERVED
HH (Households)
TOTAL #
OF HH (Households)
CASF
GRANT
AWARD
CASF
LOAN
AWARD
TOTAL
CASF
AWARD
21
California
Broadband
Cooperative
Digital 395
Middle Mile (Topaz, Coleville,
Bridgeport, Mono
Lake, June Lake,
Crowley Lake,
Benton, Mammoth
Lakes, Bishop, Big
Pine, Independence,
Lone Pine, Cartago
/ Olancha, Boron,
China Lake,
Ridgecrest,
Inyokern,
Johannesburg,
Kramer Junction,
Red Mountain)
Mono, Inyo
and Eastern
Kern
Counties,
North Eastern
San
Bernardino
0 28,127 28,127 $29,223,432 $0 $29,223,432
22 Verizon The Sea Ranch
Project Sonoma 0 232 232 $1,872,017 $0 $1,872,017
23 Plumas Sierra
Telecom.
Plumas-Sierra
Midlle-Mile
Project Plumas
County
(Blairsden-
Graeagle,
Chilcoot, Clio);
Lassen County
(Doyle,
Herlong,
Litchfield,
Janesville,
Milford,
Standish,
Susanville);
Sierra County
(Calpine,
Loyalton,
Sierraville).
Plumas,
Lassen and
Sierra
0
13,000 13,000 $1,721,280 $0 $1,721,280
24 Audeamus
Tranquillity
and West
Fresno
Fresno
County 234 351 585 $1,154,496 $0 $1,154,496
25 Race Telecom.
Mojave Air
and Space Port
Project
231 Business
in the project
area; no
households
Kern County 0 0 0 $506,199 $0 $506,199
26
Calaveras
Telephone
Company
Poker Flat
Project Calaveras 0 409 409 $640,698 $0 $640,698
27 CVIN LLC
Central Valley
Independent
Network, LLC.
(CVIN) & the
Corporation for
Educational
Network
Initiatives in
California
(CENIC)
middle mile
fiber-optics
network
infrastructure
Placer, El
Dorado,
Amador, San
Joaquin,
Stanislaus,
Calaveras,
Colusa,
Tuolumne,
Mariposa,
Merced,
Madera,
Nevada,
Fresno, Tulare,
Sutter, Yuba,
Kings and
Kern County
0 206,764 206,764 $6,659,967 $0 $6,659,967
41
GRANTEE PROJECT
NAME LOCATION
UNSERVED
HH (Households)
UNDER-
SERVED
HH (Households)
TOTAL #
OF HH (Households)
CASF
GRANT
AWARD
CASF
LOAN
AWARD
TOTAL
CASF
AWARD
28 Frontier
Communications
of the West Coast Del Norte
Ship Ashore
and Fort Dick
areas of the
Smith River
exchange ;
Pacific Shores
area of the
Crescent City
exchange
0 645 645 $68,168 $0 $68,168
29
Frontier
Communications
of the Southwest,
Inc.
Alpine
Markleeville,
Woodfords,
Paynesville,
Fredericks-
burg and
surrounding
areas
0 623 623 $95,919 $0 $95,919
30 Verizon
Crowley Lake
& Swall
Meadow
Mono County 67 426 493 $286,398 $0 $286,398
31
Happy Valley
Telephone
Company dba
TDS Telecom
Olinda Shasta
County 0 1908 1,908 $1,833,689 $0 $1,833,689
32
Winterhaven
Telephone
Company dba
TDS Telecom
Winterhaven Imperial
County 0 961 961 $2,063,967 $0 $2,063,967
33
Foresthill
Telephone
Company
Big Dipper Placer County 0 84 84 $117,000 $0 $117,000
34 Race Telecom. Kern County
High Desert Kern County 0 4371 4,371 $12,583,343 $0 $12,583,343
35 Karuk Tribe
Klamath River
Rural
Broadband
Initiative (last
mile & middle
mile)
Humboldt
County 295 321 616 $6,602,422 $0 $6,602,422
36 Race Telecom. Kern County
City of Boron Kern County 0 892 892 $3,426,357 $0 $3,426,357
37 Willits Online Westport Mendocino
County 60 66 126 $149,364 $0 $149,364
38 Willits Online Boonville Mendocino
County 0 605 605 $122,931 $40,977 $163,908
39
Pinnacles
Telephone
Company
Pinnacles
Monument
San Benito
County 0 47 47 $195,299 $0 $195,299
40
Ponderosa
Telephone
Company
Big Creek Fresno
County 6 73 79 $898,574 $0 $898,574
41
Ponderosa
Telephone
Company
Beasore/Centra
l Camp
Madera
County 32 0 32 $1,755,042 $0 $1,755,042
Total CASF Infrastructure Grant
Account Funding for Unserved and
Underserved Areas:
15,741 262,378 278,119 $80,374,760 $40,977 $80,415,737
42
Attachment E - CASF Infrastructure Grant Account Project Payments Details
Item
# Recipient Project Name
Awarded
Amount
Pre-2011
Payments
2011
Payments
2012
Payments
2013
Payments
Total
Payments
(as of
12/31/2013)
Project
Status
1 AT&T
Alta/Blue
Canyon $56,628 $0 $56,628 $0 $0 $56,628 Completed
2 AT&T Blanchard $35,816 $0 $24,963 $0 $0 $24,963 Completed
3 AT&T Comptche $18,392 $0 $9,364 $0 $0 $9,364 Completed
4 AT&T Grenada $57,596 $0 $20,150 $0 $0 $20,150 Completed
5 AT&T Hopland $61,952 $0 $22,306 $0 $0 $22,306 Completed
6 AT&T Mt. Wilson $2,420 $0 $859 $0 $0 $859 Completed
7 AT&T
Warner
Springs $93,896 $0 $43,985 $0 $0 $43,985 Completed
8 AT&T Lodi $137,416 $0 $0 $45,541 $0 $45,541 Completed
9 AT&T Clovis $36,393 $0 $0 $36,393 $0 $36,393 Completed
10 AT&T Easton $49,869 $0 $0 $36,354 $0 $36,354 Completed
Total AT&T $550,378 $0 $178,254 $118,289 $0 $296,543
11 Audeamus
Tranquility and
West Fresno $1,154,496 $0 $928,554 $0 $225,941 $1,154,494 Completed
Total Audeamus $1,154,496 $0 $928,554 $0 $225,941 $1,154,494
12 Frontier Birds Landing $100,444 $0 $99,130 $0 $0 $99,130 Completed
13 Frontier Livingston $62,000 $0 $39,555 $0 $0 $39,555 Completed
Total Frontier $162,444 $0 $138,685 $0 $0 $138,685
14
&
15 Willits Online
Covelo &
Laytonville $108,000 $78,008 $24,017 $0 $0 $102,025 Completed
Total Willits Online $108,000 $78,008 $24,017 $0 $0 $102,025
16 IP Networks
Hwy 36
Hubmboldt-
Trinity
Counties $5,753,240 $0 $3,159,738 $2,593,503 $0 $5,753,241 Completed
Total IP Networks $5,753,240 $0 $3,159,738 $2,593,503 $0 $5,753,241
17
Calaveras
Telephone
Company
Poker Flat
Project $640,698 $0 $0 $256,579 $91,674 $348,254
In-
Progress
Total Calaveras Telephone Company $640,698 $0 $0 $256,579 $91,674 $348,254
18
California
Broadband
Cooperative
(Inyo
Network) Digital 395 $29,223,432 $0 $0 $6,413,765 $18,750,724 $25,164,489
In-
Progress
Total CBC (Inyo Networks) $29,223,432 $0 $0 $6,413,765 $18,750,724 $25,164,489
19
Plumas Sierra
Telecommunic
ations
Plumas-Sierra
Midlle-Mile
Project Plumas
County $1,721,280 $0 $0 $924,331 $333,784 $1,258,115 Completed
Total Plumas Sierra
Telecommunications $1,721,280 $0 $0 $924,331 $333,784 $1,258,115
20 CVIN LLC
Central Valley
Independent
Network, LLC
middle mile
fiber-optics
network
infrastructure $6,659,967 $0 $0 $0 6,004,348 6,004,348
In-
Progress
Total CVIN LLC $6,659,967 $0 $0 $0 6,004,348 6,004,348
21 Race Telecom.
Mojave Air
and Space Port
Project $506,199 $0 $0 $0 494,419 494,419 Completed
Total Race Telecom. $506,199 $0 $0 $0 494,419 494,419
Grand Total $78,008 $4,429,249 $10,306,467 $25,900,889 $40,714,613
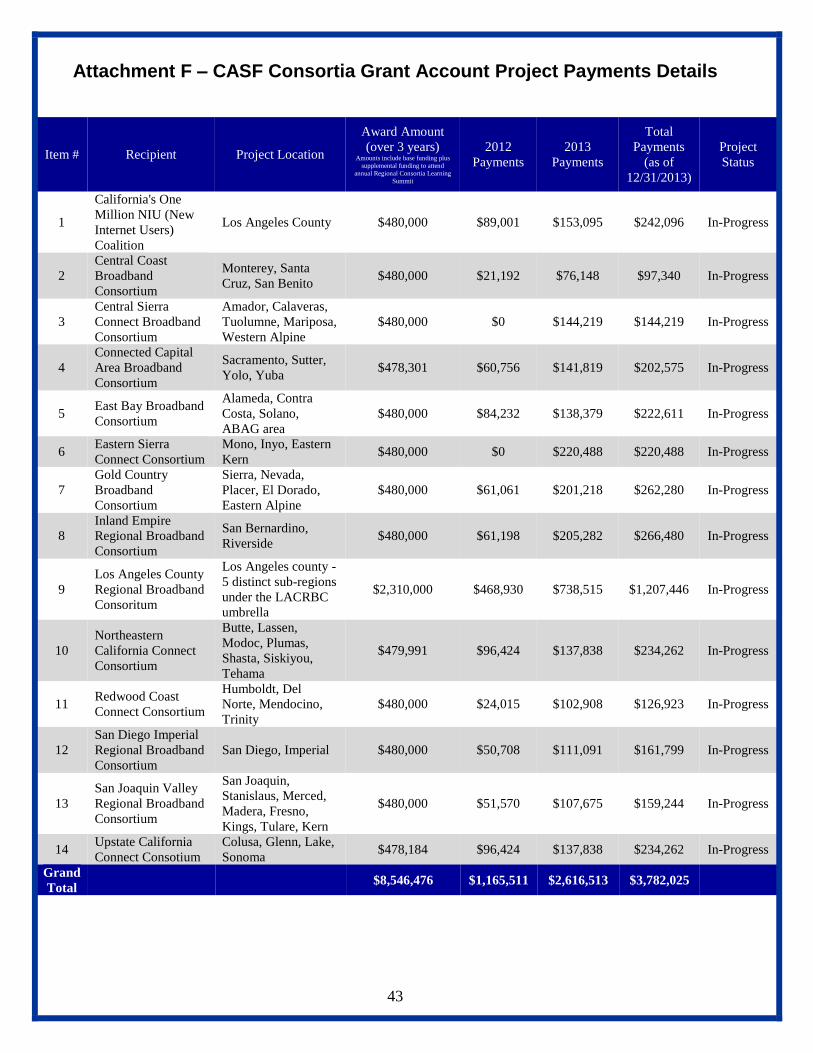
43
Attachment F – CASF Consortia Grant Account Project Payments Details
Item # Recipient Project Location
Award Amount
(over 3 years) Amounts include base funding plus
supplemental funding to attend
annual Regional Consortia Learning
Summit
2012
Payments
2013
Payments
Total
Payments
(as of
12/31/2013)
Project
Status
1
California's One
Million NIU (New
Internet Users)
Coalition
Los Angeles County $480,000 $89,001 $153,095 $242,096 In-Progress
2
Central Coast
Broadband
Consortium
Monterey, Santa
Cruz, San Benito $480,000 $21,192 $76,148 $97,340 In-Progress
3
Central Sierra
Connect Broadband
Consortium
Amador, Calaveras,
Tuolumne, Mariposa,
Western Alpine
$480,000 $0 $144,219 $144,219 In-Progress
4
Connected Capital
Area Broadband
Consortium
Sacramento, Sutter,
Yolo, Yuba $478,301 $60,756 $141,819 $202,575 In-Progress
5 East Bay Broadband
Consortium
Alameda, Contra
Costa, Solano,
ABAG area
$480,000 $84,232 $138,379 $222,611 In-Progress
6 Eastern Sierra
Connect Consortium
Mono, Inyo, Eastern
Kern $480,000 $0 $220,488 $220,488 In-Progress
7
Gold Country
Broadband
Consortium
Sierra, Nevada,
Placer, El Dorado,
Eastern Alpine
$480,000 $61,061 $201,218 $262,280 In-Progress
8
Inland Empire
Regional Broadband
Consortium
San Bernardino,
Riverside $480,000 $61,198 $205,282 $266,480 In-Progress
9
Los Angeles County
Regional Broadband
Consoritum
Los Angeles county -
5 distinct sub-regions
under the LACRBC
umbrella
$2,310,000 $468,930 $738,515 $1,207,446 In-Progress
10
Northeastern
California Connect
Consortium
Butte, Lassen,
Modoc, Plumas,
Shasta, Siskiyou,
Tehama
$479,991 $96,424 $137,838 $234,262 In-Progress
11 Redwood Coast
Connect Consortium
Humboldt, Del
Norte, Mendocino,
Trinity
$480,000 $24,015 $102,908 $126,923 In-Progress
12
San Diego Imperial
Regional Broadband
Consortium
San Diego, Imperial $480,000 $50,708 $111,091 $161,799 In-Progress
13
San Joaquin Valley
Regional Broadband
Consortium
San Joaquin,
Stanislaus, Merced,
Madera, Fresno,
Kings, Tulare, Kern
$480,000 $51,570 $107,675 $159,244 In-Progress
14 Upstate California
Connect Consotium
Colusa, Glenn, Lake,
Sonoma $478,184 $96,424 $137,838 $234,262 In-Progress
Grand
Total $8,546,476 $1,165,511 $2,616,513 $3,782,025
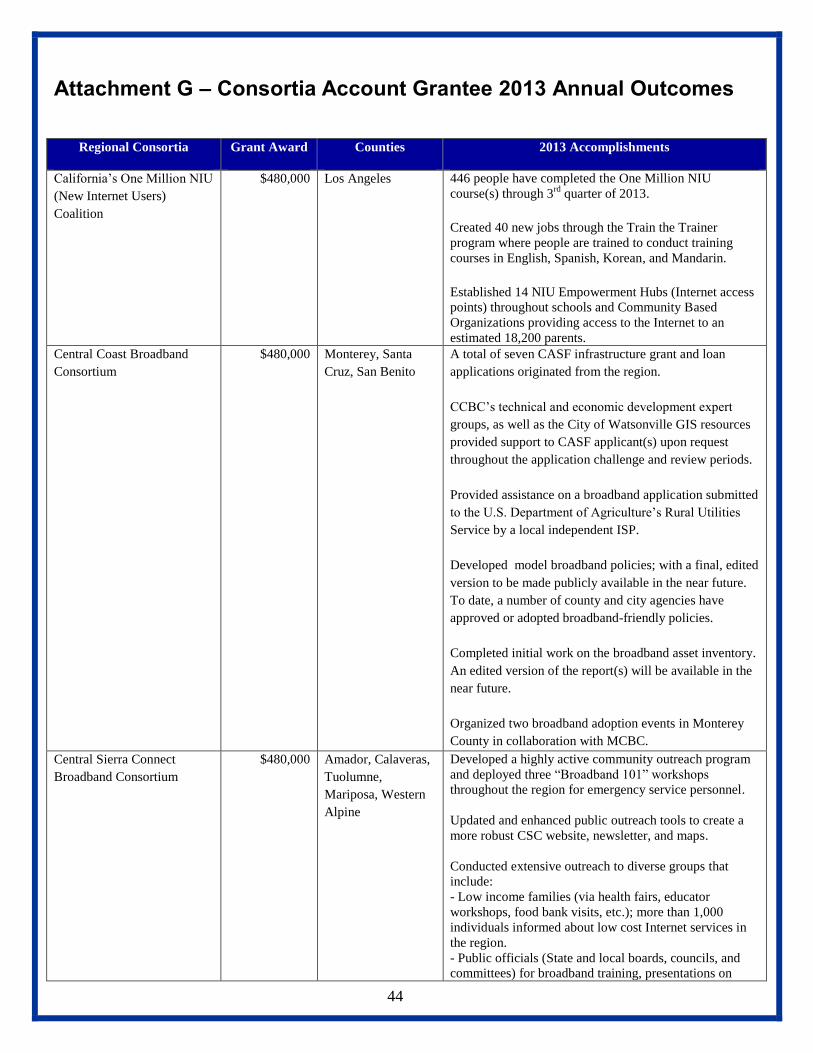
44
Attachment G – Consortia Account Grantee 2013 Annual Outcomes
Regional Consortia Grant Award Counties 2013 Accomplishments
California’s One Million NIU
(New Internet Users)
Coalition
$480,000 Los Angeles 446 people have completed the One Million NIU
course(s) through 3rd
quarter of 2013.
Created 40 new jobs through the Train the Trainer
program where people are trained to conduct training
courses in English, Spanish, Korean, and Mandarin.
Established 14 NIU Empowerment Hubs (Internet access
points) throughout schools and Community Based
Organizations providing access to the Internet to an
estimated 18,200 parents.
Central Coast Broadband
Consortium
$480,000 Monterey, Santa
Cruz, San Benito
A total of seven CASF infrastructure grant and loan
applications originated from the region.
CCBC’s technical and economic development expert
groups, as well as the City of Watsonville GIS resources
provided support to CASF applicant(s) upon request
throughout the application challenge and review periods.
Provided assistance on a broadband application submitted
to the U.S. Department of Agriculture’s Rural Utilities
Service by a local independent ISP.
Developed model broadband policies; with a final, edited
version to be made publicly available in the near future.
To date, a number of county and city agencies have
approved or adopted broadband-friendly policies.
Completed initial work on the broadband asset inventory.
An edited version of the report(s) will be available in the
near future.
Organized two broadband adoption events in Monterey
County in collaboration with MCBC.
Central Sierra Connect
Broadband Consortium
$480,000 Amador, Calaveras,
Tuolumne,
Mariposa, Western
Alpine
Developed a highly active community outreach program
and deployed three “Broadband 101” workshops
throughout the region for emergency service personnel.
Updated and enhanced public outreach tools to create a
more robust CSC website, newsletter, and maps.
Conducted extensive outreach to diverse groups that
include:
- Low income families (via health fairs, educator
workshops, food bank visits, etc.); more than 1,000
individuals informed about low cost Internet services in
the region. - Public officials (State and local boards, councils, and
committees) for broadband training, presentations on

45
consortium work including mapping, need for ongoing
infrastructure support and investment, obstacles for rural
communities, etc. to over 50 public officials and related
audience participants. - Trained 300 individuals in Tuolumne County in digital
literacy by partnering with the CA Connect Literacy
Program. - Encouraged greater ISP involvement by reaching out to
seven smaller providers within the region. - Outreach to about 30 Emergency Service personnel
(ambulance, fire, law enforcement and emergency service
coordinators) in the five county region. - Presented to and partnered with numerous business
organizations (chambers, business council, visitors
bureaus, etc.) educating and making the case for
expanded broadband availability and increased adoption.
Total reached: 300-plus. Connected Capital Area
Broadband Consortium
$478,301 Sacramento, Sutter,
Yolo, Yuba
Launched efforts to increase broadband adoption and
digital literacy in Yuba County’s Linda community and
in South Sacramento. The South Sacramento school fair
resulted in new enrollees to Comcast Internet Essentials
and 50 families purchasing low cost computers.
Developed a brochure summarizing local Internet
adoption resources in Yuba and Sutter Counties and
distributed through middle and high school mentors.
Building partnerships to seek at-home connections
families residing in federally subsidized housing units in
South Sacramento.
Published the Wireless Broadband and You document
that summarizes the state of research associated with
mobile broadband towers.
Raised the awareness of broadband benefits and
challenges to close the digital divide with local, State,
and federal elected officials and regional leaders resulting
in:
- Yolo County and its incorporated cities developing a
countywide broadband strategic plan to keep the county
economically and educationally competitive. - Broadband included in the Sacramento Area Council of
Government’s 2014 Draft Federal Advocacy Principles
proposal. - The California Air Resources Board is considering
promotion of broadband infrastructure within their AB
32 Scoping Plan update, thanks to the CCABC’s
testimony and comments submitted to the Board and
staff. - The California High Speed Rail Authority is actively
evaluating deployment of additional fiber with their
build to potentially serve as a middle mile along the
train’s route.
- In partnership with CETF, the League of California
Cities, RCRC and CSAC, convened a Local
Government Officials Roundtable to engage a “critical
mass” of key Local Government Officials throughout
California to become active champions in closing the
Digital Divide.
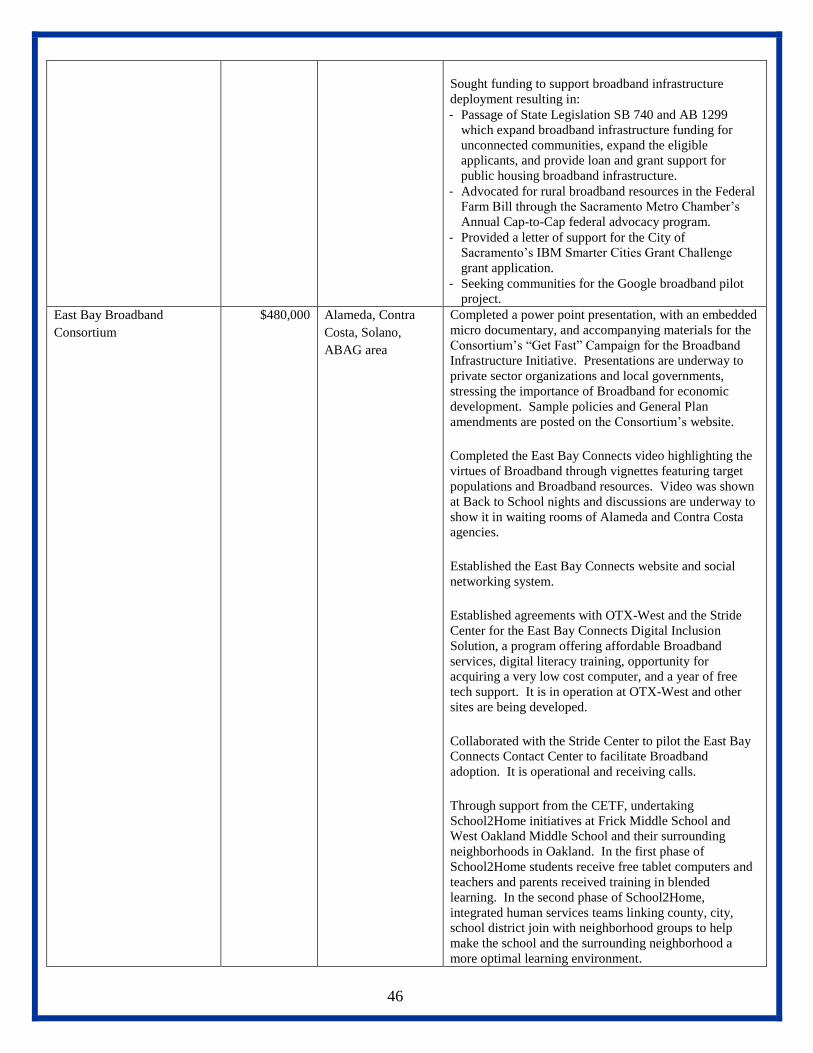
46
Sought funding to support broadband infrastructure
deployment resulting in:
- Passage of State Legislation SB 740 and AB 1299
which expand broadband infrastructure funding for
unconnected communities, expand the eligible
applicants, and provide loan and grant support for
public housing broadband infrastructure. - Advocated for rural broadband resources in the Federal
Farm Bill through the Sacramento Metro Chamber’s
Annual Cap-to-Cap federal advocacy program. - Provided a letter of support for the City of
Sacramento’s IBM Smarter Cities Grant Challenge
grant application. - Seeking communities for the Google broadband pilot
project. East Bay Broadband
Consortium
$480,000 Alameda, Contra
Costa, Solano,
ABAG area
Completed a power point presentation, with an embedded
micro documentary, and accompanying materials for the
Consortium’s “Get Fast” Campaign for the Broadband
Infrastructure Initiative. Presentations are underway to
private sector organizations and local governments,
stressing the importance of Broadband for economic
development. Sample policies and General Plan
amendments are posted on the Consortium’s website.
Completed the East Bay Connects video highlighting the
virtues of Broadband through vignettes featuring target
populations and Broadband resources. Video was shown
at Back to School nights and discussions are underway to
show it in waiting rooms of Alameda and Contra Costa
agencies.
Established the East Bay Connects website and social
networking system.
Established agreements with OTX-West and the Stride
Center for the East Bay Connects Digital Inclusion
Solution, a program offering affordable Broadband
services, digital literacy training, opportunity for
acquiring a very low cost computer, and a year of free
tech support. It is in operation at OTX-West and other
sites are being developed.
Collaborated with the Stride Center to pilot the East Bay
Connects Contact Center to facilitate Broadband
adoption. It is operational and receiving calls.
Through support from the CETF, undertaking
School2Home initiatives at Frick Middle School and
West Oakland Middle School and their surrounding
neighborhoods in Oakland. In the first phase of
School2Home students receive free tablet computers and
teachers and parents received training in blended
learning. In the second phase of School2Home,
integrated human services teams linking county, city,
school district join with neighborhood groups to help
make the school and the surrounding neighborhood a
more optimal learning environment.
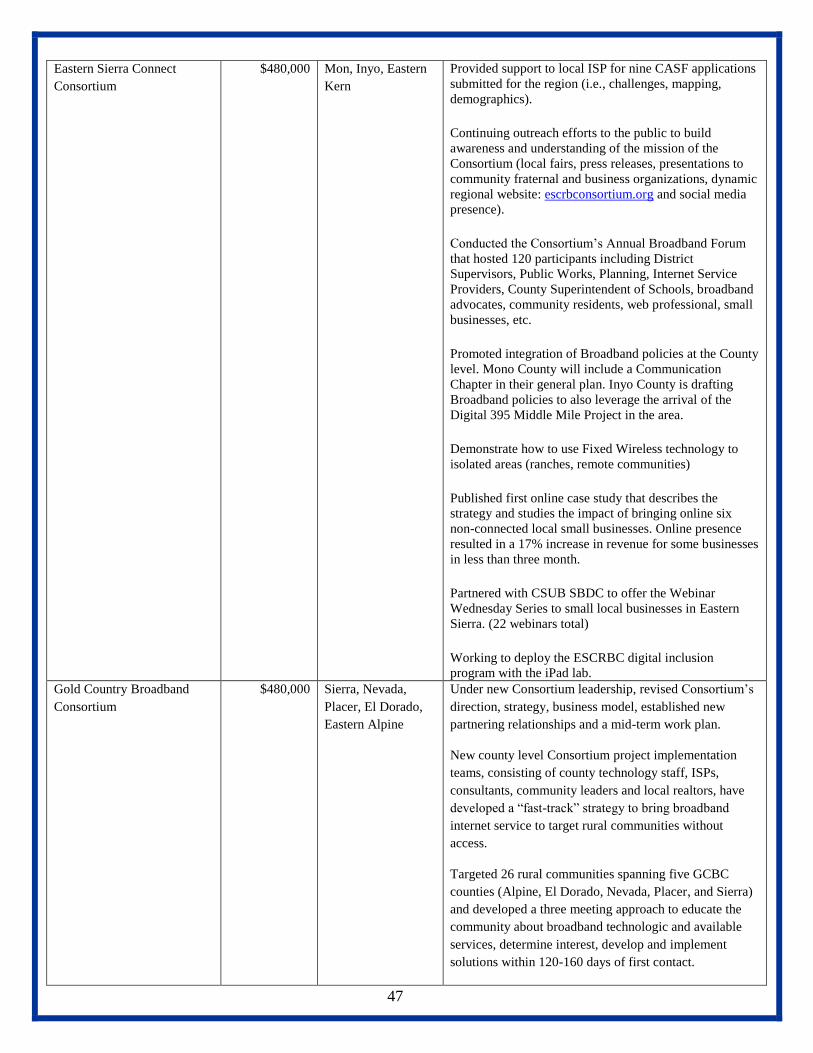
47
Eastern Sierra Connect
Consortium
$480,000 Mon, Inyo, Eastern
Kern
Provided support to local ISP for nine CASF applications
submitted for the region (i.e., challenges, mapping,
demographics).
Continuing outreach efforts to the public to build
awareness and understanding of the mission of the
Consortium (local fairs, press releases, presentations to
community fraternal and business organizations, dynamic
regional website: escrbconsortium.org and social media
presence).
Conducted the Consortium’s Annual Broadband Forum
that hosted 120 participants including District
Supervisors, Public Works, Planning, Internet Service
Providers, County Superintendent of Schools, broadband
advocates, community residents, web professional, small
businesses, etc.
Promoted integration of Broadband policies at the County
level. Mono County will include a Communication
Chapter in their general plan. Inyo County is drafting
Broadband policies to also leverage the arrival of the
Digital 395 Middle Mile Project in the area.
Demonstrate how to use Fixed Wireless technology to
isolated areas (ranches, remote communities)
Published first online case study that describes the
strategy and studies the impact of bringing online six
non-connected local small businesses. Online presence
resulted in a 17% increase in revenue for some businesses
in less than three month.
Partnered with CSUB SBDC to offer the Webinar
Wednesday Series to small local businesses in Eastern
Sierra. (22 webinars total)
Working to deploy the ESCRBC digital inclusion
program with the iPad lab.
Gold Country Broadband
Consortium
$480,000 Sierra, Nevada,
Placer, El Dorado,
Eastern Alpine
Under new Consortium leadership, revised Consortium’s
direction, strategy, business model, established new
partnering relationships and a mid-term work plan.
New county level Consortium project implementation
teams, consisting of county technology staff, ISPs,
consultants, community leaders and local realtors, have
developed a “fast-track” strategy to bring broadband
internet service to target rural communities without
access.
Targeted 26 rural communities spanning five GCBC
counties (Alpine, El Dorado, Nevada, Placer, and Sierra)
and developed a three meeting approach to educate the
community about broadband technologic and available
services, determine interest, develop and implement
solutions within 120-160 days of first contact.
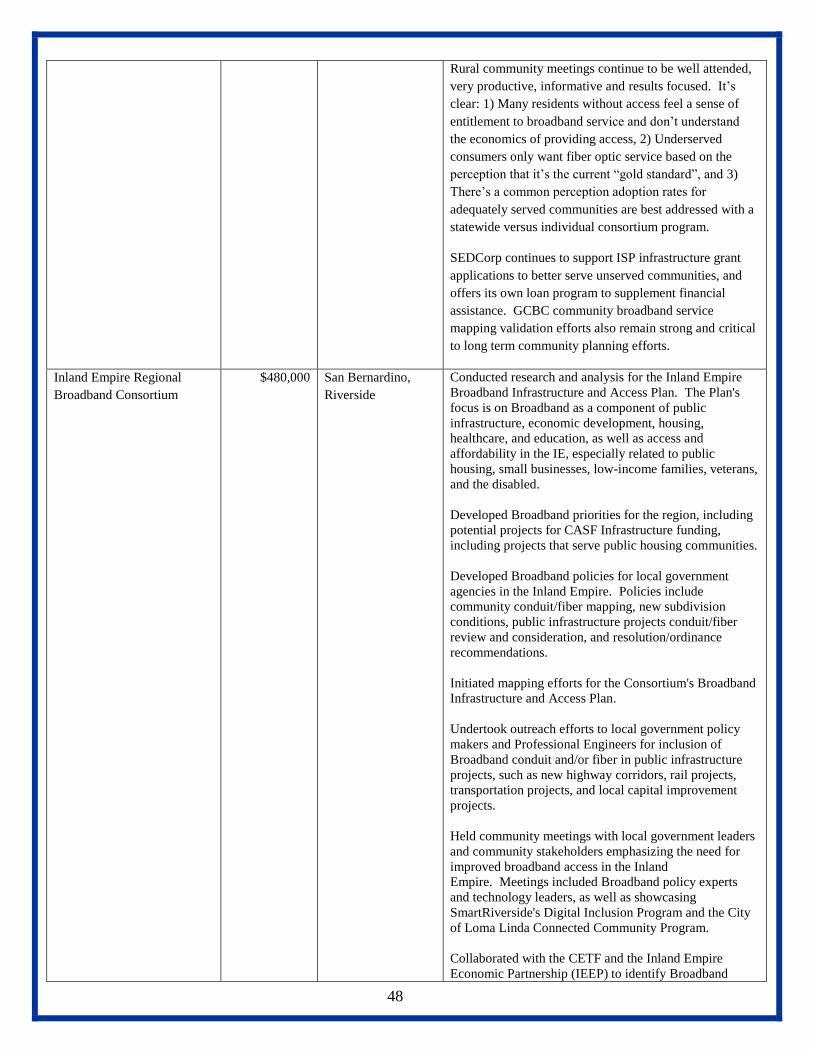
48
Rural community meetings continue to be well attended,
very productive, informative and results focused. It’s
clear: 1) Many residents without access feel a sense of
entitlement to broadband service and don’t understand
the economics of providing access, 2) Underserved
consumers only want fiber optic service based on the
perception that it’s the current “gold standard”, and 3)
There’s a common perception adoption rates for
adequately served communities are best addressed with a
statewide versus individual consortium program.
SEDCorp continues to support ISP infrastructure grant
applications to better serve unserved communities, and
offers its own loan program to supplement financial
assistance. GCBC community broadband service
mapping validation efforts also remain strong and critical
to long term community planning efforts.
Inland Empire Regional
Broadband Consortium
$480,000 San Bernardino,
Riverside
Conducted research and analysis for the Inland Empire
Broadband Infrastructure and Access Plan. The Plan's
focus is on Broadband as a component of public
infrastructure, economic development, housing,
healthcare, and education, as well as access and
affordability in the IE, especially related to public
housing, small businesses, low-income families, veterans,
and the disabled.
Developed Broadband priorities for the region, including
potential projects for CASF Infrastructure funding,
including projects that serve public housing communities.
Developed Broadband policies for local government
agencies in the Inland Empire. Policies include
community conduit/fiber mapping, new subdivision
conditions, public infrastructure projects conduit/fiber
review and consideration, and resolution/ordinance
recommendations.
Initiated mapping efforts for the Consortium's Broadband
Infrastructure and Access Plan.
Undertook outreach efforts to local government policy
makers and Professional Engineers for inclusion of
Broadband conduit and/or fiber in public infrastructure
projects, such as new highway corridors, rail projects,
transportation projects, and local capital improvement
projects.
Held community meetings with local government leaders
and community stakeholders emphasizing the need for
improved broadband access in the Inland
Empire. Meetings included Broadband policy experts
and technology leaders, as well as showcasing
SmartRiverside's Digital Inclusion Program and the City
of Loma Linda Connected Community Program.
Collaborated with the CETF and the Inland Empire
Economic Partnership (IEEP) to identify Broadband
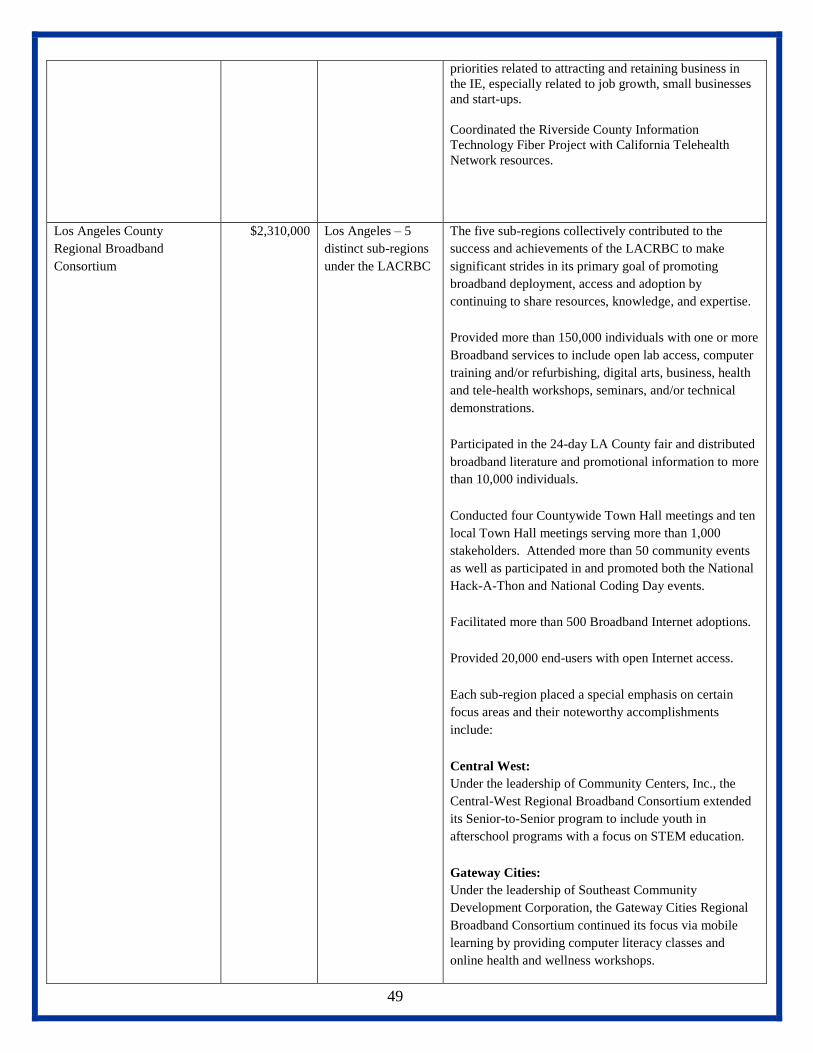
49
priorities related to attracting and retaining business in
the IE, especially related to job growth, small businesses
and start-ups.
Coordinated the Riverside County Information
Technology Fiber Project with California Telehealth
Network resources.
Los Angeles County
Regional Broadband
Consortium
$2,310,000 Los Angeles – 5
distinct sub-regions
under the LACRBC
The five sub-regions collectively contributed to the
success and achievements of the LACRBC to make
significant strides in its primary goal of promoting
broadband deployment, access and adoption by
continuing to share resources, knowledge, and expertise.
Provided more than 150,000 individuals with one or more
Broadband services to include open lab access, computer
training and/or refurbishing, digital arts, business, health
and tele-health workshops, seminars, and/or technical
demonstrations.
Participated in the 24-day LA County fair and distributed
broadband literature and promotional information to more
than 10,000 individuals.
Conducted four Countywide Town Hall meetings and ten
local Town Hall meetings serving more than 1,000
stakeholders. Attended more than 50 community events
as well as participated in and promoted both the National
Hack-A-Thon and National Coding Day events.
Facilitated more than 500 Broadband Internet adoptions.
Provided 20,000 end-users with open Internet access.
Each sub-region placed a special emphasis on certain
focus areas and their noteworthy accomplishments
include:
Central West:
Under the leadership of Community Centers, Inc., the
Central-West Regional Broadband Consortium extended
its Senior-to-Senior program to include youth in
afterschool programs with a focus on STEM education.
Gateway Cities:
Under the leadership of Southeast Community
Development Corporation, the Gateway Cities Regional
Broadband Consortium continued its focus via mobile
learning by providing computer literacy classes and
online health and wellness workshops.
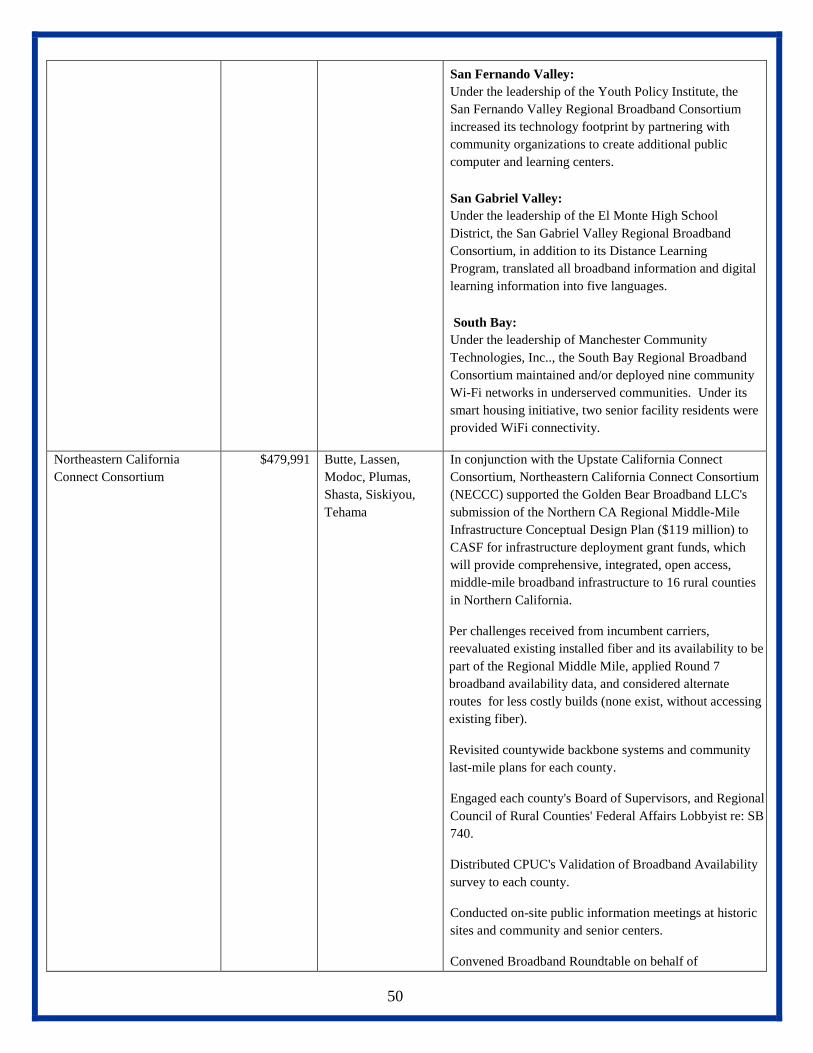
50
San Fernando Valley:
Under the leadership of the Youth Policy Institute, the
San Fernando Valley Regional Broadband Consortium
increased its technology footprint by partnering with
community organizations to create additional public
computer and learning centers.
San Gabriel Valley:
Under the leadership of the El Monte High School
District, the San Gabriel Valley Regional Broadband
Consortium, in addition to its Distance Learning
Program, translated all broadband information and digital
learning information into five languages.
South Bay:
Under the leadership of Manchester Community
Technologies, Inc.., the South Bay Regional Broadband
Consortium maintained and/or deployed nine community
Wi-Fi networks in underserved communities. Under its
smart housing initiative, two senior facility residents were
provided WiFi connectivity.
Northeastern California
Connect Consortium
$479,991 Butte, Lassen,
Modoc, Plumas,
Shasta, Siskiyou,
Tehama
In conjunction with the Upstate California Connect
Consortium, Northeastern California Connect Consortium
(NECCC) supported the Golden Bear Broadband LLC's
submission of the Northern CA Regional Middle-Mile
Infrastructure Conceptual Design Plan ($119 million) to
CASF for infrastructure deployment grant funds, which
will provide comprehensive, integrated, open access,
middle-mile broadband infrastructure to 16 rural counties
in Northern California.
Per challenges received from incumbent carriers,
reevaluated existing installed fiber and its availability to be
part of the Regional Middle Mile, applied Round 7
broadband availability data, and considered alternate
routes for less costly builds (none exist, without accessing
existing fiber).
Revisited countywide backbone systems and community
last-mile plans for each county.
Engaged each county's Board of Supervisors, and Regional
Council of Rural Counties' Federal Affairs Lobbyist re: SB
740.
Distributed CPUC's Validation of Broadband Availability
survey to each county.
Conducted on-site public information meetings at historic
sites and community and senior centers.
Convened Broadband Roundtable on behalf of
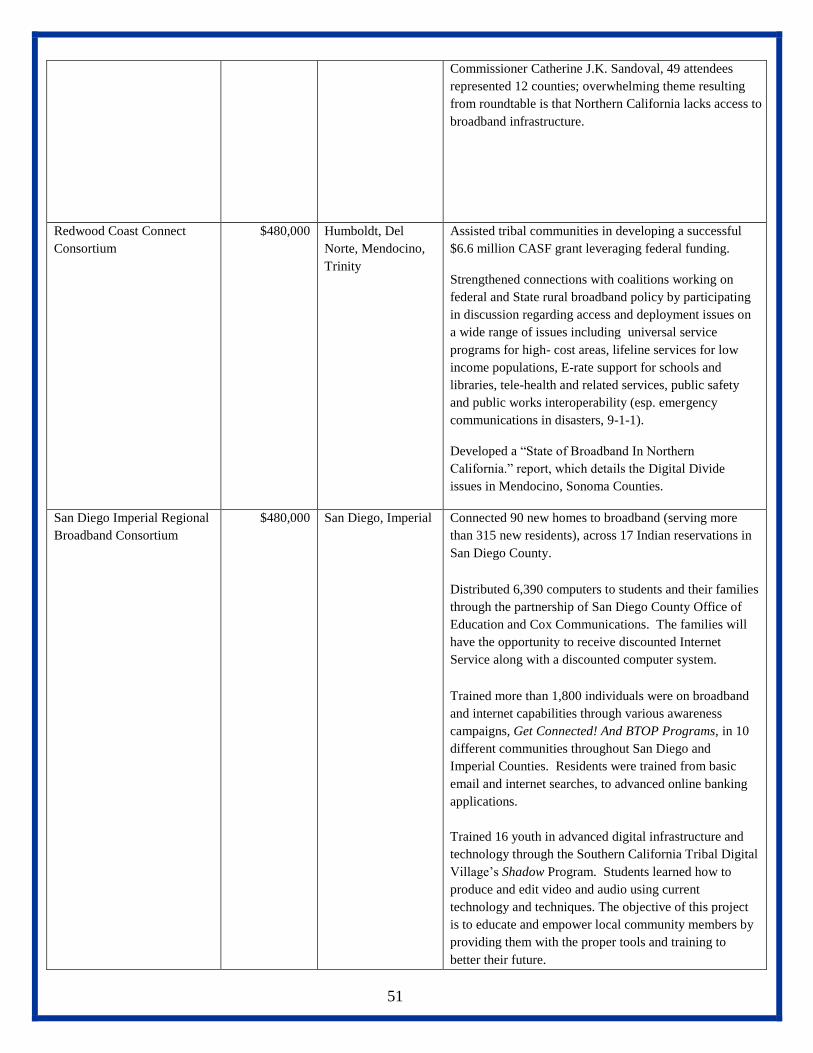
51
Commissioner Catherine J.K. Sandoval, 49 attendees
represented 12 counties; overwhelming theme resulting
from roundtable is that Northern California lacks access to
broadband infrastructure.
Redwood Coast Connect
Consortium
$480,000 Humboldt, Del
Norte, Mendocino,
Trinity
Assisted tribal communities in developing a successful
$6.6 million CASF grant leveraging federal funding.
Strengthened connections with coalitions working on
federal and State rural broadband policy by participating
in discussion regarding access and deployment issues on
a wide range of issues including universal service
programs for high- cost areas, lifeline services for low
income populations, E-rate support for schools and
libraries, tele-health and related services, public safety
and public works interoperability (esp. emergency
communications in disasters, 9-1-1).
Developed a “State of Broadband In Northern
California.” report, which details the Digital Divide
issues in Mendocino, Sonoma Counties.
San Diego Imperial Regional
Broadband Consortium
$480,000 San Diego, Imperial Connected 90 new homes to broadband (serving more
than 315 new residents), across 17 Indian reservations in
San Diego County.
Distributed 6,390 computers to students and their families
through the partnership of San Diego County Office of
Education and Cox Communications. The families will
have the opportunity to receive discounted Internet
Service along with a discounted computer system.
Trained more than 1,800 individuals were on broadband
and internet capabilities through various awareness
campaigns, Get Connected! And BTOP Programs, in 10
different communities throughout San Diego and
Imperial Counties. Residents were trained from basic
email and internet searches, to advanced online banking
applications.
Trained 16 youth in advanced digital infrastructure and
technology through the Southern California Tribal Digital
Village’s Shadow Program. Students learned how to
produce and edit video and audio using current
technology and techniques. The objective of this project
is to educate and empower local community members by
providing them with the proper tools and training to
better their future.
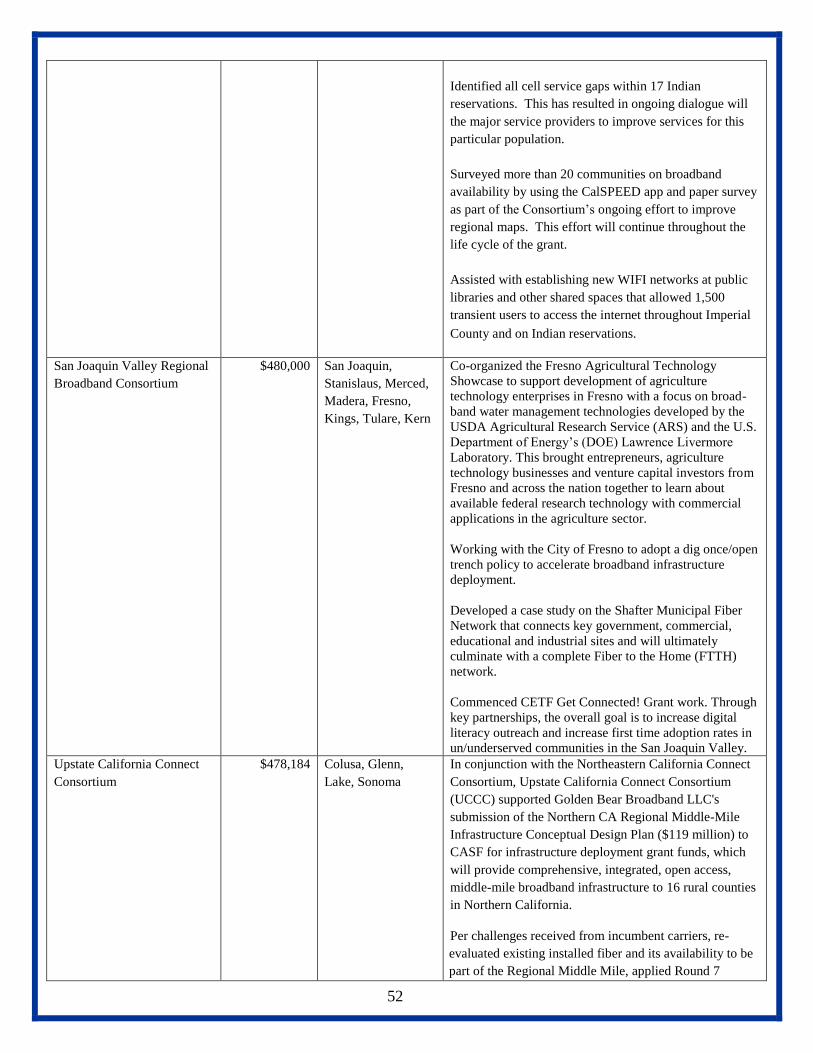
52
Identified all cell service gaps within 17 Indian
reservations. This has resulted in ongoing dialogue will
the major service providers to improve services for this
particular population.
Surveyed more than 20 communities on broadband
availability by using the CalSPEED app and paper survey
as part of the Consortium’s ongoing effort to improve
regional maps. This effort will continue throughout the
life cycle of the grant.
Assisted with establishing new WIFI networks at public
libraries and other shared spaces that allowed 1,500
transient users to access the internet throughout Imperial
County and on Indian reservations.
San Joaquin Valley Regional
Broadband Consortium
$480,000 San Joaquin,
Stanislaus, Merced,
Madera, Fresno,
Kings, Tulare, Kern
Co-organized the Fresno Agricultural Technology
Showcase to support development of agriculture
technology enterprises in Fresno with a focus on broad-
band water management technologies developed by the
USDA Agricultural Research Service (ARS) and the U.S.
Department of Energy’s (DOE) Lawrence Livermore
Laboratory. This brought entrepreneurs, agriculture
technology businesses and venture capital investors from
Fresno and across the nation together to learn about
available federal research technology with commercial
applications in the agriculture sector.
Working with the City of Fresno to adopt a dig once/open
trench policy to accelerate broadband infrastructure
deployment.
Developed a case study on the Shafter Municipal Fiber
Network that connects key government, commercial,
educational and industrial sites and will ultimately
culminate with a complete Fiber to the Home (FTTH)
network.
Commenced CETF Get Connected! Grant work. Through
key partnerships, the overall goal is to increase digital
literacy outreach and increase first time adoption rates in
un/underserved communities in the San Joaquin Valley.
Upstate California Connect
Consortium
$478,184 Colusa, Glenn,
Lake, Sonoma
In conjunction with the Northeastern California Connect
Consortium, Upstate California Connect Consortium
(UCCC) supported Golden Bear Broadband LLC's
submission of the Northern CA Regional Middle-Mile
Infrastructure Conceptual Design Plan ($119 million) to
CASF for infrastructure deployment grant funds, which
will provide comprehensive, integrated, open access,
middle-mile broadband infrastructure to 16 rural counties
in Northern California.
Per challenges received from incumbent carriers, re-
evaluated existing installed fiber and its availability to be
part of the Regional Middle Mile, applied Round 7
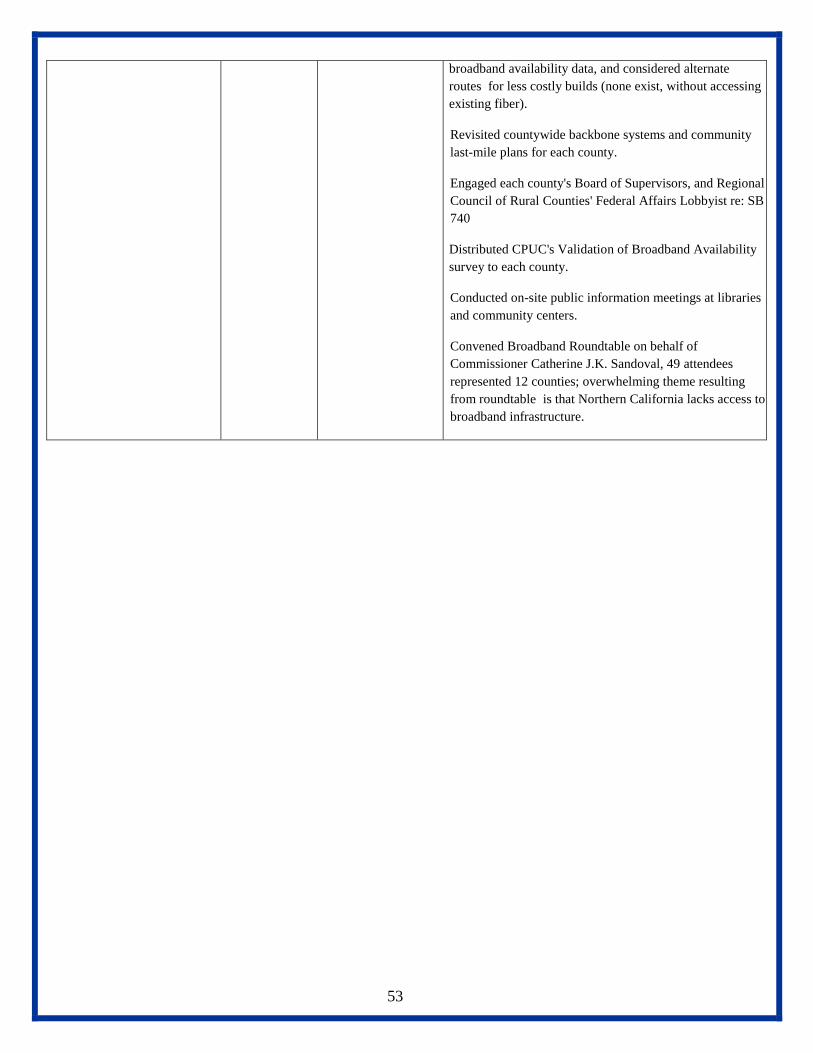
53
broadband availability data, and considered alternate
routes for less costly builds (none exist, without accessing
existing fiber).
Revisited countywide backbone systems and community
last-mile plans for each county.
Engaged each county's Board of Supervisors, and Regional
Council of Rural Counties' Federal Affairs Lobbyist re: SB
740
Distributed CPUC's Validation of Broadband Availability
survey to each county.
Conducted on-site public information meetings at libraries
and community centers.
Convened Broadband Roundtable on behalf of
Commissioner Catherine J.K. Sandoval, 49 attendees
represented 12 counties; overwhelming theme resulting
from roundtable is that Northern California lacks access to
broadband infrastructure.
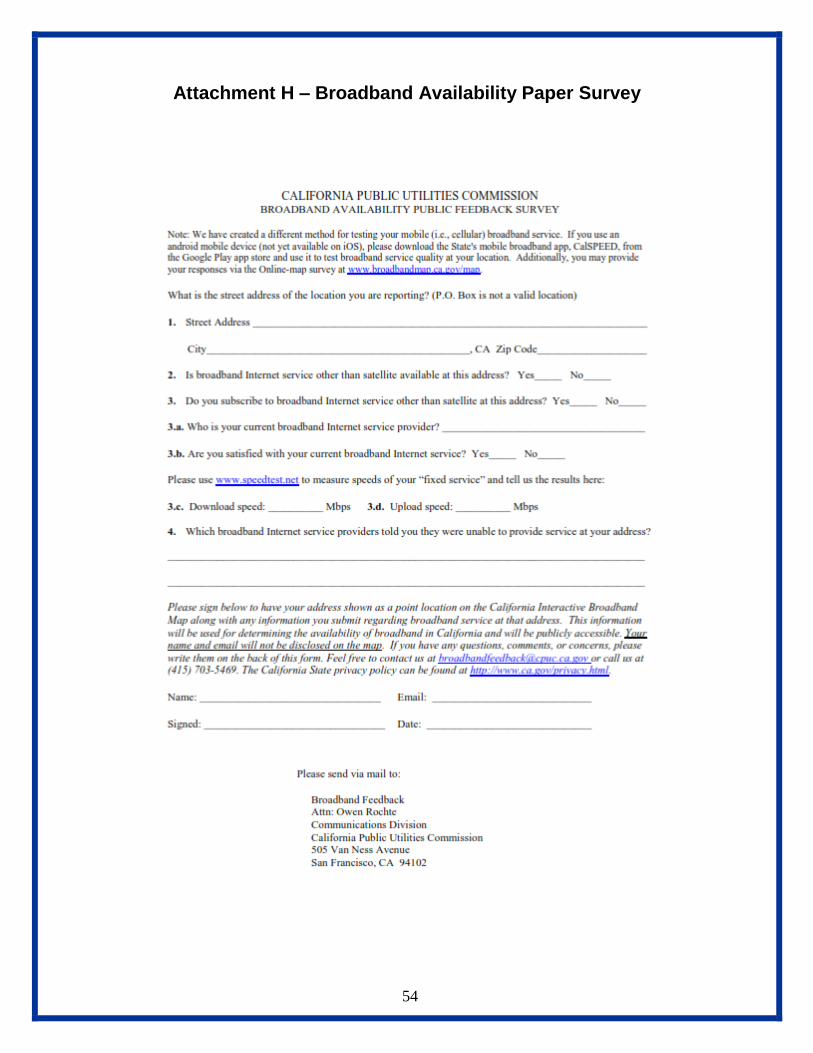
54
Attachment H – Broadband Availability Paper Survey
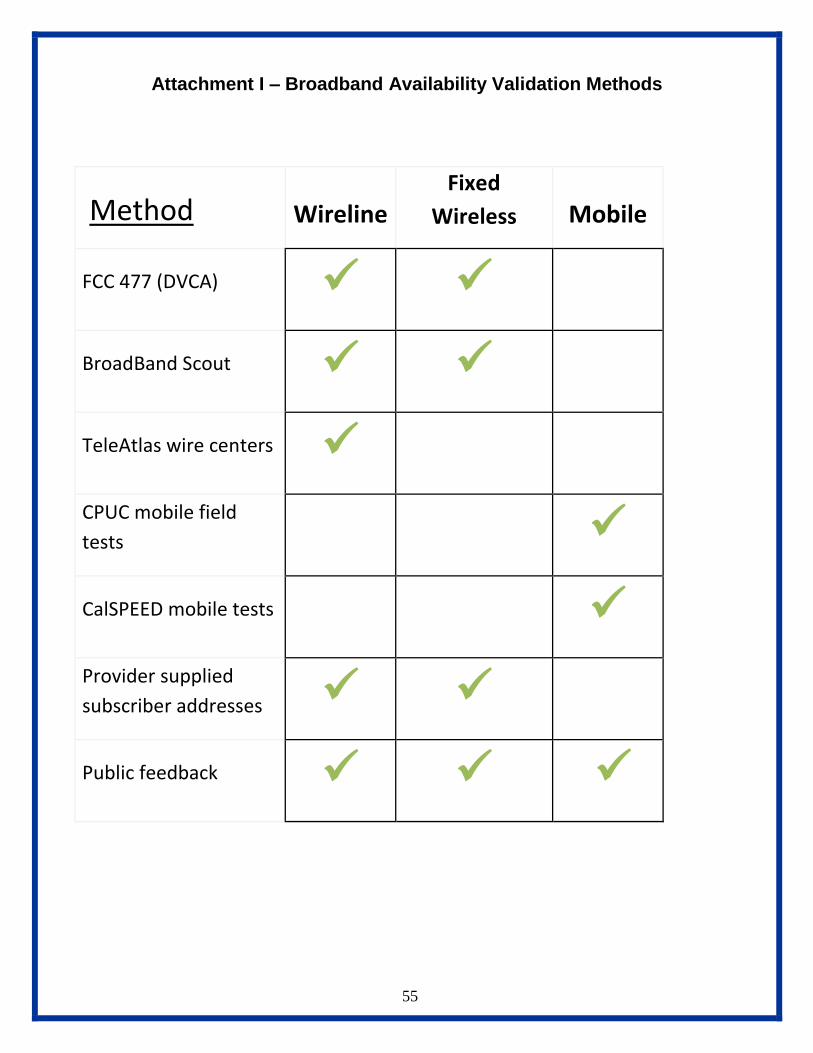
55
Attachment I – Broadband Availability Validation Methods
Method Wireline Fixed
Wireless Mobile
FCC 477 (DVCA)
BroadBand Scout
TeleAtlas wire centers
CPUC mobile field
tests
CalSPEED mobile tests
Provider supplied
subscriber addresses
Public feedback