Embed Size (px)
DESCRIPTION
This report presents the case that GHG accounting and the implementation of emission reduction strategies is feasible for global health initiatives. Furthermore, it demonstrates the viability of these strategies not only for Europe and Central Asia, but also Africa, and not only for HIV/AIDS and TB, but also for large-scale malaria programmes and health system strengthening components.
Citation preview

1
Managing our climate change risk: An approach for environmental safe guarding UNDP-Global Fund HIV/AIDS, Tuberculosis and Malaria programmes
Final Report

2
All rights reserved ©2014 UNDP
June 2014
Design: Ines Silva and Steven Scicluna of Ove Arup and Partners International Ltd.
DisclaimerThe content, analysis, opinions and policy recommendations contained in this publication do not necessarily reflect the views of the United Nations Development Programme

3
Contents
10
Foreword 4
Project Team 6
Acknowledgements 8
Glossary of terms 9
Introduction 10
Study objectives 11
What is EE-IO? 11
Measuring greenhouse gas emission of UNDP-GF disease prevention and treatment in Zimbabwe 14
HIV/AIDS grants 15
Tuberculosis grants 16
Malaria grants 17
Assessment process in the context of larger grants 17
Integration of carbon measurement into the New Funding Model process 19
Flexibility against a changing funding landscape 19
Carbon footprint of a New Funding Model grant 21
Opportunities to integrate carbon footprinting into the development of grant programmes development 25
Social cost of carbon 25
Focus study areas 27
Concluding statement 31
Appendix: Focus study areas 33
1. Climate change impact of waste management - A study based on Tajikistan’s pharmaceutical waste management
2. Specific carbon factors for health products - availability and application of data for ARVs and LLINs
3. Fleet vehicles - opportunities for carbon management
4. Carbon footprinting of Global Fund grant programmes - feasibility of measurement during operational phases
5. Off-grid power supply carbon footprint and sustainable energy planning of primary health facilities

4
Foreword
This second report does scale-up: It presents the case that GHG accounting and the implementation of emission reduction strategies is feasible for global health initiatives. Furthermore, it demonstrates the viability of these strategies not only for Europe and Central Asia, but also Africa, and not only for HIV/AIDS and TB, but also for large-scale malaria programmes and health system strengthening components.
In outcome it has established a methodology and supporting set of tools for both existing and emerging GFATM grant making mechanisms (including the New Funding Model / NFM). This enables UNDP-GF programme planers and practitioners to measure GHG emissions in a standardised way and for the rapid and efficient management of emission liabilities by informing actions to reduce emissions.
To bolster these efforts our work also reports on five separate but linked focus areas, each showcasing the opportunity for GHG emissions mitigation. These cover fleet vehicles, renewable energy for primary health facilities, monitoring and evaluation mechanisms, waste management, and supply chains. These studies highlight the case for GHG emissions reduction and the value of adopting action within mainstream objectives for provision of healthcare.
Of course GHG emissions are not the only environmental hazard caused by healthcare systems. The toxicological footprint of waste streams covering the whole lifecycle of healthcare products is important and relevant. In a parallel series of publications, the
In 2013 we presented the first carbon footprint and emission reduction strategy for a global health initiative in a report which looked at the carbon footprint of the Global Fund to fight HIV/AIDS, Tuberculosis and Malaria (GFATM) in Montenegro and Tajikistan1. The report encouraged a very positive response from across the global health community; something which has been further reinforced by our partner Arup being named ‘Consultancy of the Year’ at the Guardian Sustainable Business Awards, the submission being based on our groundbreaking project2&3. At the time questions were raised about our sense for ‘Realpolitik’; while the world is struggling to provide universal access to essential health services, is this really the right time to advocate for something as ‘exotic’ as mitigating the environmental consequences of these services and their negative health impact?
In the period since our study the UN Intergovernmental Panel on Climate Change (IPCC) has published its Fifth Assessment Report4&5. The verdict it reaches is clear: despite some progress in climate change mitigation policies, greenhouse gas (GHG) emissions have accelerated by a factor of 2.5 during the last decade. The study predicts with ‘high confidence’ that without additional mitigation we are set for a 3.7 to 4.8oC global mean surface temperature increase by 2100. Before, we were told that even a 2.5oC increase would be hard to cope with. The prescription of the IPCC leaves therefore no doubt about the seriousness of consequences: scale-up mitigation now and do it across all sectors.
1http://www.eurasia.undp.org/content/rbec/en/home/library/hiv_aids/Carbon_footprint_UNDP_Global_Fund_health_initiatives_Montenegro_Tajikistan/ 2http://www.theguardian.com/sustainable-business/sustainability-case-studies-arup-engineering-consultancy 3http://www.undp.org/content/undp/en/home/presscenter/pressreleases/2014/05/16/undp-partner-arup-awarded-sustainable-business-accolade/ 4https://www.ipcc.ch/report/ar5/index.shtml 5http://report.mitigation2014.org/spm/ipcc_wg3_ar5_summary-for-policymakers_approved.pdf

5
UNDP reports on the assessment of waste streams created by GFATM programmes and the integration of waste management modules into grant planning and implementation steps under the NFM of GFATM.
Is this the time for the introduction of environmental safeguard policies for global health financing agencies and institutions like the GFATM? Global health initiatives such as these represent markets worth in the region of US $30 billion annually. Which global business of similar scale and public exposure can do without them today?
There is a clear win-win situation for the GFATM to lead the process in the global health arena and for development partners to implement health programmes comprehensively in the context of sustainable human development. GHG mitigation is essential for the long-term security of people and the communities in which they live. Recognition that this applies equally to the healthcare industries is timely.
At the heart of this report is therefore the clear message that through the introduction of environmental safeguarding policies global health financing agencies and institutions can realize a triple win in social, economic and environmental impact for every dollar they spend on global health aid.
Dr. Kristian Steele
Senior Analyst
Advanced Technology & Research Arup
Dr. Christoph Hamelmann
Regional Practice Leader HIV, Health and Development
UNDP Regional Centre, Europe and the CIS

6
We would like to acknowledge the valuable input of the following project participants, without whom this project would not have been possible.
Project Team
John Macauley
Regional Programme SpecialistHIV, Health and Development
UNDP Regional Centre, Europe and the CIS
Elliman Jagne
Operations Manager GFATM projects
UNDP Zimbabwe
Tedla Mezemir Damte (MD,MPH)
Program Manager - Global Fund Grants
UNDP Tajikistan
Graeme Esau
Junior Professional Consultant
UNDP Zimbabwe
Dr. Christoph Hamelmann
Regional Practice Leader HIV, Health and Development
UNDP Regional Centre, Europe and the CIS
Devni Acharya
Environmental Consultant, Resource & Waste Management
Arup
Aleksandra Krukar
Admin/Finance Analyst
UNDP Tajikistan
Dr. Maria Brucoli
Engineer and Microgrids Specialist, Building Engineering
Arup

7
Keith Robertson
Senior Sustainability Consultant & Lead Analyst
Arup
Dr. Kristian Steele
Senior Analyst, Advanced Technology & Research
Arup
Daisy Mukarakate
Programme Specialist – Environment and energy
UNDP Zimbabwe
Volker Welter
Senior Procurement Adviser
UNDP Nordic Office
Saleban Omar (MD, MSc, DTM&H)
Senior Regional Programme Advisor, HIV, Health and Development Practice
UNDP Regional Services Centre for Africa, Ethiopia

8
Acknowledgements
Jens Wandel, Assistant Administrator and Director Bureau of Management, UNDPOlivier Adam, Deputy Regional Director Europe and the CIS, UNDP Camilla Bruckner, Director, Nordic Liaison OfficeMandeep Dhaliwal, Director, HIV, Health and Development Practice, UNDPTilly Sellers, Team Leader HIV, Health and Development, Regional Service Centre for Africa, UNDP Hakan Bjorkman, Cluster Leader, Partnership with the Global Fund, UNDPTracey Burton, Deputy Cluster Leader, Partnership with the Global Fund, UNDP Milena Prvulovic, Programme Specialist, UNDPGreg Soneff, Procurement Advisor, UNDPPatrick Gremillet, Senior Programme Advisor, UNDPLina Fernandez, Management Advisor, UNDPYasna Singh, Communications Associate, UNDP Emmanuel Boadi, Monitoring and Evaluation Specialist, UNDP Bettina Menne, European Centre for Environment and Health, WHO Peter Ooko K’Aluoch, Project Manager, UNOPS
Keith Evans, Transport and Logistics, ArupStefan Kohler, International Development, ArupAndy Mace, Mechanical Engineering, ArupChris Brosz, Mechanical Engineering, Arup Andrea Charlson, Sustainability Consultant, Arup,Lara Debenham, Advanced Technology and Research, Arup Nadia Boyarkina, Waste and Resource Efficiency, Arup
Sonia Roschnik, Operational Director, NHS Sustainable Development Unit Jan-Gerd Kühling, ETLog Health EnviroTech & Logistics Ute Pieper, ETLog Health EnviroTech & LogisticsLaurent Dini, Sustainable Development Manager, BayerJustin McBeath, Market Segment Manager, BayerAnnette Braae, Key Account Manager, Bestnet Roshni Gajjar, Group Risk & Sustainability Manager, Aspen Pharmacare
We would like to acknowledge the following colleagues for their support and guidance to this initiative.

9
AC Alternating Current
API Active Pharmaceutical Ingredient
ART Antiretroviral treatment
ARV Antiretroviral
ATM AIDS, Tuberculosis and Malaria
BAU Business As Usual
CCM Country Coordinating Mechanism
CDP Carbon Disclosure Project
CO Country Office
CO2e CO2 equivalent (i.e. all greenhouse gases are adjusted to the quantity of CO2 with the same global warming potential)
DC Direct Current
EE-IO Environmentally Extended Input-Output (emission factors)
GAC Grant Approvals Committee
GHG Greenhouse Gas (emissions)
GFATM The Global Fund to fight AIDS, Tuberculosis and Malaria
GMS General Management Support
GRI Global Reporting Initiative
HDPE High Density Polyethylene
HOMER Hybrid Optimization Model For Electric Renewables
I/O Input / Output (factors)
iIATT-SPHS UN informal Interagency Task Team on Sustainable Procurement in the Health Sector
Glossary of terms
LCA Life Cycle Assessment
LLINs Long Lasting Insecticide treated Nets
MAC Marginal Abatement Cost
M&E Monitoring and Evaluation
NFM New Funding Model
NHS (UK) National Health Service
NPC Net Present Value
PIU Project Implementation Unit
PR Principal Recipient
PUDR Progress Update and Disbursement Request
PV Photovoltaics
RBM Roll Back Malaria
SDA Service Delivery Area
SE4ALL Sustainable Energy For All programme
SR Sub-Recipient
TB Tuberculosis
UNDP United Nations Development Programme
UNDP-GF United Nations Development Programme - Global Fund
WHO World Health Organisation
WHOPES WHO Pesticides Evaluation Scheme
WRI World Resources Institute

10
Against a backdrop of globally rising greenhouse gas emissions (GHG), and observable changes to the world’s climate, the global health sector has a responsibility to study the climate change impacts of its programmes and take action to reduce its emissions.
The United Nations Development Programme (UNDP) is fully committed to this objective and has started the process of addressing the parallel challenges of delivering vital health services whilst also minimising the climate change impacts these have.
This was first examined in a carbon footprint study of UNDP administered Global Fund HIV/AIDS and Tuberculosis grants in Montenegro and Tajikistan; a study carried out with Arup in 20136. This work was the first ever carbon footprint and Marginal Abatement Cost (MAC) assessment of a major global health initiative.
The work saw the development of a method for measuring and reporting on the embodied carbon of all the goods and services required to deliver the targeted health programmes. It provided the first opportunity to assess across all aspects how the carbon impact is made up, and in which areas it may be useful to focus efforts for carbon reduction. The study also highlighted the opportunities for carbon to be used as a measure of climate change / environmental impact, to influence strategic decisions about how health programmes are organised and delivered.
The 2013 study demonstrated that the concept of carbon footprinting of UNDP-GF health grants is sound. The challenge now is to consider the implications for this on strategy development and practical delivery, and on using information on climate change impact to inform day-to-day decision making.
This sets the context and precedent for forward action, and for the work undertaken and presented in this report. The study has considered a different geographic location, scale of grant, and new disease context with a focus on Zimbabwe a low-income country in sub-Saharan Africa with generalised epidemics of HIV/AIDS, Malaria and Tuberculosis (ATM). The focus has been to replicating the approach at scale; applying the process to the Global Funds new grant development programme, the New Funding Model; and to taking forward more detailed studies in five priority areas of practical action and wider strategic importance to carbon emissions reduction objectives.
Introduction
6http://www.eurasia.undp.org/content/rbec/en/home/library/hiv_aids/Carbon_footprint_UNDP_Global_Fund_health_initiatives_Montenegro_Tajikistan/

11
The Tajikistan and Montenegro study demonstrated that using Environmentally Extended - Input Output (EE-IO) analysis provided a sound means of calculating a carbon footprint, and reporting at a level of granularity to inform decision making at UNDP-GF programme level. Therefore, from here the aim was to find a way to apply this approach as a decision making tool. This raised a number of questions.
1. Will the approach work at a larger scale, and what modifications to the method will be required?
2. Can the approach be extended to consider other types of health programme than those originally examined?
3. Against a changing funding landscape within the Global Fund, is the approach sufficiently flexible to the New Funding Model (NFM)?
4. How can the information gained through the analysis be used to inform the development and delivery of health programmes in the future and larger programme role out?
In addition to these questions a number of priority areas were identified where the opportunity for practical action was to be explored, or which were of wider strategic importance to facilitating carbon emissions reduction at health programme level. A set of five areas for further consideration were identified:
1. Climate change impact of waste management - A study based on Tajikistan’s pharmaceutical waste management: developing context-specific carbon factors for waste management activities, to enable different options to be explored for low carbon end-of-life waste disposal of key products used by UNDP-GF health programmes.
2. Specific carbon factors for health products - availability and application of data for ARVs and LLINs: establish the feasibility of identifying product-specific carbon factors for selected medical and pharmaceutical goods and on the willingness of the supply chain to engage with UNDP-GF on this issue.
Study objectives
Environmentally extended input-output (EE-IO) analysis is based on an ‘input-output’ method that tracks all financial transactions between industrial sectors and consumers within an economy. By adding environmental information, such as greenhouse gas emissions, to each sector it becomes possible to assign an environmental burden (a “footprint”) to these financial transactions. Similar to following the flow of money, or costs, from production to consumption, an environmentally extended input-output model allows following the flow of environmental footprints along supply and production chains. As each production step adds an environmental burden, the result is a life-cycle inventory of impacts of production and consumption, e.g. carbon, water or ecological footprints of companies, organisations, sectors, individuals, regions or countries.
What is EE-IO?

12
3. Fleet vehicles - opportunities for carbon management: to understand the potential for carbon savings to be gained from changes to the way a UNDP Country Office manages its vehicle fleet.
4. Carbon footprinting of Global Fund grant programmes - feasibility of measurement during operational phases: day-to-day monitoring of the carbon impact of health programmes and moving beyond a snapshot analysis of what the footprint of a health programme is, towards a means for day-to-day measurement and monitoring during programme delivery.
5. Off-grid power supply carbon footprint and sustainable energy planning of primary health facilities: to understand the potential carbon benefits offered by using off-grid renewable energy systems for UNDP-GF supported health facilities.
Figure 1. Scoping of emissions sources (from WRI Corporate Value Chain (Scope 3) Accounting and Reporting Standard)

13
UN
DP©

14
The 2013 Tajikistan and Montenegro study demonstrated the feasibility of a UNDP-GF carbon footprinting methodology. However, the challenge was then to understand how the method could be applied in different contexts, and at a greater scale.
Zimbabwe was chosen as the target country for the follow up study, providing significantly larger health programmes with different strategic aims and offering the opportunity to expand the assessment to include an additional disease programme on malaria.
In total four separate grants were studied, across two phases of each, with a budgeted value of nearly US$400 million; these included two HIV/AIDS, two tuberculosis (TB), two malaria, and the current New Funding Model grant. An overview of the Round 8 grants and the summary carbon footprints associated with their activity is summarised in Table 1. The following sections examine each disease programme separately.
Measuring greenhouse gas emission of UNDP-GF disease prevention and treatment in Zimbabwe
Grant Original budget
Adjusted budget7
Carbon footprint (tonnes CO2e)
GHG Scope Adjusted carbon intensity (kgCO2e/$)1 2 3
HIV/AIDS Round 8 Phase 1 $ 84,641,214 $ 68,650,867 84,092 <1% 1% 98% 1.23
HIV/AIDS Round 8 Phase 2 $ 194,473,406 $ 170,758,217 216,642 <1% 1% 98% 1.27
TB Round 8 Phase 1 $ 28,236,113 $ 22,268,867 27,340 <1% 1% 98% 1.23
TB Round 8 Phase 2 $ 26,859,566 $ 22,554,902 26,356 <1% 1% 98% 1.17
Malaria Round 8 Phase 1 $ 32,810,290 $ 30,424,448 43,570 <1% 1% 98% 1.43
Malaria Round 8 Phase 2 $ 34,377,588 $ 31,854,203 39,596 <1% 2% 97% 1.24
7The adjusted budget reflects the original budget deflated to 2007 prices, adjusted to reflect the UNDPs non-tax status on some procurement, and excluding salary costs
Table 1. Summary carbon footprint results

15
The two analyses of HIV/AIDS grant phases reflects the focus of the programmes on delivery of treatment and testing, with between 20-40% of the carbon footprint arising from pharmaceuticals; with around 20% of the project budget for Phase 1, and around 40% of the project budget for Phase 2, spent on antiretrovirals (ARV).
General and medical lab equipment primarily represents around 21% and 14% in the respective phases (largely test kits and reagents). Broadly the distribution across the two phases is similar, with Phase 1 including impacts from early programme establishment activities such as in-country training coming through with 11% of the carbon footprint.
HIV/AIDS grants
Figure 2. Carbon footprint components for HIV/AIDS Round 8 Phases 1 and 2
Pharmaceuticals
General medical and lab equipment
Training
GMS
In-country freight
Communication materials
Overheads
Other
HIV R8P1
HIV R8P2
4%4%
11%
8%
21%
22%
6%
100%
60%
80%
40%
20%
24%
7%
14%
10%
40%
29%

16
Pharmaceuticals and medical equipment again feature in the TB grant, most noticeably in Phase 2 where they represent a third of the carbon footprint. This is largely the procurement of category 1 and 2 TB medicines, with the larger component in Phase 2 including procurement of large amounts of second line
TB medicines. The larger medical and lab equipment component in Phase 1 is contributing to equipping of laboratories, and a large proportion of diagnostic kits. Training features in both programmes, and procurement of vehicles (largely for use by sub-recipient organisations) features in Phase 1.
Tuberculosis grants
Figure 3. Carbon footprint components for TB Round 8 Phases 1 and 2
TB R8P1
TB R8P2
4%
7%
11%
4%
6%
6%
20%
13%
6%
10%
100%
60%
80%
40%
20%
12%
6%
4%
7%
8%
8%
10%
33%
24%
Pharmaceuticals
General medical and lab equipment
Training
Vehicles
GMS
In-country freight
Construction
Communication materials
M&E
Overheads
Other
17
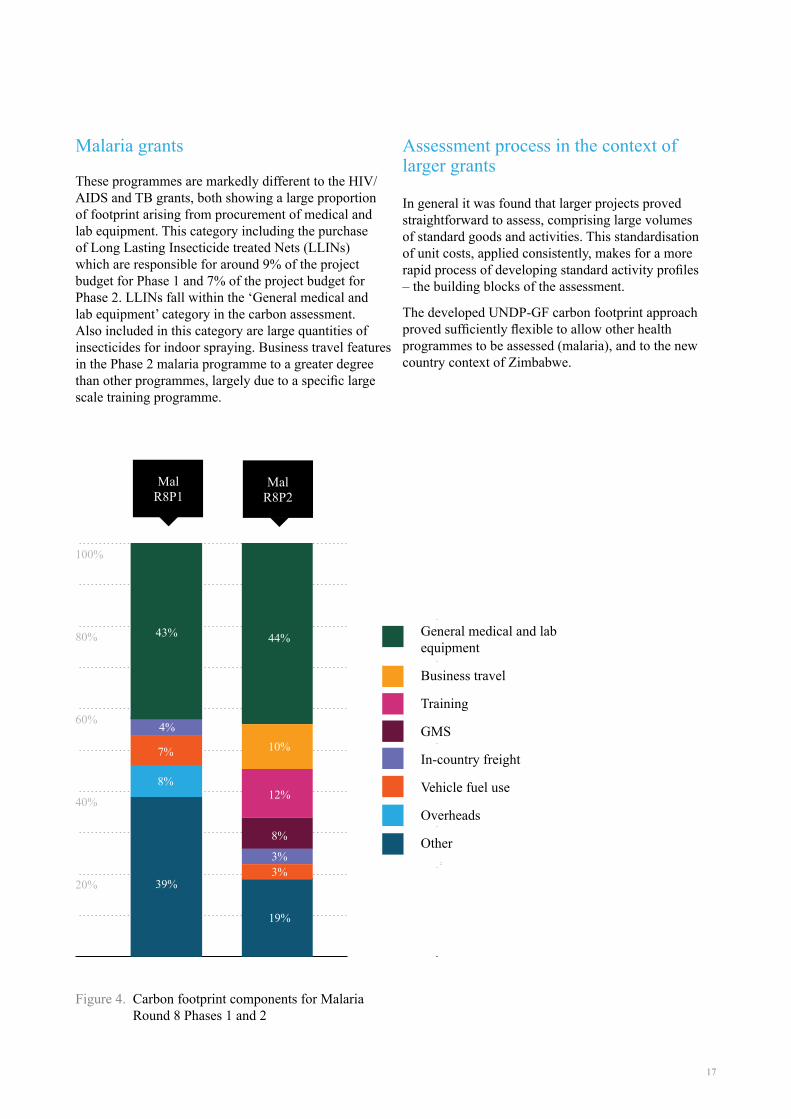
These programmes are markedly different to the HIV/AIDS and TB grants, both showing a large proportion of footprint arising from procurement of medical and lab equipment. This category including the purchase of Long Lasting Insecticide treated Nets (LLINs) which are responsible for around 9% of the project budget for Phase 1 and 7% of the project budget for Phase 2. LLINs fall within the ‘General medical and lab equipment’ category in the carbon assessment. Also included in this category are large quantities of insecticides for indoor spraying. Business travel features in the Phase 2 malaria programme to a greater degree than other programmes, largely due to a specific large scale training programme.
Malaria grants
Figure 4. Carbon footprint components for Malaria Round 8 Phases 1 and 2
General medical and lab equipment
Business travel
Training
GMS
In-country freight
Vehicle fuel use
Overheads
Other
Mal R8P1
Mal R8P2
4%
43%
7%
8%
100%
60%
80%
40%
20% 39%
12%
44%
10%
8%
3%3%
19%
Assessment process in the context of larger grants
In general it was found that larger projects proved straightforward to assess, comprising large volumes of standard goods and activities. This standardisation of unit costs, applied consistently, makes for a more rapid process of developing standard activity profiles – the building blocks of the assessment.
The developed UNDP-GF carbon footprint approach proved sufficiently flexible to allow other health programmes to be assessed (malaria), and to the new country context of Zimbabwe.

18

19
Integration of carbon measurement into the New Funding Model processWorking in Zimbabwe has allowed the UNDP-GF carbon footprint methodology to be tested on the New Funding Model, currently being rolled out across all Global Fund health programmes. Successfully testing
the UNDP-GF carbon footprinting methodology within this context is important to ensuring its future wider application in partnership with the Global Fund.
The Global Fund is introducing a new approach to the development of grant programmes called the New Funding Model (NFM). This is a significant move from the previous process of fixed funding cycles. The NFM offers many benefits to recipient countries.
- it allows eligible countries to apply at any point during the three year allocation period – allowing alignment of Global Fund programmes with national budget cycles and country-specific demands;
- it provides a simpler, and more streamlined, process for securing funding, with a shorter approval process;
- there is better engagement between the Global Fund and individual countries;
- under the NFM indicative funding amounts are provided to countries to allow for better understanding of fund availability.
The main emphasis has been on changes to the process of developing a grant programme – from concept through to disbursement of funds. The key questions that these changes prompt for a carbon footprint modelling tool are:
- can a footprint model change to be in line with grant structures under the NFM;
- what would reporting outputs look like, and how would they inform understanding of a grant carbon footprint;
- where are the opportunities in grant development and delivery for a carbon assessment to inform decision making.
Flexibility against a changing funding landscape
The implementation of the New Funding Model is a significant development in the processes around the targeting and development of Global Fund grant programmes. The process of grant development is summarised in Figure 5 and comprises of a number of key steps which will now be explained.
Development of a Concept Note is the key early phase of grant programme development. The Concept Note sets out the country context, detailing the current
disease context in the country and constraints/barriers to interventions. It covers the funding landscape for the country such as additional funding sources and funding gaps.
The Concept Note also includes the identification of Modules within the grant programme – the building blocks of a grant – setting out where effort is being focused, and how objectives will be achieved.
Flexibility against a changing funding landscape

20
Figure 6. Taxonomy used within the New Funding Model for grant components
Figure 5. New Funding Model process with opportunity for carbon input to Concept Note Development illustrated
The Development of the Concept Note is an iterative process between the Country Coordinating Mechanism (CCM) and the Global Fund, and allows for feedback and improvement of the proposed grant programme at an early stage, and informed by the availability of funds for the country in question. The introduction of a carbon footprinting methodology at this point can support decision making and directly inform this iterative process (see Figure 5).
Following the agreement of the Concept Note the grant proposal then proceeds through Technical Review, before presentation to the Global Fund Grant Approvals Committee (GAC). Following a successful award the grant programme is completed, and fund disbursement arrangements are set out, along with agreed plans for implementation, monitoring and reporting of the grant programme. This can lead to further opportunities for carbon appreciation in programme delivery.
The structure of the NFM allows for the rapid development of a grant programme, shortening the
timetable for engagement with the Global Fund. The carbon footprint tool can inform this process by providing information on the carbon footprint of individual project Modules. However for it to be workable it would need to be sufficiently flexible and useable for quick feedback to grant developers on the carbon implication of different decisions.
Under the NFM the structural unit of a grant is the Module, replacing the previous grant structure based around Service Delivery Areas (SDAs). Modules are largely drawn from an existing list of established programme components, and guidance on Concept Note development favours the use of pre-defined Modules in most grants. This facilitated the development of a standardised carbon footprint tool based on Modules.
The taxonomy of the New Funding Model is shown in Figure 6. This includes various new terms for grant components which has been used as the basis for informing the NFM carbon footprinting tool.
National Strategic Plandetermined by country
Grant Implementation3 yearsConcept Note
TRP GAC2nd GAC Board
Grant Making
Carbon footprint analysis
Ongoing country dialogue

21
Zimbabwe was selected by the Global Fund as an early applicant of the NFM approach. Representatives within the country and responsible for developing and delivering grants have played an active part in the development and review of the funding process.
This early adoption in Zimbabwe for certain grants and the available expertise has provided an opportunity to re-apply the carbon footprint approach developed and piloted in Tajikistan and Montenegro, within the structure of the NFM using Zimbabwe as the case study context. In doing this, the current HIV programme in Zimbabwe, with a budget of over $300m, was used as the example allowing refinement of the carbon footprinting approach to the NFM.
In undertaking the analysis the opportunity was taken to develop an updated spread sheet carbon footprinting tool – removing some of the complexity of the original – and providing a clearer and more intuitive interface, along with standardised outputs tailored for the NFM. The resulting model structure is set out in Figure 7 and the user interface and reporting template of the tool is shown in Figure 8.
The process set out in Figure 7 is iterative, and can be carried out to various degrees of detail depending upon the stage of grant development. The phasing of carbon footprint analysis with on-going country dialogue is further summarised in Figure 5.
Carbon footprint of a New Funding Model grant
Figure 7. Schematic of carbon footprint analysis
Data collectionassembly of grant budget data
Review of unit costsfor key activity types (training, travel etc.)
Review of Standard Activity Profiles
Model calculation of carbon footprints
Generate standard report outputs
Review and feed back into grant programme development
Carbon footprint analysis
Carried out by analyst Produced by model

22
Figure 8. Illustration of user interface and reporting screen of UNDP-GF NFM carbon footprinting tool
Table 2. Carbon footprint of New Funding Model grant for HIV
Following initial design work and NFM carbon tool development it was applied to the Zimbabwe NFM HIV grant. Its use was found to be straightforward and
study summary outputs are presented in Table 2 with further illustration through Figure 9 and Figure 10.
Grant Original budget Adjusted budget Carbon footprint (tonnes CO2e)
Adjusted carbon intensity (kgCO2e/$)
ZIM-809-G11-H $ 311,175,099 $ 327,473,303 325,871 1.279

23
Figure 9. Carbon footprint components for HIV NFM
HIVNFM
6%
4%3%
46%
8%
6%
11%
100%
60%
80%
40%
20%
12%
Pharmaceuticals
International freight
GMS
Health products and commodities
In-country freight
Training
Overheads
M&E
Other
6%
UN
DP©
UN
AM
ID©

24
Figure 10. The carbon footprint of HIV New Funding Model grant presented in GHG protocol scopes across the value chain
200,000
250,000
150,000
100,000
50,000
0
Purchased goods and services
Fuel- and energy-related
activities
Business travel
Supply chain · 91% Operations · 9%
Capital goods (construction)
Upstream transportation
and distribution
Direct emissions from
combustion of fuel
Waste generated in operations
Upstream leased assets

25
As noted above, the NFM provides a grant development process with shorter timescales and greater transparency at early stages, and the carbon footprinting method can be integrated into this process.
Over time, as assessments are carried out more widely and across a range of grants, it will become feasible to provide guidance on the relative carbon impacts of different Modules and for different disease contexts and across different geographies.
This body of evidence could then be drawn on to learn lessons for other grant programmes and actions taken to identify where different programme components can be employed, and for those chosen where specific carbon reduction activities (such as supplier dialogue/selection) can be adopted.
It is also considered feasible to use a similar approach to that discussed here to provide guidance on carbon emissions during delivery of programmes. This potentially provides a mechanism whereby delivery bodies – Principal Recipients, and Sub-Recipients, can both understand the expected carbon emissions for the grants they are involved in, and also identify and implement measures to reduce the carbon footprint of grant delivery.
Opportunities to integrate carbon footprinting into the development of grant programmes development
The integration of carbon emission monitoring within health planning processes is of increasing interest and focus. One of the challenges is to create relevance of the subject to normal working practice. To aid with this the study undertook a small exploratory calculation to link carbon emissions with the ‘social cost of carbon’.
The work of the Stern review popularized this concept and this was used as a basis for the calculation. The social cost of carbon is defined by the ultimate concentration of greenhouse gases in the atmosphere and keeping global temperature rises within defined limits. These are principles consistent with UNDP aspirations, and as such the social cost of carbon quoted by Stern of $25-30 per tonne CO2e is a useful benchmark.
Using the Stern value means we can monetize for a UNDP programme an approximate for the cost reduction (or modification of carbon intensity) that will be necessary to adhere to the quoted 450-550ppm CO2e atmospheric greenhouse gases concentration (which equates to an estimated global 2oC temperature rise) that Stern calls for.
For example the UNDP-GF progammes in Zimbabwe and specifically Round 8 covering HIV/AIDS, TB and Malaria (2010-2014), and the NFM covering HIV/AIDS (2014-2016), have total GHG emissions liabilities of 437,596 tonnes CO2e and 325,871 CO2e respectively. If we assume the $30 per tonne CO2e value this equates to a social cost of carbon of in excess $13.1 million and $9.7 million respectively. In aggregate across both these Zimbabwe grants with a combined budgeted value of $674 million (2010-2016) we find the social cost of carbon equates to some 3-4% of this budget. In summary, $22.9 million of climate change damage is incurred with the $674 million spend.
Social cost of carbon
26
UN
DP©
UN
DP©
UN
AM
ID©
UN
AM
ID©
27
Focus study areas
A series of five additional studies were carried out examining priority topics with the opportunity for practical action on carbon emission reduction, or which were of wider strategic importance to facilitating carbon emissions reduction at health programme level.
A paper on each of these has been separately prepared and is annexed to this report. Summary outcomes are presented below.
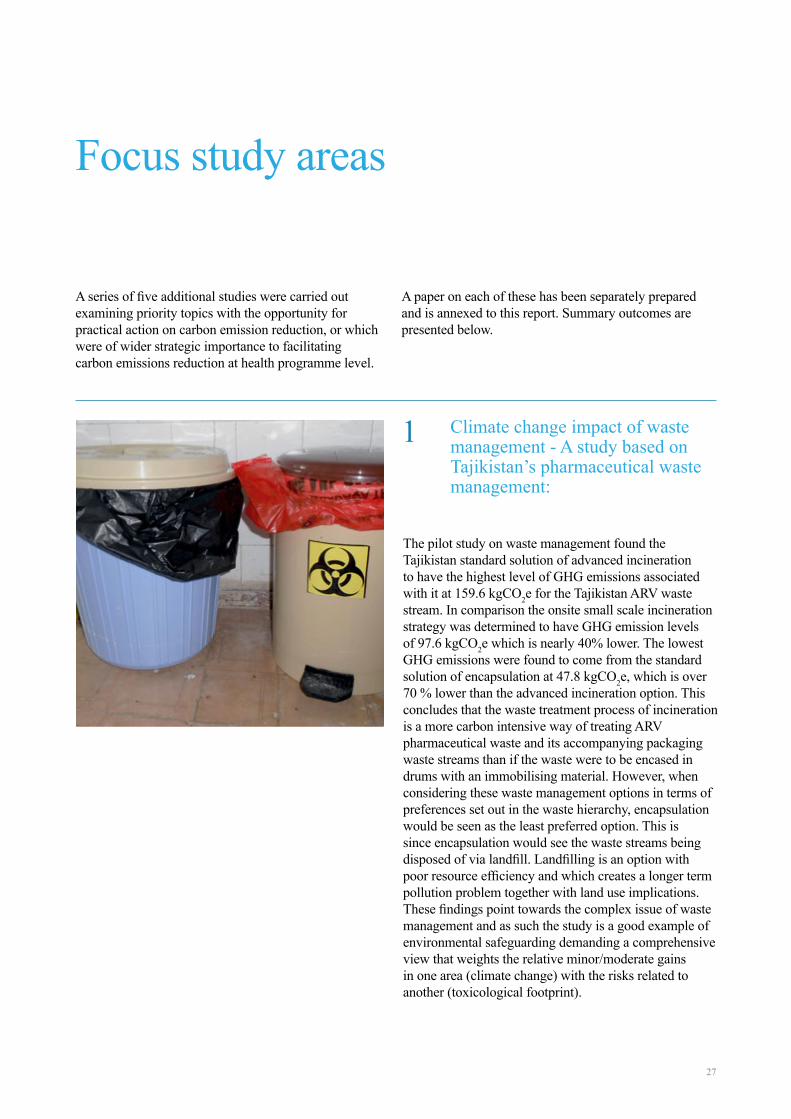
Climate change impact of waste management - A study based on Tajikistan’s pharmaceutical waste management:
1
The pilot study on waste management found the Tajikistan standard solution of advanced incineration to have the highest level of GHG emissions associated with it at 159.6 kgCO2e for the Tajikistan ARV waste stream. In comparison the onsite small scale incineration strategy was determined to have GHG emission levels of 97.6 kgCO2e which is nearly 40% lower. The lowest GHG emissions were found to come from the standard solution of encapsulation at 47.8 kgCO2e, which is over 70 % lower than the advanced incineration option. This concludes that the waste treatment process of incineration is a more carbon intensive way of treating ARV pharmaceutical waste and its accompanying packaging waste streams than if the waste were to be encased in drums with an immobilising material. However, when considering these waste management options in terms of preferences set out in the waste hierarchy, encapsulation would be seen as the least preferred option. This is since encapsulation would see the waste streams being disposed of via landfill. Landfilling is an option with poor resource efficiency and which creates a longer term pollution problem together with land use implications. These findings point towards the complex issue of waste management and as such the study is a good example of environmental safeguarding demanding a comprehensive view that weights the relative minor/moderate gains in one area (climate change) with the risks related to another (toxicological footprint).

28
Fleet vehicles - opportunities for carbon management:
On transport and logistics the study looked at the opportunities available to mitigate carbon emissions through changes to the procurement and management of vehicles used by a UNDP Project Implementation Unit. Direct opportunities are limited, being based primarily on procurement choices (vehicle type and efficiency), and avoidance of unnecessary trips. Existing guidance from UNDP on procurement choices for vehicles is good, and will already have achieved carbon reductions in this area. Avoidance of trips by PIU staff offers some more potential for improvement, although this is limited by the need to avoid compromising the delivery of projects.
It is however important to recognise that what has been examined is just a small part of grant vehicle management and does not for example address SRs and their operations. Nor does it consider what could be put in place with similar steps more widely for the whole UNDP country office car fleet. In this regard fleet vehicle management should remain a focus area for UNDP-GF because of its direct influence particularly by PIU.
3Specific carbon factors for health products - availability and application of data for ARVs and LLINs:
This is very much an emerging agenda and detailed supply chain data on the GHG emissions/impact of pharmaceuticals and medical devices is not widely available. There is also a general lack of drivers for the supply base to develop this information, especially from manufacturers of generic products. The focus study confirmed that the availability of detailed life cycle assessment (LCA) data for major procurement items is limited. At present the procurement mechanisms for ARVs and LLINs is based on the selection of suppliers who can demonstrate minimum performance standards, price, and capacity to manufacture - with little focus given to overall environmental impact. The work found some appetite from certain manufacturers to consider whole life environmental impacts. This would indicate toward the opportunity of using the significant market shaping power of purchasers within global health initiatives and their funders, among them the UNDP-GF. As such UNDP-GF should continue to support efforts to standardise LCA methodologies, and should consider how this information can inform the selection of suppliers. The efforts of the UN informal Interagency Task Team on Sustainable Procurement in the Health Sector (iIATT-SPHS)3 could have an important role in shaping the agenda.
2
UN
DP©

29
Off-grid power supply carbon footprint and sustainable energy planning of primary health facilities:
The pilot study on renewable energy planning for rural health centres/clinics in Zimbabwe found the supply of power using a hybrid system based on PV panels brings significant carbon savings compared to the business as usual (BAU) solution of burning fossil fuel derived diesel. Indeed the carbon payback of the system was determined at less than 2 years with it being cost neutral to the BAU system in only 4 years. On a UNDP-GF programme level and assuming wider application in primary health facilities of a similar function, the outline estimate indicates that the hybrid energy solution would deliver to a huge saving in programme carbon emissions.
54 Carbon footprinting of Global Fund grant programmes - feasibility of measurement during operational phases:
On review of measurement and reporting protocols it was determined that the preferred approach to on-going monitoring of carbon emissions is likely to depend on the target audience for reporting. However, in general the detail contained within the UNDP’s ATLAS management system forms the most robust dataset for understanding, at a given point in time, what monies have been spent on what grant activities. As such it appears a prime source of information for the carbon footprint analysis during operation. Adopting an approach based on this dataset would allow for relatively quick assessment of carbon footprint. Standard carbon intensities could be developed for each of the Ledger Codes contained within ATLAS for a specific country. Once these are developed, then estimating the carbon footprint at a given point in time becomes straightforward. In this way and with development of the system the success/failure of applied carbon mitigation actions could be studied and reported into UNDP and GF monitoring and evaluation mechanisms. It is recommended that UNDP examines the potential for this more fully with the GF. Within UNDP the policy and strategy basis for such action already exists.

30
UN
DP©
UN
DP©
UN
DP©
UN
DP©

31
The objectives of this UNDP-GF initiative were three fold and included:
- To apply a methodology for GHG emissions measurement and reduction to a different geographic location, scale of UNDP-GF grant, and new disease context with a focus on Zimbabwe a low-income country in Sub-Saharan Africa with generalised epidemics of HIV/AIDS, Malaria and Tuberculosis. In this way the work could demonstrate proof of concept for the approach beyond the previous pilot work on smaller grants in Montenegro/Europe and Tajikistan/Central Asia and only for HIV/AIDS and Tuberculosis grants.
- To build on and refine the prototype carbon footprint tool from the first pilots finalising its development and that of the supporting practitioner tool kit. This included adjusting the platform to align it with the NFM and linking it to NFM system templates and processes. In outcome this provides a practitioner ready tool box to assess GHG emissions and guide reduction strategies for GFATM grant planning and implementation.
- Deepen the understanding for possible interventions to reduce GHG emissions in five priority areas. This was carried out with bespoke investigations testing the opportunity for rapid change where UNDP-GF can take direct action including clinic energy strategy, waste management, vehicle fleet logistics, GHG M&E, and supply chain engagement.
The project has successfully delivered in all these areas and it can be concluded with confidence that assessment of GHG at scale is feasible for programmes like those in Zimbabwe. A carbon footprint modelling tool has been developed in line with the structures and requirements of the New Funding Model and with wider industry standards and science. Combined with the previously developed tool this now provides an effective method and toolbox for UNDP-GF carbon/GHG footprinting in a standardised way, allowing for rapid and efficient assessment and emission reduction action. The systems are now ready for scale up and the focus should shift to establishing mechanisms and momentum to deliver this.
Initial focus areas for emission reduction interventions are also clearer although further work is required to translate them into practice and action on the ground.
As next steps it follows that the GFATM should consider the introduction of environmental safeguarding policies and strategies including those that address the climate change / GHG challenge with the aim of taking practical steps in whole grant making to reduce impacts. The work undertaken and reported herein provides the GFATM a significant platform from which to advance to these goals.
UNDP and its partners through the iIATT-SPHS must promote to the GFATM the developed HIV/AIDS, Malaria and Tuberculosis grant making carbon footprinting toolbox and the established assessment methodology. The aim should be to seek partnership, to roll out more widely their use, and introduce environmental safeguarding policies on climate change.
Concluding statement

For further information please contact:
Dr. Christoph Hamelmann Regional Practice Leader HIV, Health and Development
UNDP Regional Centre, Europe and the CIS
Dr. Kristian Steele Senior Analyst
Advanced Technology & Research Arup

33
Appendix
Focus study areas

34

35
Authors: Devni Acharya1 | Dr. Kristian Steele2 | Dr. Christoph Hamelmann3 | Tedla Mezemir Dante4
1Environmental Consultant, Resource & Waste Management, Arup2Senior Analyst, Advanced Technology & Research, Arup3Regional Practice Leader HIV, Health and Development, UNDP Regional Centre, Europe and the CIS4Program Manager - Global Fund Grants, UNDP Tajikistan
Climate change impact of waste management - A study based on Tajikistan’s pharmaceutical waste management
The United Nations Development Programme (UNDP) is developing a waste management planning tool for its Global Fund operations that works to improve waste treatment practices while also understanding the climate change impact associated with different disposal strategies. This study has supported the initiative by developing a first set of carbon factors for different waste management strategies to inform the
planning tool. The project has focused on pharmaceutical waste management of antiretroviral tablets in Tajikistan.
With this focus the study has reviewed the climate change impact of three waste management scenarios include onsite small scale incineration that has limited appeal due to its toxicological footprint and two alternatives that offer improvement.
Introduction
ETLog©

36
Study scope
The study scope has been developed within the working context of the UNDP Tajikistan Global Fund (GF) programme. In Tajikistan, antiretroviral (ARV) tablets used for HIV treatment were identified as high value procurement items both in quantity and cost. As such, ARV tablet waste and its waste management practice were identified as a suitable priority category.
The materiality of this waste was identified to include:
- pharmaceutical tablets
- blister packs that enclose the ARV tablets
- patient information leaflets
- small cardboard boxes containing the above three items
- larger corrugated cardboard boxes used for transporting the ARV medicines
The three strategies for which carbon factors have been calculated are detailed below.
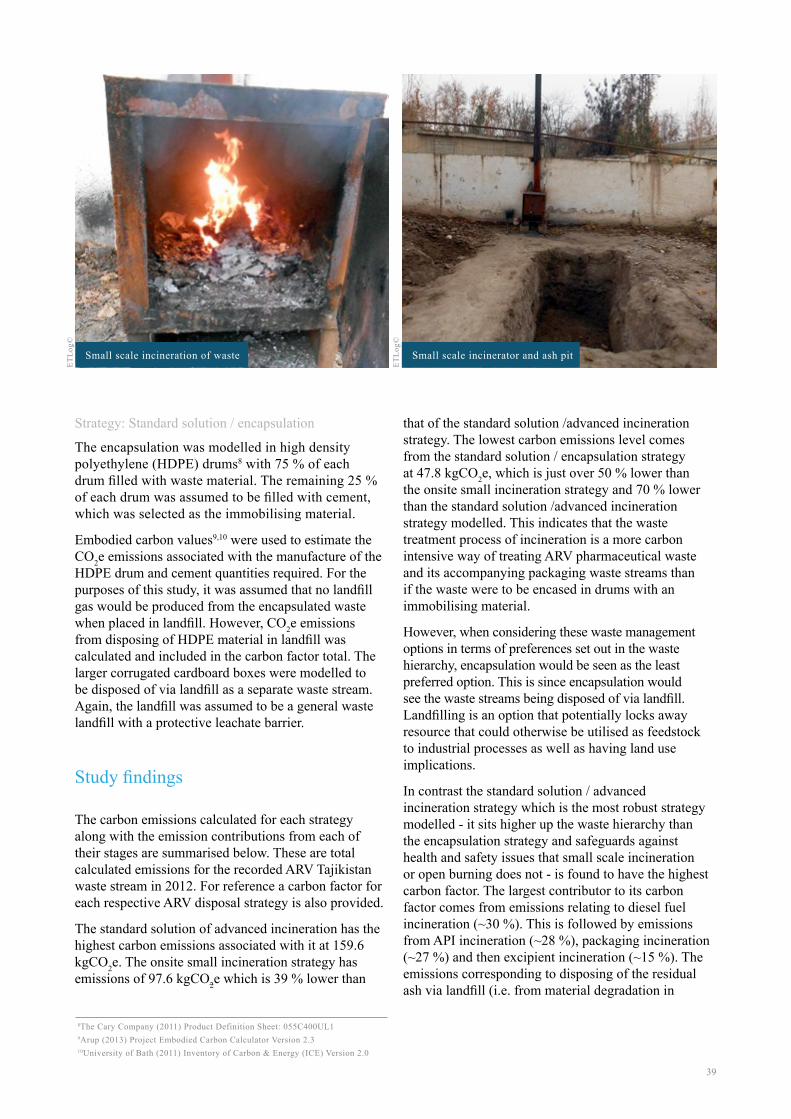
1. Onsite small scale incineration: models the carbon factor associated with common pharmaceutical waste management currently taking place in Tajikistan. The waste is treated and disposed of at the hospital or health centre where it is generated, or alternatively at a larger central district hospital where facilities are available. This strategy
involves treatment of the waste using basic waste infrastructure including small scale incinerators using biomass fuel, and without emission control and in some cases open burning. The residual ash from the incineration or burning process is then buried in an ash pit within close proximity1.
2. Standard solution / advanced incineration: has been modelled to reflect the approach that Tajikistan is working towards. This involves a national pharmaceutical waste take-back system that uses reverse logistics; supply vehicles transport the medicines to hospitals and health centres from a central warehouse, which then simultaneously collect any pharmaceutical waste to bring back to the central warehouse. The waste is then accumulated and periodically treated in an advanced incinerator with a high temperature two-chamber system with basic flue-gas treatment and which uses diesel fuel to aid combustion. The fly ash and incinerator bottom ash is then disposed of in a designated area of a landfill.
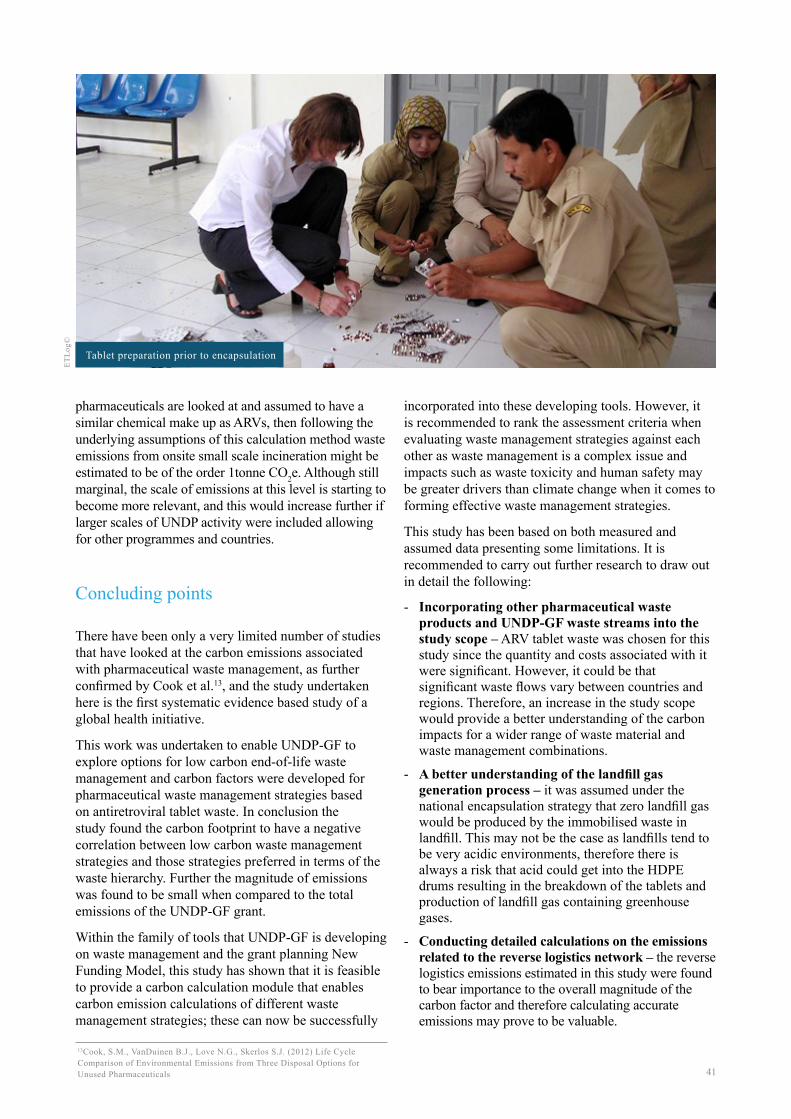
3. Standard solution / encapsulation: follows the same system set out in strategy two but sees treatment through encapsulation by filling drums with 75 % waste material and 25 % immobilising material. The drums are then disposed of in landfill.
Both strategies two and three have been assumed to be in line with World Health Organisation guidelines2.
The study has found the carbon footprint results for the scenarios to have a negative correlation between the issue of climate change and the preferred strategies from the toxicological safeguarding perspective.
These findings point towards the complex issue of waste management and as such the study is a good example of environmental safeguarding demanding a comprehensive view that weights the relative minor/moderate gains in one area (climate change) with the risks related to another
(toxicological footprint). The solution therefore is to look for greenhouse gas emissions savings between the preferred alternatives and therefore forming an effective waste management strategy.
Within the family of tools that UNDP-GF is developing on waste management and New Funding Model grant planning, the study shows that it is feasible to provide a carbon calculation module that enables greenhouse gas emission calculations of different waste management strategies.
1Pieper, Ute., ETLog, (2013) Rapid Assessment Road Map for HIV, TB and Malaria GF grants (waste sector)2World Health Organisation (1999) Safe Management of Wastes from Health-care

37
Medical supply central warehouse
Encapsulation of waste in metal casing using cement as the immobilising material
Storage of medical supplies inside a central warehouse
ETLo
g©ET
Log©
ETLo
g©
38
An outline estimate was also undertaken for the carbon dioxide equivalent (CO2e) emissions relating to the reverse logistics of the standard solution waste management strategies.
Calculation approach
A carbon factor was calculated for each of the three waste management strategies to assess and compare their climate change impact. The carbon factors were computed by summing together the CO2e emissions for each stage in the strategy that produced CO2e emissions. Undertaking this calculation required that waste material flow quantities were determined.
Pharmaceutical waste inventory
The UNDP-GF procurement department in Tajikistan estimate that 5 % of all pharmaceutical products expire. This value was further checked by UNDP central procurement, and the rapid assessment studies by ETLog for both Tajikistan and Zimbabwe and was found to be accurate. It was therefore assumed that 5 % of ARV tablets procured under the UNDP-GF grant in Tajikistan expire and require waste management. Using 2012 procurement figures developed by the ETLog study, this amounted to approximately 40 kg of tablet waste with an estimated 4:1 ratio between active pharmaceutical ingredient (API) and excipient content. This ratio was determined by establishing a weighted average based on the chemical composition of all procured ARV types by UNDP-GF in Tajikistan in 2012.
Packaging waste
By using average mass ratios between pharmaceutical tablets and their packaging, the total packaging waste amounted to approximately 78 kg. The blister pack cavities were assumed to be made out of polyvinyl chloride with the film covers made out of polyvinylidene chloride.3,4 The small cardboard boxes were sized to hold blister packs enclosing a total of 60 tablets (as do the majority of ARV medicines procured in 2012) and the paper patient information leaflet. This was then used to determine the amount of larger corrugated cardboard box packaging required for
transporting the ARV medicines.
Strategy: Onsite small scale incineration
The small scale incineration or open burning of the waste was modelled under a 70 % (by mass) combustion efficiency, with the remaining 30 % (by mass) becoming residual ash requiring disposal. This combustion efficiency was applied to correspond to the lower bound combustion efficiency of a typical municipal incinerator.5 Small scale incineration and open burning may not provide optimal oxygen conditions for efficient combustion to take place thereby producing a higher percentage of ash than if optimal oxygen conditions were present.
With the composition and mass of the tablet waste known, carbon dioxide emissions were calculated based on the complete combustion of its API and excipient constituents. Other products of combustion were assumed to have negligible climate change impact. The CO2e emissions relating to the combustion of the packaging materials were calculated using data from the life cycle assessment tool, GaBi (version 4.0)6. The CO2e emissions relating to the disposal of the residual ash in an ash pit were modelled as inert material being disposed of via landfill7.
Strategy: Standard solution / advanced incineration
When modelling advanced incineration treatment, the incinerator was assumed to be autothermic with no energy recovery associated with the process. In contrast to the combustion within the onsite small scale incinerator, a higher combustion efficiency of 80 % (by mass) relating to the upper bound combustion efficiency of a typical municipal incinerator was applied to the process due to the higher level of process control present with advanced incineration.
The CO2e emissions from the combustion of the tablet and packaging waste streams were calculated with a similar process described above for onsite small scale incineration.5 The CO2e emissions relating to the landfill disposal of the 20 % (by mass) residual ash (fly ash and incineration bottom ash) from the incineration process was modelled as an inert material disposed of via landfill. The landfill was assumed to be a general waste landfill with a protective leachate barrier.
3World Health Organisation, WHO List of Prequalified Medicinal Products [online] Available at: apps.who.int/prequal/query/productregistry.aspx?list=ha, Accessed March 20144Pilchik R. (2000) Pharmaceutical Blister Packaging, Part I: Rationale and Materials, Pharmaceutical Technology, November 2000
5Department for Environment, Food and Rural Affairs (2013) Incineration of Municipal Solid Waste6PE Europe GmbH and IKP University of Stuttgart (2003) GaBi 4.07The Chartered Institution of Wastes Management, Incineration [online] Available at: www.ciwm.co.uk/CIWM/InformationCentre/AtoZ/IPages/Incineration.aspx, Accessed March 2014
39
Strategy: Standard solution / encapsulation
The encapsulation was modelled in high density polyethylene (HDPE) drums8 with 75 % of each drum filled with waste material. The remaining 25 % of each drum was assumed to be filled with cement, which was selected as the immobilising material.
Embodied carbon values9,10 were used to estimate the CO2e emissions associated with the manufacture of the HDPE drum and cement quantities required. For the purposes of this study, it was assumed that no landfill gas would be produced from the encapsulated waste when placed in landfill. However, CO2e emissions from disposing of HDPE material in landfill was calculated and included in the carbon factor total. The larger corrugated cardboard boxes were modelled to be disposed of via landfill as a separate waste stream. Again, the landfill was assumed to be a general waste landfill with a protective leachate barrier.
Study findings
The carbon emissions calculated for each strategy along with the emission contributions from each of their stages are summarised below. These are total calculated emissions for the recorded ARV Tajikistan waste stream in 2012. For reference a carbon factor for each respective ARV disposal strategy is also provided.
The standard solution of advanced incineration has the highest carbon emissions associated with it at 159.6 kgCO2e. The onsite small incineration strategy has emissions of 97.6 kgCO2e which is 39 % lower than
that of the standard solution /advanced incineration strategy. The lowest carbon emissions level comes from the standard solution / encapsulation strategy at 47.8 kgCO2e, which is just over 50 % lower than the onsite small incineration strategy and 70 % lower than the standard solution /advanced incineration strategy modelled. This indicates that the waste treatment process of incineration is a more carbon intensive way of treating ARV pharmaceutical waste and its accompanying packaging waste streams than if the waste were to be encased in drums with an immobilising material.
However, when considering these waste management options in terms of preferences set out in the waste hierarchy, encapsulation would be seen as the least preferred option. This is since encapsulation would see the waste streams being disposed of via landfill. Landfilling is an option that potentially locks away resource that could otherwise be utilised as feedstock to industrial processes as well as having land use implications.
In contrast the standard solution / advanced incineration strategy which is the most robust strategy modelled - it sits higher up the waste hierarchy than the encapsulation strategy and safeguards against health and safety issues that small scale incineration or open burning does not - is found to have the highest carbon factor. The largest contributor to its carbon factor comes from emissions relating to diesel fuel incineration (~30 %). This is followed by emissions from API incineration (~28 %), packaging incineration (~27 %) and then excipient incineration (~15 %). The emissions corresponding to disposing of the residual ash via landfill (i.e. from material degradation in
Small scale incineration of waste Small scale incinerator and ash pit
8The Cary Company (2011) Product Definition Sheet: 055C400UL19Arup (2013) Project Embodied Carbon Calculator Version 2.310University of Bath (2011) Inventory of Carbon & Energy (ICE) Version 2.0
ETLo
g©
ETLo
g©

40
Strategy: Onsite small scale incineration
Strategy: Standard solution / advanced incinerator
Strategy: Standard solution / encapsulation
The carbon factor for ARV onsite small scale incineration is 0.8 kgCO2e / kg of waste arising.
The carbon factor for ARV disposal in the advanced incinerator is 1.4 kgCO2e / kg of waste arising.
The carbon factor for ARV disposal via encapsulation is 0.4 kgCO2e per kg of waste arising.
landfill) has an insignificant impact to the total carbon emissions (<1 %).
The largest contributor to the encapsulation strategy’s carbon emissions comes from the manufacturing of the materials used in the encapsulation drums (HDPE and cement), which makes up 88 % of the total as opposed to waste disposal activities that contribute a much lower proportion of 12 %.
An outline estimate was undertaken for the CO2e emissions12 relating to the reverse logistics of the two standard waste management strategies. This found that they would be responsible for 7.6 kgCO2e for
the total waste inventory modelled. This would have a moderately significant impact to their respective carbon emissions, increasing them on average by approximately 10 %.
When considered at scale against the total 25,000 tonnes CO2e emissions generated by an example UNDP-GF Tajikistan grant, the emissions generated by waste management activities as calculated in this study is seen to be small. However, it should be highlighted that ARVs are only one product category of the various medicines and reagents procured by UNDP-GF (or indeed which are generated as waste in Tajikistan medical programmes more widely). If wider UNDP-GF procured
11Rounding adjustments means that values do not add up to the final carbon emission value.12Department of Environment, Food & Rural Affairs and Department of Energy & Climate Change (2013) UK Government conversion factors for Company Reporting
Stage kgCO2e emissions
API incineration 38.51 Excipient incineration 20.5Packaging incineration 37.6
Wood (fuel) incineration 0.0Residual ash disposal via ash pit 1.1Total emissions 97.6
Stage kgCO2e emissions
API incineration 44.0Excipient incineration 23.4Packaging incineration 43.0
Diesel (fuel) incineration 48.6Residual ash disposal via ash pit 0.5Total emissions 159.6
Stage kgCO2e emissions
HDPE drum manufacture 26.2Cement manufacture 15.9HDPE disposal via landfill 5.1
Cardboard box disposal via landfill 0.6
Total emissions 47.8
API incinerationExcipient incinerationPackaging incinerationWood (fuel) incinerationResidual ash disposal via ash pit
API incinerationExcipient incinerationPackaging incinerationDiesel (fuel) incinerationResidual ash disposal via ash pit
HDPE drum manufactureCement manufactureHDPE disposal via landfillCardboard box disposal via landfill
41
pharmaceuticals are looked at and assumed to have a similar chemical make up as ARVs, then following the underlying assumptions of this calculation method waste emissions from onsite small scale incineration might be estimated to be of the order 1tonne CO2e. Although still marginal, the scale of emissions at this level is starting to become more relevant, and this would increase further if larger scales of UNDP activity were included allowing for other programmes and countries.
Concluding points
There have been only a very limited number of studies that have looked at the carbon emissions associated with pharmaceutical waste management, as further confirmed by Cook et al.13, and the study undertaken here is the first systematic evidence based study of a global health initiative.
This work was undertaken to enable UNDP-GF to explore options for low carbon end-of-life waste management and carbon factors were developed for pharmaceutical waste management strategies based on antiretroviral tablet waste. In conclusion the study found the carbon footprint to have a negative correlation between low carbon waste management strategies and those strategies preferred in terms of the waste hierarchy. Further the magnitude of emissions was found to be small when compared to the total emissions of the UNDP-GF grant.
Within the family of tools that UNDP-GF is developing on waste management and the grant planning New Funding Model, this study has shown that it is feasible to provide a carbon calculation module that enables carbon emission calculations of different waste management strategies; these can now be successfully
incorporated into these developing tools. However, it is recommended to rank the assessment criteria when evaluating waste management strategies against each other as waste management is a complex issue and impacts such as waste toxicity and human safety may be greater drivers than climate change when it comes to forming effective waste management strategies.
This study has been based on both measured and assumed data presenting some limitations. It is recommended to carry out further research to draw out in detail the following:
- Incorporating other pharmaceutical waste products and UNDP-GF waste streams into the study scope – ARV tablet waste was chosen for this study since the quantity and costs associated with it were significant. However, it could be that significant waste flows vary between countries and regions. Therefore, an increase in the study scope would provide a better understanding of the carbon impacts for a wider range of waste material and waste management combinations.
- A better understanding of the landfill gas generation process – it was assumed under the national encapsulation strategy that zero landfill gas would be produced by the immobilised waste in landfill. This may not be the case as landfills tend to be very acidic environments, therefore there is always a risk that acid could get into the HDPE drums resulting in the breakdown of the tablets and production of landfill gas containing greenhouse gases.
- Conducting detailed calculations on the emissions related to the reverse logistics network – the reverse logistics emissions estimated in this study were found to bear importance to the overall magnitude of the carbon factor and therefore calculating accurate emissions may prove to be valuable.
13Cook, S.M., VanDuinen B.J., Love N.G., Skerlos S.J. (2012) Life Cycle Comparison of Environmental Emissions from Three Disposal Options for Unused Pharmaceuticals
Tablet preparation prior to encapsulation
ETLo
g©

42
For further information please contact:
Dr. Christoph Hamelmann Regional Practice Leader HIV, Health and Development
UNDP Regional Centre, Europe and the CIS
Dr. Kristian Steele Senior Analyst
Advanced Technology & Research Arup
DisclaimerThe content, analysis, opinions and policy recommendations contained in this publication do not necessarily reflect the views of the United Nations Development Programme

43
Specific carbon factors for health products – availability and application of data for ARVs and LLINs
Previous studies looking at the embodied carbon of the UNDP-GF health programmes have demonstrated the magnitude of impacts from procurement of goods – both in absolute terms, and as a proportion of overall programme carbon footprints. Especially relevant are those grants where large quantities of a single product category are procured, which can be up to 40% in some case studies.
In the context of using carbon as a metric for measuring environmental impact of such grants it then becomes increasingly important to identify product-specific carbon factors, rather than using broader industrial sector factors which reflect a wide range of products and processes.
As a key global purchaser of large volumes of medicines and medical equipment the
Introduction
Authors: Keith Robertson1 | Dr. Kristian Steele2 | Dr. Christoph Hamelmann2
1Senior Sustainability Consultant & Lead Analyst, Arup2Senior Analyst, Advanced Technology & Research, Arup3Regional Practice Leader HIV, Health and Development, UNDP Regional Centre, Europe and the CIS
UNDP©
44
Study scope
For the purposes of this study two categories of goods have been identified as of priority interest:
- The procurement of antiretroviral (ARV) pharmaceuticals for the treatment of HIV/AIDS; and
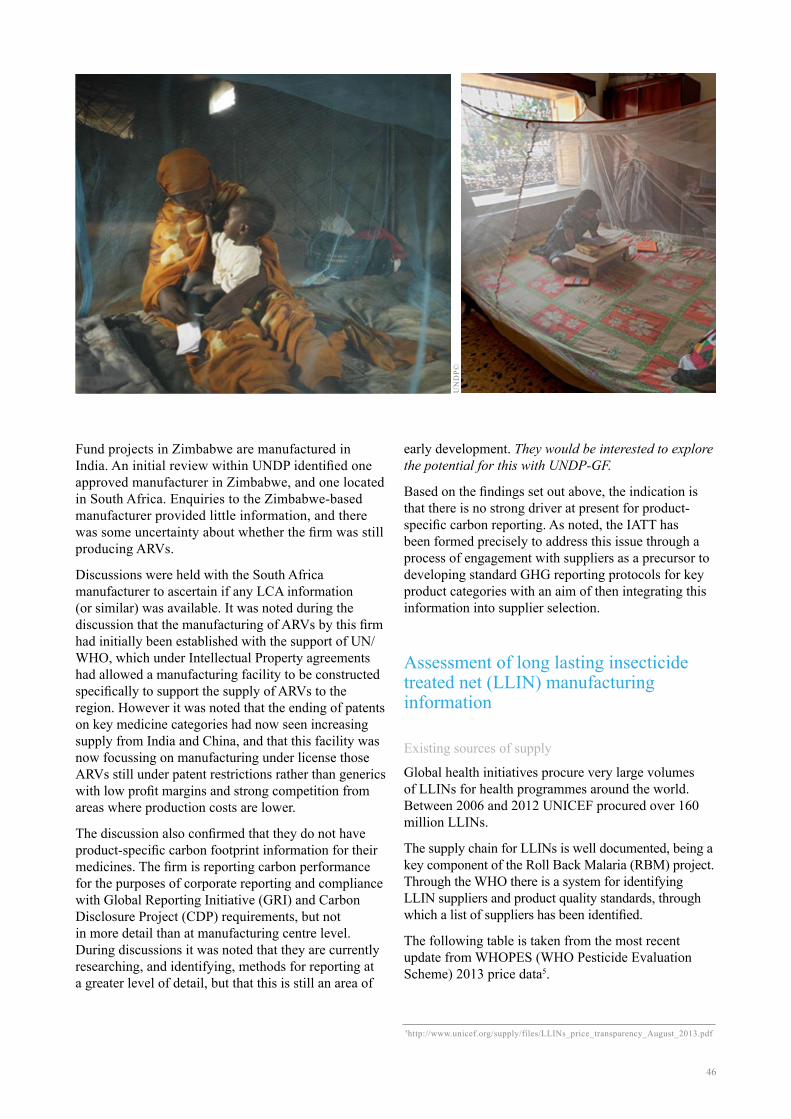
- The procurement of long lasting insecticide treated nets (LLINs) for malaria vector control.
These products feature significantly in the health programmes in Zimbabwe:
- the Round 8 Phase 2 HIV/AIDS programme in Zimbabwe allocated approximately 40% of its budget to procuring various ARV medicines;
- LLINs represent around 10% of the Round 8 grant budgets for Malaria in Zimbabwe.
Given the prominence of these goods in the grant programmes studied, and also the broader importance attached to them (which includes supporting quality and price monitoring schemes within the UN/WHO) these are of primary importance to this initial study of data availability.
Challenge
The challenge was to investigate what information is available on the two categories which might inform the footprinting process and help strengthen efforts to reduce emissions, this included:
- where are manufacturers of these goods located;
- have individual suppliers developed product-specific environmental or carbon footprinting data for their products;
- are there any mechanisms/drivers to encourage manufacturers to identify and report carbon or environmental impacts at a product scale;
- if not, then is there appetite from manufacturers to carry out this type of analysis; and
- how could UN organisations influence manufacturer reporting, given the volumes of procurement undertaken.
Information to investigate these questions was to be drawn from publicly available information, any information available from WHO/UN, and through direct discussions with manufacturing firms.
UN has considerable opportunity to influence how carbon footprinting can be used in the context of supplier selection, and through this to encourage greater transparency and reporting of environmental impact from product manufacture. The United Nations Informal Inter-Agency Task Team (IATT) on Sustainable Procurement in the Health Sector1 has been established to develop and implement an action plan on this topic,
i.e. providing a systematic approach for incorporating environmental impact quantification into procurement.This paper reports a preliminary review of data availability, and contextual information gathered during discussions with suppliers, for two specific categories of procurement which feature significantly in Global Fund (GF) health programmes in Zimbabwe, and implications of data availability on future reporting.
1The IATT comprises representatives from UNDP, UNFPA, WHO, UNICEF, UNHCR, UNOPS and UNEP

45
Assessment of ARV manufacturing information
Existing sources of supply
The term ‘ARV’ refers to a category of medicines containing a number of sub-classes. They are usually used in various recommended combinations to treat HIV infection. This paper does not investigate in detail differences between ARV medicines, and their sources, although it should be understood that there is complexity contained within referring simply to “ARVs”.
ARVs, and other pharmaceuticals used as part of antiretroviral treatment (ART), must go through an approval process within UN/WHO before being available for use in Global Fund projects. The list of ARVs used for the projects studies in Zimbabwe include:
- Abacavir
- Didanosine
- Atazanavir/Ritonavir
- Ritonavir
- Efavirenz
- Zidovudine
- Lopinavir
- Tenofovir
The World Health Organisation list of Prequalified Medicinal Products2 provides some information on the manufacturing locations for many of these. In broad terms large quantities of these are manufactured in India with smaller proportions manufactured in South America, US, and Europe. There is some mention of suppliers within Africa, but only for one ARV type. The World Health Organisation list does not provide an indication of actual volumes sourced from each of these suppliers.
The procurement of ARVs is affected by the complex area of patenting, resulting in restrictions of procurement options for ARVs under patent. This study does not examine this topic except to report comments made during discussions with manufacturers.
Availability of environmental impact data
A review was carried out to identify what information was readily available relating to the environmental and/or carbon performance of manufacturers, and
specifically to the production of ARVs.
A review of publicly available information for large international manufacturers of ARVs found that manufacturers (often with manufacturing locations based around the world) typically report on corporate environmental performance (often in line with Global Reporting Initiative requirements or similar). This type of reporting provides environmental performance data (energy, water, waste etc.) at a corporate level, and often down to the level of detail of a specific manufacturing facility (such as annual carbon emissions or similar).
No information was found on the specific impacts of product lines or categories. It is expected that manufacturing firms are likely to have basic information on the production of specific medicines – e.g. manufacturing energy – but this is not publicly available, and there is no indication that such firms carry out Life Cycle Assessment (LCA) studies/or similar in line with recognised standards.
Discussion
To some extent the findings on product level reporting are unsurprising. The Association of the British Pharmaceutical Industry (ABPI) has only recently produced a carbon footprint tool for UK pharmaceutical supply3. This is against a backdrop of increased interest in the UK regarding the carbon footprint of medicines, based on the UK NHS Carbon Reduction Strategy (2009) and Sustainable Development Strategy (2014). Discussions with the UK NHS Sustainable Development Unit (SDU) indicated that there is very little granularity in pharmaceutical life cycle data at present – something which forms a priority area for the UK NHS in order to inform their national assessment of carbon footprint. The UK NHS is currently trying to work with suppliers to develop this information in order to inform its understanding of the carbon impact of pharmaceutical provision in the UK.
Guidance for Pharmaceutical and Medical Device Product Life Cycle Accounting4 was produced in late 2012 with participation of UNDP. It is not clear how widely these are now being applied or considered by manufacturers to develop product-specific environmental data.
One area which was given some consideration was what benefits may accrue from sourcing key goods from locations closer to their point of use. As noted above, most ARVs procured by the UN for Global
2http://apps.who.int/prequal/ 3http://www.abpi.org.uk/our-work/mandi/Pages/sustainability.aspx4http://www.ghgprMAGNetotocol.org/feature/pharmaceutical-and-medical-device-sector-guidance-product-life-cycle-accounting
46
Fund projects in Zimbabwe are manufactured in India. An initial review within UNDP identified one approved manufacturer in Zimbabwe, and one located in South Africa. Enquiries to the Zimbabwe-based manufacturer provided little information, and there was some uncertainty about whether the firm was still producing ARVs.
Discussions were held with the South Africa manufacturer to ascertain if any LCA information (or similar) was available. It was noted during the discussion that the manufacturing of ARVs by this firm had initially been established with the support of UN/WHO, which under Intellectual Property agreements had allowed a manufacturing facility to be constructed specifically to support the supply of ARVs to the region. However it was noted that the ending of patents on key medicine categories had now seen increasing supply from India and China, and that this facility was now focussing on manufacturing under license those ARVs still under patent restrictions rather than generics with low profit margins and strong competition from areas where production costs are lower.
The discussion also confirmed that they do not have product-specific carbon footprint information for their medicines. The firm is reporting carbon performance for the purposes of corporate reporting and compliance with Global Reporting Initiative (GRI) and Carbon Disclosure Project (CDP) requirements, but not in more detail than at manufacturing centre level. During discussions it was noted that they are currently researching, and identifying, methods for reporting at a greater level of detail, but that this is still an area of
early development. They would be interested to explore the potential for this with UNDP-GF.
Based on the findings set out above, the indication is that there is no strong driver at present for product-specific carbon reporting. As noted, the IATT has been formed precisely to address this issue through a process of engagement with suppliers as a precursor to developing standard GHG reporting protocols for key product categories with an aim of then integrating this information into supplier selection.
Assessment of long lasting insecticide treated net (LLIN) manufacturing information
Existing sources of supply
Global health initiatives procure very large volumes of LLINs for health programmes around the world. Between 2006 and 2012 UNICEF procured over 160 million LLINs.
The supply chain for LLINs is well documented, being a key component of the Roll Back Malaria (RBM) project. Through the WHO there is a system for identifying LLIN suppliers and product quality standards, through which a list of suppliers has been identified.
The following table is taken from the most recent update from WHOPES (WHO Pesticide Evaluation Scheme) 2013 price data5.
5http://www.unicef.org/supply/files/LLINs_price_transparency_August_2013.pdf
UN
DP©

47
It is important to appreciate that the current supply chains for LLINs includes a range of products of different materials (primarily polyethylene, polypropylene and polyester) which, depending on material, are either impregnated or coated with insecticide. The material used, and the resulting method of applying insecticide, have implications for the lifetime of a net (which is a product of its physical robustness, and the longevity of the insecticide effectiveness).
Availability of environmental impact data
Initial enquiries were made to all of the suppliers in the WHOPES list. Direct contact was made with three suppliers of nets:
- BASF
- Bayer
- Bestnet
Similar to what was seen in the ARV study all companies provide corporate environmental reporting.
- BASF noted that they carry out ‘ecoefficiency’ studies for some of their products, but do not have one for their LLINs;
- Bestnet provide basic supply chain information (observing environmental legislation for example) as part of the tender process to the UN, but do not hold
product-specific environmental data;
- Bayer could provide information on the Life Cycle impacts of their LLINs – although only summary data was provided to inform this study6.
Discussion
Of the firms which responded, two held information on the life cycle impacts of their LLINs. It is not known whether other manufacturers hold such information, although an initial review of publicly available information did not identify any.
The discussions with Bayer provided useful information on the broader context behind this. Bayer’s main driver for publishing information on the life cycle impacts of their LLINs is that it offers a way to demonstrate the benefits of certain product lines which are more expensive than other LLINs. Bayer had demonstrated through its own analysis that over the lifetime of their polypropylene LifeNet product the carbon footprint of their use is lower than equivalent polyethylene or polyester nets, mainly through the extra robustness of this product.
The discussions with Bayer and other suppliers gave an indication of the current relative unimportance of life cycle information, in that it is not used as a selection criterion for LLINs. The approval and procurement
6http://www.vectorcontrol.bayer.com/bayer/cropscience/bes_vectorcontrol.nsf/id/EN_Public_Health_Journal_No_23/$file/PHJ_23.pdf
Manufacturer Product name Product type
Tana Netting DawaPlus® 2.0 Deltamethrin coated on polyester
Clarke/Shobika Duranet® Alpha-cypermethrin incorporated into polyethylene
BASF Interceptor® Alpha-cypermethrin coated on polyester
Bayer LifeNet® Deltamethrin incorporated into polypropylene
VKA Polymers MAGNet™ Alpha-cypermethrin incorporated into polyethylene
Bestnet Netprotect Deltamethrin incorporated into polyethylene
NetHealth / A to Z Textile Mills; Sumitomo Chemical
Olyset Net® Permethrin incorporated into polyethylene
Vestergaard Frandsen PermaNet® 2.0 Deltamethrin coated on polyester
Vestergaard Frandsen PermaNet® 3.0 Combination of deltamethrin coated on polyester with
Disease Control Technologies Royal Sentry® Alpha-cypermethrine incorporated into polyethylene
Yorkool Yorkool® LN Deltamethrine coated on polyester
48
process undertaken by WHO/UN is largely based on identifying nets which:
- meet the required performance standard;
- can be supplied in sufficient quantities; and
- can be provided at lowest price.
The opinion being that there is little value in firms identifying environmental impacts of their LLINs as this information is not a criterion for product selection. Production is largely carried out in countries such as India, Malaysia and Vietnam to minimise manufacturing costs. Bayer actively promote the footprint of their LifeNet specifically because this product is more costly than alternative products.
Concluding points
There is little product specific carbon footprint information available for ARVs, although there is better information available for LLINs. At present the drivers for developing this information for products are weak – there is little benefit in suppliers carrying out the necessary work to identify life cycle impacts and to make these available.
The IATT and global health financing institutions like the Global Fund and bilateral development partners have the power to increase the importance of this in their supplier selection process, which would offer several benefits:
1. Better understanding of grant programme carbon footprints: for key categories, where large volumes are procurement (or items are procured at large cost) the overall footprint estimation accuracy can be significantly improved using product-specific footprint data.
2. Incorporation of environmental impacts into the procurement chain: at present the main approach used by WHO/UN is to set a minimum performance threshold. Once this has been
achieved by a product (and further to a competitive procurement process) the supplier is listed by the WHO as approved, and is then available for use as a provider. While basic environmental performance information is included in the procurement process, no comparative figures on environmental impact of one good compared to another are available. Changing this situation, to one where suppliers provide LCA data or equivalent, would begin to provide a mechanism for including environmental impact in the procurement of goods and services.
3. Demonstrating the trade-off between environmental impact and cost: it was noted by one manufacturer of LLINs that the primary criteria for selection as a supplier is purchase price. In order to encourage manufacturers to consider the environmental cost of their products it will be necessary to include this as part of the procurement process, firstly by engaging with suppliers to develop standard methods of reporting environmental impact, and subsequently by incorporating this reporting into selection criteria.
4. Comparative assessment of different product types: there are several different types of LLINs, using different materials, and with different effective lifetimes (which are a factor of physical robustness, and also longevity of insecticidal action). Use of LCA data would inform the identification of preferred technologies on cost, lifetime, and environmental impact measures.
The various UN agencies are well placed to contribute to a significant change in the carbon footprinting landscape for key areas of procurement through the considerable leverage they gain from volumes of procurement. The IATT has begun the programme of work required to move towards more sustainable procurement, beginning the process of identifying standards for sustainability reporting, engagement with decision makers and procurement leads within UN agencies, engagement with suppliers and inclusion of sustainability standards into pre-qualification schemes.

49
UN
DP©
UN
OPS
©U
NO
PS©

50
For further information please contact:
Dr. Christoph Hamelmann Regional Practice Leader HIV, Health and Development
UNDP Regional Centre, Europe and the CIS
Dr. Kristian Steele Senior Analyst
Advanced Technology & Research Arup
DisclaimerThe content, analysis, opinions and policy recommendations contained in this publication do not necessarily reflect the views of the United Nations Development Programme
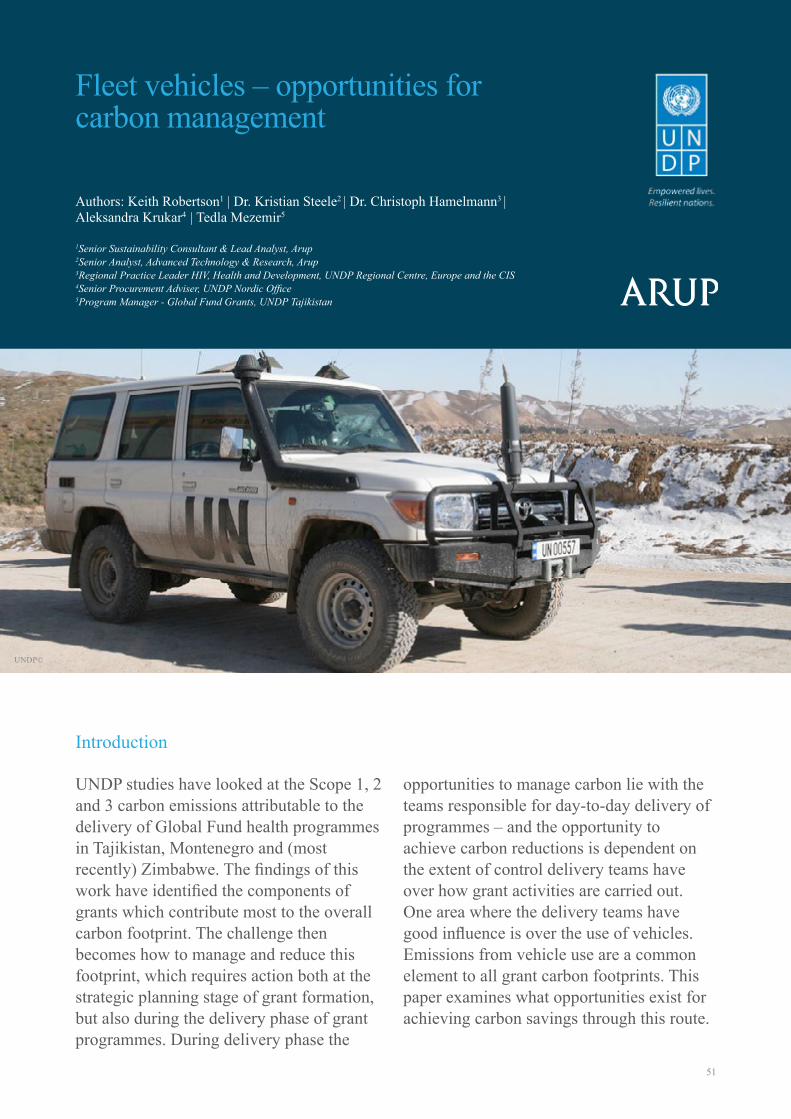
51
Authors: Keith Robertson1 | Dr. Kristian Steele2 | Dr. Christoph Hamelmann3 | Aleksandra Krukar4 | Tedla Mezemir5
Fleet vehicles – opportunities for carbon management
UNDP studies have looked at the Scope 1, 2 and 3 carbon emissions attributable to the delivery of Global Fund health programmes in Tajikistan, Montenegro and (most recently) Zimbabwe. The findings of this work have identified the components of grants which contribute most to the overall carbon footprint. The challenge then becomes how to manage and reduce this footprint, which requires action both at the strategic planning stage of grant formation, but also during the delivery phase of grant programmes. During delivery phase the
opportunities to manage carbon lie with the teams responsible for day-to-day delivery of programmes – and the opportunity to achieve carbon reductions is dependent on the extent of control delivery teams have over how grant activities are carried out. One area where the delivery teams have good influence is over the use of vehicles. Emissions from vehicle use are a common element to all grant carbon footprints. This paper examines what opportunities exist for achieving carbon savings through this route.
Introduction
1Senior Sustainability Consultant & Lead Analyst, Arup2Senior Analyst, Advanced Technology & Research, Arup3Regional Practice Leader HIV, Health and Development, UNDP Regional Centre, Europe and the CIS4Senior Procurement Adviser, UNDP Nordic Office5Program Manager - Global Fund Grants, UNDP Tajikistan
UNDP©

52
Scope
The delivery of Global Fund health programmes makes use of large numbers of vehicles, under the control of various organisations and entities. These include:
- Use of vehicles in the supply and management of procured medical equipment, pharmaceuticals, and other goods;
- Vehicles used by the UNDP Country Offices;
- Vehicles used by the Project Implementation Unit (PIU) for day-to-day tasks; and
- Vehicles used by sub-recipient (SR) organisations.
This study has identified one of these groupings – use by the Project Implementation Unit – as its focus. This is not the component of vehicle use likely to have the greatest emissions (which will come from freight vehicles and from use by sub-recipients), but it is a vehicle fleet which is directly under the control of the UNDP PIU. If it is feasible, and useful, to implement measures to change the way vehicles are used then the PIU has the remit and authority to make this happen.
The other main grouping considered for analysis was that of vehicle use by sub-recipients. Many grants include the purchase of vehicles for sole use by sub-recipients for the delivery of health activities. The selection of the vehicles being procured is undertaken by the PIU and/or Country Office, and so to some degree the emissions arising from sub-recipient vehicle use can be influenced through these procurement decisions.
Generally, sub-recipient vehicles use fuel which has also been purchased under the Global Fund grants. The day-to-day running of these vehicles is largely the responsibility of the sub-recipient organisation for which it has been purchased, and is therefore out of the direct management of the PIU (albeit fuel use and maintenance expenditure are managed as with other expenses of SRs). However, the activities undertaken by sub-recipients are undertaken within the terms of contracts between the Principal Recipient and the Sub-recipient, and there may be scope for greater control over the use of vehicles to be effected through these agreements.
For the purposes of this study the set of vehicles studied are those of the PIU in Tajikistan, supporting the delivery of the HIV/AIDS and TB grants. These grants were studied under the previous carbon footprint project carried out by UNDP and Arup.
Challenge
The challenge is to understand the systems in place for purchasing, maintaining and fuelling, and managing the use of vehicles procured through the grant funding process for use by the PIU. It was then to understand patterns of use, and to identify the potential contribution of any changes to management on the carbon footprint of the grants in question.
The fleet in Tajikistan comprises six vehicles, which are used for carrying out a range of programme-related activities which include Monitoring and Evaluation activities (M&E), general administrative and planning tasks (such as delivery and collection of documentation and occasionally equipment).
Administrative processes for fleet management
There are a number of phases to the procurement and operation of vehicles within grant programmes, discussed in the following sections.
Purchasing of vehicles
Purchasing of vehicles for use in the vehicle fleet is carried out by the Country Office of the relevant country. This is due to the value of vehicles typically being above the threshold for PIU procurement.
Management of vehicle use
Management of the fleet is undertaken through two main administrative processes depending on whether a journey is taking place within the main city area (up to approximately 25km from the PIU location), or whether travel further afield is required (in which case additional security oversight is required).
Travel within the city areaFor shorter journeys the process is:
1. Staff member requests a car/driver through an Access database system.
2. This is then approved by the relevant individual within the PIU.
3. Once approved the information is sent to the Fleet Manager, who books an available vehicle.

53
There is an Access database system which provides the booking system, and provides a record of journey bookings for later reconciliation.
Travel beyond the city areaBeyond the city there is a need for additional security. In this case the process is:
- An online request is made for security clearance for travel.
- Once clearance is granted a Local Travel Authorisation (LTA) is prepared which forms the approval document for travel. This is approved by the Programme Manager in the PIU, and by an authorised individual from the Country Office. The LTA also has a function relating to payment of expenses.
- A vehicle is assigned for use – the LTA is created for the passenger(s) and also the car driver.
Logging of travel informationThere are three main logs used for management/reconciliation of fleet vehicle costs etc.:
- A log which records mileages, fuel purchases and costs for each vehicle.
- Contained within the log book is a record of vehicle maintenance and costs.
- Daily log – a single sheet per day for each car. On this is recorded who travelled and for what purpose, where to/from, mileage, and driver name.
Reconciliation of recordsAt month end the Daily Logs for each vehicle are reconciled with the two separate systems (the Access database, and the LTA records). Costs are then attributed
to the different grant activities for budgeting and monitoring purposes. Typically these costs will be allocated to:
- Monitoring and evaluation activities.
- General office administrative budgets and/or specific vehicle fuel budget lines.
There is no final database recording all travel details from the two separate systems, although the costs attributable to all travel is entered into the UNDP ATLAS financial transaction system (although this will not record full details of usage such as destinations etc.).
Maintenance of vehicles
Maintenance of vehicles is managed by the fleet manager, and details of each vehicle’s maintenance recorded in the vehicle log. This is also used to inform the financial reconciliation, to ensure that maintenance costs are also allocated to the relevant budget lines in the grant programme.
End use of vehicles
Vehicles which are purchased under the funding for an individual grant are used by the PIU for the grant in question, but are then retained for use in subsequent programmes. This can create an available pool of vehicles greater than just those identified under a grant programme, as there may be vehicles available from previous programmes. At the point where vehicles reach their end of useful life (through age or damage) there is a standardised process for ‘retiring’ vehicles, whereupon they can be sold, donated or scrapped.
UN
DP©
UN
OPS
©
54
Opportunities for carbon management
There are various ways in which carbon emissions could be reduced through the way in which the vehicle fleet is managed as discussed below. These include:
- Purchase of more sustainable vehicles with lower embodied emissions
- Purchase of low emissions vehicles
- Avoided travel
- More efficient use of vehicles for day-to-day journeys
However, the actual capacity to achieve these savings is dependent on:
- Having administrative processes which support these activities
- Not compromising the delivery of grant programme outcomes
Procurement of vehicles
The UN has published guidance on procurement of vehicles, most recently in 20111. This guidance sets out basic and advanced sustainability criteria for vehicles. The basic criteria are intended to be used within minimal cost increases. The criteria cover a wide range of sustainability topics (emissions, quality, recycled content, pedestrian safety etc.).
In carbon terms there is little relating to embodied carbon, although proportion of recycled material is included as a Basic level criterion, with minimum standards for aluminium and steel recycled content.
Fuel economy is included as a criterion in vehicle purchasing choice, with a points based system for prioritising vehicles with higher fuel efficiency.
In quantitative terms the selection of fuel efficient vehicles is likely to outweigh recyclable content in terms of potential carbon savings. On the basis that the vehicle procurement criteria are being used when considering vehicles for use in Tajikistan, then the potential savings from switching may be limited. However, there may be a case for ensuring an adequate mix of vehicles within the fleet. It will be wholly dependent on location, but there may be scope for smaller and more fuel efficient vehicles to be used for short journeys within the city area.
Efficiency of vehicle use
It is generally accepted that travel is not undertaken unnecessarily within grant programmes. But to achieve reductions in carbon emissions for these vehicles it would be necessary to:
- Avoid unnecessary journeys
- Combine trips to reduce overall emissions
- Use an appropriate vehicle for the trip being undertaken
Vehicle logs for a three month period were obtained from the PIU in Tajikistan. These showed the following usage for the six available vehicles.
Travel beyond the city
The period examined was Jan-Mar 2014. Across the six vehicles:
- January saw 5 trips undertaken (3 to Kulyab and 2 to Khorog) for a total of 46 days. At most three vehicles were allocated concurrently;
- February saw 1 trip undertaken (Kurgan) for a total of 3 days.
- March saw 8 trips undertaken (6 to Khorog, 1 to Kurgan, 1 to Khujand). At most three vehicles were allocated concurrently.
Given the volumes and durations of these journeys (relatively few in number, and expected to mainly relate to M&E activities) it is expected that there is little opportunity for these types of journey to be avoided.
Travel within the city area
These trips are far more numerous, comprising many shorter journeys. The period Jan – Mar 2014 records over 300 journeys, around 100 per month.
Examining January as an example saw 120 journeys, all but one of which were short trips on a single day, and 75% of less than 2 hours duration. Many of the journeys are to attend meetings, to transport documents and paperwork, and occasionally for transporting supplies.
1http://www.unep.org/resourceefficiency/Portals/24147/scp/sun/facility/reduce/procurement/PDFs/UNSP_Product%20Sheet_Vehicles_basic%20and%20advanced_all%20regions.pdf
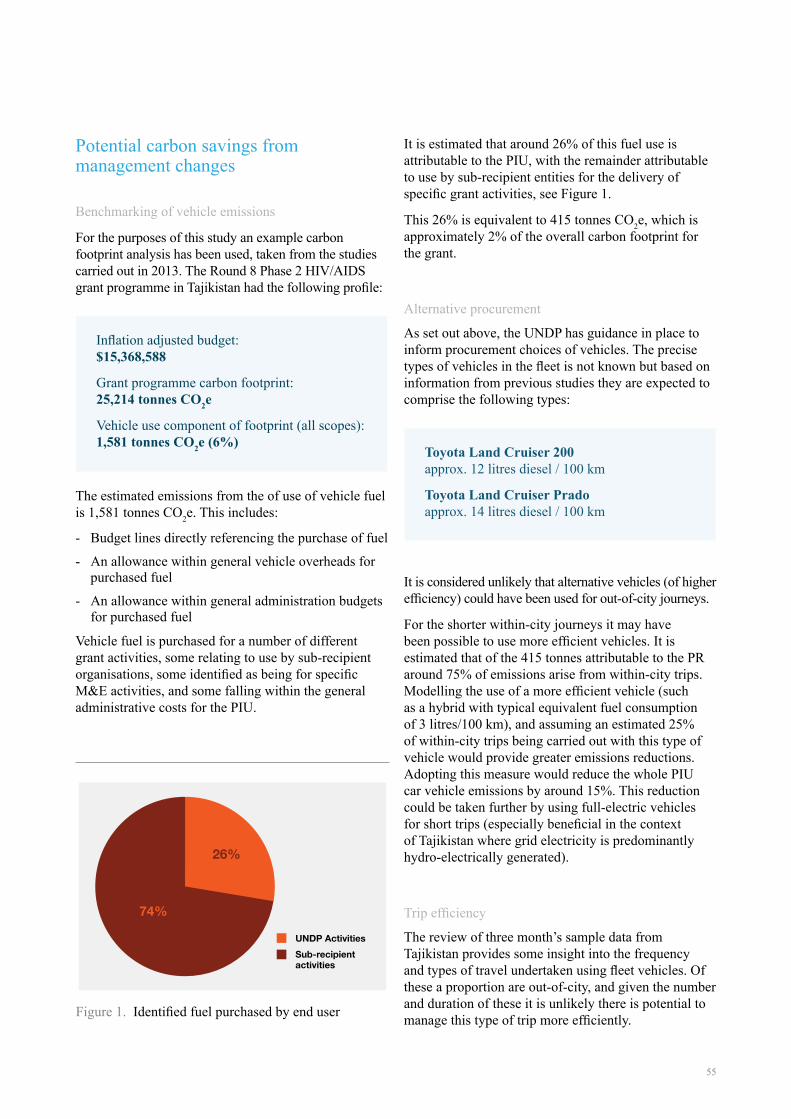
55
Potential carbon savings from management changes
Benchmarking of vehicle emissions
For the purposes of this study an example carbon footprint analysis has been used, taken from the studies carried out in 2013. The Round 8 Phase 2 HIV/AIDS grant programme in Tajikistan had the following profile:
The estimated emissions from the of use of vehicle fuel is 1,581 tonnes CO2e. This includes:
- Budget lines directly referencing the purchase of fuel
- An allowance within general vehicle overheads for purchased fuel
- An allowance within general administration budgets for purchased fuel
Vehicle fuel is purchased for a number of different grant activities, some relating to use by sub-recipient organisations, some identified as being for specific M&E activities, and some falling within the general administrative costs for the PIU.
It is estimated that around 26% of this fuel use is attributable to the PIU, with the remainder attributable to use by sub-recipient entities for the delivery of specific grant activities, see Figure 1.
This 26% is equivalent to 415 tonnes CO2e, which is approximately 2% of the overall carbon footprint for the grant.
Alternative procurement
As set out above, the UNDP has guidance in place to inform procurement choices of vehicles. The precise types of vehicles in the fleet is not known but based on information from previous studies they are expected to comprise the following types:
It is considered unlikely that alternative vehicles (of higher efficiency) could have been used for out-of-city journeys.
For the shorter within-city journeys it may have been possible to use more efficient vehicles. It is estimated that of the 415 tonnes attributable to the PR around 75% of emissions arise from within-city trips. Modelling the use of a more efficient vehicle (such as a hybrid with typical equivalent fuel consumption of 3 litres/100 km), and assuming an estimated 25% of within-city trips being carried out with this type of vehicle would provide greater emissions reductions. Adopting this measure would reduce the whole PIU car vehicle emissions by around 15%. This reduction could be taken further by using full-electric vehicles for short trips (especially beneficial in the context of Tajikistan where grid electricity is predominantly hydro-electrically generated).
Trip efficiency
The review of three month’s sample data from Tajikistan provides some insight into the frequency and types of travel undertaken using fleet vehicles. Of these a proportion are out-of-city, and given the number and duration of these it is unlikely there is potential to manage this type of trip more efficiently.
Inflation adjusted budget:$15,368,588
Grant programme carbon footprint:25,214 tonnes CO2e
Vehicle use component of footprint (all scopes): 1,581 tonnes CO2e (6%)
Toyota Land Cruiser 200 approx. 12 litres diesel / 100 km
Toyota Land Cruiser Prado approx. 14 litres diesel / 100 km
Figure 1. Identified fuel purchased by end user
UNDP ActivitiesSub-recipient activities
26%
74%

56
Within the city area the sample data shows a large number of short trips, with 23% lasting less than 60 minutes, and 47% lasting between 60 and 120 minutes. Over the three month period 320 trips have complete date/time information – an average of 3.5 trips per day. This frequency of travel suggests that there is limited scope to optimise journeys on a day to day basis.
The narrative supplied with journey information indicates a range of reasons for trips – many for meetings and site visits, but also several for document delivery etc. It is unlikely that there will be scope to manage trips to any significant extent for journeys other than simple administrative tasks. A review of trip information suggests around 20% of trips are for the purposes of transporting documents. There is potential for UNDP to achieve improvements in this pattern of vehicle usage, many of which can be delivered through a more advanced vehicle management system. An integrated system for booking, allocating, routing and logging vehicle trips could contribute significantly to achieving efficiencies in fleet usage.
To understand potential impact of changes in use, an indicative saving of 100% of simple document transfer trips (through combining these with other journeys) would reduce the PIU fuel use footprint from 416 tonnes CO2e to 353 tonnes CO2e (a 15% reduction).
Cumulative carbon savings
Combining potential savings through vehicle selection and removing simple document trips would achieve reductions of emissions attributable to the PIU vehicle use.
This is further presented in Figure 2 where it can be seen to equate to a combined reduction against PIU vehicle use of some 27%. If this were achieved it would deliver a reduction in overall grant carbon footprint of about half a percentage point.
Grant Carbon footprint:
Vehicle use component of footprint (all scopes):
Vehicle use by PIU:
Emissions after using more efficient vehicles:
Emissions after reducing the number of trips:
Total emissions after combining both changes:
25,214 tonnes CO2e
1,581 tonnes CO2e
416 tonnes CO2e
354 tonnes CO2e
353 tonnes CO2e
304 tonnes CO2e
Opportunity of hybrid technologies
The carbon savings modelled take a conservative view of what might be achievable through the use of more efficient vehicles and through more effective trip and vehicle management. There is potential to realise these savings across a greater range of vehicles and their use, through working with sub-recipient organisations, and through changes to the selection of vehicles for use.
A move towards full use of hybrid vehicles (with an estimated typical 75% reduction in vehicle emissions per km) would achieve significantly greater impact. Implementing full hybrid vehicle use could cut approximately 5% from the total grant footprint, equivalent to a saving of approximately 1,180 tonnes CO2e. This would require the identification and procurement of hybrid vehicles capable of operating under the required performance conditions. Close work between UNDP and vehicle suppliers is required to identify what vehicles might be currently available, and the operational conditions under which they would be used across different geographical locations.
Carbon saving potential
Figure 2. Vehicle emission reductions potential
Baselin
e
Vehi
cle
fuel
em
issi
ons
(tonn
es C
O2e
)0
100
200
300
400
Vehic
le
efficie
ncy
Reduc
ed
trips
Combine
d
effec
t
Reduction
PIU Footprint

57
Conclusions
The initial arguments for examining fleet vehicle use is that it is an area within the direct control of the PIU; and the findings of this paper indicate this potential and the carbon saving’s possibilities it represents. The case study review of Tajikistan found that the applied administration system is not state-of-art and uses multiple platforms, has no automated or customized analysis, no vehicle position system, and requires a re-conciliation of manual recording with an electronic requisition system. By contrast an integrated system for booking, allocating, routing and logging vehicle trips could contribute significantly to achieving efficiencies in usage.
An intervention such as this would be challenging, but the subsequent benefits would be justifiable if the updated systems were applicable beyond just the PIU – extending to the country office, and potentially broader UNDP programmes within other countries. In this regard the opportunity should be looked at from a UNDP corporate /strategic perspective and the cost efficiency, security and environmental benefits it could bring.
It is therefore recommended that the UNDP undertake a broader review of its vehicle management systems, which would inform the purchase, running and maintenance of vehicles across its operations and the systems that support their use. In time this scale of intervention would have potential to influence the behaviour of those parties involved in the delivery of transport in a range of geographies. This influence could partly be realised through extending these savings into the activities of sub-recipient organisations (often government bodies and agencies in the target countries). As an example extending the modelled vehicle emissions reductions to sub-recipients could deliver around a 2% reduction in the carbon footprint of a country grant programme, while also demonstrating direct cost savings to project/programme delivery.
UN
DP©
UN
DP©
UN
DP©
UN
DP©
58
For further information please contact:
Dr. Christoph Hamelmann Regional Practice Leader HIV, Health and Development
UNDP Regional Centre, Europe and the CIS
Dr. Kristian Steele Senior Analyst
Advanced Technology & Research Arup
DisclaimerThe content, analysis, opinions and policy recommendations contained in this publication do not necessarily reflect the views of the United Nations Development Programme

59
Authors: Keith Robertson1 | Dr. Kristian Steele2 | Dr. Christoph Hamelmann2
1Senior Sustainability Consultant & Lead Analyst, Arup2Senior Analyst, Advanced Technology & Research, Arup3Regional Practice Leader HIV, Health and Development, UNDP Regional Centre, Europe and the CIS
Carbon footprinting of Global Fund grant programmes – feasibility of measurement during operational phases
Previous studies by the UNDP, working with Arup, have demonstrated the feasibility of developing a measure of carbon footprint for the delivery of Global Fund health programmes. This method allows a grant programme to be assessed during the development of budget planning – a useful tool to inform the effect of a chosen grant strategy on overall carbon footprint.The challenge then becomes one of demonstrating how the actual delivery of a
programme performs in carbon terms, and in providing this information during the grant operational phase – to inform the decision making of those individuals actually delivering grant activities.This study examines whether the techniques used previously for assessing grants can be effectively and practicably used during the operational phase, and if not then what alternative strategies are available to the UNDP-GF and its partners for achieving this.
Introduction
UNOPS©

60
Background to carbon footprinting of grant programmes
In 2012/13 year Arup and UNDP undertook a studyto quantify the carbon footprint associated withthe delivery of Global Fund health programmes in Tajikistan and Montenegro1. The analysis technique used grant-level budgeting and financial informationto develop an estimate of the carbon footprint of the activities and procurement undertaken within the grant programme. The analysis used a database of standard industrial sector carbon intensity factors, combined with the budgeted expenditure within each component of the grant, to build up the overall carbon footprint of the grant. The approach was applied to HIV/AIDS and Tuberculosis grants in the two countries, and the results provided guidance on the relative contribution of different areas of activity – from procuring medicines and medical equipment internationally, through to the use of vehicle fuel for monitoring and evaluation work carried out within the country.
This assessment of a global health programme wasthe first of its kind, and provided insights into the areas where the UNDP and its practitioners could focus efforts to reduce carbon emissions from grant programmes. These opportunities are present at both the strategic level (where the focus of grant activities are considered), through the procurement process for goods and services, and finally to operational activities undertaken by the Project Implementation Unit for a given grant programme.
Given the tight coupling between budget and outturn expenditure it was decided to use budget spreadsheets as the main data source for analysis. These documents are fairly well standardised across UNDP- GF, and provide a good level of detail on what isbeing undertaken within a grant to inform the carbon assessment. However, such an approach is based on the assumptions implicit with the budget planning process, and do not reflect the reality of programme delivery, and any variations from the planned activities and procurement set out in the project plan and budget phase. The challenge is to understand whether the existing method can be used in such a context, or whether an alternative approach is required to deliver day-to-day carbon measurement of a grant programme.
Study scope
In broad terms this study does not have a geographicor subject-specific scope, being focused mainly on the systems and processes which underpin the development of a grant programme, and the reporting which is carried out during, and following, its delivery.
However, for the purposes of this paper the main source of information has been drawn from the Project Implementation Units for the health programmes in Tajikistan who provided information for the original study, and supplementary information to inform this paper.
Challenge
The previous footprint studies have focused on single datasets of compiled budget data, with supporting descriptions of individual grant activities, and build-ups for certain categories of budget costs. In principal the calculation approach could be similarly applied to outturn expenditure, assuming the financial data for each element of a grant programme could be provided in suitable format, but this exercise has not been carried out (retrospective analysis of grants being less directly useful than those carried out in advance, or during, grant delivery).
In principle the method could be carried out at any given point in a grant period – assuming that information could be provided, at that point in time, on all aspects of a grant programme. Based on discussions with UNDP implementation and management teams, there is no existing reporting process which provides grant data in such a format.
The challenge is to understand if there is a means to identify and collate expenditure data in a suitable format within the existing reporting systems.
1Carbon footprint of UNDP Global Fund health initiatives in Montenegro and Tajikistan: http://www.eurasia.undp.org/content/rbec/en/home/library/hiv_aids/Carbon_footprint_UNDP_Global_Fund_health_ initiatives_Montenegro_Tajikistan/

61
Context of a reporting system
Structure of a grant programme
A simplified structure for a typical health programme has the following participants (as shown in Figure 1):
- The Global Fund – ultimate funder of grant activities
- The UNDP (Principal Recipient of funds) – coordinates and measures funding and delivery of grant programmes;
- Sub-recipient organisations – carry out the activities funded by the grant.
The capacity to monitor carbon on an on-going basis isof interest at two levels:
- allowing the UNDP to monitor the carbon associated with how sub-recipients deliver programme activities; and
- allowing Global Fund to monitor the high level carbon performance of their funded projects.
Any operational reporting system for carbon needs to operate at a level of granularity similar to other existing project reporting systems – which comprise two main reporting systems: financial reporting and reporting on delivery against project outcome targets.
Examining the existing reporting systems provides insight to the level of detail any carbon reporting must operate at. To understand this it is necessary to consider the typical structure of a grant programme.
The terminology applicable to grants is changing with the introduction of the New Funding Model, but the principles are largely similar to those used in the previous funding regime.
1. Financial management between Global Fund and the Principal Recipient
Funds for grants are distributed to the Principal Recipient (PR) which is the UNDP in the case of the grants being studied. The PR is responsible for reporting to the Global Fund on the progress of grants – i.e. how much money is being spent, and how is the programme performing against delivery targets. This reporting is done through the completion of Progress Update and Disbursement Request (PUDR). The PUDR documents:
- financial activity during the reporting period;
- description of progress towards achieving the agreed targets;
- a summary on procurement and supply management (PSM) – that is procurement of key goods;
- a self-assessment analysis;
- an annex on sub-recipient financial information (not always required).
Disbursement of funds from Global Fund to the PR is reliant on the PUDR being submitted and approved.
The PUDR is an important standard reporting format, but it does not contain detailed financial transaction information. It contains aggregated data that allows the Global Fund to review expenditure at summary category levels.The PUDR is completed by the PR based on a large amount of transaction data which is collated to inform expenditure against budget at an aggregated level.
2. Financial management between Principal Recipients and Sub-recipients
The PR is responsible for managing the distribution of funding to sub-recipients, for direct purchasing from suppliers, and for attribution of funds to UNDP activities.
The UNDP uses the ATLAS system to record all financial transactions for grant programmes. ATLAS forms the main system for managing data relating to this expenditure, and is maintained by the PR through the receipt of invoice and transaction information from sub- recipients and other parties.
Figure 1. Simplified grant delivery structure
Global Fund
UNDP(PR)
Sub-recipients
Financial and performance
reporting
Financial and performance
reporting
Fund disbursement
Fund disbursement
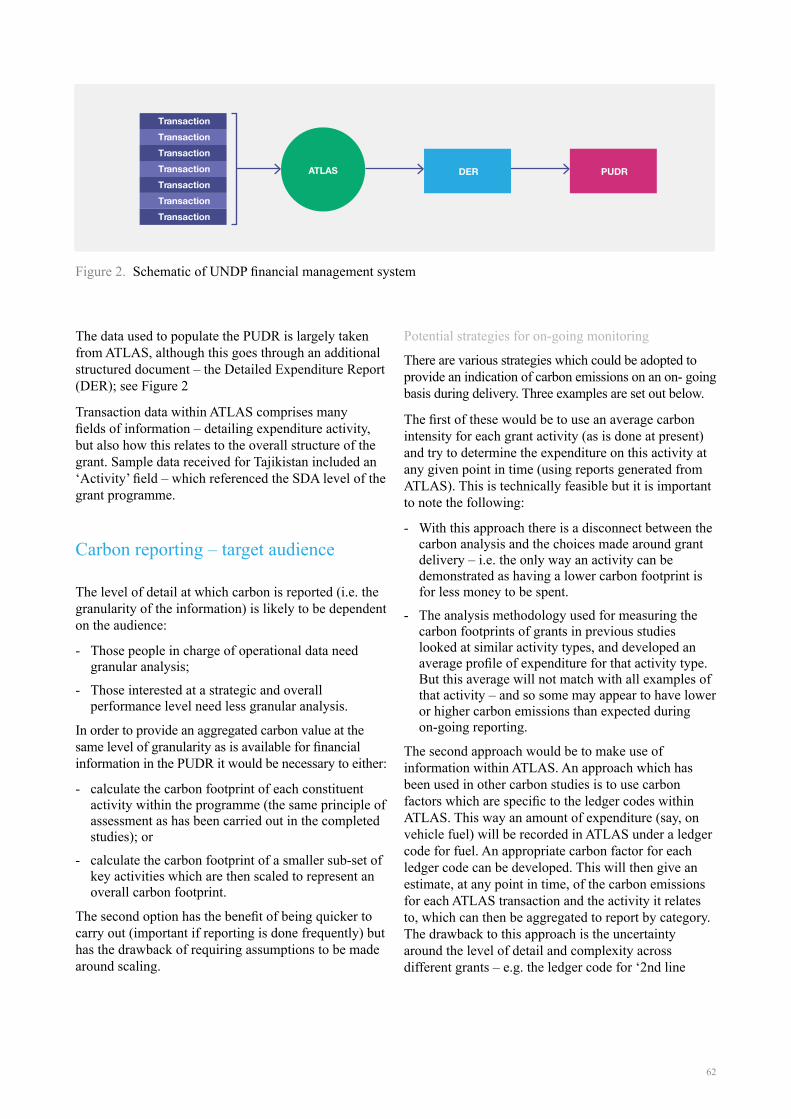
62
The data used to populate the PUDR is largely taken from ATLAS, although this goes through an additional structured document – the Detailed Expenditure Report (DER); see Figure 2
Transaction data within ATLAS comprises manyfields of information – detailing expenditure activity, but also how this relates to the overall structure of the grant. Sample data received for Tajikistan included an ‘Activity’ field – which referenced the SDA level of the grant programme.
Carbon reporting – target audience
The level of detail at which carbon is reported (i.e. the granularity of the information) is likely to be dependent on the audience:
- Those people in charge of operational data need granular analysis;
- Those interested at a strategic and overall performance level need less granular analysis.
In order to provide an aggregated carbon value at the same level of granularity as is available for financial information in the PUDR it would be necessary to either:
- calculate the carbon footprint of each constituent activity within the programme (the same principle of assessment as has been carried out in the completed studies); or
- calculate the carbon footprint of a smaller sub-set of key activities which are then scaled to represent an overall carbon footprint.
The second option has the benefit of being quicker to carry out (important if reporting is done frequently) but has the drawback of requiring assumptions to be made around scaling.
Potential strategies for on-going monitoring
There are various strategies which could be adopted to provide an indication of carbon emissions on an on- going basis during delivery. Three examples are set out below.
The first of these would be to use an average carbon intensity for each grant activity (as is done at present) and try to determine the expenditure on this activity at any given point in time (using reports generated from ATLAS). This is technically feasible but it is important to note the following:
- With this approach there is a disconnect between the carbon analysis and the choices made around grant delivery – i.e. the only way an activity can be demonstrated as having a lower carbon footprint is for less money to be spent.
- The analysis methodology used for measuring the carbon footprints of grants in previous studies looked at similar activity types, and developed an average profile of expenditure for that activity type. But this average will not match with all examples of that activity – and so some may appear to have lower or higher carbon emissions than expected during on-going reporting.
The second approach would be to make use of information within ATLAS. An approach which has been used in other carbon studies is to use carbon factors which are specific to the ledger codes within ATLAS. This way an amount of expenditure (say, on vehicle fuel) will be recorded in ATLAS under a ledger code for fuel. An appropriate carbon factor for each ledger code can be developed. This will then give an estimate, at any point in time, of the carbon emissions for each ATLAS transaction and the activity it relates to, which can then be aggregated to report by category. The drawback to this approach is the uncertainty around the level of detail and complexity across different grants – e.g. the ledger code for ‘2nd line
Figure 2. Schematic of UNDP financial management system
ATLAS DER
TransactionTransactionTransactionTransactionTransactionTransactionTransaction
PUDR

63
antibiotics’ will not necessarily contain detail on where drugs were procured (reducing the scope for tailored carbon intensities) although there may be methods for resolving this ambiguity.
The third approach is quite different to the two above,in that instead of attempting to calculate the carbon emissions of each activity, instead a set of ‘indicator activities’ is used. The principal is that instead of assessing the carbon footprint of all the pharmaceuticals bought, instead the carbon emissions associated with (for example) treating a single HIV patient is calculated. This approach has some merit in that it allows the following to be done:
1. the process steps in delivering an activity become better understood (e.g. where do drugs come from; how are they transported; how is a patient travelling; how are sub-recipient employees travelling; how are test results obtained etc);
2. instead of trying to understand the footprint of small items within a grant, cash transactions on food and drink and such-like, rather the focus is on the large and expensive components of the grant;
3. it may facilitate easier comparison between grant programmes in different countries; although conversely may provide fewer opportunities for comparison between different disease programmes;
4. there is the benefit of producing a small number of indicators to show general progress at the level which the Global Fund is interested; but provides poor granularity for the management of sub- recipient organisations.
Conclusions
It is concluded that the preferred approach to on- going monitoring depends on the target audience for reporting. However, in general the detail contained within ATLAS forms the most robust dataset for understanding, at a given point in time, what monies have been spent on what grant activities. It is understood that recent work has been undertaken to update ATLAS to reflect changes to the administration of grants in line with the New Funding Model. As such it appears a prime source of information for the carbon footprint analysis during operation.
Adopting an approach based on this dataset would allow for relatively quick assessment of carbon footprint. Standard carbon intensities can be developed for each of the Ledger Codes contained within ATLAS for a specific country. Once these are developed, then estimating the carbon footprint at a given point in time becomes relatively straightforward.
Discussions with the UNDP have identified that ATLAS contains detail on individual transactions to a granular level of detail – down to the ‘Activity’ level which was used for the previous carbon footprint studies. At the ‘Activity’ level ATLAS records ledger codes which reflect the project, donor and fund attached to each transaction. This means that a financial transaction based approach appears viable.
The technique of using financial transaction data, combined with using carbon factors specific to accounting ledger codes, has been used by a number of large organisations. This approach has formed the basis of NHS Carbon Footprint studies in the UK and the UK Higher Education sector, along with a number of large private organisations, although primarily as an annual reporting mechanism, rather than an on-going reporting system. However, the calculation method is robust.
The use of ATLAS as the basis of a corporate accounting system offers considerable opportunityfor the UNDP. In addition to providing a means of reporting and monitoring on the delivery of grants, it also offers opportunities for corporate reporting across the UNDP and potentially other UN organisations which share the ATLAS platform.
It is recommended that a trial exercise for monitoring the on-going grant delivery carbon footprint is initiated, which will demonstrate the applicability of this method, and will assist in understanding where other opportunities for its application exist within the UNDP.
UN
OPS
©

64
For further information please contact:
Dr. Christoph Hamelmann Regional Practice Leader HIV, Health and Development
UNDP Regional Centre, Europe and the CIS
Dr. Kristian Steele Senior Analyst
Advanced Technology & Research Arup
DisclaimerThe content, analysis, opinions and policy recommendations contained in this publication do not necessarily reflect the views of the United Nations Development Programme

65
Authors: Dr. Maria Brucoli1 | Dr. Kristian Steele2 | Dr. Christoph Hamelmann3 | Elliman Jagne4 | Daisy Mukarakate5
Off-grid power supply carbon footprint and sustainable energy planning of primary health facilities
Cost effective, resilient and sustainable access to energy is an important building block for development and is a strategically important objective for UNDP as recognised by the Sustainable Energy for All (SE4ALL1) programme.
In the health sector, power availability is a key requirement for successful service delivery with power needed for life-support equipment (e.g. incubators), essential equipment (e.g. refrigerators), and basic
function delivery requiring light to see or power for small equipment.
In many countries where UNDP-GF administers programmes, there is insufficient generation capacity or delivery infrastructure. This means that in many cases GF-grants are being used to procure and support micro scale energy infrastructure. This study will provide an insight to the carbon impact and savings potential of renewable off grid generation technology at country grant level.
Introduction
1http://www.se4all.org/
1Engineer and Microgrids Specialist Building Engineering, Arup2Senior Analyst, Advanced Technology & Research, Arup3Regional Practice Leader HIV, Health and Development, UNDP Regional Centre, Europe and the CIS4Operations Manager GFATM projects, UNDP Zimbabwe5Programme Specialist – Environment and energy, UNDP Zimbabwe
UNOPS©
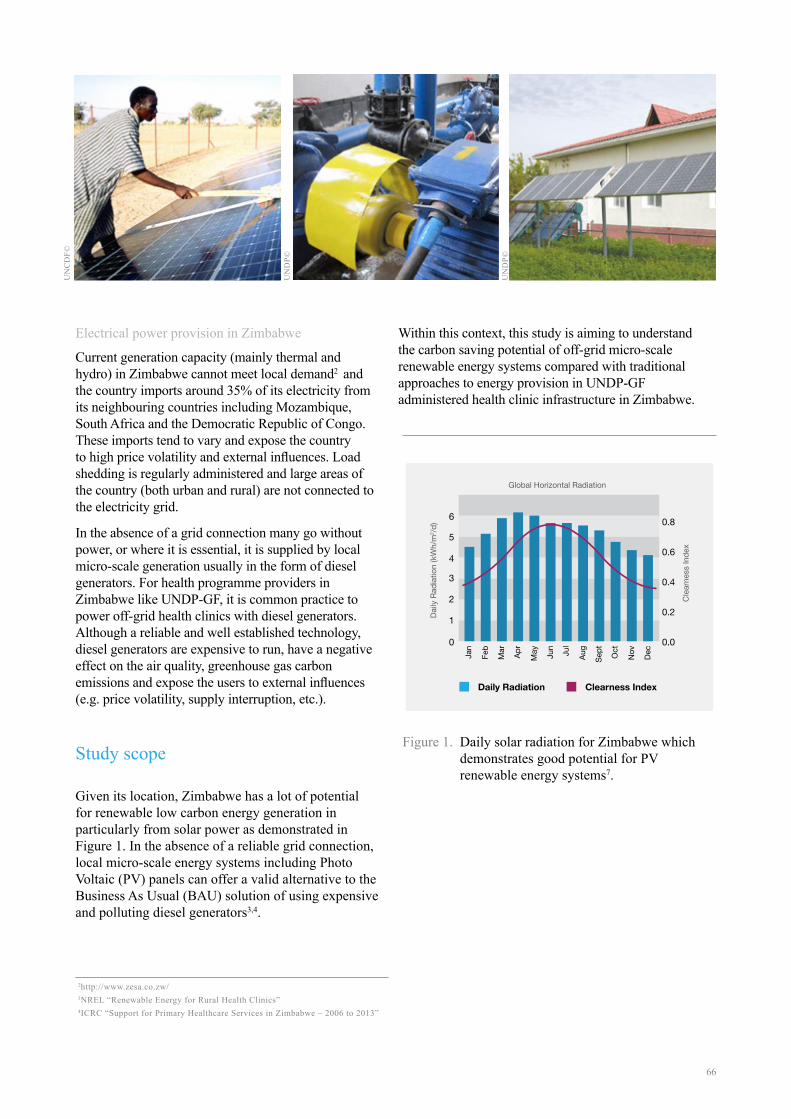
66
Electrical power provision in Zimbabwe
Current generation capacity (mainly thermal and hydro) in Zimbabwe cannot meet local demand2 and the country imports around 35% of its electricity from its neighbouring countries including Mozambique, South Africa and the Democratic Republic of Congo. These imports tend to vary and expose the country to high price volatility and external influences. Load shedding is regularly administered and large areas of the country (both urban and rural) are not connected to the electricity grid.
In the absence of a grid connection many go without power, or where it is essential, it is supplied by local micro-scale generation usually in the form of diesel generators. For health programme providers in Zimbabwe like UNDP-GF, it is common practice to power off-grid health clinics with diesel generators. Although a reliable and well established technology, diesel generators are expensive to run, have a negative effect on the air quality, greenhouse gas carbon emissions and expose the users to external influences (e.g. price volatility, supply interruption, etc.).
Study scope
Given its location, Zimbabwe has a lot of potential for renewable low carbon energy generation in particularly from solar power as demonstrated in Figure 1. In the absence of a reliable grid connection, local micro-scale energy systems including Photo Voltaic (PV) panels can offer a valid alternative to the Business As Usual (BAU) solution of using expensive and polluting diesel generators3,4.
Within this context, this study is aiming to understand the carbon saving potential of off-grid micro-scale renewable energy systems compared with traditional approaches to energy provision in UNDP-GF administered health clinic infrastructure in Zimbabwe.
Figure 1. Daily solar radiation for Zimbabwe which demonstrates good potential for PV renewable energy systems7.
2http://www.zesa.co.zw/ 3NREL “Renewable Energy for Rural Health Clinics”4ICRC “Support for Primary Healthcare Services in Zimbabwe – 2006 to 2013”
Global Horizontal Radiation
Cle
arne
ss In
dex
Daily
Rad
iatio
n (k
Wh/
m2 /d
)
Jan
Feb
Mar Apr
May Jun
Jul
Aug
Sept Oct
Nov Dec0
1
2
3
4
5
0.0
0.2
0.4
0.6
0.86
Daily Radiation Clearness Index
UN
CD
F©
UN
DP©
UN
DP©
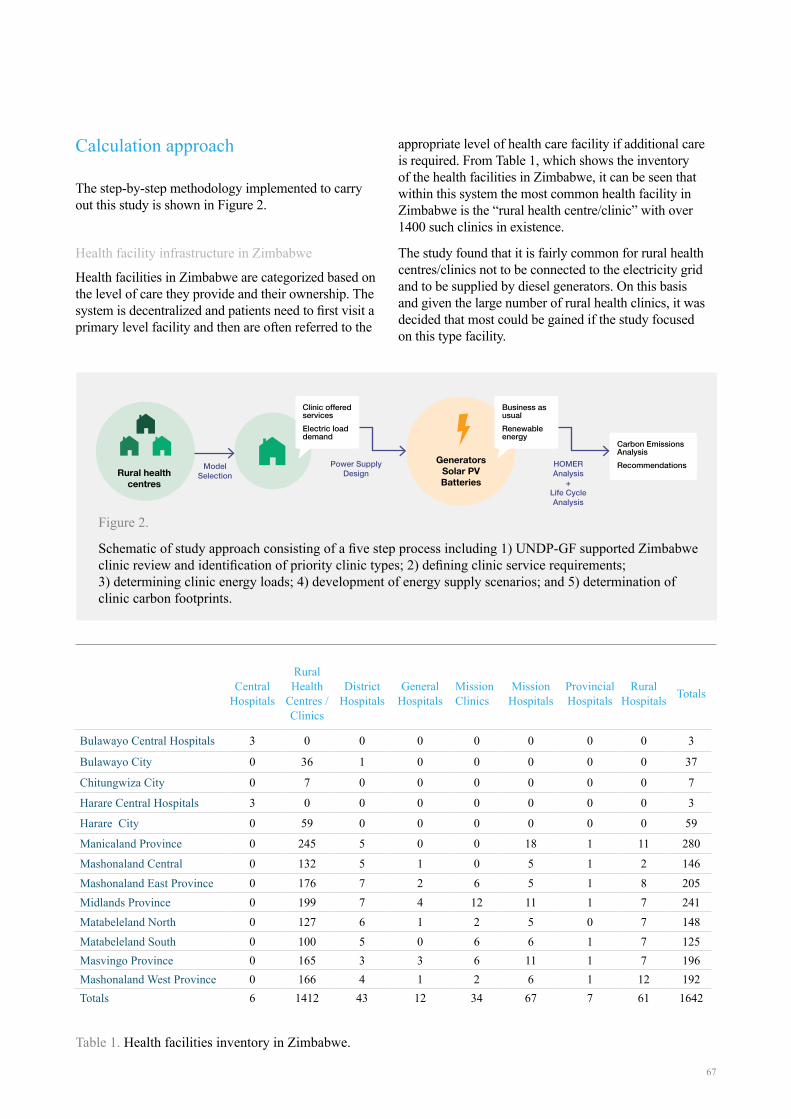
67
Calculation approach
The step-by-step methodology implemented to carry out this study is shown in Figure 2.
Health facility infrastructure in Zimbabwe
Health facilities in Zimbabwe are categorized based on the level of care they provide and their ownership. The system is decentralized and patients need to first visit a primary level facility and then are often referred to the
appropriate level of health care facility if additional care is required. From Table 1, which shows the inventory of the health facilities in Zimbabwe, it can be seen that within this system the most common health facility in Zimbabwe is the “rural health centre/clinic” with over 1400 such clinics in existence.
The study found that it is fairly common for rural health centres/clinics not to be connected to the electricity grid and to be supplied by diesel generators. On this basis and given the large number of rural health clinics, it was decided that most could be gained if the study focused on this type facility.
Table 1. Health facilities inventory in Zimbabwe.
GeneratorsSolar PVBatteries
Business as usualRenewable energy
Carbon Emissions AnalysisRecommendationsModel
SelectionPower Supply
DesignHOMER Analysis
+ Life Cycle Analysis
Clinic offeredservicesElectric loaddemand
Figure 2.
Schematic of study approach consisting of a five step process including 1) UNDP-GF supported Zimbabwe clinic review and identification of priority clinic types; 2) defining clinic service requirements; 3) determining clinic energy loads; 4) development of energy supply scenarios; and 5) determination of clinic carbon footprints.
Central Hospitals
Rural Health
Centres / Clinics
District Hospitals
General Hospitals
Mission Clinics
Mission Hospitals
Provincial Hospitals
Rural Hospitals Totals
Bulawayo Central Hospitals 3 0 0 0 0 0 0 0 3
Bulawayo City 0 36 1 0 0 0 0 0 37
Chitungwiza City 0 7 0 0 0 0 0 0 7
Harare Central Hospitals 3 0 0 0 0 0 0 0 3
Harare City 0 59 0 0 0 0 0 0 59
Manicaland Province 0 245 5 0 0 18 1 11 280
Mashonaland Central 0 132 5 1 0 5 1 2 146Mashonaland East Province 0 176 7 2 6 5 1 8 205Midlands Province 0 199 7 4 12 11 1 7 241Matabeleland North 0 127 6 1 2 5 0 7 148Matabeleland South 0 100 5 0 6 6 1 7 125Masvingo Province 0 165 3 3 6 11 1 7 196Mashonaland West Province 0 166 4 1 2 6 1 12 192Totals 6 1412 43 12 34 67 7 61 1642
Rural health centres

68
Health clinic services
With this focus it then became important to create a physical definition for a rural health centre/clinic. A floor plan for an example facility can be found in Figure 3 (a real clinic in Masvingo Province); and this was used as the basis for creating the nominal physical definition. The clinic was then further defined as being in a rural and relatively remote site, not near a river or hills of any particular significance. It was assumed located off the Zimbabwe energy grid but benefiting from road access with a 50km distance to the nearest main highway where there was fuel access and also the national energy grid network.
The physical definition of the facility and the nature of the services it offers are important because they shape the loading requirements and subsequently the power demand. Based on the plan in Figure 3 it was assumed that the clinic offered the following services:
- Capacity of 8 beds
- Delivery suite
- Treatment of minor illnesses and injuries
- Small number of permanent staff
- Minor surgical procedures
- Immunization services
- Cold chain requirements for vaccines, blood and medical supplies
- On site basic lab and some simple diagnostic equipment
Electrical loading
Given the service requirements it then became possible to make assumptions regarding energy loading requirements and develop a maximum power demand. Outline requirements for the services were based on UNDP-GF programme experience, the example clinic layout and reference of USAID guidance6. This was also used to define the load requirements we expect to see in UNDP-GF supported rural health clinics. As such it can be expected that electric power is required for:
- General purpose and task lighting (e.g. to support minor surgical procedures)
- Maintaining the cold chain for vaccines, blood, and other medical supplies utilizing basic lab equipment (a centrifuge, haematology mixer, microscope, incubator, etc.)
- A pump load and UV water purification system for water provision
- External lighting
The power loading requirements of this equipment are defined in more detail in Table 2. This was then used to establish a 24 hour loading profile (Figure 4) which could then be used as a multiplier over the clinic service life.
5Personal communication Peter Ooko K’Aluoch UNOPS Zimbabwe 6USAID “Powering Health: Electrification options for rural health centres”
Figure 3. Example clinic Masvingo Province used as the basis for defining facility health service provision and subsequently energy loading5.
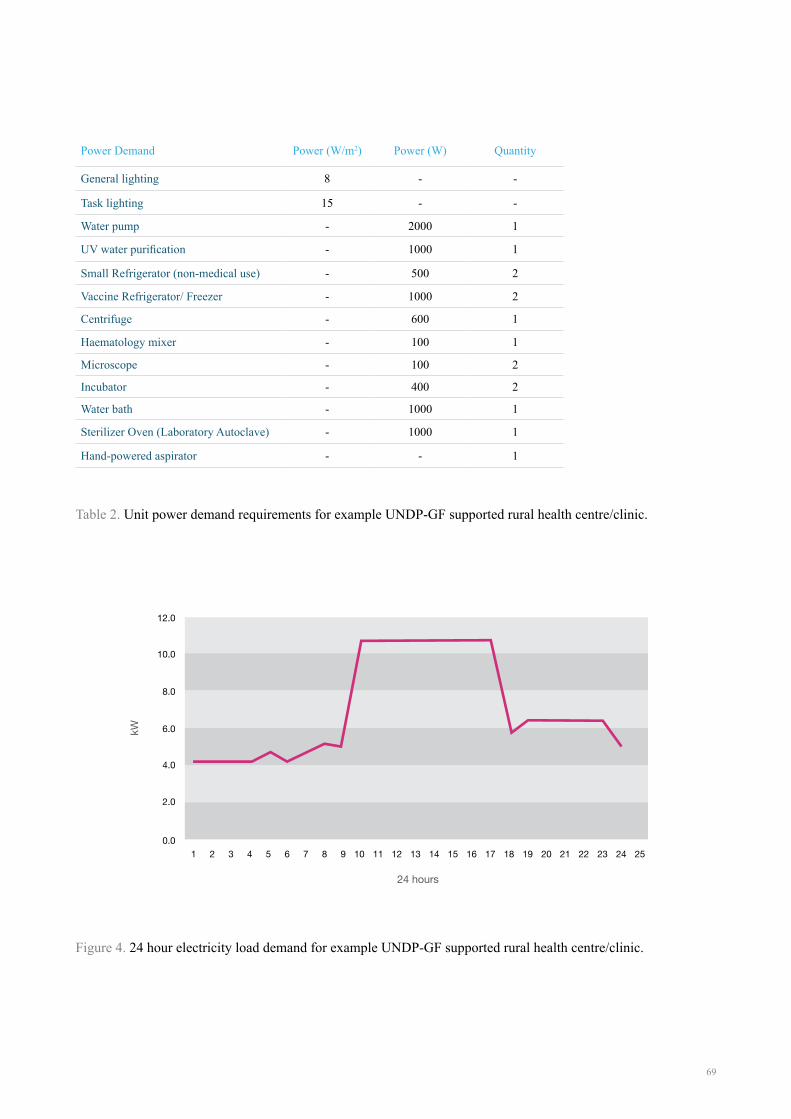
69
Table 2. Unit power demand requirements for example UNDP-GF supported rural health centre/clinic.
Figure 4. 24 hour electricity load demand for example UNDP-GF supported rural health centre/clinic.
Power Demand Power (W/m2) Power (W) Quantity
General lighting 8 - -
Task lighting 15 - -
Water pump - 2000 1
UV water purification - 1000 1
Small Refrigerator (non-medical use) - 500 2
Vaccine Refrigerator/ Freezer - 1000 2
Centrifuge - 600 1
Haematology mixer - 100 1
Microscope - 100 2
Incubator - 400 2
Water bath - 1000 1
Sterilizer Oven (Laboratory Autoclave) - 1000 1
Hand-powered aspirator - - 1
24 hours
kW
0.0
8.0
6.0
4.0
2.0
10.0
12.0
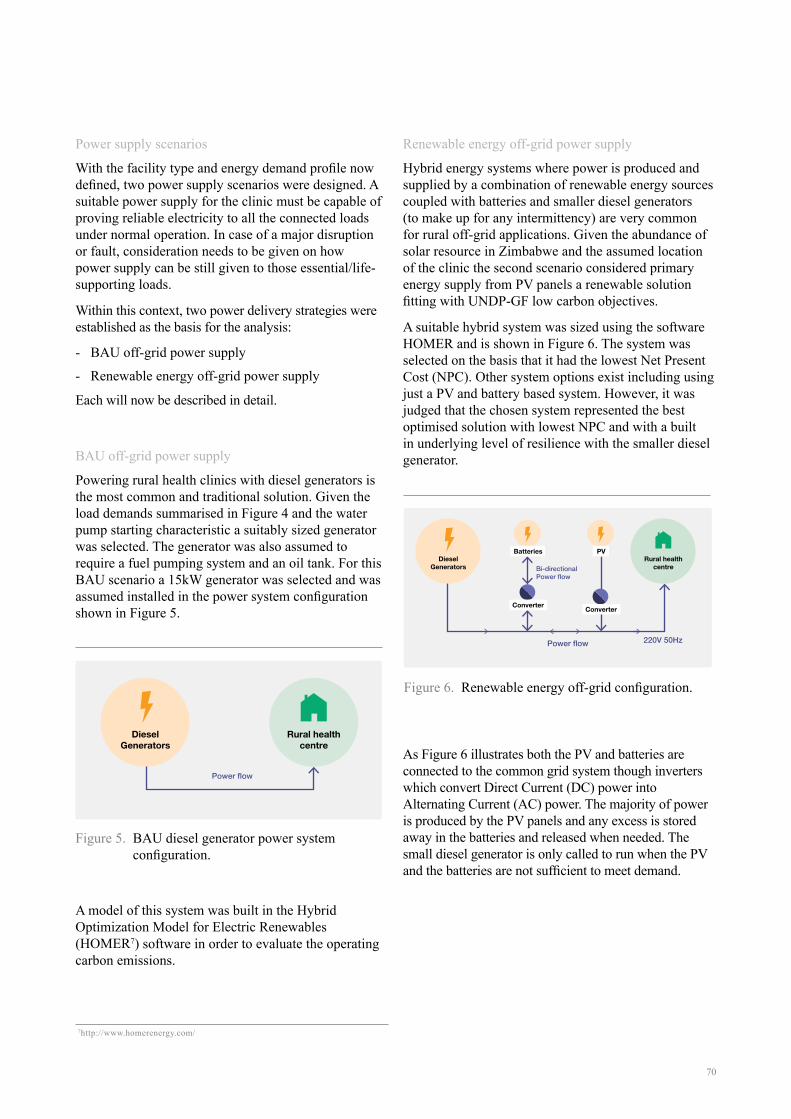
70
Power supply scenarios
With the facility type and energy demand profile now defined, two power supply scenarios were designed. A suitable power supply for the clinic must be capable of proving reliable electricity to all the connected loads under normal operation. In case of a major disruption or fault, consideration needs to be given on how power supply can be still given to those essential/life-supporting loads.
Within this context, two power delivery strategies were established as the basis for the analysis:
- BAU off-grid power supply
- Renewable energy off-grid power supply
Each will now be described in detail.
BAU off-grid power supply
Powering rural health clinics with diesel generators is the most common and traditional solution. Given the load demands summarised in Figure 4 and the water pump starting characteristic a suitably sized generator was selected. The generator was also assumed to require a fuel pumping system and an oil tank. For this BAU scenario a 15kW generator was selected and was assumed installed in the power system configuration shown in Figure 5.
A model of this system was built in the Hybrid Optimization Model for Electric Renewables (HOMER7) software in order to evaluate the operating carbon emissions.
Renewable energy off-grid power supply
Hybrid energy systems where power is produced and supplied by a combination of renewable energy sources coupled with batteries and smaller diesel generators (to make up for any intermittency) are very common for rural off-grid applications. Given the abundance of solar resource in Zimbabwe and the assumed location of the clinic the second scenario considered primary energy supply from PV panels a renewable solution fitting with UNDP-GF low carbon objectives.
A suitable hybrid system was sized using the software HOMER and is shown in Figure 6. The system was selected on the basis that it had the lowest Net Present Cost (NPC). Other system options exist including using just a PV and battery based system. However, it was judged that the chosen system represented the best optimised solution with lowest NPC and with a built in underlying level of resilience with the smaller diesel generator.
As Figure 6 illustrates both the PV and batteries are connected to the common grid system though inverters which convert Direct Current (DC) power into Alternating Current (AC) power. The majority of power is produced by the PV panels and any excess is stored away in the batteries and released when needed. The small diesel generator is only called to run when the PV and the batteries are not sufficient to meet demand.
Figure 5. BAU diesel generator power system configuration.
Figure 6. Renewable energy off-grid configuration.
7http://www.homerenergy.com/
Rural healthcentre
DieselGenerators
Power flow
Power flow
Bi-directional Power flow
220V 50Hz
Batteries
Converter Converter
PVDiesel
GeneratorsRural health
centre

71
Embodied carbon
For completeness the study also took account of the carbon footprint associated with the manufacture and production of the two energy systems; i.e. so called embodied carbon. This was undertaking by creating simplified life cycle assessment (LCA) models of each system (see Table 3). In this way the study could consider the full life cycle carbon footprint of both scenarios measuring the greenhouse gas emissions arising from both supply chain / manufacture, and their operation. Built into this aspect of the study were also the carbon emissions of maintaining both systems during operation.
Study findings
The embodied and operating carbon emission levels determined for each scenario are shown in Table 4. This data is further summarised through Figure 7 and Figure 8 both presenting the comparison of two scenarios over an operational life span of 30 years.
The main findings of this study can be summarised as follows:
1. The greenhouse gas emissions and associated carbon footprint (including both embodied and operating values) of the BAU scenario are much
higher (around 6.5 times) than the ones of the renewable energy scenario.
2. The embodied carbon in the components for the renewable energy scenario is higher than the one associated with the BAU diesel generator system (around 40 times); but the magnitude of embodied emissions for both systems is small compared with their operational footprint.
3. This means the carbon payback time for the renewable energy scenario is less than one year.
4. The carbon emissions associated with the renewables hybrid system in operation come from periodic use of its back up diesel generator and routine maintenance.
5. There is likely an opportunity to reduce the carbon emissions of both systems subject to more precise sizing of components and their optimisation to reflect more specific scenarios.
6. The emissions associated with fuel transportation are not factored. Similarly the emissions associated with the decommissioning are not included. When included, this is likely to increase the overall emissions from the two scenarios and possibly increase the division between the two even further.
If there are 1400 rural health centres/clinics in Zimbabwe and we assume 50% are currently off grid
Table 3. Embodied carbon in energy system components.
Table 4. Comparison of total embodied and operating carbon for the two scenarios over 30 years.
Description (Manufacturer) No Total kg CO2
Inverter (SMA) 2 453
Battery (Hoppecke Vented lead acid) 24 30,028
PV Panel (Sanyo HIT-N240SE10) 231 609
Diesel generator 1 8,312
BAU Renewable off-grid
Embodied (tonnes kg CO2) 5 89
Operating (tonnes kg CO2) 2025 224

72
Figure 7. Annual carbon emission comparison between two scenarios. The up-front embodied carbon emissions are much greater for the renewables approach, but very quickly this carbon pays back due to the operational emissions arising from generator use in the BAU scenario.
Figure 8. Cumulative carbon emissions over a 30 year operational period demonstrating the savings of the renewables solution over BAU.
Cum
ulat
ive
carb
on e
mis
sion
s (to
nnes
CO
2)
Year
0
1000
500
1500
2000
2500
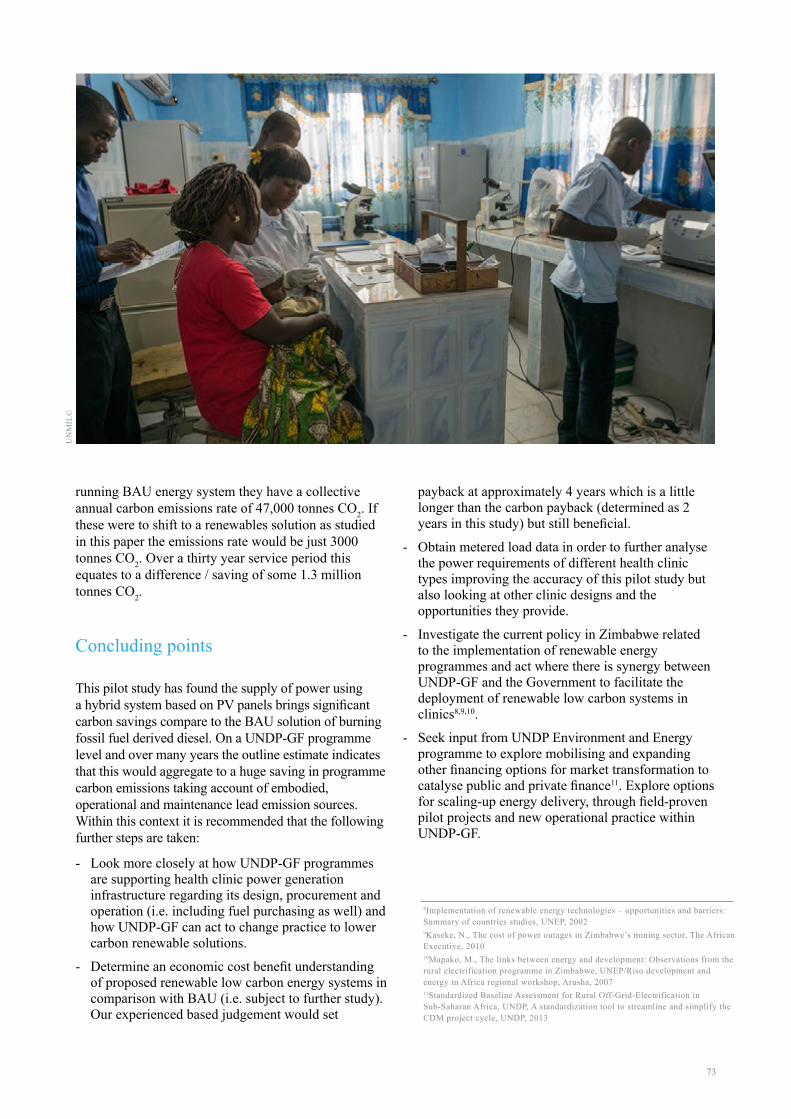
73
running BAU energy system they have a collective annual carbon emissions rate of 47,000 tonnes CO2. If these were to shift to a renewables solution as studied in this paper the emissions rate would be just 3000 tonnes CO2. Over a thirty year service period this equates to a difference / saving of some 1.3 million tonnes CO2.
Concluding points
This pilot study has found the supply of power using a hybrid system based on PV panels brings significant carbon savings compare to the BAU solution of burning fossil fuel derived diesel. On a UNDP-GF programme level and over many years the outline estimate indicates that this would aggregate to a huge saving in programme carbon emissions taking account of embodied, operational and maintenance lead emission sources. Within this context it is recommended that the following further steps are taken:
- Look more closely at how UNDP-GF programmes are supporting health clinic power generation infrastructure regarding its design, procurement and operation (i.e. including fuel purchasing as well) and how UNDP-GF can act to change practice to lower carbon renewable solutions.
- Determine an economic cost benefit understanding of proposed renewable low carbon energy systems in comparison with BAU (i.e. subject to further study). Our experienced based judgement would set
payback at approximately 4 years which is a little longer than the carbon payback (determined as 2 years in this study) but still beneficial.
- Obtain metered load data in order to further analyse the power requirements of different health clinic types improving the accuracy of this pilot study but also looking at other clinic designs and the opportunities they provide.
- Investigate the current policy in Zimbabwe related to the implementation of renewable energy programmes and act where there is synergy between UNDP-GF and the Government to facilitate the deployment of renewable low carbon systems in clinics8,9,10.
- Seek input from UNDP Environment and Energy programme to explore mobilising and expanding other financing options for market transformation to catalyse public and private finance11. Explore options for scaling-up energy delivery, through field-proven pilot projects and new operational practice within UNDP-GF.
8Implementation of renewable energy technologies – opportunities and barriers: Summary of countries studies, UNEP, 20029Kaseke, N., The cost of power outages in Zimbabwe’s mining sector, The African Executive, 2010 10Mapako, M., The links between energy and development: Observations from the rural electrification programme in Zimbabwe, UNEP/Riso development and energy in Africa regional workshop, Arusha, 200711Standardized Baseline Assessment for Rural Off-Grid-Electrification in Sub-Saharan Africa, UNDP, A standardization tool to streamline and simplify the CDM project cycle, UNDP, 2013
UN
MIL
©

74
For further information please contact:
Dr. Christoph Hamelmann Regional Practice Leader HIV, Health and Development
UNDP Regional Centre, Europe and the CIS
Dr. Kristian Steele Senior Analyst
Advanced Technology & Research Arup
DisclaimerThe content, analysis, opinions and policy recommendations contained in this publication do not necessarily reflect the views of the United Nations Development Programme