Embed Size (px)
Citation preview

Maximizing the economic welfare extracted from
the energy system is a key priority for all
governments. This can be measured by a country’s
energy productivity. Perhaps nowhere else in the
world is this issue more salient than in China.
China is the world’s largest energy consumer and
has led global economic growth in the first part
of the twenty-first century. Furthermore, in the
interconnected world we live in, decisions in China
have global impacts. In periods of some of its fastest
growth (from 2002-2005) China experienced
declining energy productivity. In 2006, China put in
place ambitious energy intensity targets. Combined
with policies at the sector and product level, these
contributed to China reversing its falling energy
productivity. Building on this success, China’s 12th
Five Year Plan, extended and deepened these
reforms. But within China’s system of provincial
and industrial energy intensity targets there is a blind
spot which could reduce the potential welfare gain
from these plans. Assessing the embodied energy in
interprovincial trade reveals these potential gains
and provides the information required to encourage
regional practices to align better with national
objectives. The response from Chinese policymakers
to the challenges of building new infrastructure
while managing resource and environmental
constraints provides a valuable lesson for
governments in rapidly developing countries, such as
Saudi Arabia. A summary of key lessons from the
Chinese experience of managing energy productivity
is presented in the conclusion.
Managing China’s energy productivity potential: what are the lessons for policy makers?
Nicholas Howarth, Min JIN, Leo Lester, Yan XIA
Summary
October 2014 KS-1409-DP03A

2
Managing China’s energy productivity potential
About KAPSARC
The King Abdullah Petroleum Studies and Research Center (KAPSARC) is an independent, non-profit
research institution dedicated to researching energy economics, policy, technology, and the environment across
all types of energy. KAPSARC’s mandate is to advance the understanding of energy challenges and
opportunities facing the world today and tomorrow, through unbiased, independent, and high-caliber research
for the benefit of society. KAPSARC is located in Riyadh, Saudi Arabia.
Legal notice
© Copyright 2014 King Abdullah Petroleum Studies and Research Center (KAPSARC). No portion of this
document may be reproduced or utilized without the proper attribution to KAPSARC.

3
Managing China’s energy productivity potential
Introduction
With low and declining energy productivity, Saudi
Arabia is currently facing a set of energy policy
challenges very similar to those that China has been
navigating over the last couple of decades.
China’s energy policy trilemma, how to balance the
competing needs of economic development, security
of energy supply, and the curtailment of carbon
emissions, is as acute as it is for any country (WEC,
2012). Already the world’s second largest economy,
much of China’s population remains poor and it still
sees itself as a developing country. The burgeoning
economy has driven up energy demand and raised
oil import levels to over 50% of total oil
consumption (Xu, 2013), fueling concerns over
energy security. Domestic energy consumption is
primarily coal, and this contributes to China being
the world’s largest emitter of greenhouse gases,
responsible for 24% of global CO2 emissions.
Moreover, as air quality deteriorates and health
concerns magnify, China is increasingly seeking to
control pollution.
One response to the trilemma lies in improving
energy efficiency. Much has been written on the
topic and China has not always been compared
favorably to other countries. It has been labelled nine
times less efficient than Japan and five times less
than Europe (Wang, 2013). Yet its track record of
improving efficiency over the last thirty years, albeit
starting from a low base, is impressive. In contrast to
the global average of 1.2% per year between 1980
and 2000, and 0.5% between 2000 and 2010 (IEA,
2012), China reduced its energy intensity by an
average of 4% each year (See Figure 1).
China’s geographic and developmental diversity
make further improvements in energy efficiency
challenging. National statistics tell only half the
story; analyses and policies based solely on such
statistics will miss the provincial and inter-provincial
complexities which offer the country both great
challenges and enormous opportunities in furthering
its efficiency agenda. This paper provides a detailed
look behind the national picture, to explore not just
the provincial story, but the connections between the
provinces. As part of the effort to further enhance
China’s energy productivity potential, this gives
policy makers new insight into how to foster
greater cooperation among provinces to achieve
national priorities. This may also provide insight for
policymakers in other regions.
Chinese energy productivity in context
In 2006, China attracted international attention with
its 11th Five Year Plan (FYP) by committing to an
aggressive target to lower its national energy
intensity by 20% by 2010, relative to 2005 levels.
This policy was particularly noteworthy as it was
made in response to rising energy intensity (2002-
2005), the first time this had happened since China’s
opening up in the 1980s (see Figure 1).
This period of rising declining productivity, or as
generally referred to by policymakers, rising energy
intensity, has been well studied (NDRC, 2004a;
Kahrl and Roland-Holst, 2008; Guan et al., 2009;
Yuxiang and Chen, 2010) and won’t be discussed in
detail here.
The response from China’s central government to
this rising energy intensity was a significant policy-
driven transformation. Starting from November
2004, the National Reform and Development
Commission (NDRC) passed the Medium and Long
Term Energy Conservation Plan (NDRC, 2004b)
setting out detailed energy conservation targets and
identifying Ten Key Energy Savings Projects, which
were subsequently incorporated into China’s 11th
FYI as important industrial energy intensity
reduction measures (NDRC, 2006).

4
Managing China’s energy productivity potential
The State Council set out a comprehensive set of
energy intensity targets for key industrial processes
(Table 1) and energy performance standards for
industrial products and equipment, through the
Identified Energy Efficient Product List (IEEPL).
Table 1 shows performance and targets for material
efficiencies in key industrial process. As the
industrial sector comprises 70% of energy
consumption in China, these policies were closely
tied to driving down energy intensity from 2005
onwards.
The Top 1000 program targeted the largest energy
consuming enterprises across nine sectors. The
threshold for inclusion was an annual consumption
of a minimum of 180,000 tons of coal equivalent
(tce) of energy. Combined, these enterprises
accounted for one third of China’s total energy use
and almost half of industrial energy use in 2004
(NDRC, 2006). The program required enterprises to
conduct mandatory energy audits and develop
energy savings plans to be reviewed against a set of
criteria specified by the NDRC. Ji Xie (2010)
estimated the energy saved by the program between
2006 and 2009 was equal to 136 million tce. Official
estimates suggested it was closer to 150 million tce,
with total carbon dioxide savings of almost
400 million tons (NDRC, 2011). To encourage
implementation, success at achieving the energy
savings targets was tied directly to government
officials’ annual job evaluations (State-Council,
2007).
In June 2004, the NDRC established a market-based
policy of differential electricity pricing for high
energy consuming industries where prices were
set based on the energy intensity level of each
enterprise (Price et al., 2008). Enterprises were
grouped into one of four categories “encouraged”,
“permitted”, “restricted” and “eliminated”. The first
two categories paid the normal price for electricity in
their area, while the latter two paid a premium of
Figure 1: Evolution of Chinese energy productivity and intensity, key policies and events

5
Managing China’s energy productivity potential
RMB0.05 and RMB0.20 per kWh respectively.
These charges have been increased in an effort to
force inefficient plants to close and, in 2007, the
policy was adjusted to allow provincial authorities to
retain revenue from the extra charges to provide
stronger incentives for the measure’s implementation
(NDRC, 2007b; Taylor et al., 2010).
In 2007, the State Council again took action to phase
out inefficient enterprises with the Small Plant
Closures and Phasing Out Outdated Production
Capacity program which was accompanied by a
complete list of closure thresholds (MIIT, 2010). As
part of the program, the Ministry of Finance
provided some compensation to eligible enterprises
(MOF, 2011). It was further extended in the 12th
FYP.
In February 2011, China announced that it had met
the 11th FYP’s 20% target with a final reported
reduction of 19.1% (MIIT, 2011). Despite this,
overall energy consumption had grown much faster
than planned. The 11th FYP assumed a 2010
primary energy consumption target of 2.7 billion tce:
a 4% average annual growth in energy consumption
(NDRC, 2007a). Actual 2010 energy consumption
reached 3.2 billion tce, an average annual growth of
6.6% (CCIN, 2013). The intensity target was able to
be met due to greater than expected economic
growth.
Informed by the experience of the successful 11th
FYP, the 12th FYP contained even more stringent
and focused targets (see Figure 2). The 2015 energy
consumption target of 4 billion tce assumes average
GDP growth of around 8%. This is a planned
reduction of 16% in energy intensity from 2010
levels by 2015. This will bring the total estimated
reduction under the 11th and 12th FYPs (2006-2015)
to 32% below 2005 levels (PRCSC, 2012). It also
supports the closely related target of reducing carbon
intensity (carbon emissions per unit of GDP) by 17%
below 2010 levels by the end of 2015 and 40-45%
below 2005 levels by 2020 (State-Council, 2009).
Table 1: Industrial sector energy intensity targets under the 11th FYP Source: State Council (2006)
units 2000 Actual
2005 Actual
2010 Target
2020 Target
Coal-fired power Kgce/kwh 392 377 360 320
Steel Kgce/t 906 760 730 700
10 kinds of non-ferrous metals tce/t 4.8 4.7 4.6 4.5
Aluminum tce/t 9.9 9.6 9.5 9.2
Copper tce/t 4.7 4.4 4.3 4.0
Refining Kgoe/t.factor 14 13 12 10
Ethene Kgce/t 848 700 650 600
Ammonia production Kgce/t 1372 1210 1140 1000
Caustic soda Kgce/t 1553 1503 1400 1300
Cement Kgce/t 181 159 148 129
Plate glass Kgce/box 30 26 24 20
Building Ceramics Kgce/m2 10.0 9.9 9.2 7.2
Railway transportation tce/1MtKmeq. 10.4 9.7 9.4 9.0

6
Managing China’s energy productivity potential
As part of this, industrial energy intensity is to be
reduced by 21% relative to 2010 by the end of 2015.
It is expected that this will deliver an estimated total
energy saving of around 67 million tce. Specific
targets for the main industrial sectors and products
have also been released, though these will be
difficult to assess because of the lack of official
baseline data for 2010. In Table 2 we show the
latest available data, which is for 2007, to put these
targets in context (MIIT, 2012).
The 12th FYP put forward a set of differentiated
provincial targets in recognition of China’s
unbalanced economic development. The developed
coastal regions with relatively modern infrastructure
have more stringent energy intensity reduction
targets (lightly shaded provinces in Figure 2) while
the less developed interior (darkly shaded provinces)
have less challenging targets. All provinces
experienced declining energy intensity between 2005
-2010 (with the gradated bars moving from left to
right). The solid markers in Figure 2 represent each
province’s energy intensity target under the 12th
FYP.
The 11th FYP’s 20% energy intensity reduction
target was not met uniformly across all the
provinces. Figure 2 shows provincial reductions
varied between 33% and 6%. Guangdong and
Shanghai, both developed areas, only managed to
Figure 2: Change in Energy Intensity improves for all provinces over 11th FYP (2005-2010) shown by the gradated bar moving from left (2005) to right (2010). 12th FYP targets for 2015 with 2010 as base year are shown by the solid black mark. The shaded map shows the energy intensity targets in the 12th FYP. Source: State Council (2012); MIIT (2011) KAPSARC analysis

7
Managing China’s energy productivity potential
reduce their energy intensity during the 11th FYP
period by around 6%; their target for the 12th FYP is
18% relative to 2010. In contrast, Beijing improved
its performance by over 20% by 2010 and must find
a further 17% before 2015. The interplay between
the provinces discussed in section three can help
explain how these future targets will be achieved in
significant part via embodied energy imports from
other provinces.
For example, as Beijing has reduced its energy
intensity, it has become more and more reliant on
other provinces for the goods and energy it needs to
supply its local economy. Hebei province, straddled
with a reputation for bad pollution, provides Beijing
with 30% of its imports of embodied energy and is
one of the biggest net exporters of embodied energy.
It is a major center for the steel industry and, at least
partly as a result, has one of the highest provincial
energy intensity scores. The question for policy
makers is whether or not Beijing has become cleaner
at Hebei’s expense. Moreover, given Hebei’s low
energy efficiency, has this actually worsened the
national average? Similar questions can be asked of
Guangdong, Shanghai, and all the developed, energy
importing regions. This problem has been discussed
in an international context before (Hayashi and
Krey, 2006; Zhou et al, 2013; Neiderberger and
Spalding-Fecher, 2006); its investigation within
China is long overdue.
An alternative way of framing these policy goals is
to shift the focus from controlling or reducing
energy intensity (unit of energy over unit of GDP) to
boosting energy productivity (the inverse). Energy
productivity places a premium on increasing the
economic and social benefit of fuel use and in this
way can better align energy efficiency targets to the
overall agenda of sustainable GDP growth. This
shift has been adopted elsewhere including in the
United States and Germany, and is under
consideration or being actively discussed in other
countries (ASE, 2013; FRG, 2013; AASE, 2014;
KAPSARC, 2014).
General industrial EI target 12th FYP: Industrial Energy Intensity to reduced by 21% relative to 2010 by 2015
Sub-sectors
2007 Energy
consumption
million tce*
2007
IVA
Bn RMB*
2007 Energy
intensity*
2015 targeted
reduction
Smelting and pressing of ferrous metal 47,774 9,007 5.30 18%
Smelting and pressing of non-ferrous metal 10,686 4,478 2.39 18%
Processing of petroleum, coking, processing of nuclear fuel 13,177 3,097 4.25 18%
Manufacture of raw chemical materials and chemical
products 27,245 7,340 3.71 20%
Manufacture of non-metallic mineral products 20,355 4,849 4.20 20%
Manufacture of machinery 8,207 22,366 0.37 22%
Light industry 20,560 30,001 0.69 20%
Manufacture of textiles 6,208 4,9142 1.26 20%
Manufacture of electronic equipment 2,007 7,925 0.25 18%
Table 2: Industrial sector energy intensity targets under the 12 FYP Source: MIIT (2012) * Industrial Value Added (IVA) measures the net economic contribution of each industrial sub-sector. Official sub-sector level data have not been released for 2004 or for 2008 onwards. The absence of a 2010 baseline makes sub-sector energy intensity targets difficult to evaluate.

8
Managing China’s energy productivity potential
Yet an important consideration is missing from
this standard picture of energy targets and trends.
A significant amount of energy originates and flows
between regions in the goods that are traded between
provinces, the embodied energy in trade. If steel or
cement used in Guangdong was produced in Yunnan
then the energy that went into producing that steel is
typically attributed to Yunnan. Perhaps a better way
of accounting for this energy is to attribute it to the
province in which the steel or cement itself is
consumed, in this case Guangdong, at the source of
demand, rather than that of supply.
If the overall national target of a 16% reduction in
energy intensity over the life of the 12th FYP is to be
met in the most effective way, considering the
embodied energy flowing through supply chains
between provinces can be of value to policymakers.
This can also help inform target setting in a way that
prevents “energy outsourcing” and compliance
leakage. Most crucially, it also offers policy makers
the insight required to improve the energy efficiency
of interprovincial supply chains.
Embodied Energy in Interregional trade
Method and background to the analysis
For China, consistent with international convention,
the concept of ‘embodied energy’ was defined by the
International Federation of Institutes for Advanced
Study as the total energy consumption, both direct
and indirect, in the life cycle of a product or service
(Chen, 2009). Most attention, however, has been
given to examining the embodied carbon in China’s
net exports in the context of the “carbon-
outsourcing” hypothesis. This posits that advanced
economies have achieved significant emission
reductions by importing high-carbon energy
intensive industrial goods from the developing world
(mainly China), while shifting to produce higher
value-added and lower GHG emitting services in
their own economies (Davis and Caldeira, 2010; Su
and Ang, 2011; IPCC, 2014).
Less attention has been given explicitly to embodied
energy, though this is a key part of such carbon-
based analysis, and less still has been given to
looking at embodied energy flows between regions
and regional sectors within a country, as distinct
from simply between countries. In focusing on this
in our analysis we aim to fill an important
knowledge gap and to provide one of the most
detailed expositions of such flows in China. This
information is of immediate relevance for economic
planners in China looking to better understand the
energy system, and coupled with information on
provincial energy intensity performance and targets,
highlights opportunities for potential cost-effective
mitigation options. Though we exclude international
exports and imports from our analysis, it also has a
high degree of international significance for those
seeking to better understand the regional
heterogeneity of the country and challenges faced by
China in increasing energy productivity.
In our analysis we have developed a multi-regional
input-output model for the embodied energy in trade
between 30 provinces. This is based on provincial
input - output tables for China for 2007, which is the
most recent year for which complete data exists
(China Energy Statistical Year Books, 2008 and
2013). We also calculate energy consumption data
for 30 sectors based on the energy balance tables for
each province and use this to derive the
interprovincial embodied energy flows between the
sectors across provinces.
The fundamental information used in such analysis
are the flows of products from each industrial sector,
considered as a producer, to each of the other sectors
considered as consuming sectors. This produces an
intra-provincial matrix for a given province where
the distribution of output through different sectors of
the province is given along the rows, and the
composition of inputs required by different sectors is
given by the columns. Multi-regional input-output
models extend the single region model by reflecting
9
Managing China’s energy productivity potential
inter-regional trade in goods and services. The
corresponding resource and environmental impacts
resulting from consumption activities in one region
can thus be traced to specific production sectors in
other regions through the interregional supply chain
(Leontief, 1986).
We focus on the interprovincial trade between each
regional grouping, excluding the trade flows which
move from each province to the international export
sector. In this closed system, defined by each
region’s input-output data, the sum of total
embodied exports between regions equals the sum of
total embodied imports. An important topic for
future research, yet to be attempted, would be to
extend this analysis to account for the embodied
energy flows from each province to the international
export market, to provide an even more
comprehensive picture of provincial embodied
energy flows.
In our analysis embodied energy is attributed to the
first point of consumption, rather than the final
point. This means that where energy is used to
produce steel in region 1, which is then exported to
region 2 to produce a car before the car is exported
to region 3, the embodied energy from the steel
production is attributed to region 2, and the
embodied energy from the car’s manufacture to
region 3. This attribution of embodied energy to the
first point of consumption, may be seen to understate
the embodied energy consumption of region 3, and
overstate that of region 2. However, this is the
typical convention for this type of analysis and the
method which we have followed in our paper. A
more detailed and formal description of our
methodology and data is available on request.
Results
For ease of illustration, we have aggregated our
results into eight regional groups: the North East,
which comprises Heilongjaing, Jilin and Liaoning;
the Northern Municipalities (Beijing and Tianjin);
the North Coast (Hebei and Shandong); the East
Coast, comprising Shanghai, Jiangsu and Zhejiang;
the South Coast (Guangdong, Fujian and Hainan);
the Central Regions (Shanxi, Henan, Hubei, Hunan,
Anhui and Jiangxi); the North West (Inner
Mongolia, Shaanxi, Ningxia, Gansu and Xinjiang);
and the South West, which comprises Sichuan,
Chongqing, Yunnan, Guizhou, Guangxi and Qinghai
(Figure 3). Each region has a different shade on the
grayscale. A more detailed provincial picture is
provided in the Appendix to this paper. (Figure A1).
There are three key trading blocks. The Central
Region is the main embodied energy exporter, with
significant flows to the East and North Coasts, while
the Southwest Region is the main supplier of
embodied energy to the South Coast provinces. A
smaller trading block exists in the north between the
interior Northwest Region and the Northern
Municipalities and Northeast. These distinct
groupings reflect the regional characterization of
internal trade within China, due to the limited
transport infrastructure linking the country,
combined with the distances involved.
The most significant sectors which have a high
volume of embodied energy in traded goods are the
electricity, steel smelting and the coal mining sectors
(see Figure 4). These sectors have a strong degree of
interrelationship, but are separated out according to
the Chinese statistical yearbooks.
Several clear regional and sectoral patterns emerge.
The more industrialized East Coast and South Coast
provinces and the Northern Municipalities are the
main embodied energy importers, while the less
industrialized Central and two western regions are
the main embodied energy exporters.
Embodied energy in the steel smelting sector
includes the energy embodied in physical steel
imports and exports between provinces as well as

10
Managing China’s energy productivity potential
Figure 3: Flows of embodied energy between regions in China (2007, million tce) Sources: Chinese Statistical Year Book and Chinese Energy Statistical Year Book (years 2008 and 2013) Chinese Academy of Sciences-KAPSARC Analysis. Bands touching the edge of the circular diagram, denote the origin of the embodied energy flow (exports); conversely, where a band finishes at a non-connected section of the internal circular boundary, it denotes embodied energy flows into that region (imports). The outer circle denotes the percentage share of embodied imports and exports for each region. Width of the bands indicates volume of flows which is indicated in million tce on the inner circle adjacent to the bands.

11
Managing China’s energy productivity potential
any goods which include steel such as automobiles,
ships, construction, electrical appliances and other
machinery made of steel which was manufactured in
one region and consumed in another region.
For example, Zhejiang is one of the top importers of
embodied energy from steel smelting activities. The
three main provinces it imports from are Jiangsu,
Hebei, and Henan. Zhejiang is a major manufacturer
of automobiles and machinery in China. The
embodied energy represented in these sectoral flows
describes the energy that went into the production of
the steel imported from these other provinces that is
then used in Zhejiang to produce goods. This data
describes only bilateral trade. If the car which was
built in Zhejiang is bought by a consumer in
Shanghai or Guangdong, the embodied energy from
steel smelting is only attributed to Zhejiang.
The energy that is expended within Zhejiang to
produce the cars, be it indigenous steel smelting in
Zhejiang, electricity in the manufacturing process or
chemicals used to produce plastic components, is
associated with the car when it is exported to another
province. In our example above, this would mean
that the embodied energy associated with the car
would flow from Zhejiang to Guangdong, but this
would not include the embodied energy from steel
smelting that Zhejiang imported from Jiangsu.
Figure 4: Sector breakdown of embodied energy imports and exports by province (2007, million tce) Sources: Chinese Statistical Year Book and Chinese Energy Statistical Year Book (years 2008 and 2013) Chinese Academy of Sciences-KAPSARC Analysis. This Figure shows the main energy consuming sectors, the top six of which together comprise around 80% of the total embodied energy flows between provinces. These sectors are: electricity and gas provision, iron smelting, petroleum processing, chemical processing, coal mining and transport. The remaining sectors (other mining, other heavy industry, light industry, agriculture and services) we group into the category ‘other’.

12
Managing China’s energy productivity potential
To give another example, take embodied energy
from the coal mining sector. This includes the
energy that was used to extract, wash, grade and
process coal (as well as a small amount of peat)
which is associated with exports and imports of that
coal to and from another province. For example,
Hebei is the largest exporter of embodied energy
from coal mining. This coal is mainly exported to
Zhejiang, Jiangsu, Shanghai, Tianjin, and Beijing.
In these provinces, the coal can then be used to
manufacture steel or produce electricity.
The embodied energy in the trade of electricity is a
little different, as it includes both the energy of the
electricity being traded and the energy that went into
the production of the electricity. This is different to
the trade in coal where only the direct and indirect
energy that went into the mining and processing of
that commodity is included, and the energy value of
the coal itself is not attributed as embodied energy.
The effect of accounting for embodied energy on provincial energy intensity targets
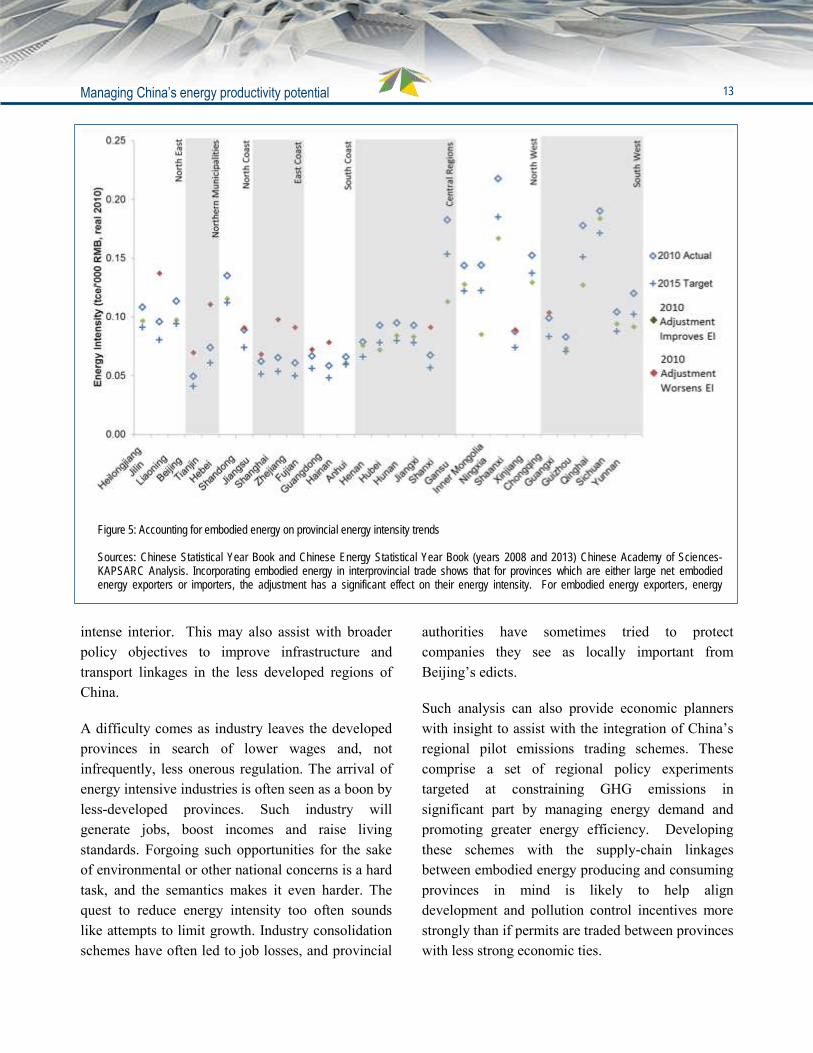
In our final piece of analysis we take the net
embodied energy flows from each province and use
it to adjust the official energy consumption data for
2010 to calculate a measure of energy intensity
which includes embodied energy in trade (Figure 5).
Because the latest comprehensive data on
interprovincial embodied energy in trade can only be
calculated for 2007, we have applied these flows to
the 2010 energy consumption data. While clearly
this is a limitation, it still provides a good sense of
the direction and magnitude of the adjustment to
each province’s energy intensity performance if
embodied energy were taken into account. The next
release of comprehensive provincial input-output
tables will be for the year 2012; at the time of
writing, these had yet to be published. Once the 2012
data are released they will provide an important
update to this analysis.
On the South Coast, the energy intensity of
Guangdong and Zhejiang moves up from around
0.06 tons per 1000 RMB in both to around 0.08 and
0.09 tons per 1000 RMB, or an increase of around
34% and 50% respectively. Conversely, in Shanxi
energy intensity falls from 0.18 to 0.11 tce per
1000RMB or around 38%. This outcome of falling
adjusted energy intensity is replicated across the
Central Region and reflected in rising adjusted
energy intensity in the East Coast and North Coast
regions.
Large falls in adjusted energy intensity are also
exhibited in the North West regions of Ningxia
(23%) and Inner Mongolia (41%); with
corresponding rises in energy intensity in the
Northern Municipalities of Beijing (41%) and
Tianjin (50%).
In the South West and South Coast regions, large
falls in adjusted energy intensity are exhibited by
Guizhou (28%) and Yunnan (24%), whereas
significant increases in adjusted energy intensity are
reflected in Guangdong (34%).
It is clear that accounting for the embodied energy in
interprovincial trade is of significant consequence
for the interpretation of China’s energy intensity
targets. In many cases, provinces which are
‘performing well’ are revealed to be sourcing
significant energy intensive inputs from the
provinces which are ‘performing badly’ in terms of
energy intensity levels. Greater awareness among
policy makers at both the provincial and national
levels of these linkages could lead to improved
coordination between provinces, especially those
that are closely linked. This could help encourage
improved cooperation between provinces in the
pursuit of national energy policy priorities. For
example, by highlighting the supply chain linkages
in this way, investment from the more developed
industrial and efficient coastal areas could be
encouraged towards the less developed energy
13
Managing China’s energy productivity potential
intense interior. This may also assist with broader
policy objectives to improve infrastructure and
transport linkages in the less developed regions of
China.
A difficulty comes as industry leaves the developed
provinces in search of lower wages and, not
infrequently, less onerous regulation. The arrival of
energy intensive industries is often seen as a boon by
less-developed provinces. Such industry will
generate jobs, boost incomes and raise living
standards. Forgoing such opportunities for the sake
of environmental or other national concerns is a hard
task, and the semantics makes it even harder. The
quest to reduce energy intensity too often sounds
like attempts to limit growth. Industry consolidation
schemes have often led to job losses, and provincial
authorities have sometimes tried to protect
companies they see as locally important from
Beijing’s edicts.
Such analysis can also provide economic planners
with insight to assist with the integration of China’s
regional pilot emissions trading schemes. These
comprise a set of regional policy experiments
targeted at constraining GHG emissions in
significant part by managing energy demand and
promoting greater energy efficiency. Developing
these schemes with the supply-chain linkages
between embodied energy producing and consuming
provinces in mind is likely to help align
development and pollution control incentives more
strongly than if permits are traded between provinces
with less strong economic ties.
Figure 5: Accounting for embodied energy on provincial energy intensity trends Sources: Chinese Statistical Year Book and Chinese Energy Statistical Year Book (years 2008 and 2013) Chinese Academy of Sciences-KAPSARC Analysis. Incorporating embodied energy in interprovincial trade shows that for provinces which are either large net embodied energy exporters or importers, the adjustment has a significant effect on their energy intensity. For embodied energy exporters, energy

14
Managing China’s energy productivity potential
Conclusions
China’s experience managing the energy
productivity of its economy over the last few
decades provides a useful example to other rapidly
developing countries, including Saudi Arabia. The
process of building new infrastructure (the houses
for people to live in, commercial buildings and
industrial facilities, the ports, utility and transport
networks) consumes a massive amount of energy
and locks in years of future energy use
commitments. Yet these are integral to the process
of nation building, and central to the goal of lifting
standards of living. This paper has described how
some of these issues have been managed through the
policy frame of energy productivity, or in the
language of Chinese policymakers, energy intensity.
The Saudi Arabian Minister for Petroleum, Dr Ali Al
-Naimi, has spoken of the need to reduce wasted
energy resources and increase value in the economy,
noting that it takes more than double the world
average amount of energy to generate $1000 of GDP
in the Kingdom. Indeed the Middle East as a region
is one of the few places in the world where energy
productivity is declining each year. Without a
concerted effort, it will be difficult for the region to
increase the value it derives from its energy
resources. Learning from the experience of other
countries can therefore improve policy outcomes in
the region.
Western countries may lead in the field of energy
productivity, but for developing countries they may
not hold all the answers. This paper looks East, to
one of Saudi Arabia’s most rapidly growing trading
partners, and to China, to investigate what lessons
can be learned for improving the management of the
Kingdom’s energy productivity.
In conclusion we draw out the main policy lessons
in the following points:
As shown by its period of falling energy
productivity (2002-2005), rising energy
productivity in China was not an inevitable
process of its economic development. It required
ambitious and often difficult economic reforms.
Reforms to enhance the energy productivity of
the Chinese economy were taken in a step by step
fashion. The energy intensity targets and actions
described in detail in this paper are largely from
the 12th FYP which was informed significantly
by the 11th FYP, which was informed by past
experiences. Thus, decision makers should be
skeptical of silver bullet solutions taken from
other jurisdictions. An evolutionary approach to
policy making may be required. An oft quoted
phrase of Deng Xiaoping is ‘crossing the river by
feeling the stones’.
International as well as interprovincial trade has
played an important role in the evolution of
Chinese energy productivity. The energy
embodied in trade is an important consideration
in accurately understanding and managing energy
productivity in any region or country. In practice,
it tends to be overlooked, hiding potential gains
that could be made from cooperation with major
trading partners.
Using energy productivity, rather than energy
intensity, as the organizing concept to manage
energy efficiency in the economy, offers several
advantages. It is increasingly being used by
advanced economies, such as the United
Statesand Germany, and is actively under
discussion in other nations.
Energy productivity offers a new way forward to
better align the often competing agendas which
are found in national and international energy and
climate debates.

15
Managing China’s energy productivity potential
Figure A1: Flows of embodied energy between provinces in China (2007, million tce) Sources: Chinese Statistical Year Book and Chinese Energy Statistical Year Book (years 2008 and 2013) Chinese Academy of Sciences-KAPSARC Analysis. Bands touching the edge of the circular diagram, denote the origin of the embodied energy flow (exports); conversely, where a band finishes at a non-connected section of the internal circular boundary, it denotes embodied energy flows into that region (imports). Width of the bands indicates volume of flows which is indicated in million tce on the inner circle adjacent to the bands.
Appendix

16
Managing China’s energy productivity potential
References
AASE (Australian Alliance to Save Energy) (2014).
"Joint statement of lifting Australia’s Energy
Productivity." Available at: http://www.a2se.org.au/
files/Docs/140414_Joint_Statement_.pdf .
ASE (Alliance to Save Energy) (2013). "Energy
2030 On the Road." [Online]. Available at: http://
www.ase.org/resources/energy-2030-road-report.
CCIN: China Climate Change Info Net (2013). "The
outlook on controlling overall energy consumption
in China." [Online]. Available at: http://
www.ccchina.gov.cn/Detail.aspx?
newsId=17481&TId=57 (Chinese).
Chen, H.M. (2009). "The energy and environment
impacts of China’s international trade," Fudan
University.
Davis, S.J., Caldeira, K. (2010). "Consumption-
based accounting of CO2 emissions." Proceedings of
the National Academy of Sciences 107(12): 5687-
5692.
FRG (Federal Republic of Germany) (2013).
"Communication from the Federal Republic of
Germany to the European Commission of 19 June
2013." [Online]. Available at: http://ec.europa.eu/
energy/efficiency/eed/doc/reporting/2013/
de_2013report_en.pdf.
Guan, D., Peters, G.P., Weber, C.L., Hubacek, K.
(2009). "Journey to world top emitter: An analysis of
the driving forces of China's recent CO2 emissions
surge." Geophysical Research Letters 36(4):
L04709.
IEA (2012). "World Energy Outlook
2012." [Online]. Available at: http://www.iea.org/
publications/freepublications/publication/name-
49561-en.html.
IPCC (2014). "The Mitigation of Climate Change,
Fifth Assessment Report," UNFCCC, Geneva, Paris.
Kahrl, F., Roland-Holst, D. (2008). "Energy and
exports in China." China Economic Review 19(4):
649-658.
KAPSARC (2014). "The case for energy
productivity: more than just semantics," KAPSARC
Discussion Paper. KS-1402-DP01B, March, 2014.
Leontief, W. (1986). Input-output economics.
Oxford University Press.
Ministry of Industry and Information Technology
(2010). "Phasing Out Backward Capacities for 11th
FYP." [Online]. Available at: http://
www.miit.gov.cn/n11293472/n11293832/
n13095885/13232432.html (Chinese).
Ministry of Industry and Information Technology
(2011). "DDRC announced the accomplishment of
the 11th Five-Year energy saving targets for each
province." [Online]. Available at: http://
www.miit.gov.cn/n11293472/n11293832/
n12768545/13880926.html (Chinese).
Ministry of Industry and Information Technology
(2012). "The 12th FYP for Industrial Energy-
saving." [Online]. Available at: http://
www.miit.gov.cn/n11293472/n11293832/
n11293907/n11368223/14475991.html (Chinese).
Ministry of Finance (2011). "Management
Regulation on Fiscal Rewards for Phasing-Out
Outdated Production Capacity." [Online]. Available
at: http://www.miit.gov.cn/n11293472/n11293877/
n13138101/n13138133/13745753.html (Chinese).
National Development and Reform Commission
(NDRC) (2004a). "Guidance of Adjustment and
Management of the Projects in Iron and Steel,
Electrolytic Aluminum, and Cement
Industry." [Online]. Available at: http://
www.ynetc.gov.cn/Item/1276.aspx (Chinese).
National Development and Reform Commission
(NDRC) (2004b). "Medium and Long Term Energy
Conservation Plan." [Online]. Available at: http://
baike.baidu.com/view/10910606.htm?fr=aladdin
(Chinese).

17
Managing China’s energy productivity potential
National Development and Reform Commission
(NDRC) (2006). "Implementation Suggestions of
Ten Key Energy-Conservation Projects during the
Eleventh Five-Year Plan." [Online]. Available at:
(Chinese).
National Development and Reform Commission
(NDRC) (2007a). "Energy Development Plan of the
11th Five Year Plan." [Online]. Available at: http://
www.ccchina.gov.cn/WebSite/CCChina/UpFile/
File186.pdf (Chinese).
National Development and Reform Commission
(NDRC) (2007b). "Notice of NDRC on Local
Provincial Government to retain revenue collected
through the differential electricity pricing
system." [Online]. Available at: http://
www.china.com.cn/economic/txt/2007-10/12/
content_9040150.htm> (Chinese).
National Development and Reform Commission
(NDRC) (2011). "Review of the Eleventh Five-Year
Plan: Top 1000 Program Exceeded
Targets." [Online]. Available at: http://www.gov.cn/
gzdt/2011-09/30/content_1960586.htm (Chinese).
PRCSC (2012). "China's Energy Policy 2012."
Information Office of the State Council.
Price, L.K., Wang, X., Yun, J. (2008). "China's Top-
1000 Energy-Consuming Enterprises Program:
Reducing Energy Consumption of the 1000 Largest
Industrial Enterprises in China." Lawrence Berkeley
National Laboratory; Peking University, China
Energy Conservation Association.
Song, F., Zheng, X. (2014). "What drives the change
in China's energy intensity: combining
decomposition analysis and econometric analysis at
the provincial level," School of Economics, Renmin
University.
State Council (2006). "Implementation of the 11th
Five Year Plan: Targets and Division of
Work." [Online]. Available at: http://
www.molss.gov.cn/gb/zt/2006-11/21/
content_149505.htm (Chinese).
State Council (2007). "Notice about the issuance of
comprehensive energy saving and pollution
reduction work plan." [Online]. Available at: http://
www.gov.cn/jrzg/2007-06/03/content_634545.htm
(Chinese).
State Council (2009). "China’s Commitment: to
reduce carbon intensity by 40-45% below 2005
level." [Online]. Available at: http://
www.nbd.com.cn/articles/2009-11-27/255297.html
(Chinese).
Su, B., Ang, B.W. (2011). "Multi-region input-
output analysis of CO2 emissions embodied in trade:
the feedback effects." Ecological Economics 7142 -
53.
Taylor, R.P., Draugelis, G.J., Zhang, Y., Co, A.U.A.
(2010). "Accelerating Energy Conservation in
China's Provinces," World Bank.
Wang, Y.-h. (2013). "Fundamental Principles of
China's Energy Security Strategy." International
Relations and Diplomacy 1(1): 34-41.
WEC (2012). "World Energy Trilemma: time to get
real, the agenda for change". World Energy Council,
London.
Xie, J. (2010). "Presentation on the energy savings
results in China," Energy Efficiency Forum.
Xu, X. (2013). "World Energy China Outlook 2013-
2014 - Executive Summary." Institute of World
Economics and Politics; Chinese Academy of Social
Sciences.
Yuxiang, K., Chen, Z. (2010). "Government
expenditure and energy intensity in China." Energy
Policy 38(2): 691-694.
Zhang, Z. (2000). "Decoupling China’s Carbon
Emissions Increase from Economic Growth: An
Economic Analysis and Policy Implications." World
Development 28(4): 739-752.

18
Managing China’s energy productivity potential
About the authors
This paper is the result of cooperation between the
Energy Productivity and China Projects at
KAPSARC and researchers from Renmin University
of China and the Chinese Academy of Sciences.
Jin Min and Xia Yan are Visiting Fellows at
KAPSARC and would also like to recognize the
support of the Research Funds for the Central
Universities and the Research Funds of Renmin
University of China (Jin Min, Grant No. 12XNI009)
and the National Science Foundation of China (Xia
Yan, Grant No. 71203213).
Nicholas Howarth is project leader
of this work and a Research Fellow
specializing in technological change,
energy and the environment. He holds
a D.Phil in applied economics from the
University of Oxford.
Leo Lester is a Research Fellow
leading the China Research Program.
Formally a macroeconomist and China
specialist, he has a PhD and is a CFA
and FRM.
Jin Min is an Associate Professor at
the Renmin University of China. She
specializes in energy efficiency in
China.
Xia Yan is Associate Professor at the
Chinese Academy of Science,
specializing in multiregional input
output and computable general
equilibrium m odeling of the Chinese
economy.