Embed Size (px)
Citation preview

MANAGERIAL FINANCE
PROFESSIONAL 1 EXAMINATION - AUGUST 2019
NOTES: Section A – Answer Question 1 and Question 2 and either Part A or Part B of Question 3. Section B – Answer Question 4 and either Part A or Part B of Question 5. Should you provide answers to both Parts A and B in Question 3 and/or Question 5, you must draw a clearly distinguishable line through the answer Part(s) not to be marked. Otherwise, only the first answer(s) to hand for each of these questions will be marked.
MANAGERIAL FINANCE TABLES ARE PROVIDED
TIME ALLOWED: 3 hours, plus 10 minutes to read the paper. INSTRUCTIONS: During the reading time you may write notes on the examination paper, but you may not commence writing in your answer book. Please read each Question carefully. Marks for each question are shown. The pass mark required is 50% in total over the whole paper. Start your answer to each question on a new page. You are reminded to pay particular attention to your communication skills, and care must be taken regarding the format and literacy of your solutions. The marking system will take into account the content of your answers and the extent to which answers are supported with relevant legislation, case law or examples, where appropriate. List on the cover of each answer booklet, in the space provided, the number of each question attempted. NB: PLEASE ENSURE TO ENCLOSE YOUR ANSWER SHEET TO QUESTION 4 IN THE ENVELOPE PROVIDED.
The Institute of Certified Public Accountants in Ireland,17 Harcourt Street, Dublin 2.

THE INSTITUTE OF CERTIFIED PUBLIC ACCOUNTANTS IN IRELAND MANAGERIAL FINANCE PROFESSIONAL 1 EXAMINATION – AUGUST 2019
Time allowed 3 hours, plus 10 minutes to read the paper.
SECTION A (Answer Questions 1 and 2 and either Part A or Part B of Question 3)
1. K Ltd. is in the business of manufacturing savoury snacks specialising in tortilla chips and flavoured crisps.
The company has been successful since it was formed over ten years ago. Its customers are supermarkets and its sales units are measured in cartons. In view of the trend towards healthier eating, the company is considering introducing a gluten-free version of savoury snacks that will complement its existing offerings. The company’s planning horizon is five years. The new gluten-free product line will be known as Product KGF.
You have been provided with the following details relating to this project:
• The research and development division has spent €300,000 on market research, and the directors of
K Ltd. are encouraged by the findings. Product KGF will require investment in a new machine, which is expected to cost €750,000 payable immediately upon commencement of the project. The sales proceeds of the machine at the end of its five-year useful life are expected to be €150,000.
• The research and development division has estimated that 70,000 units will be sold in Year 1, with a
10% annual increase in Years 2 to 4 inclusive, and no growth in sales volume in Year 5. • Total fixed operating costs will be €495,000 per year. This figure includes an allocated annual fixed
charge from Head Office amounting to €11,500 per month relating to the overheads and the annual depreciation relating to the new machinery acquired for this project.
• Depreciation is charged on a straight-line basis over the 5-year life at 20%, and the scrap value of
€150,000 is expected to be realised. • Acceptance of this project will mean that other work capable of making a net contribution of €350,000
for each of the five years will not proceed. Further research and development costs of €127,500 have been contracted and will be paid for in Year 1.
• The selling price of the new product has been forecasted at €60 per unit for the first two years, and
will increase by 10% in Year 3 of the project. It will remain at the Year 3 price for the remainder of the project. All sales will be on a cash basis.
• The forecasted gross margin is 40%. Cost of sales will consist entirely of materials which will be paid
for immediately. The project will operate on a Just-In-Time (J.I.T) basis with no opening or closing inventory.
• Other variable costs will amount to €45 per unit and are expected to stay constant for the five years
of the project. • Distribution agency fees amounting to 5% of the annual sales for the previous year will be paid,
commencing in Year 2. The fee for years 4 and 5 will be paid in the last year of the project. There is no fee for Year 3.
• The total gross marketing costs have been estimated at €950,000, 30% of which will be paid before
the project commences. The remaining amounts which are subject to the project being undertaken will be paid in equal annual instalments.
• The company’s cost of capital is 10%. The company expects investments to deliver positive pre-tax
Net Present Value over the life of the five-year project and a maximum payback period of three years. You may ignore taxation.
Page 1

Page 2
K Ltd.’s Managing Director has requested that on the basis of the information provided you appraise this investment proposal.
REQUIREMENT: Prepare extracts from a report to the management of K Ltd. with the information presented in the following order: (a) A table showing the results of your calculations and initial recommendations based on (i) the Payback and (ii)
NPV methods.
Include any detailed workings on separate pages as an appendix to your extracts from the report. For the NPV calculation, figures may be rounded to the nearest euro. For the Payback calculation, rounding to two decimal places is required.
(15 marks) (b) Evaluate five non- financial factors that should be considered by the company in deciding whether or not to invest
in the new KGF product line. (10 marks)
[Total: 25 Marks]
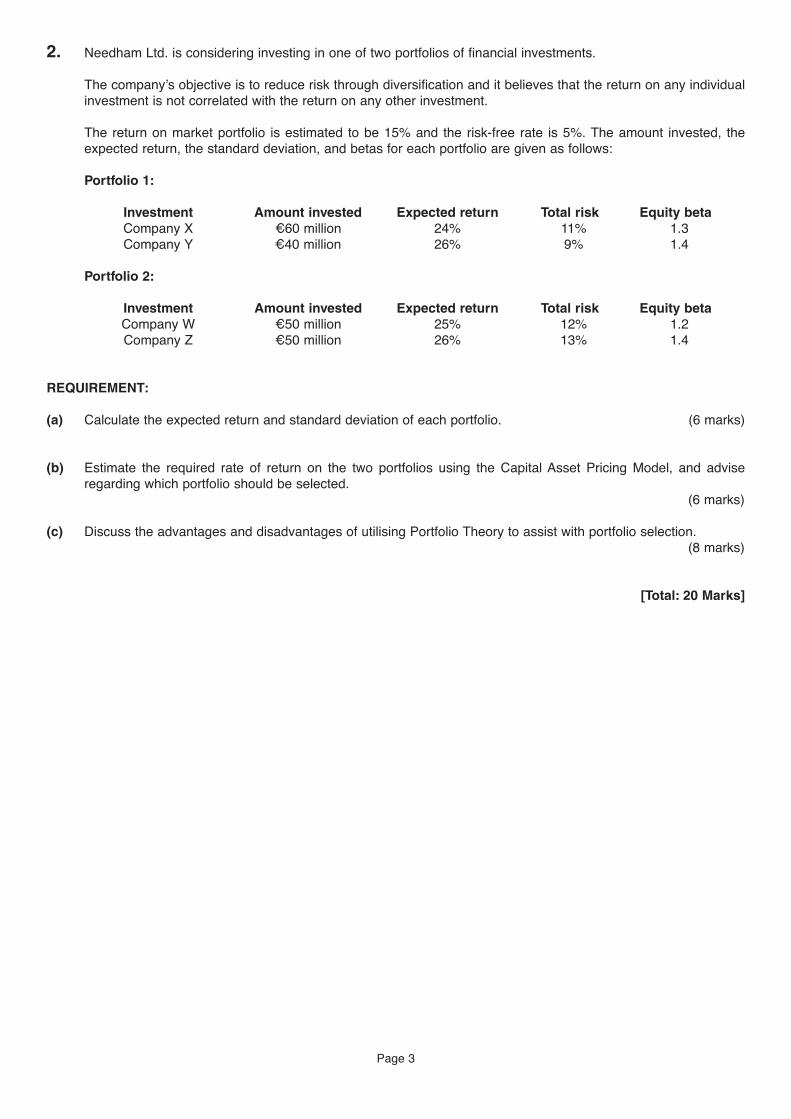
2. Needham Ltd. is considering investing in one of two portfolios of financial investments.
The company’s objective is to reduce risk through diversification and it believes that the return on any individual investment is not correlated with the return on any other investment.
The return on market portfolio is estimated to be 15% and the risk-free rate is 5%. The amount invested, the expected return, the standard deviation, and betas for each portfolio are given as follows:
Portfolio 1:
Investment Amount invested Expected return Total risk Equity beta Company X €60 million 24% 11% 1.3 Company Y €40 million 26% 9% 1.4
Portfolio 2:
Investment Amount invested Expected return Total risk Equity beta Company W €50 million 25% 12% 1.2 Company Z €50 million 26% 13% 1.4
REQUIREMENT: (a) Calculate the expected return and standard deviation of each portfolio. (6 marks) (b) Estimate the required rate of return on the two portfolios using the Capital Asset Pricing Model, and advise
regarding which portfolio should be selected. (6 marks)
(c) Discuss the advantages and disadvantages of utilising Portfolio Theory to assist with portfolio selection.
(8 marks)
[Total: 20 Marks]
Page 3

Page 4
3. Answer either Part A OR Part B.
Part (A) A factoring company has proposed a one-year agreement to Edwards Ltd. to both manage its receivables and advance 80% of the credit sales value when invoiced. Existing invoices will be eligible for an immediate 80% cash payment. The annual sales on credit by Edwards Ltd. are €6m spread evenly throughout the year, and the average delay in payment from the invoice date is 90 days. The factoring company is confident of reducing this delay to only 60 days, and will pay the remaining 20% of invoice value to Edwards Ltd. immediately on receipt from the customer. The charge for receivables management will be 1.7% of annual credit turnover payable at the year-end. For the advance payment on the invoices a commission of 1% will be charged plus interest applied at 10% per annum on the gross funds advanced. Edwards Ltd. will be able to save €80,000 during this year in administration costs if the factoring company takes on the debtor management. Currently, the company finances trade credit through an overdraft facility with an annual interest rate of 11%. REQUIREMENT: Draft a letter to the Directors of Edwards Ltd. advising them on whether to enter into the agreement. Your letter should include: (i) A table showing the results of your calculations. (8 marks) Include any detailed workings on separate pages as an appendix to your letter, and (ii) A brief discussion of the relative advantages and disadvantages for Edwards Ltd. of overdraft, factoring and term
loan financing. (7 marks)
[Total: 15 Marks]
OR
Part B ‘Capital Structure can have no influence on the value of a firm.’ Miller and Modigliani (1958). Discuss this statement, and outline six practical factors that a company should consider when determining capital structure.
[Total: 15 Marks]

Page 5
SECTION B Answer Question 4 and either Part A OR Part B of Question 5.
4. The following multiple-choice question contains eight sections, each of which is followed by a
choice of answers. Each question carries equal marks. On the answer sheet provided, indicate for each question, which of the options you think is the correct answer. Marks will not be awarded where you select more than one answer for any question.
INFORMATION RELEVANT TO REQUIREMENTS 1, 2 and 3 ONLY
Extracts from the Statement of Financial Position as at 31 December 2018 for JJ Plc have been provided below:
€m 5% Debentures Irredeemable (€100 each) 20.0 6% Preference Shares (€1 each) 2.5 Ordinary Shares (€1 each) 18.0
Other relevant information: • The corporation tax rate is 12.5% • The market value of the ordinary share is €6.80 per share • The market value of the preference share is €1.06 per share • The expected dividend on the ordinary shares is €0.45 with a projected growth rate of 2.5% • The market value of the debentures is €97.50 each. REQUIREMENT: 1. The company’s current cost of debentures is approximately: (a) 6.62% (b) 4.48% (c) 8.50% (d) None of the above. 2. The company’s current cost of preference shares is approximately: (a) 5.66% (b) 8.5% (c) 10.2% (d) None of the above. 3. The company’s current cost of ordinary shares is approximately: (a) 7.98% (b) 9.28% (c) 8.5% (d) None of the above.
Page 6
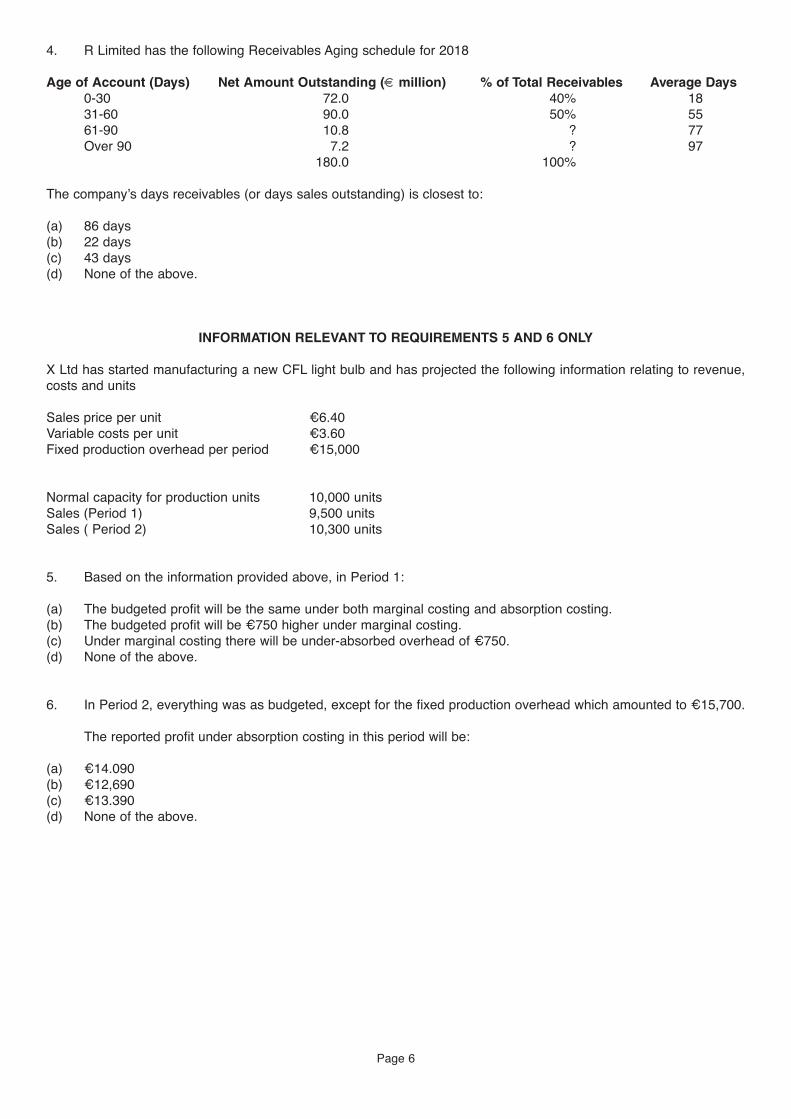
4. R Limited has the following Receivables Aging schedule for 2018 Age of Account (Days) Net Amount Outstanding (€ million) % of Total Receivables Average Days
0-30 72.0 40% 18 31-60 90.0 50% 55 61-90 10.8 ? 77 Over 90 7.2 ? 97
180.0 100% The company’s days receivables (or days sales outstanding) is closest to: (a) 86 days (b) 22 days (c) 43 days (d) None of the above.
INFORMATION RELEVANT TO REQUIREMENTS 5 AND 6 ONLY X Ltd has started manufacturing a new CFL light bulb and has projected the following information relating to revenue, costs and units Sales price per unit €6.40 Variable costs per unit €3.60 Fixed production overhead per period €15,000 Normal capacity for production units 10,000 units Sales (Period 1) 9,500 units Sales ( Period 2) 10,300 units
5. Based on the information provided above, in Period 1: (a) The budgeted profit will be the same under both marginal costing and absorption costing. (b) The budgeted profit will be €750 higher under marginal costing. (c) Under marginal costing there will be under-absorbed overhead of €750. (d) None of the above.
6. In Period 2, everything was as budgeted, except for the fixed production overhead which amounted to €15,700.
The reported profit under absorption costing in this period will be: (a) €14.090 (b) €12,690 (c) €13.390 (d) None of the above.

7. In relation to share price movements, which of the following statements are correct?
(i) The Efficient Market Hypothesis (EMH) states that the price of securities fully and fairly reflects all relevant available information but only in situations where past information is being considered.
(ii) Prices move randomly when new information is publicly announced. (iii) New information from published accounts is the only determinant of the random movements in share price.
(a) (i) and (ii) only (b) (i) and (iii) only (c) (ii) and (iii) only (d) None of the combinations listed above. 8. In relation to working capital management, which of the following statements are correct?
(i) Working capital management involves consideration of both the investment and financing decision. (ii) An increased amount of inventory decreases the risk of obsolescence. (iii) An increased amount of inventory decreases the risk of ‘stock outs’ and the possibility of losing customers.
(a) (i) and (ii) only (b) (i) and (iii) only (c) (ii) and (iii) only (d) None of the combinations listed above.
[Total: 20 Marks]
Page 7

5. Answer either Part (A) OR Part (B)
Part (A) Harmstrong Ltd. is an Irish private Ltd. company in the consumer electronics business, and distributes electronic items to shops and DIY centres. The company has been trading for the last ten years and has over 100 outlets throughout Europe. It has recently been approached by a large multinational chain ‘Technology World Plc’ that has over 3,000 outlets throughout the USA and is interested in acquiring 51% of Harmstrong Ltd. Extracts from the most recent Financial Statements of Harmstrong Ltd. are provided below:
Statements of Financial Position as at 31 December 2018
Dec 2018
Non-Current Assets €’000 Goodwill 600 Land & Buildings 350 Plant & Machinery 550 Investments 500 Current Assets Trade Receivables 500 Inventories 400 Cash & Equivalents 200 Current Liabilities Trade & Other Payables 600 Bank Loans & Overdrafts 120 Total Assets ( Net) 2,380 Share Capital (nominal €2 shares) 1,000 Long Term Debt 1,000 Retained Earnings 380 Total Equity & Long Term Liabilities 2,380
The dividends proposed for the year remain unchanged from the previous years and totals €50,000. There was no interim dividend. This amount of dividend has been paid for each of the last 5 years. The goodwill consists of a value placed by the directors of Harmstrong Ltd. on its brands and reputation in the electronics business. Further relevant information:
• The trade receivables figure includes a debt of €25,000 (which will need to be written off from a customer since
gone into liquidation). Merchant & Ivory, a credit rating agency had indicated that the industry norm is to provide 20% against the gross value of receivables for bad debts.
• Technology World Plc commissioned an independent valuation report on the non-current assets. This report indicated that at end of year the market value of the Land & Buildings amounted to €2.1 million, and the Plant & Machinery was €0.2 million.
• Assume that there were no tax implications arising from any of these adjustments. • The notes to the accounts reveal that the market values of the Investments are as follows: Listed Shares
€50,000; (Book value €350,000); and Government Bonds €180,000; (Book value €50,000). • The remaining investment was a premium site in the much sought after International Financial Services Centre. • The market value of this investment has increased four-fold on its book value. • Harmstrong Ltd. has a court case pending and has provided for this. It has understated the liability by €160,000
against the amount provided for in the accounts. • For the purposes of share valuation, it has been agreed to use the average p/e ratio and dividend yield of the two
quoted companies provided below. However, since Harmstrong Ltd. is a private company, it was also agreed that the P/E ratio used for an earnings basis of valuation should be reduced by 30%. Company P/E Ratio Dividend Yield Plc 1 6.4 1.12% Plc 2 7.8 1.85%
Page 8

An examination of previous Income Statements reveals the following: Year ended 31 Dec. 2018 2017 2016 2015 2014
€ ‘000 € ‘000 € ‘000 € ‘000 € ‘000 Operating Profit 490 441 400 340 270 Profit Before Tax 350 290 250 190 150 Profit After Tax 290 190 140 80 40 Independent research reveals that the industry profits are expected to grow at a compound annual rate of 5%. The Directors of Harmstrong Ltd. expect profits to increase by 20% per annum over the next five years.
REQUIREMENT: (a) Create a table for the Directors of Harmstrong Ltd. showing a share of valuations based on the following four
methods:
(i) Net Assets Basis; (Net Asset value per Share) (4 marks) (ii) Earnings Basis (no growth); Estimated Value per Share (4 marks) (iii) Earnings Basis (with growth); Estimated Value per Share (4 marks) (iv) Dividend Yield. (4 marks)
(b) Recommend and justify a share price that may be used to value Harmstrong Ltd. (4 marks)
[Total: 20 Marks]
OR Part (B) “The financial manager makes decisions about the expected cash flows of the firm, which include decisions about how much and what types of debt and equity should be used to finance the firm (capital structure decisions); what type of assets should be purchased to help generate expected cash flows (capital budgeting decisions); and what to do with net cash flows generated by the firm – reinvest them in the firm or pay dividends (dividend decisions)”, Besley and Brigham. In light of the above statement discuss the complexity of the role of the financial manager reflecting upon the inter-relationship between the decisions in the areas highlighted.
[Total: 20 Marks]
END OF PAPER
Page 9

THE INSTITUTE OF CERTIFIED PUBLIC ACCOUNTANTS IN IRELAND MANAGERIAL FINANCE PROFESSIONAL 1 EXAMINATION – AUGUST 2019
SOLUTION 1 REPORT TO: Managing Director of K Limited FROM: CPA Financial Consultant RE: Proposed Investment in Product line KGF This report presents the results of the investment appraisal of the proposed KGF Product line using the NPV and Payback methods.
Introduction of KGF Product Line Recommendation Method NPV (in €000s) €-10.53 million (approx.) Reject as negative NPV over life of 5 years Payback No Payback Reject as payback not achieved Recommendation: From a financial perspective, we would recommend rejection of this project as it fails to meet the investment appraisal criteria. Specifically, the project has a large negative net present value and payback is not achieved within the specified three years. However, a number of issues should be investigated in relation to the basis of the calculations and the methods used to evaluate this proposal. We suggest a thorough re-examination of each relevant cash flow and the assumptions underlying the calculations that have led to this negative result. Examples of items that warrant further investigation include:
· Inflows from revenues depend on the forecasted quantities and price of units sold. Since the company has found that there is a “trend towards healthier eating”, the growth rate in sales volume may be overly conservative. Likewise, further increases in the anticipated selling price may be feasible.
· Relevant cash outflows exceed inflows by a significant amount for each year of the project. The cost of materials
at 60% of sales may be excessive. Using its leverage with suppliers (based on ten years of successful trading), the company could negotiate cash and bulk discounts.
· The proposed use of a JIT system should be reconsidered since this could lead to extra costs required to meet
demand at short notice. It may be possible to use existing extra storage space at a minimal marginal cost. · Other anticipated outflows should also be investigated. For instance, the forecasted operating costs should be
analysed to ensure that no other allocated items have been included. The payback method is a useful technique for identifying projects that will generate sufficient net cash flows within a specified time horizon. However, its use may not be appropriate here since it could take much longer than three years for the company to establish itself in a growth market. Assuming that the relevant cash flows have been correctly identified and estimated, and that the appropriate discount rate is used, the NPV method is a valid method for the financial appraisal of projects. On that basis, and subject to further investigation of the issues raised above, we recommend rejection of the project.
Page 10
SUGGESTED SOLUTIONS

Q1- K Ltd Key Considerations ( given in Question) Units- Sales Increase Factor 10% Price - Sales Increase Factor 10% Gross Margin 40% Material Costs 60% Other Variable Costs €45 Machine Cost ( Year 0) €750,000 Machine Proceeds (Year 5) €150,000 Further Research and Devt Costs €127,500 Opportunity Costs €350,000 Distribution Agency Fees factor 5% Gross Marketing Costs €950,000 Gross Marketing Costs factor - Project Life 70% Gross Marketing Costs - Year 0 30% Fixed Operating Costs (before allocations) €495,000 Allocated Annual Fixed HQ charge (mthly) €11,500 Depreciation Factor 20% Machine Scrap Value €150,000 Sales Revenue Year 1 Year 2 Year 3 Year 4 Year 5
Sales Units 70,000 77,000 84,700 93,170 93,170 Sales Price €60 €60 €66 €66 €66
Cash Inflow €4,200,000 €4,620,000 €5,590,200 €6,149,220 €6,149,220
Variable Costs Materials €2,520,000 €2,772,000 €3,354,120 €3,689,532 €3,689,532 Other Variable Costs €3,150,000 €3,465,000 €3,811,500 €4,192,650 €4,192,650 Total €5,670,000 €6,237,000 €7,165,620 €7,882,182 €7,882,182
Cash Inflows Sales Revenue €4,200,000 €4,620,000 €5,590,200 €6,149,220 €6,149,220
Cash Outflows Variable Costs €5,670,000 €6,237,000 €7,165,620 €7,882,182 €7,882,182 Further Research and Devt Costs €127,500 €0 €0 €0 €0 Opportunity Costs €350,000 €350,000 €350,000 €350,000 €350,000 Distribution Agency Fees €210,000 €0 €0 €586,971 Gross Marketing Costs €133,000 €133,000 €133,000 €133,000 €133,000 Relevant Fixed Operating Costs W1 €237,000 €237,000 €237,000 €237,000 €237,000 Total Cash Outflows €6,517,500 €7,167,000 €7,885,620 €8,602,182 €9,189,153
Net Cash Flow -€2,317,500 -€2,547,000 -€2,295,420 -€2,452,962 -€3,039,933
W1 - Relevant Fixed Operating Costs Fixed Operating Costs €495,000 Less Allocated Annual Fixed HQ charge (Annual Calculation) €138,000 Depreciation Charge €120,000 Relevant Fixed Operating Costs €237,000
Net Present Value
Year 0 Year 1 Year 2 Year 3 Year 4 Year 5 Machine Cost -€750,000 Gross Marketing Costs - Year 0 -€285,000 Total Cash Outflows -€1,035,000 -€6,517,500 -€7,167,000 -€7,885,620 -€8,602,182 -€9,189,153 Total Cash Inflows €0 €4,200,000 €4,620,000 €5,590,200 €6,149,220 €6,149,220 Net Cash Flow -€1,035,000 -€2,317,500 -€2,547,000 -€2,295,420 -€2,452,962 -€3,039,933 Discount Factor @ 10% 1.00 0.909 0.826 0.751 0.683 0.621 NPV -€1,035,000 -€2,106,608 -€2,103,822 -€1,723,860 -€1,675,373 -€1,887,798
-€10,532,461 Payback No Payback Reject
Page 11

(b) Five Non-Financial Factors 1. Reliability of supplier in sourcing and delivering the non-gluten raw materials for the new product line - are any of
these new UK suppliers where there may be Brexit and/or currency implications? 2. Staff acceptance of the new product line - will additional training be required for the new machine? 3. Markets for the new KGF product range - what are the demographics of the target customers allied to other
product and market trends? Are export markets included and have the geopolitical factors been fully investigated? 4. The main customers are supermarkets - need to consider impact of new product launch with these customers,
regarding demand for existing sales, joint marketing and promotion arrangements etc. Have any customers signed contracts for the new KGF Product range?
5. Possible technological obsolescence of the new machine - there will be a need to keep abreast of product and
process innovations over the five-year life cycle of the project. These and other non-financial factors can be expanded upon further.
Page 12
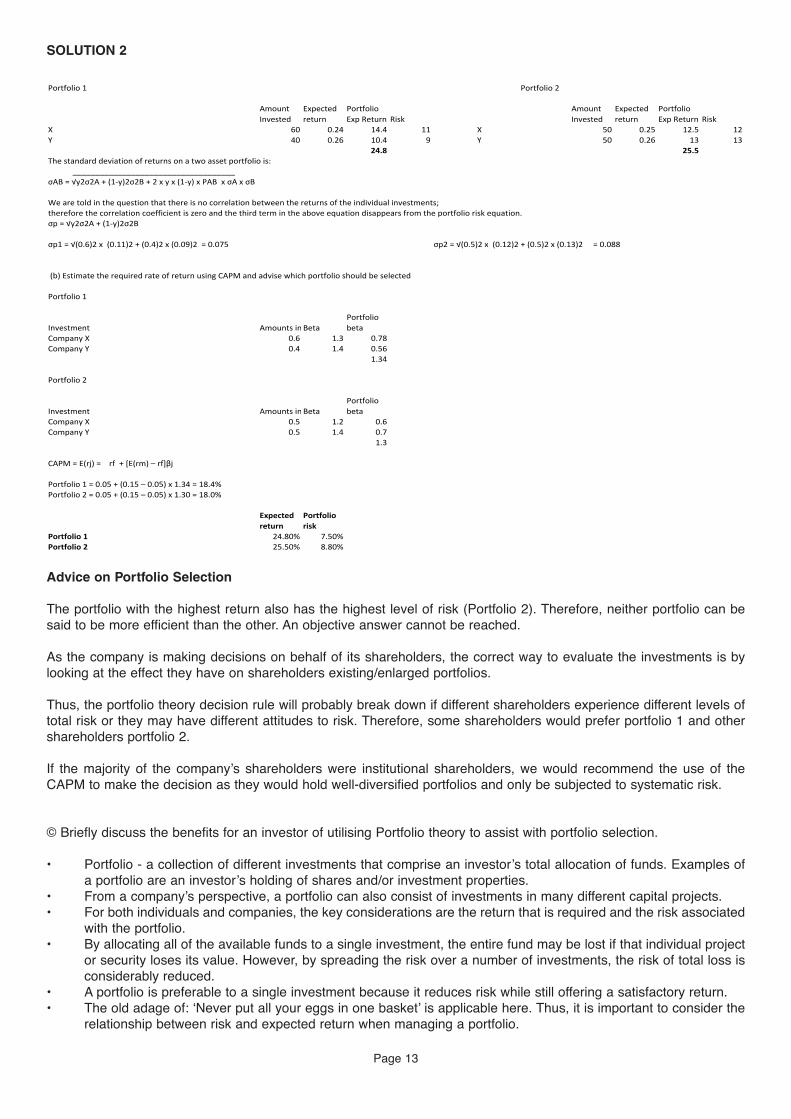
SOLUTION 2
Advice on Portfolio Selection The portfolio with the highest return also has the highest level of risk (Portfolio 2). Therefore, neither portfolio can be said to be more efficient than the other. An objective answer cannot be reached. As the company is making decisions on behalf of its shareholders, the correct way to evaluate the investments is by looking at the effect they have on shareholders existing/enlarged portfolios. Thus, the portfolio theory decision rule will probably break down if different shareholders experience different levels of total risk or they may have different attitudes to risk. Therefore, some shareholders would prefer portfolio 1 and other shareholders portfolio 2. If the majority of the company’s shareholders were institutional shareholders, we would recommend the use of the CAPM to make the decision as they would hold well-diversified portfolios and only be subjected to systematic risk. © Briefly discuss the benefits for an investor of utilising Portfolio theory to assist with portfolio selection. • Portfolio - a collection of different investments that comprise an investor’s total allocation of funds. Examples of
a portfolio are an investor’s holding of shares and/or investment properties. • From a company’s perspective, a portfolio can also consist of investments in many different capital projects. • For both individuals and companies, the key considerations are the return that is required and the risk associated
with the portfolio. • By allocating all of the available funds to a single investment, the entire fund may be lost if that individual project
or security loses its value. However, by spreading the risk over a number of investments, the risk of total loss is considerably reduced.
• A portfolio is preferable to a single investment because it reduces risk while still offering a satisfactory return. • The old adage of: ‘Never put all your eggs in one basket’ is applicable here. Thus, it is important to consider the
relationship between risk and expected return when managing a portfolio.
Page 13

Key concepts that are at the heart of Portfolio Theory are • Risk • Standard Deviation • expected return and probability • co-efficient of variation • correlation • diversification Risk • Two types of risk that affect any portfolio selection decision – systematic risk and unsystematic risk • Systematic risk is risk that affects all projects or investment decisions as it is macro-economic related – interest
rates, exchange rates, and Government policies. It therefore cannot be diversified. • Unsystematic risk on the other hand is unique to the securities or investments selected as it relates to the sector
and the company specifics. It can be diversified and by holding an appropriate mix of selections in the portfolio this type of risk can be reduced further.
• Markowitz in his work with Portfolio Theory concentrated on unsystematic risk. Expected Return & Probability • If we can assign a probability to a variety of likely returns then we can establish the expected return of a security.
When we use the term expected return it will be the sum of the probabilities of the return that the security will generate.
• In effect, expected return is calculated by multiplying potential outcomes by the likelihood of them occurring and then summing these results. This expected return is a statistical measure.
➢ The security or outcome can be represented as X ➢ The probability of the outcome can be represented as p ➢ The expected return is Px ➢ ∑p X is the sum of the probabilities of the expected return
Standard Deviation • There can be a high degree of variability in the expected returns for a security or portfolio of securities and hence
there is the risk that we may not gain a return or that we may receive a lower return that we expected. • Because of this variability, we need a measurement of the risk. Standard Deviation can be a statistical measure
of how likely it is that the expected return will be achieved. It measures the variability of returns about the mean or average.
• A high standard deviation implies greater variability of actual return while a low standard deviation implies that there is smaller risk for a given security or portfolio or Investment.
• We can say that the preferred position is high expected returns with low standard deviation. • Standard Deviation can be represented as σ Co-Efficient of Variation • What if there were two securities that had the same return and we had to choose just one (possibly because of
limited funds) we would select the security with the lowest standard deviation. • If both securities had the same standard deviation, we would select the one with the highest return. Frequently
we need to calculate the measure of risk per unit of return – this is the Coefficient of Variation. • This is calculated as Standard Deviation divided by expected return. Diversification and Correlation • Way of reducing risk is to diversify your selections. • Means of diversification would include securities from different industry sectors, different geographical markets
and inclusion of different forms of securities/investments ranging from shares, bonds, property, and commodities to cash.
• Furthermore we are trying, when possible, to spread the risk – this is what we mean when we talk about diversifying the risk – by endeavouring to select securities within our holding that when one venture fails the other venture might succeed and is not affected by the other venture.
• Examples can be provided or student may exemplify by referring to the Companies in the 2 portfolios Salient points from the above concepts should be utilised
Page 14

SOLUTION 3 Part A (a) Benefits:
Daily credit granted = €6,000,000/365 = €16,438 Immediate cash boost: €16,438 x 80 x 0.8 = €1,052,055 Annual interest saving €1,052,055 x 0.11 = €115,726 Plus interest saving on earlier settlement: €16,438 x 20 x 0.2 x 0.11 = €7,233 plus administration saving = €80,000
€202,959 Costs: 0.017 x 6,000,000 €102,000.0 1,052,055 x 0.1 €105,205.5 6,000,000 x 0.8 x 0.01 €48,000.0
€255,205.0
On a strict interpretation of the data, Edwards Ltd should favour continuing without the help of the factoring company because the charges are higher than the savings (even with the assumption of immediate reduction if the credit period is taken from 90 days to 60 days). However, there are at least three other considerations that may affect the decision. First, real businesses often feel the pressure of cash flow shortages (the capital markets are not perfect). Therefore, the managers may value the cash flow boost more highly than allowed for. Second, senior management time devoted to the problem of debtors may not have been included in ‘administration costs’. Third, customer relationships may be damaged by the actions of a factor keen in reducing the average debtor period.
A brief discussion of the relative advantages and disadvantages for Edwards Ltd of overdraft, factoring and term loan financing.
Overdraft should be used only for cash shortages or short-term working capital requirements & company needs to be aware that it is repayable on demand. Facility for less than a year – company might be tempted to view overdraft as a ‘permanent’ source of finance & have over-reliance on it. This perception of overdraft has to be avoided. Security - Les security required than for term loans Cost – Bank Interest charged on the amount outstanding Repayment – easier as there are no structure repayments – funds paid in as they become available to reduce the overdraft Flexibility – All of the overdraft facility does not have to be drawn down in one go – the unused balance can be obtained quickly & without formality Key Disadvantages (when compared to term loan/ factoring & other sources of finance) – Facility repayable on demand – can lead to strain on cash flows. Interest rates can be variable Term Loan – Made available for fixed term & usually as fixed interest rate. Repayments in equal instalments over loan duration Repayment profile can be structured to suit company business – e.g. interest payments only & one balloon repayment at end Known cash flow assists financial planning Security can be Letter of Guarantee from Director or floating charge on stock Factoring – Involvement of 3rd Party. Sale of trade debts for immediate cash to factor as 3rd party that charges commission. Cost usually higher than overdraft rates Factor charges administration fee .5% to 2.5% - range of services can be provided – Finance up front as factor receives the invoices from Edwards Limited & pays Edwards Ltd 80% of value of invoices up front. Balance (less factor charges & commissions) paid when invoice settled or after a specified period Security is the company’s receivables, leaving other assets free. Useful if Edwards Ltd growing quickly & receivables growing – funds available from factor will increase. With cash flow guaranteed greater opportunity for taking up supplier discounts. Factor has greater sales ledger management experience of debt administration & debt collection (research
Page 15

conducted – 60 days by factor to collect debt Vs Company 75 days to collect) Key disadvantages – cost – hence accurate workings of cost should be done before utilising a factor Terms of Agreement & Risk – recourse Vs non-recourse Perception of your customers if factor too aggressive in collecting debts
Part B
“Capital Structure can have no influence on the value of a firm” Miller and Modigliani (1958)
Miller and Modigliani view can be contrasted with traditional view that preceded them.
• Traditional view – There is an optimal mix of debt and equity for every firm that enables that firm to minimise their Weighted Average Cost of Capital (WACC).
• Traditional view is that cost of equity remains at a constant level at low gearing levels, causing WACC to
fall. • Beyond a certain point shareholders begin to demand a higher rate of return to compensate for the higher
financial risk – WACC begins to rise and the value of the company starts to fall. • Miller and Modigliani view was that the value of the firm was determined by the income generated from
the business activities & the manner in which it was split between providers of debt or equity was irrelevant. • If the shares of two firms with same level of business risk but different financial risk as a result of debt/equity
relationship were traded at different prices, shareholders would move from overvalued firm to undervalued firm and adjust their personal borrowing through the market to maintain their financial risk at the same level. Thus, through arbitrage pricing the total price of both firms would be forced to a common equilibrium value.
• Miller showed later in a separate paper that the tax shield benefit of debt can act to increase the value of
the firm with the higher gearing • Capital structure is not irrelevant as there are other practical considerations –
o Balance of control and ownership – less disruption where retained earnings used as source of finance ahead of equity and debt
o Pecking Order theory (Donaldson) also indicates that retained earnings preferred ahead of debt and equity
o Transaction costs for raising finance through debt and equity higher than retained earnings o Family companies – high proportion of SME’s in Ireland wish to retain family balance of ownership
and control – reticent about new equity to outsiders or risk of loan capital o Debt providers imposing restrictions & covenants restricting freedom of use of assets and /or
restrictions on dividend payments – Shareholders averse to these restrictions o Shareholders not keen on restricting dividends or risk of reduced dividends where interest payments
have to paid ahead of dividends or exposed to bankruptcy risk o Taxation effects – Corporate & personal debt may be favoured because of the tax benefits of debt
vs equity o Interest rates environment – fixed Vs floating & level of interest rates may deter firms from taking on
increased debt in their capital structure o Fluctuating interest rates may make take on of debt less favourable o Economic environment & Stock Market situation – If Stock market depressed or timing not right for
share issue – company may favour debt – Examples can be provided e.g. Digicell & withdrawing their share issue, timing of IPO’s this year by IT Companies (Uber, Slack, Airbnb, Lyft etc.)
o Signalling effect of Dividends or Issue of Debt – Some investors may see issue of debt capital as a sign that the Directors perceive the company to be strong in projected future cash flow to commit to future regular interest rate repayments
o Variability of projected future cash flows – if strong variability more difficult to convince lenders of capacity to repay
o Type of Fixed Assets – Tangible Vs Intangible. If company has high level of tangible assets easier to borrow as debt provider can use these as collateral whereas intangible assets (e.g. patents from software houses) more difficult to crystallise as security & more difficult to use as borrowing base.
o Nature of Operations – If company has significant international presence may desire Foreign Exchange loans & foreign denominated debt in their capital structure.
Page 16

SOLUTION 4 Q1 B Q2 A Q3 B Q4 C Q5 D Q6 B Q7 D Q8 B Q1 Cost of Debentures After tax cost of Debt = kd (1 – T)
Q2 Cost of Preference Shares
Q3 Cost of Equity (using Dividend Growth Model)
Page 17
€2.5m x €1.0
Formula:
00 6% Preference shares - ma
Pref Share dividend x 100
arket value = €1.06
66.5
Pref share price
.06 x 100 %1.06 (A)

Q4 Q5 In period 1 Production exceeds Sales so that profit under absorption costing is higher than the marginal costing
profit. It is higher by the amount that production exceeds sales (500 units) x the Fixed overhead element (€15,000 / 10,000 units = €1.50 Fixed OAR)
Profit is higher under Absorption Costing exceeding Marginal Costing by €750 being 500 units x €1.50
Ans = D as none of the Statements are correct
Q6
Q7 In relation to share price movements which of the following statements are correct?
(i) The Efficient Market Hypothesis (EMH) states that the price of securities fully and fairly reflects all relevant available information but only in situations where past information is being considered.
(ii) Prices move randomly when new information is publicly announced. (iii) New information from published accounts is the only determinant of the random movements in share price (iv) Statement 1 is false as there is no requirement for the rider at the end of the Statement ‘but only in
situations where past information is being considered’. If this rider had been omitted then the EMH definition from Eugene Fama would have been valid
Statement 2 is false. Share prices should move correctly not randomly in response to disclosure of new information. New information arises at random, not the share price response to that new information.
Statement 3 is false. In an efficient market share price movements reflect disclosure of all relevant available information, not just accounting information.
Only possible answer is (D) as none of the Statements is correct
Q8 In relation to working capital management which of the following statements are correct?
(i) Working capital management involves consideration of both the investment and financing decision. (ii) An increased amount of inventory decreases the risk of obsolescence. (iii) An increased amount of inventory decreases the risk of ‘stock outs’ and the possibility of losing customers. Statements 1 and 3 are correct Only possible answer is (B)
Page 18
X LtdPeriod 2
Selling
Units Price (€) €
Sales 10,300 6.4 65920
Cost of Sales
Var Costs 3.6 37080
Fixed Overheads 1.5 15450
52530
Fixed Overhead - Underabsorbed 700
€15700- €15000
Profit 12690(B)

SOLUTION 5 Part A
Page 19
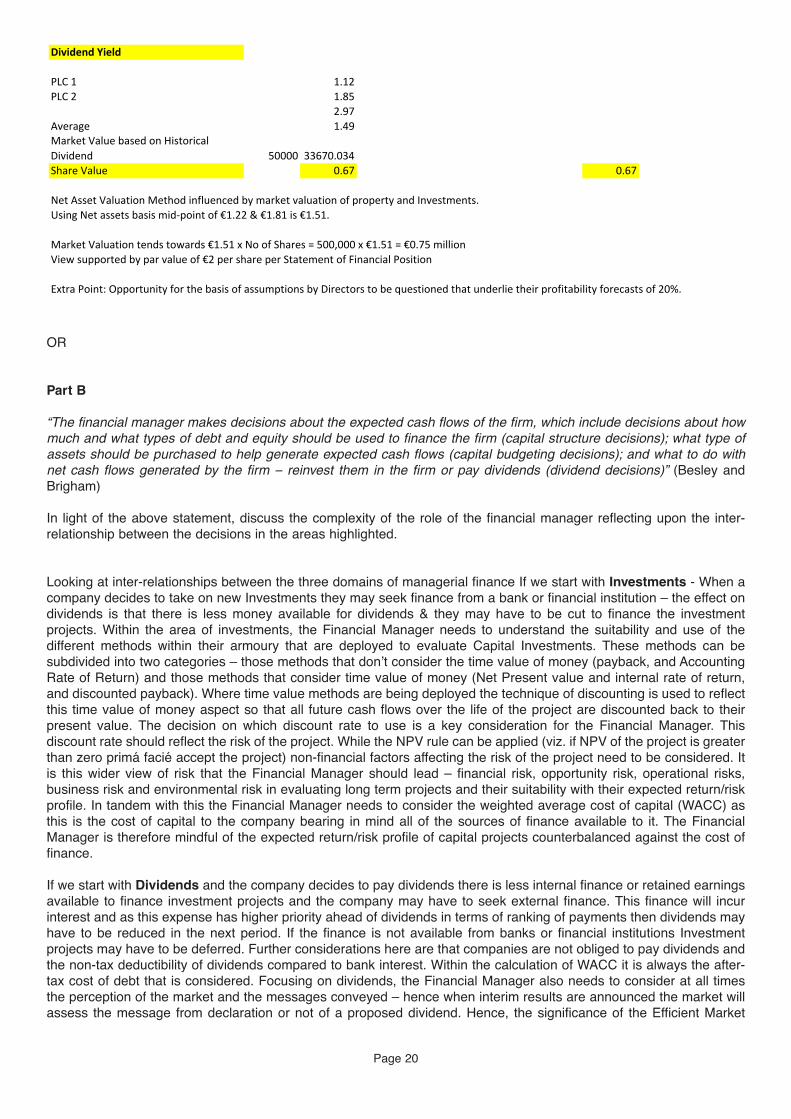
OR Part B “The financial manager makes decisions about the expected cash flows of the firm, which include decisions about how much and what types of debt and equity should be used to finance the firm (capital structure decisions); what type of assets should be purchased to help generate expected cash flows (capital budgeting decisions); and what to do with net cash flows generated by the firm – reinvest them in the firm or pay dividends (dividend decisions)” (Besley and Brigham) In light of the above statement, discuss the complexity of the role of the financial manager reflecting upon the inter-relationship between the decisions in the areas highlighted. Looking at inter-relationships between the three domains of managerial finance If we start with Investments - When a company decides to take on new Investments they may seek finance from a bank or financial institution – the effect on dividends is that there is less money available for dividends & they may have to be cut to finance the investment projects. Within the area of investments, the Financial Manager needs to understand the suitability and use of the different methods within their armoury that are deployed to evaluate Capital Investments. These methods can be subdivided into two categories – those methods that don’t consider the time value of money (payback, and Accounting Rate of Return) and those methods that consider time value of money (Net Present value and internal rate of return, and discounted payback). Where time value methods are being deployed the technique of discounting is used to reflect this time value of money aspect so that all future cash flows over the life of the project are discounted back to their present value. The decision on which discount rate to use is a key consideration for the Financial Manager. This discount rate should reflect the risk of the project. While the NPV rule can be applied (viz. if NPV of the project is greater than zero primá facié accept the project) non-financial factors affecting the risk of the project need to be considered. It is this wider view of risk that the Financial Manager should lead – financial risk, opportunity risk, operational risks, business risk and environmental risk in evaluating long term projects and their suitability with their expected return/risk profile. In tandem with this the Financial Manager needs to consider the weighted average cost of capital (WACC) as this is the cost of capital to the company bearing in mind all of the sources of finance available to it. The Financial Manager is therefore mindful of the expected return/risk profile of capital projects counterbalanced against the cost of finance. If we start with Dividends and the company decides to pay dividends there is less internal finance or retained earnings available to finance investment projects and the company may have to seek external finance. This finance will incur interest and as this expense has higher priority ahead of dividends in terms of ranking of payments then dividends may have to be reduced in the next period. If the finance is not available from banks or financial institutions Investment projects may have to be deferred. Further considerations here are that companies are not obliged to pay dividends and the non-tax deductibility of dividends compared to bank interest. Within the calculation of WACC it is always the after-tax cost of debt that is considered. Focusing on dividends, the Financial Manager also needs to consider at all times the perception of the market and the messages conveyed – hence when interim results are announced the market will assess the message from declaration or not of a proposed dividend. Hence, the significance of the Efficient Market
Page 20

hypothesis and the arguments surrounding the view of relevance or irrelevance of dividends. Within the calculation of WACC methods for calculating costs of ordinary shares, retained earnings and preference shares need to be deployed bearing in mind whether the Capital Asset Pricing model or Gordon’s Growth model is more applicable but both methods need to be grasped and applied. Moreover where cash flows are generated from projects decisions need to be made whether dividends will be paid or the money re-invested bearing in mind the business operations counterbalanced against the signalling effect to the market of payment or non-payment of dividends and the views of ordinary shareholders and the constituent elements of the company’s equity (e.g. certain shareholders more interested in capital gain than dividends) If we start with Finance, where the company seeks this finance from external parties this may result in interest charges and a higher cost of capital as the bank charges a higher risk premium in advancing the loan – the interest rate reflects from the bank’s perspective their risk premium. The company now must pay a higher cost of capital and less projects will be financed or made available. This in turn means that the ability to pay dividends is seriously curtailed. Furthermore an understanding of risk – systematic and unsystematic- is required, even at minimum from the perspective of earning a return from excess funds that is greater than the risk free rate represented by Government Bonds. The capital structure decision that reflects the components of WACC is key as there are trade-offs to be considered in structuring capital while being mindful of gaining a low cost of capital. For example, looking at debt (before even considering different types of debt instruments) by incurring debt the possibility of financial risk is increased and yet debt has tax efficiency advantages within the overall cost of capital. Before a Financial Manager will consider external finance that incurs a risk premium and interest charges with financial risk the Financial Manager will consider internal finance and possibility of freeing up internal finance. From an operational perspective this freeing up of internal finance may arise from improved working capital management impacting upon a cash conversion cycle that should be attuned to the needs of the business. For example, the inventory turnover is considerably different for a high-end jeweller than a supermarket with perishable goods. Within the capital structure decision the Financial Manager needs to be aware of different types of debt instruments and different internal financing/equity alternatives in addition to the fact that ordinary shareholders incur the greatest risk as owners of the company & will expect a return. Hence in the same way that ordinary shareholders that can use methods that have their basis in portfolio theory the Financial Manager also needs to be aware of Portfolio Theory and the concept of diversification to reduce risk while being mindful of the return on the finance (as evidenced by return on capital employed), even in the selection of financing instruments. The Financial Manager will also be conscious of their treasury management role while being aware of their operational role ensuring that there is sufficient cash for everyday operations- hence the importance of cash budgeting allied to the capital budgeting/investment decisions treated earlier with the inter-connection with financial implications & the sometimes trade-off between profitability and liquidity. This needs to be managed while continually being conscious of overall aim of making decisions that further long-term shareholder wealth maximisation while recognising the inter-play between the financing, investment and dividend domains. It is this interplay between capital structure decisions/ WACC/financing decisions; capital budgeting/investment decisions and impact upon dividend decisions that adds to the complexity of the role Candidates can expand upon these areas with exemplification of decisions in the capital structure, capital budgeting and dividend domains highlighting further inter-relationships that add to the complexity of the financial management role.
END OF PAPER
Page 21