Embed Size (px)
Citation preview

Management’s report on internal control over financial reporting
JPMorgan Chase & Co./2010 Annual Report
158
Management of JPMorgan Chase & Co. (“JPMorgan Chase” or the
“Firm”) is responsible for establishing and maintaining adequate
internal control over financial reporting. Internal control over finan-
cial reporting is a process designed by, or under the supervision of,
the Firm’s principal executive and principal financial officers, or
persons performing similar functions, and effected by JPMorgan
Chase’s Board of Directors, management and other personnel, to
provide reasonable assurance regarding the reliability of financial
reporting and the preparation of financial statements for external
purposes in accordance with accounting principles generally
accepted in the United States of America.
JPMorgan Chase’s internal control over financial reporting includes
those policies and procedures that (1) pertain to the maintenance
of records, that, in reasonable detail, accurately and fairly reflect
the transactions and dispositions of the Firm’s assets; (2) provide
reasonable assurance that transactions are recorded as necessary to
permit preparation of financial statements in accordance with
generally accepted accounting principles, and that receipts and
expenditures of the Firm are being made only in accordance with
authorizations of JPMorgan Chase’s management and directors;
and (3) provide reasonable assurance regarding prevention or
timely detection of unauthorized acquisition, use or disposition of
the Firm’s assets that could have a material effect on the financial
statements.
Because of its inherent limitations, internal control over financial
reporting may not prevent or detect misstatements. Also, projec-
tions of any evaluation of effectiveness to future periods are subject
to the risk that controls may become inadequate because of
changes in conditions, or that the degree of compliance with the
policies or procedures may deteriorate.
Management has completed an assessment of the effectiveness of
the Firm’s internal control over financial reporting as of December
31, 2010. In making the assessment, management used the
framework in “Internal Control – Integrated Framework” promul-
gated by the Committee of Sponsoring Organizations of the Tread-
way Commission, commonly referred to as the “COSO” criteria.
Based upon the assessment performed, management concluded
that as of December 31, 2010, JPMorgan Chase’s internal control
over financial reporting was effective based upon the COSO criteria.
Additionally, based upon management’s assessment, the Firm
determined that there were no material weaknesses in its internal
control over financial reporting as of December 31, 2010.
The effectiveness of the Firm’s internal control over financial
reporting as of December 31, 2010, has been audited by
PricewaterhouseCoopers LLP, an independent registered public
accounting firm, as stated in their report which appears herein.
James Dimon Chairman and Chief Executive Officer
Douglas L. Braunstein Executive Vice President and Chief Financial Officer
February 28, 2011

Report of independent registered public accounting firm
JPMorgan Chase & Co./2010 Annual Report
159
Report of Independent Registered Public Accounting Firm
To the Board of Directors and Stockholders of JPMorgan
Chase & Co.:
In our opinion, the accompanying consolidated balance sheets and
the related consolidated statements of income, changes in stock-
holders’ equity and comprehensive income and cash flows present
fairly, in all material respects, the financial position of JPMorgan
Chase & Co. and its subsidiaries (the “Firm”) at December 31,
2010 and 2009, and the results of their operations and their cash
flows for each of the three years in the period ended December 31,
2010, in conformity with accounting principles generally accepted
in the United States of America. Also in our opinion, the Firm
maintained, in all material respects, effective internal control over
financial reporting as of December 31, 2010, based on criteria
established in Internal Control - Integrated Framework issued by
the Committee of Sponsoring Organizations of the Treadway Com-
mission (COSO). The Firm's management is responsible for these
financial statements, for maintaining effective internal control over
financial reporting and for its assessment of the effectiveness of
internal control over financial reporting, included in the accompany-
ing “Management's report on internal control over financial report-
ing.” Our responsibility is to express opinions on these financial
statements and on the Firm's internal control over financial report-
ing based on our integrated audits. We conducted our audits in
accordance with the standards of the Public Company Accounting
Oversight Board (United States). Those standards require that we
plan and perform the audits to obtain reasonable assurance about
whether the financial statements are free of material misstatement
and whether effective internal control over financial reporting was
maintained in all material respects. Our audits of the financial
statements included examining, on a test basis, evidence support-
ing the amounts and disclosures in the financial statements, assess-
ing the accounting principles used and significant estimates made
by management, and evaluating the overall financial statement
presentation. Our audit of internal control over financial reporting
included obtaining an understanding of internal control over finan-
cial reporting, assessing the risk that a material weakness exists,
and testing and evaluating the design and operating effectiveness
of internal control based on the assessed risk. Our audits also
included performing such other procedures as we considered nec-
essary in the circumstances. We believe that our audits provide a
reasonable basis for our opinions.
A company’s internal control over financial reporting is a process
designed to provide reasonable assurance regarding the reliability of
financial reporting and the preparation of financial statements for
external purposes in accordance with generally accepted accounting
principles. A company’s internal control over financial reporting
includes those policies and procedures that (i) pertain to the mainte-
nance of records that, in reasonable detail, accurately and fairly
reflect the transactions and dispositions of the assets of the com-
pany; (ii) provide reasonable assurance that transactions are re-
corded as necessary to permit preparation of financial statements in
accordance with generally accepted accounting principles, and that
receipts and expenditures of the company are being made only in
accordance with authorizations of management and directors of the
company; and (iii) provide reasonable assurance regarding preven-
tion or timely detection of unauthorized acquisition, use, or disposi-
tion of the company’s assets that could have a material effect on the
financial statements.
Because of its inherent limitations, internal control over financial
reporting may not prevent or detect misstatements. Also, projections
of any evaluation of effectiveness to future periods are subject to the
risk that controls may become inadequate because of changes in
conditions, or that the degree of compliance with the policies or
procedures may deteriorate.
February 28, 2011
PricewaterhouseCoopers LLP • 300 Madison Avenue • New York, NY 10017

Consolidated statements of income
JPMorgan Chase & Co./2010 Annual Report
160
Year ended December 31, (in millions, except per share data) 2010 2009 2008
Revenue
Investment banking fees $ 6,190 $ 7,087 $ 5,526
Principal transactions 10,894 9,796 (10,699 )
Lending- and deposit-related fees 6,340 7,045 5,088
Asset management, administration and commissions 13,499 12,540 13,943
Securities gains(a) 2,965 1,110 1,560
Mortgage fees and related income 3,870 3,678 3,467
Credit card income 5,891 7,110 7,419
Other income 2,044 916 2,169
Noninterest revenue 51,693 49,282 28,473
Interest income 63,782 66,350 73,018
Interest expense 12,781 15,198 34,239
Net interest income 51,001 51,152 38,779
Total net revenue 102,694 100,434 67,252
Provision for credit losses 16,639 32,015 20,979
Noninterest expense
Compensation expense 28,124 26,928 22,746
Occupancy expense 3,681 3,666 3,038
Technology, communications and equipment expense 4,684 4,624 4,315
Professional and outside services 6,767 6,232 6,053
Marketing 2,446 1,777 1,913
Other expense 14,558 7,594 3,740
Amortization of intangibles 936 1,050 1,263
Merger costs — 481 432
Total noninterest expense 61,196 52,352 43,500
Income before income tax expense/(benefit) and extraordinary gain 24,859 16,067 2,773
Income tax expense/(benefit) 7,489 4,415 (926 )
Income before extraordinary gain 17,370 11,652 3,699
Extraordinary gain — 76 1,906
Net income $ 17,370 $ 11,728 $ 5,605
Net income applicable to common stockholders $ 15,764 $ 8,774 $ 4,742
Per common share data
Basic earnings per share
Income before extraordinary gain $ 3.98 $ 2.25 $ 0.81 Net income 3.98 2.27 1.35
Diluted earnings per share
Income before extraordinary gain 3.96 2.24 0.81 Net income 3.96 2.26 1.35
Weighted-average basic shares 3,956 3,863 3,501 Weighted-average diluted shares 3,977 3,880 3,522
Cash dividends declared per common share $ 0.20 $ 0.20 $ 1.52 (a) The following other-than-temporary impairment losses are included in securities gains for the periods presented.
Year ended December 31,(in millions) 2010 2009
Total other-than-temporary impairment losses $ (94) $ (946)
Losses recorded in/(reclassified from) other comprehensive income (6) 368
Total credit losses recognized in income $ (100) $ (578)
The Notes to Consolidated Financial Statements are an integral part of these statements.

Consolidated balance sheets
JPMorgan Chase & Co./2010 Annual Report
161
December 31, (in millions, except share data) 2010 2009
Assets
Cash and due from banks $ 27,567 $ 26,206
Deposits with banks 21,673 63,230
Federal funds sold and securities purchased under resale agreements (included $20,299 and $20,536 at fair value) 222,554 195,404
Securities borrowed (included $13,961 and $7,032 at fair value) 123,587 119,630
Trading assets (included assets pledged of $73,056 and $38,315) 489,892 411,128
Securities (included $316,318 and $360,365 at fair value and assets pledged of $86,891 and $140,631) 316,336 360,390
Loans (included $1,976 and $1,364 at fair value) 692,927 633,458
Allowance for loan losses (32,266) (31,602 )
Loans, net of allowance for loan losses 660,661 601,856
Accrued interest and accounts receivable (included zero and $5,012 at fair value) 70,147 67,427
Premises and equipment 13,355 11,118
Goodwill 48,854 48,357
Mortgage servicing rights 13,649 15,531
Other intangible assets 4,039 4,621
Other assets (included $18,201 and $19,165 at fair value and assets pledged of $1,485 and $1,762) 105,291 107,091
Total assets(a) $ 2,117,605 $ 2,031,989
Liabilities
Deposits (included $4,369 and $4,455 at fair value) $ 930,369 $ 938,367 Federal funds purchased and securities loaned or sold under repurchase agreements (included $4,060 and $3,396 at
fair value) 276,644 261,413
Commercial paper 35,363 41,794
Other borrowed funds (included $9,931 and $5,637 at fair value) 57,309 55,740
Trading liabilities 146,166 125,071 Accounts payable and other liabilities (included the allowance for lending-related commitments of $717 and $939
and $236 and $357 at fair value) 170,330 162,696
Beneficial interests issued by consolidated variable interest entities (included $1,495 and $1,410 at fair value) 77,649 15,225
Long-term debt (included $38,839 and $48,972 at fair value) 247,669 266,318
Total liabilities(a) 1,941,499 1,866,624
Commitments and contingencies (see Note 31 on pages 280–281 of this Annual Report)
Stockholders’ equity
Preferred stock ($1 par value; authorized 200,000,000 shares; issued 780,000 and 2,538,107 shares) 7,800 8,152
Common stock ($1 par value; authorized 9,000,000,000 shares; issued 4,104,933,895 shares) 4,105 4,105
Capital surplus 97,415 97,982
Retained earnings 73,998 62,481
Accumulated other comprehensive income/(loss) 1,001 (91 )
Shares held in RSU Trust, at cost (1,192,712 shares and 1,526,944 shares) (53) (68 )
Treasury stock, at cost (194,639,785 shares and 162,974,783 shares) (8,160) (7,196 )
Total stockholders’ equity 176,106 165,365
Total liabilities and stockholders’ equity $ 2,117,605 $ 2,031,989
(a) The following table presents information on assets and liabilities related to VIEs that are consolidated by the Firm at December 31, 2010 and 2009. The difference between total VIE assets and liabilities represents the Firm’s interests in those entities, which were eliminated in consolidation.
December 31, (in millions) 2010 2009 Assets Trading assets $ 9,837 $ 6,347 Loans 95,587 13,004 All other assets 3,494 5,043 Total assets $ 108,918 $ 24,394 Liabilities Beneficial interests issued by consolidated variable interest entities $ 77,649 $ 15,225 All other liabilities 1,922 2,197 Total liabilities $ 79,571 $ 17,422
The assets of the consolidated VIEs are used to settle the liabilities of those entities. The holders of the beneficial interests do not have recourse to the general credit of JPMorgan Chase. At December 31, 2010, the Firm provided limited program-wide credit enhancement of $2.0 billion related to its Firm-administered multi-seller conduits. For further discussion, see Note 16 on pages 244–259 of this Annual Report.
The Notes to Consolidated Financial Statements are an integral part of these statements.

Consolidated statements of changes in stockholders’ equity and comprehensive income
JPMorgan Chase & Co./2010 Annual Report
162
Year ended December 31, (in millions, except per share data) 2010 2009 2008
Preferred stock Balance at January 1 $ 8,152 $ 31,939 $ — Issuance of preferred stock — — 31,550 Issuance of preferred stock – conversion of the Bear Stearns preferred stock — — 352 Accretion of preferred stock discount on issuance to the U.S. Treasury — 1,213 37 Redemption of preferred stock issued to the U.S. Treasury — (25,000) — Redemption of other preferred stock (352) — —
Balance at December 31 7,800 8,152 31,939
Common stock Balance at January 1 4,105 3,942 3,658 Issuance of common stock — 163 284
Balance at December 31 4,105 4,105 3,942
Capital surplus Balance at January 1 97,982 92,143 78,597 Issuance of common stock — 5,593 11,201 Warrant issued to U.S. Treasury in connection with issuance of preferred stock — — 1,250 Preferred stock issue cost — — (54) Shares issued and commitments to issue common stock for employee stock-based compensation awards and related tax effects 706 474 859 Net change from the Bear Stearns merger: Reissuance of treasury stock and the Share Exchange agreement — — 48 Employee stock awards — — 242 Other (1,273) (228) —
Balance at December 31 97,415 97,982 92,143
Retained earnings Balance at January 1 62,481 54,013 54,715 Cumulative effect of changes in accounting principles (4,376) — — Net income 17,370 11,728 5,605 Dividends declared: Preferred stock (642) (1,328) (674)
Accelerated amortization from redemption of preferred stock issued to the U.S. Treasury — (1,112) — Common stock ($0.20, $0.20 and $1.52 per share for 2010, 2009 and 2008, respectively) (835) (820) (5,633)
Balance at December 31 73,998 62,481 54,013
Accumulated other comprehensive income/(loss) Balance at January 1 (91) (5,687) (917) Cumulative effect of changes in accounting principles (144) — — Other comprehensive income/(loss) 1,236 5,596 (4,770)
Balance at December 31 1,001 (91) (5,687)
Shares held in RSU Trust Balance at January 1 (68) (217) — Resulting from the Bear Stearns merger — — (269) Reissuance from RSU Trust 15 149 52
Balance at December 31 (53) (68) (217)
Treasury stock, at cost Balance at January 1 (7,196) (9,249) (12,832) Purchase of treasury stock (2,999) — — Reissuance from treasury stock 2,040 2,079 2,454 Share repurchases related to employee stock-based compensation awards (5) (26) (21) Net change from the Bear Stearns merger as a result of the reissuance of treasury
stock and the Share Exchange agreement — — 1,150
Balance at December 31 (8,160) (7,196) (9,249)
Total stockholders’ equity $ 176,106 $ 165,365 $ 166,884
Comprehensive income Net income $ 17,370 $ 11,728 $ 5,605Other comprehensive income/(loss) 1,236 5,596 (4,770)
Comprehensive income $ 18,606 $ 17,324 $ 835
The Notes to Consolidated Financial Statements are an integral part of these statements.

Consolidated statements of cash flows
JPMorgan Chase & Co./2010 Annual Report
163
Note: Effective January 1, 2010, the Firm adopted accounting guidance related to VIEs. Upon adoption of the guidance, the Firm consolidated noncash assets and liabilities of $87.7 billion and $92.2 billion, respectively.
In 2008, the fair values of noncash assets acquired and liabilities assumed in: (1) the merger with Bear Stearns were $288.2 billion and $287.7 billion, respectively (approximately 26 million shares of common stock valued at approximately $1.2 billion were issued in connection with the Bear Stearns merger); and (2) the Wash-ington Mutual transaction were $260.3 billion and $260.1 billion, respectively.
The Notes to Consolidated Financial Statements are an integral part of these statements.
Year ended December 31, (in millions) 2010 2009 2008 Operating activities Net income $ 17,370 $ 11,728 $ 5,605 Adjustments to reconcile net income to net cash (used in)/provided by operating activities: Provision for credit losses 16,639 32,015 20,979 Depreciation and amortization 4,029 3,308 3,265 Amortization of intangibles 936 1,050 1,263 Deferred tax benefit (968) (3,622) (2,637 ) Investment securities gains (2,965) (1,110) (1,560 ) Proceeds on sale of investment — — (1,540 ) Stock-based compensation 3,251 3,355 2,637 Originations and purchases of loans held-for-sale (37,085) (22,417) (34,902 ) Proceeds from sales, securitizations and paydowns of loans held-for-sale 40,155 33,902 38,036 Net change in: Trading assets (72,082) 133,488 (12,787 ) Securities borrowed (3,926) 4,452 15,408 Accrued interest and accounts receivable 443 (6,312) 10,221 Other assets (12,452) 32,557 (32,919 ) Trading liabilities 19,344 (79,314) 24,061 Accounts payable and other liabilities 17,325 (26,450) 1,012 Other operating adjustments 6,234 6,167 (12,212 ) Net cash (used in)/provided by operating activities (3,752) 122,797 23,930 Investing activities Net change in: Deposits with banks 41,625 74,829 (118,929 ) Federal funds sold and securities purchased under resale agreements (26,957) 7,082 (44,597 ) Held-to-maturity securities: Proceeds 7 9 10 Available-for-sale securities: Proceeds from maturities 92,740 87,712 44,414 Proceeds from sales 118,600 114,041 96,806 Purchases (179,487) (346,372) (248,599 ) Proceeds from sales and securitizations of loans held-for-investment 8,853 30,434 27,531 Other changes in loans, net 3,645 51,251 (59,123 ) Net cash (used)/received in business acquisitions or dispositions (4,910) (97) 2,128 Proceeds from assets sale to the FRBNY — — 28,850 Net maturities/(purchases) of asset-backed commercial paper guaranteed by the FRBB — 11,228 (11,228 ) All other investing activities, net (114) (762) (934 ) Net cash provided by/(used in) investing activities 54,002 29,355 (283,671 ) Financing activities Net change in: Deposits (9,637) (107,700) 177,331 Federal funds purchased and securities loaned or sold under repurchase agreements 15,202 67,785 15,250 Commercial paper and other borrowed funds (6,869) (67,198) 9,219 Beneficial interests issued by consolidated variable interest entities 2,426 (4,076) (55) Proceeds from long-term borrowings and trust preferred capital debt securities 55,181 51,324 72,407 Payments of long-term borrowings and trust preferred capital debt securities (99,043) (68,441) (65,344 ) Excess tax benefits related to stock-based compensation 26 17 148 Proceeds from issuance of preferred stock and Warrant to the U.S. Treasury — — 25,000 Proceeds from issuance of other preferred stock — — 7,746 Redemption of preferred stock issued to the U.S. Treasury — (25,000) — Redemption of other preferred stock (352) — — Proceeds from issuance of common stock — 5,756 11,500 Treasury stock purchased (2,999) — — Dividends paid (1,486) (3,422) (5,911 ) All other financing activities, net (1,666) (2,124) (292 ) Net cash (used in)/provided by financing activities (49,217) (153,079) 246,999 Effect of exchange rate changes on cash and due from banks 328 238 (507 ) Net increase/(decrease) in cash and due from banks 1,361 (689) (13,249 ) Cash and due from banks at the beginning of the year 26,206 26,895 40,144 Cash and due from banks at the end of the year $ 27,567 $ 26,206 $ 26,895 Cash interest paid $ 12,404 $ 16,875 $ 37,267 Cash income taxes paid, net 9,747 5,434 2,280

Notes to consolidated financial statements
164 JPMorgan Chase & Co./2010 Annual Report
Note 1 – Basis of presentation JPMorgan Chase & Co. (“JPMorgan Chase” or the “Firm”), a finan-
cial holding company incorporated under Delaware law in 1968, is a
leading global financial services firm and one of the largest banking
institutions in the United States of America (“U.S.”), with operations
worldwide. The Firm is a leader in investment banking, financial
services for consumers, small business and commercial banking,
financial transaction processing, asset management and private
equity. For a discussion of the Firm’s business segment information,
see Note 34 on pages 290–293 of this Annual Report.
The accounting and financial reporting policies of JPMorgan Chase
and its subsidiaries conform to accounting principles generally
accepted in the United States of America (“U.S. GAAP”). Addition-
ally, where applicable, the policies conform to the accounting and
reporting guidelines prescribed by bank regulatory authorities.
Certain amounts in prior periods have been reclassified to conform
to the current presentation.
Consolidation
The Consolidated Financial Statements include the accounts of JPMor-
gan Chase and other entities in which the Firm has a controlling
financial interest. All material intercompany balances and transactions
have been eliminated. The Firm determines whether it has a control-
ling financial interest in an entity by first evaluating whether the entity
is a voting interest entity or a variable interest entity (“VIE”).
Voting Interest Entities Voting interest entities are entities that have sufficient equity and
provide the equity investors voting rights that enable them to make
significant decisions relating to the entity’s operations. For these
types of entities, the Firm’s determination of whether it has a con-
trolling interest is primarily based on the amount of voting equity
interests held. Entities in which the Firm has a controlling financial
interest, through ownership of the majority of the entities’ voting
equity interests, or through other contractual rights that give the
Firm control, are consolidated by the Firm.
Investments in companies in which the Firm has significant influence
over operating and financing decisions (but does not own a majority
of the voting equity interests) are accounted for (i) in accordance
with the equity method of accounting (which requires the Firm to
recognize its proportionate share of the entity’s net earnings), or (ii)
at fair value if the fair value option was elected at the inception of
the Firm’s investment. These investments are generally included in
other assets, with income or loss included in other income.
The Firm-sponsored asset management funds are generally struc-
tured as limited partnerships or limited liability companies, which are
typically considered voting interest entities. For the significant major-
ity of these entities, the Firm is the general partner or managing
member, but the non-affiliated partners or members have the ability
to remove the Firm as the general partner or managing member
without cause (i.e., kick-out rights), based on a simple majority vote,
or the non-affiliated partners or members have rights to participate
in important decisions. Accordingly, the Firm does not consolidate
these funds. In the limited cases where the non-affiliated partners or
members do not have substantive kick-out or participating rights,
the Firm consolidates the funds.
The Firm’s investment companies make investments in both public
and private entities, including investments in buyouts, growth equity
and venture opportunities. These investments are accounted for
under investment company guidelines and accordingly, irrespective
of the percentage of equity ownership interests held, are carried on
the Consolidated Balance Sheets at fair value, and are recorded in
other assets.
Variable Interest Entities VIEs are entities that, by design, either (1) lack sufficient equity to
permit the entity to finance its activities without additional subordi-
nated financial support from other parties, or (2) have equity inves-
tors that do not have the ability to make significant decisions
relating to the entity’s operations through voting rights, or do not
have the obligation to absorb the expected losses, or do not have
the right to receive the residual returns of the entity.
The most common type of VIE is a special purpose entity (“SPE”). SPEs
are commonly used in securitization transactions in order to isolate
certain assets and distribute the cash flows from those assets to
investors. SPEs are an important part of the financial markets, includ-
ing the mortgage- and asset-backed securities and commercial paper
markets, as they provide market liquidity by facilitating investors’
access to specific portfolios of assets and risks. SPEs may be organized
as trusts, partnerships or corporations and are typically established for
a single, discrete purpose. SPEs are not typically operating entities and
usually have a limited life and no employees. The basic SPE structure
involves a company selling assets to the SPE; the SPE funds the pur-
chase of those assets by issuing securities to investors. The legal
documents that govern the transaction specify how the cash earned
on the assets must be allocated to the SPE’s investors and other
parties that have rights to those cash flows. SPEs are generally struc-
tured to insulate investors from claims on the SPE’s assets by creditors
of other entities, including the creditors of the seller of the assets.
On January 1, 2010, the Firm implemented new consolidation ac-
counting guidance related to VIEs. The new guidance eliminates the
concept of qualified special purpose entities (“QSPEs”) that were
previously exempt from consolidation, and introduces a new frame-
work for consolidation of VIEs. The primary beneficiary of a VIE is
required to consolidate the assets and liabilities of the VIE. Under the
new guidance, the primary beneficiary is the party that has both (1)
the power to direct the activities of an entity that most significantly
impact the VIE’s economic performance; and (2) through its interests
in the VIE, the obligation to absorb losses or the right to receive bene-
fits from the VIE that could potentially be significant to the VIE.
To assess whether the Firm has the power to direct the activities of a
VIE that most significantly impact the VIE’s economic performance,
the Firm considers all the facts and circumstances, including its role
in establishing the VIE and its ongoing rights and responsibilities.
This assessment includes, first, identifying the activities that most
significantly impact the VIE’s economic performance; and second,
identifying which party, if any, has power over those activities. In
general, the parties that make the most significant decisions affect-
ing the VIE (such as asset managers, collateral managers, servicers,
or owners of call options or liquidation rights over the VIE’s assets)
or have the right to unilaterally remove those decision-makers are
deemed to have the power to direct the activities of a VIE.

JPMorgan Chase & Co./2010 Annual Report 165
To assess whether the Firm has the obligation to absorb losses of the
VIE or the right to receive benefits from the VIE that could potentially
be significant to the VIE, the Firm considers all of its economic inter-
ests, including debt and equity investments, servicing fees, and deriva-
tive or other arrangements deemed to be variable interests in the VIE.
This assessment requires that the Firm apply judgment in determining
whether these interests, in the aggregate, are considered potentially
significant to the VIE. Factors considered in assessing significance
include: the design of the VIE, including its capitalization structure;
subordination of interests; payment priority; relative share of interests
held across various classes within the VIE’s capital structure; and the
reasons why the interests are held by the Firm.
The Firm performs on-going reassessments of: (1) whether entities
previously evaluated under the majority voting-interest framework
have become VIEs, based on certain events, and therefore subject to
the VIE consolidation framework; and (2) whether changes in the facts
and circumstances regarding the Firm’s involvement with a VIE cause
the Firm’s consolidation conclusion to change.
For further details regarding the Firm’s application of the accounting
guidance effective January 1, 2010, see Note 16 on pages 244–259
of this Annual Report.
The Financial Accounting Standards Board (“FASB”) issued an
amendment which deferred the requirements of the accounting guid-
ance for certain investment funds, including mutual funds, private
equity funds and hedge funds. For the funds to which the deferral
applies, the Firm continues to apply other existing authoritative guid-
ance to determine whether such funds should be consolidated.
Assets held for clients in an agency or fiduciary capacity by the Firm
are not assets of JPMorgan Chase and are not included in the Con-
solidated Balance Sheets.
For reporting periods prior to January 1, 2010, there were two differ-
ent accounting frameworks applicable to SPEs: The qualifying special
purpose entity (“QSPE”) framework and the VIE framework. The
applicable framework depended on the nature of the entity and the
Firm’s relation to that entity. The QSPE framework was applicable
when an entity sold financial assets to an SPE meeting certain defined
criteria that were designed to ensure that the activities of the entity
were essentially predetermined at the inception of the vehicle and that
the transferor of the financial assets could not exercise control over the
entity and the assets therein. QSPEs were not consolidated by the
transferor or other counterparties as long as they did not have the
unilateral ability to liquidate or to cause the entity to no longer meet
the QSPE criteria. The Firm’s securitizations of residential and commer-
cial mortgages, credit card, automobile and student loans generally
were evaluated using the QSPE framework. For further details, see
Note 16 on pages 244–259 of this Annual Report.
Additionally, the other SPEs were evaluated using the VIE framework,
which was based on a risk and reward approach, and required a vari-
able interest holder (i.e., an investor or other counterparty to a VIE)
to consolidate the VIE if that party absorbed a majority of the ex-
pected losses of the VIE, received the majority of the expected
residual returns of the VIE, or both. In making the determination of
whether the Firm should consolidate a VIE, the Firm evaluated the
VIE’s design, capital structure and relationships among the variable
interest holders. If the Firm could not identify the party that consoli-
dates a VIE through a qualitative analysis, the Firm performed a
quantitative analysis, which computed and allocated expected losses
or residual returns to variable interest holders. The allocation of
expected cash flows in this analysis was based on the relative rights
and preferences of each variable interest holder in the VIE’s capital
structure. The Firm reconsidered whether it was the primary benefi-
ciary of a VIE only when certain defined events occurred.
Use of estimates in the preparation of consolidated finan-
cial statements
The preparation of Consolidated Financial Statements requires
management to make estimates and assumptions that affect the
reported amounts of assets and liabilities, revenue and expense, and
disclosures of contingent assets and liabilities. Actual results could
be different from these estimates.
Foreign currency translation
JPMorgan Chase revalues assets, liabilities, revenue and expense
denominated in non-U.S. currencies into U.S. dollars using applica-
ble exchange rates.
Gains and losses relating to translating functional currency financial
statements for U.S. reporting are included in other comprehensive
income/(loss) within stockholders’ equity. Gains and losses relating
to nonfunctional currency transactions, including non-U.S. opera-
tions where the functional currency is the U.S. dollar, are reported in
the Consolidated Statements of Income.
Statements of cash flows
For JPMorgan Chase’s Consolidated Statements of Cash Flows, cash
is defined as those amounts included in cash and due from banks.
Significant accounting policies
The following table identifies JPMorgan Chase’s other significant
accounting policies and the Note and page where a detailed descrip-
tion of each policy can be found. Business changes and developments Note 2 Page 166
Fair value measurement Note 3 Page 170
Fair value option Note 4 Page 187
Derivative instruments Note 6 Page 191
Noninterest revenue Note 7 Page 199
Interest income and interest expense Note 8 Page 200
Pension and other postretirement employee
benefit plans Note 9 Page 201
Employee stock-based incentives Note 10 Page 210
Securities Note 12 Page 214
Securities financing activities Note 13 Page 219
Loans Note 14 Page 220
Allowance for credit losses Note 15 Page 239
Variable interest entities Note 16 Page 244
Goodwill and other intangible assets Note 17 Page 260
Premises and equipment Note 18 Page 263
Long-term debt Note 22 Page 265
Income taxes Note 27 Page 271
Off–balance sheet lending-related financial instruments, guarantees and other commitments Note 30 Page 275
Litigation Note 32 Page 282

Notes to consolidated financial statements
166 JPMorgan Chase & Co./2010 Annual Report
Note 2 – Business changes and developments
Decrease in common stock dividend
On February 23, 2009, the Board of Directors reduced the Firm’s
quarterly common stock dividend from $0.38 to $0.05 per share,
effective with the dividend paid on April 30, 2009, to shareholders
of record on April 6, 2009.
Acquisition of the banking operations of Washington
Mutual Bank
On September 25, 2008, JPMorgan Chase acquired the banking
operations of Washington Mutual Bank (“Washington Mutual”)
from the FDIC for $1.9 billion. The acquisition expanded JPMorgan
Chase’s consumer branch network into several states, including
California, Florida Washington, Georgia, Idaho, Nevada and Oregon
and created the third largest branch network in the U.S. The acquisi-
tion also extended the reach of the Firm’s business banking, com-
mercial banking, credit card, consumer lending and wealth
management businesses.
The acquisition was accounted for under the purchase method of
accounting, which requires that the assets and liabilities of Washing-
ton Mutual be initially reported at fair value.
In 2008, the $1.9 billion purchase price was preliminarily allocated
to the Washington Mutual assets acquired and liabilities assumed,
which resulted in negative goodwill. In accordance with U.S. GAAP
for business combinations that was in effect at the time of the
acquisition, noncurrent nonfinancial assets acquired in the Washing-
ton Mutual transaction that were not held-for-sale, such as the
premises and equipment and other intangibles, were written down
against the negative goodwill. The negative goodwill that remained
after writing down the nonfinancial assets was recognized as an
extraordinary gain of $1.9 billion at December 31, 2008. The final
total extraordinary gain that resulted from the Washington Mutual
transaction was $2.0 billion.
The final summary computation of the purchase price and the allocation of the final total purchase price of $1.9 billion to the net assets acquired of Wash-
ington Mutual – based on their respective fair values as of September 25, 2008, and the resulting final negative goodwill of $2.0 billion are
presented below.
September 25, 2008 (in millions) Purchase price Purchase price $ 1,938 Direct acquisition costs 3 Total purchase price 1,941 Net assets acquired: Washington Mutual’s net assets before fair value adjustments $ 39,186 Washington Mutual’s goodwill and other intangible assets (7,566) Subtotal 31,620
Adjustments to reflect assets acquired at fair value: Securities (16) Trading assets (591) Loans (30,998) Allowance for loan losses 8,216 Premises and equipment 680 Accrued interest and accounts receivable (243) Other assets 4,010
Adjustments to reflect liabilities assumed at fair value: Deposits (686) Other borrowed funds 68 Accounts payable, accrued expense and other liabilities (1,124) Long-term debt 1,063
Fair value of net assets acquired 11,999 Negative goodwill before allocation to nonfinancial assets (10,058 )
Negative goodwill allocated to nonfinancial assets(a) 8,076
Negative goodwill resulting from the acquisition(b) $ (1,982 )
(a) The acquisition was accounted for as a purchase business combination, which requires the assets (including identifiable intangible assets) and liabilities (including executory contracts and other commitments) of an acquired business to be recorded at their respective fair values as of the effective date of the acquisition and consoli-dated with those of JPMorgan Chase. The fair value of the net assets of Washington Mutual’s banking operations exceeded the $1.9 billion purchase price, resulting in negative goodwill. Noncurrent, nonfinancial assets not held-for-sale, such as premises and equipment and other intangibles, were written down against the negative goodwill. The negative goodwill that remained after writing down transaction-related core deposit intangibles of approximately $4.9 billion and premises and equip-ment of approximately $3.2 billion was recognized as an extraordinary gain of $2.0 billion.
(b) The extraordinary gain was recorded net of tax expense in Corporate/Private Equity.

JPMorgan Chase & Co./2010 Annual Report 167
Condensed statement of net assets acquired The following condensed statement of net assets acquired reflects the final value assigned to the Washington Mutual net assets as of Septem-
ber 25, 2008.
(in millions) September 25, 2008 Assets Cash and due from banks $ 3,680Deposits with banks 3,517Federal funds sold and securities purchased under resale agreements 1,700Trading assets 5,691Securities 17,224Loans (net of allowance for loan losses) 206,456Accrued interest and accounts receivable 3,253Mortgage servicing rights 5,874All other assets 16,596Total assets $ 263,991
Liabilities Deposits $ 159,872Federal funds purchased and securities loaned or sold under repurchase agreements 4,549Other borrowed funds 81,636Trading liabilities 585Accounts payable, accrued expense and other liabilities 6,708Long-term debt 6,718Total liabilities 260,068
Washington Mutual net assets acquired $ 3,923
Merger with The Bear Stearns Companies Inc.
Effective May 30, 2008, BSC Merger Corporation, a wholly owned
subsidiary of JPMorgan Chase, merged with The Bear Stearns
Companies Inc. (“Bear Stearns”) pursuant to the Agreement and
Plan of Merger, dated as of March 16, 2008, as amended March
24, 2008, and Bear Stearns became a wholly owned subsidiary of
JPMorgan Chase. The merger provided the Firm with a leading
global prime brokerage platform; strengthened the Firm’s equities
and asset management businesses; enhanced capabilities in mort-
gage origination, securitization and servicing; and expanded the
platform of the Firm’s energy business. The merger was accounted
for under the purchase method of accounting, which requires that
the assets and liabilities of Bear Stearns be fair valued. The final
total purchase price to complete the merger was $1.5 billion.
The merger with Bear Stearns was accomplished through a series of
transactions that were reflected as step acquisitions. On April 8,
2008, pursuant to a share exchange agreement, JPMorgan Chase
acquired 95 million newly issued shares of Bear Stearns common
stock (or 39.5% of Bear Stearns common stock after giving effect
to the issuance) for 20.7 million shares of JPMorgan Chase com-
mon stock. Further, between March 24, 2008, and May 12, 2008,
JPMorgan Chase acquired approximately 24 million shares of Bear
Stearns common stock in the open market at an average purchase
price of $12.37 per share. The share exchange and cash purchase
transactions resulted in JPMorgan Chase owning approximately
49.4% of Bear Stearns common stock immediately prior to con-
summation of the merger. Finally, on May 30, 2008, JPMorgan
Chase completed the merger. As a result of the merger, each
outstanding share of Bear Stearns common stock (other than shares
then held by JPMorgan Chase) was converted into the right to
receive 0.21753 shares of common stock of JPMorgan Chase. Also,
on May 30, 2008, the shares of common stock that JPMorgan
Chase and Bear Stearns acquired from each other in the share
exchange transaction were cancelled. From April 8, 2008, through
May 30, 2008, JPMorgan Chase accounted for the investment in
Bear Stearns under the equity method of accounting. During this
period, JPMorgan Chase recorded reductions to its investment in
Bear Stearns representing its share of Bear Stearns net losses,
which was recorded in other income and accumulated other com-
prehensive income. The difference between the net assets acquired
and the fair value of the net assets acquired (including goodwill),
presented in the tables below, represent JPMorgan Chase’s net
losses recorded under the equity method of accounting.
In conjunction with the Bear Stearns merger, in June 2008, the
Federal Reserve Bank of New York (the “FRBNY”) took control,
through a limited liability company (“LLC”) formed for this purpose,
of a portfolio of $30 billion in assets acquired from Bear Stearns,
based on the value of the portfolio as of March 14, 2008. The
assets of the LLC were funded by a $28.85 billion term loan from
the FRBNY, and a $1.15 billion subordinated loan from JPMorgan
Chase. The JPMorgan Chase loan is subordinated to the FRBNY
loan and will bear the first $1.15 billion of any losses of the portfo-
lio. Any remaining assets in the portfolio after repayment of the
FRBNY loan, the JPMorgan Chase note and the expense of the LLC
will be for the account of the FRBNY.

Notes to consolidated financial statements
168 JPMorgan Chase & Co./2010 Annual Report
As a result of step acquisition accounting, the final total purchase price of $1.5 billion was allocated to the Bear Stearns assets acquired and
liabilities assumed using their fair values as of April 8, 2008, and May 30, 2008, respectively. The final summary computation of the purchase
price and the allocation of the final total purchase price of $1.5 billion to the net assets acquired of Bear Stearns are presented below.
May 30, 2008 (in millions, except shares, per share amounts, ratios and where otherwise noted)
Purchase price Shares exchanged in the Share Exchange transaction (April 8, 2008) 95,000 Other Bear Stearns shares outstanding 145,759 Total Bear Stearns stock outstanding 240,759 Cancellation of shares issued in the Share Exchange transaction (95,000 ) Cancellation of shares acquired by JPMorgan Chase for cash in the open market (24,061 ) Bear Stearns common stock exchanged as of May 30, 2008 121,698 Exchange ratio 0.21753 JPMorgan Chase common stock issued 26,473
Average purchase price per JPMorgan Chase common share(a) $ 45.26 Total fair value of JPMorgan Chase common stock issued $ 1,198 Bear Stearns common stock acquired for cash in the open market (24 million shares at an
average share price of $12.37 per share) 298
Fair value of employee stock awards (largely to be settled by shares held in the RSU Trust(b)) 242 Direct acquisition costs 27 Less: Fair value of Bear Stearns common stock held in the RSU Trust and included in the
exchange of common stock (269 )(b) Total purchase price 1,496 Net assets acquired Bear Stearns common stockholders’ equity $ 6,052 Adjustments to reflect assets acquired at fair value: Trading assets (3,877 ) Premises and equipment 509 Other assets (288 ) Adjustments to reflect liabilities assumed at fair value: Long-term debt 504 Other liabilities (2,289 ) Fair value of net assets acquired excluding goodwill 611
Goodwill resulting from the merger(c) $ 885
(a) The value of JPMorgan Chase common stock was determined by averaging the closing prices of JPMorgan Chase’s common stock for the four trading days during the period March 19 through 25, 2008.
(b) Represents shares of Bear Stearns common stock held in an irrevocable grantor trust (the “RSU Trust”), to be used to settle stock awards granted to selected employees and certain key executives under certain heritage Bear Stearns employee stock plans. Shares in the RSU Trust were exchanged for 6 million shares of JPMorgan Chase common stock at the merger exchange ratio of 0.21753. For further discussion of the RSU Trust, see Note 10 on pages 210–212 of this Annual Report.
(c) The goodwill was recorded in Investment Bank and is not tax-deductible.
Condensed statement of net assets acquired
The following condensed statement of net assets acquired reflects the final values assigned to the Bear Stearns net assets as of May 30, 2008.
(in millions) May 30, 2008 Assets Cash and due from banks $ 534 Federal funds sold and securities purchased under resale agreements 21,204 Securities borrowed 55,195 Trading assets 136,489 Loans 4,407 Accrued interest and accounts receivable 34,677 Goodwill 885 All other assets 35,377 Total assets $ 288,768 Liabilities Federal funds purchased and securities loaned or sold under repurchase agreements $ 54,643 Other borrowings 16,166 Trading liabilities 24,267 Beneficial interests issued by consolidated VIEs 47,042 Long-term debt 67,015 Accounts payable and other liabilities 78,569 Total liabilities 287,702 Bear Stearns net assets(a) $ 1,066
(a) Reflects the fair value assigned to 49.4% of the Bear Stearns net assets acquired on April 8, 2008 (net of related amortization), and the fair value assigned to the remaining 50.6% of the Bear Stearns net assets acquired on May 30, 2008. The difference between the net assets acquired, as presented above, and the fair value of the net assets acquired (including goodwill), presented in the previous table, represents JPMorgan Chase’s net losses recorded under the equity method of accounting.

JPMorgan Chase & Co./2010 Annual Report 169
Unaudited pro forma condensed combined financial
information reflecting the Bear Stearns merger and
Washington Mutual transaction
The following unaudited pro forma condensed combined finan-
cial information presents the 2008 results of operations of the
Firm as they may have appeared, if the Bear Stearns merger and
the Washington Mutual transaction had been completed on
January 1, 2008.
Year ended December 31, (in millions, except per share data) 2008 Total net revenue $ 68,149 Loss before extraordinary gain (14,090) Net loss (12,184)
Net loss per common share data: Basic earnings per share Loss before extraordinary gain $ (4.26) Net loss (3.72)
Diluted earnings per share(a) Loss before extraordinary gain (4.26) Net loss (3.72) Average common shares issued and outstanding Basic 3,510.5 Diluted 3,510.5
(a) Common equivalent shares have been excluded from the pro forma compu-tation of diluted loss per share for the year ended December 31, 2008, as the effect would be antidilutive.
The unaudited pro forma combined financial information is pre-
sented for illustrative purposes only and does not indicate the
financial results of the combined company had the companies
actually been combined as of January 1, 2008, nor is it indicative
of the results of operations in future periods. Included in the
unaudited pro forma combined financial information for the year
ended December 31, 2008, were pro forma adjustments to reflect
the results of operations of Bear Stearns and Washington Mu-
tual’s banking operations, considering the purchase accounting,
valuation and accounting conformity adjustments. For the Wash-
ington Mutual transaction, the amortization of purchase account-
ing adjustments to report interest-earning assets acquired and
interest-bearing liabilities assumed at current interest rates is
reflected for the year ended December 31, 2008. Valuation
adjustments and the adjustment to conform allowance method-
ologies in the Washington Mutual transaction, and valuation and
accounting conformity adjustments related to the Bear Stearns
merger are reflected in the results for the year ended December
31, 2008.
Internal reorganization related to the Bear Stearns
merger
On June 30, 2008, JPMorgan Chase fully and unconditionally
guaranteed each series of outstanding preferred stock of Bear
Stearns, as well as all of Bear Stearns’ outstanding U.S. Securities
and Exchange Commission (“SEC”) registered U.S. debt securities
and obligations relating to trust preferred capital debt securities.
Subsequently, on July 15, 2008, JPMorgan Chase completed an
internal merger transaction, which resulted in each series of
outstanding preferred stock of Bear Stearns being automatically
exchanged into newly-issued shares of JPMorgan Chase preferred
stock having substantially identical terms. In addition, pursuant to
internal transactions in July 2008 and the first quarter of 2009,
JPMorgan Chase assumed or guaranteed the remaining out-
standing securities of Bear Stearns and its subsidiaries, in each
case in accordance with the indentures and other agreements
governing those securities. As discussed below, all of the above
series of preferred stock, and the depositary shares representing
such preferred stock, were redeemed on August 20, 2010.
Other business events
Redemption of Series E, F and G cumulative preferred
stock
On August 20, 2010, JPMorgan Chase redeemed at stated
redemption value, all outstanding shares of its Series E 6.15%
Cumulative Preferred Stock; Series F 5.72% Cumulative Preferred
Stock; and Series G 5.49% Cumulative Preferred Stock. For a
further discussion of preferred stock, see Note 23 on pages 267–
268 of this Annual Report.
RBS Sempra transaction
On July 1, 2010, JPMorgan Chase completed the acquisition of
RBS Sempra Commodities’ global oil, global metals and European
power and gas businesses. The Firm acquired approximately $1.7
billion of net assets which included $3.3 billion of debt which was
immediately repaid. This acquisition almost doubled the number
of clients the Firm’s commodities business can serve and will
enable the Firm to offer clients more products in more regions of
the world.
Purchase of remaining interest in J.P. Morgan Cazenove
On January 4, 2010, JPMorgan Chase purchased the remaining
interest in J.P. Morgan Cazenove, an investment banking busi-
ness partnership formed in 2005, which resulted in an adjustment
to the Firm’s capital surplus of approximately $1.3 billion.

Notes to consolidated financial statements
170 JPMorgan Chase & Co./2010 Annual Report
Termination of Chase Paymentech Solutions joint
venture
The dissolution of the Chase Paymentech Solutions joint venture,
a global payments and merchant acquiring joint venture between
JPMorgan Chase and First Data Corporation, was completed on
November 1, 2008. JPMorgan Chase retained approximately 51%
of the business, which it operates under the name Chase Pay-
mentech Solutions. The dissolution of the Chase Paymentech
Solutions joint venture was accounted for as a step acquisition in
accordance with U.S. GAAP for business combinations, and the
Firm recognized an after-tax gain of $627 million in the fourth
quarter of 2008 as a result of the dissolution. The gain represents
the amount by which the fair value of the net assets acquired
(predominantly intangible assets and goodwill) exceeded JPMor-
gan Chase’s carrying value in the net assets transferred to First
Data Corporation. Upon dissolution, the Firm consolidated the
retained Chase Paymentech Solutions business.
Proceeds from Visa Inc. shares
On March 19, 2008, Visa Inc. (“Visa”) completed its initial public
offering (“IPO”). Prior to the IPO, JPMorgan Chase held approxi-
mately a 13% equity interest in Visa. On March 28, 2008, Visa
used a portion of the proceeds from the offering to redeem a
portion of the Firm’s equity interest, which resulted in the recog-
nition of a pretax gain of $1.5 billion (recorded in other income).
In conjunction with the IPO, Visa placed $3.0 billion in escrow to
cover liabilities related to certain litigation matters. The escrow
was increased by $1.1 billion in 2008, $700 million in 2009 and
by $1.3 billion in 2010. Increases in Visa’s escrow account results
in a dilution of the value of the Firm’s ownership of Visa Inc.
JPMorgan Chase’s interest in the escrow was recorded as a
reduction of other expense and reported net to the extent of
established litigation reserves.
Purchase of remaining interest in Highbridge Capital
Management
In January 2008, JPMorgan Chase purchased an additional equity
interest in Highbridge Capital Management, LLC (“Highbridge”),
which resulted in the Firm owning 77.5% of Highbridge. In July
2009, JPMorgan Chase completed its purchase of the remaining
interest in Highbridge, which resulted in a $228 million adjustment
to capital surplus.
Note 3 – Fair value measurement
JPMorgan Chase carries a portion of its assets and liabilities at
fair value. The majority of such assets and liabilities are carried at
fair value on a recurring basis. Certain assets and liabilities are
carried at fair value on a nonrecurring basis, including held-for-
sale loans, which are accounted for at the lower of cost or fair
value and that are only subject to fair value adjustments under
certain circumstances.
The Firm has an established and well-documented process for
determining fair values. Fair value is defined as the price that
would be received to sell an asset or paid to transfer a liability
in an orderly transaction between market participants at the
measurement date. Fair value is based on quoted market prices,
where available. If listed prices or quotes are not available, fair
value is based on internally developed models that primarily
use, as inputs, market-based or independently sourced market
parameters, including but not limited to yield curves, interest
rates, volatilities, equity or debt prices, foreign exchange rates
and credit curves. In addition to market information, models
also incorporate transaction details, such as maturity of the
instrument. Valuation adjustments may be made to ensure that
financial instruments are recorded at fair value. These adjust-
ments include amounts to reflect counterparty credit quality,
the Firm’s creditworthiness, constraints on liquidity and unob-
servable parameters. Valuation adjustments are applied consis-
tently over time.
• Credit valuation adjustments (“CVA”) are necessary when the
market price (or parameter) is not indicative of the credit qual-
ity of the counterparty. As few classes of derivative contracts
are listed on an exchange, the majority of derivative positions
are valued using internally developed models that use as their
basis observable market parameters. An adjustment is neces-
sary to reflect the credit quality of each derivative counterparty
to arrive at fair value. The adjustment also takes into account
contractual factors designed to reduce the Firm’s credit expo-
sure to each counterparty, such as collateral and legal rights
of offset.
• Debit valuation adjustments (“DVA”) are necessary to reflect
the credit quality of the Firm in the valuation of liabilities
measured at fair value. The methodology to determine the ad-
justment is consistent with CVA and incorporates JPMorgan
Chase’s credit spread as observed through the credit default
swap market.

JPMorgan Chase & Co./2010 Annual Report 171
• Liquidity valuation adjustments are necessary when the Firm
may not be able to observe a recent market price for a fi-
nancial instrument that trades in inactive (or less active)
markets or to reflect the cost of exiting larger-than-normal
market-size risk positions (liquidity adjustments are not
taken for positions classified within level 1 of the fair value
hierarchy; see below). The Firm estimates the amount of un-
certainty in the initial valuation based on the degree of li-
quidity in the market in which the financial instrument
trades and makes liquidity adjustments to the carrying value
of the financial instrument. The Firm measures the liquidity
adjustment based on the following factors: (1) the amount
of time since the last relevant pricing point; (2) whether
there was an actual trade or relevant external quote; and (3)
the volatility of the principal risk component of the financial
instrument. Costs to exit larger-than-normal market-size risk
positions are determined based on the size of the adverse
market move that is likely to occur during the period re-
quired to bring a position down to a nonconcentrated level.
• Unobservable parameter valuation adjustments are necessary
when positions are valued using internally developed models
that use as their basis unobservable parameters – that is, pa-
rameters that must be estimated and are, therefore, subject to
management judgment. Such positions are normally traded
less actively. Examples include certain credit products where
parameters such as correlation and recovery rates are unob-
servable. Unobservable parameter valuation adjustments are
applied to mitigate the possibility of error and revision in the
estimate of the market price provided by the model.
The Firm has numerous controls in place intended to ensure that
its fair values are appropriate. An independent model review
group reviews the Firm’s valuation models and approves them for
use for specific products. All valuation models within the Firm are
subject to this review process. A price verification group, inde-
pendent from the risk-taking function, ensures observable market
prices and market-based parameters are used for valuation wher-
ever possible. For those products with material parameter risk for
which observable market levels do not exist, an independent
review of the assumptions made on pricing is performed. Addi-
tional review includes deconstruction of the model valuations for
certain structured instruments into their components and bench-
marking valuations, where possible, to similar products; validat-
ing valuation estimates through actual cash settlement; and
detailed review and explanation of recorded gains and losses,
which are analyzed daily and over time. Valuation adjustments,
which are also determined by the independent price verification
group, are based on established policies and applied consistently
over time. Any changes to the valuation methodology are re-
viewed by management to confirm that the changes are justified.
As markets and products develop and the pricing for certain
products becomes more or less transparent, the Firm continues to
refine its valuation methodologies. During 2010, no changes
were made to the Firm’s valuation models that had, or are ex-
pected to have, a material impact on the Firm’s Consolidated
Balance Sheets or results of operations.
The methods described above to estimate fair value may produce
a fair value calculation that may not be indicative of net realizable
value or reflective of future fair values. Furthermore, while the
Firm believes its valuation methods are appropriate and consis-
tent with other market participants, the use of different method-
ologies or assumptions to determine the fair value of certain
financial instruments could result in a different estimate of fair
value at the reporting date.
Valuation Hierarchy
A three-level valuation hierarchy has been established under U.S.
GAAP for disclosure of fair value measurements. The valuation
hierarchy is based on the transparency of inputs to the valuation
of an asset or liability as of the measurement date. The three
levels are defined as follows.
• Level 1 – inputs to the valuation methodology are quoted
prices (unadjusted) for identical assets or liabilities in active
markets.
• Level 2 – inputs to the valuation methodology include quoted
prices for similar assets and liabilities in active markets, and
inputs that are observable for the asset or liability, either di-
rectly or indirectly, for substantially the full term of the finan-
cial instrument.
• Level 3 – one or more inputs to the valuation methodology are
unobservable and significant to the fair value measurement.
A financial instrument’s categorization within the valuation
hierarchy is based on the lowest level of input that is significant
to the fair value measurement.
Following is a description of the valuation methodologies used by
the Firm to measure instruments at fair value, including the
general classification of such instruments pursuant to the valua-
tion hierarchy.
Assets
Securities purchased under resale agreements (“resale
agreements”) and securities borrowed
To estimate the fair value of resale agreements and securities
borrowed transactions, cash flows are first evaluated taking into
consideration any derivative features of the resale agreement and
are then discounted using the appropriate market rates for the
applicable maturity. As the inputs into the valuation are primarily
based on readily observable pricing information, such resale
agreements are classified within level 2 of the valuation hierarchy.
Loans and unfunded lending-related commitments
The majority of the Firm’s loans and lending-related commitments
are not carried at fair value on a recurring basis on the Consoli-
dated Balance Sheets, nor are they actively traded. The fair value
of such loans and lending-related commitments is included in the
additional disclosures of fair value of certain financial instruments
required by U.S. GAAP on pages 185–186 of this Note. Loans

Notes to consolidated financial statements
172 JPMorgan Chase & Co./2010 Annual Report
carried at fair value on a recurring and nonrecurring basis are
included in the applicable tables that follow.
Wholesale
There is no liquid secondary market for most loans and lending-
related commitments in the Firm's wholesale portfolio. In the
limited circumstances where direct secondary market information
– including pricing of actual market transactions, broker quota-
tions or quoted market prices for similar instruments – is available
(principally for loans in the Firm's secondary trading portfolio),
such information is used in the determination of fair value. For
the remainder of the portfolio, fair value is estimated using a
discounted cash flow (“DCF”) model. In addition to the character-
istics of the underlying loans (including principal, contractual
interest rate and contractual fees), key inputs to the model in-
clude interest rates, prepayment rates and credit spreads. The
credit spread input is derived from the cost of credit default
swaps (“CDS”) and, as a result, also incorporates the effects of
secondary market liquidity. As many of the Firm’s clients do not
have bonds traded with sufficient liquidity in the public markets
to have observable CDS spreads, the Firm principally develops
benchmark credit curves by industry and credit rating to estimate
fair value. Also incorporated into the valuation process are addi-
tional adjustments to account for the difference in loss severity
rates between bonds, on which the cost of credit derivatives is
based, and loans as well as loan equivalents (which represent the
portion of an unused commitment expected, based on the Firm's
average portfolio historical experience, to become outstanding
prior to an obligor default). Certain floating rate loans that are
not carried on the balance sheet at fair value are carried at
amounts that approximate fair value due to their short term
nature and negligible credit risk (e.g. based on historical experi-
ence or collateralization).
The Firm's loans and unfunded lending-related commitments
carried at fair value are classified within level 2 or 3 of the valua-
tion hierarchy, depending on the level of liquidity and activity in
the markets for a particular product.
Consumer
The only products in the Firm’s consumer loan portfolio with a
meaningful level of secondary market activity in the current
economic environment are certain conforming residential mort-
gages. These loans are classified as trading assets and carried at
fair value on the Consolidated Balance Sheets. They are predomi-
nantly classified within level 2 of the valuation hierarchy based on
the level of market liquidity and activity.
The fair value of the Firm’s other consumer loans (except for
credit card receivables) is generally determined by discounting the
loan principal and interest cash flows expected to be collected at
a market observable discount rate, when available. Portfolio-
specific factors that a market participant would consider in de-
termining fair value (e.g., expected lifetime credit losses, esti-
mated prepayments, servicing costs and market liquidity) are
either modeled into the cash flow projections or incorporated as
an adjustment to the discount rate. For products that continue to
be offered in the market, discount rates are derived from market-
observable primary origination rates. Where primary origination
rates are not available (i.e., subprime mortgages, subprime home
equity and option adjustable-rate mortgages (“option ARMs”))
the valuation is based on the Firm’s estimate of a market partici-
pant’s required return on equity for similar products (i.e., a hypo-
thetical origination spread). Estimated lifetime credit losses
consider expected and current default rates for existing portfolios,
collateral prices (where applicable) and expectations about
changes in the economic environment (e.g., unemployment
rates).
The fair value of credit card receivables is determined using a
discounted expected cash flow methodology. Key estimates and
assumptions include: projected interest income and late fee
revenue, funding, servicing, credit costs, and loan payment rates.
The projected loan payment rates are used to determine the
estimated life of the credit card loan receivables, which are then
discounted using a risk-appropriate discount rate. The discount
rate is derived from the Firm's estimate of a market participant's
expected return on credit card receivables. As the credit card
portfolio has a short-term life, an amount equal to the allowance
for loan losses is considered a reasonable proxy for the credit cost
component.
Loans that are not carried on the Consolidated Balance Sheets at
fair value are not classified within the fair value hierarchy.
Mortgage loans carried at fair value
For certain loans that are expected to be securitized, fair value is
estimated using a combination of observed transaction prices,
independent pricing services and relevant broker quotes. Consid-
eration is given to the nature of the quotes (e.g., indicative or
firm) and the relationship of recently evidenced market activity to
the prices provided from independent pricing services. When
relevant market activity is not occurring or is limited, fair value is
estimated by projecting the expected cash flows and discounting
those cash flows at a rate reflective of current market liquidity. To
estimate the projected cash flows of a residential mortgage loan
(inclusive of assumptions of prepayment, default rates and loss
severity), specific consideration is given to both borrower-specific
and other market factors, including, but not limited to: the bor-
rower’s FICO score; the type of collateral supporting the loans;
the level of documentation for the loan; and market-derived
expectations for home price appreciation or depreciation in the
respective geography of the borrower. For commercial mortgages,
consideration is given to both borrower-specific and other market
factors, including but not limited to: the borrower’s debt-to-
service coverage ratio; the type of commercial property (e.g.,
retail, office, lodging, multi-family, etc.); an estimate of the cur-
rent loan-to-value ratio; and market-derived expectations for
property price appreciation or depreciation in the respective
geographic location. In addition, commercial mortgage loans
typically have lock-out periods where the borrower is restricted
from prepaying the loan due to prepayment penalties. These
features reduce prepayment risk for commercial mortgages rela-

JPMorgan Chase & Co./2010 Annual Report 173
tive to that of residential mortgages. These loans are classified
within level 2 or 3 of the valuation hierarchy, depending on the
level of liquidity and activity in the markets for the particular
product.
Securities
Where quoted prices for identical securities are available in an
active market, securities are classified in level 1 of the valuation
hierarchy. Level 1 securities include highly liquid government
bonds; mortgage products for which there are quoted prices in
active markets such as U.S. government agency or U.S. govern-
ment-sponsored enterprise (collectively, “U.S. government agen-
cies”) markets; pass-through mortgage-backed securities
(“MBS”); and exchange-traded equities (e.g., common and
preferred stocks).
If quoted market prices are not available for the specific security,
the Firm may estimate the value of such instruments using a
combination of observed transaction prices, independent pricing
services and relevant broker quotes. Consideration is given to the
nature of the quotes (e.g., indicative or firm) and the relationship
of recently evidenced market activity to the prices provided from
independent pricing services. The Firm may also use pricing
models or discounted cash flows. The majority of such instru-
ments are classified within level 2 of the valuation hierarchy;
however, in cases where there is limited activity or less transpar-
ency around inputs to the valuation, securities are classified
within level 3 of the valuation hierarchy.
For mortgage-backed securities, where market activity is not
occurring or is limited, fair value is estimated considering the
value of the collateral and the specific attributes of the securities
held by the Firm. The value of the collateral pool supporting the
securities is analyzed using the same techniques and factors
described above for residential mortgage loans, albeit in a more
aggregated manner across the pool. For example, for residential
MBS, factors evaluated may include average FICO scores, average
delinquency rates, average loss severities and prepayment rates,
among other metrics. For commercial MBS, factors evaluated may
include average delinquencies, loan or geographic concentrations,
and average debt-service coverage ratios, among other metrics.
In addition, as each securitization vehicle distributes cash in a
manner or order that is predetermined at the inception of the
vehicle, the priority in which each particular MBS is allocated cash
flows, and the level of credit enhancement in place to support
those cash flows, are key considerations in deriving the value of
MBS. Finally, the risk premium that investors demand for securi-
tized products in the current market is factored into the valuation.
To benchmark its valuations, the Firm looks to transactions for
similar instruments and uses independent pricing provided by
third-party vendors, broker quotes and relevant market indices,
such as the ABX index, as applicable. While none of those
sources are solely indicative of fair value, they serve as directional
indicators for the appropriateness of the Firm’s estimates.
For certain collateralized mortgage and debt obligations, asset-
backed securities (“ABS”) and high-yield debt securities, the
determination of fair value may require benchmarking to similar
instruments or analyzing default and recovery rates. For cash
collateralized debt obligations (“CDOs”), external price infor-
mation is not available. Therefore, cash CDOs are valued using
market-standard models, such as Intex, to model the specific
collateral composition and cash flow structure of each deal; key
inputs to the model are market spread data for each credit
rating, collateral type and other relevant contractual features.
Asset-backed securities are valued based on external prices or
market spread data, using current market assumptions on
prepayments and defaults. For ABS where the external price
data is not observable or the limited available data is opaque,
the collateral performance is monitored and considered in the
valuation of the security. To benchmark its valuations, the Firm
looks to transactions for similar instruments and uses inde-
pendent prices provided by third-party vendors, broker quotes
and relevant market indices, such as the ABX index, as applica-
ble. While none of those sources are solely indicative of fair
value, they serve as directional indicators for the appropriate-
ness of the Firm’s estimates. The majority of collateralized
mortgage and debt obligations, high-yield debt securities and
ABS are currently classified in level 3 of the valuation hierarchy.
Collateralized loan obligations (“CLOs”) are securities backed by
corporate loans, and they are predominantly held in the Firm’s
available-for-sale (“AFS”) securities portfolio. For these securities,
external pricing information is not readily available. They are there-
fore valued using market-standard models to model the specific
collateral composition and cash flow structure of each deal; key
inputs to the model are market spread data for each credit rating,
collateral type and other relevant contractual features. For further
discussion, see Note 12 on pages 214–218 of this Annual Report.
Commodities
Commodities inventory is generally carried at the lower of cost or
fair value. The fair value of commodities inventory is determined
primarily using pricing and data derived from the markets on
which the commodities are traded. The majority of commodities
inventory is classified within level 1 of the valuation hierarchy.
The Firm also has positions in commodities-based derivatives that
can be traded on an exchange or over-the-counter (“OTC”) and
carried at fair value. The pricing inputs to these derivatives in-
clude forward curves of underlying commodities, basis curves,
volatilities, correlations, and occasionally other model parameters.
The valuation of these derivatives is based on calibrating to
market transactions, as well as to independent pricing informa-
tion from sources such as brokers and consensus pricing services.
Where inputs are historical time series data, they are adjusted for
uncertainty where appropriate. The majority of commodities-
based derivatives are classified within level 2 of the valuation
hierarchy.

Notes to consolidated financial statements
174 JPMorgan Chase & Co./2010 Annual Report
Derivatives
Exchange-traded derivatives valued using quoted prices are
classified within level 1 of the valuation hierarchy. However, few
classes of derivative contracts are listed on an exchange; thus, the
majority of the Firm’s derivative positions are valued using inter-
nally developed models that use as their basis readily observable
market parameters – that is, parameters that are actively quoted
and can be validated to external sources, including industry
pricing services. Depending on the types and contractual terms of
derivatives, fair value can be modeled using a series of tech-
niques, such as the Black-Scholes option pricing model, simula-
tion models or a combination of various models, which are
consistently applied. Where derivative products have been estab-
lished for some time, the Firm uses models that are widely ac-
cepted in the financial services industry. These models reflect the
contractual terms of the derivatives, including the period to
maturity, and market-based parameters such as interest rates,
volatility, and the credit quality of the counterparty. Further, many
of these models do not contain a high level of subjectivity, as the
methodologies used in the models do not require significant
judgment, and inputs to the models are readily observable from
actively quoted markets, as is the case for “plain vanilla” interest
rate swaps, option contracts and CDS. Such instruments are
generally classified within level 2 of the valuation hierarchy.
Derivatives that are valued based on models with significant
unobservable market parameters and that are normally traded
less actively, have trade activity that is one way, and/or are traded
in less-developed markets are classified within level 3 of the
valuation hierarchy. Level 3 derivatives include, for example, CDS
referenced to certain MBS, certain types of CDO transactions,
options on baskets of single-name stocks, and callable exotic
interest rate options.
Other complex products, such as those sensitive to correlation
between two or more underlying parameters, also fall within level
3 of the valuation hierarchy, and include structured credit deriva-
tives which are illiquid and non-standard in nature (e.g., synthetic
CDOs collateralized by a portfolio of credit default swaps “CDS”).
For most CDO transactions, while inputs such as CDS spreads
may be observable, the correlation between the underlying debt
instruments is unobservable. Correlation levels are modeled on a
transaction basis and calibrated to liquid benchmark tranche
indices. For all structured credit derivatives, actual transactions,
where available, are used regularly to recalibrate all unobservable
parameters.
Correlation sensitivity is also material to the overall valuation of
options on baskets of single-name stocks; the valuation of these
baskets is typically not observable due to their non-standardized
structuring. Correlation for products such as these is typically esti-
mated based on an observable basket of stocks and then adjusted
to reflect the differences between the underlying equities.
For callable exotic interest rate options, while most of the as-
sumptions in the valuation can be observed in active markets
(e.g., interest rates and volatility), the callable option transaction
flow is essentially one-way, and as such, price observability is
limited. As pricing information is limited, assumptions are based
on the dynamics of the underlying markets (e.g., the interest rate
markets) including the range and possible outcomes of the appli-
cable inputs. In addition, the models used are calibrated, as
relevant, to liquid benchmarks, and valuation is tested against
monthly independent pricing services and actual transactions.
Mortgage servicing rights and certain retained interests
in securitizations
Mortgage servicing rights (“MSRs”) and certain retained interests
from securitization activities do not trade in an active, open
market with readily observable prices. Accordingly, the Firm
estimates the fair value of MSRs and certain other retained inter-
ests in securitizations using DCF models.
• For MSRs, the Firm uses an option-adjusted spread (“OAS”)
valuation model in conjunction with the Firm’s proprietary
prepayment model to project MSR cash flows over multiple in-
terest rate scenarios; these scenarios are then discounted at
risk-adjusted rates to estimate the fair value of the MSRs. The
OAS model considers portfolio characteristics, contractually
specified servicing fees, prepayment assumptions, delinquency
rates, late charges, other ancillary revenue, costs to service
and other economic factors. The Firm reassesses and periodi-
cally adjusts the underlying inputs and assumptions used in
the OAS model to reflect market conditions and assumptions
that a market participant would consider in valuing the MSR
asset. Due to the nature of the valuation inputs, MSRs are
classified within level 3 of the valuation hierarchy.
• For certain retained interests in securitizations, the Firm esti-
mates the fair value for those retained interests by calculating
the present value of future expected cash flows using model-
ing techniques. Such models incorporate management's best
estimates of key variables, such as expected credit losses, pre-
payment speeds and the appropriate discount rates, consider-
ing the risk involved. Changes in the assumptions used may
have a significant impact on the Firm's valuation of retained
interests, and such interests are therefore typically classified
within level 3 of the valuation hierarchy.
For both MSRs and certain other retained interests in securitiza-
tions, the Firm compares its fair value estimates and assumptions
to observable market data where available and to recent market
activity and actual portfolio experience. For further discussion of
the most significant assumptions used to value retained interests
and MSRs, as well as the applicable stress tests for those assump-
tions, see Note 16 on pages 244–259, and Note 17 on pages
260–263 of this Annual Report.
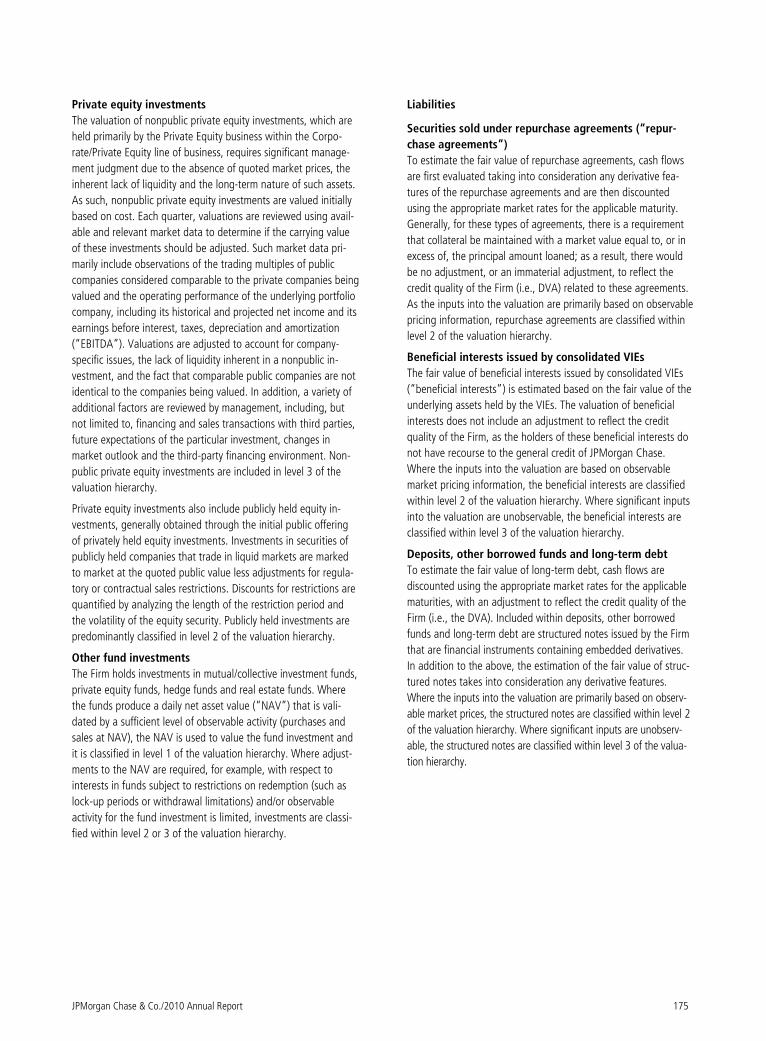
JPMorgan Chase & Co./2010 Annual Report 175
Private equity investments
The valuation of nonpublic private equity investments, which are
held primarily by the Private Equity business within the Corpo-
rate/Private Equity line of business, requires significant manage-
ment judgment due to the absence of quoted market prices, the
inherent lack of liquidity and the long-term nature of such assets.
As such, nonpublic private equity investments are valued initially
based on cost. Each quarter, valuations are reviewed using avail-
able and relevant market data to determine if the carrying value
of these investments should be adjusted. Such market data pri-
marily include observations of the trading multiples of public
companies considered comparable to the private companies being
valued and the operating performance of the underlying portfolio
company, including its historical and projected net income and its
earnings before interest, taxes, depreciation and amortization
(“EBITDA”). Valuations are adjusted to account for company-
specific issues, the lack of liquidity inherent in a nonpublic in-
vestment, and the fact that comparable public companies are not
identical to the companies being valued. In addition, a variety of
additional factors are reviewed by management, including, but
not limited to, financing and sales transactions with third parties,
future expectations of the particular investment, changes in
market outlook and the third-party financing environment. Non-
public private equity investments are included in level 3 of the
valuation hierarchy.
Private equity investments also include publicly held equity in-
vestments, generally obtained through the initial public offering
of privately held equity investments. Investments in securities of
publicly held companies that trade in liquid markets are marked
to market at the quoted public value less adjustments for regula-
tory or contractual sales restrictions. Discounts for restrictions are
quantified by analyzing the length of the restriction period and
the volatility of the equity security. Publicly held investments are
predominantly classified in level 2 of the valuation hierarchy.
Other fund investments
The Firm holds investments in mutual/collective investment funds,
private equity funds, hedge funds and real estate funds. Where
the funds produce a daily net asset value (“NAV”) that is vali-
dated by a sufficient level of observable activity (purchases and
sales at NAV), the NAV is used to value the fund investment and
it is classified in level 1 of the valuation hierarchy. Where adjust-
ments to the NAV are required, for example, with respect to
interests in funds subject to restrictions on redemption (such as
lock-up periods or withdrawal limitations) and/or observable
activity for the fund investment is limited, investments are classi-
fied within level 2 or 3 of the valuation hierarchy.
Liabilities
Securities sold under repurchase agreements (“repur-
chase agreements”)
To estimate the fair value of repurchase agreements, cash flows
are first evaluated taking into consideration any derivative fea-
tures of the repurchase agreements and are then discounted
using the appropriate market rates for the applicable maturity.
Generally, for these types of agreements, there is a requirement
that collateral be maintained with a market value equal to, or in
excess of, the principal amount loaned; as a result, there would
be no adjustment, or an immaterial adjustment, to reflect the
credit quality of the Firm (i.e., DVA) related to these agreements.
As the inputs into the valuation are primarily based on observable
pricing information, repurchase agreements are classified within
level 2 of the valuation hierarchy.
Beneficial interests issued by consolidated VIEs
The fair value of beneficial interests issued by consolidated VIEs
(“beneficial interests”) is estimated based on the fair value of the
underlying assets held by the VIEs. The valuation of beneficial
interests does not include an adjustment to reflect the credit
quality of the Firm, as the holders of these beneficial interests do
not have recourse to the general credit of JPMorgan Chase.
Where the inputs into the valuation are based on observable
market pricing information, the beneficial interests are classified
within level 2 of the valuation hierarchy. Where significant inputs
into the valuation are unobservable, the beneficial interests are
classified within level 3 of the valuation hierarchy.
Deposits, other borrowed funds and long-term debt
To estimate the fair value of long-term debt, cash flows are
discounted using the appropriate market rates for the applicable
maturities, with an adjustment to reflect the credit quality of the
Firm (i.e., the DVA). Included within deposits, other borrowed
funds and long-term debt are structured notes issued by the Firm
that are financial instruments containing embedded derivatives.
In addition to the above, the estimation of the fair value of struc-
tured notes takes into consideration any derivative features.
Where the inputs into the valuation are primarily based on observ-
able market prices, the structured notes are classified within level 2
of the valuation hierarchy. Where significant inputs are unobserv-
able, the structured notes are classified within level 3 of the valua-
tion hierarchy.

Notes to consolidated financial statements
176 JPMorgan Chase & Co./2010 Annual Report
The following tables present assets and liabilities measured at fair value as of December 31, 2010 and 2009, by major product category and by
the fair value hierarchy (as described above).
Assets and liabilities measured at fair value on a recurring basis
Fair value hierarchy
December 31, 2010 (in millions) Level 1(i) Level 2(i) Level 3(i) Netting
adjustments Total
fair value Federal funds sold and securities purchased under resale
agreements $ — $ 20,299 $ — $ — $ 20,299 Securities borrowed — 13,961 — — 13,961
Trading assets: Debt instruments:
Mortgage-backed securities:
U.S. government agencies(a) 36,813 10,738 174 — 47,725 Residential – nonagency — 2,807 687 — 3,494 Commercial – nonagency — 1,093 2,069 — 3,162
Total mortgage-backed securities 36,813 14,638 2,930 — 54,381
U.S. Treasury and government agencies(a) 12,863 9,026 — — 21,889 Obligations of U.S. states and municipalities — 11,715 2,257 — 13,972 Certificates of deposit, bankers’ acceptances and commercial paper — 3,248 — — 3,248 Non-U.S. government debt securities 31,127 38,482 697 — 70,306 Corporate debt securities — 42,280 4,946 — 47,226
Loans(b) — 21,736 13,144 — 34,880 Asset-backed securities — 2,743 7,965 — 10,708
Total debt instruments 80,803 143,868 31,939 — 256,610 Equity securities 124,400 3,153 1,685 — 129,238
Physical commodities(c) 18,327 2,708 — — 21,035 Other — 2,275 253 — 2,528
Total debt and equity instruments(d) 223,530 152,004 33,877 — 409,411 Derivative receivables:
Interest rate 2,278 1,120,282 5,422 (1,095,427) 32,555
Credit(e) — 111,827 17,902 (122,004) 7,725 Foreign exchange 1,121 163,114 4,236 (142,613) 25,858 Equity 30 38,041 5,562 (39,429) 4,204 Commodity 1,324 56,076 2,197 (49,458) 10,139
Total derivative receivables(f) 4,753 1,489,340 35,319 (1,448,931) 80,481 Total trading assets 228,283 1,641,344 69,196 (1,448,931) 489,892 Available-for-sale securities: Mortgage-backed securities:
U.S. government agencies(a) 104,736 15,490 — — 120,226 Residential – nonagency — 48,969 5 — 48,974 Commercial – nonagency — 5,403 251 — 5,654
Total mortgage-backed securities 104,736 69,862 256 — 174,854
U.S. Treasury and government agencies(a) 522 10,826 — — 11,348 Obligations of U.S. states and municipalities 31 11,272 256 — 11,559 Certificates of deposit 6 3,641 — — 3,647 Non-U.S. government debt securities 13,107 7,670 — — 20,777 Corporate debt securities 1 61,793 — — 61,794 Asset-backed securities:
Credit card receivables — 7,608 — — 7,608 Collateralized loan obligations — 128 13,470 — 13,598 Other — 8,777 305 — 9,082
Equity securities 1,998 53 — — 2,051 Total available-for-sale securities 120,401 181,630 14,287 — 316,318 Loans — 510 1,466 — 1,976 Mortgage servicing rights — — 13,649 — 13,649
Other assets:
Private equity investments(g) 49 826 7,862 — 8,737 All other 5,093 192 4,179 — 9,464
Total other assets 5,142 1,018 12,041 — 18,201 Total assets measured at fair value on a recurring
basis(h) $ 353,826 $1,858,762 $ 110,639 $ (1,448,931) $ 874,296
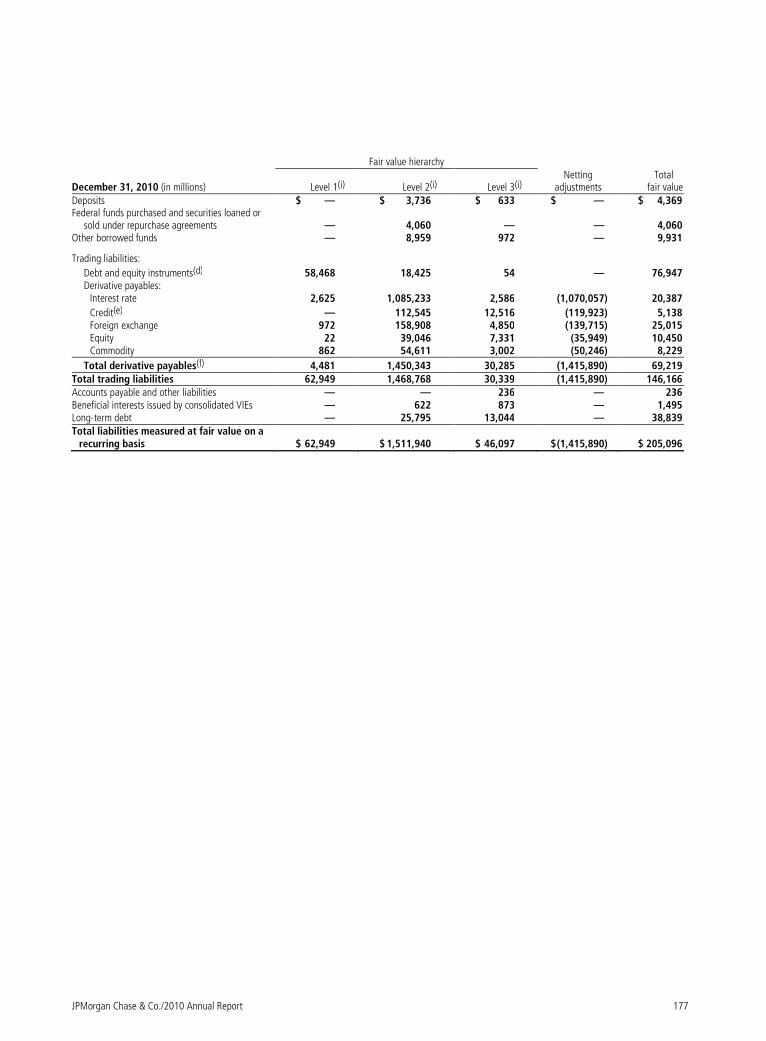
JPMorgan Chase & Co./2010 Annual Report 177
Fair value hierarchy
December 31, 2010 (in millions) Level 1(i) Level 2(i) Level 3(i) Netting
adjustments Total
fair value Deposits $ — $ 3,736 $ 633 $ — $ 4,369 Federal funds purchased and securities loaned or
sold under repurchase agreements — 4,060 — — 4,060 Other borrowed funds — 8,959 972 — 9,931
Trading liabilities:
Debt and equity instruments(d) 58,468 18,425 54 — 76,947 Derivative payables:
Interest rate 2,625 1,085,233 2,586 (1,070,057) 20,387
Credit(e) — 112,545 12,516 (119,923) 5,138 Foreign exchange 972 158,908 4,850 (139,715) 25,015 Equity 22 39,046 7,331 (35,949) 10,450 Commodity 862 54,611 3,002 (50,246) 8,229
Total derivative payables(f) 4,481 1,450,343 30,285 (1,415,890) 69,219 Total trading liabilities 62,949 1,468,768 30,339 (1,415,890) 146,166 Accounts payable and other liabilities — — 236 — 236 Beneficial interests issued by consolidated VIEs — 622 873 — 1,495 Long-term debt — 25,795 13,044 — 38,839 Total liabilities measured at fair value on a
recurring basis $ 62,949 $ 1,511,940 $ 46,097 $ (1,415,890) $ 205,096

Notes to consolidated financial statements
178 JPMorgan Chase & Co./2010 Annual Report
Fair value hierarchy
December 31, 2009 (in millions) Level 1 Level 2 Level 3 Netting
adjustments Total
fair value Federal funds sold and securities purchased under resale
agreements $ — $ 20,536 $ — $ — $ 20,536 Securities borrowed — 7,032 — — 7,032
Trading assets: Debt instruments:
Mortgage-backed securities:
U.S. government agencies(a) 33,092 8,373 260 — 41,725 Residential – nonagency — 2,284 1,115 — 3,399 Commercial – nonagency — 537 1,770 — 2,307
Total mortgage-backed securities 33,092 11,194 3,145 — 47,431
U.S. Treasury and government agencies(a) 13,701 9,559 — — 23,260 Obligations of U.S. states and municipalities — 5,681 1,971 — 7,652 Certificates of deposit, bankers’ acceptances and commercial paper — 5,419 — — 5,419 Non-U.S. government debt securities 25,684 32,487 734 — 58,905 Corporate debt securities — 48,754 5,241 — 53,995
Loans(b) — 18,330 13,218 — 31,548 Asset-backed securities — 1,428 7,975 — 9,403
Total debt instruments 72,477 132,852 32,284 — 237,613 Equity securities 75,053 3,450 1,956 — 80,459
Physical commodities(c) 9,450 586 — — 10,036 Other — 1,884 926 — 2,810
Total debt and equity instruments(d) 156,980 138,772 35,166 — 330,918
Derivative receivables(e)(f) 2,344 1,516,490 46,684 (1,485,308) 80,210 Total trading assets 159,324 1,655,262 81,850 (1,485,308) 411,128 Available-for-sale securities
:
Mortgage-backed securities:
U.S. government agencies(a) 158,957 8,941 — — 167,898 Residential – nonagency — 14,773 25 — 14,798 Commercial – nonagency — 4,590 — — 4,590 Total mortgage-backed securities 158,957 28,304 25 — 187,286
U.S. Treasury and government agencies(a) 405 29,592 — — 29,997 Obligations of U.S. states and municipalities — 6,188 349 — 6,537 Certificates of deposit — 2,650 — — 2,650 Non-U.S. government debt securities 5,506 18,997 — — 24,503 Corporate debt securities 1 62,007 — — 62,008 Asset-backed securities:
Credit card receivables — 25,742 — — 25,742 Collateralized debt and loan obligations — 5 12,144 — 12,149 Other — 6,206 588 — 6,794
Equity securities 2,466 146 87 — 2,699 Total available-for-sale securities 167,335 179,837 13,193 — 360,365 Loans — 374 990 — 1,364 Mortgage servicing rights — — 15,531 — 15,531
Other assets:
Private equity investments(g) 165 597 6,563 — 7,325
All other(j) 7,241 90 9,521 — 16,852 Total other assets 7,406 687 16,084 — 24,177 Total assets measured at fair value on a recurring
basis(h) $ 334,065 $ 1,863,728 $ 127,648 $ (1,485,308) $ 840,133

JPMorgan Chase & Co./2010 Annual Report 179
Fair value hierarchy
December 31, 2009 (in millions) Level 1 Level 2 Level 3 Netting
adjustments Total fair value
Deposits $ — $ 3,979 $ 476 $ — $ 4,455Federal funds purchased and securities loaned or
sold under repurchase agreements — 3,396 — — 3,396Other borrowed funds — 5,095 542 — 5,637
Trading liabilities:
Debt and equity instruments(d) 50,577 14,359 10 — 64,946
Derivative payables(e)(f) 2,038 1,481,813 35,332 (1,459,058) 60,125Total trading liabilities 52,615 1,496,172 35,342 (1,459,058) 125,071Accounts payable and other liabilities — 2 355 — 357Beneficial interests issued by consolidated VIEs — 785 625 — 1,410Long-term debt — 30,685 18,287 — 48,972Total liabilities measured at fair value on a
recurring basis $ 52,615 $ 1,540,114 $ 55,627 $ (1,459,058) $ 189,298 (a) At December 31, 2010 and 2009, included total U.S. government-sponsored enterprise obligations of $137.3 billion and $195.8 billion respectively, which were
predominantly mortgage-related. (b) At December 31, 2010 and 2009, included within trading loans were $22.7 billion and $20.7 billion, respectively, of residential first-lien mortgages and $2.6 billion and
$2.7 billion, respectively, of commercial first-lien mortgages. Residential mortgage loans include conforming mortgage loans originated with the intent to sell to U.S. government agencies of $13.1 billion and $11.1 billion, respectively, and reverse mortgages of $4.0 billion and $4.5 billion, respectively.
(c) Physical commodities inventories are generally accounted for at the lower of cost or fair value. (d) Balances reflect the reduction of securities owned (long positions) by the amount of securities sold but not yet purchased (short positions) when the long and short
positions have identical Committee on Uniform Security Identification Procedures (“CUSIPs”). (e) The level 3 amounts for derivative receivables and derivative payables related to credit primarily include structured credit derivative instruments. For further information
on the classification of instruments within the valuation hierarchy, see pages 171–175 of this Note. (f) As permitted under U.S. GAAP, the Firm has elected to net derivative receivables and derivative payables and the related cash collateral received and paid when a
legally enforceable master netting agreement exists. For purposes of the tables above, the Firm does not reduce derivative receivables and derivative payables balances for this netting adjustment, either within or across the levels of the fair value hierarchy, as such netting is not relevant to a presentation based on the transparency of inputs to the valuation of an asset or liability. Therefore, the balances reported in the fair value hierarchy table above are gross of any counterparty netting adjustments. However, if the Firm were to net such balances within level 3, the reduction in the level 3 derivative receivable and derivative payable balances would be $12.7 billion and $16.0 billion at December 31, 2010 and 2009, respectively, exclusive of the netting benefit associated with cash collateral, which would further reduce the level 3 balances.
(g) Private equity instruments represent investments within the Corporate/Private Equity line of business. The cost basis of the private equity investment portfolio totaled $10.0 billion and $8.8 billion at December 31, 2010 and 2009, respectively.
(h) At December 31, 2010 and 2009, balances included investments valued at net asset value of $12.1 billion and $16.8 billion, respectively, of which $5.9 billion and $9.0 billion, respectively, were classified in level 1, $2.0 billion and $3.2 billion, respectively, in level 2 and $4.2 billion and $4.6 billion in level 3.
(i) For the year ended December 31, 2010, there were no significant transfers between levels 1 and 2. Transfers from level 3 into level 2 included $1.2 billion of trading loans due to increased price transparency. There were no significant transfers into level 3.
(j) Included assets within accrued interest receivable and other assets at December 31, 2009.
Changes in level 3 recurring fair value measurements
The following tables include a rollforward of the balance sheet
amounts (including changes in fair value) for financial instruments
classified by the Firm within level 3 of the fair value hierarchy for
the years ended December 31, 2010, 2009 and 2008. When a
determination is made to classify a financial instrument within level
3, the determination is based on the significance of the unobserv-
able parameters to the overall fair value measurement. However,
level 3 financial instruments typically include, in addition to the
unobservable or level 3 components, observable components (that
is, components that are actively quoted and can be validated to
external sources); accordingly, the gains and losses in the table
below include changes in fair value due in part to observable fac-
tors that are part of the valuation methodology. Also, the Firm risk-
manages the observable components of level 3 financial instru-
ments using securities and derivative positions that are classified
within level 1 or 2 of the fair value hierarchy; as these level 1 and
level 2 risk management instruments are not included below, the
gains or losses in the following tables do not reflect the effect of
the Firm’s risk management activities related to such level 3 in-
struments.

Notes to consolidated financial statements
180 JPMorgan Chase & Co./2010 Annual Report
Fair value measurements using significant unobservable inputs
Year ended December 31, 2010 (in millions)
Fair value at January 1, 2010
Total realized/
unrealized gains/(losses)
Purchases, issuances
settlements, net
Transfers into and/or
out of
level 3(e)
Fair value at December 31,
2010
Change in unrealized
gains/(losses) related to financial instruments held at December 31, 2010
Assets: Trading assets: Debt instruments: Mortgage-backed securities: U.S. government agencies $ 260 $ 24 $ (107) $ (3) $ 174 $ (31 ) Residential – nonagency 1,115 178 (564) (42) 687 110 Commercial – nonagency 1,770 230 (33) 102 2,069 130 Total mortgage-backed
securities 3,145 432 (704) 57 2,930 209 Obligations of U.S. states and
municipalities 1,971 2 142 142 2,257 (30 ) Non-U.S. government debt securities 734 (132) 140 (45) 697 (105 ) Corporate debt securities 5,241 (325) 115 (85) 4,946 28 Loans 13,218 (40) 1,296 (1,330) 13,144 (385 ) Asset-backed securities 7,975 333 (354) 11 7,965 292 Total debt instruments 32,284 270 635 (1,250) 31,939 9 Equity securities 1,956 133 (351) (53) 1,685 199 Other 926 10 (762) 79 253 98 Total debt and equity
instruments 35,166 413(a) (478) (1,224) 33,877 306 (a) Net derivative receivables: Interest rate 2,040 3,057 (2,520) 259 2,836 487 Credit 10,350 (1,757) (3,102) (105) 5,386 (1,048 ) Foreign exchange 1,082 (913) (434) (349) (614) (464 ) Equity (1,791) 7 (121) 136 (1,769) (11 ) Commodity (329) (700) 134 90 (805) (76 )
Total net derivative receivables 11,352 (306)(a) (6,043) 31 5,034 (1,112 )(a)
Available-for-sale securities: Asset-backed securities 12,732 (146) 1,189 — 13,775 (129 ) Other 461 (49) 37 63 512 18 Total available-for-sale
securities 13,193 (195)(b) 1,226 63 14,287 (111 )(b)
Loans 990 145(a) 323 8 1,466 37 (a)
Mortgage servicing rights 15,531 (2,268)(c) 386 — 13,649 (2,268 )(c)
Other assets:
Private equity investments 6,563 1,038(a) 715 (454) 7,862 688 (a)
All other 9,521 (113)(d) (5,132) (97) 4,179 37 (d)
Fair value measurements using significant unobservable inputs
Year ended December 31, 2010 (in millions)
Fair value at January 1, 2010
Total realized/
unrealized (gains)/losses
Purchases, issuances
settlements, net
Transfers into and/or
out of
level 3(e)
Fair value at December 31,
2010
Change in unrealized
(gains)/losses related to financial instruments held at December 31, 2010
Liabilities(f):
Deposits $ 476 $ 54(a) $ (226) $ 329 $ 633 $ (77 )(a)
Other borrowed funds 542 (123)(a) 795 (242) 972 445 (a)
Trading liabilities:
Debt and equity instruments 10 2(a) 19 23 54 — (a)
Accounts payable and other liabilities 355 (138)(d) 19 — 236 37 (d)
Beneficial interests issued by consolidated VIEs 625 (7)(a) 87 168 873 (76 )(a)
Long-term debt 18,287 (532)(a) (4,796) 85 13,044 662 (a)

JPMorgan Chase & Co./2010 Annual Report 181
Fair value measurements using significant unobservable inputs
Year ended December 31, 2009 (in millions)
Fair value, January 1, 2009
Total realized/
unrealized gains/(losses)
Purchases, issuances
settlements, net
Transfers into and/or
out of
level 3(e)
Fair value, December 31,
2009
Change in unrealized
gains/(losses) related to financial instruments held at December 31, 2009
Assets: Trading assets: Debt instruments: Mortgage-backed securities: U.S. government agencies $ 163 $ (38) $ 62 $ 73 $ 260 $ (38 ) Residential – nonagency 3,339 (782) (245) (1,197) 1,115 (871 ) Commercial – nonagency 2,487 (242) (325) (150) 1,770 (313 ) Total mortgage-backed
securities 5,989 (1,062) (508) (1,274) 3,145 (1,222 ) Obligations of U.S. states and
municipalities 2,641 (22) (648) — 1,971 (123 ) Non-U.S. government debt securities 707 38 (75) 64 734 34 Corporate debt securities 5,280 38 (3,416) 3,339 5,241 (72 ) Loans 17,091 (871) (3,497) 495 13,218 (1,167 ) Asset-backed securities 7,106 1,436 (378) (189) 7,975 734 Total debt instruments 38,814 (443) (8,522) 2,435 32,284 (1,816 ) Equity securities 1,380 (149) (512) 1,237 1,956 (51 ) Other 1,226 (79) (253) 32 926 (119 ) Total debt and equity
instruments 41,420 (671)(a) (9,287) 3,704 35,166 (1,986 )(a)
Total net derivative receivables 9,507 (11,406)(a) (3,448) 16,699 11,352 (10,835 )(a) Available-for-sale securities: Asset-backed securities 11,447 (2) 1,112 175 12,732 (48 ) Other 944 (269) 302 (516) 461 43 Total available-for-sale
securities 12,391 (271)(b) 1,414 (341) 13,193 (5 )(b)
Loans 2,667 (448)(a) (1,906) 677 990 (488 )(a)
Mortgage servicing rights 9,403 5,807(c) 321 — 15,531 5,807 (c)
Other assets:
Private equity investments 6,369 (407)(a) 582 19 6,563 (369 )(a)
All other(g) 8,114 (676)(d) 2,439 (356) 9,521 (612 )(d)
Fair value measurements using significant unobservable inputs
Year ended December 31, 2009 (in millions)
Fair value at January 1, 2009
Total realized/
unrealized (gains)/losses
Purchases, issuances
settlements, net
Transfers into and/or
out of
level 3(e)
Fair value at December 31,
2009
Change in unrealized
(gains)/losses related to financial instruments held at December 31, 2009
Liabilities(f):
Deposits $ 1,235 $ 47(a) $ (870) $ 64 $ 476 $ (36)(a)
Other borrowed funds 101 (73)(a) 621 (107) 542 9(a)
Trading liabilities:
Debt and equity instruments 288 64(a) (339) (3) 10 12(a)
Accounts payable and other liabilities — (55)(a) 410 — 355 (29)(a)
Beneficial interests issued by consolidated VIEs — 344(a) (598) 879 625 327(a)
Long-term debt 16,548 1,367(a) (2,738) 3,110 18,287 1,728(a)

Notes to consolidated financial statements
182 JPMorgan Chase & Co./2010 Annual Report
Fair value measurements using significant unobservable inputs
Year ended December 31, 2008 (in millions)
Fair value at January 1, 2008
Total realized/
unrealized gains/(losses)
Purchases, issuances
settlements, net
Transfers into and/or
out of
level 3(e)
Fair value at December 31,
2008
Change in unrealized
gains/(losses) related to financial instruments held at December 31, 2008
Assets: Trading assets:
Debt and equity instruments $ 24,066 $(12,805)(a) $ 6,201 $ 23,958 $ 41,420 $ (9,860 )(a)
Total net derivative receivables 633 4,556(a) 2,290 2,028 9,507 1,814 (a)
Available-for-sale securities 101 (1,232)(b) 3,772 9,750 12,391 (422 )(b)
Loans 8,380 (1,547)(a) 12 (4,178) 2,667 (1,324 )(a)
Mortgage servicing rights 8,632 (6,933)(c) 7,704 — 9,403 (6,933 )(c) Other assets:
Private equity investments 6,763 (638)(a) 320 (76) 6,369 (1,089 )(a)
All other(g) 5,978 (940)(d) 2,787 289 8,114 (753 )(d)
Fair value measurements using significant unobservable inputs
Year ended December 31, 2008 (in millions)
Fair value at January 1, 2008
Total realized/
unrealized (gains)/losses
Purchases, issuances
settlements, net
Transfers into and/or
out of
level 3(e)
Fair value at December 31,
2008
Change in unrealized
(gains)/losses related to financial instruments held at December 31, 2008
Liabilities(f):
Deposits $ 1,161 $ (57)(a) $ 79 $ 52 $ 1,235 $ (69)(a)
Other borrowed funds 105 (7)(a) 53 (50) 101 (24)(a) Trading liabilities:
Debt and equity instruments 480 (73)(a) (33) (86) 288 (125)(a)
Accounts payable and other liabilities 25 (25)(a) — — — —Beneficial interests issued by
consolidated VIEs 82 (24)(a) (603) 545 — —
Long-term debt 21,938 (4,502)(a) (1,717) 829 16,548 (3,682)(a)
(a) Predominantly reported in principal transactions revenue, except for changes in fair value for Retail Financial Services mortgage loans originated with the intent to sell, which are reported in mortgage fees and related income.
(b) Realized gains and losses on available-for-sale securities, as well as other-than-temporary impairment losses that are recorded in earnings, are reported in securities gains. Unrealized gains and losses are reported in other comprehensive income.
(c) Changes in fair value for Retail Financial Services mortgage servicing rights are reported in mortgage fees and related income. (d) Predominantly reported in other income. (e) All transfers into and/or out of level 3 are assumed to occur at the beginning of the reporting period. (f) Level 3 liabilities as a percentage of total Firm liabilities accounted for at fair value (including liabilities measured at fair value on a nonrecurring basis) were 22%, 29% and
25% at December 31, 2010, 2009 and 2008, respectively. (g) Includes certain assets that are classified within accrued interest receivable and other assets on the Consolidated Balance Sheet at December 31, 2009 and 2008.
Assets and liabilities measured at fair value on a nonrecurring basis
Certain assets, liabilities and unfunded lending-related commitments are measured at fair value on a nonrecurring basis; that is, they are not meas-
ured at fair value on an ongoing basis but instead are subject to fair value adjustments only in certain circumstances (for example, when there is
evidence of impairment). The following tables present the assets and liabilities carried on the Consolidated Balance Sheets by caption and level
within the valuation hierarchy (as described above) as of December 31, 2010 and 2009, for which a nonrecurring change in fair value has been
recorded during the reporting period.
Fair value hierarchy
December 31, 2010 (in millions) Level 1(d) Level 2(d) Level 3(d) Total fair value
Loans retained(a) $ — $ 5,484 $ 690 $ 6,174
Loans held-for-sale(b) — 312 3,200 3,512 Total loans — 5,796 3,890 9,686
Other real estate owned — 78 311 389 Other assets — — 2 2 Total other assets — 78 313 391 Total assets at fair value on a nonrecurring basis $ — $ 5,874 $ 4,203 $ 10,077
Accounts payable and other liabilities(c) $ — $ 53 $ 18 $ 71 Total liabilities at fair value on a nonrecurring basis $ — $ 53 $ 18 $ 71

JPMorgan Chase & Co./2010 Annual Report 183
Fair value hierarchy December 31, 2009 (in millions) Level 1 Level 2 Level 3 Total fair value
Loans retained(a) $ — $ 4,544 $ 1,137 $ 5,681
Loans held-for-sale(b) — 601 1,029 1,630Total loans — 5,145 2,166 7,311
Other real estate owned — 307 387 694Other assets — — 184 184Total other assets — 307 571 878Total assets at fair value on a nonrecurring basis $ — $ 5,452 $ 2,737 $ 8,189
Accounts payable and other liabilities(c) $ — $ 87 $ 39 $ 126Total liabilities at fair value on a nonrecurring basis $ — $ 87 $ 39 $ 126
(a) Reflects mortgage, home equity and other loans where the carrying value is based on the fair value of the underlying collateral. (b) Predominantly includes credit card loans at December 31, 2010. Predominantly includes leveraged lending loans at December 31, 2009. Loans held-for-sale are carried
on the Consolidated Balance Sheets at the lower of cost or fair value. (c) Represents, at December 31, 2010 and 2009, fair value adjustments associated with $517 million and $648 million, respectively, of unfunded held-for-sale lending-
related commitments within the leveraged lending portfolio. (d) In the year ended December 31, 2010, transfers between levels 1, 2 and 3 were not significant.
The method used to estimate the fair value of impaired collateral-
dependent loans, and other loans where the carrying value is
based on the fair value of the underlying collateral (e.g., residential
mortgage loans charged off in accordance with regulatory guid-
ance), depends on the type of collateral (e.g., securities, real
estate, nonfinancial assets) underlying the loan. Fair value of the
collateral is estimated based on quoted market prices, broker
quotes or independent appraisals, or by using a DCF model. For
further information, see Note 15 on pages 239–243 of this Annual
Report.
Nonrecurring fair value changes
The following table presents the total change in value of assets
and liabilities for which a fair value adjustment has been included
in the Consolidated Statements of Income for the years ended
December 31, 2010, 2009 and 2008, related to financial instru-
ments held at those dates.
Year ended December 31, (in millions) 2010 2009 2008 Loans retained $ (3,413) $ (3,550) $ (1,159) Loans held-for-sale 29 (389) (2,728) Total loans (3,384) (3,939) (3,887)
Other assets 25 (104) (685) Accounts payable and
other liabilities 6 31 (285) Total nonrecurring fair
value gains/(losses) $ (3,353) $ (4,012) $ (4,857)
In the above table, loans predominantly include: (1) mortgage, home
equity, and other loans where changes in the carrying value are
based on the fair value of the underlying collateral; and (2) the
change in fair value for leveraged lending loans carried on the Con-
solidated Balance Sheets at the lower of cost or fair value. Accounts
payable and other liabilities predominantly include the change in fair
value for unfunded lending-related commitments within the lever-
aged lending portfolio.
Level 3 analysis
Level 3 assets at December 31, 2010, predominantly include deriva-
tive receivables, mortgage servicing rights (“MSRs”), collateralized
loan obligations (“CLOs”) held within the available-for-sale securities
portfolio, trading loans, asset-backed trading securities and private
equity investments.
• Derivative receivables included $35.3 billion of interest rate,
credit, foreign exchange, equity and commodity contracts classi-
fied within level 3 at December 31, 2010. Included within this
balance was $11.6 billion of structured credit derivatives with
corporate debt underlying. In assessing the Firm’s risk exposure to
structured credit derivatives, the Firm believes consideration
should also be given to derivative liabilities with similar, and
therefore offsetting, risk profiles. At December 31, 2010, $5.6
billion of level 3 derivative liabilities had risk characteristics similar
to those of the derivative receivable assets classified in level 3.
• Mortgage servicing rights represent the fair value of future cash
flows for performing specified mortgage servicing activities for
others (predominantly with respect to residential mortgage loans).
For a further description of the MSR asset, interest rate risk man-
agement and the valuation methodology used for MSRs, including
valuation assumptions and sensitivities, see Note 17 on pages
260–263 of this Annual Report.
• CLOs totaling $13.5 billion were securities backed by corporate
loans held in the Firm’s AFS securities portfolio. Substantially all of
these securities are rated “AAA,” “AA” and “A” and had an av-
erage credit enhancement of 30%. Credit enhancement in CLOs is
primarily in the form of subordination, which is a form of struc-
tural credit enhancement where realized losses associated with
assets held by an issuing vehicle are allocated to issued tranches
considering their relative seniority. For further discussion, see Note
12 on pages 214–218 of this Annual Report.
• Trading loans totaling $13.1 billion included $4.4 billion of nona-
gency residential mortgage whole loans and commercial mort-
gage loans held in IB for which there is limited price transparency;
and $4.0 billion of reverse mortgages for which the principal risk
sensitivities are mortality risk and home prices. The fair value of
Notes to consolidated financial statements
184 JPMorgan Chase & Co./2010 Annual Report
the commercial and residential mortgage loans is estimated by
projecting expected cash flows, considering relevant borrower-
specific and market factors, and discounting those cash flows at
a rate reflecting current market liquidity. Loans are partially
hedged by level 2 instruments, including credit default swaps
and interest rate derivatives, which are observable and liquid.
Consolidated Balance Sheets changes
Level 3 assets (including assets measured at fair value on a nonrecur-
ring basis) were 5% of total Firm assets at December 31, 2010.
The following describes significant changes to level 3 assets during
the year.
For the year ended December 31, 2010
Level 3 assets decreased by $15.5 billion during 2010, due to the
following:
• $11.4 billion decrease in derivative receivables, predominantly
driven by changes in credit spreads;
• A net decrease of $3.5 billion due to the adoption of new ac-
counting guidance related to VIEs. As a result of the adoption of
the new guidance, there was a decrease of $5.0 billion in accrued
interest and accounts receivable related to retained securitization
interests in Firm-sponsored credit card securitization trusts that
were eliminated upon consolidation, partially offset by an increase
of $1.5 billion in trading debt and equity instruments;
• $2.8 billion decrease in trading assets – debt and equity instru-
ments, driven by sales, securitizations and transfers of trading
loans to level 2 due to increased price transparency;
• $1.9 billion decrease in MSRs. For a further discussion of the
change, refer to Note 17 on pages 260–263 of this Annual Re-
port;
• $2.2 billion increase in nonrecurring loans held-for-sale, largely
driven by an increase in credit card loans;
• $1.3 billion increase in private equity investments, largely driven
by additional follow-on investments and net gains in the portfolio;
and
• $1.0 billion increase in asset-backed AFS securities, predominantly
driven by purchases of CLOs.
Gains and Losses
Gains and losses included in the tables for 2010, 2009 and 2008
included:
2010
Included in the tables for the year ended December 31, 2010
• $2.3 billion of losses on MSRs; and
• $1.0 billion gain in private equity, largely driven by gains on
investments in the portfolio.
2009
Included in the tables for the year ended December 31, 2009
• $11.4 billion of net losses on derivatives, primarily related to the
tightening of credit spreads;
• Net losses on trading – debt and equity instruments of $671
million, consisting of $2.1 billion of losses, primarily related to
residential and commercial loans and MBS, principally driven by
markdowns and sales, partially offset by gains of $1.4 billion,
reflecting increases in the fair value of other ABS;
• $5.8 billion of gains on MSRs; and
• $1.4 billion of losses related to structured note liabilities, pre-
dominantly due to volatility in the equity markets.
2008
Included in the tables for the year ended December 31, 2008
• Losses on trading-debt and equity instruments of approximately
$12.8 billion, principally from mortgage-related transactions and
auction-rate securities;
• Losses of $6.9 billion on MSRs;
• Losses of approximately $3.9 billion on leveraged loans;
• Net gains of $4.6 billion related to derivatives, principally due to
changes in credit spreads and rate curves;
• Gains of $4.5 billion related to structured notes, principally due to
significant volatility in the fixed income, commodities and equity
markets; and
• Private equity losses of $638 million.
For further information on changes in the fair value of the MSRs, see
Note 17 on pages 260–263 of this Annual Report.
Credit adjustments
When determining the fair value of an instrument, it may be necessary
to record a valuation adjustment to arrive at an exit price under U.S.
GAAP. Valuation adjustments include, but are not limited to, amounts
to reflect counterparty credit quality and the Firm’s own creditworthi-
ness. The market’s view of the Firm’s credit quality is reflected in credit
spreads observed in the credit default swap market. For a detailed
discussion of the valuation adjustments the Firm considers, see the
valuation discussion at the beginning of this Note.
The following table provides the credit adjustments, excluding the
effect of any hedging activity, reflected within the Consolidated
Balance Sheets as of the dates indicated.
December 31, (in millions) 2010 2009 Derivative receivables balance $ 80,481 $ 80,210
Derivatives CVA(a) (4,362) (3,697 ) Derivative payables balance 69,219 60,125
Derivatives DVA (882) (841 )(d)
Structured notes balance(b)(c) 53,139 59,064
Structured notes DVA (1,153) (685 )(d)
(a) Derivatives credit valuation adjustments (“CVA”), gross of hedges, includes results managed by credit portfolio and other lines of business within IB.
(b) Structured notes are recorded within long-term debt, other borrowed funds or deposits on the Consolidated Balance Sheets, based on the tenor and legal form of the note.
(c) Structured notes are measured at fair value based on the Firm’s election under the fair value option. For further information on these elections, see Note 4 on pages 187–189 of this Annual Report.
(d) The prior period has been revised.

JPMorgan Chase & Co./2010 Annual Report 185
The following table provides the impact of credit adjustments on
earnings in the respective periods, excluding the effect of any
hedging activity.
Year ended December 31, (in millions) 2010 2009 2008 Credit adjustments:
Derivative CVA(a) $ (665) $ 5,869 $ (7,561 )
Derivative DVA 41 (548)(c) 789
Structured note DVA(b) 468 (1,748)(c) 1,211
(a) Derivatives CVA, gross of hedges, includes results managed by credit portfo-lio and other lines of business within IB.
(b) Structured notes are measured at fair value based on the Firm’s election under the fair value option. For further information on these elections, see Note 4 on pages 187–189 of this Annual Report.
(c) The 2009 prior period has been revised.
Additional disclosures about the fair value of financial
instruments (including financial instruments not carried at
fair value)
U.S. GAAP requires disclosure of the estimated fair value of certain
financial instruments, and the methods and significant assump-
tions used to estimate their fair value. Financial instruments within
the scope of these disclosure requirements are included in the
following table. However, certain financial instruments and all
nonfinancial instruments are excluded from the scope of these
disclosure requirements. Accordingly, the fair value disclosures
provided in the following table include only a partial estimate of
the fair value of JPMorgan Chase’s assets and liabilities. For exam-
ple, the Firm has developed long-term relationships with its cus-
tomers through its deposit base and credit card accounts,
commonly referred to as core deposit intangibles and credit card
relationships. In the opinion of management, these items, in the
aggregate, add significant value to JPMorgan Chase, but their fair
value is not disclosed in this Note.
Financial instruments for which carrying value approximates fair value Certain financial instruments that are not carried at fair value on
the Consolidated Balance Sheets are carried at amounts that
approximate fair value, due to their short-term nature and gen-
erally negligible credit risk. These instruments include cash and
due from banks; deposits with banks; federal funds sold; securi-
ties purchased under resale agreements and securities borrowed
with short-dated maturities; short-term receivables and accrued
interest receivable; commercial paper; federal funds purchased;
securities loaned and sold under repurchase agreements with
short-dated maturities; other borrowed funds (excluding ad-
vances from the Federal Home Loan Banks (“FHLBs”)); accounts
payable; and accrued liabilities. In addition, U.S. GAAP requires
that the fair value for deposit liabilities with no stated maturity
(i.e., demand, savings and certain money market deposits) be
equal to their carrying value; recognition of the inherent funding
value of these instruments is not permitted.

Notes to consolidated financial statements
186 JPMorgan Chase & Co./2010 Annual Report
The following table presents the carrying value and estimated fair values of financial assets and liabilities.
2010 2009
December 31, (in billions) Carrying
value Estimated fair value
Appreciation/ (depreciation)
Carrying value
Estimated fair value
Appreciation/ (depreciation)
Financial assets Assets for which fair value approximates carrying value $ 49.2 $ 49.2 $ — $ 89.4 $ 89.4 $ — Accrued interest and accounts receivable (included zero
and $5.0 at fair value) 70.1 70.1 — 67.4 67.4 — Federal funds sold and securities purchased under resale
agreements (included $20.3 and $20.5 at fair value) 222.6 222.6 — 195.4 195.4 — Securities borrowed (included $14.0 and $7.0 at fair value) 123.6 123.6 — 119.6 119.6 — Trading assets 489.9 489.9 — 411.1 411.1 — Securities (included $316.3 and $360.4 at fair value) 316.3 316.3 — 360.4 360.4 —
Loans (included $2.0 and $1.4 at fair value)(a)(b) 660.7 663.5 2.8 601.9 598.3 (3.6 ) Mortgage servicing rights at fair value 13.6 13.6 — 15.5 15.5 — Other (included $18.2 and $19.2 at fair value) 64.9 65.0 0.1 73.4 73.2 (0.2 ) Total financial assets $ 2,010.9 $ 2,013.8 $ 2.9 $ 1,934.1 $ 1,930.3 $ (3.8 ) Financial liabilities Deposits (included $4.4 and $4.5 at fair value) $ 930.4 $ 931.5 $ (1.1) $ 938.4 $ 939.5 $ (1.1 ) Federal funds purchased and securities loaned or sold
under repurchase agreements (included $4.1 and $3.4 at fair value) 276.6 276.6 — 261.4 261.4 —
Commercial paper 35.4 35.4 — 41.8 41.8 — Other borrowed funds (included $9.9 and $5.6 at fair
value) 57.3 57.2 0.1 55.7 55.9 (0.2 ) Trading liabilities 146.2 146.2 — 125.1 125.1 — Accounts payable and other liabilities (included $0.2 and
$0.4 at fair value) 138.2 138.2 — 136.8 136.8 — Beneficial interests issued by consolidated VIEs (included
$1.5 and $1.4 at fair value) 77.6 77.9 (0.3) 15.2 15.2 — Long-term debt and junior subordinated deferrable interest
debentures (included $38.8 and $49.0 at fair value) 247.7 249.0 (1.3) 266.3 268.4 (2.1 ) Total financial liabilities $ 1,909.4 $ 1,912.0 $ (2.6) $ 1,840.7 $ 1,844.1 $ (3.4 ) Net appreciation/(depreciation) $ 0.3 $ (7.2 )
(a) For originated or purchased loans held for investment, other than PCI loans, the carrying value is the principal amount outstanding, net of the allowance for loan losses, net charge-offs, interest applied to principal (for loans accounted for on the cost recovery method), unamortized discounts and premiums, and deferred loan fees or costs. For a further discussion of the Firm’s loan accounting framework, see Note 14 on pages 220–238 of this Annual Report.
(b) Fair value is typically estimated using a discounted cash flow model that incorporates the characteristics of the underlying loans (including principal, contractual interest rate and contractual fees) and key inputs, including expected lifetime credit losses, interest rates, prepayment rates, and primary origination or secondary market spreads. The dif-ference between the estimated fair value and carrying value is the result of the different methodologies used to determine fair value as compared to carrying value. For example, credit losses are estimated for the asset’s remaining life in a fair value calculation but are estimated for a loss emergence period in a loan loss reserve calcula-tion; future loan income (interest and fees) is incorporated in a fair value calculation but is generally not considered in a loan loss reserve calculation. For a further dis-cussion of the Firm’s methodologies for estimating the fair value of loans and lending-related commitments, see pages 171–173 of this Note.
The majority of the Firm’s unfunded lending-related commitments are not carried at fair value on a recurring basis on the Consolidated Balance
Sheets, nor are they actively traded. The carrying value and estimated fair value of the Firm’s wholesale lending-related commitments were as
follows for the periods indicated. 2010 2009
December 31, (in billions)
Carrying
value(a) Estimated fair value
Carrying
value(a) Estimated fair value
Wholesale lending-related commitments $ 0.7 $ 0.9 $ 0.9 $ 1.3
(a) Represents the allowance for wholesale unfunded lending-related commitments. Excludes the current carrying values of the guarantee liability and the offsetting asset each recognized at fair value at the inception of guarantees.
The Firm does not estimate the fair value of consumer lending-related commitments. In many cases, the Firm can reduce or cancel these com-
mitments by providing the borrower prior notice or, in some cases, without notice as permitted by law. For a further discussion of the valuation
of lending-related commitments, see pages 171–173 of this Note.

JPMorgan Chase & Co./2010 Annual Report 187
Trading assets and liabilities
Trading assets include debt and equity instruments held for trading
purposes that JPMorgan Chase owns (“long” positions), certain
loans managed on a fair value basis and for which the Firm has
elected the fair value option, and physical commodities inventories
that are generally accounted for at the lower of cost or fair value.
Trading liabilities include debt and equity instruments that the Firm
has sold to other parties but does not own (“short” positions). The
Firm is obligated to purchase instruments at a future date to cover
the short positions. Included in trading assets and trading liabilities
are the reported receivables (unrealized gains) and payables (unre-
alized losses) related to derivatives. Trading assets and liabilities
are carried at fair value on the Consolidated Balance Sheets. Bal-
ances reflect the reduction of securities owned (long positions) by
the amount of securities sold but not yet purchased (short posi-
tions) when the long and short positions have identical Committee
on Uniform Security Identification Procedures (“CUSIPs”).
Trading assets and liabilities–average balances
Average trading assets and liabilities were as follows for the periods indicated.
Year ended December 31, (in millions) 2010 2009 2008
Trading assets – debt and equity instruments(a) $ 354,441 $ 318,063 $ 384,102 Trading assets – derivative receivables 84,676 110,457 121,417
Trading liabilities – debt and equity instruments(a) (b) 78,159 60,224 78,841 Trading liabilities – derivative payables 65,714 77,901 93,200
(a) Balances reflect the reduction of securities owned (long positions) by the amount of securities sold, but not yet purchased (short positions) when the long and short positions have identical CUSIPs.
(b) Primarily represent securities sold, not yet purchased.
Note 4 – Fair value option
The fair value option provides an option to elect fair value as an
alternative measurement for selected financial assets, financial
liabilities, unrecognized firm commitments, and written loan com-
mitments not previously carried at fair value.
Elections
Elections were made by the Firm to:
• Mitigate income statement volatility caused by the differences in
the measurement basis of elected instruments (for example, cer-
tain instruments elected were previously accounted for on an
accrual basis) while the associated risk management arrange-
ments are accounted for on a fair value basis;
• Eliminate the complexities of applying certain accounting models
(e.g., hedge accounting or bifurcation accounting for hybrid in-
struments); and
• Better reflect those instruments that are managed on a fair value
basis.
Elections include the following:
• Loans purchased or originated as part of securitization ware-
housing activity, subject to bifurcation accounting, or man-
aged on a fair value basis.
• Securities financing arrangements with an embedded deriva-
tive and/or a maturity of greater than one year.
• Owned beneficial interests in securitized financial assets that
contain embedded credit derivatives, which would otherwise
be required to be separately accounted for as a derivative in-
strument.
• Certain tax credits and other equity investments acquired as
part of the Washington Mutual transaction.
• Structured notes issued as part of IB’s client-driven activities.
(Structured notes are financial instruments that contain em-
bedded derivatives.)
• Long-term beneficial interests issued by IB’s consolidated
securitization trusts where the underlying assets are carried at
fair value.

Notes to consolidated financial statements
188 JPMorgan Chase & Co./2010 Annual Report
Changes in fair value under the fair value option election
The following table presents the changes in fair value included in the Consolidated Statements of Income for the years ended December 31,
2010, 2009 and 2008, for items for which the fair value election was made. The profit and loss information presented below only includes the
financial instruments that were elected to be measured at fair value; related risk management instruments, which are required to be measured
at fair value, are not included in the table.
2010 2009 2008
Principal transactions
Other income
Total changes in fair value
recorded Principal
transactions Other
income
Total changes in fair value
recorded Principal
transactions Other
income
Total changes in fair value
recorded
December 31, (in millions) Federal funds sold and securities
purchased under resale agreements $ 173 $ — $ 173 $ (553) $ — $ (553) $ 1,139 $ — $ 1,139 Securities borrowed 31 — 31 82 — 82 29 — 29
Trading assets: Debt and equity instruments,
excluding loans 556 (2)(c) 554 619 25(c) 644 (870) (58)(c) (928) Loans reported as trading assets: Changes in instrument-
specific credit risk 1,279 (6)(c) 1,273 (300) (177)(c) (477) (9,802) (283)(c) (10,085)
Other changes in fair value (312) 4,449(c) 4,137 1,132 3,119(c) 4,251 696 1,178(c) 1,874 Loans: Changes in instrument-specific
credit risk 95 — 95 (78) — (78) (1,991) — (1,991) Other changes in fair value 90 — 90 (343) — (343) (42) — (42)
Other assets — (263)(d) (263) — (731)(d) (731) — (660)(d) (660)
Deposits(a) (564) — (564) (770) — (770) (132) — (132) Federal funds purchased and securities
loaned or sold under repurchase agreements (29) — (29) 116 — 116 (127) — (127)
Other borrowed funds(a) 123 — 123 (1,287) — (1,287) 1,888 — 1,888 Trading liabilities (23) — (23) (3) — (3) 35 — 35 Beneficial interests issued by
consolidated VIEs (12) — (12) (351) — (351) 355 — 355
Other liabilities (9) 8(d) (1) 64 — 64 — — — Long-term debt:
Changes in instrument-specific
credit risk(a) 400 — 400 (1,704) — (1,704) 1,174 — 1,174
Other changes in fair value(b) 1,297 — 1,297 (2,393) — (2,393) 16,202 — 16,202
(a) Total changes in instrument-specific credit risk related to structured notes were $468 million, $(1.7) billion and $1.2 billion for the years ended December 31, 2010, 2009 and 2008, respectively. These totals include adjustments for structured notes classified within deposits and other borrowed funds, as well as long-term debt. The 2009 prior period has been revised.
(b) Structured notes are debt instruments with embedded derivatives that are tailored to meet a client’s need for derivative risk in funded form. The embedded derivative is the primary driver of risk. The 2008 gain included in “Other changes in fair value” results from a significant decline in the value of certain structured notes where the embedded derivative is principally linked to either equity indices or commodity prices, both of which declined sharply during the third quarter of 2008. Although the risk associated with the structured notes is actively managed, the gains reported in this table do not include the income statement impact of such risk management instruments.
(c) Reported in mortgage fees and related income. (d) Reported in other income.
Determination of instrument-specific credit risk for items
for which a fair value election was made
The following describes how the gains and losses included in earnings
during 2010, 2009 and 2008, which were attributable to changes in
instrument-specific credit risk, were determined.
• Loans and lending-related commitments: For floating-rate instru-
ments, all changes in value are attributed to instrument-specific
credit risk. For fixed-rate instruments, an allocation of the changes
in value for the period is made between those changes in value
that are interest rate-related and changes in value that are credit-
related. Allocations are generally based on an analysis of bor-
rower-specific credit spread and recovery information, where
available, or benchmarking to similar entities or industries.
• Long-term debt: Changes in value attributable to instrument-
specific credit risk were derived principally from observable
changes in the Firm’s credit spread.
• Resale and repurchase agreements, securities borrowed agree-
ments and securities lending agreements: Generally, for these
types of agreements, there is a requirement that collateral be
maintained with a market value equal to or in excess of the prin-
cipal amount loaned; as a result, there would be no adjustment or
an immaterial adjustment for instrument-specific credit risk related
to these agreements.

JPMorgan Chase & Co./2010 Annual Report 189
Difference between aggregate fair value and aggregate remaining contractual principal balance outstanding
The following table reflects the difference between the aggregate fair value and the aggregate remaining contractual principal balance outstanding
as of December 31, 2010 and 2009, for loans, long-term debt and long-term beneficial interests for which the fair value option has been elected.
2010 2009
Contractual principal
outstanding Fair value
Fair value over/(under) contractual principal
outstanding
Contractual principal
outstanding Fair value
Fair value over/(under) contractual principal outstanding
December 31, (in millions)
Loans Performing loans 90 days or more past due Loans reported as trading assets $ — $ — $ — $ — $ — $ — Loans — — — — — — Nonaccrual loans Loans reported as trading assets 5,246 1,239 (4,007) 7,264 2,207 (5,057 ) Loans 927 132 (795) 1,126 151 (975 )
Subtotal 6,173 1,371 (4,802) 8,390 2,358 (6,032 ) All other performing loans Loans reported as trading assets 39,490 33,641 (5,849) 35,095 29,341 (5,754 ) Loans 2,496 1,434 (1,062) 2,147 1,000 (1,147 )
Total loans $ 48,159 $ 36,446 $ (11,713) $ 45,632 $ 32,699 $ (12,933 )
Long-term debt
Principal-protected debt $ 20,761(b) $ 21,315 $ 554 $ 26,765(b) $ 26,378 $ (387 )
Nonprincipal-protected debt(a) NA 17,524 NA NA 22,594 NA
Total long-term debt NA $ 38,839 NA NA $ 48,972 NA
Long-term beneficial interests Principal-protected debt $ 49 $ 49 $ — $ 90 $ 90 $ —
Nonprincipal-protected debt(a) NA 1,446 NA NA 1,320 NA
Total long-term beneficial interests NA $ 1,495 NA NA $ 1,410 NA
(a) Remaining contractual principal is not applicable to nonprincipal-protected notes. Unlike principal-protected notes, for which the Firm is obligated to return a stated amount of principal at the maturity of the note, nonprincipal-protected notes do not obligate the Firm to return a stated amount of principal at maturity, but to return an amount based on the performance of an underlying variable or derivative feature embedded in the note.
(b) Where the Firm issues principal-protected zero-coupon or discount notes, the balance reflected as the remaining contractual principal is the final principal payment at maturity.
At December 31, 2010 and 2009, the contractual amount of letters of credit for which the fair value option was elected was $3.8 billion and $3.7
billion, respectively, with a corresponding fair value of $6 million at both December 31, 2010 and 2009. For further information regarding off-
balance sheet commitments, see Note 30 on pages 275–280 of this Annual Report.
Note 5 – Credit risk concentrations Concentrations of credit risk arise when a number of customers are
engaged in similar business activities or activities in the same
geographic region, or when they have similar economic features
that would cause their ability to meet contractual obligations to be
similarly affected by changes in economic conditions.
JPMorgan Chase regularly monitors various segments of its credit
portfolio to assess potential concentration risks and to obtain collat-
eral when deemed necessary. Senior management is significantly
involved in the credit approval and review process, and risk levels are
adjusted as needed to reflect management’s risk tolerance.
In the Firm’s wholesale portfolio, risk concentrations are evaluated
primarily by industry and monitored regularly on both an aggregate
portfolio level and on an individual customer basis. Management of
the Firm’s wholesale exposure is accomplished through loan syndi-
cation and participation, loan sales, securitizations, credit deriva-
tives, use of master netting agreements, and collateral and other
risk-reduction techniques. In the consumer portfolio, concentrations
are evaluated primarily by product and by U.S. geographic region,
with a key focus on trends and concentrations at the portfolio level,
where potential risk concentrations can be remedied through
changes in underwriting policies and portfolio guidelines.
The Firm does not believe that its exposure to any particular loan
product (e.g., option ARMs), industry segment (e.g., commercial
real estate) or its exposure to residential real estate loans with high
loan-to-value ratios results in a significant concentration of credit
risk. Terms of loan products and collateral coverage are included in
the Firm’s assessment when extending credit and establishing its
allowance for loan losses.
For further information regarding on–balance sheet credit concen-
trations by major product and/or geography, see Notes 14 and 15
on pages 220–238 and 239–243, respectively, of this Annual
Report. For information regarding concentrations of off–balance
sheet lending-related financial instruments by major product, see
Note 30 on pages 275–280 of this Annual Report.
Customer receivables representing primarily margin loans to
prime and retail brokerage clients of $32.5 billion and $15.7
billion at December 31, 2010 and 2009, respectively, are included
in the table below. These margin loans are generally over-
collateralized through a pledge of assets maintained in clients’
brokerage accounts and are subject to daily minimum collateral
requirements. In the event that the collateral value decreases, a
maintenance margin call is made to the client to provide addi-
tional collateral into the account. If additional collateral is not

Notes to consolidated financial statements
190 JPMorgan Chase & Co./2010 Annual Report
provided by the client, the client’s positions may be liquidated by
the Firm to meet the minimum collateral requirements. As a result
of the Firm’s credit risk mitigation practices, the Firm does not
hold any reserves for credit impairment on these agreements as of
December 31, 2010 and 2009.
The table below presents both on–balance sheet and off–balance sheet wholesale- and consumer-related credit exposure by the Firm’s three
portfolio segments as of December 31, 2010, and 2009.
2010 2009 Credit On-balance sheet Off-balance Credit On-balance sheet Off-balance
December 31, (in millions) exposure Loans Derivatives sheet(d) exposure Loans Derivatives sheet(d)
Wholesale(a) Banks and finance companies $ 65,867 $ 21,562 $ 20,935 $ 23,370 $ 54,053 $ 14,396 $ 17,957 $ 21,700Real estate 64,351 53,635 868 9,848 68,509 57,195 1,112 10,202Healthcare 41,093 6,047 2,121 32,925 35,605 4,992 1,917 28,696State and municipal governments 35,808 6,095 5,148 24,565 34,726 5,687 4,979 24,060Asset managers 29,364 7,070 7,124 15,170 24,920 5,930 6,640 12,350Consumer products 27,508 7,921 1,039 18,548 27,004 7,880 1,094 18,030Oil and gas 26,459 5,701 3,866 16,892 23,322 5,895 2,309 15,118Utilities 25,911 4,220 3,104 18,587 27,178 5,451 3,073 18,654Retail and consumer services 20,882 5,876 796 14,210 20,673 5,611 769 14,293Technology 14,348 2,752 1,554 10,042 14,169 3,802 1,409 8,958Machinery and equipment manufacturing 13,311 3,601 445 9,265 12,759 3,189 456 9,114Building materials/construction 12,808 3,285 295 9,228 10,448 3,252 281 6,915Chemicals/plastics 12,312 3,372 350 8,590 9,870 2,719 392 6,759Metals/mining 11,426 3,301 1,018 7,107 12,547 3,410 1,158 7,979Business services 11,247 3,850 370 7,027 10,667 3,627 397 6,643Central government 11,173 1,146 6,052 3,975 9,557 1,703 5,501 2,353Media 10,967 3,711 284 6,972 12,379 4,173 329 7,877Insurance 10,918 1,103 1,660 8,155 13,421 1,292 2,511 9,618Telecom services 10,709 1,524 1,362 7,823 11,265 2,042 1,273 7,950Holding companies 10,504 3,885 894 5,725 16,018 4,360 1,042 10,616Transportation 9,652 3,754 822 5,076 9,749 3,141 1,238 5,370Securities firms and exchanges 9,415 1,722 5,038 2,655 10,832 3,457 4,796 2,579Automotive 9,011 2,026 248 6,737 9,357 2,510 357 6,490Agriculture/paper manufacturing 7,368 1,918 250 5,200 5,801 1,928 251 3,622Aerospace 5,732 516 197 5,019 5,254 597 79 4,578
All other(b) 140,926 62,917 14,641 63,368 137,359 41,838 18,890 76,631
Subtotal 649,070 222,510 80,481 346,079 627,442 200,077 80,210 347,155Loans held-for-sale and loans at fair value 5,123 5,123 — — 4,098 4,098 — —Receivables from customers 32,541 — — — 15,745 — — —Interests in purchased receivables 391 — — — 2,927 — — —
Total wholesale 687,125 227,633 80,481 346,079 650,212 204,175 80,210 347,155
Consumer, excluding credit card Home equity – senior lien 40,436 24,376 — 16,060 46,622 27,376 — 19,246Home equity – junior lien 92,690 64,009 — 28,681 111,280 74,049 — 37,231
Prime mortgage, including option ARMs(a) 75,805 74,539 — 1,266 77,082 75,428 — 1,654
Subprime mortgage(a) 11,287 11,287 — — 12,526 12,526 — —
Auto(a) 53,613 48,367 — 5,246 51,498 46,031 — 5,467Business banking 26,514 16,812 — 9,702 26,014 16,974 — 9,040
Student and other(a) 15,890 15,311 — 579 16,915 14,726 — 2,189PCI-Home equity 24,459 24,459 — — 26,520 26,520 — —PCI-Prime mortgage 17,322 17,322 — — 19,693 19,693 — —PCI-Subprime mortgage 5,398 5,398 — — 5,993 5,993 — —PCI-option ARMs 25,584 25,584 — — 29,039 29,039 — —Loans held-for-sale 154 154 — — 2,142 2,142 — —
Total consumer, excluding credit card 389,152 327,618 — 61,534 425,324 350,497 — 74,827
Credit Card Credit card – retained(a)(c) 682,751 135,524 — 547,227 647,899 78,786 — 569,113
Credit card – held-for-sale 2,152 2,152 — — — — — —
Total credit card 684,903 137,676 — 547,227 647,899 78,786 — 569,113
Total exposure $ 1,761,180 $ 692,927 $ 80,481 $ 954,840 $ 1,723,435 $ 633,458 $ 80,210 $ 991,095
(a) Effective January 1, 2010, the Firm adopted accounting guidance related to VIEs. Upon the adoption of the guidance, the Firm consolidated its Firm-sponsored credit card securitiza-tion trusts and certain other consumer loan securitization entities, primarily mortgage-related. As a result, related receivables are now recorded as loans on the Consolidated Balance Sheet. For further information, see Note 16 on pages 244–259 of this Annual Report.
(b) For more information on exposures to SPEs included in all other, see Note 16 on pages 244–259 of this Annual Report. (c) Excludes $84.6 billion of securitized credit card receivables at December 31, 2009. (d) Represents lending-related financial instruments.

JPMorgan Chase & Co./2010 Annual Report 191
Note 6 – Derivative instruments
Derivative instruments enable end-users to modify or mitigate
exposure to credit or market risks. Counterparties to a derivative
contract seek to obtain risks and rewards similar to those that
could be obtained from purchasing or selling a related cash instru-
ment without having to exchange upfront the full purchase or sales
price. JPMorgan Chase makes markets in derivatives for customers
and also uses derivatives to hedge or manage its own market risk
exposures. The majority of the Firm’s derivatives are entered into
for market-making purposes.
Trading derivatives
The Firm makes markets in a variety of derivatives in its trading
portfolios to meet the needs of customers (both dealers and clients)
and to generate revenue through this trading activity (“client de-
rivatives”). Customers use derivatives to mitigate or modify interest
rate, credit, foreign exchange, equity and commodity risks. The Firm
actively manages the risks from its exposure to these derivatives by
entering into other derivative transactions or by purchasing or
selling other financial instruments that partially or fully offset the
exposure from client derivatives. The Firm also seeks to earn a
spread between the client derivatives and offsetting positions, and
from the remaining open risk positions.
Risk management derivatives
The Firm manages its market risk exposures using various derivative
instruments.
Interest rate contracts are used to minimize fluctuations in earnings
that are caused by changes in interest rates. Fixed-rate assets and
liabilities appreciate or depreciate in market value as interest rates
change. Similarly, interest income and expense increase or decrease
as a result of variable-rate assets and liabilities resetting to current
market rates, and as a result of the repayment and subsequent
origination or issuance of fixed-rate assets and liabilities at current
market rates. Gains or losses on the derivative instruments that are
related to such assets and liabilities are expected to substantially
offset this variability in earnings. The Firm generally uses interest
rate swaps, forwards and futures to manage the impact of interest
rate fluctuations on earnings.
Foreign currency forward contracts are used to manage the foreign
exchange risk associated with certain foreign currency–
denominated (i.e., non-U.S.) assets and liabilities and forecasted
transactions, as well as the Firm’s net investments in certain non-
U.S. subsidiaries or branches whose functional currencies are not
the U.S. dollar. As a result of fluctuations in foreign currencies, the
U.S. dollar–equivalent values of the foreign currency–denominated
assets and liabilities or forecasted revenue or expense increase or
decrease. Gains or losses on the derivative instruments related to
these foreign currency–denominated assets or liabilities, or forecasted
transactions, are expected to substantially offset this variability.
Commodities based forward and futures contracts are used to
manage the price risk of certain inventory, including gold and base
metals, in the Firm's commodities portfolio. Gains or losses on the
forwards and futures are expected to substantially offset the depre-
ciation or appreciation of the related inventory. Also in the com-
modities portfolio, electricity and natural gas futures and forwards
contracts are used to manage price risk associated with energy-
related tolling and load-serving contracts and investments.
The Firm uses credit derivatives to manage the counterparty credit
risk associated with loans and lending-related commitments. Credit
derivatives compensate the purchaser when the entity referenced in
the contract experiences a credit event, such as bankruptcy or a
failure to pay an obligation when due. For a further discussion of
credit derivatives, see the discussion in the Credit derivatives sec-
tion on pages 197–199 of this Note.
For more information about risk management derivatives, see the
risk management derivatives gains and losses table on page 196 of
this Annual Report, and the hedge accounting gains and losses
tables on pages 194–195 of this Note.
Accounting for derivatives
All free-standing derivatives are required to be recorded on the
Consolidated Balance Sheets at fair value. As permitted under U.S.
GAAP, the Firm nets derivative assets and liabilities, and the related
cash collateral received and paid, when a legally enforceable mas-
ter netting agreement exists between the Firm and the derivative
counterparty. The accounting for changes in value of a derivative
depends on whether or not the transaction has been designated
and qualifies for hedge accounting. Derivatives that are not desig-
nated as hedges are marked to market through earnings. The
tabular disclosures on pages 192–199 of this Note provide addi-
tional information on the amount of, and reporting for, derivative
assets, liabilities, gains and losses. For further discussion of deriva-
tives embedded in structured notes, see Notes 3 and 4 on pages
170–187 and 187–189, respectively, of this Annual Report.
Derivatives designated as hedges
The Firm applies hedge accounting to certain derivatives executed
for risk management purposes – generally interest rate, foreign
exchange and gold and base metal derivatives. However, JPMorgan
Chase does not seek to apply hedge accounting to all of the deriva-
tives involved in the Firm’s risk management activities. For exam-
ple, the Firm does not apply hedge accounting to purchased credit
default swaps used to manage the credit risk of loans and commit-
ments, because of the difficulties in qualifying such contracts as
hedges. For the same reason, the Firm does not apply hedge ac-
counting to certain interest rate and commodity derivatives used for
risk management purposes.
To qualify for hedge accounting, a derivative must be highly effec-
tive at reducing the risk associated with the exposure being
hedged. In addition, for a derivative to be designated as a hedge,
the risk management objective and strategy must be documented.
Hedge documentation must identify the derivative hedging instru-
ment, the asset or liability or forecasted transaction and type of risk
to be hedged, and how the effectiveness of the derivative is as-
sessed prospectively and retrospectively. To assess effectiveness,
the Firm uses statistical methods such as regression analysis, as

Notes to consolidated financial statements
192 JPMorgan Chase & Co./2010 Annual Report
well as nonstatistical methods including dollar-value comparisons
of the change in the fair value of the derivative to the change in the
fair value or cash flows of the hedged item. The extent to which a
derivative has been, and is expected to continue to be, effective at
offsetting changes in the fair value or cash flows of the hedged
item must be assessed and documented at least quarterly. Any
hedge ineffectiveness (i.e., the amount by which the gain or loss on
the designated derivative instrument does not exactly offset the
change in the hedged item attributable to the hedged risk) must be
reported in current-period earnings. If it is determined that a deriva-
tive is not highly effective at hedging the designated exposure,
hedge accounting is discontinued.
There are three types of hedge accounting designations: fair
value hedges, cash flow hedges and net investment hedges.
JPMorgan Chase uses fair value hedges primarily to hedge fixed-
rate long-term debt, AFS securities and gold and base metal
inventory. For qualifying fair value hedges, the changes in the fair
value of the derivative, and in the value of the hedged item, for
the risk being hedged, are recognized in earnings. If the hedge
relationship is terminated, then the fair value adjustment to the
hedged item continues to be reported as part of the basis of the
hedged item and for interest-bearing instruments is amortized to
earnings as a yield adjustment. Derivative amounts affecting
earnings are recognized consistent with the classification of the
hedged item – primarily net interest income and principal trans-
actions revenue.
JPMorgan Chase uses cash flow hedges to hedge the exposure to
variability in cash flows from floating-rate financial instruments and
forecasted transactions, primarily the rollover of short-term assets
and liabilities, and foreign currency–denominated revenue and
expense. For qualifying cash flow hedges, the effective portion of
the change in the fair value of the derivative is recorded in other
comprehensive income/(loss) (“OCI”) and recognized in the Con-
solidated Statements of Income when the hedged cash flows affect
earnings. Derivative amounts affecting earnings are recognized
consistent with the classification of the hedged item – primarily
interest income, interest expense, noninterest revenue and com-
pensation expense. The ineffective portions of cash flow hedges are
immediately recognized in earnings. If the hedge relationship is
terminated, then the value of the derivative recorded in accumu-
lated other comprehensive income/(loss) (“AOCI”) is recognized in
earnings when the cash flows that were hedged affect earnings.
For hedge relationships that are discontinued because a forecasted
transaction is not expected to occur according to the original hedge
forecast, any related derivative values recorded in AOCI are imme-
diately recognized in earnings.
JPMorgan Chase uses foreign currency hedges to protect the value
of the Firm’s net investments in certain non-U.S. subsidiaries or
branches whose functional currencies are not the U.S. dollar. For
foreign currency qualifying net investment hedges, changes in the
fair value of the derivatives are recorded in the translation adjust-
ments account within AOCI.
Notional amount of derivative contracts
The following table summarizes the notional amount of derivative
contracts outstanding as of December 31, 2010 and 2009.
Notional amounts(b) December 31, (in billions) 2010 2009 Interest rate contracts Swaps $ 46,299 $ 47,663Futures and forwards 9,298 6,986Written options 4,075 4,553Purchased options 3,968 4,584Total interest rate contracts 63,640 63,786
Credit derivatives(a) 5,472 5,994Foreign exchange contracts Cross-currency swaps 2,568 2,217Spot, futures and forwards 3,893 3,578Written options 674 685Purchased options 649 699Total foreign exchange contracts 7,784 7,179Equity contracts Swaps 116 81Futures and forwards 49 45Written options 430 502Purchased options 377 449Total equity contracts 972 1,077Commodity contracts Swaps 349 178Spot, futures and forwards 170 113Written options 264 201Purchased options 254 205Total commodity contracts 1,037 697Total derivative notional amounts $ 78,905 $ 78,733
(a) Primarily consists of credit default swaps. For more information on volumes and types of credit derivative contracts, see the Credit derivatives discussion on pages 197–199 of this Note.
(b) Represents the sum of gross long and gross short third-party notional deriva-tive contracts.
While the notional amounts disclosed above give an indication of
the volume of the Firm’s derivative activity, the notional amounts
significantly exceed, in the Firm’s view, the possible losses that
could arise from such transactions. For most derivative transactions,
the notional amount does not change hands; it is used simply as a
reference to calculate payments.
Impact of derivatives on the Consolidated Balance Sheets
The following tables summarize derivative fair values as of Decem-
ber 31, 2010 and 2009, by accounting designation (e.g., whether
the derivatives were designated as hedges or not) and contract type.

JPMorgan Chase & Co./2010 Annual Report 193
Free-standing derivatives(a)
Derivative receivables Derivative payables
December 31, 2010 (in millions)
Not designated as hedges
Designated as hedges
Total derivative receivables
Not designated as hedges
Designated as hedges
Total derivative payables
Trading assets and liabilities Interest rate $ 1,121,703 $ 6,279 $ 1,127,982 $ 1,089,604 $ 840 $ 1,090,444 Credit 129,729 — 129,729 125,061 — 125,061
Foreign exchange(b) 165,240 3,231 168,471 163,671 1,059 164,730 Equity 43,633 — 43,633 46,399 — 46,399
Commodity 59,573 24 59,597 56,397 2,078(d) 58,475 Gross fair value of trading
assets and liabilities $ 1,519,878 $ 9,534 $ 1,529,412 $ 1,481,132 $ 3,977 $ 1,485,109
Netting adjustment(c) (1,448,931) (1,415,890) Carrying value of derivative
trading assets and trading liabilities on the Consolidated Balance Sheets $ 80,481 $ 69,219
Derivative receivables Derivative payables
December 31, 2009 (in millions)
Not designated as hedges
Designated as hedges
Total derivative receivables
Not designated as hedges
Designated as hedges
Total derivative payables
Trading assets and liabilities Interest rate $ 1,148,901 $ 6,568 $ 1,155,469 $ 1,121,978 $ 427 $ 1,122,405 Credit 170,864 — 170,864 164,790 — 164,790
Foreign exchange(b) 141,790 2,497 144,287 137,865 353 138,218 Equity 57,871 — 57,871 58,494 — 58,494
Commodity 36,988 39 37,027 35,082 194(d) 35,276 Gross fair value of trading
assets and liabilities $ 1,556,414 $ 9,104 $ 1,565,518 $ 1,518,209 $ 974 $ 1,519,183
Netting adjustment(c) (1,485,308) (1,459,058 ) Carrying value of derivative
trading assets and trading liabilities on the Consolidated Balance Sheets $ 80,210 $ 60,125
(a) Excludes structured notes for which the fair value option has been elected. See Note 4 on pages 187–189 of this Annual Report for further information. (b) Excludes $21 million of foreign currency-denominated debt designated as a net investment hedge at December 31, 2010. The Firm did not use foreign currency-
denominated debt as a hedging instrument in 2009, and therefore there was no impact as of December, 31, 2009. (c) U.S. GAAP permits the netting of derivative receivables and payables, and the related cash collateral received and paid when a legally enforceable master netting
agreement exists between the Firm and a derivative counterparty. (d) Excludes $1.0 billion and $1.3 billion related to commodity derivatives that are embedded in a debt instrument and used as fair value hedging instruments that are
recorded in the line item of the host contract (other borrowed funds) for December 31, 2010 and 2009, respectively.
Derivative receivables and payables mark-to-market
The following table summarizes the fair values of derivative receivables and payables, including those designated as hedges, by contract type after
netting adjustments as of December 31, 2010 and 2009.
Trading assets – Derivative receivables Trading liabilities – Derivative payablesDecember 31, (in millions) 2010 2009 2010 2009 Contract type
Interest rate(a) $ 32,555 $ 33,733 $ 20,387 $ 19,688
Credit(a) 7,725 11,859 5,138 6,036 Foreign exchange 25,858 21,984 25,015 19,818 Equity 4,204 6,635 10,450 11,554 Commodity 10,139 5,999 8,229 3,029 Total $ 80,481 $ 80,210 $ 69,219 $ 60,125
(a)In 2010, the reporting of cash collateral netting was enhanced to reflect a refined allocation by product. Prior periods have been revised to conform to the current presentation. The refinement resulted in an increase to interest rate derivative receivables, and an offsetting decrease to credit derivative receivables, of $7.0 billion, and an increase to interest rate derivative payables and a corresponding decrease to credit derivative payables of $4.5 billion as of December 31, 2009.

Notes to consolidated financial statements
194 JPMorgan Chase & Co./2010 Annual Report
The tables that follow reflect the derivative-related income statement impact by accounting designation for the years ended December 31, 2010 and 2009, respectively.
Fair value hedge gains and losses
The following tables present derivative instruments, by contract type, used in fair value hedge accounting relationships, as well as pretax
gains/(losses) recorded on such derivatives and the related hedged items for the years ended December 31, 2010 and 2009. The Firm includes
gains/(losses) on the hedging derivative and the related hedged item in the same line item in the Consolidated Statements of Income.
Gains/(losses) recorded in income Income statement impact due to:
Year ended December 31, 2010 (in millions) Derivatives Hedged items
Total income
statement impact(d)
Hedge
ineffectiveness(e)
Excluded
components(f) Contract type
Interest rate(a) $ 1,066 $ (454) $ 612 $ 172 $ 440
Foreign exchange(b) 1,357(g) (1,812) (455) — (455)
Commodity(c) (1,354) 1,882 528 — 528 Total $ 1,069 $ (384) $ 685 $ 172 $ 513
Gains/(losses) recorded in income Income statement impact due to:
Year ended December 31, 2009 (in millions) Derivatives Hedged items
Total income
statement impact(d)
Hedge
ineffectiveness(e)
Excluded
components(f) Contract type
Interest rate(a) $ (3,830) $ 4,638 $ 808 $ (466) $ 1,274
Foreign exchange(b) (1,421)(g) 1,445 24 — 24
Commodity(c) (430) 399 (31) — (31) Total $ (5,681) $ 6,482 $ 801 $ (466) $ 1,267
(a) Primarily consists of hedges of the benchmark (e.g., London Interbank Offered Rate (“LIBOR”)) interest rate risk of fixed-rate long-term debt and AFS securities. Gains and losses were recorded in net interest income.
(b) Primarily consists of hedges of the foreign currency risk of long-term debt and AFS securities for changes in spot foreign currency rates. Gains and losses related to the derivatives and the hedged items, due to changes in spot foreign currency rates, were recorded in principal transactions revenue.
(c) Consists of overall fair value hedges of gold and base metal inventory. Gains and losses were recorded in principal transactions revenue. (d) Total income statement impact for fair value hedges consists of hedge ineffectiveness and any components excluded from the assessment of hedge effectiveness. The
related amount for the year ended December 31, 2008 was a net gain of $434 million. (e) Hedge ineffectiveness is the amount by which the gain or loss on the designated derivative instrument does not exactly offset the gain or loss on the hedged item
attributable to the hedged risk. (f) Certain components of hedging derivatives are permitted to be excluded from the assessment of hedge effectiveness, such as forward points on a futures or forward
contract. Amounts related to excluded components are recorded in current-period income. (g) For the years ended December 31, 2010 and 2009, includes $278 million and $(1.6) billion of revenue related to certain foreign exchange trading derivatives desig-
nated as fair value hedging instruments, respectively.
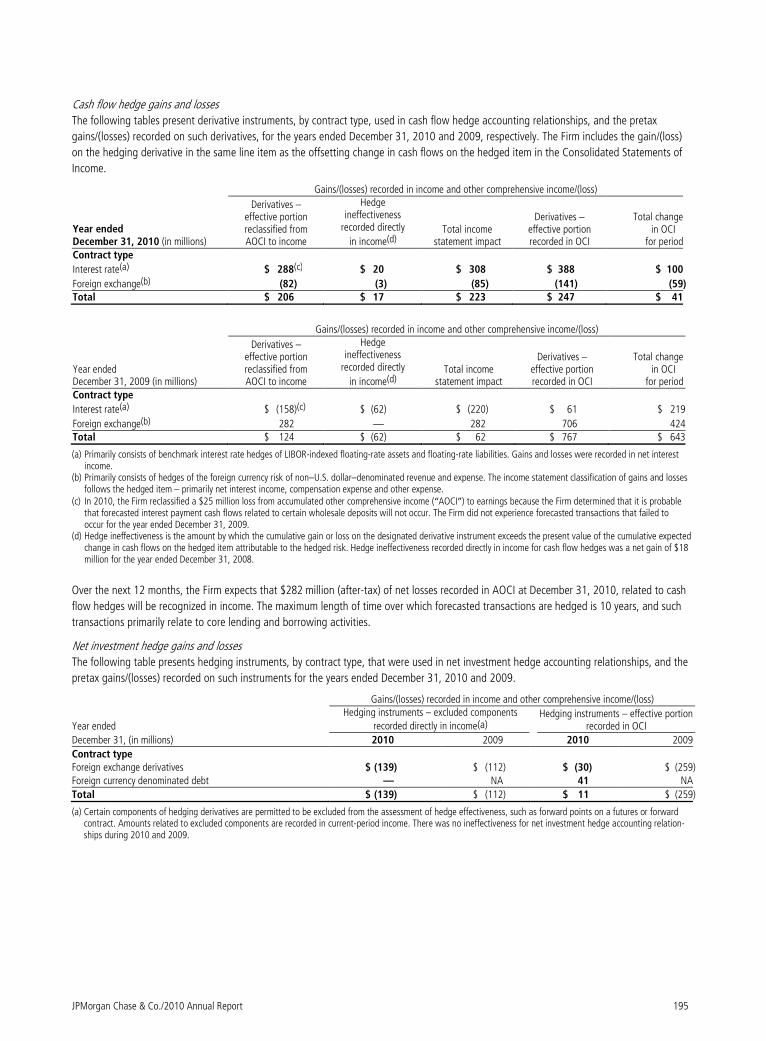
JPMorgan Chase & Co./2010 Annual Report 195
Cash flow hedge gains and losses
The following tables present derivative instruments, by contract type, used in cash flow hedge accounting relationships, and the pretax
gains/(losses) recorded on such derivatives, for the years ended December 31, 2010 and 2009, respectively. The Firm includes the gain/(loss)
on the hedging derivative in the same line item as the offsetting change in cash flows on the hedged item in the Consolidated Statements of
Income.
Gains/(losses) recorded in income and other comprehensive income/(loss)
Year ended December 31, 2010 (in millions)
Derivatives – effective portion reclassified from AOCI to income
Hedge ineffectiveness
recorded directly
in income(d)
Total income
statement impact
Derivatives – effective portion recorded in OCI
Total change in OCI .
for period Contract type
Interest rate(a) $ 288(c) $ 20 $ 308 $ 388 $ 100
Foreign exchange(b) (82) (3) (85) (141) (59) Total $ 206 $ 17 $ 223 $ 247 $ 41
Gains/(losses) recorded in income and other comprehensive income/(loss)
Year ended December 31, 2009 (in millions)
Derivatives – effective portion reclassified from AOCI to income
Hedge ineffectiveness
recorded directly
in income(d)
Total income
statement impact
Derivatives – effective portion recorded in OCI
Total change in OCI .
for period Contract type
Interest rate(a) $ (158)(c) $ (62) $ (220) $ 61 $ 219
Foreign exchange(b) 282 — 282 706 424Total $ 124 $ (62) $ 62 $ 767 $ 643
(a) Primarily consists of benchmark interest rate hedges of LIBOR-indexed floating-rate assets and floating-rate liabilities. Gains and losses were recorded in net interest income.
(b) Primarily consists of hedges of the foreign currency risk of non–U.S. dollar–denominated revenue and expense. The income statement classification of gains and losses follows the hedged item – primarily net interest income, compensation expense and other expense.
(c) In 2010, the Firm reclassified a $25 million loss from accumulated other comprehensive income (“AOCI”) to earnings because the Firm determined that it is probable that forecasted interest payment cash flows related to certain wholesale deposits will not occur. The Firm did not experience forecasted transactions that failed to occur for the year ended December 31, 2009.
(d) Hedge ineffectiveness is the amount by which the cumulative gain or loss on the designated derivative instrument exceeds the present value of the cumulative expected change in cash flows on the hedged item attributable to the hedged risk. Hedge ineffectiveness recorded directly in income for cash flow hedges was a net gain of $18 million for the year ended December 31, 2008.
Over the next 12 months, the Firm expects that $282 million (after-tax) of net losses recorded in AOCI at December 31, 2010, related to cash
flow hedges will be recognized in income. The maximum length of time over which forecasted transactions are hedged is 10 years, and such
transactions primarily relate to core lending and borrowing activities.
Net investment hedge gains and losses
The following table presents hedging instruments, by contract type, that were used in net investment hedge accounting relationships, and the
pretax gains/(losses) recorded on such instruments for the years ended December 31, 2010 and 2009.
Gains/(losses) recorded in income and other comprehensive income/(loss)
Year ended
Hedging instruments – excluded components
recorded directly in income(a)
Hedging instruments – effective portion recorded in OCI
December 31, (in millions) 2010 2009 2010 2009
Contract type Foreign exchange derivatives $ (139) $ (112) $ (30) $ (259) Foreign currency denominated debt — NA 41 NA
Total $ (139) $ (112) $ 11 $ (259)
(a) Certain components of hedging derivatives are permitted to be excluded from the assessment of hedge effectiveness, such as forward points on a futures or forward contract. Amounts related to excluded components are recorded in current-period income. There was no ineffectiveness for net investment hedge accounting relation-ships during 2010 and 2009.

Notes to consolidated financial statements
196 JPMorgan Chase & Co./2010 Annual Report
Risk management derivatives gains and losses (not designated as
hedging instruments)
The following table presents nontrading derivatives, by contract
type, that were not designated in hedge accounting relationships,
and the pretax gains/(losses) recorded on such derivatives for the
years ended December 31, 2010 and 2009. These derivatives are
risk management instruments used to mitigate or transform market
risk exposures arising from banking activities other than trading
activities, which are discussed separately below.
Year ended December 31, Derivatives gains/(losses) recorded in income
(in millions) 2010 2009Contract type
Interest rate(a) $ 4,997 $ (3,113 )
Credit(b) (237) (3,222 )
Foreign exchange(c) (85) (197 )
Equity(b) — (8 )
Commodity(b) (24) (50 ) Total $ 4,651 $ (6,590 )
(a) Gains and losses were recorded in principal transactions revenue, mortgage fees and related income, and net interest income.
(b) Gains and losses were recorded in principal transactions revenue. (c) Gains and losses were recorded in principal transactions revenue and net
interest income.
Trading derivative gains and losses
The Firm has elected to present derivative gains and losses related
to its trading activities together with the cash instruments with
which they are risk managed. All amounts are recorded in principal
transactions revenue in the Consolidated Statements of Income for
the years ended December 31, 2010 and 2009. The amounts below
do not represent a comprehensive view of the Firm’s trading activi-
ties because they do not include certain revenue associated with
those activities, including net interest income earned on cash
instruments used in trading activities and gains and losses on cash
instruments that are risk managed without derivative instruments.
Year ended December 31, Gains/(losses) recorded in
principal transactions revenue (in millions) 2010 2009Type of instrument Interest rate $ (683) $ 4,375 Credit 4,636 5,022
Foreign exchange(a) 1,854 2,583 Equity 1,827 1,475 Commodity 256 1,329 Total $ 7,890 $ 14,784
(a) In 2010, the reporting of trading gains and losses was enhanced to include trading gains and losses related to certain trading derivatives designated as fair value hedg-ing instruments. Prior period amounts have been revised to conform to the current presentation.
Credit risk, liquidity risk and credit-related contingent features
In addition to the specific market risks introduced by each deriva-
tive contract type, derivatives expose JPMorgan Chase to credit risk
– the risk that derivative counterparties may fail to meet their
payment obligations under the derivative contracts and the collat-
eral, if any, held by the Firm proves to be of insufficient value to
cover the payment obligation. It is the policy of JPMorgan Chase to
enter into legally enforceable master netting agreements as well as
to actively pursue the use of collateral agreements to mitigate
derivative counterparty credit risk. The amount of derivative receiv-
ables reported on the Consolidated Balance Sheets is the fair value
of the derivative contracts after giving effect to legally enforceable
master netting agreements and cash collateral held by the Firm.
These amounts represent the cost to the Firm to replace the con-
tracts at then-current market rates should the counterparty default.
While derivative receivables expose the Firm to credit risk, deriva-
tive payables expose the Firm to liquidity risk, as the derivative
contracts typically require the Firm to post cash or securities
collateral with counterparties as the mark-to-market (“MTM”) of
the contracts moves in the counterparties’ favor, or upon speci-
fied downgrades in the Firm’s and its subsidiaries’ respective
credit ratings. Certain derivative contracts also provide for termi-
nation of the contract, generally upon a downgrade of either the
Firm or the counterparty, at the fair value of the derivative con-
tracts. The aggregate fair value of net derivative payables that
contain contingent collateral or termination features triggered
upon a downgrade was $19.8 billion and $22.6 billion at De-
cember 31, 2010 and 2009, respectively, for which the Firm has
posted collateral of $14.6 billion and $22.3 billion, respectively,
in the normal course of business. At December 31, 2010 and
2009, the impact of a single-notch and two-notch ratings down-
grade to JPMorgan Chase & Co. and its subsidiaries, primarily
JPMorgan Chase Bank, National Association (“JPMorgan Chase
Bank, N.A.”), would have required $1.9 billion and $3.5 billion,
respectively, and $1.2 billion and $2.2 billion, respectively, of
additional collateral to be posted by the Firm. In addition, at
December 31, 2010 and 2009, the impact of single-notch and
two-notch ratings downgrades to JPMorgan Chase & Co. and its
subsidiaries, primarily JPMorgan Chase Bank, N.A., related to
contracts with termination triggers would have required the Firm
to settle trades with a fair value of $430 million and $1.0 billion,
respectively, and $260 million and $270 million, respectively.

JPMorgan Chase & Co./2010 Annual Report 197
The following table shows the current credit risk of derivative receivables after netting adjustments, and the current liquidity risk of derivative
payables after netting adjustments, as of December 31, 2010 and 2009.
Derivative receivables Derivative payables December 31, (in millions) 2010 2009 2010 2009 Gross derivative fair value $ 1,529,412 $ 1,565,518 $ 1,485,109 $ 1,519,183 Netting adjustment – offsetting receivables/payables (1,376,969) (1,419,840) (1,376,969) (1,419,840 ) Netting adjustment – cash collateral received/paid (71,962) (65,468) (38,921) (39,218 ) Carrying value on Consolidated Balance Sheets $ 80,481 $ 80,210 $ 69,219 $ 60,125
In addition to the collateral amounts reflected in the table above, at
December 31, 2010 and 2009, the Firm had received liquid securi-
ties and other cash collateral in the amount of $16.5 billion and
$15.5 billion, respectively, and had posted $10.9 billion and $11.7
billion, respectively. The Firm also receives and delivers collateral at
the initiation of derivative transactions, which is available as secu-
rity against potential exposure that could arise should the fair value
of the transactions move in the Firm’s or client’s favor, respectively.
Furthermore, the Firm and its counterparties hold collateral related
to contracts that have a non-daily call frequency for collateral to be
posted, and collateral that the Firm or a counterparty has agreed to
return but has not yet settled as of the reporting date. At December
31, 2010 and 2009, the Firm had received $18.0 billion and $16.9
billion, respectively, and delivered $8.4 billion and $5.8 billion,
respectively, of such additional collateral. These amounts were not
netted against the derivative receivables and payables in the table
above, because, at an individual counterparty level, the collateral
exceeded the fair value exposure at December 31, 2010 and 2009.
Credit derivatives
Credit derivatives are financial instruments whose value is derived
from the credit risk associated with the debt of a third-party issuer
(the reference entity) and which allow one party (the protection
purchaser) to transfer that risk to another party (the protection
seller). Credit derivatives expose the protection purchaser to the
creditworthiness of the protection seller, as the protection seller is
required to make payments under the contract when the reference
entity experiences a credit event, such as a bankruptcy, a failure to
pay its obligation or a restructuring. The seller of credit protection
receives a premium for providing protection but has the risk that
the underlying instrument referenced in the contract will be subject
to a credit event.
The Firm is both a purchaser and seller of protection in the credit
derivatives market and uses these derivatives for two primary
purposes. First, in its capacity as a market-maker in the
dealer/client business, the Firm actively risk manages a portfolio of
credit derivatives by purchasing and selling credit protection, pre-
dominantly on corporate debt obligations, to meet the needs of
customers. As a seller of protection, the Firm’s exposure to a given
reference entity may be offset partially, or entirely, with a contract
to purchase protection from another counterparty on the same or
similar reference entity. Second, the Firm uses credit derivatives to
mitigate credit risk associated with its overall derivative receivables
and traditional commercial credit lending exposures (loans and
unfunded commitments) as well as to manage its exposure to
residential and commercial mortgages. See Note 3 on pages 170–
187 of this Annual Report for further information on the Firm’s
mortgage-related exposures. In accomplishing the above, the Firm
uses different types of credit derivatives. Following is a summary of
various types of credit derivatives.
Credit default swaps
Credit derivatives may reference the credit of either a single refer-
ence entity (“single-name”) or a broad-based index. The Firm
purchases and sells protection on both single- name and index-
reference obligations. Single-name CDS and index CDS contracts
are OTC derivative contracts. Single-name CDS are used to manage
the default risk of a single reference entity, while index CDS con-
tracts are used to manage the credit risk associated with the
broader credit markets or credit market segments. Like the S&P 500
and other market indices, a CDS index comprises a portfolio of CDS
across many reference entities. New series of CDS indices are
periodically established with a new underlying portfolio of reference
entities to reflect changes in the credit markets. If one of the refer-
ence entities in the index experiences a credit event, then the
reference entity that defaulted is removed from the index. CDS can
also be referenced against specific portfolios of reference names or
against customized exposure levels based on specific client de-
mands: for example, to provide protection against the first $1
million of realized credit losses in a $10 million portfolio of expo-
sure. Such structures are commonly known as tranche CDS.
For both single-name CDS contracts and index CDS contracts, upon
the occurrence of a credit event, under the terms of a CDS contract
neither party to the CDS contract has recourse to the reference
entity. The protection purchaser has recourse to the protection
seller for the difference between the face value of the CDS contract
and the fair value of the reference obligation at the time of settling
the credit derivative contract, also known as the recovery value. The
protection purchaser does not need to hold the debt instrument of
the underlying reference entity in order to receive amounts due
under the CDS contract when a credit event occurs.
Credit-related notes
A credit-related note is a funded credit derivative where the issuer of
the credit-related note purchases from the note investor credit protec-
tion on a referenced entity. Under the contract, the investor pays the
issuer the par value of the note at the inception of the transaction,
and in return, the issuer pays periodic payments to the investor,
based on the credit risk of the referenced entity. The issuer also
repays the investor the par value of the note at maturity unless the
reference entity experiences a specified credit event. If a credit event

Notes to consolidated financial statements
198 JPMorgan Chase & Co./2010 Annual Report
occurs, the issuer is not obligated to repay the par value of the note,
but rather, the issuer pays the investor the difference between the par
value of the note and the fair value of the defaulted reference obliga-
tion at the time of settlement. Neither party to the credit-related note
has recourse to the defaulting reference entity. For a further discus-
sion of credit-related notes, see Note 16 on pages 244–259 of this
Annual Report.
Effective July 1, 2010, the Firm adopted new accounting guidance
prospectively related to credit derivatives embedded in beneficial
interests in securitized financial assets, which resulted in the elec-
tion of the fair value option for certain instruments in the AFS
securities portfolio. The related cumulative effect adjustment in-
creased retained earnings and decreased accumulated other com-
prehensive income by $15 million, respectively, as of July 1, 2010.
The following table presents a summary of the notional amounts of
credit derivatives and credit-related notes the Firm sold and pur-
chased as of December 31, 2010 and 2009. Upon a credit event,
the Firm as seller of protection would typically pay out only a per-
centage of the full notional amount of net protection sold, as the
amount actually required to be paid on the contracts takes into
account the recovery value of the reference obligation at the time
of settlement. The Firm manages the credit risk on contracts to sell
protection by purchasing protection with identical or similar under-
lying reference entities. Other purchased protection referenced in
the following table includes credit derivatives bought on related,
but not identical, reference positions (including indices, portfolio
coverage and other reference points) as well as protection pur-
chased through credit-related notes.
The Firm does not use notional amounts as the primary measure of
risk management for credit derivatives, because the notional amount
does not take into account the probability of the occurrence of a
credit event, the recovery value of the reference obligation, or related
cash instruments and economic hedges.
Total credit derivatives and credit-related notes
Maximum payout/Notional amount
December 31, 2010
(in millions)
Protection sold
Protection purchased with
identical underlyings(c)
Net protection
(sold)/purchased(d)
Other protection
purchased(e)
Credit derivatives Credit default swaps $ (2,659,240) $ 2,652,313 $ (6,927) $ 32,867
Other credit derivatives(a) (93,776) 10,016 (83,760) 24,234 Total credit derivatives (2,753,016) 2,662,329 (90,687) 57,101
Credit-related notes(b) (2,008) — (2,008) 3,327 Total $ (2,755,024) $ 2,662,329 $ (92,695) $ 60,428
Maximum payout/Notional amount
December 31, 2009
(in millions)
Protection sold
Protection purchased with
identical underlyings(c)
Net protection
(sold)/purchased(d)
Other protection
purchased(e)
Credit derivatives
Credit default swaps $ (2,937,442) $ 2,978,044 $ 40,602 $ 28,064
Other credit derivatives(a) (10,575) 9,290 (1,285) 30,473
Total credit derivatives (2,948,017) 2,987,334 39,317 58,537
Credit-related notes (4,031) — (4,031) 1,728
Total $ (2,952,048) $ 2,987,334 $ 35,286 $ 60,265
(a) Primarily consists of total return swaps and credit default swap options. (b) As a result of the adoption of new accounting guidance, effective July 1, 2010, includes beneficial interests in securitized financial assets that contain embedded credit
derivatives. (c) Represents the total notional amount of protection purchased where the underlying reference instrument is identical to the reference instrument on protection sold; the
notional amount of protection purchased for each individual identical underlying reference instrument may be greater or lower than the notional amount of protection sold. (d) Does not take into account the fair value of the reference obligation at the time of settlement, which would generally reduce the amount the seller of protection pays to
the buyer of protection in determining settlement value. (e) Represents protection purchased by the Firm through single-name and index credit default swap or credit-related notes.

JPMorgan Chase & Co./2010 Annual Report 199
The following tables summarize the notional and fair value amounts of credit derivatives and credit-related notes as of December 31, 2010
and 2009, where JPMorgan Chase is the seller of protection. The maturity profile is based on the remaining contractual maturity of the credit
derivative contracts. The ratings profile is based on the rating of the reference entity on which the credit derivative contract is based. The
ratings and maturity profile of protection purchased are comparable to the profile reflected below.
Protection sold – credit derivatives and credit-related notes ratings(a) /maturity profile
December 31, 2010 (in millions) <1 year 1–5 years >5 years Total
notional amount Fair value(b)
Risk rating of reference entity Investment-grade $ (175,618) $ (1,194,695) $ (336,309) $ (1,706,622) $ (17,261) Noninvestment-grade (148,434) (702,638) (197,330) (1,048,402) (59,939) Total $ (324,052) $ (1,897,333) $ (533,639) $ (2,755,024) $ (77,200)
December 31, 2009 (in millions) <1 year 1–5 years >5 years Total
notional amount Fair value(b)
Risk rating of reference entity Investment-grade $ (215,580) $ (1,140,133) $ (367,015) $ (1,722,728) $ (16,607) Noninvestment-grade (150,122) (806,139) (273,059) (1,229,320) (90,410) Total $ (365,702) $ (1,946,272) $ (640,074) $ (2,952,048) $ (107,017)
(a) The ratings scale is based on the Firm’s internal ratings, which generally correspond to ratings as defined by S&P and Moody’s. (b) Amounts are shown on a gross basis, before the benefit of legally enforceable master netting agreements and cash collateral held by the Firm.
Note 7 – Noninterest revenue Investment banking fees
This revenue category includes advisory and equity and debt under-
writing fees. Advisory fees are recognized as revenue when the
related services have been performed and the fee has been earned.
Underwriting fees are recognized as revenue when the Firm has
rendered all services to the issuer and is entitled to collect the fee
from the issuer, as long as there are no other contingencies associ-
ated with the fee (e.g., the fee is not contingent upon the customer
obtaining financing). Underwriting fees are net of syndicate expense;
the Firm recognizes credit arrangement and syndication fees as
revenue after satisfying certain retention, timing and yield criteria.
The following table presents the components of investment bank-
ing fees.
Year ended December 31, (in millions) 2010 2009 2008Underwriting: Equity $ 1,589 $ 2,487 $ 1,477 Debt 3,172 2,739 2,094Total underwriting 4,761 5,226 3,571
Advisory(a) 1,429 1,861 1,955Total investment banking fees $ 6,190 $ 7,087 $ 5,526
(a) Effective January 1, 2010, the Firm adopted accounting guidance related to VIEs. Upon adoption of the guidance, the Firm consolidated its Firm-administered multi-seller con-duits. The consolidation of the conduits did not significantly change the Firm’s net income as a whole; however, it did affect the classification of items on the Firm’s Consolidated Statements of Income. As a result, certain advisory fees were considered inter-company and eliminated, and the fees charged by the consolidated multi-seller conduits to its cus-tomers were classified as lending-and-deposit-related fees.
Principal transactions
Principal transactions revenue consists of realized and unrealized
gains and losses from trading activities (including physical com-
modities inventories that are generally accounted for at the lower
of cost or fair value), changes in fair value associated with finan-
cial instruments held by IB for which the fair value option was
elected, and loans held-for-sale within the wholesale lines of
business. Principal transactions revenue also includes private
equity gains and losses.
The following table presents principal transactions revenue.
Year ended December 31, (in millions) 2010 2009 2008
Trading revenue $ 9,404 $ 9,870 $ (9,791)
Private equity gains/(losses)(a) 1,490 (74) (908)
Principal transactions $10,894 $ 9,796 $(10,699)
(a) Includes revenue on private equity investments held in the Private Equity business within Corporate/Private Equity, as well as those held in other business segments.
Lending- and deposit-related fees
This revenue category includes fees from loan commitments,
standby letters of credit, financial guarantees, deposit-related fees
in lieu of compensating balances, cash management-related activi-
ties or transactions, deposit accounts and other loan-servicing
activities. These fees are recognized over the period in which the
related service is provided.
Asset management, administration and commissions
This revenue category includes fees from investment management
and related services, custody, brokerage services, insurance premiums
and commissions, and other products. These fees are recognized over
the period in which the related service is provided. Performance-
based fees, which are earned based on exceeding certain benchmarks
or other performance targets, are accrued and recognized at the end
of the performance period in which the target is met.
The following table presents the components of asset management,
administration and commissions.
Year ended December 31, (in millions) 2010 2009 2008Asset management:
Investment management fees $ 5,632 $ 4,997 $ 5,562All other asset management fees 496 356 432Total asset management fees 6,128 5,353 5,994
Total administration fees(a) 2,023 1,927 2,452Commission and other fees:
Brokerage commissions 2,804 2,904 3,141All other commissions and fees 2,544 2,356 2,356Total commissions and fees 5,348 5,260 5,497
Total asset management, administration and commissions $13,499 $12,540 $13,943
(a) Includes fees for custody, securities lending, funds services and securities clearance.

Notes to consolidated financial statements
200 JPMorgan Chase & Co./2010 Annual Report
Mortgage fees and related income
This revenue category primarily reflects Retail Financial Services’s
(“RFS”) mortgage banking revenue, including: fees and income
derived from mortgages originated with the intent to sell; mortgage
sales and servicing including losses related to the repurchase of
previously-sold loans; the impact of risk management activities asso-
ciated with the mortgage pipeline, warehouse loans and MSRs; and
revenue related to any residual interests held from mortgage securiti-
zations. This revenue category also includes gains and losses on sales
and lower of cost or fair value adjustments for mortgage loans held-
for-sale, as well as changes in fair value for mortgage loans origi-
nated with the intent to sell and measured at fair value under the fair
value option. Changes in the fair value of RFS mortgage servicing
rights are reported in mortgage fees and related income. Net interest
income from mortgage loans, and securities gains and losses on AFS
securities used in mortgage-related risk management activities, are
recorded in interest income and securities gains/(losses), respectively.
For a further discussion of MSRs, see Note 17 on pages 260–263 of
this Annual Report.
Credit card income
This revenue category includes interchange income from credit and
debit cards. Prior to 2010, this revenue category included servicing
fees earned in connection with securitization activities. Effective
January 1, 2010, the Firm consolidated its Firm-sponsored credit
card securitization trusts (see Note 16 on pages 244–259 of this
Annual Report) and, as a result, the servicing fees were eliminated
in consolidation. Volume-related payments to partners and expense
for rewards programs are netted against interchange income;
expense related to rewards programs are recorded when the re-
wards are earned by the customer. Other fee revenue is recognized
as earned, except for annual fees, which are deferred and recog-
nized on a straight-line basis over the 12-month period to which
they pertain. Direct loan origination costs are also deferred and
recognized over a 12-month period. In addition, due to the consoli-
dation of Chase Paymentech Solutions in the fourth quarter of
2008, this category now includes net fees earned for processing
card transactions for merchants.
Credit card revenue sharing agreements The Firm has contractual agreements with numerous affinity or-
ganizations and co-brand partners, which grant the Firm exclusive
rights to market to the members or customers of such organizations
and partners. These organizations and partners endorse the credit
card programs and provide their mailing lists to the Firm, and they
may also conduct marketing activities and provide awards under
the various credit card programs. The terms of these agreements
generally range from three to 10 years. The economic incentives the
Firm pays to the endorsing organizations and partners typically
include payments based on new account originations, charge
volumes, and the cost of the endorsing organizations’ or partners’
marketing activities and awards.
The Firm recognizes the payments made to the affinity organiza-
tions and co-brand partners based on new account originations as
direct loan origination costs. Payments based on charge volumes
are considered by the Firm as revenue sharing with the affinity
organizations and co-brand partners, which are deducted from
interchange income as the related revenue is earned. Payments
based on marketing efforts undertaken by the endorsing organiza-
tion or partner are expensed by the Firm as incurred. These costs
are recorded within noninterest expense.
Note 8 – Interest income and Interest expense
Interest income and interest expense is recorded in the Consoli-
dated Statements of Income and classified based on the nature of
the underlying asset or liability. Interest income and interest ex-
pense includes the current-period interest accruals for financial
instruments measured at fair value, except for financial instruments
containing embedded derivatives that would be separately ac-
counted for in accordance with U.S. GAAP absent the fair value
option election; for those instruments, all changes in fair value,
including any interest elements, are reported in principal transac-
tions revenue. For financial instruments that are not measured at
fair value, the related interest is included within interest income or
interest expense, as applicable.
Details of interest income and interest expense were as follows.
Year ended December 31, (in millions) 2010 2009 2008 Interest income Loans $ 40,388 $ 38,704 $ 38,347 Securities 9,540 12,377 6,344 Trading assets 11,007 12,098 17,236 Federal funds sold and securities
purchased under resale agreements 1,786 1,750 5,983 Securities borrowed 175 4 2,297 Deposits with banks 345 938 1,916
Other assets(a) 541 479 895
Total interest income(b) 63,782 66,350 73,018 Interest expense Interest-bearing deposits 3,424 4,826 14,546
Short-term and other liabilities(c) 2,708 3,845 10,933 Long-term debt 5,504 6,309 8,355 Beneficial interests issued by
consolidated VIEs 1,145 218 405
Total interest expense(b) 12,781 15,198 34,239 Net interest income $ 51,001 $ 51,152 $ 38,779 Provision for credit losses $ 16,639 $ 32,015 $ 19,445 Provision for credit losses – accounting
conformity(d) — — 1,534 Total provision for credit losses $ 16,639 $ 32,015 $ 20,979
Net interest income after provision for credit losses $ 34,362 $ 19,137 $ 17,800
(a) Predominantly margin loans. (b) Effective January 1, 2010, the Firm adopted accounting guidance related to
VIEs. Upon the adoption of the guidance, the Firm consolidated its Firm-sponsored credit card securitization trusts, its Firm-administered multi-seller conduits and certain other consumer loan securitization entities, primarily mortgage-related. The consolidation of these VIEs did not significantly change the Firm’s total net income. However, it did affect the classification of items on the Firm’s Consolidated Statements of Income; as a result of the adoption of the guidance, certain noninterest revenue was eliminated in consolidation, offset by the recognition of interest income, interest expense, and provision for credit losses.
(c) Includes brokerage customer payables. (d) 2008 includes an accounting conformity loan loss reserve provision related to
the acquisition of Washington Mutual’s banking operations.

JPMorgan Chase & Co./2010 Annual Report 201
Note 9 – Pension and other postretirement employee benefit plans
The Firm’s defined benefit pension plans and its other postretire-
ment employee benefit (“OPEB”) plans (collectively the “Plans”)
are accounted for in accordance with U.S. GAAP for retirement
benefits.
Defined benefit pension plans
The Firm has a qualified noncontributory U.S. defined benefit
pension plan that provides benefits to substantially all U.S. employ-
ees. The U.S. plan employs a cash balance formula in the form of
pay and interest credits to determine the benefits to be provided at
retirement, based on eligible compensation and years of service.
Employees begin to accrue plan benefits after completing one year
of service, and benefits generally vest after three years of service. In
November 2009, the Firm announced certain changes to the pay
credit schedule and amount of eligible compensation recognized
under the U.S. plan effective February 1, 2010. The Firm also offers
benefits through defined benefit pension plans to qualifying em-
ployees in certain non-U.S. locations based on factors such as
eligible compensation, age and/or years of service.
It is the Firm’s policy to fund the pension plans in amounts suffi-
cient to meet the requirements under applicable laws. On January
15, 2009, and August 28, 2009, the Firm made discretionary cash
contributions to its U.S. defined benefit pension plan of $1.3 billion
and $1.5 billion, respectively. The amount of potential 2011 contri-
butions to the U.S. defined benefit pension plans, if any, is not
determinable at this time. The expected amount of 2011 contribu-
tions to the non-U.S. defined benefit pension plans is $166 million
of which $154 million is contractually required.
JPMorgan Chase also has a number of defined benefit pension
plans not subject to Title IV of the Employee Retirement Income
Security Act. The most significant of these plans is the Excess
Retirement Plan, pursuant to which certain employees earn pay and
interest credits on compensation amounts above the maximum
stipulated by law under a qualified plan. The Firm announced that,
effective May 1, 2009, pay credits would no longer be provided on
compensation amounts above the maximum stipulated by law. The
Excess Retirement Plan had an unfunded projected benefit obliga-
tion in the amount of $266 million and $267 million, at December
31, 2010 and 2009, respectively.
Defined contribution plans
JPMorgan Chase currently provides two qualified defined contribu-
tion plans in the U.S. and other similar arrangements in certain
non-U.S. locations, all of which are administered in accordance
with applicable local laws and regulations. The most significant of
these plans is The JPMorgan Chase 401(k) Savings Plan (the
“401(k) Savings Plan”), which covers substantially all U.S. employ-
ees. The 401(k) Savings Plan allows employees to make pretax and
Roth 401(k) contributions to tax-deferred investment portfolios. The
JPMorgan Chase Common Stock Fund, which is an investment
option under the 401(k) Savings Plan, is a nonleveraged employee
stock ownership plan.
The Firm matched eligible employee contributions up to 5% of
benefits-eligible compensation (e.g., base pay) on a per pay period
basis through April 30, 2009, and then amended the plan to pro-
vide that thereafter matching contributions would be made annu-
ally. Employees begin to receive matching contributions after
completing a one-year-of-service requirement. Employees with total
annual cash compensation of $250,000 or more are not eligible for
matching contributions. Matching contributions are immediately
vested for employees hired before May 1, 2009, and will vest after
three years of service for employees hired on or after May 1, 2009.
The 401(k) Savings Plan also permits discretionary profit-sharing
contributions by participating companies for certain employees,
subject to a specified vesting schedule.
Effective August 10, 2009, JPMorgan Chase Bank, N.A. became the
sponsor of the WaMu Savings Plan and that plan’s assets were
merged into the 401(k) Savings Plan effective March 31, 2010.
OPEB plans
JPMorgan Chase offers postretirement medical and life insurance
benefits to certain retirees and postretirement medical benefits to
qualifying U.S. employees. These benefits vary with length of ser-
vice and date of hire and provide for limits on the Firm’s share of
covered medical benefits. The medical and life insurance benefits
are both contributory. Postretirement medical benefits also are
offered to qualifying U.K. employees.
JPMorgan Chase’s U.S. OPEB obligation is funded with corporate-
owned life insurance (“COLI”) purchased on the lives of eligible
employees and retirees. While the Firm owns the COLI policies,
COLI proceeds (death benefits, withdrawals and other distributions)
may be used only to reimburse the Firm for its net postretirement
benefit claim payments and related administrative expense. The
U.K. OPEB plan is unfunded.

Notes to consolidated financial statements
202 JPMorgan Chase & Co./2010 Annual Report
The following table presents the changes in benefit obligations and plan assets and funded status amounts reported on the Consolidated
Balance Sheets for the Firm’s U.S. and non-U.S. defined benefit pension and OPEB plans.
Defined benefit pension plans
As of or for the year ended December 31, U.S. Non-U.S. OPEB plans(f) (in millions) 2010 2009 2010 2009 2010 2009
Change in benefit obligation Benefit obligation, beginning of year $ (7,977) $ (7,796) $ (2,536) $ (2,007) $ (1,025) $ (1,095) Benefits earned during the year (230) (313) (30) (30) (2) (3) Interest cost on benefit obligations (468) (514) (128) (122) (55) (64) Plan amendments — 384 10 1 — —
Business combinations — (4)(b) (12)(b) — — (40)(b) Employee contributions NA NA (4) (3) (70) (64) Net gain/(loss) (249) (408) (71) (287) 13 101 Benefits paid 604 674 96 95 168 160 Expected Medicare Part D subsidy receipts NA NA NA NA (10) (9) Curtailments — — — 1 — (7) Settlements — — 5 4 — — Special termination benefits — — (1) (1) — — Foreign exchange impact and other — — 71 (187) 1 (4) Benefit obligation, end of year $ (8,320) $ (7,977) $ (2,600) $ (2,536) $ (980) $ (1,025) Change in plan assets Fair value of plan assets, beginning of year $ 10,218 $ 6,948 $ 2,432 $ 2,008 $ 1,269 $ 1,126 Actual return on plan assets 1,179 1,145 228 218 137 172 Firm contributions 35 2,799 157 115 3 2Employee contributions — — 4 3 — —Benefits paid (604) (674) (96) (95) (28) (31) Settlements — — (5) (4) — —Foreign exchange impact and other — — (73) 187 — —
Fair value of plan assets, end of year $ 10,828(c)(d) $ 10,218(c)(d) $ 2,647(d) $ 2,432(d) $ 1,381 $ 1,269
Funded/(unfunded) status(a) $ 2,508(e) $ 2,241(e) $ 47 $ (104) $ 401 $ 244 Accumulated benefit obligation, end of year $ (8,271) $ (7,964) $ (2,576) $ (2,510) NA NA
(a) Represents overfunded plans with an aggregate balance of $3.5 billion and $3.0 billion at December 31, 2010 and 2009, respectively, and underfunded plans with an aggregate balance of $561 million and $623 million at December 31, 2010 and 2009, respectively.
(b) Represents change resulting from the RBS Sempra Commodities business in 2010 and from the Washington Mutual plan in 2009. (c) At December 31, 2010 and 2009, approximately $385 million and $332 million, respectively, of U.S. plan assets included participation rights under participating
annuity contracts. (d) At December 31, 2010 and 2009, defined benefit pension plan amounts not measured at fair value include $52 million and $82 million, respectively, of accrued receiv-
ables, and $187 million and $189 million, respectively, of accrued liabilities, for U.S. plans; and $9 million and $8 million, respectively, of accrued receivables for non-U.S. plans.
(e) Does not include any amounts attributable to the Washington Mutual Qualified Pension plan. The disposition of this plan remained subject to litigation and was not determinable.
(f) Includes an unfunded accumulated postretirement benefit obligation of $36 million and $29 million at December 31, 2010 and 2009, respectively, for the U.K. plan.
Gains and losses
For the Firm’s defined benefit pension plans, fair value is used to
determine the expected return on plan assets. For the Firm’s OPEB
plans, a calculated value that recognizes changes in fair value over
a five-year period is used to determine the expected return on plan
assets. Amortization of net gains and losses is included in annual
net periodic benefit cost if, as of the beginning of the year, the net
gain or loss exceeds 10% of the greater of the projected benefit
obligation or the fair value of the plan assets. Any excess, as well
as prior service costs, are amortized over the average future service
period of defined benefit pension plan participants, which for the
U.S. defined benefit pension plan is currently nine years. For OPEB
plans, any excess net gains and losses also are amortized over the
average future service period, which is currently five years; how-
ever, prior service costs are amortized over the average years of
service remaining to full eligibility age, which is currently three
years.
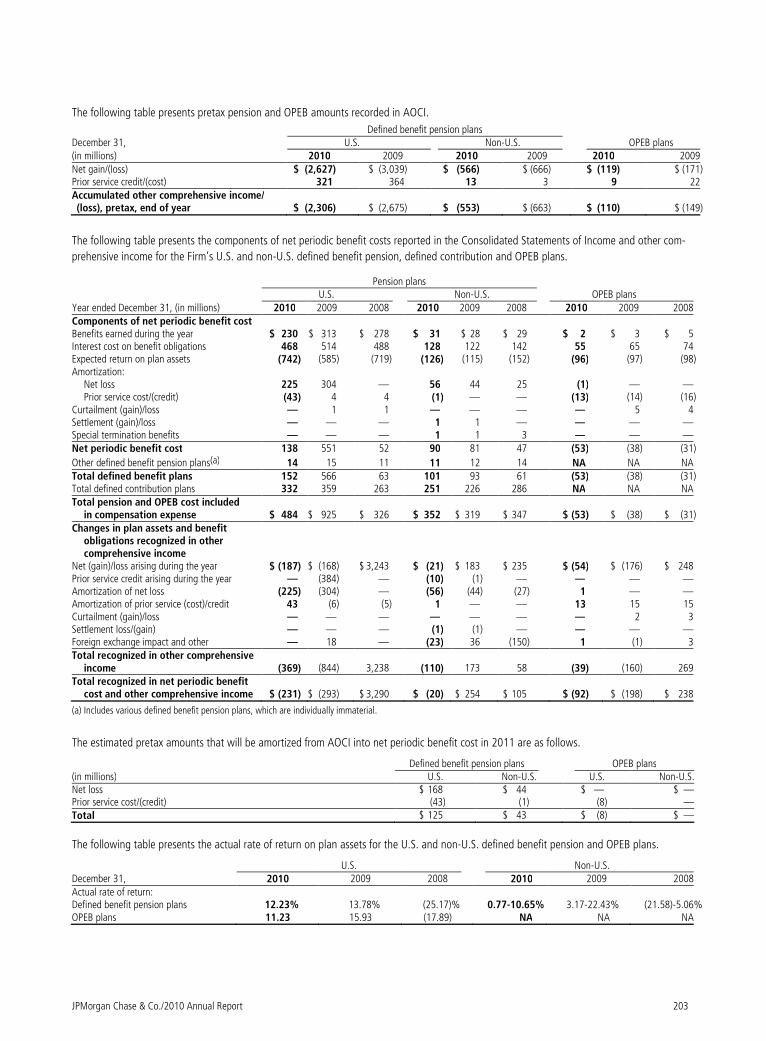
JPMorgan Chase & Co./2010 Annual Report 203
The following table presents pretax pension and OPEB amounts recorded in AOCI. Defined benefit pension plans
December 31, U.S. Non-U.S. OPEB plans (in millions) 2010 2009 2010 2009 2010 2009
Net gain/(loss) $ (2,627) $ (3,039) $ (566) $ (666) $ (119) $ (171 ) Prior service credit/(cost) 321 364 13 3 9 22 Accumulated other comprehensive income/ (loss), pretax, end of year $ (2,306) $ (2,675) $ (553) $ (663) $ (110) $ (149 )
The following table presents the components of net periodic benefit costs reported in the Consolidated Statements of Income and other com-
prehensive income for the Firm’s U.S. and non-U.S. defined benefit pension, defined contribution and OPEB plans.
Pension plans U.S. Non-U.S. OPEB plans
Year ended December 31, (in millions) 2010 2009 2008 2010 2009 2008 2010 2009 2008 Components of net periodic benefit cost Benefits earned during the year $ 230 $ 313 $ 278 $ 31 $ 28 $ 29 $ 2 $ 3 $ 5 Interest cost on benefit obligations 468 514 488 128 122 142 55 65 74 Expected return on plan assets (742) (585) (719) (126) (115) (152) (96) (97) (98) Amortization:
Net loss 225 304 — 56 44 25 (1) — — Prior service cost/(credit) (43) 4 4 (1) — — (13) (14) (16)
Curtailment (gain)/loss — 1 1 — — — — 5 4 Settlement (gain)/loss — — — 1 1 — — — — Special termination benefits — — — 1 1 3 — — — Net periodic benefit cost 138 551 52 90 81 47 (53) (38) (31)
Other defined benefit pension plans(a) 14 15 11 11 12 14 NA NA NA Total defined benefit plans 152 566 63 101 93 61 (53) (38) (31) Total defined contribution plans 332 359 263 251 226 286 NA NA NA Total pension and OPEB cost included
in compensation expense $ 484 $ 925 $ 326 $ 352 $ 319 $ 347 $ (53) $ (38) $ (31) Changes in plan assets and benefit
obligations recognized in other comprehensive income
Net (gain)/loss arising during the year $ (187) $ (168) $ 3,243 $ (21) $ 183 $ 235 $ (54) $ (176) $ 248 Prior service credit arising during the year — (384) — (10) (1) — — — — Amortization of net loss (225) (304) — (56) (44) (27) 1 — — Amortization of prior service (cost)/credit 43 (6) (5) 1 — — 13 15 15 Curtailment (gain)/loss — — — — — — — 2 3 Settlement loss/(gain) — — — (1) (1) — — — — Foreign exchange impact and other — 18 — (23) 36 (150) 1 (1) 3 Total recognized in other comprehensive
income (369) (844) 3,238 (110) 173 58 (39) (160) 269 Total recognized in net periodic benefit
cost and other comprehensive income $ (231) $ (293) $ 3,290 $ (20) $ 254 $ 105 $ (92) $ (198) $ 238
(a) Includes various defined benefit pension plans, which are individually immaterial. The estimated pretax amounts that will be amortized from AOCI into net periodic benefit cost in 2011 are as follows.
Defined benefit pension plans OPEB plans (in millions) U.S. Non-U.S. U.S. Non-U.S. Net loss $ 168 $ 44 $ — $ — Prior service cost/(credit) (43) (1) (8) — Total $ 125 $ 43 $ (8) $ —
The following table presents the actual rate of return on plan assets for the U.S. and non-U.S. defined benefit pension and OPEB plans.
U.S. Non-U.S. December 31, 2010 2009 2008 2010 2009 2008 Actual rate of return: Defined benefit pension plans 12.23% 13.78% (25.17)% 0.77-10.65% 3.17-22.43% (21.58)-5.06% OPEB plans 11.23 15.93 (17.89) NA NA NA

Notes to consolidated financial statements
204 JPMorgan Chase & Co./2010 Annual Report
Plan assumptions
JPMorgan Chase’s expected long-term rate of return for U.S. de-
fined benefit pension and OPEB plan assets is a blended average of
the investment advisor’s projected long-term (10 years or more)
returns for the various asset classes, weighted by the asset alloca-
tion. Returns on asset classes are developed using a forward-
looking building-block approach and are not strictly based on
historical returns. Equity returns are generally developed as the sum
of inflation, expected real earnings growth and expected long-term
dividend yield. Bond returns are generally developed as the sum of
inflation, real bond yield and risk spread (as appropriate), adjusted
for the expected effect on returns from changing yields. Other
asset-class returns are derived from their relationship to the equity
and bond markets. Consideration is also given to current market
conditions and the short-term portfolio mix of each plan; as a
result, in 2010 the Firm generally maintained the same expected
return on assets as in the prior year.
For the U.K. defined benefit pension plans, which represent the
most significant of the non-U.S. defined benefit pension plans,
procedures similar to those in the U.S. are used to develop the
expected long-term rate of return on defined benefit pension plan
assets, taking into consideration local market conditions and the
specific allocation of plan assets. The expected long-term rate of
return on U.K. plan assets is an average of projected long-term
returns for each asset class. The return on equities has been se-
lected by reference to the yield on long-term U.K. government
bonds plus an equity risk premium above the risk-free rate. The
return on “AA”-rated long-term corporate bonds has been taken as
the average yield on such bonds.
The discount rate used in determining the benefit obligation under
the U.S. defined benefit pension and OPEB plans was selected by
reference to the yields on portfolios of bonds with maturity dates
and coupons that closely match each of the plan’s projected cash
flows; such portfolios are derived from a broad-based universe of
high-quality corporate bonds as of the measurement date. In years
in which these hypothetical bond portfolios generate excess cash,
such excess is assumed to be reinvested at the one-year forward
rates implied by the Citigroup Pension Discount Curve published as
of the measurement date. The discount rate for the U.K. defined
benefit pension and OPEB plans represents a rate implied from the
yield curve of the year-end iBoxx £ corporate “AA” 15-year-plus
bond index.
The following tables present the weighted-average annualized actuarial assumptions for the projected and accumulated postretirement benefit
obligations, and the components of net periodic benefit costs, for the Firm’s U.S. and non-U.S. defined benefit pension and OPEB plans, as of
and for the periods indicated.
Weighted-average assumptions used to determine benefit obligations
U.S. Non-U.S. December 31, 2010 2009 2010 2009
Discount rate: Defined benefit pension plans 5.50% 6.00% 1.60-5.50% 2.00-5.70% OPEB plans 5.50 6.00 5.50 5.70 Rate of compensation increase 4.00 4.00 3.00-4.50 3.00-4.50 Health care cost trend rate: Assumed for next year 7.00 7.75 6.50 5.40 Ultimate 5.00 5.00 6.00 4.50 Year when rate will reach ultimate 2017 2014 2015 2014
Weighted-average assumptions used to determine net periodic benefit costs
U.S. Non-U.S. Year ended December 31, 2010 2009 2008 2010 2009 2008
Discount rate: Defined benefit pension plans 6.00% 6.65% 6.60% 2.00-5.70% 2.00-6.20% 2.25-5.80 % OPEB plans 6.00 6.70 6.60 5.70 6.20 5.80 Expected long-term rate of return on plan assets: Defined benefit pension plans 7.50 7.50 7.50 2.40-6.20 2.50-6.90 3.25-5.75 OPEB plans 7.00 7.00 7.00 NA NA NA Rate of compensation increase 4.00 4.00 4.00 3.00-4.50 3.00-4.00 3.00-4.25 Health care cost trend rate: Assumed for next year 7.75 8.50 9.25 5.40 7.00 5.75 Ultimate 5.00 5.00 5.00 4.50 5.50 4.00 Year when rate will reach ultimate 2014 2014 2014 2014 2012 2010

JPMorgan Chase & Co./2010 Annual Report 205
The following table presents the effect of a one-percentage-point
change in the assumed health care cost trend rate on JPMorgan
Chase’s total service and interest cost and accumulated postretire-
ment benefit obligation.
1-Percentage- 1-Percentage- Year ended December 31, 2010 point point (in millions) increase decrease Effect on total service and interest cost $ 2 $ (2) Effect on accumulated postretirement
benefit obligation 36 (31)
At December 31, 2010, the Firm decreased the discount rates used
to determine its benefit obligations for the U.S. defined benefit
pension and OPEB plans in light of current market interest rates,
which will result in an increase in expense of approximately $21
million for 2011. The 2011 expected long-term rate of return on
U.S. defined benefit pension plan assets and U.S. OPEB plan assets
are 7.50% and 6.25%, respectively, as compared to 7.50% and
7.00% in 2010. The initial health care benefit obligation trend
assumption declined from 7.75% in 2010 to 7.00% in 2011. The
ultimate health care trend assumption will remain at 5.00% in
2011, but the year to ultimate was adjusted from 2014 to 2017.
As of December 31, 2010, the interest crediting rate assumption
and the assumed rate of compensation increase remained at
5.25% and 4.00%, respectively.
JPMorgan Chase’s U.S. defined benefit pension and OPEB plan
expense is sensitive to the expected long-term rate of return on
plan assets and the discount rate. With all other assumptions held
constant, a 25-basis point decline in the expected long-term rate of
return on U.S. plan assets would result in an increase of approxi-
mately an aggregate $30 million in 2011 U.S. defined benefit
pension and OPEB plan expense. A 25-basis point decline in the
discount rate for the U.S. plans would result in an increase in 2011
U.S. defined benefit pension and OPEB plan expense of approxi-
mately an aggregate $11 million and an increase in the related
benefit obligations of approximately an aggregate $169 million. A
25-basis point increase in the interest crediting rate for the U.S.
defined benefit pension plan would result in an increase in 2011
U.S. defined benefit pension expense of approximately $19 million
and an increase in the related projected benefit obligations of
approximately $76 million. A 25-basis point decline in the discount
rates for the non-U.S. plans would result in an increase in the 2011
non-U.S. defined benefit pension plan expense of approximately
$11 million.
Investment strategy and asset allocation
The Firm’s U.S. defined benefit pension plan assets are held in trust
and are invested in a well-diversified portfolio of equity and fixed
income securities, real estate, cash and cash equivalents, and alterna-
tive investments (e.g., hedge funds, private equity funds, and real
estate funds). Non-U.S. defined benefit pension plan assets are held
in various trusts and are also invested in well-diversified portfolios of
equity, fixed income and other securities. Assets of the Firm’s COLI
policies, which are used to partially fund the U.S. OPEB plan, are held
in separate accounts with an insurance company and are invested in
equity and fixed income index funds.
The investment policy for the Firm’s U.S. defined benefit pension
plan assets is to optimize the risk-return relationship as appropriate
to the needs and goals using a global portfolio of various asset
classes diversified by market segment, economic sector, and issuer.
Periodically the Firm performs a comprehensive analysis on the U.S.
defined benefit pension plan asset allocations, incorporating pro-
jected asset and liability data, which focuses on the short-and long-
term impact of the asset allocation on cumulative pension expense,
economic cost, present value of contributions and funded status.
Currently, approved asset allocation ranges are: U.S. equity 15–
35%, international equity 15–25%, debt securities 10–30%,
hedge funds 10–30%, real estate 5–20%, and private equity 5–
20%. Asset allocations are not managed to a specific target but
seek to shift asset class allocations within these stated ranges.
Assets are managed by a combination of internal and external
investment managers. Asset allocation decisions also incorporate
the economic outlook and anticipated implications of the macro-
economic environment on the various asset classes and managers.
Maintaining an appropriate level of liquidity, which takes into
consideration forecasted requirements for cash is a major consid-
eration in the asset allocation process. The Firm regularly reviews
the asset allocations and all factors that continuously impact the
portfolio, which is rebalanced when deemed necessary.
For the U.K. defined benefit pension plans, which represent the
most significant of the non-U.S. defined benefit pension plans, the
assets are invested to maximize returns subject to an appropriate
level of risk relative to the plans’ liabilities. In order to reduce the
volatility in returns relative to the plan’s liability profiles, the U.K.
defined benefit pension plans’ largest asset allocations are to debt
securities of appropriate durations. Other assets, mainly equity
securities, are then invested for capital appreciation, to provide
long-term investment growth. Similar to the U.S. defined benefit
pension plan, asset allocations for the U.K. plans are reviewed and
rebalanced on a regular basis.
Investments held by the Plans include financial instruments which
are exposed to various risks such as interest rate, market and credit
risks. Exposure to a concentration of credit risk is mitigated by the
broad diversification of both U.S. and non-U.S. investment instru-
ments. Additionally, the investments in each of the common/
collective trust funds and registered investment companies are
further diversified into various financial instruments. As of Decem-
ber 31, 2010, assets held by the Firm’s U.S. and non-U.S. defined
benefit pension and OPEB plans do not include JPMorgan Chase
common stock, except in connection with investments in third-party
stock-index funds. The plans hold investments in funds that are
sponsored or managed by affiliates of JPMorgan Chase in the amount
of $1.7 billion and $1.6 billion for U.S. plans and $155 million and
$474 million for non-U.S. plans, as of December 31, 2010 and 2009,
respectively.
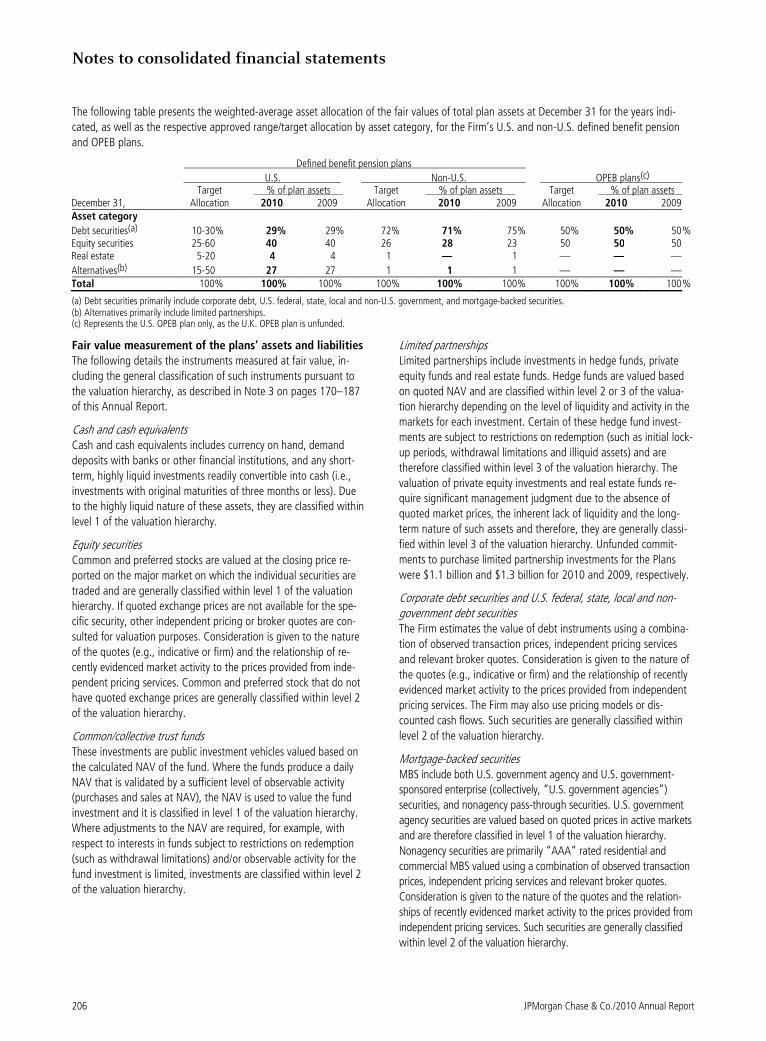
Notes to consolidated financial statements
206 JPMorgan Chase & Co./2010 Annual Report
The following table presents the weighted-average asset allocation of the fair values of total plan assets at December 31 for the years indi-
cated, as well as the respective approved range/target allocation by asset category, for the Firm’s U.S. and non-U.S. defined benefit pension
and OPEB plans.
Defined benefit pension plans
U.S. Non-U.S. OPEB plans(c)
Target % of plan assets Target % of plan assets Target % of plan assets December 31, Allocation 2010 2009 Allocation 2010 2009 Allocation 2010 2009 Asset category
Debt securities(a) 10-30% 29% 29% 72% 71% 75% 50% 50% 50 % Equity securities 25-60 40 40 26 28 23 50 50 50 Real estate 5-20 4 4 1 — 1 — — —
Alternatives(b) 15-50 27 27 1 1 1 — — — Total 100% 100% 100% 100% 100% 100% 100% 100% 100 %
(a) Debt securities primarily include corporate debt, U.S. federal, state, local and non-U.S. government, and mortgage-backed securities. (b) Alternatives primarily include limited partnerships. (c) Represents the U.S. OPEB plan only, as the U.K. OPEB plan is unfunded.
Fair value measurement of the plans’ assets and liabilities
The following details the instruments measured at fair value, in-
cluding the general classification of such instruments pursuant to
the valuation hierarchy, as described in Note 3 on pages 170–187
of this Annual Report.
Cash and cash equivalents Cash and cash equivalents includes currency on hand, demand
deposits with banks or other financial institutions, and any short-
term, highly liquid investments readily convertible into cash (i.e.,
investments with original maturities of three months or less). Due
to the highly liquid nature of these assets, they are classified within
level 1 of the valuation hierarchy.
Equity securities Common and preferred stocks are valued at the closing price re-
ported on the major market on which the individual securities are
traded and are generally classified within level 1 of the valuation
hierarchy. If quoted exchange prices are not available for the spe-
cific security, other independent pricing or broker quotes are con-
sulted for valuation purposes. Consideration is given to the nature
of the quotes (e.g., indicative or firm) and the relationship of re-
cently evidenced market activity to the prices provided from inde-
pendent pricing services. Common and preferred stock that do not
have quoted exchange prices are generally classified within level 2
of the valuation hierarchy.
Common/collective trust funds These investments are public investment vehicles valued based on
the calculated NAV of the fund. Where the funds produce a daily
NAV that is validated by a sufficient level of observable activity
(purchases and sales at NAV), the NAV is used to value the fund
investment and it is classified in level 1 of the valuation hierarchy.
Where adjustments to the NAV are required, for example, with
respect to interests in funds subject to restrictions on redemption
(such as withdrawal limitations) and/or observable activity for the
fund investment is limited, investments are classified within level 2
of the valuation hierarchy.
Limited partnerships Limited partnerships include investments in hedge funds, private
equity funds and real estate funds. Hedge funds are valued based
on quoted NAV and are classified within level 2 or 3 of the valua-
tion hierarchy depending on the level of liquidity and activity in the
markets for each investment. Certain of these hedge fund invest-
ments are subject to restrictions on redemption (such as initial lock-
up periods, withdrawal limitations and illiquid assets) and are
therefore classified within level 3 of the valuation hierarchy. The
valuation of private equity investments and real estate funds re-
quire significant management judgment due to the absence of
quoted market prices, the inherent lack of liquidity and the long-
term nature of such assets and therefore, they are generally classi-
fied within level 3 of the valuation hierarchy. Unfunded commit-
ments to purchase limited partnership investments for the Plans
were $1.1 billion and $1.3 billion for 2010 and 2009, respectively.
Corporate debt securities and U.S. federal, state, local and non-government debt securities The Firm estimates the value of debt instruments using a combina-
tion of observed transaction prices, independent pricing services
and relevant broker quotes. Consideration is given to the nature of
the quotes (e.g., indicative or firm) and the relationship of recently
evidenced market activity to the prices provided from independent
pricing services. The Firm may also use pricing models or dis-
counted cash flows. Such securities are generally classified within
level 2 of the valuation hierarchy.
Mortgage-backed securities MBS include both U.S. government agency and U.S. government-
sponsored enterprise (collectively, “U.S. government agencies”)
securities, and nonagency pass-through securities. U.S. government
agency securities are valued based on quoted prices in active markets
and are therefore classified in level 1 of the valuation hierarchy.
Nonagency securities are primarily “AAA” rated residential and
commercial MBS valued using a combination of observed transaction
prices, independent pricing services and relevant broker quotes.
Consideration is given to the nature of the quotes and the relation-
ships of recently evidenced market activity to the prices provided from
independent pricing services. Such securities are generally classified
within level 2 of the valuation hierarchy.

JPMorgan Chase & Co./2010 Annual Report 207
Derivative receivables and derivative payables In the normal course of business, foreign exchange, credit, interest
rate and equity derivative contracts are used to minimize fluctua-
tions in the value of plan assets caused by exposure to credit or
market risks. These instruments may also be used in lieu of invest-
ing in cash instruments. Exchange traded derivatives valued using
quoted prices are classified within level 1 of the valuation hierarchy.
However, a majority of the derivative instruments are valued using
internally developed models that use as their basis readily observ-
able market parameters and are therefore classified within level 2
of the valuation hierarchy.
Other Other consists of exchange traded funds (“ETFs”), mutual fund
investments, and participating and non-participating annuity con-
tracts (“Annuity Contracts”). ETFs are valued at the closing price
reported on the major market on which the individual securities are
traded and are generally classified within level 1 of the valuation
hierarchy. Mutual fund investments are valued using NAV. Those
fund investments with a daily NAV that are validated by a sufficient
level of observable activity (purchases and sales at NAV) are classified
in level 1 of the valuation hierarchy. Where adjustments to the NAV
are required, for example, for fund investments subject to restrictions
on redemption (such as lock-up periods or withdrawal limitations),
and/or observable activity for the fund investment is limited, the
mutual fund investments are classified in level 2 or 3 of the valuation
hierarchy. Annuity Contracts are valued at the amount by which the
fair value of the assets held in the separate account exceeds the
actuarially determined guaranteed benefit obligation covered under
the Annuity Contracts. Annuity Contracts lack market mechanisms for
transferring each individual policy and generally include restrictions
on the timing of surrender; therefore, these investments are classified
within level 3 of the valuation hierarchy.
Pension and OPEB plan assets and liabilities measured at fair value
U.S. defined benefit pension plans Non-U.S. defined benefit pension plans
December 31, 2010 (in millions)
Level 1 Level 2 Level 3 Total
fair value
Level 1
Level 2
Level 3 Total fair value
Cash and cash equivalents $ — $ — $ — $ — $ 81 $ — $ — $ 81 Equity securities:
Capital equipment 748 9 — 757 68 13 — 81 Consumer goods 712 — — 712 75 21 — 96 Banks and finance companies 414 1 — 415 113 9 — 122 Business services 444 — — 444 53 10 — 63 Energy 195 — — 195 59 6 — 65 Materials 205 — — 205 50 13 — 63 Real Estate 21 — — 21 1 — — 1 Other 857 6 — 863 194 16 — 210 Total equity securities 3,596 16 — 3,612 613 88 — 701
Common/collective trust funds(a) 1,195 756 — 1,951 46 180 — 226 Limited partnerships:
Hedge funds — 959 1,102 2,061 — — — — Private equity funds — — 1,232 1,232 — — — — Real estate — — 304 304 — — — — Total limited partnerships — 959 2,638 3,597 — — — —
Corporate debt securities(b) — 424 1 425 — 718 — 718 U.S. federal, state, local and non-U.S.
government debt securities — 453 — 453 — 864 — 864
Mortgage-backed securities(c) 188 55 — 243 1 — — 1
Derivative receivables(d) 2 194 — 196 — 3 — 3 Other 218 58 387 663 18 51 — 69
Total assets measured at fair value(e)(f) $ 5,199 $ 2,915 $ 3,026 $ 11,140 $ 759 $ 1,904 $ — $ 2,663
Derivative payables — (177) — (177) — (25) — (25 )
Total liabilities measured at fair value $ — $ (177) $ — $ (177)(g) $ — $ (25) $ — $ (25 )

Notes to consolidated financial statements
208 JPMorgan Chase & Co./2010 Annual Report
U.S. defined benefit pension plans Non-U.S. defined benefit pension plans
December 31, 2009 (in millions)
Level 1 Level 2 Level 3 Total
fair value Level 1 Level 2
Level 3 Total fair value
Cash and cash equivalents $ 71 $ — $ — $ 71 $ 27 $ — $ — $ 27Equity securities:
Capital equipment 608 13 — 621 49 16 — 65Consumer goods 554 — — 554 64 18 — 82Banks and finance companies 324 — — 324 90 12 — 102Business services 322 — — 322 39 13 — 52Energy 188 — — 188 45 13 — 58Materials 186 — — 186 35 3 — 38Real estate 19 — — 19 — — — —Other 571 1 — 572 171 — — 171Total equity securities 2,772 14 — 2,786 493 75 — 568
Common/collective trust funds(a) 1,868 610 — 2,478 23 185 — 208Limited partnerships:
Hedge funds — 912 627 1,539 — — — —Private equity funds — — 874 874 — — — —Real estate — — 196 196 — — — —Total limited partnerships — 912 1,697 2,609 — — — —
Corporate debt securities(b) — 941 — 941 — 685 — 685U.S. federal, state, local and non-U.S.
government debt securities — 406 — 406 — 841 — 841
Mortgage-backed securities(c) 169 54 — 223 — — — —
Derivative receivables(d) — 90 — 90 — 5 — 5Other 348 115 334 797 18 89 13 120
Total assets measured at fair value(e)(f) $ 5,228 $ 3,142 $ 2,031 $ 10,401 $ 561 $ 1,880 $ 13 $ 2,454
Derivative payables — (76) — (76) — (30) — (30)
Total liabilities measured at fair value $ — $ (76) $ — $ (76)(g) $ — $ (30) $ — $ (30)
(a) At December 31, 2010 and 2009, common/collective trust funds generally include commingled funds that primarily included 22% and 39%, respectively, of short-term investment funds; 21% and 24%, respectively, of equity (index) investments; and 16% and 15%, respectively, of international investments.
(b) Corporate debt securities include debt securities of U.S. and non-U.S. corporations. (c) At December 31, 2010 and 2009, mortgage-backed securities were generally invested 77% and 72%, respectively, in debt securities issued by U.S. government agen-
cies. (d) At December 31, 2010 and 2009, derivative receivables primarily included 89% and 80%, respectively, of foreign exchange contracts; and 11% and 16%, respectively,
of equity warrants. (e) At December 31, 2010 and 2009, the fair value of investments valued at NAV were $4.1 billion and $4.2 billion, respectively, which were classified within
the valuation hierarchy as follows: $1.3 billion and $2.0 billion in level 1, $1.7 billion and $1.6 billion in level 2 and $1.1 billion and $600 million in level 3. (f) At December 31, 2010 and 2009, excluded U.S. defined benefit pension plan receivables for investments sold and dividends and interest receivables of $52 million and
$82 million, respectively; and excluded non-U.S. defined benefit pension plan receivables for dividends and interest receivables of $9 million and $8 million, respectively. (g) At December 31, 2010 and 2009, excluded $149 million and $177 million, respectively, of U.S. defined benefit pension plan payables for investments purchased; and
$38 million and $12 million, respectively, of other liabilities.
At December 31, 2010 and 2009, the Firm’s OPEB plan was partially funded with COLI policies of $1.4 billion and $1.3 billion, respectively,
which were classified in level 3 of the valuation hierarchy.

JPMorgan Chase & Co./2010 Annual Report 209
Changes in level 3 fair value measurements using significant unobservable inputs
Year ended December 31, 2010 (in millions)
Fair value, January 1, 2010
Total realized/ unrealized
gains/(losses)(a) Purchases, sales
and settlements, net Transfers in and/or
out of level 3
Fair value, December 31, 2010
U.S. defined benefit pension plans Limited partnerships: Hedge funds $ 627 $ 8 $ 388 $ 79 $ 1,102Private equity funds 874 111 235 12 1,232Real estate 196 19 89 — 304Total limited partnerships $ 1,697 $ 138 $ 712 $ 91 $ 2,638Corporate debt securities — — — 1 1Other 334 53 — — 387 Total U.S. plans $ 2,031 $ 191 $ 712 $ 92 $ 3,026Non-U.S. defined benefit pension plans Other $ 13 $ (1) $ (12) $ — $ — Total non-U.S. plans $ 13 $ (1) $ (12) $ — $ —OPEB plans COLI $ 1,269 $ 137 $ (25) $ — $ 1,381Total OPEB plans $ 1,269 $ 137 $ (25) $ — $ 1,381
Year ended December 31, 2009 (in millions)
Fair value, January 1, 2009
Total realized/ unrealized
gains/(losses)(a) Purchases, sales
and settlements, net Transfers in and/or
out of level 3
Fair value, December 31, 2009
U.S. defined benefit pension plans Limited partnerships: Hedge funds $ 524 $ 112 $ (9) $ — $ 627Private equity funds 810 (1) 80 (15) 874Real estate 203 (107) 100 — 196Total limited partnerships $ 1,537 $ 4 $ 171 $ (15) $ 1,697Corporate debt securities — — — — —Other 315 19 — — 334 Total U.S. plans $ 1,852 $ 23 $ 171 $ (15) $ 2,031Non-U.S. defined benefit pension plans Other $ 14 $ (1) $ — $ — $ 13 Total non-U.S. plans $ 14 $ (1) $ — $ — $ 13OPEB plans COLI $ 1,126 $ 172 $ (29) $ — $ 1,269Total OPEB plans $ 1,126 $ 172 $ (29) $ — $ 1,269
(a) For the years ended December 31, 2010, and 2009, respectively, total realized (unrealized) gains/(losses) are the changes in unrealized gains or losses relating to assets held at December 31, 2010 and 2009, respectively.
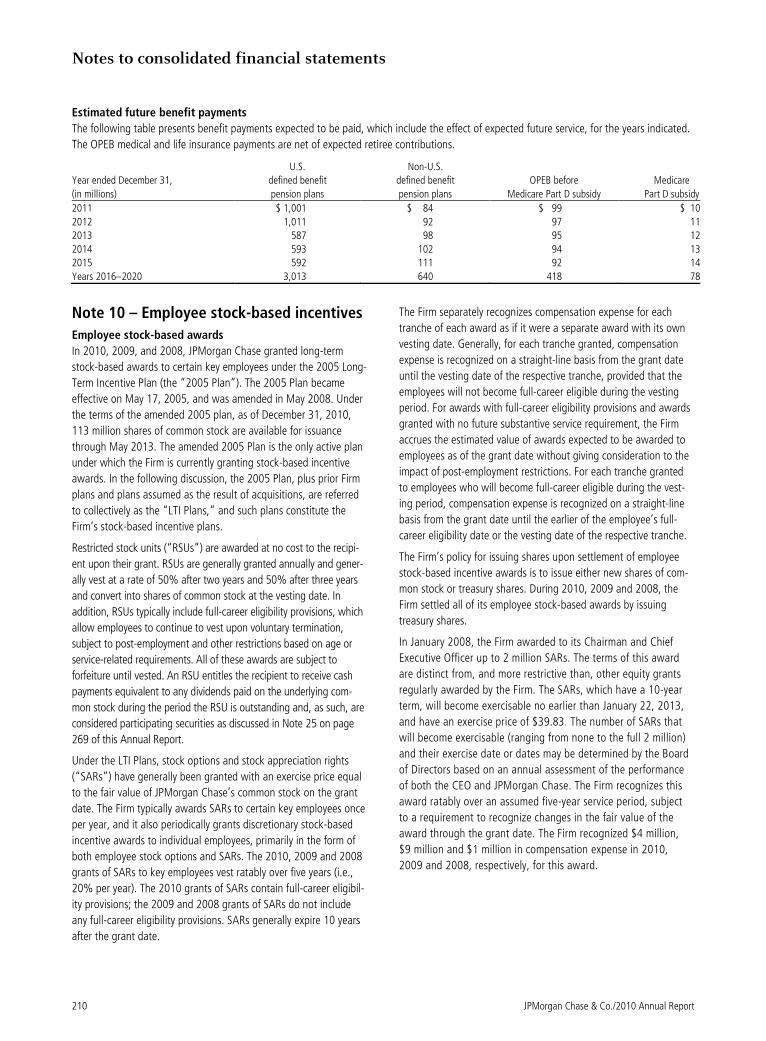
Notes to consolidated financial statements
210 JPMorgan Chase & Co./2010 Annual Report
Estimated future benefit payments
The following table presents benefit payments expected to be paid, which include the effect of expected future service, for the years indicated.
The OPEB medical and life insurance payments are net of expected retiree contributions.
U.S. Non-U.S.
Year ended December 31, defined benefit defined benefit OPEB before Medicare
(in millions) pension plans pension plans Medicare Part D subsidy Part D subsidy
2011 $ 1,001 $ 84 $ 99 $ 10
2012 1,011 92 97 11
2013 587 98 95 12
2014 593 102 94 13
2015 592 111 92 14
Years 2016–2020 3,013 640 418 78
Note 10 – Employee stock-based incentives
Employee stock-based awards
In 2010, 2009, and 2008, JPMorgan Chase granted long-term
stock-based awards to certain key employees under the 2005 Long-
Term Incentive Plan (the “2005 Plan”). The 2005 Plan became
effective on May 17, 2005, and was amended in May 2008. Under
the terms of the amended 2005 plan, as of December 31, 2010,
113 million shares of common stock are available for issuance
through May 2013. The amended 2005 Plan is the only active plan
under which the Firm is currently granting stock-based incentive
awards. In the following discussion, the 2005 Plan, plus prior Firm
plans and plans assumed as the result of acquisitions, are referred
to collectively as the “LTI Plans,” and such plans constitute the
Firm’s stock-based incentive plans.
Restricted stock units (“RSUs”) are awarded at no cost to the recipi-
ent upon their grant. RSUs are generally granted annually and gener-
ally vest at a rate of 50% after two years and 50% after three years
and convert into shares of common stock at the vesting date. In
addition, RSUs typically include full-career eligibility provisions, which
allow employees to continue to vest upon voluntary termination,
subject to post-employment and other restrictions based on age or
service-related requirements. All of these awards are subject to
forfeiture until vested. An RSU entitles the recipient to receive cash
payments equivalent to any dividends paid on the underlying com-
mon stock during the period the RSU is outstanding and, as such, are
considered participating securities as discussed in Note 25 on page
269 of this Annual Report.
Under the LTI Plans, stock options and stock appreciation rights
(“SARs”) have generally been granted with an exercise price equal
to the fair value of JPMorgan Chase’s common stock on the grant
date. The Firm typically awards SARs to certain key employees once
per year, and it also periodically grants discretionary stock-based
incentive awards to individual employees, primarily in the form of
both employee stock options and SARs. The 2010, 2009 and 2008
grants of SARs to key employees vest ratably over five years (i.e.,
20% per year). The 2010 grants of SARs contain full-career eligibil-
ity provisions; the 2009 and 2008 grants of SARs do not include
any full-career eligibility provisions. SARs generally expire 10 years
after the grant date.
The Firm separately recognizes compensation expense for each
tranche of each award as if it were a separate award with its own
vesting date. Generally, for each tranche granted, compensation
expense is recognized on a straight-line basis from the grant date
until the vesting date of the respective tranche, provided that the
employees will not become full-career eligible during the vesting
period. For awards with full-career eligibility provisions and awards
granted with no future substantive service requirement, the Firm
accrues the estimated value of awards expected to be awarded to
employees as of the grant date without giving consideration to the
impact of post-employment restrictions. For each tranche granted
to employees who will become full-career eligible during the vest-
ing period, compensation expense is recognized on a straight-line
basis from the grant date until the earlier of the employee’s full-
career eligibility date or the vesting date of the respective tranche.
The Firm’s policy for issuing shares upon settlement of employee
stock-based incentive awards is to issue either new shares of com-
mon stock or treasury shares. During 2010, 2009 and 2008, the
Firm settled all of its employee stock-based awards by issuing
treasury shares.
In January 2008, the Firm awarded to its Chairman and Chief
Executive Officer up to 2 million SARs. The terms of this award
are distinct from, and more restrictive than, other equity grants
regularly awarded by the Firm. The SARs, which have a 10-year
term, will become exercisable no earlier than January 22, 2013,
and have an exercise price of $39.83. The number of SARs that
will become exercisable (ranging from none to the full 2 million)
and their exercise date or dates may be determined by the Board
of Directors based on an annual assessment of the performance
of both the CEO and JPMorgan Chase. The Firm recognizes this
award ratably over an assumed five-year service period, subject
to a requirement to recognize changes in the fair value of the
award through the grant date. The Firm recognized $4 million,
$9 million and $1 million in compensation expense in 2010,
2009 and 2008, respectively, for this award.
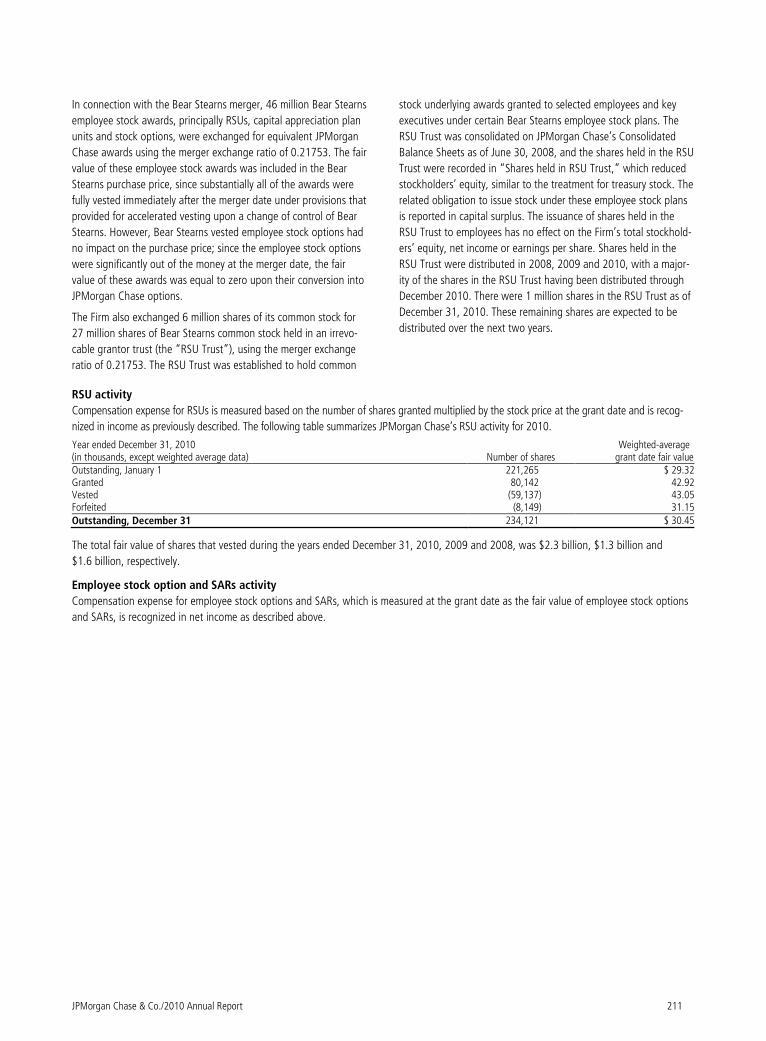
JPMorgan Chase & Co./2010 Annual Report 211
In connection with the Bear Stearns merger, 46 million Bear Stearns
employee stock awards, principally RSUs, capital appreciation plan
units and stock options, were exchanged for equivalent JPMorgan
Chase awards using the merger exchange ratio of 0.21753. The fair
value of these employee stock awards was included in the Bear
Stearns purchase price, since substantially all of the awards were
fully vested immediately after the merger date under provisions that
provided for accelerated vesting upon a change of control of Bear
Stearns. However, Bear Stearns vested employee stock options had
no impact on the purchase price; since the employee stock options
were significantly out of the money at the merger date, the fair
value of these awards was equal to zero upon their conversion into
JPMorgan Chase options.
The Firm also exchanged 6 million shares of its common stock for
27 million shares of Bear Stearns common stock held in an irrevo-
cable grantor trust (the “RSU Trust”), using the merger exchange
ratio of 0.21753. The RSU Trust was established to hold common
stock underlying awards granted to selected employees and key
executives under certain Bear Stearns employee stock plans. The
RSU Trust was consolidated on JPMorgan Chase’s Consolidated
Balance Sheets as of June 30, 2008, and the shares held in the RSU
Trust were recorded in “Shares held in RSU Trust,” which reduced
stockholders’ equity, similar to the treatment for treasury stock. The
related obligation to issue stock under these employee stock plans
is reported in capital surplus. The issuance of shares held in the
RSU Trust to employees has no effect on the Firm’s total stockhold-
ers’ equity, net income or earnings per share. Shares held in the
RSU Trust were distributed in 2008, 2009 and 2010, with a major-
ity of the shares in the RSU Trust having been distributed through
December 2010. There were 1 million shares in the RSU Trust as of
December 31, 2010. These remaining shares are expected to be
distributed over the next two years.
RSU activity
Compensation expense for RSUs is measured based on the number of shares granted multiplied by the stock price at the grant date and is recog-
nized in income as previously described. The following table summarizes JPMorgan Chase’s RSU activity for 2010.
Year ended December 31, 2010 (in thousands, except weighted average data) Number of shares
Weighted-average grant date fair value
Outstanding, January 1 221,265 $ 29.32Granted 80,142 42.92Vested (59,137) 43.05Forfeited (8,149) 31.15Outstanding, December 31 234,121 $ 30.45
The total fair value of shares that vested during the years ended December 31, 2010, 2009 and 2008, was $2.3 billion, $1.3 billion and
$1.6 billion, respectively.
Employee stock option and SARs activity
Compensation expense for employee stock options and SARs, which is measured at the grant date as the fair value of employee stock options
and SARs, is recognized in net income as described above.

Notes to consolidated financial statements
212 JPMorgan Chase & Co./2010 Annual Report
The following table summarizes JPMorgan Chase’s employee stock option and SARs activity for the year ended December 31, 2010, including
awards granted to key employees and awards granted in prior years under broad-based plans.
Year ended December 31, 2010 (in thousands, except weighted-average data, and where otherwise noted)
Number of options/SARs
Weighted-average exercise price
Weighted-average remaining contractual life (in years)
Aggregate intrinsic value
Outstanding, January 1 266,568 $ 45.83 Granted 20,949 42.96 Exercised (12,870) 30.69 Forfeited (3,076) 34.82 Canceled (37,044) 65.95 Outstanding, December 31 234,527 $ 43.33 3.4 $ 1,191,151Exercisable, December 31 181,183 45.52 2.1 788,217
The weighted-average grant date per share fair value of stock
options and SARs granted during the years ended December 31,
2010, 2009 and 2008, was $12.27, $8.24 and $10.36, respec-
tively. The total intrinsic value of options exercised during the years
ended December 31, 2010, 2009 and 2008, was $154 million,
$154 million and $391 million, respectively.
Compensation expense
The Firm recognized the following noncash compensation expense
related to its various employee stock-based incentive plans in its
Consolidated Statements of Income.
Year ended December 31, (in millions) 2010 2009 2008 Cost of prior grants of RSUs and SARs
that are amortized over their appli-cable vesting periods $ 2,479 $ 2,510 $ 2,228
Accrual of estimated costs of RSUs and SARs to be granted in future periods including those to full-career eligible employees 772 845 409
Total noncash compensation expense related to employee stock-based incentive plans $ 3,251 $ 3,355 $ 2,637
At December 31, 2010, approximately $1.5 billion (pretax) of
compensation cost related to unvested awards had not yet been
charged to net income. That cost is expected to be amortized into
compensation expense over a weighted-average period of 0.9
years. The Firm does not capitalize any compensation cost related
to share-based compensation awards to employees.
Cash flows and tax benefits
Income tax benefits related to stock-based incentive arrangements
recognized in the Firm’s Consolidated Statements of Income for
the years ended December 31, 2010, 2009 and 2008, were $1.3
billion, $1.3 billion and $1.1 billion, respectively.
The following table sets forth the cash received from the exercise
of stock options under all stock-based incentive arrangements, and
the actual income tax benefit realized related to tax deductions
from the exercise of the stock options.
Year ended December 31, (in millions) 2010 2009 2008 Cash received for options exercised $ 205 $ 437 $1,026 Tax benefit realized 14 11 72
In June 2007, the FASB ratified guidance which requires that
realized tax benefits from dividends or dividend equivalents paid
on equity-classified share-based payment awards that are
charged to retained earnings be recorded as an increase to
additional paid-in capital and included in the pool of excess tax
benefits available to absorb tax deficiencies on share-based
payment awards. Prior to the issuance of this guidance, the Firm
did not include these tax benefits as part of this pool of excess
tax benefits. The Firm adopted this guidance on January 1, 2008;
its adoption did not have an impact on the Firm’s Consolidated
Balance Sheets or results of operations.
Valuation assumptions
The following table presents the assumptions used to value employee
stock options and SARs granted during the years ended December 31,
2010, 2009 and 2008, under the Black-Scholes valuation model.
Year ended December 31, 2010 2009 2008 Weighted-average annualized
valuation assumptions Risk-free interest rate 3.89% 2.33% 3.90 %
Expected dividend yield(a) 3.13 3.40 3.57 Expected common stock price volatility
37 56 34
Expected life (in years) 6.4 6.6 6.8
(a) In 2010 and 2009, the expected dividend yield was determined using historical dividend yields.
The expected volatility assumption is derived from the implied
volatility of JPMorgan Chase’s publicly traded stock options.
The expected life assumption is an estimate of the length of time
that an employee might hold an option or SAR before it is exer-
cised or canceled, and the assumption is based on the Firm’s
historical experience.

JPMorgan Chase & Co./2010 Annual Report 213
Note 11 – Noninterest expense The following table presents the components of noninterest expense.
Year ended December 31, (in millions) 2010 2009 2008
Compensation expense(a) $ 28,124 $ 26,928 $ 22,746Noncompensation expense:
Occupancy expense 3,681 3,666 3,038Technology, communications and equipment expense 4,684 4,624 4,315Professional and outside services 6,767 6,232 6,053Marketing 2,446 1,777 1,913
Other expense(b)(c)(d) 14,558 7,594 3,740Amortization of intangibles 936 1,050 1,263
Total noncompensation expense 33,072 24,943 20,322Merger costs — 481 432Total noninterest expense $ 61,196 $ 52,352 $ 43,500
(a) 2010 includes a payroll tax expense related to the United Kingdom (“U.K.”) Bank Payroll Tax on certain compensation awarded from December 9, 2009, to April 5, 2010, to relevant banking employees.
(b) In 2010, 2009 and 2008, included litigation expense of $7.4 billion, $161 million and a net benefit of $781 million, respectively. (c) Includes foreclosed property expense of $1.0 billion, $1.4 billion and $213 million in 2010, 2009 and 2008, respectively. (d) Expense for 2009 included a $675 million FDIC special assessment.
Merger costs
Costs associated with the Bear Stearns merger and the Washington Mutual transaction in 2008 are reflected in the merger costs caption of the
Consolidated Statements of Income. For a further discussion of the Bear Stearns merger and the Washington Mutual transaction, see Note 2
on pages 166–170 of this Annual Report. A summary of merger-related costs is shown in the following table.
2009 2008 Year ended December 31, (in millions)
Bear Stearns
Washington Mutual Total
Bear Stearns
Washington Mutual Total
Expense category Compensation $ (9) $ 256 $ 247 $ 181 $ 113 $ 294 Occupancy (3) 15 12 42 — 42 Technology and communications and other 38 184 222 85 11 96
Total(a)(b) $ 26 $ 455 $ 481 $ 308 $ 124 $ 432
(a) With the exception of occupancy- and technology-related write-offs, all of the costs in the table required the expenditure of cash. (b) There were no merger costs for 2010.
The table below shows changes in the merger reserve balance related to costs associated with the above transactions.
2010 2009 2008 Year ended December 31, (in millions)
Bear Stearns
Washington Mutual Total
Bear Stearns
Washington Mutual Total
Bear Stearns
Washington Mutual Total
Merger reserve balance, beginning of period $ 32 $ 57 $ 89 $ 327 $ 441 $ 768 $ — $ — $ —
Recorded as merger costs(a) — — — 26 455 481 308 124 432Recorded as goodwill — — — (5) — (5) 1,112 435 1,547 Utilization of merger reserve (32) (57) (89) (316) (839) (1,155) (1,093) (118) (1,211) Merger reserve balance, end
of period $ — $ — $ — $ 32 $ 57 $ 89 $ 327 $ 441 $ 768
(a) There were no merger costs for 2010.

Notes to consolidated financial statements
214 JPMorgan Chase & Co./2010 Annual Report
Note 12 – Securities
Securities are classified as AFS, held-to-maturity (“HTM”) or trad-
ing. Trading securities are discussed in Note 3 on pages 170–187
of this Annual Report. Securities are classified primarily as AFS
when used to manage the Firm’s exposure to interest rate move-
ments or used for longer-term strategic purposes. AFS securities are
carried at fair value on the Consolidated Balance Sheets. Unrealized
gains and losses, after any applicable hedge accounting adjust-
ments, are reported as net increases or decreases to accumulated
other comprehensive income/(loss). The specific identification
method is used to determine realized gains and losses on AFS
securities, which are included in securities gains/(losses) on the
Consolidated Statements of Income. Securities that the Firm has the
positive intent and ability to hold to maturity are classified as HTM
and are carried at amortized cost on the Consolidated Balance
Sheets. The Firm has not classified new purchases of securities as
HTM for the past several years.
Other-than-temporary impairment
AFS debt and equity securities in unrealized loss positions are
analyzed as part of the Firm’s ongoing assessment of other-than-
temporary impairment (“OTTI”). For debt securities, the Firm con-
siders a decline in fair value to be other-than-temporary when the
Firm does not expect to recover the entire amortized cost basis of
the security. The Firm also considers an OTTI to have occurred when
there is an adverse change in cash flows to beneficial interests in
securitizations that are rated below “AA” at their acquisition, or
that can be contractually prepaid or otherwise settled in such a way
that the Firm would not recover substantially all of its recorded
investment. For AFS equity securities, the Firm considers a decline
in fair value to be other-than-temporary if it is probable that the
Firm will not recover its amortized cost basis.
For debt securities, OTTI losses must be recognized in earnings if an
investor has the intent to sell the debt security, or if it is more likely
than not that the investor will be required to sell the debt security
before recovery of its amortized cost basis. However, even if an
investor does not expect to sell a debt security, it must evaluate the
expected cash flows to be received and determine if a credit loss
exists. In the event of a credit loss, only the amount of impairment
associated with the credit loss is recognized in income. Amounts
relating to factors other than credit losses are recorded in OCI.
When the Firm intends to sell AFS debt or equity securities, it
recognizes an impairment loss equal to the full difference between
the amortized cost basis and the fair value of those securities.
When the Firm does not intend to sell AFS debt or equity securities
in an unrealized loss position, potential OTTI is considered using a
variety of factors, including the length of time and extent to which
the market value has been less than cost; adverse conditions spe-
cifically related to the industry, geographic area or financial condi-
tion of the issuer or underlying collateral of a security; payment
structure of the security; changes to the rating of the security by a
rating agency; the volatility of the fair value changes; and changes
in fair value of the security after the balance sheet date. For debt
securities, the Firm estimates cash flows over the remaining lives of
the underlying collateral to assess whether credit losses exist and,
where applicable for purchased or retained beneficial interests in
securitized assets, to determine if any adverse changes in cash
flows have occurred. The Firm’s cash flow estimates take into
account expectations of relevant market and economic data as of
the end of the reporting period. For securities issued in a securitiza-
tion, the Firm also takes into consideration underlying loan-level
data, and structural features of the securitization, such as subordi-
nation, excess spread, overcollateralization or other forms of credit
enhancement, and compares the losses projected for the underlying
collateral (“pool losses”) against the level of credit enhancement in
the securitization structure to determine whether these features are
sufficient to absorb the pool losses, or whether a credit loss on the
AFS debt security exists. The Firm also performs other analyses to
support its cash flow projections, such as first-loss analyses or
stress scenarios.
For equity securities, the Firm considers the above factors, as well
as the Firm’s intent and ability to retain its investment for a period
of time sufficient to allow for any anticipated recovery in market
value, and whether evidence exists to support a realizable value
equal to or greater than the carrying value.
Realized gains and losses
The following table presents realized gains and losses from AFS
securities.
Year ended December 31, (in millions) 2010 2009 2008 Realized gains $ 3,382 $ 2,268 $ 1,890
Realized losses (317) (580) (330 )(c)
Net realized gains(a) 3,065 1,688 1,560 Credit losses included in securities
gains(b) (100) (578) NA Net securities gains $ 2,965 $ 1,110 $ 1,560
(a) Proceeds from securities sold were within approximately 3% of amortized cost in 2010 and 2009 and within approximately 2% of amortized cost in 2008.
(b) Includes other-than-temporary impairment losses recognized in income on certain prime mortgage-backed securities and obligations of U.S. states and municipali-ties for the year ended December 31, 2010, and on certain subprime and prime mortgage-backed securities and obligations of U.S. states and municipalities for the year ended December 31, 2009.
(c) Includes $76 million of losses due to other-than temporary impairment of subprime mortgage-backed securities.

JPMorgan Chase & Co./2010 Annual Report 215
The amortized costs and estimated fair values of AFS and HTM securities were as follows at December 31, 2010 and 2009.
2010 2009
December 31, (in millions) Amortized
cost
Gross unrealized
gains
Gross unrealized
losses Fair
value Amortized cost
Gross unrealized
gains
Gross unrealized
losses Fair. value
Available-for-sale debt securities Mortgage-backed securities:
U.S. government agencies(a) $ 117,364 $ 3,159 $ 297 $ 120,226 $ 166,094 $ 2,412 $ 608 $ 167,898 Residential:
Prime and Alt-A 2,173 81 250(d) 2,004 5,234 96 807(d) 4,523 Subprime — — — — 17 — — 17 Non-U.S. 47,089 290 409 46,970 10,003 320 65 10,258
Commercial 5,169 502 17 5,654 4,521 132 63 4,590 Total mortgage-backed securities 171,795 4,032 973 174,854 185,869 2,960 1,543 187,286 U.S. Treasury and government
agencies(a) 11,258 118 28 11,348 30,044 88 135 29,997 Obligations of U.S. states and
municipalities 11,732 165 338 11,559 6,270 292 25 6,537 Certificates of deposit 3,648 1 2 3,647 2,649 1 — 2,650 Non-U.S. government debt securities 20,614 191 28 20,777 24,320 234 51 24,503
Corporate debt securities(b) 61,718 495 419 61,794 61,226 812 30 62,008 Asset-backed securities:
Credit card receivables 7,278 335 5 7,608 25,266 502 26 25,742 Collateralized loan obligations 13,336 472 210 13,598 12,172 413 436 12,149 Other 8,968 130 16 9,082 6,719 129 54 6,794 Total available-for-sale debt
securities 310,347 5,939 2,019(d) 314,267 354,535 5,431 2,300(d) 357,666 Available-for-sale equity securities 1,894 163 6 2,051 2,518 185 4 2,699
Total available-for-sale securities $ 312,241 $ 6,102 $ 2,025(d) $ 316,318 $ 357,053 $ 5,616 $ 2,304(d) $ 360,365
Total held-to-maturity securities(c) $ 18 $ 2 $ — $ 20 $ 25 $ 2 $ — $27
(a) Includes total U.S. government-sponsored enterprise obligations with fair values of $94.2 billion and $153.0 billion at December 31, 2010 and 2009, respectively, which were predominantly mortgage-related.
(b) Consists primarily of bank debt including sovereign government-guaranteed bank debt. (c) Consists primarily of mortgage-backed securities issued by U.S. government-sponsored enterprises. (d) Includes a total of $133 million and $368 million (before tax) of unrealized losses related to prime mortgage-backed securities for which credit losses have been recog-
nized in income at December 31, 2010 and 2009, respectively. These unrealized losses are not credit-related and remain reported in AOCI.

Notes to consolidated financial statements
216 JPMorgan Chase & Co./2010 Annual Report
Securities impairment
The following table presents the fair value and gross unrealized losses for AFS securities by aging category at December 31, 2010 and 2009.
Securities with gross unrealized losses Less than 12 months 12 months or more
December 31, 2010 (in millions) Fair value
Gross unrealized
losses Fair value
Gross unrealized
losses Total fair
value
Total gross unrealized
losses Available-for-sale debt securities Mortgage-backed securities:
U.S. government agencies $ 14,039 $ 297 $ — $ — $ 14,039 $ 297Residential: Prime and Alt-A — — 1,193 250 1,193 250 Subprime — — — — — — Non-U.S. 35,166 379 1,080 30 36,246 409Commercial 548 14 11 3 559 17
Total mortgage-backed securities 49,753 690 2,284 283 52,037 973U.S. Treasury and government agencies 921 28 — — 921 28Obligations of U.S. states and municipalities 6,890 330 20 8 6,910 338Certificates of deposit 1,771 2 — — 1,771 2Non-U.S. government debt securities 6,960 28 — — 6,960 28Corporate debt securities 18,783 418 90 1 18,873 419Asset-backed securities:
Credit card receivables — — 345 5 345 5Collateralized loan obligations 460 10 6,321 200 6,781 210Other 2,615 9 32 7 2,647 16
Total available-for-sale debt securities 88,153 1,515 9,092 504 97,245 2,019Available-for-sale equity securities — — 2 6 2 6
Total securities with gross unrealized losses $ 88,153 $ 1,515 $ 9,094 $ 510 $ 97,247 $ 2,025
Securities with gross unrealized losses Less than 12 months 12 months or more
December 31, 2009 (in millions) Fair value
Gross unrealized
losses Fair value
Gross unrealized
losses Total fair
value
Total gross unrealized
losses Available-for-sale debt securities Mortgage-backed securities:
U.S. government agencies $ 43,235 $ 603 $ 644 $ 5 $ 43,879 $ 608 Residential: Prime and Alt-A 183 27 3,032 780 3,215 807 Subprime — — — — — — Non-U.S. 391 1 1,773 64 2,164 65 Commercial 679 34 229 29 908 63
Total mortgage-backed securities 44,488 665 5,678 878 50,166 1,543 U.S. Treasury and government agencies 8,433 135 — — 8,433 135 Obligations of U.S. states and municipalities 472 11 389 14 861 25 Certificates of deposit — — — — — — Non-U.S. government debt securities 2,471 46 835 5 3,306 51 Corporate debt securities 1,831 12 4,634 18 6,465 30 Asset-backed securities:
Credit card receivables — — 745 26 745 26 Collateralized loan obligations 42 1 7,883 435 7,925 436 Other 767 8 1,767 46 2,534 54
Total available-for-sale debt securities 58,504 878 21,931 1,422 80,435 2,300 Available-for-sale equity securities 1 1 3 3 4 4
Total securities with gross unrealized losses $ 58,505 $ 879 $ 21,934 $ 1,425 $ 80,439 $ 2,304
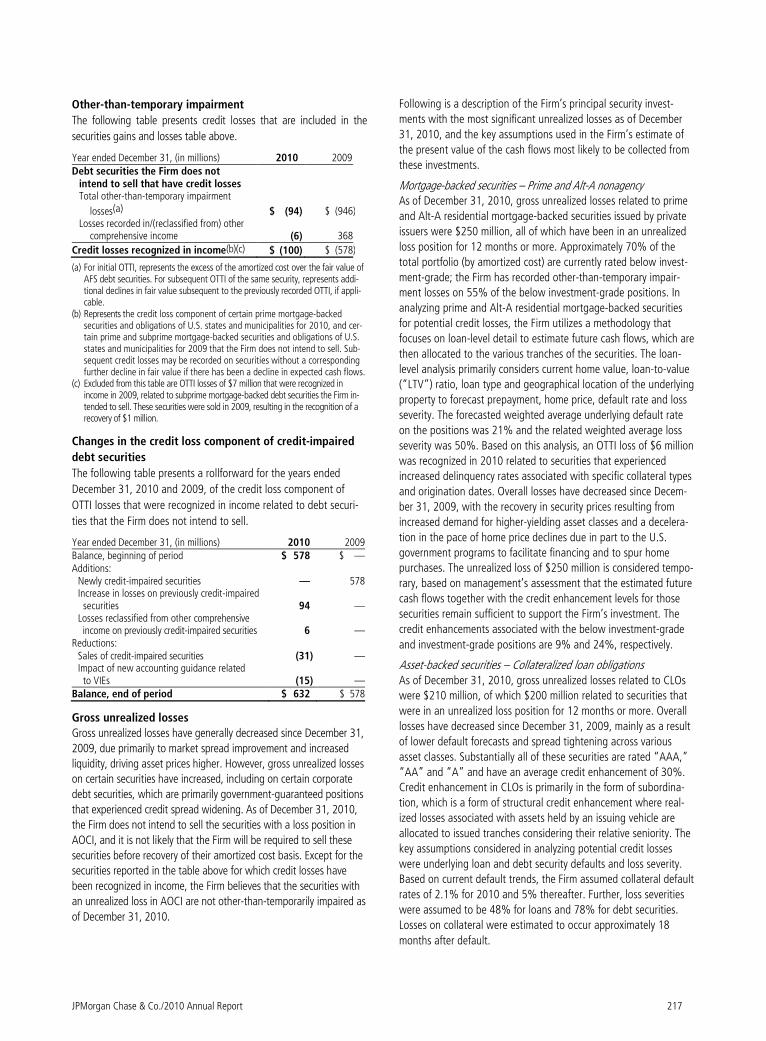
JPMorgan Chase & Co./2010 Annual Report 217
Other-than-temporary impairment
The following table presents credit losses that are included in the
securities gains and losses table above.
Year ended December 31, (in millions) 2010 2009 Debt securities the Firm does not
intend to sell that have credit losses Total other-than-temporary impairment
losses(a) $ (94) $ (946 ) Losses recorded in/(reclassified from) other
comprehensive income (6) 368
Credit losses recognized in income(b)(c) $ (100) $ (578 )
(a) For initial OTTI, represents the excess of the amortized cost over the fair value of AFS debt securities. For subsequent OTTI of the same security, represents addi-tional declines in fair value subsequent to the previously recorded OTTI, if appli-cable.
(b) Represents the credit loss component of certain prime mortgage-backed securities and obligations of U.S. states and municipalities for 2010, and cer-tain prime and subprime mortgage-backed securities and obligations of U.S. states and municipalities for 2009 that the Firm does not intend to sell. Sub-sequent credit losses may be recorded on securities without a corresponding further decline in fair value if there has been a decline in expected cash flows.
(c) Excluded from this table are OTTI losses of $7 million that were recognized in income in 2009, related to subprime mortgage-backed debt securities the Firm in-tended to sell. These securities were sold in 2009, resulting in the recognition of a recovery of $1 million.
Changes in the credit loss component of credit-impaired
debt securities
The following table presents a rollforward for the years ended
December 31, 2010 and 2009, of the credit loss component of
OTTI losses that were recognized in income related to debt securi-
ties that the Firm does not intend to sell.
Year ended December 31, (in millions) 2010 2009 Balance, beginning of period $ 578 $ — Additions:
Newly credit-impaired securities — 578 Increase in losses on previously credit-impaired securities 94 — Losses reclassified from other comprehensive income on previously credit-impaired securities 6 —
Reductions: Sales of credit-impaired securities (31) — Impact of new accounting guidance related to VIEs (15) —
Balance, end of period $ 632 $ 578
Gross unrealized losses
Gross unrealized losses have generally decreased since December 31,
2009, due primarily to market spread improvement and increased
liquidity, driving asset prices higher. However, gross unrealized losses
on certain securities have increased, including on certain corporate
debt securities, which are primarily government-guaranteed positions
that experienced credit spread widening. As of December 31, 2010,
the Firm does not intend to sell the securities with a loss position in
AOCI, and it is not likely that the Firm will be required to sell these
securities before recovery of their amortized cost basis. Except for the
securities reported in the table above for which credit losses have
been recognized in income, the Firm believes that the securities with
an unrealized loss in AOCI are not other-than-temporarily impaired as
of December 31, 2010.
Following is a description of the Firm’s principal security invest-
ments with the most significant unrealized losses as of December
31, 2010, and the key assumptions used in the Firm’s estimate of
the present value of the cash flows most likely to be collected from
these investments.
Mortgage-backed securities – Prime and Alt-A nonagency As of December 31, 2010, gross unrealized losses related to prime
and Alt-A residential mortgage-backed securities issued by private
issuers were $250 million, all of which have been in an unrealized
loss position for 12 months or more. Approximately 70% of the
total portfolio (by amortized cost) are currently rated below invest-
ment-grade; the Firm has recorded other-than-temporary impair-
ment losses on 55% of the below investment-grade positions. In
analyzing prime and Alt-A residential mortgage-backed securities
for potential credit losses, the Firm utilizes a methodology that
focuses on loan-level detail to estimate future cash flows, which are
then allocated to the various tranches of the securities. The loan-
level analysis primarily considers current home value, loan-to-value
(“LTV”) ratio, loan type and geographical location of the underlying
property to forecast prepayment, home price, default rate and loss
severity. The forecasted weighted average underlying default rate
on the positions was 21% and the related weighted average loss
severity was 50%. Based on this analysis, an OTTI loss of $6 million
was recognized in 2010 related to securities that experienced
increased delinquency rates associated with specific collateral types
and origination dates. Overall losses have decreased since Decem-
ber 31, 2009, with the recovery in security prices resulting from
increased demand for higher-yielding asset classes and a decelera-
tion in the pace of home price declines due in part to the U.S.
government programs to facilitate financing and to spur home
purchases. The unrealized loss of $250 million is considered tempo-
rary, based on management’s assessment that the estimated future
cash flows together with the credit enhancement levels for those
securities remain sufficient to support the Firm’s investment. The
credit enhancements associated with the below investment-grade
and investment-grade positions are 9% and 24%, respectively.
Asset-backed securities – Collateralized loan obligations As of December 31, 2010, gross unrealized losses related to CLOs
were $210 million, of which $200 million related to securities that
were in an unrealized loss position for 12 months or more. Overall
losses have decreased since December 31, 2009, mainly as a result
of lower default forecasts and spread tightening across various
asset classes. Substantially all of these securities are rated “AAA,”
“AA” and “A” and have an average credit enhancement of 30%.
Credit enhancement in CLOs is primarily in the form of subordina-
tion, which is a form of structural credit enhancement where real-
ized losses associated with assets held by an issuing vehicle are
allocated to issued tranches considering their relative seniority. The
key assumptions considered in analyzing potential credit losses
were underlying loan and debt security defaults and loss severity.
Based on current default trends, the Firm assumed collateral default
rates of 2.1% for 2010 and 5% thereafter. Further, loss severities
were assumed to be 48% for loans and 78% for debt securities.
Losses on collateral were estimated to occur approximately 18
months after default.

Notes to consolidated financial statements
218 JPMorgan Chase & Co./2010 Annual Report
Contractual maturities and yields
The following table presents the amortized cost and estimated fair value at December 31, 2010, of JPMorgan Chase’s AFS and HTM securities
by contractual maturity.
By remaining maturity December 31, 2010 (in millions)
Due in one year or less
Due after one year through five years
Due after five years through 10 years
Due after
10 years(c) Total Available-for-sale debt securities
Mortgage-backed securities:(a) Amortized cost $ 15 $ 259 $ 2,781 $ 168,740 $ 171,795 Fair value 15 282 2,825 171,732 174,854
Average yield(b) 8.63% 6.25% 2.71% 3.85% 3.84 %
U.S. Treasury and government agencies:(a) Amortized cost $ 1,843 $ 4,913 $ 4,251 $ 251 $ 11,258 Fair value 1,850 5,007 4,260 231 11,348
Average yield(b) 1.68% 2.62% 3.84% 3.86% 2.95 %
Obligations of U.S. states and municipalities: Amortized cost $ 39 $ 160 $ 333 $ 11,200 $ 11,732 Fair value 39 167 351 11,002 11,559
Average yield(b) 3.21% 4.30% 5.25% 5.07% 5.06 % Certificates of deposit:
Amortized cost $ 3,642 $ 6 $ — $ — $ 3,648 Fair value 3,641 6 — — 3,647
Average yield(b) 5.16% 10.75% —% —% 5.17 % Non-U.S. government debt securities:
Amortized cost $ 5,666 $ 13,557 $ 1,388 $ 3 $ 20,614 Fair value 5,673 13,712 1,389 3 20,777
Average yield(b) 1.81% 2.23% 3.56% 5.34% 2.21 % Corporate debt securities:
Amortized cost $ 12,515 $ 44,137 $ 5,065 $ 1 $ 61,718 Fair value 12,597 44,100 5,096 1 61,794
Average yield(b) 2.25% 2.19% 4.81% 1.07% 2.42 % Asset-backed securities:
Amortized cost $ 38 $ 3,371 $ 13,567 $ 12,606 $ 29,582 Fair value 38 3,454 14,041 12,755 30,288
Average yield(b) 8.94% 2.05% 2.48% 2.19% 2.32 % Total available-for-sale debt securities
Amortized cost $ 23,758 $ 66,403 $ 27,385 $ 192,801 $ 310,347 Fair value 23,853 66,728 27,962 195,724 314,267
Average yield(b) 2.56% 2.24% 3.23% 3.81% 3.33 % Available-for-sale equity securities
Amortized cost $ — $ — $ — $ 1,894 $ 1,894 Fair value — — — 2,051 2,051
Average yield(b) —% —% —% 0.29% 0.29 % Total available-for-sale securities
Amortized cost $ 23,758 $ 66,403 $ 27,385 $ 194,695 $ 312,241 Fair value 23,853 66,728 27,962 197,775 316,318
Average yield(b) 2.56% 2.24% 3.23% 3.78% 3.31 % Total held-to-maturity securities
Amortized cost $ — $ 6 $ 11 $ 1 $ 18 Fair value — 6 12 2 20
Average yield(b) —% 6.97% 6.83% 6.49% 6.85 %
(a) U.S. government agencies and U.S. government-sponsored enterprises were the only issuers whose securities exceeded 10% of JPMorgan Chase’s total stockholders’ equity at December 31, 2010.
(b) Average yield was based on amortized cost balances at the end of the period and did not give effect to changes in fair value reflected in accumulated other comprehensive income/(loss). Yields are derived by dividing interest/dividend income (including the effect of related derivatives on AFS securities and the amortization of premiums and accretion of discounts) by total amortized cost. Taxable-equivalent yields are used where applicable.
(c) Includes securities with no stated maturity. Substantially all of the Firm’s residential mortgage-backed securities and collateralized mortgage obligations are due in 10 years or more, based on contractual maturity. The estimated duration, which reflects anticipated future prepayments based on a consensus of deal-ers in the market, is approximately five years for agency residential mortgage-backed securities, three years for agency residential collateralized mortgage obligations and six years for nonagency residential collateralized mortgage obligations.
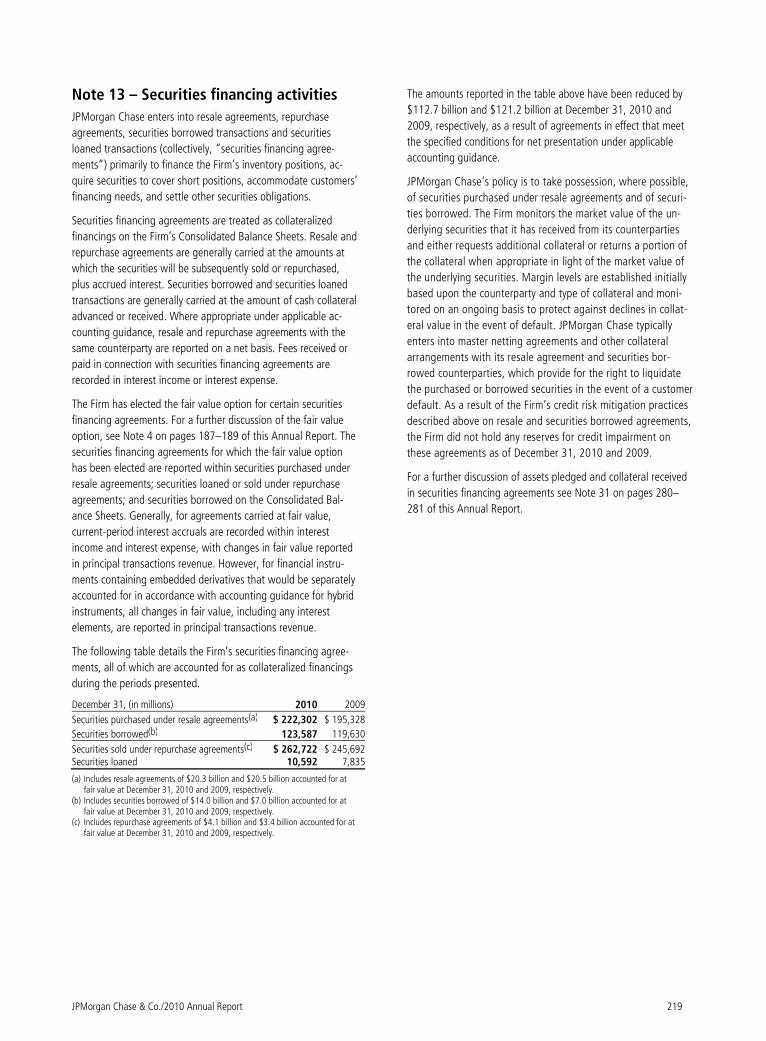
JPMorgan Chase & Co./2010 Annual Report 219
Note 13 – Securities financing activities
JPMorgan Chase enters into resale agreements, repurchase
agreements, securities borrowed transactions and securities
loaned transactions (collectively, “securities financing agree-
ments”) primarily to finance the Firm’s inventory positions, ac-
quire securities to cover short positions, accommodate customers’
financing needs, and settle other securities obligations.
Securities financing agreements are treated as collateralized
financings on the Firm’s Consolidated Balance Sheets. Resale and
repurchase agreements are generally carried at the amounts at
which the securities will be subsequently sold or repurchased,
plus accrued interest. Securities borrowed and securities loaned
transactions are generally carried at the amount of cash collateral
advanced or received. Where appropriate under applicable ac-
counting guidance, resale and repurchase agreements with the
same counterparty are reported on a net basis. Fees received or
paid in connection with securities financing agreements are
recorded in interest income or interest expense.
The Firm has elected the fair value option for certain securities
financing agreements. For a further discussion of the fair value
option, see Note 4 on pages 187–189 of this Annual Report. The
securities financing agreements for which the fair value option
has been elected are reported within securities purchased under
resale agreements; securities loaned or sold under repurchase
agreements; and securities borrowed on the Consolidated Bal-
ance Sheets. Generally, for agreements carried at fair value,
current-period interest accruals are recorded within interest
income and interest expense, with changes in fair value reported
in principal transactions revenue. However, for financial instru-
ments containing embedded derivatives that would be separately
accounted for in accordance with accounting guidance for hybrid
instruments, all changes in fair value, including any interest
elements, are reported in principal transactions revenue.
The following table details the Firm’s securities financing agree-
ments, all of which are accounted for as collateralized financings
during the periods presented.
December 31, (in millions) 2010 2009
Securities purchased under resale agreements(a) $ 222,302 $ 195,328
Securities borrowed(b) 123,587 119,630
Securities sold under repurchase agreements(c) $ 262,722 $ 245,692Securities loaned 10,592 7,835
(a) Includes resale agreements of $20.3 billion and $20.5 billion accounted for at fair value at December 31, 2010 and 2009, respectively.
(b) Includes securities borrowed of $14.0 billion and $7.0 billion accounted for at fair value at December 31, 2010 and 2009, respectively.
(c) Includes repurchase agreements of $4.1 billion and $3.4 billion accounted for at fair value at December 31, 2010 and 2009, respectively.
The amounts reported in the table above have been reduced by
$112.7 billion and $121.2 billion at December 31, 2010 and
2009, respectively, as a result of agreements in effect that meet
the specified conditions for net presentation under applicable
accounting guidance.
JPMorgan Chase’s policy is to take possession, where possible,
of securities purchased under resale agreements and of securi-
ties borrowed. The Firm monitors the market value of the un-
derlying securities that it has received from its counterparties
and either requests additional collateral or returns a portion of
the collateral when appropriate in light of the market value of
the underlying securities. Margin levels are established initially
based upon the counterparty and type of collateral and moni-
tored on an ongoing basis to protect against declines in collat-
eral value in the event of default. JPMorgan Chase typically
enters into master netting agreements and other collateral
arrangements with its resale agreement and securities bor-
rowed counterparties, which provide for the right to liquidate
the purchased or borrowed securities in the event of a customer
default. As a result of the Firm’s credit risk mitigation practices
described above on resale and securities borrowed agreements,
the Firm did not hold any reserves for credit impairment on
these agreements as of December 31, 2010 and 2009.
For a further discussion of assets pledged and collateral received
in securities financing agreements see Note 31 on pages 280–
281 of this Annual Report.
Notes to consolidated financial statements
220 JPMorgan Chase & Co./2010 Annual Report
Note 14 – Loans
Loan accounting framework
The accounting for a loan depends on management’s strategy for
the loan, and on whether the loan was credit-impaired at the
date of acquisition. The Firm accounts for loans based on the
following categories:
• Originated or purchased loans held-for-investment (other than
purchased credit-impaired (“PCI”) loans);
• Loans held-for-sale;
• Fair value loans;
• PCI loans held-for-investment
The following provides a detailed accounting discussion of these
loan categories:
Loans held-for-investment (other than PCI loans) Originated or purchased loans held-for-investment, other than PCI
loans, are measured at the principal amount outstanding, net of the
following: allowance for loan losses; net charge-offs; interest applied
to principal (for loans accounted for on the cost recovery method);
unamortized discounts and premiums; and deferred loan fees or cost.
Interest income Interest income on performing loans held-for-investment, other
than PCI loans, is accrued and recognized as interest income at
the contractual rate of interest. Purchase price discounts or pre-
miums, as well as net deferred loan fees or costs, are amortized
into interest income over the life of the loan to produce a level
rate of return.
Nonaccrual loans Nonaccrual loans are those on which the accrual of interest has
been suspended. Loans (other than credit card loans and certain
consumer loans insured by U.S. government agencies) are placed
on nonaccrual status and considered nonperforming when full
payment of principal and interest is in doubt, which is generally
determined when principal or interest is 90 days or more past due
and collateral, if any, is insufficient to cover principal and interest.
A loan is determined to be past due when the minimum payment
is not received from the borrower by the contractually specified
due date or for certain loans (e.g., residential real estate loans),
when a monthly payment is due and unpaid for 30 days or more.
All interest accrued but not collected is reversed against interest
income at the date a loan is placed on nonaccrual status. In
addition, the amortization of deferred amounts is suspended. In
certain cases, interest income on nonaccrual loans may be recog-
nized to the extent cash is received (i.e., cash basis) when the
recorded loan balance is deemed fully collectible; however, if
there is doubt regarding the ultimate collectability of the recorded
loan balance, all interest cash receipts are applied to reduce the
carrying value of the loan (the cost recovery method).
A loan may be returned to accrual status when repayment is
reasonably assured and there has been demonstrated perform-
ance under the terms of the loan or, if applicable, the terms of
the restructured loan.
As permitted by regulatory guidance, credit card loans are generally
exempt from being placed on nonaccrual status; accordingly, inter-
est and fees related to credit card loans continue to accrue until the
loan is charged off or paid in full. However, the Firm separately
establishes an allowance for the estimated uncollectible portion of
billed and accrued interest and fee income on credit card loans.
Allowance for loan losses The allowance for loan losses represents the estimated probable
losses on held-for-investment loans. Changes in the allowance for
loan losses are recorded in the Provision for credit losses on the
Firm’s Consolidated Statements of Income. See Note 15 on pages
239–243 for further information on the Firm’s accounting polices
for the allowance for loan losses.
Charge-offs Wholesale loans and risk-rated business banking and auto loans
are charged off against the allowance for loan losses when it is
highly certain that a loss has been realized. This determination
includes many factors, including the prioritization of the Firm’s
claim in bankruptcy, expectations of the workout/restructuring of
the loan and valuation of the borrower's equity.
Consumer loans, other than risk-rated business banking and auto
loans and PCI loans, are generally charged off to the allowance
for loan losses upon reaching specified stages of delinquency, in
accordance with the Federal Financial Institutions Examination
Council (“FFIEC”) policy. Residential mortgage loans and scored
business banking loans are generally charged down to estimated
net realizable value at no later than 180 days past due. Certain
consumer loans, including auto loans and non-government guar-
anteed student loans, are generally charged down to estimated
net realizable value at 120 days past due. The Firm regularly
assesses the assumptions that it uses to estimate these net realiz-
able values, and updates the underlying assumptions as necessary
to further refine its estimates.
Credit card loans are charged off by the end of the month in
which the account becomes 180 days past due, or within 60 days
from receiving notification about a specified event (e.g., bank-
ruptcy of the borrower), whichever is earlier.
Certain impaired loans are deemed collateral-dependent because
repayment of the loan is expected to be provided solely by the
underlying collateral, rather than by cash flows from the bor-
rower’s operations, income or other resources. Impaired collat-
eral-dependent loans are charged-off to the fair value of the
collateral, less costs to sell. See Note 15 on pages 239–243 for
information on the Firm’s charge-off and valuation policies for
collateral-dependent loans.
JPMorgan Chase & Co./2010 Annual Report 221
Loans held-for-sale Held-for-sale loans are measured at the lower of cost or fair
value, with valuation changes recorded in noninterest revenue.
For wholesale loans, the valuation is performed on an individual
loan basis. For consumer loans, the valuation is performed on a
portfolio basis.
Interest income on loans held-for-sale is accrued and recognized
based on the contractual rate of interest.
Loan origination fees or costs and purchase price discounts or
premiums are deferred in a contra loan account until the related
loan is sold. The deferred fees and discounts or premiums are an
adjustment to the basis of the loan and therefore are included in
the periodic determination of the lower of cost or fair value
adjustments and/or the gain or losses recognized at the time of
sale.
Held-for-sale loans are subject to the nonaccrual policies de-
scribed above.
Because held-for-sale loans are recognized at the lower of cost or
fair value, the Firm’s allowance for loan losses and charge-off
policies do not apply to these loans.
Fair value loans Loans used in a trading strategy or risk managed on a fair value
basis are measured at fair value, with changes in fair value re-
corded in noninterest revenue.
For these loans, the earned current contractual interest payment
is recognized in interest income. Changes in fair value are recog-
nized in noninterest revenue. Loan origination fees are recognized
upfront in noninterest revenue. Loan origination costs are recog-
nized in the associated expense category as incurred.
Because these loans are recognized at fair value, the Firm’s
nonaccrual, allowance for loan losses, and charge-off policies do
not apply to these loans.
See Note 4 on pages 187–189 of this Annual Report for further
information on the Firm’s elections of fair value accounting under
the fair value option. See Note 3 and Note 4 on pages 170–187
and 187–189 of this Annual Report for further information on
loans carried at fair value and classified as trading assets.
PCI loans PCI loans held-for-investment are initially measured at fair value.
PCI loans have evidence of credit deterioration since the loan’s
origination date and therefore it is probable, at acquisition, that all
contractually required payments will not be collected. Because PCI
loans are initially measured at fair value, which includes an estimate
of future credit losses, no allowance for loan losses related to PCI
loans is recorded at the acquisition date. See page 233 of this Note
for information on accounting for PCI loans subsequent to their
acquisition.
Loan classification changes
Loans in the held-for-investment portfolio that management
decides to sell are transferred to the held-for-sale portfolio at the
lower of cost or fair value on the date of transfer. Credit-related
losses are charged against the allowance for loan losses; losses
due to changes in interest rates or foreign currency exchange
rates are recognized in noninterest revenue.
In certain limited cases, loans in the held-for-sale portfolio that
management decides to retain are transferred to the held-for-
investment portfolio at the lower of cost or fair value on the date of
transfer. These loans are subsequently assessed for impairment
based on the Firm’s allowance methodology. For a further discus-
sion of the methodologies used in establishing the Firm’s allowance
for loan losses, see Note 15 on pages 239–243 of this Annual
Report.
Loan modifications
The Firm seeks to modify certain loans in conjunction with its
loss-mitigation activities. Through the modification, JPMorgan
Chase grants one or more concessions to a borrower who is
experiencing financial difficulty in order to minimize the Firm’s
economic loss, avoid foreclosure or repossession of the collateral
and to ultimately maximize payments received by the Firm from
the borrower. The concessions granted vary by program and by
borrower-specific characteristics, and may include interest rate
reductions, term extensions, payment deferrals, or the acceptance
of equity or other assets in lieu of payments. In certain limited
circumstances, loan modifications include principal forgiveness.
Such modifications are accounted for and reported as troubled
debt restructurings (“TDRs”). A loan that has been modified in a
TDR is generally considered to be impaired until it matures, is
repaid, or is otherwise liquidated, regardless of whether the
borrower performs under the modified terms. In certain limited
cases, the effective interest rate applicable to the modified loan is
at or above the current market rate at the time of the restructur-
ing. In such circumstances, and assuming that the loan subse-
quently performs under its modified terms and the Firm expects to
collect all contractual principal and interest cash flows, the loan is
disclosed as impaired and as a TDR only during the year of the
modification; in subsequent years, the loan is not disclosed as an
impaired loan or as a TDR so long as repayment of the restruc-
tured loan under its modified terms is reasonably assured.
Loans, except for credit card loans, modified in a TDR are gener-
ally placed on nonaccrual status, although in most cases such
loans were already on nonaccrual status prior to modification.
These loans may be returned to performing status (resuming the
accrual of interest) if the following criteria are met: (a) the bor-
rower has performed under the modified terms for a minimum of
six months and/or six payments, and (b) the Firm has an expecta-
tion that repayment of the modified loan is reasonably assured
based on, for example, the borrower’s debt capacity and level of
future earnings, collateral values, LTV ratios, and other current
market considerations.

Notes to consolidated financial statements
222 JPMorgan Chase & Co./2010 Annual Report
Because TDRs are considered to be impaired, these loans are
evaluated for an asset-specific allowance, which considers the
expected re-default rates for the modified loans and is deter-
mined based on the same methodology used to estimate the
Firm’s asset-specific allowance component regardless of whether
the loan is performing and has been returned to accrual status.
For further discussion of the methodology used to estimate the
Firm’s asset-specific allowance, see Note 15 on pages 239–243
of this Annual Report.
Foreclosed property
The Firm acquires property from borrowers through loan restructur-
ings, workouts, and foreclosures. Property acquired may include
real property (e.g., residential real estate, land, buildings, and
fixtures) and commercial and personal property (e.g., aircraft,
railcars, and ships).
At the time JPMorgan Chase takes physical possession, the
property is recorded in other assets on the Consolidated Balance
Sheets at fair value less estimated costs to sell. Each quarter the
fair value of the acquired property is reviewed and adjusted, if
necessary. Subsequent changes to fair value are charged/credited
to noninterest revenue. Operating expense, such as real estate
taxes and maintenance, are charged to other expense.
Loan Portfolio
The Firm’s loan portfolio is divided into three portfolio segments, which are the same segments used by the Firm to determine the allowance
for loan losses: Wholesale; Consumer, excluding credit card; and Credit Card. Within each portfolio segment, the Firm monitors and assesses the
credit risk in the following classes of loans, based on the risk characteristics of each loan class:
Wholesale(a) Consumer, excluding
credit card(b) Credit Card
• Commercial and industrial • Real estate • Financial institutions • Government agencies • Other
Residential real estate – excluding PCI • Home equity – senior lien • Home equity – junior lien • Prime mortgage, including option
ARMs • Subprime mortgage Other consumer loans
• Auto(c)
• Business banking(c) • Student and other Residential real estate – PCI • Home equity • Prime mortgage • Subprime mortgage • Option ARMs
• Chase, excluding accounts origi-
nated by Washington Mutual • Accounts originated by Washington
Mutual
(a) Includes loans reported in Investment Bank, Commercial Banking, Treasury & Securities Services, Asset Management and Corporate/Private Equity segments.
(b) Includes RFS and residential real estate loans reported in the Corporate/Private Equity segment. (c) Includes risk-rated loans that apply the Firm’s wholesale methodology for determining the allowance for loan losses; these loans are managed
by RFS, and therefore for consistency in presentation, are included with the other consumer loan classes.

JPMorgan Chase & Co./2010 Annual Report 223
The following table summarizes the Firm’s loan balances by portfolio segment:
December 31, 2010 (in millions) Wholesale Consumer, excluding
credit card Credit Card Total
Retained(a) $ 222,510 $ 327,464 $ 135,524 $ 685,498 (b) Held-for-sale 3,147 154 2,152 5,453 At fair value 1,976 — — 1,976 Total $ 227,633 $ 327,618 $ 137,676 $ 692,927
December 31, 2009 (in millions) Wholesale Consumer, excluding
credit card Credit Card Total
Retained $ 200,077 $ 348,355 $ 78,786 $ 627,218 (b) Held-for-sale 2,734 2,142 — 4,876 At fair value 1,364 — — 1,364 Total $ 204,175 $ 350,497 $ 78,786 $ 633,458
(a) Effective January 1, 2010, the Firm adopted accounting guidance related to VIEs. Upon adoption of the guidance, the Firm consolidated $84.7 billion of loans associ-ated with Firm-sponsored credit card securitization trusts; $15.1 billion of wholesale loans; and $4.8 billion of loans associated with certain other consumer securitiza-tion entities, primarily mortgage-related. For further information, see Note 16 on pages 244–259 of this Annual Report.
(b) Loans (other than PCI loans and those for which the fair value option has been selected) are presented net of unearned income, unamortized discounts and premiums, and net deferred loan costs of $1.9 billion and $1.4 billion at December 31, 2010 and 2009, respectively.
On an on-going basis, the Firm manages its exposure to credit risk. Selling loans is one way that the Firm reduces its credit exposures. The
following table provides information about the Firm's loan sales by portfolio segment.
Year ended December 31, (in millions) 2010 2009 2008
Net gains/(losses) on sales of loans (including lower of
cost or fair value adjustments)(a) Wholesale $ 215 $ 291 $ (2,647 ) Consumer, excluding credit card 265 127 (11 ) Credit Card (16) 21 150 Total net gains/(losses) on sales of loans (including lower
of cost or fair value adjustments)(a) $ 464 $ 439 $ (2,508 )
(a) Excludes sales related to loans accounted for at fair value.
Wholesale loan portfolio Wholesale loans include loans made to a variety of customers
from large corporate and institutional clients to certain high-net
worth individuals.
The primary credit quality indicator for wholesale loans is the risk
rating assigned each loan. Risk ratings are used to identify the
credit quality of loans and differentiate risk within the portfolio.
Risk ratings on loans consider the probability of default (“PD”)
and the loss given default (“LGD”). PD is the likelihood that a
loan will not be repaid at default. The LGD is the estimated loss
on the loan that would be realized upon the default of the bor-
rower and takes into consideration collateral and structural
support for each credit facility.
Management considers several factors to determine an appro-
priate risk rating, including the obligor’s debt capacity and
financial flexibility, the level of the obligor’s earnings, the
amount and sources for repayment, the level and nature of
contingencies, management strength, and the industry and
geography in which the obligor operates. Risk ratings generally
represent ratings profiles similar to those defined by S&P and
Moody’s. Investment grade ratings range from “AAA/Aaa”
to “BBB-/Baa3”. Noninvestment grade ratings are further
classified as noncriticized (“BB+/Ba1 and B-/B3”) and criticized
(“CCC+”/”Caa1 and lower”), and the criticized portion is
further subdivided into performing and nonaccrual loans, repre-
senting management’s assessment of the collectibility of princi-
pal and interest. Criticized loans have a higher probability of
default than noncriticized loans.
Risk ratings are reviewed on a regular and ongoing basis by Credit
Risk Management and are adjusted as necessary for updated
information affecting the obligor’s ability to fulfill its obligations.
As noted above, the risk rating of a loan considers the industry in
which the obligor conducts its operations. As part of the overall
credit risk management framework, the Firm focuses on the man-
agement and diversification of its industry and client exposures,
with particular attention paid to industries with actual or potential
credit concern. See Note 5 on pages 189–190 in this Annual Report
for further detail on industry concentrations.

Notes to consolidated financial statements
224 JPMorgan Chase & Co./2010 Annual Report
The table below provides information by class of receivable for the retained loans in the Wholesale portfolio segment.
As of or for the year ended December 31, Commercial
and industrial Real estate (in millions, except ratios) 2010 2009 2010 2009 Loans by risk ratings Investment grade $ 31,697 $ 31,203 $ 28,504 $ 31,986 Noninvestment grade:
Noncriticized 30,874 28,714 16,425 14,462 Criticized performing 2,371 6,079 5,769 7,859 Criticized-total nonaccrual 1,634 2,245 2,937 2,888
Total noninvestment grade 34,879 37,038 25,131 25,209 Total retained loans $ 66,576 $ 68,241 $ 53,635 $ 57,195 % of total criticized to total retained loans 6.02% 12.20% 16.23% 18.79 % % of nonaccrual loans to total retained loans 2.45 3.29 5.48 5.05
Loans by geographic distribution(a) Total non-U.S. $ 17,731 $ 19,138 $ 1,963 $ 2,227 Total U.S. 48,845 49,103 51,672 54,968 Total retained loans $ 66,576 $ 68,241 $ 53,635 $ 57,195 Net charge-offs $ 403 $ 1,243 $ 862 $ 688
% of net charge-offs to retained loans(b) 0.61% 1.82% 1.61% 1.20 %
Loan deliquency(c) Current and less than 30 days past due and still accruing $ 64,501 $ 65,692 $ 50,299 $ 53,370 30–89 days past due and still accruing 434 276 290 823
90 or more days past due and still accruing(d) 7 28 109 114 Nonaccrual 1,634 2,245 2,937 2,888 Total retained loans $ 66,576 $ 68,241 $ 53,635 $ 57,195
(a) U.S. and non-U.S. distribution is determined based predominantly on the domicile of the borrower. (b) Ratios were calculated using end-of-period retained loans. (c) For wholesale loans, the past due status of a loan is generally not a significant indicator of credit quality due to the ongoing review and monitoring of an obligor's
ability to meet contractual obligations. For a discussion of more significant factors, see page 223 of this Note. (d) Represents loans that are 90 days or more past due as to principal and/or interest, but that are still accruing interest; these loans are considered well-collateralized. (e) Effective January 1, 2010, the Firm adopted accounting guidance related to VIEs. Upon adoption of the guidance, the Firm consolidated $15.1 billion of wholesale
loans. For further information, see Note 16 on pages 244–259 of this Annual Report. (f) Other primarily includes loans to special purpose entities and loans to private banking clients. See Note 1 on page 164–165 of this Annual Report for additional infor-
mation on SPEs.
The following table presents additional information on the real estate class of loans within the wholesale portfolio segment for the periods ended
December 31, 2010 and 2009. The real estate class primarily consists of secured commercial loans mainly to borrowers for multi-family and com-
mercial lessor properties. Multi-family lending specifically finances apartment buildings. Commercial lessors receive financing specifically for real
estate leased to retail, office and industrial tenants. The commercial construction and development loans represent financing for the construction of
apartments, office and professional buildings and malls. Other real estate loans include lodging, real estate investment trusts (“REITs”), single-
family, homebuilders and other real estate.
December 31, Multi-family Commercial lessors (in millions, except ratios) 2010 2009 2010 2009 Real estate retained loans $ 30,604 $ 31,077 $ 15,796 $15,170 Criticized exposure 3,798 3,942 3,593 3,855 % of total real estate retained loans 12.41% 12.68% 22.75% 25.41% Criticized nonaccrual $ 1,016 $ 1,109 $ 1,549 $ 687 % of total real estate retained loans 3.32% 3.57% 9.81% 4.53%

JPMorgan Chase & Co./2010 Annual Report 225
(table continued from previous page)
Financial institutions Government agencies Other(e)(f)
Total
retained loans(e) 2010 2009 2010 2009 2010 2009 2010 2009 $ 22,525 $ 14,878 $ 6,871 $ 6,684 $ 56,450 $ 33,780 $ 146,047 $ 118,531
8,480 8,319 382 624 6,012 6,704 62,173 58,823 317 1,201 3 28 320 997 8,780 16,164 136 729 22 5 781 692 5,510 6,559 8,933 10,249 407 657 7,113 8,393 76,463 81,546 $ 31,458 $ 25,127 $ 7,278 $ 7,341 $ 63,563 $ 42,173 $ 222,510 $ 200,077 1.44% 7.68% 0.34% 0.45% 1.73% 4.00% 6.42% 11.36% 0.43 2.90 0.30 0.07 1.23 1.64 2.48 3.28
$ 19,756 $ 11,755 $ 870 $ 1,707 $ 25,831 $ 18,790 $ 66,151 $ 53,617 11,702 13,372 6,408 5,634 37,732 23,383 156,359 146,460$ 31,458 $ 25,127 $ 7,278 $ 7,341 $ 63,563 $ 42,173 $ 222,510 $ 200,077 $ 72 $ 734 $ 2 $ — $ 388 $ 467 $ 1,727 $ 3,132 0.23% 2.92% 0.03% —% 0.61% 1.11% 0.78% 1.57% $ 31,289 $ 24,324 $ 7,222 $ 7,321 $ 61,837 $ 40,785 $ 215,148 $ 191,492 31 68 34 15 704 512 1,493 1,694 2 6 — — 241 184 359 332 136 729 22 5 781 692 5,510 6,559$ 31,458 $ 25,127 $ 7,278 $ 7,341 $ 63,563 $ 42,173 $ 222,510 $ 200,077
(table continued from previous page)
Commercial construction and development Other Total real estate loans 2010 2009 2010 2009 2010 2009
$ 3,395 $ 4,599 $ 3,840 $ 6,349 $ 53,635 $ 57,195 619 1,359 696 1,591 8,706 10,747 18.23% 29.55% 18.13% 25.06% 16.23% 18.79%
$ 174 $ 313 $ 198 $ 779 $ 2,937 $ 2,888 5.13% 6.81% 5.16% 12.27% 5.48% 5.05%

Notes to consolidated financial statements
226 JPMorgan Chase & Co./2010 Annual Report
Wholesale impaired loans and loan modifications
Wholesale impaired loans include loans that have been placed on nonaccrual status and/or that have been modified in a TDR. All impaired
loans are evaluated for an asset-specific allowance as described in Note 15 on pages 239–243 of this Annual Report.
The table below set forth information about the Firm’s wholesale impaired loans.
December 31,
Commercial and industrial Real estate
Financial institutions
Government agencies Other
Total retained loans
(in millions) 2010 2009 2010 2009 2010 2009 2010 2009 2010 2009 2010 2009
Impaired loans With an allowance $ 1,512 $ 2,171 $ 2,510 $ 2,998 $ 127 $ 579 $ 22 $ 4 $ 697 $ 595 $ 4,868 $ 6,347
Without an allowance(a) 157 89 445 363 8 149 — — 8 12 618 613
Total impaired loans $ 1,669 $ 2,260 $ 2,955 $ 3,361 $ 135 $ 728 $ 22 $ 4 $ 705 $ 607 $ 5,486 $ 6,960Allowance for loan losses related to
impaired loans(b) $ 435 $ 454 $ 825 $ 1,212 $ 61 $ 165 $ 14 $ 1 $ 239 $ 214 $ 1,574 $ 2,046Unpaid principal balance of impaired
loans(c) 2,453 3,042 3,487 3,649 244 918 30 4 1,046 760 7,260 8,373
(a) When the discounted cash flows, collateral value or market price equals or exceeds the recorded investment in the loan, then the loan does not require an allowance. This typically occurs when the impaired loans have been partially charged-off and/or there have been interest payments received and applied to the loan balance.
(b) The allowance for impaired loans is included in JPMorgan Chase’s asset-specific allowance for loan losses. (c) Represents the contractual amount of principal owed at December 31, 2010 and 2009. The unpaid principal balance differs from the impaired loan balances due to
various factors, including charge-offs; interest payments received and applied to the carrying value; net deferred loan fees or costs; and discount or premiums on pur-chased loans.
The following table presents the Firm’s average impaired loans for the years ended 2010, 2009 and 2008.
For the year ended December 31, Impaired loans (average) (in millions) 2010 2009 2008 Commercial and industrial $ 1,655 $ 1,767 $ 337 Real estate 3,101 2,420 389 Financial institutions 304 685 49 Government agencies 5 4 1 Other 884 468 120
Total(a) $ 5,949 $ 5,344 $ 896
(a) The related interest income on accruing impaired loans, largely in real estate, was $21 million, $15 million and zero for the years ended December 31, 2010, 2009 and 2008. The interest income recognized on a cash basis was not material for the years 2010, 2009 and 2008.
The following table provides information about the Firm’s wholesale loans modified in troubled debt restructurings. These TDR loans are
included as impaired loans in the above tables.
December 31,
Commercial and industrial Real estate
Financial institutions
Government agencies Other
Total retained loans
(in millions) 2010 2009 2010 2009 2010 2009 2010 2009 2010 2009 2010 2009Loans modified in troubled debt
restructurings(a) $ 212 $ 253 $ 907 $ 856 $ 1 $ — $ 22 $ — $ 1 $ — $ 1,143 $1,109TDRs on nonaccrual status 163 222 831 269 1 — 22 — 1 — 1,018 491Additional commitments to lend
to borrowers whose loans have been modified in TDRs 1 33 — 6 — — — — — — 1 39
(a) These modifications generally provided interest rate concessions to the borrower or deferral of principal repayments.

JPMorgan Chase & Co./2010 Annual Report 227
Consumer loan portfolio Consumer loans, excluding credit card loans, consist primarily of
residential mortgages, home equity loans, auto loans, business
banking loans, and student and other loans, with a primary focus
on serving the prime consumer credit market. The portfolio also
includes home equity loans secured by junior liens and mortgage
loans with interest-only payment options to predominantly prime
borrowers, as well as certain payment-option loans originated by
Washington Mutual that may result in negative amortization.
The table below provides information about consumer retained
loans by class, excluding the credit card loan portfolio segment.
December 31, (in millions) 2010 2009Residential real estate –
excluding PCI Home equity:
Senior lien(a) $ 24,376 $ 27,376
Junior lien(b) 64,009 74,049Mortgages:
Prime, including option ARMs(c) 74,539 75,428
Subprime(c) 11,287 12,526Other consumer loans
Auto(c) 48,367 46,031Business banking 16,812 16,974
Student and other(c) 15,311 14,726Residential real estate – PCI
Home equity 24,459 26,520Prime mortgage 17,322 19,693Subprime mortgage 5,398 5,993Option ARMs 25,584 29,039
Total retained loans $ 327,464 $ 348,355
(a) Represents loans where JPMorgan Chase holds the first security interest on the property.
(b) Represents loans where JPMorgan Chase holds a security interest that is subordinate in rank to other liens.
(c) Effective January 1, 2010, the Firm adopted accounting guidance related to VIEs. Upon adoption of the guidance, the Firm consolidated $4.8 billion of certain consumer loan securitization entities, primarily mortgage-related. For further information, see Note 16 on pages 244–259 of this Annual Re-port.
Delinquency rates are a primary credit quality indicator for con-
sumer loans. Loans that are more than 30 days past due provide
an early warning of borrowers that may be experiencing financial
difficulties and/or who may be unable or unwilling to repay the
loan. As the loan continues to age, it becomes more clear that
the borrower is likely either unable or unwilling to pay. In the
case of residential real estate loans, late-stage delinquencies
(greater than 150 days past due) are a strong indicator of loans
that will ultimately result in a short sale or foreclosure. In addition
to delinquency rates, other credit quality indicators for consumer
loans vary based on the class of loan, as follows:
• For residential real estate loans, including both non-PCI and
PCI portfolios, the current estimated loan-to-value (“LTV”) ra-
tio, or the combined LTV ratio in the case of loans with a junior
lien, is an indicator of the potential loss severity in the event of
default. Additionally, LTV or combined LTV can provide insight
into a borrower’s continued willingness to pay, as the delin-
quency rate of high-LTV loans tends to be greater than that for
loans where the borrower has equity in the collateral. The
geographic distribution of the loan collateral also provides in-
sight as to the credit quality of the portfolio, as factors such as
the regional economy, home price changes and specific events
such as hurricanes, earthquakes, etc. will affect credit quality.
The borrowers’ current or “refreshed” FICO score is a secon-
dary credit-quality indicator for certain loans, as FICO scores
are an indication of the borrower’s credit payment history.
Thus, a loan to a borrower with a low FICO score (660 or be-
low) is considered to be of higher risk than a loan to a bor-
rower with a high FICO score. Further, a loan to a borrower
with a high LTV ratio and a low FICO score is at greater risk of
default than a loan to a borrower that has both a high LTV ra-
tio and a high FICO score.
• For auto, scored business banking and student loans, geo-
graphic distribution is an indicator of the credit performance of
the portfolio. Similar to residential real estate loans, geo-
graphic distribution provides insights into the portfolio per-
formance based on regional economic activity and events.
• Risk-rated business banking and auto loans are similar to
wholesale loans in that the primary credit quality indicators are
the risk rating that is assigned to the loan and whether the
loans are considered to be criticized and/or nonaccrual. Risk
ratings are reviewed on a regular and ongoing basis by Credit
Risk Management and are adjusted as necessary for updated
information affecting borrowers’ ability to fulfill their obliga-
tions. Consistent with other classes of consumer loans, the
geographic distribution of the portfolio provides insights into
portfolio performance based on regional economic activity and
events.

Notes to consolidated financial statements
228 JPMorgan Chase & Co./2010 Annual Report
Residential real estate – excluding PCI loans
The tables below provide information by class for residential real estate (excluding PCI) retained loans in the consumer, excluding credit card
portfolio segment.
Home equity As of or for the year ended Senior lien Junior lien December 31, (in millions, except ratios) 2010 2009 2010 2009 Net charge-offs $ 262 $ 234 $ 3,182 $ 4,448 % of net charge-offs to retained loans 1.00% 0.80% 4.63% 5.62 % Loan delinquency Current and less than 30 days past due $ 23,615 $ 26,543 $ 62,315 $ 71,534 30–149 days past due 414 512 1,508 2,224 150 or more days past due 347 321 186 291 Total retained loans $ 24,376 $ 27,376 $ 64,009 $ 74,049 % of 30+ days past due to total retained loans 3.12% 3.04% 2.65% 3.40 % 90 or more days past due and still accruing $ — $ — $ — $ —
Nonaccrual loans(a) 479 477 784 1,188
Current estimated LTV ratios(b)(c)(d) Greater than 125% and refreshed FICO scores:
Equal to or greater than 660 $ 528 $ 472 $ 6,928 $ 6,788 Less than 660 238 235 2,495 2,703
101% to 125% and refreshed FICO scores:
Equal to or greater than 660 974 933 9,403 10,616 Less than 660 325 319 2,873 3,277
80% to 100% and refreshed FICO scores:
Equal to or greater than 660 2,860 3,038 13,333 16,098 Less than 660 738 825 3,155 3,657
Less than 80% and refreshed FICO scores:
Equal to or greater than 660 15,994 18,591 22,527 27,225 Less than 660 2,719 2,963 3,295 3,685
U.S. government-guaranteed — — — —
Total retained loans $ 24,376 $ 27,376 $ 64,009 $ 74,049 Geographic region California $ 3,348 $ 3,658 $ 14,656 $ 16,990 New York 3,272 3,438 12,278 13,456 Texas 3,594 4,306 2,239 2,711 Florida 1,088 1,198 3,470 4,123 Illinois 1,635 1,795 4,248 4,849 Ohio 2,010 2,338 1,568 1,865 New Jersey 732 777 3,617 4,090 Michigan 1,176 1,329 1,618 1,900 Arizona 1,481 1,648 2,979 3,582 Washington 776 868 2,142 2,481
All other(e) 5,264 6,021 15,194 18,002 Total retained loans $ 24,376 $ 27,376 $ 64,009 $ 74,049
(a) At December 31, 2010 and 2009, nonaccrual loans excluded mortgage loans insured by U.S. government agencies of $10.5 billion and $9.0 billion, respectively, that are 90 days past due and accruing at the guaranteed reimbursement rate. These amounts are excluded as reimbursement of insured amounts is proceeding normally.
(b) Represents the aggregate unpaid principal balance of loans divided by the estimated current property value. Current property values are estimated, at a minimum, quar-terly, based on home valuation models utilizing nationally recognized home price index valuation estimates and do not represent actual appraised loan level collateral val-ues; as such, the resulting ratios are necessarily imprecise and should be viewed as estimates.
(c) Junior lien represents combined LTV, which considers all available lien positions related to the property. All other products are presented without consideration of subordi-nate liens on the property.
(d) Refreshed FICO scores represent each borrower’s most recent credit score obtained by the Firm; current FICO scores are obtained at least quarterly. (e) At December 31, 2010 and 2009, includes prime mortgage loans insured by U.S. government agencies of $12.9 billion and $10.8 billion, respectively. (f) At December 31, 2010 and 2009, includes 30+ day delinquent mortgage loans that are insured by U.S. government agencies of $11.4 billion and $9.7 billion, respectively.
These amounts are considered current as reimbursement of insured amounts is proceeding normally.

JPMorgan Chase & Co./2010 Annual Report 229
(table continued from previous page)
Mortgages Total residential real
Prime, including option ARMs Subprime estate (excluding PCI)
2010 2009 2010 2009 2010 2009 $ 1,627 $ 1,957 $ 1,374 $ 1,648 $ 6,445 $ 8,287 2.15% 2.51% 10.82% 11.86% 3.52% 4.14%
$ 69,562(f) $ 69,458(f) $ 8,477 $ 8,294 $ 163,969 $ 175,829 1,576 2,629 1,184 1,883 4,682 7,248 3,401 3,341 1,626 2,349 5,560 6,302 $ 74,539 $ 75,428 $ 11,287 $ 12,526 $ 174,211 $ 189,379 6.68% 7.91% 24.90% 33.79% 5.88% 7.15%
$ — $ — $ — $ — $ — $ — 4,320 4,667 2,210 3,248 7,793 9,580 $ 3,039 $ 2,435 $ 338 $ 335 $ 10,833 $ 10,030 1,595 1,339 1,153 1,169 5,481 5,446 4,733 4,763 506 593 15,616 16,905 1,775 1,913 1,486 1,902 6,459 7,411 10,720 12,889 925 1,094 27,838 33,119 2,786 3,152 1,955 2,663 8,634 10,297 32,385 33,368 2,252 2,063 73,158 81,247 4,557 4,803 2,672 2,707 13,243 14,158 12,949 10,766 — — 12,949 10,766 $ 74,539 $ 75,428 $ 11,287 $ 12,526 $ 174,211 $ 189,379 $ 19,278 $ 21,538 $ 1,730 $ 1,720 $ 39,012 $ 43,906 9,587 9,784 1,381 1,535 26,518 28,213 2,569 2,185 345 407 8,747 9,609 4,840 5,293 1,422 1,625 10,820 12,239 3,765 3,250 468 584 10,116 10,478 462 461 275 299 4,315 4,963 2,026 2,207 534 617 6,909 7,691 963 1,009 294 324 4,051 4,562 1,320 1,414 244 301 6,024 6,945 2,056 2,174 247 274 5,221 5,797 27,673 26,113 4,347 4,840 52,478 54,976 $ 74,539 $ 75,428 $ 11,287 $ 12,526 $ 174,211 $ 189,379

Notes to consolidated financial statements
230 JPMorgan Chase & Co./2010 Annual Report
Residential real estate impaired loans and loan
modifications – excluding PCI loans
The Firm is participating in the U.S. Treasury’s Making Home
Affordable (“MHA”) programs and is continuing to expand its
other loss-mitigation efforts for financially distressed borrowers
who do not qualify for the MHA programs.
MHA, as well as the Firm’s other loss-mitigation programs, gen-
erally provide various concessions to financially troubled borrow-
ers including, but not limited to, interest rate reductions, term or
payment extensions and deferral of principal payments that
would otherwise have been required under the terms of the
original agreement. Principal forgiveness has been limited to a
specific modification program for option ARMs.
Generally, borrowers must make at least three payments under the
revised contractual terms during a trial modification and be success-
fully re-underwritten with income verification before a mortgage or
home equity loan can be permanently modified. When the Firm
modifies home equity lines of credit in troubled debt restructurings,
future lending commitments related to the modified loans are
canceled as part of the terms of the modification.
Modifications of residential real estate loans other than PCI loans
are generally accounted for and reported as TDRs. For further
discussion of the accounting for loan modifications and TDRs, see
Loan modifications on pages 221–222 of this Note.
The tables below set forth information about the Firm’s residential real estate impaired loans, excluding PCI. These loans are considered to be
impaired as they have been modified in a TDR. All impaired loans are evaluated for an asset-specific allowance as described in Note 15 on
pages 239–243 of this Annual Report.
Home equity Mortgages
December 31, Senior lien Junior lien Prime, including option
ARMs Subprime Total residential real estate (excluding PCI)
(in millions) 2010 2009 2010 2009 2010 2009 2010 2009 2010 2009
Impaired loans(a)(b) With an allowance $ 211 $ 167 $ 258 $ 221 $ 1,525 $ 552 $ 2,563 $ 1,952 $ 4,557 $ 2,892
Without an allowance(c) 15 1 25 1 559 90 188 46 787 138
Total impaired loans(d) $ 226 $ 168 $ 283 $ 222 $ 2,084 $ 642 $ 2,751 $ 1,998 $ 5,344 $ 3,030
Allowance for loan losses related to impaired loans $ 77 $ 73 $ 82 $ 100 $ 97 $ 70 $ 555 $ 494 $ 811 $ 737
Unpaid principal balance of
impaired loans(e) 265 178 402 273 2,751 783
3,777 2,303 7,195 3,537
Impaired loans on nonaccrual status 38 30 63 43
534 249 632 598 1,267 920
(a) Represents loans modified in a TDR. These modifications generally provided interest rate concessions to the borrower or deferral of principal repayments. (b) There are no additional commitments to lend to borrowers whose loans have been modified in TDRs as of December 31, 2010 and 2009. (c) When discounted cash flows or collateral value equals or exceeds the recorded investment in the loan, then the loan does not require an allowance. This typically occurs when the
impaired loans have been partially charged-off and/or there have been interest payments received and applied to the loan balance. (d) At December 31, 2010 and 2009, $3.0 billion and $296 million, respectively, of loans modified subsequent to repurchase from Ginnie Mae were excluded from loans accounted for
as TDRs. When such loans perform subsequent to modification they are generally sold back into Ginnie Mae loan pools. Modified loans that do not re-perform become subject to foreclosure. Substantially all amounts due under the terms of these loans continue to be insured and, where applicable, reimbursement of insured amounts is proceeding normally.
(e) Represents the contractual amount of principal owed at December 31, 2010 and 2009. The unpaid principal balance differs from the impaired loan balances due to various factors, including charge-offs; interest payments received and applied to the principal balance; net deferred loan fees or costs; and discounts or premiums on purchased loans.
The following table presents average impaired loans and the related interest income reported by the Firm.
For the year ended December 31, Impaired loans (average) Interest income on impaired loans(a) Interest income on impaired
loans on a cash basis(a)
(in millions) 2010 2009 2008 2010 2009 2008 2010 2009 2008
Home equity
Senior lien $ 207 $ 142 $ 39 $ 15 $ 7 $ 2 $ 1 $ 1 $ —
Junior lien 266 187 39 10 9 3 1 1 —Mortgages
Prime, including option ARMs 1,530 496 41 70 34 2 14 8 —
Subprime 2,539 1,948 690 121 98 47 19 6 2
Total residential real estate (excluding PCI) $4,542 $ 2,773 $ 809 $ 216 $ 148 $ 54 $ 35 $ 16 $ 2
(a) Generally, interest income on loans modified in a TDR is recognized on a cash basis until such time as the borrower has made a minimum of six payments under the new terms. As of December 31, 2010 and 2009, loans of $580 million and $256 million, respectively, are TDRs for which the borrowers have not yet made six payments under their modified terms.

JPMorgan Chase & Co./2010 Annual Report 231
Other consumer loans
The tables below provide information for other consumer retained loan classes, including auto, business banking and student loans.
As of or for the year ended December 31, Auto(c) Business banking Student and other(c) Total other consumer (in millions, except ratios) 2010 2009 2010 2009 2010 2009 2010 2009 Net charge-offs $ 298 $ 627 $ 707 $ 842 $ 459 $ 443 $ 1,464 $ 1,912 % of net charge-offs to retained
loans 0.63% 1.44% 4.23% 4.73% 2.85% 2.90% 1.82% 2.49% Loan delinquency Current and less than 30 days
past due $ 47,778 $ 45,281 $ 16,240 $ 16,277 $ 15,074(d) $ 14,479(d) $ 79,092 $ 76,037 30–119 days past due 579 720 351 427 232 240 1,162 1,387 120 or more days past due 10 30 221 270 5 7 236 307 Total retained loans $ 48,367 $ 46,031 $ 16,812 $ 16,974 $ 15,311 $ 14,726 $ 80,490 $ 77,731
% of 30+ days past due to total
retained loans 1.22% 1.63% 3.40% 4.11% 1.55% 1.68% 1.74% 2.18%
90 or more days past due and still accruing $ — $ — $ — $ — $ 625 $ 542 $ 625 $ 542
Nonaccrual loans(a) 141 177 832 826 67 74 1,040 1,077 Geographic region California $ 4,307 $ 4,440 $ 851 $ 515 $ 1,330 $ 1,304 $ 6,488 $ 6,259 New York 3,875 3,756 2,877 3,040 1,305 1,243 8,057 8,039 Texas 4,505 4,330 2,550 2,487 1,273 1,197 8,328 8,014 Florida 1,923 1,750 220 166 722 715 2,865 2,631 Illinois 2,608 2,440 1,320 1,380 940 868 4,868 4,688 Ohio 2,961 3,153 1,647 1,783 1,010 957 5,618 5,893 New Jersey 1,842 1,776 422 426 502 475 2,766 2,677 Michigan 2,434 2,108 1,401 1,613 729 686 4,564 4,407 Arizona 1,499 1,479 1,218 1,210 387 366 3,104 3,055 Washington 716 627 115 84 279 266 1,110 977 All other 21,697 20,172 4,191 4,270 6,834 6,649 32,722 31,091 Total retained loans $ 48,367 $ 46,031 $ 16,812 $ 16,974 $ 15,311 $ 14,726 $ 80,490 $ 77,731
Loans by risk ratings(b) Noncriticized $ 5,803 $ 4,564 $ 10,831 $ 10,450 NA NA $ 16,634 $ 15,014 Criticized performing 265 448 502 517 NA NA 767 965 Criticized nonaccrual 12 39 574 542 NA NA 586 581
(a) At December 31, 2010 and 2009, excludes student loans that are 90 days past due and still accruing, which are insured by U.S. government agencies under the FFELP, of $625 million and $542 million, respectively. These amounts are excluded as reimbursement of insured amounts is proceeding normally.
(b) For risk-rated business banking and auto loans, the primary credit quality indicator is the risk-rating of the loan, including whether the loans are considered to be criticized and/or nonaccrual.
(c) Effective January 1, 2010, the Firm adopted accounting guidance related to VIEs. Upon the adoption of the guidance, the Firm consolidated certain consumer loan securitization entities. For further information, see Note 16 on pages 244–259 of this Annual Report.
(d) Includes 30+ day delinquent loans that are 30 days or more past due and still accruing, which are insured by U.S. government agencies under the FFELP, of $1.1 billion and $942 million at December 31, 2010 and 2009, respectively. These amounts are considered current as reimbursement of insured amounts is proceeding normally.

Notes to consolidated financial statements
232 JPMorgan Chase & Co./2010 Annual Report
Other consumer impaired loans
The tables below set forth information about the Firm’s other consumer impaired loans, including risk-rated business banking and auto loans
that have been placed on nonaccrual status, and any loan that has been modified in a troubled debt restructuring.
Auto Business banking Total other consumer(c) December 31, (in millions) 2010 2009 2010 2009 2010 2009Impaired loans With an allowance $ 102 $ 118 $ 774 $ 500 $ 876 $ 618
Without an allowance(a) — — — — — —Total impaired loans $ 102 $ 118 $ 774 $ 500 $ 876 $ 618
Allowance for loan losses related to impaired loans $ 16 $ 30 $ 248 $ 129 $ 264 $ 159
Unpaid principal balance of impaired loans(b) 132 137 899 577 1,031 714
(a) When discounted cash flows, collateral value or market price equals or exceeds the recorded investment in the loan, then the loan does not require an allowance. This typically occurs when the impaired loans have been partially charged-off and/or there have been interest payments received and applied to the loan balance.
(b) Represents the contractual amount of principal owed at December 31, 2010 and 2009. The unpaid principal balance differs from the impaired loan balances due to various factors, including charge-offs; interest payments received and applied to the principal balance; net deferred loan fees or costs; and discounts or premiums on purchased loans.
(c) There were no student and other loans modified in TDRs at December 31, 2010 and 2009.
The following table presents average impaired loans.
For the year ended December 31, Impaired loans (average)(b)
(in millions) 2010 2009 2008
Auto $ 120 $ 100 $ 71Business banking 682 396 200
Total other consumer(a) $ 802 $ 496 $ 271
(a) There were no student and other loans modified in TDRs at December 31, 2010, 2009 and 2008. (b) The related interest income on impaired loans, including those on cash basis, were not material for the years 2010, 2009 and 2008.
The following table provides information about the Firm’s other consumer loans modified in troubled debt restructurings. These TDR loans are
included as impaired loans in the tables above.
Auto Business banking Total other consumer(c) December 31, (in millions) 2010 2009 2010 2009 2010 2009
Loans modified in troubled debt restructurings(a)(b) $ 91 $ 79 $ 395 $ 17 $ 486 $ 96 TDRs on nonaccrual status 39 30 268 16 307 46
(a) These modifications generally provided interest rate concessions to the borrower or deferral of principal repayments. (b) Additional commitments to lend to borrowers whose loans have been modified in TDRs as of December 31, 2010 and 2009 are immaterial. (c) There were no student and other loans modified in TDRs at December 31, 2010 and 2009.

JPMorgan Chase & Co./2010 Annual Report 233
Purchased credit-impaired (“PCI”) loans
PCI loans were determined to be credit-impaired upon acquisition
based on specific risk characteristics of the loan, including prod-
uct type, loan-to-value ratios, FICO scores, and past-due status.
Upon acquisition, credit-impaired loans acquired in the same
fiscal quarter may be aggregated into one or more pools, pro-
vided that the loans have common risk characteristics. A pool is
then accounted for as a single asset with a single composite
interest rate and an aggregate expectation of cash flows. With
respect to the Washington Mutual transaction, all of the con-
sumer loans were aggregated into pools of loans with common
risk characteristics.
PCI loans are initially recorded at fair value upon acquisition. For
each PCI loan, or pool of loans, the Firm is required to estimate the
total cash flows (both principal and interest) expected to be col-
lected over the remaining life of the loan or pool. These estimates
incorporate assumptions regarding default rates, loss severities, the
amounts and timing of prepayments and other factors that reflect
then-current market conditions.
The excess of cash flows expected to be collected over the carrying
value of the underlying loans is referred to as the accretable yield.
This amount is not reported on the Firm’s Consolidated Balance
Sheets but is accreted into interest income at a level rate of return
over the remaining estimated lives of the underlying pools of loans.
For variable-rate loans, expected future cash flows were initially
based on the rate in effect at acquisition; expected future cash
flows are recalculated as rates change over the lives of the loans.
On a quarterly basis, the Firm updates the amount of loan princi-
pal and interest cash flows expected to be collected. Probable
decreases in expected loan principal cash flows trigger the recog-
nition of impairment, which is then measured as the present
value of the expected principal loss plus any related foregone
interest cash flows, discounted at the pool’s effective interest
rate. Impairments are recognized through the provision and
allowance for loan losses. Probable and significant increases in
expected cash flows (e.g., decreased principal credit losses, the
net benefit of modifications) would first reverse any previously
recorded allowance for loan losses with any remaining increases
recognized prospectively as a yield adjustment over the remaining
estimated lives of the underlying loans. The impacts of (i) pre-
payments, (ii) changes in variable interest rates, and (iii) any other
changes in the timing of expected cash flows are recognized
prospectively as adjustments to interest income. Disposals of
loans – which may include sales of loans, receipt of payments in
full by the borrower, or foreclosure – result in removal of the loan
from the PCI portfolio.
If the timing and/or amounts of expected cash flows on PCI loans
were determined not to be reasonably estimable, no interest
would be accreted and the loans would be reported as nonac-
crual loans; however, since the timing and amounts of expected
cash flows for the Firm’s PCI consumer loans are reasonably
estimable, interest is being accreted and the loans are being
reported as performing loans.
Charge-offs are not recorded on PCI loans until actual losses
exceed the estimated losses that were recorded as purchase
accounting adjustments at acquisition date. To date, no charge-
offs have been recorded for these consumer loans.
The PCI portfolio affects the Firm’s results of operations primarily
through: (i) contribution to net interest margin; (ii) expense re-
lated to defaults and servicing resulting from the liquidation of
the loans; and (iii) any provision for loan losses. The PCI loans
acquired in the Washington Mutual transaction were funded
based on the interest rate characteristics of the loans. For exam-
ple, variable-rate loans were funded with variable-rate liabilities
and fixed-rate loans were funded with fixed-rate liabilities with a
similar maturity profile. A net spread will be earned on the declin-
ing balance of the portfolio, which is estimated as of December
31, 2010, to have a remaining weighted-average life of 7.0
years.
The Firm continues to modify certain PCI loans. The impact of
these modifications is incorporated into the Firm’s quarterly
assessment of whether a probable and significant change in
expected cash flows has occurred, and the loans continue to be
accounted for and reported as PCI loans. The impact of modifica-
tions on expected cash flows is estimated using the Firm’s experi-
ence with previously modified loans and other relevant data.
Additionally, the Firm monitors the performance of modifications
and updates and/or refines assumptions as experience and
changes in circumstances or data warrant.

Notes to consolidated financial statements
234 JPMorgan Chase & Co./2010 Annual Report
Residential real estate – PCI loans
The table below sets forth information about the Firm’s consumer PCI loans.
December 31, Home equity Prime mortgage (in millions, except ratios) 2010 2009 2010 2009
Carrying value(a) $ 24,459 $ 26,520 $ 17,322 $ 19,693
Related allowance for loan losses(b) 1,583 — 1,766 1,090 Loan delinquency (based on unpaid
principal balance)
Current and less than 30 days past due $ 25,783 $ 29,697 $ 13,035 $ 15,404
30–149 days past due 1,348 2,117 1,468 2,026 150 or more days past due 1,181 1,144 4,425 4,542 Total loans $ 28,312 $ 32,958 $ 18,928 $ 21,972
% of 30+ days past due to total loans 8.93% 9.89% 31.13% 29.89% Current estimated LTV ratios
(based on unpaid principal balance)(c)(d) Greater than 125% and refreshed FICO scores:
Equal to or greater than 660 $ 6,324 $ 6,139 $ 2,400 $ 1,935 Less than 660 4,052 4,401 2,744 2,244
101% to 125% and refreshed FICO scores:
Equal to or greater than 660 6,097 6,875 3,815 4,566 Less than 660 2,701 3,141 3,011 3,213
80% to 100% and refreshed FICO scores:
Equal to or greater than 660 4,019 5,713 1,970 3,364 Less than 660 1,483 1,930 1,857 2,594
Lower than 80% and refreshed FICO scores:
Equal to or greater than 660 2,539 3,330 1,443 1,832 Less than 660 1,097 1,429 1,688 2,224
Total unpaid principal balance $ 28,312 $ 32,958 $ 18,928 $ 21,972
Geographic region (based on unpaid principal balance) California $ 17,012 $ 19,749 $ 10,891 $ 12,657 New York 1,316 1,495 1,111 1,239 Texas 525 616 194 231 Florida 2,595 3,045 1,519 1,801 Illinois 627 723 562 650 Ohio 38 47 91 106 New Jersey 540 625 486 540 Michigan 95 113 279 307 Arizona 539 653 359 438 Washington 1,535 1,766 451 533 All other 3,490 4,126 2,985 3,470 Total unpaid principal balance $ 28,312 $ 32,958 $ 18,928 $ 21,972
(a) Carrying value includes the effect of fair value adjustments that were applied to the consumer PCI portfolio at the date of acquisition. (b) Management concluded as part of the Firm’s regular assessment of the PCI loan pools that it was probable that higher expected principal credit losses would result in a decrease in
expected cash flows. As a result, an allowance for loan losses for impairment of these pools has been recognized. (c) Represents the aggregate unpaid principal balance of loans divided by the estimated current property value. Current property values are estimated, at a minimum quarterly, based
on home valuation models utilizing nationally recognized home price index valuation estimates and do not represent actual appraised loan level collateral values; as such the result-ing ratios are necessarily imprecise and should be viewed as estimates. Current estimated combined LTV for junior lien home equity loans considers all available lien positions re-lated to the property.
(d) Refreshed FICO scores represent each borrower’s most recent credit score obtained by the Firm; current FICO scores are obtained at least quarterly.

JPMorgan Chase & Co./2010 Annual Report 235
(table continued from previous page)
Subprime mortgage Option ARMs Total PCI 2010 2009 2010 2009 2010 2009 $ 5,398 $ 5,993 $ 25,584 $ 29,039 $ 72,763 $ 81,245 98 — 1,494 491 4,941 1,581
$ 4,312 $ 4,531 $ 18,672 $ 23,709 $ 61,802 $ 73,341 1,020 1,383 2,215 4,010 6,051 9,536 2,710 3,107 9,904 9,660 18,220 18,453 $ 8,042 $ 9,021 $ 30,791 $ 37,379 $ 86,073 $ 101,330 46.38% 49.77% 39.36% 36.57% 28.20% 27.62% $ 432 $ 409 $ 2,681 $ 4,081 $ 11,837 $ 12,564 2,129 2,084 6,330 6,761 15,255 15,490
424 481 4,292 5,518 14,628 17,440 1,663 1,877 5,005 6,291 12,380 14,522 374 497 4,152 4,925 10,515 14,499 1,477 1,917 3,551 4,213 8,368 10,654 186 179 2,281 2,549 6,449 7,890 1,357 1,577 2,499 3,041 6,641 8,271 $ 8,042 $ 9,021 $ 30,791 $ 37,379 $ 86,073 $ 101,330 $ 1,971 $ 2,244 $ 16,130 $ 19,637 $ 46,004 $ 54,287 736 774 1,703 1,848 4,866 5,356 435 476 155 191 1,309 1,514 906 1,049 3,916 5,106 8,936 11,001 438 480 760 896 2,387 2,749 122 135 131 156 382 444 316 350 1,064 1,166 2,406 2,681 214 245 345 448 933 1,113 165 194 528 708 1,591 1,993 178 200 745 877 2,909 3,376 2,561 2,874 5,314 6,346 14,350 16,816 $ 8,042 $ 9,021 $ 30,791 $ 37,379 $ 86,073 $ 101,330
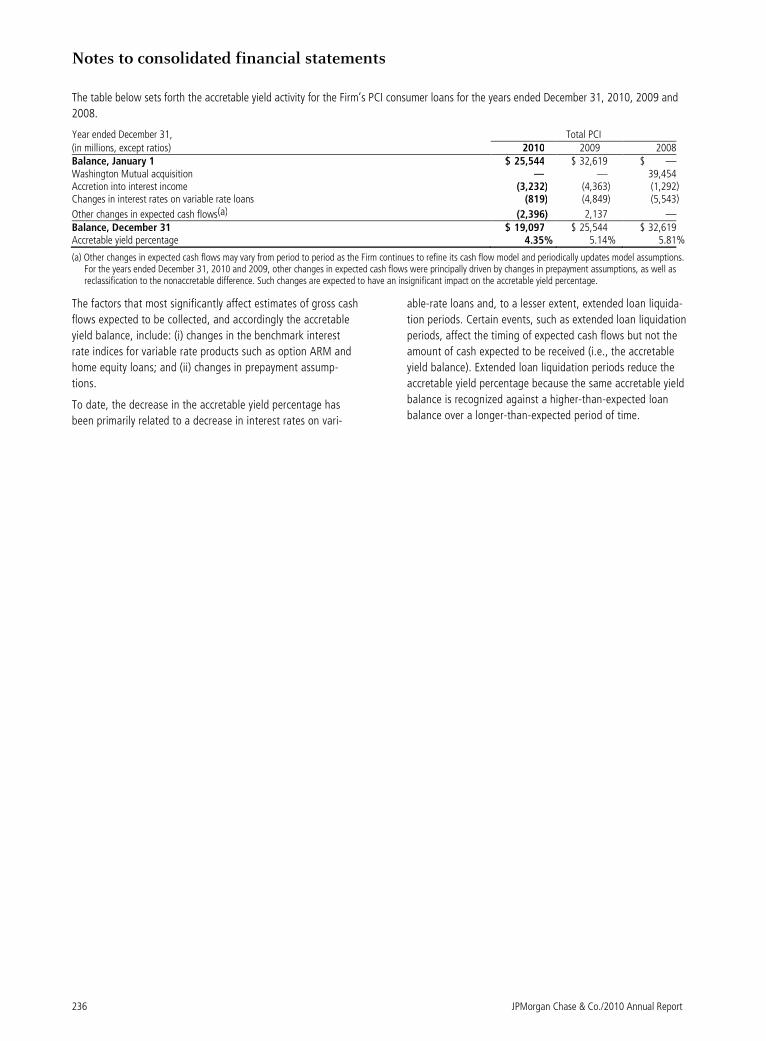
Notes to consolidated financial statements
236 JPMorgan Chase & Co./2010 Annual Report
The table below sets forth the accretable yield activity for the Firm’s PCI consumer loans for the years ended December 31, 2010, 2009 and
2008.
Year ended December 31, Total PCI (in millions, except ratios) 2010 2009 2008
Balance, January 1 $ 25,544 $ 32,619 $ — Washington Mutual acquisition — — 39,454 Accretion into interest income (3,232) (4,363) (1,292) Changes in interest rates on variable rate loans (819) (4,849) (5,543)
Other changes in expected cash flows(a) (2,396) 2,137 —
Balance, December 31 $ 19,097 $ 25,544 $ 32,619 Accretable yield percentage 4.35% 5.14% 5.81%
(a) Other changes in expected cash flows may vary from period to period as the Firm continues to refine its cash flow model and periodically updates model assumptions. For the years ended December 31, 2010 and 2009, other changes in expected cash flows were principally driven by changes in prepayment assumptions, as well as reclassification to the nonaccretable difference. Such changes are expected to have an insignificant impact on the accretable yield percentage.
The factors that most significantly affect estimates of gross cash
flows expected to be collected, and accordingly the accretable
yield balance, include: (i) changes in the benchmark interest
rate indices for variable rate products such as option ARM and
home equity loans; and (ii) changes in prepayment assump-
tions.
To date, the decrease in the accretable yield percentage has
been primarily related to a decrease in interest rates on vari-
able-rate loans and, to a lesser extent, extended loan liquida-
tion periods. Certain events, such as extended loan liquidation
periods, affect the timing of expected cash flows but not the
amount of cash expected to be received (i.e., the accretable
yield balance). Extended loan liquidation periods reduce the
accretable yield percentage because the same accretable yield
balance is recognized against a higher-than-expected loan
balance over a longer-than-expected period of time.

JPMorgan Chase & Co./2010 Annual Report 237
Credit card loans The credit card portfolio segment includes credit card loans origi-
nated and purchased by the Firm, including those acquired in the
Washington Mutual transaction. Delinquency rates are the pri-
mary credit quality indicator for credit card loans as they provide
an early warning that borrowers may be experiencing difficulties
(30-days past due), as well as information on those borrowers
that have been delinquent for a longer period of time (90-days
past due). In addition to delinquency rates, the geographic distri-
bution of the loans provides insight as to the credit quality of the
portfolio based on the regional economy.
The borrower’s credit score is another general indicator of credit
quality. Because the borrower’s credit score tends to be a lagging
indicator of credit quality, the Firm does not use credit scores as a
primary indicator of credit quality. However, the distribution of such
scores provides a general indicator of credit quality trends within
the portfolio. Refreshed FICO score information for a random sam-
ple of the credit card portfolio is indicated in the table below, as
FICO is considered to be the industry benchmark for credit scores.
The Firm generally originates new card accounts to prime con-
sumer borrowers. However, certain cardholders’ refreshed FICO
scores may change over time, depending on the performance of
the cardholder and changes in credit score technology.
The table below sets forth information about the Firm’s Credit Card loans.
As of or for the year ended December 31,
(in millions, except ratios)
Chase, excluding
Washington Mutual portfolio(e)
Washington Mutual
portfolio(e) Total credit card
2010 2009 2010 2009(f) 2010 2009(f) Net charge-offs $ 11,191 $ 6,466 $ 2,846 $ 3,168 $ 14,037 $ 9,634 % of net charge-offs to retained loans 8.73% 9.76% 17.73% 15.26% 9.73% 11.07%
Loan delinquency(a)(b) Current and less than 30 days past due and still accruing $ 117,248 $ 55,374 $ 12,670 $ 17,316 $ 129,918 $ 72,690 30 – 89 days past due and still accruing 2,092 1,638 459 974 2,551 2,612 90 or more days past due and still accruing 2,449 2,118 604 1,363 3,053 3,481 Nonaccrual loans 2 3 — — 2 3 Total retained loans $ 121,791 $ 59,133 $ 13,733 $ 19,653 $ 135,524 $ 78,786 Loan delinquency ratios % of 30 plus days past due to total retained loans 3.73% 6.35% 7.74% 11.89% 4.14% 7.73% % of 90 plus days past due to total retained loans 2.01 3.58 4.40 6.94 2.25 4.42
Credit card loans by geographic region California $ 15,454 $ 7,115 $ 2,650 $ 3,873 $ 18,104 $ 10,988 New York 9,540 4,527 1,032 1,458 10,572 5,985 Texas 9,217 4,154 1,006 1,421 10,223 5,575 Florida 6,724 3,439 1,165 1,735 7,889 5,174 Illinois 7,077 3,166 542 771 7,619 3,937 Ohio 5,035 2,506 401 562 5,436 3,068 New Jersey 5,070 2,337 494 707 5,564 3,044 Michigan 3,956 1,977 273 397 4,229 2,374 Virginia 3,020 1,386 295 417 3,315 1,803 Pennsylvania 4,521 2,243 424 598 4,945 2,841 Washington 2,053 911 438 596 2,491 1,507 Georgia 2,834 1,477 398 562 3,232 2,039 All other 47,290 23,895 4,615 6,556 51,905 30,451
Total retained loans(c) $ 121,791 $ 59,133 $ 13,733 $ 19,653 $ 135,524 $ 78,786
Percentage of portfolio based on carrying value
with estimated refreshed FICO scores(d) Equal to or greater than 660 80.6% 72.6% 56.4% 49.2% 77.9% 66.7% Less than 660 19.4 27.4 43.6 50.8 22.1 33.3
(a) Results reflect the impact of purchase accounting adjustments related to the Washington Mutual transaction and the consolidation of the WMMT in the second quarter of 2009.
(b) The Firm's policy is generally to exempt credit card loans from being placed on nonaccrual status as permitted by regulatory guidance. Under guidance issued by the FFIEC, credit card loans are charged off by the end of the month in which the account becomes 180 days past due or within 60 days from receiving notification about a specified event (e.g., bankruptcy of the borrower), whichever is earlier.
(c) Effective January 1, 2010, the Firm adopted accounting guidance related to VIEs. Upon adoption of the guidance, the Firm consolidated its Firm-sponsored credit card securitization trusts. For further information, see Note 16 on pages 244–259 of this Annual Report.
(d) Refreshed FICO scores are estimated based on a statistically significant random sample of credit card accounts in the credit card portfolio for the period shown. The Firm obtains refreshed FICO scores on a quarterly basis.
(e) Includes billed finance charges and fees net of an allowance for uncollectible amounts. (f) Includes $1.0 billion of loans at December 31, 2009, held by the WMMT, which were consolidated onto the Firm's Consolidated Balance Sheets at fair value during the
second quarter of 2009. Such loans had been fully repaid or charged off as of December 31, 2010. For further discussion, see Note 16 on pages 244–259 of this An-nual Report.

Notes to consolidated financial statements
238 JPMorgan Chase & Co./2010 Annual Report
Credit card impaired loans
JPMorgan Chase may offer one of a number of loan modification
programs to credit card borrowers who are experiencing financial
difficulty. The Firm has short-term programs for borrowers who
may be in need of temporary relief, and long-term programs for
borrowers who are experiencing a more fundamental level of
financial difficulties. Most of the Firm’s modified credit card loans
have been modified under the long-term programs. Modifications
under the Firm’s long-term programs involve placing the customer
on a fixed payment plan not exceeding 60 months. Modifications
under all of these programs typically include reducing the interest
rate on the card. Also in all cases, the Firm cancels the customer’s
available line of credit on the credit card. Substantially all of these
modifications, both long-term and short-term are considered to
be troubled debt restructurings.
If the cardholder does not comply with the modified payment
terms, then the credit card loan agreement reverts back to its pre-
modification payment terms. Assuming that the cardholder does
not begin to perform in accordance with those payment terms,
the loan continues to age and will ultimately be charged-off in
accordance with the Firm’s standard charge-off policy. In addi-
tion, if a borrower successfully completes a short-term modifica-
tion program, then the loan reverts back to its pre-modification
payment terms. However, in most cases, the Firm does not rein-
state the borrower’s line of credit.
The Firm measures the allowance for loan losses related to im-
paired credit card loans as the difference between the recorded
investment in the loan and the present value of the cash flows
expected to be collected, discounted at the loan’s original con-
tractual interest rate and, therefore, does not consider any incre-
mental penalty rate in this measurement.
The tables below set forth information about the Firm’s impaired
credit card loans. All of these loans are considered to be impaired
as they have been modified in troubled debt restructurings.
Chase, excluding Washington Mutual
portfolio Washington Mutual
portfolio Total credit card December 31, (in millions) 2010 2009 2010 2009 2010 2009
Impaired loans with an allowance(a)(b)
Credit card loans with modified payment terms(c) $ 6,685 $ 3,513 $ 1,570 $ 1,617 $ 8,255 $ 5,130 Modified credit card loans that have reverted to
pre-modification payment terms(d) 1,439 812 311 303 1,750 1,115
Total impaired loans(e) $ 8,124 $ 4,325 $ 1,881 $ 1,920 $10,005 $ 6,245 Allowance for loan losses related to impaired
loans $ 3,175 $ 2,038 $ 894 $ 1,079 $ 4,069 $ 3,117
(a) The carrying value and the unpaid principal balance are the same for credit card impaired loans. (b) There are no impaired loans without an allowance. (c) Represents credit card loans outstanding to borrowers then enrolled in a credit card modification program. (d) Represents credit card loans that were modified in troubled debt restructurings but that have subsequently reverted back to the loans’ pre-modification payment
terms. Of the $1.8 billion total loan amount at December 31, 2010, approximately $1.2 billion of loans have reverted back to the pre-modification payment terms of the loans due to noncompliance with the terms of the modified loans. A substantial portion of these loans is expected to be charged-off in accordance with the Firm’s standard charge-off policy. The remaining $590 million of loans are to borrowers who have successfully completed a short-term modification program. The Firm continues to report these loans as troubled debt restructurings since the borrowers’ credit lines remain closed. Prior-period amounts have been revised to conform to the current presentation.
(e) The increase in troubled debt restructurings from December 31, 2009 to December 31, 2010, is primarily attributable to previously-modified loans held in Firm-sponsored credit card securitization trusts being consolidated as a result of adopting the new accounting guidance related to VIEs.
The following table presents average balances of impaired credit card loans and interest income recognized on those loans.
For the year ended December 31, Impaired loans (average) Interest income on impaired loans(a)
(in millions) 2010 2009 2008 2010 2009 2008
Chase, excluding Washington Mutual portfolio $ 8,747 $ 3,059 $ 2,386 $ 479 $ 181 $ 167
Washington Mutual portfolio 1,983 991 — 126 70 —
Total credit card $ 10,730 $ 4,050 $ 2,386 $ 605 $ 251 $ 167
(a) As permitted by regulatory guidance, credit card loans are generally exempt from being placed on nonaccrual status; accordingly, interest and fees related to credit card loans continue to accrue until the loan is charged off or paid in full. However, the Firm separately establishes an allowance for the estimated uncollectible portion of billed and ac-crued interest and fee income on credit card loans.

JPMorgan Chase & Co./2010 Annual Report 239
Note 15 – Allowance for credit losses
JPMorgan Chase’s allowance for loan losses covers the wholesale
and consumer, including credit card loan portfolios, and represents
management’s estimate of probable credit losses inherent in the
Firm’s loan portfolio. Management also computes an allowance for
wholesale and consumer lending-related commitments using meth-
odologies similar to those used to compute the allowance on the
underlying loans. During 2010, the Firm did not make any significant
changes to the methodologies or policies used to determine its al-
lowance for credit losses, which policies are described in the follow-
ing paragraphs.
The allowance for loan losses includes an asset-specific component, a
formula-based component and a component related to PCI loans.
The asset-specific component relates to loans considered to be im-
paired, which includes loans that have been modified in a troubled
debt restructuring as well as risk-rated loans that have been placed
on nonaccrual status. An asset-specific allowance for impaired loans
is established when the loan’s discounted cash flows (or, in certain
cases, the loan’s observable market price) is lower than the recorded
investment in the loan. To compute the asset-specific component of
the allowance, larger loans are evaluated individually, while smaller
loans are evaluated as pools using historical loss experience for the
respective class of assets. Risk-rated loans (primarily wholesale loans)
are pooled by risk rating, while scored loans (i.e., consumer loans)
are pooled by product type.
The Firm generally measures the asset-specific allowance as the
difference between the recorded investment in the loan and the
present value of the cash flows expected to be collected, discounted
at the loan’s original effective interest rate. Subsequent changes in
impairment due to the impact of discounting are reported as an
adjustment to the provision for loan losses, not as an adjustment to
interest income. An asset-specific allowance for an impaired loan that
is determined using an observable market price is measured as the
difference between the recorded investment in the loan and the
loan’s fair value.
Certain loans are deemed collateral-dependent because repay-
ment of the loan is expected to be provided solely by the underly-
ing collateral, rather than by cash flows from the borrower’s
operations, income or other resources. Impaired collateral-
dependent loans are charged-off to the fair value of the collateral,
less costs to sell, rather than being subject to an asset-specific
reserve as for other impaired loans.
The determination of the fair value of the collateral depends on
the type of collateral (e.g., securities, real estate). In cases where
the collateral is in the form of liquid securities, the fair value is
based on quoted market prices or broker quotes. For illiquid
securities or other financial assets, the fair value of the collateral
is estimated using a discounted cash flow model.
For residential real estate loans, collateral values are based upon
external valuation sources. When it becomes likely that a bor-
rower is either unable or unwilling to pay, the Firm obtains a
broker’s price opinion of the home based on an exterior-only
valuation (“exterior opinions”). As soon as practicable after
taking physical possession of the property through foreclosure,
the Firm obtains an appraisal based on an inspection that in-
cludes the interior of the home (“interior appraisals”). Exterior
opinions and interior appraisals are discounted based upon the
Firm’s experience with actual liquidation values as compared to
the estimated values provided by exterior opinions and interior
appraisals, considering state- and product-specific factors.
For commercial real estate loans, the collateral value is generally
based on appraisals from internal and external valuation sources.
Collateral values are typically updated every six to twelve months,
either by obtaining a new appraisal or by performing an internal
analysis, in accordance with the Firm’s policies. The Firm also
considers both borrower- and market-specific factors, which may
result in obtaining appraisal updates or broker price opinions at
more frequent intervals.
See Note 3 on pages 170–187 of this Annual Report for further
information on the fair value hierarchy for impaired collateral-
dependent loans.
The formula-based component is based on a statistical calculation to
provide for probable principal losses inherent in performing risk-rated
loans and consumer loans, except for loans restructured in troubled
debt restructurings and PCI loans. See Note 14 on pages 220–238 of
this Annual Report for more information on PCI loans.
For risk-rated loans, the statistical calculation is the product of an
estimated probability of default and an estimated loss given default.
These factors are differentiated by risk rating and expected maturity.
In assessing the risk rating of a particular loan, among the factors
considered are the obligor’s debt capacity and financial flexibility, the
level of the obligor’s earnings, the amount and sources for repay-
ment, the level and nature of contingencies, management strength,
and the industry and geography in which the obligor operates. These
factors are based on an evaluation of historical and current informa-
tion, and involve subjective assessment and interpretation. Emphasiz-
ing one factor over another or considering additional factors could
impact the risk rating assigned by the Firm to that loan. PD estimates
are based on observable external through-the-cycle data, using
credit-rating agency default statistics. LGD estimates are based on the
Firm’s history of actual credit losses over more than one credit cycle.
For scored loans, the statistical calculation is performed on pools of
loans with similar risk characteristics (e.g., product type) and gener-
ally computed as the product of actual outstandings, an expected-
loss factor and an estimated-loss coverage period. Expected-loss
factors are statistically derived and consider historical factors such as
loss frequency and severity. In developing loss frequency and severity
assumptions, the Firm considers known and anticipated changes in
the economic environment, including changes in housing prices,
unemployment rates and other risk indicators.
A nationally recognized home price index measure is used to develop
loss severity estimates on defaulted residential real estate loans at
the metropolitan statistical areas (“MSA”) level. These loss severity
estimates are regularly validated by comparison to actual losses

Notes to consolidated financial statements
240 JPMorgan Chase & Co./2010 Annual Report
recognized on defaulted loans, market-specific real estate appraisals
and property sales activity. Real estate broker price opinions are
obtained when the loan is being evaluated for charge-off and at least
every six months thereafter. When foreclosure is determined to be
probable, a third-party appraisal is obtained as soon as practicable.
Forecasting methods are used to estimate expected-loss factors,
including credit loss forecasting models and vintage-based loss
forecasting.
The economic impact of potential modifications of residential real
estate loans is not included in the formula-based allowance because
of the uncertainty regarding the type and results of such modifica-
tions. As discussed in Note 14 on pages 220–238 of this Annual
Report, modified residential real estate loans are generally accounted
for as troubled debt restructurings upon contractual modification and
are evaluated for an asset-specific allowance at and subsequent to
modification. Assumptions regarding the loans’ expected re-default
rates are incorporated into the measurement of the asset-specific
allowance.
Management applies judgment within an established framework to
adjust the results of applying the statistical calculation described above.
The determination of the appropriate adjustment is based on manage-
ment’s view of uncertainties that have occurred but are not yet re-
flected in the loss factors and that relate to current macroeconomic and
political conditions, the quality of underwriting standards and other
relevant internal and external factors affecting the credit quality of the
portfolio. In addition, for the risk-rated portfolios, any adjustments
made to the statistical calculation also consider concentrated and
deteriorating industries. For the scored loan portfolios, adjustments to
the statistical calculation are accomplished in part by analyzing the
historical loss experience for each major product segment. Factors
related to unemployment, housing prices, borrower behavior and lien
position are incorporated into the calculation, where relevant.
Management establishes an asset-specific allowance for lending-
related commitments that are considered impaired and computes a
formula-based allowance for performing wholesale and consumer
lending-related commitments. These are computed using a method-
ology similar to that used for the wholesale loan portfolio, modified
for expected maturities and probabilities of drawdown.
Allowance for credit losses and loans and lending-related commitments by impairment methodology
2010 Year ended December 31, (in millions) Wholesale
Consumer, excluding credit card Credit Card Total
Allowance for loan losses Beginning balance at January 1, $ 7,145 $ 14,785 $ 9,672 $ 31,602
Cumulative effect of change in accounting principles(a) 14 127 7,353 7,494
Gross charge-offs(a) 1,989 8,383 15,410 25,782
Gross (recoveries)(a) (262) (474) (1,373) (2,109)
Net charge-offs(a) 1,727 7,909 14,037 23,673 Provision for loan losses:
Excluding accounting conformity(a) (673) 9,458 8,037 16,822
Accounting conformity(b) — — — — Total provision for loan losses (673) 9,458 8,037 16,822 Acquired allowance resulting from Washington Mutual transaction — — — —
Other(c) 2 10 9 21 Ending balance at December 31 $ 4,761 $ 16,471 $ 11,034 $ 32,266 Allowance for loan losses by impairment methodology
Asset-specific(d)(e)(f) $ 1,574 $ 1,075 $ 4,069 $ 6,718
Formula-based(a)(f) 3,187 10,455 6,965 20,607 PCI — 4,941 — 4,941 Total allowance for loan losses $ 4,761 $ 16,471 $ 11,034 $ 32,266 Loans by impairment methodology
Asset-specific(c) $ 5,486 $ 6,220 $ 10,005 $ 21,711 Formula-based 216,980 248,481 125,519 590,980 PCI 44 72,763 — 72,807 Total retained loans $ 222,510 $ 327,464 $ 135,524 $ 685,498
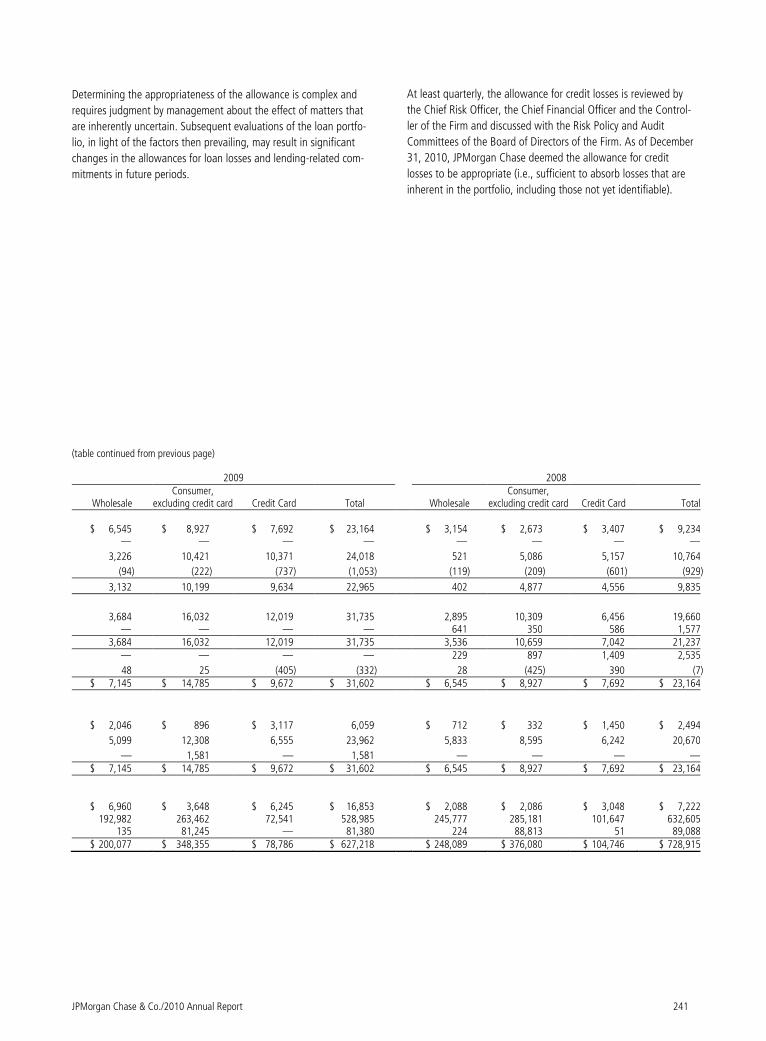
JPMorgan Chase & Co./2010 Annual Report 241
Determining the appropriateness of the allowance is complex and
requires judgment by management about the effect of matters that
are inherently uncertain. Subsequent evaluations of the loan portfo-
lio, in light of the factors then prevailing, may result in significant
changes in the allowances for loan losses and lending-related com-
mitments in future periods.
At least quarterly, the allowance for credit losses is reviewed by
the Chief Risk Officer, the Chief Financial Officer and the Control-
ler of the Firm and discussed with the Risk Policy and Audit
Committees of the Board of Directors of the Firm. As of December
31, 2010, JPMorgan Chase deemed the allowance for credit
losses to be appropriate (i.e., sufficient to absorb losses that are
inherent in the portfolio, including those not yet identifiable).
(table continued from previous page)
2009 2008
Wholesale Consumer,
excluding credit card Credit Card Total Wholesale Consumer,
excluding credit card Credit Card Total $ 6,545 $ 8,927 $ 7,692 $ 23,164 $ 3,154 $ 2,673 $ 3,407 $ 9,234 — — — — — — — —
3,226 10,421 10,371 24,018 521 5,086 5,157 10,764
(94) (222) (737) (1,053) (119) (209) (601) (929)
3,132 10,199 9,634 22,965 402 4,877 4,556 9,835
3,684 16,032 12,019 31,735 2,895 10,309 6,456 19,660 — — — — 641 350 586 1,577 3,684 16,032 12,019 31,735 3,536 10,659 7,042 21,237 — — — — 229 897 1,409 2,535
48 25 (405) (332) 28 (425) 390 (7) $ 7,145 $ 14,785 $ 9,672 $ 31,602 $ 6,545 $ 8,927 $ 7,692 $ 23,164
$ 2,046 $ 896 $ 3,117 6,059 $ 712 $ 332 $ 1,450 $ 2,494
5,099 12,308 6,555 23,962 5,833 8,595 6,242 20,670
— 1,581 — 1,581 — — — — $ 7,145 $ 14,785 $ 9,672 $ 31,602 $ 6,545 $ 8,927 $ 7,692 $ 23,164 $ 6,960 $ 3,648 $ 6,245 $ 16,853 $ 2,088 $ 2,086 $ 3,048 $ 7,222 192,982 263,462 72,541 528,985 245,777 285,181 101,647 632,605 135 81,245 — 81,380 224 88,813 51 89,088 $ 200,077 $ 348,355 $ 78,786 $ 627,218 $ 248,089 $ 376,080 $ 104,746 $ 728,915

Notes to consolidated financial statements
242 JPMorgan Chase & Co./2010 Annual Report
2010 Year ended December 31, (in millions) Wholesale
Consumer, excluding credit card Credit Card Total
Allowance for lending-related commitments Beginning balance at January 1, $ 927 $ 12 $ — $ 939
Cumulative effect of change in accounting principles(a) (18) — — (18) Provision for lending-related commitments:
Excluding accounting conformity(a) (177) (6) — (183)
Accounting conformity(b) — — — — Total provision for lending-related commitments (177) (6) — (183) Acquired allowance resulting from Washington Mutual transaction — — — —
Other(c) (21) — — (21) Ending balance at December 31 $ 711 $ 6 $ — $ 717
Allowance for lending-related commitments by impairment methodology
Asset-specific $ 180 $ — $ — $ 180 Formula-based 531 6 — 537 Total allowance for lending-related commitments $ 711 $ 6 $ — $ 717
Lending-related commitments by impairment methodology Asset-specific $ 1,005 $ — $ — $ 1,005 Formula-based 345,074 61,534 547,227 953,835 Total lending-related commitments $ 346,079 $ 61,534 $ 547,227 $ 954,840
Impaired collateral-dependent loans Net charge-offs $ 269 $ 304 $ — $ 573 Loans measured at fair value of collateral less cost to sell 806 890 — 1,696
(a) Effective January 1, 2010, the Firm adopted accounting guidance related to VIEs. Upon adoption of the guidance, the Firm consolidated its Firm-sponsored credit card securitization trusts, its Firm-administered multi-seller conduits and certain other consumer loan securitization entities, primarily mortgage-related. As a result, $7.4 billion, $14 million and $127 million, respectively, of allowance for loan losses were recorded on-balance sheet with the consolidation of these entities. For further discussion, see Note 16 on pages 244–259 of this Annual Report.
(b) Represents adjustments to the provision for credit losses recognized in Corporate/Private Equity related to the Washington Mutual transaction in 2008. (c) The 2009 amount predominantly represents a reclassification related to the issuance and retention of securities from the Chase Issuance Trust. For further information,
see Note 16 on pages 244–259 of this Annual Report. The 2008 amount predominantly represents a transfer of allowance between Corporate/Private Equity and Credit card.
(d) Relates to risk-rated loans that have been placed on nonaccrual status and loans that have been modified in a troubled debt restructuring. (e) At December 31, 2010, 2009 and 2008 the asset-specific consumer excluding card allowance for loan losses included troubled debt restructuring reserves of $985
million, $754 million and $258 million respectively. The asset-specific credit card allowance for loan losses is related to loans modified in troubled debt restructurings. (f) At December 31, 2010, the Firm’s allowance for loan losses on all impaired credit card loans was reclassified to the asset-specific allowance. This reclassification had
no incremental impact on the Firm’s allowance for loan losses. Prior periods have been revised to reflect the current presentation. .

JPMorgan Chase & Co./2010 Annual Report 243
(table continued from previous page)
2009 2008
Wholesale Consumer,
excluding credit card Credit card Total Wholesale Consumer,
excluding credit card Credit card Total $ 634 $ 25 $ — $ 659 $ 835 $ 15 $ — $ 850 — — — — — — — —
290 (10) — 280 (214) (1) — (215) — — — — 5 (48) — (43) 290 (10) — 280 (209) (49) — (258) — — — — — 66 — 66 3 (3) — — 8 (7) — 1 $ 927 $ 12 $ — $ 939 $ 634 $ 25 $ — $ 659
$ 297 $ — $ — $ 297 $ 29 $ — $ — $ 29 630 12 — 642 605 25 — 630 $ 927 $ 12 $ — $ 939 $ 634 $ 25 $ — $ 659
$ 1,577 $ — $ — $ 1,577 $ 233 $ — $ — $ 233 345,578 74,827 569,113 989,518 379,638 117,805 623,702 1,121,145 $ 347,155 $ 74,827 $ 569,113 $ 991,095 $ 379,871 $ 117,805 $ 623,702 $ 1,121,378
$ 500 $ 166 $ — $ 666 $ 124 $ 22 $ — $ 146 1,127 210 — 1,337 1,032 33 — 1,065
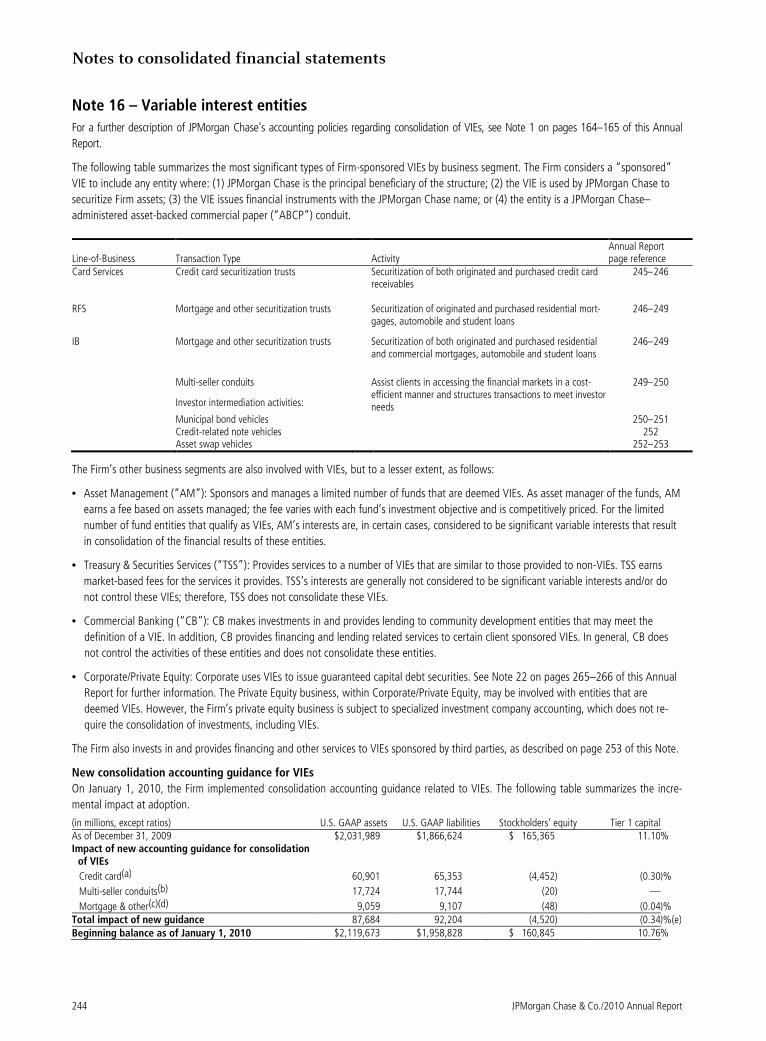
Notes to consolidated financial statements
244 JPMorgan Chase & Co./2010 Annual Report
Note 16 – Variable interest entities
For a further description of JPMorgan Chase’s accounting policies regarding consolidation of VIEs, see Note 1 on pages 164–165 of this Annual
Report.
The following table summarizes the most significant types of Firm-sponsored VIEs by business segment. The Firm considers a “sponsored”
VIE to include any entity where: (1) JPMorgan Chase is the principal beneficiary of the structure; (2) the VIE is used by JPMorgan Chase to
securitize Firm assets; (3) the VIE issues financial instruments with the JPMorgan Chase name; or (4) the entity is a JPMorgan Chase–
administered asset-backed commercial paper (“ABCP”) conduit.
Line-of-Business Transaction Type Activity Annual Report page reference
Card Services Credit card securitization trusts Securitization of both originated and purchased credit card receivables
245–246
RFS Mortgage and other securitization trusts Securitization of originated and purchased residential mort-gages, automobile and student loans
246–249
IB Mortgage and other securitization trusts Securitization of both originated and purchased residential and commercial mortgages, automobile and student loans
246–249
Multi-seller conduits
Investor intermediation activities:
Assist clients in accessing the financial markets in a cost-efficient manner and structures transactions to meet investor needs
249–250
Municipal bond vehicles 250–251 Credit-related note vehicles 252 Asset swap vehicles 252–253
The Firm’s other business segments are also involved with VIEs, but to a lesser extent, as follows:
• Asset Management (“AM”): Sponsors and manages a limited number of funds that are deemed VIEs. As asset manager of the funds, AM
earns a fee based on assets managed; the fee varies with each fund’s investment objective and is competitively priced. For the limited
number of fund entities that qualify as VIEs, AM’s interests are, in certain cases, considered to be significant variable interests that result
in consolidation of the financial results of these entities.
• Treasury & Securities Services (“TSS”): Provides services to a number of VIEs that are similar to those provided to non-VIEs. TSS earns
market-based fees for the services it provides. TSS’s interests are generally not considered to be significant variable interests and/or do
not control these VIEs; therefore, TSS does not consolidate these VIEs.
• Commercial Banking (“CB”): CB makes investments in and provides lending to community development entities that may meet the
definition of a VIE. In addition, CB provides financing and lending related services to certain client sponsored VIEs. In general, CB does
not control the activities of these entities and does not consolidate these entities.
• Corporate/Private Equity: Corporate uses VIEs to issue guaranteed capital debt securities. See Note 22 on pages 265–266 of this Annual
Report for further information. The Private Equity business, within Corporate/Private Equity, may be involved with entities that are
deemed VIEs. However, the Firm’s private equity business is subject to specialized investment company accounting, which does not re-
quire the consolidation of investments, including VIEs.
The Firm also invests in and provides financing and other services to VIEs sponsored by third parties, as described on page 253 of this Note.
New consolidation accounting guidance for VIEs
On January 1, 2010, the Firm implemented consolidation accounting guidance related to VIEs. The following table summarizes the incre-
mental impact at adoption.
(in millions, except ratios) U.S. GAAP assets U.S. GAAP liabilities Stockholders’ equity Tier 1 capital As of December 31, 2009 $2,031,989 $1,866,624 $ 165,365 11.10 % Impact of new accounting guidance for consolidation
of VIEs
Credit card(a) 60,901 65,353 (4,452) (0.30 )%
Multi-seller conduits(b) 17,724 17,744 (20) —
Mortgage & other(c)(d) 9,059 9,107 (48) (0.04 )% Total impact of new guidance 87,684 92,204 (4,520) (0.34 )%(e) Beginning balance as of January 1, 2010 $2,119,673 $1,958,828 $ 160,845 10.76 %

JPMorgan Chase & Co./2010 Annual Report 245
(a) The assets and liabilities of the Firm-sponsored credit card securitization trusts that were consolidated were initially measured at their carrying values, primarily amortized cost, as this method is consistent with the approach that Card Services utilizes to manage its other assets. These assets were primarily recorded in loans on the Firm’s Consolidated Balance Sheet. In addition, Card Services established an allowance for loan losses of $7.4 billion (pretax), which was reported as a transi-tion adjustment in stockholders’ equity. The impact to stockholders’ equity also includes a decrease to AOCI of $116 million, as a result of the reversal of the fair value adjustments taken on retained AFS securities that were eliminated in consolidation.
(b) The assets and liabilities of the Firm-administered multi-seller conduits which were consolidated were initially measured at their carrying values, primarily amortized cost, as this method is consistent with the business’s intent to hold the assets for the longer-term. The assets are recorded primarily in loans and in other assets on the Firm’s Consolidated Balance Sheets.
(c) RFS consolidated certain mortgage and other consumer securitizations, which resulted in a net increase in both assets and liabilities of $4.7 billion ($3.5 billion related to residential mortgage securitizations and $1.2 billion related to other consumer securitizations). These assets were initially measured at their unpaid princi-pal balance and recorded primarily in loans on the Firm’s Consolidated Balance Sheets. This method was elected as a practical expedient.
(d) IB consolidated certain mortgage and other consumer securitizations, which resulted in a net increase in both assets and liabilities of $4.3 billion ($3.7 billion related to residential mortgage securitizations and $0.6 billion related to other consumer securitizations). These assets were initially measured at their fair value, as this method is consistent with the approach that IB utilizes to manage similar assets. These assets were recorded primarily in trading assets on the Firm’s Consolidated Balance Sheets.
(e) The U.S. GAAP consolidation of the credit card securitization trusts did not have a significant impact on risk-weighted assets on the adoption date because the Chase Issuance Trust (the Firm’s primary credit card securitization trust) had been consolidated for regulatory capital purposes beginning in the second quarter of 2009, which added approximately $40.0 billion of risk-weighted assets for regulatory capital purposes. In addition, the Firm elected a two-quarter regulatory imple-mentation deferral of the effect of this accounting guidance on risk-weighted assets and risk-based capital requirements, as permitted for its Firm-administered multi-seller conduits and certain mortgage-related and other securitization entities. The deferral period ended July 1, 2010, and the Firm consolidated, for regulatory capital purposes, the deferred amounts, which had a negligible impact on risk-weighted assets and risk-based capital ratios.
Significant Firm-sponsored variable interest entities
Credit card securitizations
The Card Services (“CS”) business securitizes originated and pur-
chased credit card loans, primarily through the Chase Issuance Trust
(the “Trust”). The Firm’s continuing involvement in credit card securi-
tizations includes servicing the receivables, retaining an undivided
seller’s interest in the receivables, retaining certain senior and subor-
dinated securities and maintaining escrow accounts. As servicer, the
Firm receives contractual servicing fees based on the securitized loan
balance plus excess servicing fees, which are recorded in credit card
income as discussed in Note 7 on page 200 of this Annual Report.
Effective January 1, 2010, the Firm consolidated the assets and
liabilities of Firm-sponsored credit card securitization trusts, including
its primary card securitization trust, Chase Issuance Trust, as a result
of the implementation of new accounting guidance. The consolida-
tion determination was based on the Firm’s ability to direct the
activities of these VIEs through its servicing responsibilities and other
duties, including making decisions as to the receivables that are
transferred into those trusts and as to any related modifications and
workouts. Additionally, the nature and extent of the Firm’s other
continuing involvement with the trusts, as indicated above, obligates
the Firm to absorb losses and gives the Firm the right to receive
certain benefits from these VIEs that could potentially be significant.
Upon consolidation at January 1, 2010, the Firm recorded a net
increase in GAAP assets of $60.9 billion on the Consolidated Balance
Sheet, as follows: $84.7 billion of loans; $7.4 billion of allowance for
loan losses; $4.4 billion of other assets, partially offset by $20.8
billion of previously recognized assets, consisting primarily of retained
AFS securities that were eliminated upon consolidation. In addition,
the Firm recognized $65.4 billion of liabilities representing the trusts’
beneficial interests issued to third parties.
The following table summarizes the assets and liabilities of the Firm-sponsored credit card securitization trusts at December 31, 2010.
(in billions) Loans Other assets
Total assets held by Firm–sponsored
credit card securitization trusts
Beneficial interests
issued to third parties
December 31, 2010 $ 67.2 $ 1.3 $ 68.5 $ 44.3
The underlying securitized credit card receivables and other assets
are available only for payment of the beneficial interests issued by
the securitization trusts; they are not available to pay the Firm’s
other obligations or the claims of the Firm’s other creditors.
The agreements with the credit card securitization trusts require the
Firm to maintain a minimum undivided interest in the credit card
trusts (which generally ranges from 4% to 12%). As of December
31, 2010, the Firm held undivided interests in Firm-sponsored
credit card securitization trusts of $17.2 billion. The Firm main-
tained an average undivided interest in principal receivables owned
by those trusts of approximately 19% for the year ended December
31, 2010. The Firm also retained $1.1 billion of senior securities
and $3.2 billion of subordinated securities in certain of its credit
card securitization trusts as of December 31, 2010. The Firm’s
undivided interests in the credit card trusts and securities retained
are eliminated in consolidation.
Accounting Treatment Prior to January 1, 2010
Prior to January 1, 2010, the Firm accounted for its credit card
securitizations as QSPEs and therefore these entities were not
consolidated. The Firm recorded only its retained interests in the
entities on its Consolidated Balance Sheets.
As of December 31, 2009, the principal amount outstanding of
total assets held by Firm-sponsored nonconsolidated credit card
securitizations QSPEs was $109.6 billion in which the Firm had
continuing involvement.
At December 31, 2009, the Firm retained undivided interests in its
Firm-sponsored credit card securitization trusts of $16.7 billion,
Notes to consolidated financial statements
246 JPMorgan Chase & Co./2010 Annual Report
which were classified within loans on its Consolidated Balance
Sheets. The Firm maintained an average undivided interest in
principal receivables owned by those trusts of approximately 16%
for the year ended December 31, 2009. The Firm also retained
$7.2 billion of senior securities and $6.6 billion of subordinated
securities in certain of its credit card securitization trusts as of
December 31, 2009, which were classified as AFS securities. Addi-
tionally, the Firm’s interests included $1.0 billion of escrow ac-
counts and $3.2 billion of retained subordinated interests in
accrued interest and fees on securitized receivables, which were
classified as “other assets.”
During 2009, the Firm took certain actions permitted by the trust
agreements with respect to two of the Firm’s credit card securitiza-
tion trusts.
• Chase Issuance Trust (the “Trust”): In 2009, the Firm consoli-
dated, for regulatory capital purposes, the Chase Issuance Trust
(the Firm’s primary issuance trust) as a result of taking certain
actions permitted by the Trust agreements, including increasing
the required credit enhancement level of each tranche of out-
standing notes issued by the Trust and increasing the excess
spread for the Trust. These actions resulted in the addition of
approximately $40 billion of risk-weighted assets for regulatory
capital purposes, which decreased the Firm’s Tier 1 capital ratio
by approximately 40 basis points, at that time, but did not have
a material impact on the Firm’s Consolidated Balance Sheets or
results of operations.
• Washington Mutual Master Trust (“WMMT”): The Firm acquired
an interest in the WMMT as part of the acquisition of the Wash-
ington Mutual banking operations. In 2009, the Firm removed all
remaining credit card receivables originated by Washington Mu-
tual, resulting in the consolidation of the WMMT for accounting
and regulatory capital purposes. As a result, the Firm recorded,
during the second quarter of 2009, additional assets with an ini-
tial fair value of $6.0 billion, additional liabilities with an initial
fair value of $6.1 billion and a pretax loss of approximately $64
million.
Firm-sponsored mortgage and other securitization trusts
The Firm securitizes originated and purchased residential mortgages,
commercial mortgages and other consumer loans (including automo-
bile and student loans) primarily in its RFS and IB businesses. De-
pending on the particular transaction, as well as the respective
business involved, the Firm may act as the servicer of the loans and/or
retain certain beneficial interests in the securitization trusts.
Effective January 1, 2010, the Firm consolidated certain mortgage
securitization trusts (both residential and commercial) and Firm-
sponsored automobile and student loan trusts as a result of the
implementation of the accounting guidance. The consolidation
determination was based on the Firm’s ability to direct the activities
of these VIEs through its servicing responsibilities and duties,
including making decisions related to loan modifications and work-
outs. Additionally, the nature and extent of the Firm’s continuing
economic involvement with these trusts obligates the Firm to ab-
sorb losses and gives the Firm the right to receive benefits from the
VIEs that could potentially be significant.
Prior to January 1, 2010, the Firm accounted for its residential and
commercial mortgage, automobile, and certain student loan securiti-
zations as QSPEs and therefore did not consolidate these entities;
only the Firm’s retained interests in these entities were recorded on its
Consolidated Balance Sheets. In addition, the Firm previously consoli-
dated certain other student loan securitizations in accordance with
the accounting treatment under prior accounting guidance.
The following table presents the total unpaid principal amount of
assets held in JPMorgan Chase–sponsored securitization entities in
which the Firm has continuing involvement, including those that
are consolidated by the Firm and those that are not consolidated by
the Firm. Continuing involvement includes servicing the loans;
holding senior interests or subordinated interests; recourse or
guarantee arrangements; and derivative transactions. In certain
instances, the Firm’s only continuing involvement is servicing the
loans. In the table below, the amount of beneficial interests held by
JPMorgan Chase does not equal the assets held in nonconsolidated
VIEs because of the existence of beneficial interests held by third
parties, which are reflected at their current outstanding par
amounts; and because a portion of the Firm’s retained interests
(trading assets and AFS securities) are reflected at their fair values.
See Securitization activity on pages 255–258 of this Note for fur-
ther information regarding the Firm’s cash flows with and interests
retained in nonconsolidated VIEs.

JPMorgan Chase & Co./2010 Annual Report 247
Firm-sponsored mortgage and other consumer securitization trusts
Principal amount outstanding
JPMorgan Chase interest in securitized assets
in nonconsolidated VIEs(d)(e)(f)(g)(h)
December 31, 2010(a)
(in billions)
Total assets
held by
securitization VIEs
Assets held in
consolidated
securitization VIEs
Assets held in
nonconsolidated
securitization VIEs
with continuing
involvement
Trading
assets
AFS
securities
Other
assets
Total interests
held by
JPMorgan
Chase
Securitization-related
Residential mortgage:
Prime(b) $ 153.1 $ 2.2 $ 143.8 $ 0.7 $ — $ — $ 0.7
Subprime 44.0 1.6 40.7 — — — —
Option ARMs 36.1 0.3 35.8 — — — —
Commercial and other(c) 153.4 — 106.2 2.0 0.9 — 2.9
Student 4.5 4.5 — — — — —
Auto — — — — — — —
Total $ 391.1 $ 8.6 $ 326.5 $ 2.7 $ 0.9 $ — $ 3.6
Principal amount outstanding
JPMorgan Chase interest in securitized assets
in nonconsolidated VIEs(d)(e)(f)(g)(h)
December 31, 2009(a)
(in billions)
Total assets
held by
securitization VIEs
Assets held in
consolidated
securitization VIEs
Assets held in
nonconsolidated
securitization VIEs
with continuing
involvement
Trading
assets
AFS
securities
Other
assets
Total interests
held by
JPMorgan
Chase
Securitization-related
Residential mortgage:
Prime(b) $ 183.3 $ — $ 171.5 $ 0.9 $ 0.2 $ — $ 1.1
Subprime 50.0 — 47.3 — — — —Option ARMs 42.0 — 42.0 — 0.1 — 0.1
Commercial and other(c) 155.3 — 24.8 1.6 0.8 — 2.4
Student 4.8 3.8 1.0 — — 0.1 0.1
Auto 0.2 — 0.2 — — — —Total $ 435.6 $ 3.8 $ 286.8 $ 2.5 $ 1.1 $ 0.1 $ 3.7
(a) Excludes loan sales to U.S. government agencies. See page 257 of this Note for information on the Firm’s loan sales to U.S. government agencies. (b) Includes Alt-A loans. (c) Consists of securities backed by commercial loans (predominantly real estate) and non-mortgage-related consumer receivables purchased from third parties. The Firm
generally does not retain a residual interest in its sponsored commercial mortgage securitization transactions. Includes co-sponsored commercial securitizations and, therefore, includes non–JPMorgan Chase–originated commercial mortgage loans.
(d) Excludes retained servicing (for a discussion of MSRs, see Note 17 on pages 260–263 of this Annual Report) and securities retained from loan sales to U.S. govern-ment agencies.
(e) Excludes senior and subordinated securities of $182 million and $18 million, respectively, at December 31, 2010, and $729 million and $146 million, respectively, at December 31, 2009, which the Firm purchased in connection with IB’s secondary market-making activities.
(f) Includes investments acquired in the secondary market that are predominantly for held-for-investment purposes, of $315 million and $139 million as of December 31, 2010 and 2009, respectively. This comprises $238 million and $91 million of AFS securities, related to commercial and other; and $77 million and $48 million of in-vestments classified as trading assets–debt and equity instruments, including $39 million and $47 million of residential mortgages, and $38 million and $1 million of commercial and other, all respectively, at December 31, 2010 and 2009.
(g) Excludes interest rate and foreign exchange derivatives primarily used to manage the interest rate and foreign exchange risks of the securitization entities. See Note 6 on pages 191–199 of this Annual Report for further information on derivatives.
(h) Includes interests held in re-securitization transactions.

Notes to consolidated financial statements
248 JPMorgan Chase & Co./2010 Annual Report
Residential mortgage The Firm securitizes residential mortgage loans originated by RFS,
as well as residential mortgage loans purchased from third parties
by either RFS or IB. RFS generally retains servicing for all residential
mortgage loans originated or purchased by RFS, and for certain
mortgage loans purchased by IB.
For securitizations serviced by RFS, the Firm has the power to direct
the significant activities of the VIE because it is responsible for
decisions related to loan modifications and workouts. In a limited
number of these securitizations, RFS also retains an interest in the
VIE that could potentially be significant to the VIE. In these in-
stances, the Firm is deemed to be the primary beneficiary. At
December 31, 2010, approximately $2.9 billion of assets and $3.0
billion of liabilities of Firm-sponsored residential mortgage securiti-
zation trusts were consolidated on balance sheet. For Firm-
sponsored securitizations serviced by unrelated third parties, the
Firm does not consolidate the VIE as the power to direct the signifi-
cant activities resides with the third party servicer. At December 31,
2009, RFS did not consolidate any VIEs in accordance with the
accounting treatment under prior accounting rules. RFS held re-
tained interests of approximately $205 million and $537 million as
of December 31, 2010 and 2009, respectively, in nonconsolidated
residential mortgage securitization entities. See pages 257–258 of
this Note for further information on retained interests held in non-
consolidated VIEs; these retained interests are classified as trading
assets or AFS securities.
The Firm’s mortgage loan sales are primarily nonrecourse, thereby
effectively transferring the risk of future credit losses to the pur-
chaser of the mortgage-backed securities issued by the trust. How-
ever, for a limited number of loan sales, the Firm is obligated to
share a portion of the credit risk associated with the sold loans with
the purchaser. See Note 30 on pages 275–280 of this Annual
Report for additional information on loans sold with recourse, as
well as information on indemnification liability for breaches of
representations and warranties. See page 257 of this Note for
further information on loans sold to U.S. government agencies.
IB engages in underwriting and trading activities involving securi-
ties issued by Firm-sponsored securitization trusts. As a result, IB at
times retains senior and/or subordinated interests (including resid-
ual interests) in residential mortgage securitizations upon securiti-
zation, and/or reacquires positions in the secondary market in the
normal course of business. In certain instances, as a result of the
positions retained or reacquired by IB, when considered together
with the servicing arrangements entered into by RFS, the Firm is
deemed to be the primary beneficiary of certain securitization
trusts. At December 31, 2010, $1.2 billion of VIE assets and $702
million of liabilities were consolidated due to IB’s involvement with
such trusts. IB did not consolidate any residential securitization VIEs
at December 31, 2009, in accordance with the accounting treat-
ment under prior accounting rules. IB held approximately $461
million, and $479 million of senior and subordinated interests at
December 31, 2010 and 2009, respectively, in nonconsolidated
residential mortgage securitization entities. This includes approxi-
mately $1 million and $2 million of residual interests at December
31, 2010 and 2009, respectively. See pages 257–258 of this Note
for further information on interests held in nonconsolidated securi-
tizations. These retained interests are accounted for at fair value
and classified as trading assets.
Commercial mortgages and other consumer securitizations IB originates and securitizes commercial mortgage loans, and
engages in underwriting and trading activities involving the securi-
ties issued by securitization trusts. IB may retain unsold senior
and/or subordinated interests in commercial mortgage securitiza-
tions at the time of securitization but, generally, the Firm does not
service commercial loan securitizations. For commercial mortgage
securitizations the power to direct the significant activities of the
VIE generally is held by the servicer or investors in a specified class
of securities (“controlling class”). At December 31, 2010, approxi-
mately $84 million of VIE assets and $82 million of VIE liabilities of
commercial mortgage securitization trusts were consolidated due to
the Firm holding certain subordinated interests that give the Firm
the power to direct the activities of these entities as well as a
significant interest. IB did not consolidate any commercial mort-
gage securitization VIEs at December 31, 2009, in accordance with
the accounting treatment under prior accounting rules. At Decem-
ber 31, 2010 and 2009, the Firm held $2.0 billion and $1.6 billion,
respectively, of retained interests in nonconsolidated commercial
mortgage securitizations. This included approximately zero and $22
million of residual interests as of December 31, 2010 and 2009,
respectively.
The Firm also securitizes automobile and student loans originated by
RFS, and consumer loans (including automobile and student loans)
purchased by IB. The Firm retains servicing responsibilities for all
originated and certain purchased student and automobile loans and
has the power to direct the activities of these VIEs through these
servicing responsibilities. At December 31, 2010, $4.5 billion of
assets and $3.2 billion of liabilities of student loan securitizations
were consolidated due to the combination of retained interests held
by the Firm and servicing responsibilities. Auto loans previously
securitized were repurchased by the Firm during 2010 as these
securitization entities were terminated. As of December 31, 2009,
the Firm held $9 million and $49 million of retained interests in
securitized automobile and student loan securitizations, respectively,
which were not consolidated in accordance with the accounting
treatment under prior accounting rules. These retained interests were
reported in other assets. In addition, at December 31, 2009, the Firm
held interests in other student loans which resulted in $3.8 billion of
other student loans being consolidated on the balance sheet in
accordance with the accounting treatment under prior accounting
rules.
Re-securitizations The Firm engages in re-securitization transactions in which securi-
ties are transferred to a VIE in exchange for new beneficial inter-
ests. Re-securitizations involve the repackaging of securities
previously issued by both agency sponsored (Fannie Mae, Freddie
Mac and Ginnie Mae) and nonagency (private-label) VIEs that are
generally backed by either residential or commercial mortgages. A
re-securitization entity receives principal and interest payments

JPMorgan Chase & Co./2010 Annual Report 249
from the securities held in the entity and passes them to the benefi-
cial interest holders. These entities are not actively managed and
are passive in nature. Re-securitization entities are often estab-
lished to the specifications of the investors. In a re-securitization
entity, the most significant power is in the design of the entity (i.e.,
the decision as to the specific security or securities to be repack-
aged and the terms of the beneficial interests issued). The power
over a re-securitization entity is often considered to be shared
between the sponsor and investor(s) that are significantly involved
in the creation and design of the re-securitization entity. At Decem-
ber 31, 2010, the Firm did not consolidate any agency re-
securitizations, as it did not have the unilateral power to direct the
significant activities of the re-securitization entity. At December 31,
2010, the Firm consolidated $477 million of assets and $230
million of liabilities of private-label re-securitizations, as the Firm
had both the unilateral power to direct the significant activities of,
and retained a significant interest in, these re-securitization entities.
As of December 31, 2009, the Firm did not consolidate any re-
securitization entities (agency or private-label) in accordance with
the accounting treatment under prior accounting rules.
During the years ended December 31, 2010, 2009, and 2008, the
Firm transferred $33.9 billion, $19.1 billion and $16.8 billion,
respectively, of securities to agency re-securitization entities and
$1.3 billion, $4.0 billion and $2.7 billion to private-label re-
securitization entities. At December 31, 2010 and 2009, the Firm
held approximately $3.5 billion and $1.6 billion of both senior and
subordinated interests in nonconsolidated agency re-securitization
entities and $46 million and $220 million of both senior and subor-
dinated interests, in nonconsolidated private-label re-securitization
entities. See pages 257–258 of this Note for further information on
interests held in nonconsolidated securitization VIEs.
Multi-seller conduits
The Firm is an active participant in the asset-backed securities
business, and it helps customers meet their financing needs by
providing access to the commercial paper markets through VIEs
known as multi-seller conduits. Multi-seller conduit entities are
separate bankruptcy remote entities that purchase interests in, and
make loans secured by, pools of receivables and other financial
assets pursuant to agreements with customers of the Firm. The
conduits fund their purchases and loans through the issuance of
highly rated commercial paper to third-party investors. The primary
source of repayment of the commercial paper is the cash flows from
the pools of assets. In most instances, the assets are structured
with deal-specific credit enhancements provided by the customers
(i.e., sellers) to the conduits or other third parties. Deal-specific
credit enhancements are generally structured to cover a multiple of
historical losses expected on the pool of assets, and are typically in
the form of overcollateralization provided by the seller, but also
may include any combination of the following: recourse to the seller
or originator, cash collateral accounts, letters of credit, excess
spread, retention of subordinated interests or third-party guaran-
tees. The deal-specific credit enhancements mitigate the Firm’s
potential losses on its agreements with the conduits.
To ensure timely repayment of the commercial paper, each asset
pool financed by the conduits has a minimum 100% deal-specific
liquidity facility associated with it. Deal-specific liquidity facilities
are the primary source of liquidity support for the conduits and are
typically in the form of asset purchase agreements. They are gener-
ally structured so the liquidity that will be provided by the Firm (as
liquidity provider) will be effected by the Firm purchasing, or lend-
ing against, a pool of nondefaulted, performing assets. In limited
circumstances, the Firm may provide unconditional liquidity.
The conduit’s administrative agent can require the liquidity provider
to perform under its asset purchase agreement with the conduit at
any time. These agreements may cause the liquidity provider, which
is generally the Firm, to purchase an asset from the conduit at an
amount above the asset’s then current fair value – in effect, provid-
ing a guarantee of the asset’s initial value.
The Firm also provides the multi-seller conduit vehicles with program-
wide liquidity facilities in the form of uncommitted short-term revolv-
ing facilities established to handle funding increments too small to be
funded by commercial paper and that can be accessed by the con-
duits only in the event of short-term disruptions in the commercial
paper market.
Because the majority of the deal-specific liquidity facilities will only
fund nondefaulted assets, program-wide credit enhancement is
required to absorb losses on defaulted receivables in excess of losses
absorbed by any deal-specific credit enhancement. Program-wide
credit enhancement may be provided by JPMorgan Chase in the form
of standby letters of credit or by third-party surety bond providers. The
amount of program-wide credit enhancement required varies by
conduit and ranges between 5% and 10% of the applicable commer-
cial paper that is outstanding. The Firm provided $2.0 billion and
$2.4 billion of program-wide credit enhancement at December 31,
2010 and 2009, respectively.
JPMorgan Chase receives fees for structuring multi-seller conduit
transactions and compensation from the multi-seller conduits for its
role as administrative agent, liquidity provider, and provider of
program-wide credit enhancement.
Effective January 1, 2010, the Firm consolidated its Firm-
administered multi-seller conduits, as the Firm has both the power
to direct the significant activities of the conduits and a potentially
significant economic interest in the conduits. The Firm directs the
economic performance of the conduits as administrative agent and
in its role in structuring transactions for the conduits. In these roles,
the Firm makes decisions regarding concentration of asset types
and credit quality of transactions, and is responsible for managing
the commercial paper funding needs of the conduits. The Firm’s
interests that could potentially be significant to the VIEs include the
fees received as administrative agent, liquidity provider and pro-
vider of program-wide credit enhancement, as well as the Firm’s
potential exposure as a result of the liquidity and credit enhance-
ment facilities provided to the conduits.

Notes to consolidated financial statements
250 JPMorgan Chase & Co./2010 Annual Report
December 31, 2010 (in billions) Loans Other assets
Total assets held by Firm-
administered multi-seller conduits
Commercial paper
issued to third parties
Consolidated(a) $ 21.1 $ 0.6 $ 21.7 $ 21.6
(a) The Firm provided certain deal-specific liquidity facilities (primarily asset purchase agreements); program-wide liquidity facilities; and program-wide credit enhancements that were eliminated in consolidation.
Accounting Treatment Prior to January 1, 2010
Prior to January 1, 2010, the Firm had consolidated one of its
multi-seller conduits; all other Firm-administered multi-seller con-
duits were not consolidated in accordance with prior accounting
rules. Under prior accounting rules, the party that absorbed the
majority of the entity’s expected losses, received a majority of the
entity’s residual returns, or both, would consolidate. Each noncon-
solidated multi-seller conduit administered by the Firm at December
31, 2009 had issued Expected Loss Notes (“ELNs”), the holders of
which were committed to absorbing the majority of the expected
loss of each respective conduit. The total amounts of ELNs out-
standing for nonconsolidated conduits at December 31, 2009 was
$96 million.
At December 31, 2009, total assets funded and commercial paper
issued by Firm-sponsored multi-seller conduits were as follows.
December 31, 2009 (in billions) Total
assets funded Commercial paper issued
Consolidated $ 5.1 $ 5.1
Non-consolidated(a) 17.8 17.8
(a) The Firm provided certain deal-specific liquidity facilities (primarily asset purchase agreements) of $24.2 billion. Additionally, the Firm provided program-wide liquidity facilities of $13.0 billion and program-wide credit enhancements of $2.0 billion.
The Firm’s maximum exposure to loss on nonconsolidated Firm-
administered multi-seller conduits was $24.8 billion at December 31,
2009. The maximum exposure to loss, calculated separately for each
multi-seller conduit, included the Firm’s exposure to both deal-specific
liquidity facilities and program wide credit enhancements. For pur-
poses of calculating maximum exposure to loss, Firm-provided pro-
gram-wide credit enhancement was limited to deal-specific liquidity
facilities provided to third parties.
VIEs associated with investor intermediation activities
As a financial intermediary, the Firm creates certain types of VIEs
and also structures transactions, typically using derivatives, with
these VIEs to meet investor needs. The Firm may also provide
liquidity and other support. The risks inherent in the derivative
instruments or liquidity commitments are managed similarly to
other credit, market or liquidity risks to which the Firm is ex-
posed. The principal types of VIEs for which the Firm is engaged
in on behalf of clients are municipal bond vehicles, credit-related
note vehicles and asset swap vehicles.
Municipal bond vehicles
The Firm has created a series of trusts that provide short-term
investors with qualifying tax-exempt investments, and that allow
investors in tax-exempt securities to finance their investments at
short-term tax-exempt rates. In a typical transaction, the vehicle
purchases fixed-rate longer-term highly rated municipal bonds and
funds the purchase by issuing two types of securities: (1) putable
floating-rate certificates and (2) inverse floating-rate residual inter-
ests (“residual interests”). The maturity of each of the putable
floating-rate certificates and the residual interests is equal to the
life of the vehicle, while the maturity of the underlying municipal
bonds is longer. Holders of the putable floating-rate certificates
may “put,” or tender, the certificates if the remarketing agent
cannot successfully remarket the floating-rate certificates to an-
other investor. A liquidity facility conditionally obligates the liquidity
provider to fund the purchase of the tendered floating-rate certifi-
cates. If funded, the liquidity facility would be repaid by the pro-
ceeds from the sale of the underlying municipal bonds upon
termination of the vehicle. In certain transactions, if the proceeds
from the sale of the underlying municipal bonds are not sufficient
to repay the liquidity facility, the liquidity provider has recourse to
the residual interest holders for reimbursement.
The holders of the residual interests in these vehicles could experi-
ence losses if the face amount of the putable floating-rate certifi-
cates exceeds the market value of the municipal bonds upon
termination of the vehicle. Certain vehicles require a smaller initial
investment by the residual interest holders and thus do not result in
excess collateralization. For these vehicles there exists a reim-
bursement obligation which requires the residual interest holders to
post, during the life of the vehicle, additional collateral to the Firm,
as liquidity provider, on a daily basis should the market value of the
municipal bonds decline.
JPMorgan Chase Bank, N.A. often serves as the sole liquidity pro-
vider, and J.P. Morgan Securities LLC as remarketing agent, of the
putable floating-rate certificates. The liquidity provider’s obligation to
perform is conditional and is limited by certain termination events,
which include bankruptcy or failure to pay by the municipal bond
issuer or credit enhancement provider, an event of taxability on the
municipal bonds or the immediate downgrade of the municipal bond
to below investment grade. A downgrade of JPMorgan Chase Bank,
N.A.’s short-term rating does not affect the Firm’s obligation under
the liquidity facility. However, in the event of a downgrade in the
Firm’s credit ratings, holders of the putable floating-rate certificates
supported by those liquidity facility commitments might choose to sell
their instruments, which could increase the likelihood that the liquid-
ity commitments could be drawn. In vehicles in which third-party
investors own the residual interests, in addition to the termination
events, the Firm’s exposure as liquidity provider is further limited by
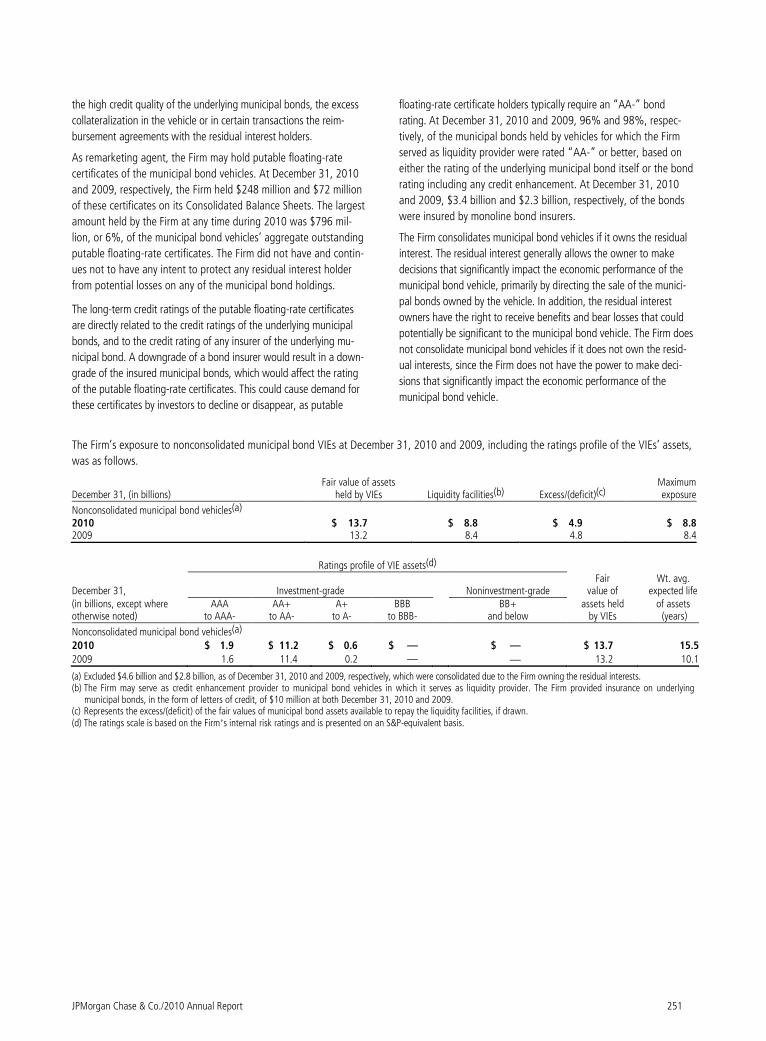
JPMorgan Chase & Co./2010 Annual Report 251
the high credit quality of the underlying municipal bonds, the excess
collateralization in the vehicle or in certain transactions the reim-
bursement agreements with the residual interest holders.
As remarketing agent, the Firm may hold putable floating-rate
certificates of the municipal bond vehicles. At December 31, 2010
and 2009, respectively, the Firm held $248 million and $72 million
of these certificates on its Consolidated Balance Sheets. The largest
amount held by the Firm at any time during 2010 was $796 mil-
lion, or 6%, of the municipal bond vehicles’ aggregate outstanding
putable floating-rate certificates. The Firm did not have and contin-
ues not to have any intent to protect any residual interest holder
from potential losses on any of the municipal bond holdings.
The long-term credit ratings of the putable floating-rate certificates
are directly related to the credit ratings of the underlying municipal
bonds, and to the credit rating of any insurer of the underlying mu-
nicipal bond. A downgrade of a bond insurer would result in a down-
grade of the insured municipal bonds, which would affect the rating
of the putable floating-rate certificates. This could cause demand for
these certificates by investors to decline or disappear, as putable
floating-rate certificate holders typically require an “AA-” bond
rating. At December 31, 2010 and 2009, 96% and 98%, respec-
tively, of the municipal bonds held by vehicles for which the Firm
served as liquidity provider were rated “AA-” or better, based on
either the rating of the underlying municipal bond itself or the bond
rating including any credit enhancement. At December 31, 2010
and 2009, $3.4 billion and $2.3 billion, respectively, of the bonds
were insured by monoline bond insurers.
The Firm consolidates municipal bond vehicles if it owns the residual
interest. The residual interest generally allows the owner to make
decisions that significantly impact the economic performance of the
municipal bond vehicle, primarily by directing the sale of the munici-
pal bonds owned by the vehicle. In addition, the residual interest
owners have the right to receive benefits and bear losses that could
potentially be significant to the municipal bond vehicle. The Firm does
not consolidate municipal bond vehicles if it does not own the resid-
ual interests, since the Firm does not have the power to make deci-
sions that significantly impact the economic performance of the
municipal bond vehicle.
The Firm’s exposure to nonconsolidated municipal bond VIEs at December 31, 2010 and 2009, including the ratings profile of the VIEs’ assets,
was as follows.
December 31, (in billions)
Fair value of assets held by VIEs Liquidity facilities(b) Excess/(deficit)(c)
Maximum exposure
Nonconsolidated municipal bond vehicles(a) 2010 $ 13.7 $ 8.8 $ 4.9 $ 8.8 2009 13.2 8.4 4.8 8.4
Ratings profile of VIE assets(d)
December 31, Investment-grade
Noninvestment-grade Fair
value of Wt. avg. expected life
(in billions, except where otherwise noted)
AAA to AAA-
AA+ to AA-
A+ to A-
BBB to BBB-
BB+ and below
assets held by VIEs
of assets (years)
Nonconsolidated municipal bond vehicles(a)
2010 $ 1.9 $ 11.2 $ 0.6 $ — $ — $ 13.7 15.5
2009 1.6 11.4 0.2 — — 13.2 10.1
(a) Excluded $4.6 billion and $2.8 billion, as of December 31, 2010 and 2009, respectively, which were consolidated due to the Firm owning the residual interests. (b) The Firm may serve as credit enhancement provider to municipal bond vehicles in which it serves as liquidity provider. The Firm provided insurance on underlying
municipal bonds, in the form of letters of credit, of $10 million at both December 31, 2010 and 2009. (c) Represents the excess/(deficit) of the fair values of municipal bond assets available to repay the liquidity facilities, if drawn. (d) The ratings scale is based on the Firm’s internal risk ratings and is presented on an S&P-equivalent basis.

Notes to consolidated financial statements
252 JPMorgan Chase & Co./2010 Annual Report
Credit-related note vehicles
The Firm structures transactions with credit-related note vehicles in
which the VIE purchases highly rated assets, such as asset-backed
securities, and enters into a credit derivative contract with the Firm
to obtain exposure to a referenced credit which the VIE otherwise
does not hold. The VIE then issues credit-linked notes (“CLNs”)
with maturities predominantly ranging from one to 10 years in
order to transfer the risk of the referenced credit to the VIE’s inves-
tors. Clients and investors often prefer using a CLN vehicle since
the CLNs issued by the VIE generally carry a higher credit rating
than such notes would if issued directly by JPMorgan Chase. The
Firm’s exposure to the CLN vehicles is generally limited to its rights
and obligations under the credit derivative contract with the VIE, as
the Firm does not provide any additional contractual financial
support to the VIE. In addition, the Firm has not historically pro-
vided any financial support to the CLN vehicles over and above its
contractual obligations. Accordingly, the Firm typically does not
consolidate the CLN vehicles. As a derivative counterparty in a
credit-related note structure, the Firm has a senior claim on the
collateral of the VIE and reports such derivatives on its balance
sheet at fair value. The collateral purchased by such VIEs is largely
investment-grade, with a significant amount being rated “AAA.”
The Firm divides its credit-related note structures broadly into two
types: static and managed.
In a static credit-related note structure, the CLNs and associated
credit derivative contract either reference a single credit (e.g., a
multi-national corporation), or all or part of a fixed portfolio of
credits. The Firm generally buys protection from the VIE under the
credit derivative. In a managed credit-related note structure, the
CLNs and associated credit derivative generally reference all or part
of an actively managed portfolio of credits. An agreement exists
between a portfolio manager and the VIE that gives the portfolio
manager the ability to substitute each referenced credit in the
portfolio for an alternative credit. By participating in a structure
where a portfolio manager has the ability to substitute credits
within pre-agreed terms, the investors who own the CLNs seek to
reduce the risk that any single credit in the portfolio will default.
The Firm does not act as portfolio manager; its involvement with
the VIE is generally limited to being a derivative counterparty. As a
net buyer of credit protection, in both static and managed credit-
related note structures, the Firm pays a premium to the VIE in
return for the receipt of a payment (up to the notional of the de-
rivative) if one or more of the credits within the portfolio defaults,
or if the losses resulting from the default of reference credits exceed
specified levels. Since each CLN is established to the specifications
of the investors, the investors have the power over the activities of
that VIE that most significantly affect the performance of the CLN.
Accordingly, the Firm does not generally consolidate these credit-
related note entities. Furthermore, the Firm does not have a vari-
able interest that could potentially be significant. As a derivative
counterparty, the Firm has a senior claim on the collateral of the
VIE and reports such derivatives on its balance sheet at fair value.
Substantially all of the assets purchased by such VIEs are invest-
ment-grade.
Exposure to nonconsolidated credit-related note VIEs at December 31, 2010 and 2009, was as follows.
Net derivative Trading Total Par value of collateral
December 31, 2010 (in billions) receivables assets(b) exposure(c) held by VIEs(d)
Credit-related notes(a) Static structure $ 1.0 $ — $ 1.0 $ 9.5Managed structure 2.8 — 2.8 10.7 Total $ 3.8 $ — $ 3.8 $ 20.2
Net derivative Trading Total Par value of collateral
December 31, 2009 (in billions) receivables assets(b) exposure(c) held by VIEs(d)
Credit-related notes(a) Static structure $ 1.9 $ 0.7 $ 2.6 $ 10.8Managed structure 5.0 0.6 5.6 15.2 Total $ 6.9 $ 1.3 $ 8.2 $ 26.0
(a) Excluded collateral with a fair value of $142 million and $855 million at December 31, 2010 and 2009, respectively, which was consolidated, as the Firm, in its role as secondary market-maker, held a majority of the issued credit-related notes of certain vehicles.
(b) Trading assets principally comprise notes issued by VIEs, which from time to time are held as part of the termination of a deal or to support limited market-making. (c) On–balance sheet exposure that includes net derivative receivables and trading assets – debt and equity instruments. (d) The Firm’s maximum exposure arises through the derivatives executed with the VIEs; the exposure varies over time with changes in the fair value of the derivatives. The
Firm relies on the collateral held by the VIEs to pay any amounts due under the derivatives; the vehicles are structured at inception so that the par value of the collateral is expected to be sufficient to pay amounts due under the derivative contracts.
Asset swap vehicles
The Firm structures and executes transactions with asset swap vehi-
cles on behalf of investors. In such transactions, the VIE purchases a
specific asset or assets and then enters into a derivative with the Firm
in order to tailor the interest rate or foreign exchange currency risk, or
both, according to investors’ requirements. Generally, the assets are
held by the VIE to maturity, and the tenor of the derivatives would
match the maturity of the assets. Investors typically invest in the notes
issued by such VIEs in order to obtain exposure to the credit risk of
the specific assets, as well as exposure to foreign exchange and

JPMorgan Chase & Co./2010 Annual Report 253
interest rate risk that is tailored to their specific needs. The derivative
transaction between the Firm and the VIE may include currency swaps
to hedge assets held by the VIE denominated in foreign currency into
the investors’ local currency or interest rate swaps to hedge the
interest rate risk of assets held by the VIE; to add additional interest
rate exposure into the VIE in order to increase the return on the
issued notes; or to convert an interest-bearing asset into a zero-
coupon bond.
The Firm’s exposure to asset swap vehicles is generally limited to its
rights and obligations under the interest rate and/or foreign ex-
change derivative contracts. The Firm historically has not provided
any financial support to the asset swap vehicles over and above its
contractual obligations. The Firm does not generally consolidate
these asset swap vehicles, since the Firm does not have the power
to direct the significant activities of these entities and does not
have a variable interest that could potentially be significant. As a
derivative counterparty, the Firm has a senior claim on the collat-
eral of the VIE and reports such derivatives on its balance sheet at
fair value. Substantially all of the assets purchased by such VIEs are
investment-grade.
Exposure to nonconsolidated asset swap VIEs at December 31, 2010 and 2009, was as follows.
Net derivative Trading Total Par value of
December 31, (in billions) receivables assets(b) exposure(c) collateral held by VIEs (d)
2010(a) $ 0.3 $ — $ 0.3 $ 7.6
2009(a) 0.1 — 0.1 10.2
(a) Excluded the fair value of collateral of zero and $623 million at December 31, 2010 and 2009, respectively, which was consolidated as the Firm, in its role as secondary market-maker, held a majority of the issued notes of certain vehicles.
(b) Trading assets principally comprise notes issued by VIEs, which from time to time are held as part of the termination of a deal or to support limited market-making. (c) On–balance sheet exposure that includes net derivative receivables and trading assets – debt and equity instruments. (d) The Firm’s maximum exposure arises through the derivatives executed with the VIEs; the exposure varies over time with changes in the fair value of the derivatives. The
Firm relies upon the collateral held by the VIEs to pay any amounts due under the derivatives; the vehicles are structured at inception so that the par value of the collat-eral is expected to be sufficient to pay amounts due under the derivative contracts.
VIEs sponsored by third parties
Investment in a third-party credit card securitization trust
The Firm holds two interests in a third-party-sponsored VIE, which
is a credit card securitization trust that owns credit card receivables
issued by a national retailer. The Firm is not the primary beneficiary
of the trust, as the Firm does not have the power to direct the
activities of the VIE that most significantly impact the VIE’s eco-
nomic performance. The first note is structured so that the principal
amount can float up to 47% of the principal amount of the receiv-
ables held by the trust, not to exceed $4.2 billion. The Firm ac-
counts for its investment at fair value within AFS securities. At
December 31, 2010 and 2009, the amortized cost of the note was
$3.0 billion and $3.5 billion, respectively, and the fair value was
$3.1 billion and $3.5 billion, respectively. The Firm accounts for its
other interest with the trust, which is not subject to the limits noted
above, as a loan at amortized cost. This senior loan had an amor-
tized cost and fair value of approximately $1.0 billion at both
December 31, 2010 and 2009. For more information on AFS securi-
ties and loans, see Notes 12 and 14 on pages 214–218 and 220–
238, respectively, of this Annual Report.
VIE used in FRBNY transaction
In conjunction with the Bear Stearns merger, in June 2008, the
Federal Reserve Bank of New York (“FRBNY”) took control,
through an LLC formed for this purpose, of a portfolio of $30.0
billion in assets, based on the value of the portfolio as of March 14,
2008. The assets of the LLC were funded by a $28.85 billion term
loan from the FRBNY and a $1.15 billion subordinated loan from
JPMorgan Chase. The JPMorgan Chase loan is subordinated to the
FRBNY loan and will bear the first $1.15 billion of any losses of the
portfolio. Any remaining assets in the portfolio after repayment of
the FRBNY loan, repayment of the JPMorgan Chase loan and the
expense of the LLC will be for the account of the FRBNY. The extent
to which the FRBNY and JPMorgan Chase loans will be repaid will
depend on the value of the assets in the portfolio and the liquida-
tion strategy directed by the FRBNY. The Firm does not consolidate
the LLC, as it does not have the power to direct the activities of the
VIE that most significantly impact the VIE’s economic performance.
Prior to January 1, 2010, the Firm did not consolidate the LLC in
accordance with the accounting treatment under prior consolida-
tion accounting guidance since it did not have the obligation to
absorb the majority of the vehicle’s expected losses, receive a
majority of the vehicle’s residual returns, or both.
Other VIEs sponsored by third parties
The Firm enters into transactions with VIEs structured by other
parties. These include, for example, acting as a derivative counter-
party, liquidity provider, investor, underwriter, placement agent,
trustee or custodian. These transactions are conducted at arm’s
length, and individual credit decisions are based on the analysis of
the specific VIE, taking into consideration the quality of the underly-
ing assets. Where the Firm does not have the power to direct the
activities of the VIE that most significantly impact the VIE’s eco-
nomic performance, or a variable interest that could potentially be
significant, the Firm records and reports these positions on its
Consolidated Balance Sheets similarly to the way it would record
and report positions in respect of any other third-party transaction.

Notes to consolidated financial statements
254 JPMorgan Chase & Co./2010 Annual Report
Consolidated VIE assets and liabilities
The following table presents information on assets and liabilities related to VIEs that are consolidated by the Firm as of December 31, 2010
and 2009.
Assets Liabilities
December 31, 2010
(in billions)
Trading assets –
debt and equity
instruments Loans Other(a)
Total
assets(b)
Beneficial
interests in
VIE assets(c) Other(d) Total liabilities
VIE program type
Firm-sponsored credit card trusts $ — $ 67.2 $ 1.3 $ 68.5 $ 44.3 $ — $ 44.3
Firm-administered multi-seller conduits — 21.1 0.6 21.7 21.6 0.1 21.7
Mortgage securitization entities 1.8 2.9 — 4.7 2.4 1.6 4.0
Other 8.0 4.4 1.6 14.0 9.3 0.3 9.6
Total $ 9.8 $ 95.6 $ 3.5 $ 108.9 $ 77.6 $ 2.0 $ 79.6
Assets Liabilities
December 31, 2009
(in billions)
Trading assets –
debt and equity
instruments Loans Other(a)
Total
assets(b)
Beneficial
interests in
VIE assets(c) Other(d) Total liabilities
VIE program type
Firm-sponsored credit card trusts(e) $ — $ 6.1 $ 0.8 $ 6.9 $ 3.9 $ — $ 3.9
Firm-administered multi-seller conduits — 2.2 2.9 5.1 4.8 — 4.8
Mortgage securitization entities — — — — — — —Other 6.4 4.7 1.3 12.4 6.5 2.2 8.7
Total $ 6.4 $ 13.0 $ 5.0 $ 24.4 $ 15.2 $ 2.2 $ 7.4
(a) Included assets classified as cash, resale agreements, derivative receivables, available-for-sale, and other assets within the Consolidated Balance Sheets. (b) The assets of the consolidated VIEs included in the program types above are used to settle the liabilities of those entities. The difference between total assets and total
liabilities recognized for consolidated VIEs represents the Firm’s interest in the consolidated VIEs for each program type. (c) The interest-bearing beneficial interest liabilities issued by consolidated VIEs are classified in the line item on the Consolidated Balance Sheets titled, “Beneficial
interests issued by consolidated variable interest entities.” The holders of these beneficial interests do not have recourse to the general credit of JPMorgan Chase. Included in beneficial interests in VIE assets are long-term beneficial interests of $52.6 billion and $10.4 billion at December 31, 2010 and 2009, respectively. The maturities of the long-term beneficial interests as of December 31, 2010, were as follows: $13.9 billion under one year, $29.0 billion between one and five years, and $9.7 billion over five years.
(d) Included liabilities predominately classified as other liabilities as of December 31, 2010, and predominately classified as other liabilities and other borrowed funds as of December 31, 2009.
(e) Includes the receivables and related liabilities of the WMMT. For further discussion, see page 246 of this Note.
Supplemental information on loan securitizations
For loan securitizations in which the Firm is not required to consoli-
date the trust, the Firm records the transfer of the loan receivable
to the trust as a sale when the accounting criteria for a sale are
met. Those criteria are: (1) the transferred financial assets are
legally isolated from the Firm’s creditors; (2) the transferee or
beneficial interest holder can pledge or exchange the transferred
financial assets; and (3) the Firm does not maintain effective control
over the transferred financial assets (e.g., the Firm cannot repur-
chase the transferred assets before their maturity and it does not
have the ability to unilaterally cause the holder to return the trans-
ferred assets).
For loan securitizations accounted for as a sale, the Firm recognizes
a gain or loss based on the difference between the value of pro-
ceeds received (including cash, beneficial interests, or servicing
assets received) and the carrying value of the assets sold. Gains and
losses on securitizations are reported in noninterest revenue. The
value of the proceeds received is determined under the Firm’s
valuation policies described in Note 3 on pages 170–187 of this
Annual Report.
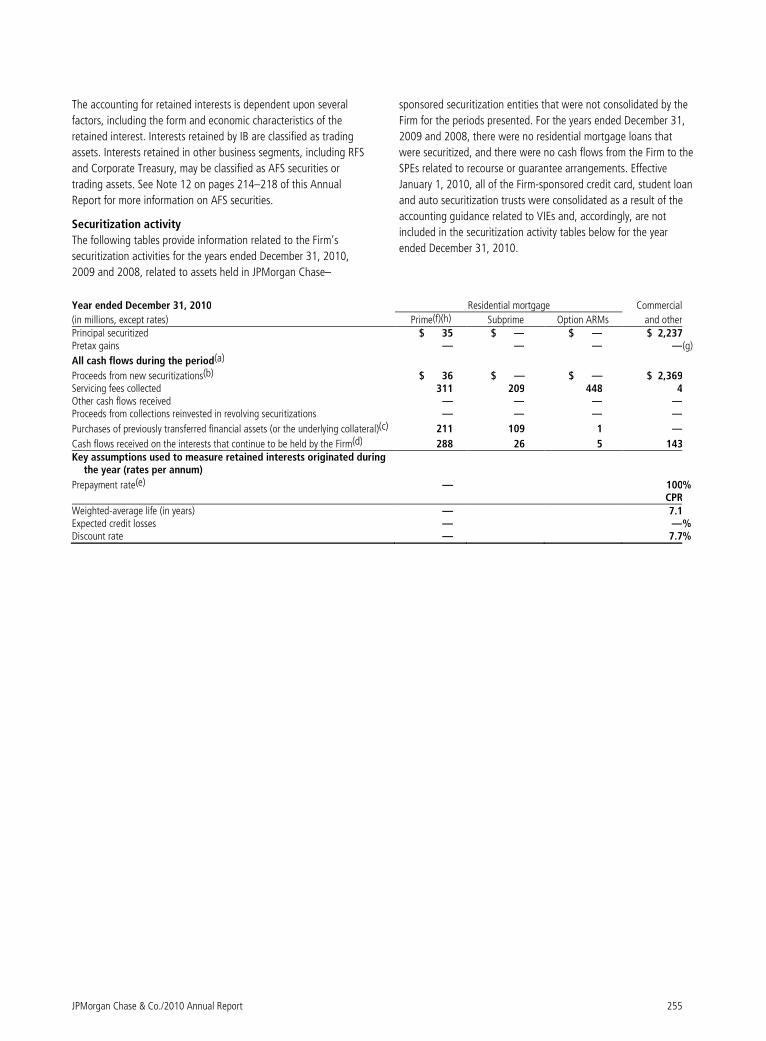
JPMorgan Chase & Co./2010 Annual Report 255
The accounting for retained interests is dependent upon several
factors, including the form and economic characteristics of the
retained interest. Interests retained by IB are classified as trading
assets. Interests retained in other business segments, including RFS
and Corporate Treasury, may be classified as AFS securities or
trading assets. See Note 12 on pages 214–218 of this Annual
Report for more information on AFS securities.
Securitization activity
The following tables provide information related to the Firm’s
securitization activities for the years ended December 31, 2010,
2009 and 2008, related to assets held in JPMorgan Chase–
sponsored securitization entities that were not consolidated by the
Firm for the periods presented. For the years ended December 31,
2009 and 2008, there were no residential mortgage loans that
were securitized, and there were no cash flows from the Firm to the
SPEs related to recourse or guarantee arrangements. Effective
January 1, 2010, all of the Firm-sponsored credit card, student loan
and auto securitization trusts were consolidated as a result of the
accounting guidance related to VIEs and, accordingly, are not
included in the securitization activity tables below for the year
ended December 31, 2010.
Year ended December 31, 2010 Residential mortgage Commercial
(in millions, except rates) Prime(f)(h) Subprime Option ARMs and other Principal securitized $ 35 $ — $ — $ 2,237 Pretax gains — — — —(g)
All cash flows during the period(a)
Proceeds from new securitizations(b) $ 36 $ — $ — $ 2,369 Servicing fees collected 311 209 448 4 Other cash flows received — — — — Proceeds from collections reinvested in revolving securitizations — — — —
Purchases of previously transferred financial assets (or the underlying collateral)(c) 211 109 1 —
Cash flows received on the interests that continue to be held by the Firm(d) 288 26 5 143 Key assumptions used to measure retained interests originated during
the year (rates per annum)
Prepayment rate(e) — 100% CPR Weighted-average life (in years) — 7.1 Expected credit losses — —% Discount rate — 7.7%

Notes to consolidated financial statements
256 JPMorgan Chase & Co./2010 Annual Report
Residential mortgage Year ended December 31, 2009 (in millions, except rates) Credit card Prime(f) Subprime Option ARMs
Commercial and other Student Auto
Principal securitized $ 26,538 $ — $ — $ — $ 500 $ — $ —
Pretax gains 22 — — — —(g) — —
All cash flows during the period(a)
Proceeds from new securitizations(b) $ 26,538 $ — $ — $ — $ 542 $ — $ —Servicing fees collected 1,251 432 185 494 11 3 4Other cash flows received 5,000 7 4 — — — —Proceeds from collections reinvested in revolving
securitizations 161,428 — — — — — —Purchases of previously transferred financial assets
(or the underlying collateral)(c) — 136 — 29 — — 249Cash flows received on the interests that continue to
be held by the Firm(d) 261 475 25 38 109 7 4Key assumptions used to measure retained
interests originated during the year (rates per annum)
Prepayment rate(e) 16.7% 100% PPR CPY Weighted-average life (in years) 0.5 9.0 Expected credit losses 8.9% —% Discount rate 16.0% 10.7%
Residential mortgage Year ended December 31, 2008 (in millions, except rates) Credit card Prime(f) Subprime Option ARMs
Commercial and other Student Auto
Principal securitized $ 21,390 $ — $ — $ — $ 1,023 $ — $ —
Pretax gains 151 — — — —(g) — —
All cash flows during the period(a)
Proceeds from new securitizations(b) $ 21,389 $ — $ — $ — $ 989 $ — $ —Servicing fees collected 1,162 279 146 129 11 4 15Other cash flows received 4,985 23 16 — — — —Proceeds from collections reinvested in revolving
securitizations 152,399 — — — — — —Purchases of previously transferred financial assets
(or the underlying collateral)(c) — 217 13 6 — — 359Cash flows received on the interests that continue to
be held by the Firm(d) 117 267 23 53 455 — 43Key assumptions used to measure retained
interests originated during the year (rates per annum)
Prepayment rate(e) 19.1% 1.5% PPR CPR Weighted-average life (in years) 0.4 2.1 Expected credit losses 4.6% 1.5% Discount rate 12.5% 25.0%
(a) Excludes loan sales for which the Firm did not securitize (including loans sold to U.S. government agencies). (b) Includes $36 million of proceeds from prime mortgage securitizations received as securities in 2010, $2.4 billion, $542 million, and $989 million from new securitiza-
tions of commercial and other in 2010, 2009 and 2008, respectively, and $12.8 billion and $5.5 billion from credit card in 2009 and 2008, respectively. These securities were primarily classified as level 2 of the fair value measurement hierarchy.
(c) Includes cash paid by the Firm to reacquire assets from the off–balance sheet, nonconsolidated entities – for example, servicer clean-up calls. (d) Includes cash flows received on retained interests – including, for example, principal repayments and interest payments. (e) PPR: principal payment rate; CPR: constant prepayment rate; CPY: constant prepayment yield. (f) Includes Alt-A loans and re-securitization transactions. (g) The Firm elected the fair value option for loans pending securitization. The carrying value of these loans accounted for at fair value approximated the proceeds received
from securitization. (h) There were no retained interests held in the residential mortgage securitization completed in 2010.

JPMorgan Chase & Co./2010 Annual Report 257
Loans sold to U.S. government agencies and other third-
party sponsored securitization entities
In addition to the amounts reported in the securitization activity
tables above, the Firm, in the normal course of business, sells
originated and purchased mortgage loans, predominantly to U.S.
government agencies. These loans are sold primarily for the pur-
pose of securitization by U.S. government agencies, which also
provide credit enhancement of the loans through certain guarantee
provisions. In connection with these loan sales, the Firm makes
certain representations and warranties. For additional information
about the Firm’s loan sale- and securitization-related indemnifica-
tions, see Note 30 on pages 275–280 of this Annual Report.
The Firm generally retains the right to service the mortgage loans in
accordance with the respective servicing guidelines and standards,
and records a servicing asset at the time of sale.
The following table summarizes these loan sale activities.
Year ended December 31, (in millions) 2010 2009 2008Carrying value of loans
sold(a)(b) $ 156,615 $ 154,571 $ 132,111Proceeds received from loan
sales as cash 3,887 1,702 7,112Proceeds received from loan sales
as securities(c) 149,786 149,343 121,947Total proceeds received
from loan sales $ 153,673 $ 151,045 $ 129,059Gains on loan sales 212 89 30
(a) Predominantly to U.S. government agencies. (b) MSRs were excluded from the above table. See Note 17 on pages 260–263 of
this Annual Report for further information on originated MSRs. (c) Predominantly includes securities from U.S. government agencies that are
generally sold shortly after receipt.
The Firm has the option to repurchase certain loans sold to U.S.
government agencies (predominantly loans securitized in Ginnie
Mae pools) if they reach certain delinquency triggers. Once the
delinquency trigger has been met, regardless of whether the repur-
chase option has been exercised, the Firm recognizes the loan on
the Consolidated Balance Sheet. The Firm also recognizes an offset-
ting liability in accounts payable and other liabilities for any loans
subject to the repurchase option, but for which the option to repur-
chase has not been exercised. As of December 31, 2010 and 2009,
loans repurchased or with the option to repurchase were $13.0
billion and $10.8 billion, respectively. Additionally, real estate
owned resulting from repurchases of loans sold to U.S. government
agencies was $1.9 billion and $579 million as of December 31,
2010 and 2009, respectively. Substantially all of these loans and
real estate continue to be insured or guaranteed by U.S. govern-
ment agencies and, where applicable, reimbursement is proceeding
normally.
JPMorgan Chase’s interests in Firm-sponsored securitized assets
The following table summarizes the Firm’s interests in Firm-sponsored non-consolidated securitizations, which are carried at fair value on the
Firm’s Consolidated Balance Sheets at December 31, 2010 and 2009. The risk ratings are periodically reassessed as information becomes
available. As of December 31, 2010 and 2009, 66% and 76%, respectively, of the Firm’s retained securitization interests in Firm-sponsored
securitizations were risk-rated “A” or better.
Ratings profile of interests held(b)(c)(d) 2010 2009
December 31, (in billions) Investment-
grade Noninvestment-
grade Retained interests
Investment- grade
Noninvestment- grade
Retainedinterests(e)
Asset types Residential mortgage:
Prime(a) $ 0.2 $ 0.5 $ 0.7 $ 0.7 $ 0.4 $ 1.1 Subprime — — — — — — Option ARMs — — — 0.1 — 0.1
Commercial and other 2.6 0.3 2.9 2.2 0.2 2.4 Total $ 2.8 $ 0.8 $ 3.6 $ 3.0 $ 0.6 $ 3.6
(a) Includes retained interests in Alt-A loans and re-securitization transactions. (b) The ratings scale is presented on an S&P-equivalent basis. (c) Includes $315 million and $139 million of investments acquired in the secondary market, but predominantly held for investment purposes, as of December 31, 2010
and 2009, respectively. Of this amount, $276 million and $108 million is classified as investment-grade as of December 31, 2010 and 2009, respectively. (d) Excludes senior and subordinated securities of $200 million and $875 million at December 31, 2010 and 2009, respectively, which the Firm purchased in connection
with IB’s secondary market-making activities. (e) Excludes $49 million of retained interests in student loans at December 31, 2009.

Notes to consolidated financial statements
258 JPMorgan Chase & Co./2010 Annual Report
The table below outlines the key economic assumptions used to determine the fair value as of December 31, 2010 and 2009, of certain of the
Firm’s retained interests in nonconsolidated Firm-sponsored securitizations, other than MSRs, that are valued using modeling techniques. The
table below also outlines the sensitivities of those fair values to immediate 10% and 20% adverse changes in assumptions used to determine
fair value. For a discussion of MSRs, see Note 17 on pages 260–263 of this Annual Report.
Residential mortgage
December 31, 2010 (in millions, except rates and where otherwise noted) Prime(b) Subprime Option ARMs
Commercial and other(g)
JPMorgan Chase interests in securitized assets(a)(c) $ 708 $ 14 $ 29 $ 2,906 Weighted-average life (in years) 5.5 6.6 7.7 3.3
Weighted-average constant prepayment rate(d) 7.9% 5.7% 8.4% — % CPR CPR CPR CPR
Impact of 10% adverse change $ (15) $ — $ — $ — Impact of 20% adverse change (27) (1) (1) — Weighted-average loss assumption 5.2% 16.2% 30.0% 2.1 %
Impact of 10% adverse change $ (12) $ (1) $ — $ (76 ) Impact of 20% adverse change (21) (2) (1) (151 )
Weighted-average discount rate 11.6% 10.7% 6.3% 16.4 % Impact of 10% adverse change $ (26) $ — $ (1) $ (69 ) Impact of 20% adverse change (47) (1) (2) (134 )
December 31, 2009 Residential mortgage
(in millions, except rates and where otherwise noted) Credit card(e) Prime(b) Subprime Option ARMs
Commercial and other(g) Student Auto
JPMorgan Chase interests in securitized assets(c) $ 4,016 $ 1,143 $ 27 $ 113 $ 2,361 $ 51 $ 9
Weighted-average life (in years) 0.6 8.3 4.3 5.1 3.5 8.1 0.6 Weighted-average constant
prepayment rate(d) 14.3% 4.9% 21.8% 15.7% —% 5.0% 1.4% PPR CPR CPR CPR CPR CPR ABS
Impact of 10% adverse change $ (1) $ (15) $ (2) $ — $ — $ (1) $ — Impact of 20% adverse change (2) (31) (3) (1) — (2) (1)
Weighted-average loss assumption 6.8% 3.2% 2.7% 0.7% 1.4% —%(f) 0.8%
Impact of 10% adverse change $ (1) $ (15) $ (4) $ — $ (41) $ — $ — Impact of 20% adverse change (3) (29) (7) — (100) — —
Weighted-average discount rate 12.0% 11.4% 23.2% 5.4% 12.5% 9.0% 2.8% Impact of 10% adverse change $ (10) $ (41) $ (2) $ (1) $ (72) $ (2) $ — Impact of 20% adverse change (20) (82) (4) (3) (139) (4) —
(a) Effective January 1, 2010, all of the Firm-sponsored credit card, student loan and auto securitization trusts were consolidated as a result of the accounting guidance related to VIEs and, accordingly, are not included in the table above for the year ended December 31, 2010.
(b) Includes retained interests in Alt-A and re-securitization transactions. (c) Includes certain investments acquired in the secondary market but predominantly held for investment purposes. (d) PPR: principal payment rate; ABS: absolute prepayment speed; CPR: constant prepayment rate. (e) Excludes the Firm’s retained senior and subordinated AFS securities in its credit card securitization trusts, which are discussed on pages 245–246 of this Note. (f) Expected losses for student loans securitizations are minimal and are incorporated into other assumptions. (g) The anticipated credit losses, including expected static pool losses, are immaterial for the Firm’s retained interests on commercial and other securitizations that had
occurred during 2010, 2009 and 2008.
The sensitivity analysis in the preceding table is hypothetical. Changes in fair value based on a 10% or 20% variation in assumptions generally
cannot be extrapolated easily, because the relationship of the change in the assumptions to the change in fair value may not be linear. Also, in
the table, the effect that a change in a particular assumption may have on the fair value is calculated without changing any other assumption.
In reality, changes in one factor may result in changes in another, which might counteract or magnify the sensitivities. The above sensitivities
also do not reflect risk management practices the Firm may undertake to mitigate such risks.

JPMorgan Chase & Co./2010 Annual Report 259
Loan delinquencies and net charge-offs
The table below includes information about delinquencies, net charge-offs and components of off–balance sheet securitized financial assets as
of December 31, 2010 and 2009.
As of or for the year ended Credit exposure 90 days past due and still accruing Nonaccrual loans Net loan charge-offs(d)
December 31, (in millions) 2010 2009 2010 2009 2010 2009 2010 2009
Securitized loans(a) Residential mortgage:
Prime mortgage(b) $ 143,764 $ 171,547 $ — $ — $ 33,093 $ 33,838 $ 6,257 $ 9,333Subprime mortgage 40,721 47,261 — — 15,456 19,505 3,598 7,123Option ARMs 35,786 41,983 — — 10,788 10,973 2,305 2,287
Commercial and other 106,245 24,799 — — 5,791 1,244 618 15Credit card NA 84,626 NA 2,385 NA — NA 6,443Student NA 1,008 NA 64 NA — NA 1Automobile NA 218 NA — NA 1 NA 4
Total loans securitized(c) $ 326,516 $ 371,442 $ — $ 2,449 $ 65,128 $ 65,561 $ 12,778 $ 25,206
(a) Total assets held in securitization-related SPEs, including credit card securitization trusts, were $391.1 billion and $545.2 billion at December 31, 2010 and 2009, respectively. The $326.5 billion and $371.4 billion of loans securitized at December 31, 2010 and 2009, respectively, excludes: $56.0 billion and $145.0 billion of securitized loans in which the Firm has no continuing involvement, zero and $16.7 billion of seller’s interests in credit card master trusts, zero and $8.3 billion of cash amounts on deposit and escrow accounts, and $8.6 billion and $3.8 billion of loan securitizations consolidated on the Firm’s Consolidated Balance Sheets at Decem-ber 31, 2010 and 2009, respectively.
(b) Includes Alt-A loans. (c) Includes securitized loans that were previously recorded at fair value and classified as trading assets. (d) Net charge-offs represent losses realized upon liquidation of the assets held by off–balance sheet securitization entities.

Notes to consolidated financial statements
JPMorgan Chase & Co./2010 Annual Report 260
Note 17 – Goodwill and other intangible assets Goodwill and other intangible assets consist of the following.
December 31, (in millions) 2010 2009 2008Goodwill $ 48,854 $ 48,357 $ 48,027Mortgage servicing rights 13,649 15,531 9,403Other intangible assets
Purchased credit card relationships $ 897 $ 1,246 $ 1,649Other credit card–related intangibles 593 691 743Core deposit intangibles 879 1,207 1,597
Other intangibles 1,670 1,477 1,592Total other intangible assets $ 4,039 $ 4,621 $ 5,581
Goodwill
Goodwill is recorded upon completion of a business combination as the
difference between the purchase price and the fair value of the net
assets acquired. Subsequent to initial recognition, goodwill is not
amortized but is tested for impairment during the fourth quarter of each
fiscal year, or more often if events or circumstances, such as adverse
changes in the business climate, indicate there may be impairment.
The goodwill associated with each business combination is allo-
cated to the related reporting units, which are determined based on
how the Firm’s businesses are managed and how they are reviewed
by the Firm’s Operating Committee. The following table presents
goodwill attributed to the business segments.
December 31, (in millions) 2010 2009 2008Investment Bank $ 5,278 $ 4,959 $ 4,765Retail Financial Services 16,813 16,831 16,840Card Services 14,205 14,134 13,977Commercial Banking 2,866 2,868 2,870Treasury & Securities Services 1,680 1,667 1,633Asset Management 7,635 7,521 7,565Corporate/Private Equity 377 377 377Total goodwill $ 48,854 $ 48,357 $ 48,027
The following table presents changes in the carrying amount of goodwill.
Year ended December 31, (in millions) 2010 2009 2008
Beginning balance at January 1,(a): $ 48,357 $ 48,027 $ 45,270 Changes from:
Business combinations 556 271 2,481 Dispositions (19) — (38 )
Other(b) (40) 59 314
Balance at December 31,(a) $ 48,854 $ 48,357 $ 48,027
(a) Reflects gross goodwill balances as the Firm has not recognized any impairment losses to date.
(b) Includes foreign currency translation adjustments and other tax-related adjustments.
The increase in goodwill during 2010 was largely due to the acquisi-
tion of the RBS Sempra Commodities business in IB, and the pur-
chase of a majority interest in Gávea Investimentos, a leading
alternative asset management company in Brazil, by AM. The
increase in goodwill during 2009 was primarily due to final purchase
accounting adjustments related to the Bear Stearns merger and the
acquisition of a commodities business (each primarily allocated to IB),
and foreign currency translation adjustments related to the Firm’s
credit card business, partially offset by accounting adjustments asso-
ciated with the Bear Stearns and Bank One mergers. The increase in
goodwill during 2008 was primarily due to the dissolution of the
Chase Paymentech Solutions joint venture (allocated to Card Ser-
vices), the merger with Bear Stearns, the purchase of an additional
equity interest in Highbridge and tax-related purchase accounting
adjustments associated with the Bank One merger (which were
primarily attributed to IB).
Impairment Testing
Goodwill was not impaired at December 31, 2010 or 2009, nor
was any goodwill written off due to impairment during 2010, 2009
or 2008.
The goodwill impairment test is performed in two steps. In the first
step, the current fair value of each reporting unit is compared with its
carrying value, including goodwill. If the fair value is in excess of the
carrying value (including goodwill), then the reporting unit’s goodwill
is considered not to be impaired. If the fair value is less than the
carrying value (including goodwill), then a second step is performed.
In the second step, the implied current fair value of the reporting
unit’s goodwill is determined by comparing the fair value of the
reporting unit (as determined in step one) to the fair value of the net
assets of the reporting unit, as if the reporting unit were being ac-
quired in a business combination. The resulting implied current fair
value of goodwill is then compared with the carrying value of the
reporting unit’s goodwill. If the carrying value of the goodwill exceeds
its implied current fair value, then an impairment charge is recognized
for the excess. If the carrying value of goodwill is less than its implied
current fair value, then no goodwill impairment is recognized.
The primary method the Firm uses to estimate the fair value of its
reporting units is the income approach. The models project cash flows
for the forecast period and use the perpetuity growth method to
calculate terminal values. These cash flows and terminal values are
then discounted using an appropriate discount rate. Projections of
cash flows are based on the reporting units’ earnings forecasts, which
include the estimated effects of regulatory and legislative changes
(including, but not limited to the Dodd-Frank Act, the CARD Act, and
limitations on non-sufficient funds and overdraft fees). These fore-
casts are also reviewed with the Operating Committee of the Firm.
The Firm’s cost of equity is determined using the Capital Asset Pricing
Model, which is consistent with methodologies and assumptions the
Firm uses when advising clients in third party transactions. The dis-
count rate used for each reporting unit represents an estimate of the
cost of equity capital for that reporting unit and is determined based
on the Firm’s overall cost of equity, as adjusted for the risk character-
istics specific to each reporting unit, (for example, for higher levels of
risk or uncertainty associated with the business or management’s
forecasts and assumptions). To assess the reasonableness of the
discount rates used for each reporting unit management compares
the discount rate to the estimated cost of equity for publicly traded
institutions with similar businesses and risk characteristics. In addi-
tion, the weighted average cost of equity (aggregating the various
reporting units) is compared with the Firms’ overall cost of equity to
ensure reasonableness.
The valuations derived from the discounted cash flow models are
then compared with market-based trading and transaction multi-
ples for relevant competitors. Precise conclusions generally can not
be drawn from these comparisons due to the differences that
naturally exist between the Firm's businesses and competitor insti-

JPMorgan Chase & Co./2010 Annual Report 261
tutions. However, trading and transaction comparables are used as
general indicators to assess the general reasonableness of the
estimated fair values. Management also takes into consideration a
comparison between the aggregate fair value of the Firm’s report-
ing units and JPMorgan Chase’s market capitalization. In evaluat-
ing this comparison, management considers several factors,
including (a) a control premium that would exist in a market trans-
action, (b) factors related to the level of execution risk that would
exist at the firm-wide level that do not exist at the reporting unit
level and (c) short-term market volatility and other factors that do
not directly affect the value of individual reporting units.
While no impairment of goodwill was recognized during 2010,
the Firm’s consumer lending businesses in RFS and CS remain at
elevated risk of goodwill impairment due to their exposure to U.S.
consumer credit risk and the effects of regulatory and legislative
changes. The valuation of these businesses is particularly dependent
upon economic conditions (including new unemployment claims and
home prices), and regulatory and legislative changes that may affect
consumer credit card use. The assumptions used in the discounted
cash flow model were determined using management’s best esti-
mates. The cost of equity reflected the related risk and uncertainty,
and was evaluated in comparison to relevant market peers. Deteriora-
tion in these assumptions could cause the estimated fair values of
these reporting units and their associated goodwill to decline, which
may result in a material impairment charge to earnings in a future
period related to some portion of the associated goodwill.
Mortgage servicing rights
Mortgage servicing rights represent the fair value of future cash
flows for performing specified mortgage servicing activities (pre-
dominantly with respect to residential mortgage) for others. MSRs
are either purchased from third parties or retained upon sale or
securitization of mortgage loans. Servicing activities include collect-
ing principal, interest, and escrow payments from borrowers; mak-
ing tax and insurance payments on behalf of borrowers; monitoring
delinquencies and executing foreclosure proceedings; and account-
ing for and remitting principal and interest payments to the inves-
tors of the mortgage-backed securities.
JPMorgan Chase made the determination to treat its MSRs as one
class of servicing assets based on the availability of market inputs
used to measure its MSR asset at fair value and its treatment of
MSRs as one aggregate pool for risk management purposes. As
permitted by U.S. GAAP, the Firm elected to account for this one
class of servicing assets at fair value. The Firm estimates the fair
value of MSRs using an option-adjusted spread model (“OAS”),
which projects MSR cash flows over multiple interest rate scenarios
in conjunction with the Firm’s prepayment model, and then dis-
counts these cash flows at risk-adjusted rates. The model considers
portfolio characteristics, contractually specified servicing fees,
prepayment assumptions, delinquency rates, late charges, other
ancillary revenue and costs to service, and other economic factors.
The Firm reassesses and periodically adjusts the underlying inputs
and assumptions used in the OAS model to reflect market condi-
tions and assumptions that a market participant would consider in
valuing the MSR asset. During 2010 and 2009, the Firm continued
to refine its proprietary prepayment model based on a number of
market-related factors, including a downward trend in home prices,
general tightening of credit underwriting standards and the associ-
ated impact on refinancing activity. The Firm compares fair value
estimates and assumptions to observable market data where avail-
able, and to recent market activity and actual portfolio experience.
The fair value of MSRs is sensitive to changes in interest rates,
including their effect on prepayment speeds. JPMorgan Chase uses
combinations of derivatives and securities to manage changes in
the fair value of MSRs. The intent is to offset any changes in the fair
value of MSRs with changes in the fair value of the related risk
management instruments. MSRs decrease in value when interest
rates decline. Conversely, securities (such as mortgage-backed
securities), principal-only certificates and certain derivatives (when
the Firm receives fixed-rate interest payments) increase in value
when interest rates decline.
The following table summarizes MSR activity for the years ended
December 31, 2010, 2009 and 2008.
Year ended December 31, (in millions, except where otherwise noted) 2010 2009 2008 Fair value at beginning of period $15,531 $ 9,403 $ 8,632 MSR activity
Originations of MSRs 3,153 3,615 3,061
Purchase of MSRs 26 2 6,755(f)
Disposition of MSRs (407) (10) —
Total net additions 2,772 3,607 9,816 Change in valuation due to inputs
and assumptions(a) (2,268) 5,807 (6,933) Other changes in fair value(b) (2,386) (3,286) (2,112) Total change in fair value of MSRs(c) (4,654) 2,521 (9,045)
Fair value at December 31(d) $13,649 $ 15,531 $ 9,403
Change in unrealized gains/ (losses) included in income related to MSRs held at December 31 $ (2,268) $ 5,807 $ (6,933)
Contractual service fees, late fees and other ancillary fees included in income $ 4,484 $ 4,818 $ 3,353
Third-party mortgage loans serviced at December 31 (in billions) $ 976 $ 1,091 $ 1,185
Servicer advances, net at December 31 (in billions)(e) $ 9.9 $ 7.7 $ 5.2
(a) Represents MSR asset fair value adjustments due to changes in inputs, such as interest rates and volatility, as well as updates to assumptions used in the valuation model. “Total realized/unrealized gains/(losses)” columns in the Changes in level 3 recurring fair value measurements tables in Note 3 on pages 170–187 of this An-nual Report include these amounts.
(b) Includes changes in MSR value due to modeled servicing portfolio runoff (or time decay). “Purchases, issuances, settlements, net” columns in the Changes in level 3 recurring fair value measurements tables in Note 3 on pages 170–187 of this An-nual Report include these amounts.
(c) Includes changes related to commercial real estate of $(1) million, $(4) million and $(4) million for the years ended December 31, 2010, 2009 and 2008, respectively.
(d) Includes $40 million, $41 million and $55 million related to commercial real estate at December 31, 2010, 2009 and 2008, respectively.
(e) Represents amounts the Firm pays as the servicer (e.g., scheduled principal and interest to a trust, taxes and insurance), which will generally be reimbursed within a short period of time after the advance from future cash flows from the trust or the underlying loans. The Firm’s credit risk associated with these advances is minimal because reimbursement of the advances is senior to all cash payments to investors. In addition, the Firm maintains the right to stop payment if the collateral is insuffi-cient to cover the advance.

Notes to consolidated financial statements
JPMorgan Chase & Co./2010 Annual Report 262
(f) Includes MSRs acquired as a result of the Washington Mutual transaction (of which $59 million related to commercial real estate) and the Bear Stearns merger. For further discussion, see Note 2 on pages 166–170 of this Annual Report.
The following table presents the components of mortgage fees and
related income (including the impact of MSR risk management
activities) for the years ended December 31, 2010, 2009 and 2008.
Year ended December 31, (in millions) 2010 2009 2008 RFS mortgage fees and related income
Net production revenue: Production revenue $ 3,440 $ 2,115 $1,150 Repurchase losses (2,912) (1,612) (252)
Net production revenue 528 503 898 Net mortgage servicing revenue Operating revenue:
Loan servicing revenue 4,575 4,942 3,258 Other changes in MSR asset
fair value(a) (2,384) (3,279) (2,052) Total operating revenue 2,191 1,663 1,206
Risk management: Changes in MSR asset fair value due to inputs or
assumptions in model(b) (2,268) 5,804 (6,849) Derivative valuation adjust- ments and other 3,404 (4,176) 8,366
Total risk management 1,136 1,628 1,517 Total RFS net mortgage
servicing revenue 3,327 3,291 2,723 All other(c) 15 (116) (154) Mortgage fees and related
income $ 3,870 $ 3,678 $ 3,467 (a) Includes changes in the MSR value due to modeled servicing portfolio runoff
(or time decay). “Purchases, issuances, settlements, net” columns in the Changes in level 3 recurring fair value measurements tables in Note 3 on pages 170–187 of this Annual Report include these amounts.
(b) Represents MSR asset fair value adjustments due to changes in inputs, such as interest rates and volatility, as well as updates to assumptions used in the valuation model. “Total realized/unrealized gains/(losses)” columns in the
Changes in level 3 recurring fair value measurements tables in Note 3 on pages 170–187 of this Annual Report include these amounts.
(c) Primarily represents risk management activities performed by the Chief Investment Office (“CIO”) in the Corporate sector.
The table below outlines the key economic assumptions used to
determine the fair value of the Firm’s MSRs at December 31, 2010
and 2009; and it outlines the sensitivities of those fair values to
immediate adverse changes in those assumptions, as defined
below.
Year ended December 31, (in millions, except rates) 2010 2009 Weighted-average prepayment speed
assumption (CPR) 11.29% 11.37% Impact on fair value of 10% adverse change $ (809) $ (896) Impact on fair value of 20% adverse change (1,568) (1,731)
Weighted-average option adjusted spread 3.94% 4.63% Impact on fair value of 100 basis points
adverse change $ (578) $ (641) Impact on fair value of 200 basis points
adverse change (1,109) (1,232)
CPR: Constant prepayment rate.
The sensitivity analysis in the preceding table is hypothetical and
should be used with caution. Changes in fair value based on variation
in assumptions generally cannot be easily extrapolated, because the
relationship of the change in the assumptions to the change in fair
value may not be linear. Also, in this table, the effect that a change in
a particular assumption may have on the fair value is calculated
without changing any other assumption. In reality, changes in one
factor may result in changes in another, which might magnify or
counteract the sensitivities.
Other intangible assets
Other intangible assets are recorded at their fair value upon completion of a business combination or certain other transactions, and generally
represent the value of customer relationships or arrangements. Subsequently, the Firm’s intangible assets with finite lives, including core deposit
intangibles, purchased credit card relationships, and other intangible assets, are amortized over their useful lives in a manner that best reflects the eco-
nomic benefits of the intangible asset. The decrease in other intangible assets during 2010 was predominantly due to amortization, partially offset by an
increase resulting from the aforementioned Gávea Investimentos transaction.
The components of credit card relationships, core deposits and other intangible assets were as follows.
2010 2009
Gross Accumulated
Net carrying Gross Accumulated
Net carrying
December 31, (in millions) amount amortization value amount amortization value
Purchased credit card relationships $ 5,789 $ 4,892 $ 897 $ 5,783 $ 4,537 $ 1,246
Other credit card–related intangibles 907 314 593 894 203 691
Core deposit intangibles 4,280 3,401 879 4,280 3,073 1,207
Other intangibles 2,515 845 1,670 2,200 723 1,477

JPMorgan Chase & Co./2010 Annual Report 263
Amortization expense
Intangible assets of approximately $600 million, consisting primarily of asset management advisory contracts, were determined to have an indefinite life
and are not amortized.
The following table presents amortization expense related to credit card relationships, core deposits and all other intangible assets.
Year ended December 31, (in millions) 2010 2009 2008
Purchased credit card relationships $ 355 $ 421 $ 625
All other intangibles:
Other credit card–related intangibles 111 94 33
Core deposit intangibles 328 390 469
Other intangibles 142 145 136
Total amortization expense $ 936 $ 1,050 $ 1,263
Future amortization expense
The following table presents estimated future amortization expense related to credit card relationships, core deposits and all other intangible
assets at December 31, 2010.
Year ended December 31, (in millions) Purchased credit card relationships
Other credit card-related intangibles
Core deposit intangibles
All other intangible assets Total
2011 $ 294 $ 103 $ 284 $ 116 $ 797 2012 254 106 240 111 711 2013 213 103 195 108 619 2014 109 102 100 94 405 2015 23 95 25 76 219
Impairment testing
The Firm’s intangible assets are tested for impairment if events or
changes in circumstances indicate that the asset might be impaired,
and, for intangible assets with indefinite lives, on an annual basis.
The impairment test for a finite-lived intangible asset compares the
undiscounted cash flows associated with the use or disposition of
the intangible asset to its carrying value. If the sum of the undis-
counted cash flows exceeds its carrying value, then no impairment
charge is recorded. If the sum of the undiscounted cash flows is less
than its carrying value, then an impairment charge is recognized to
the extent the carrying amount of the asset exceeds its fair value.
The impairment test for indefinite-lived intangible assets compares
the fair value of the intangible asset to its carrying amount. If the
carrying value exceeds the fair value, then an impairment charge is
recognized for the difference.
Note 18 – Premises and equipment Premises and equipment, including leasehold improvements, are
carried at cost less accumulated depreciation and amortization.
JPMorgan Chase computes depreciation using the straight-line
method over the estimated useful life of an asset. For leasehold
improvements, the Firm uses the straight-line method computed
over the lesser of the remaining term of the leased facility or the
estimated useful life of the leased asset. JPMorgan Chase has
recorded immaterial asset retirement obligations related to asbes-
tos remediation in those cases where it has sufficient information to
estimate the obligations’ fair value.
JPMorgan Chase capitalizes certain costs associated with the
acquisition or development of internal-use software. Once the
software is ready for its intended use, these costs are amortized on
a straight-line basis over the software’s expected useful life and
reviewed for impairment on an ongoing basis.
Note 19 – Deposits
At December 31, 2010 and 2009, noninterest-bearing and interest-
bearing deposits were as follows.
December 31, (in millions) 2010 2009
U.S. offices
Noninterest-bearing $ 228,555 $ 204,003
Interest-bearing:
Demand(a) 33,368 15,964
Savings(b) 334,632 297,949
Time (included $2,733 and $1,463
at fair value at December 31,
2010 and 2009, respectively)(c) 87,237 125,191
Total interest-bearing deposits 455,237 439,104
Total deposits in U.S. offices 683,792 643,107
Non-U.S. offices
Noninterest-bearing 10,917 8,082
Interest-bearing:
Demand 174,417 186,885
Savings 607 661
Time (included $1,636 and $2,992
at fair value at December 31,
2010 and 2009, respectively)(c) 60,636 99,632
Total interest-bearing deposits 235,660 287,178
Total deposits in non-U.S. offices 246,577 295,260
Total deposits $ 930,369 $ 938,367
(a) 2010 and 2009 includes Negotiable Order of Withdrawal (“ NOW” ) accounts. 2010 includes certain trust accounts.
(b) Includes Money Market Deposit Accounts (“ MMDAs” ). (c) See Note 4 on pages 187–189 of this Annual Report for further information
on structured notes classified as deposits for which the fair value option has been elected.

Notes to consolidated financial statements
JPMorgan Chase & Co./2010 Annual Report 264
At December 31, 2010 and 2009, time deposits in denominations
of $100,000 or more were as follows.
December 31, (in millions) 2010 2009U.S. $ 59,653 $ 90,552Non-U.S. 44,544 77,887Total $ 104,197 $ 168,439
At December 31, 2010, the maturities of interest-bearing time
deposits were as follows.
December 31, 2010 (in millions) U.S. Non-U.S. Total 2011 $ 71,930 $ 60,043 $ 131,973 2012 7,382 287 7,669 2013 4,281 153 4,434 2014 1,432 22 1,454 2015 2,074 — 2,074 After 5 years 138 131 269 Total $ 87,237 $ 60,636 $ 147,873
On November 21, 2008, the FDIC released final rules on the FDIC
Temporary Liquidity Guarantee Program (the “TLG Program”). One
component of this program, the Transaction Account Guarantee
Program (the “TAG Program”), provided unlimited deposit insur-
ance through December 31, 2009, on certain noninterest-bearing
transaction accounts at FDIC-insured participating institutions. The
Firm elected to participate in the TLG Program and, as a result, was
required to pay additional insurance premiums to the FDIC in an
amount equal to an annualized 10 basis points on balances in
noninterest-bearing transaction accounts that exceeded the
$250,000 FDIC deposit insurance limits. The expiration date of the
program was extended to December 31, 2010, to provide contin-
ued support to those institutions most affected by the financial
crisis and to enable the program to be phased-out in an orderly
manner. Beginning January 1, 2010, the Firm no longer partici-
pated in the TAG Program. As a result, funds held in noninterest-
bearing transaction accounts after December 31, 2009, were no
longer guaranteed in full. Instead, they are insured up to $250,000
under the FDIC’s general deposit rules.
Note 20 – Other borrowed funds
The following table details the components of other borrowed funds.
December 31, (in millions) 2010 2009
Advances from Federal Home Loan Banks(a) $ 25,234 $ 27,847 Other 32,075 27,893
Total(b)(c) $ 57,309 $ 55,740
(a) Advances from the FHLBs of $11.4 billion, $1.5 billion, $7.3 billion, $1.0 billion and $3.0 billion matures in each of the 12-month periods ending De-cember 31, 2011, 2012, 2013, 2014, and 2015, respectively, and $928 mil-lion matures after December 31, 2015.
(b) Includes other borrowed funds of $9.9 billion and $5.6 billion accounted for at fair value at December 31, 2010 and 2009, respectively. See Note 3 on pages 170–187 of this Annual Report for further information.
(c) Includes other borrowed funds of $37.8 billion and $30.4 billion secured by assets totaling $95.3 billion and $144.1 billion at December 31, 2010 and 2009, respectively.
As of December 31, 2010 and 2009, JPMorgan Chase had no
significant lines of credit for general corporate purposes.
Note 21 – Accounts payable and other liabilities
The following table details the components of accounts payable
and other liabilities.
December 31, (in millions) 2010 2009
Brokerage payables(a) $ 95,359 $ 92,848Accounts payable and other
liabilities(b) 74,971 69,848Total $ 170,330 $ 162,696
(a) Includes payables to customers, brokers, dealers and clearing organizations, and securities fails.
(b) Includes $236 million and $357 million accounted for at fair value at Decem-ber 31, 2010 and 2009, respectively.

JPMorgan Chase & Co./2010 Annual Report 265
Note 22 – Long-term debt
JPMorgan Chase issues long-term debt denominated in various currencies, although predominantly U.S. dollars, with both fixed and variable
interest rates. Included in senior and subordinated debt below are various equity-linked or other indexed instruments, which the Firm has
elected to measure at fair value. These hybrid securities are classified in the line item of the host contract on the Consolidated Balance Sheets.
Changes in fair value are recorded in principal transactions revenue in the Consolidated Statements of Income. The following table is a sum-
mary of long-term debt carrying values (including unamortized original issue discount, valuation adjustments and fair value adjustments, where
applicable) by remaining contractual maturity as of December 31, 2010.
By remaining maturity at 2010 December 31, 2010 Under After 2009 (in millions, except rates) 1 year 1–5 years 5 years Total Total Parent company
Senior debt: Fixed rate(a) $ 20,384 $ 47,031 $ 31,372 $ 98,787 $ 93,729
Variable rate(b) 15,648 37,119 6,260 59,027 73,335
Interest rates(c) 0.36–6.00% 0.31–7.00% 0.24–7.25% 0.24–7.25% 0.22–7.50% Subordinated debt: Fixed rate $ 2,865 $ 9,649 $ 9,486 $ 22,000 $ 24,851 Variable rate — 1,987 9 1,996 1,838
Interest rates(c) 5.90–6.75% 1.37–6.63% 2.16–8.53% 1.37–8.53% 1.14–10.00% Subtotal $ 38,897 $ 95,786 $ 47,127 $ 181,810 $ 193,753 Subsidiaries Senior debt: Fixed rate $ 546 $ 1,782 $ 2,900 $ 5,228 $ 3,310 Variable rate 6,435 17,199 6,911 30,545 39,835
Interest rates(c) 0.26–2.00% 0.21–3.75% 0.32–14.21% 0.21–14.21% 0.16–14.21%
Subordinated debt: Fixed rate $ — $ — $ 8,605 $ 8,605 $ 8,655 Variable rate — — 1,150 1,150 1,150
Interest rates(c) —% —% 0.63–8.25% 0.63–8.25% 0.58–8.25% Subtotal $ 6,981 $ 18,981 $ 19,566 $ 45,528 $ 52,950 Junior subordinated debt: Fixed rate $ — $ — $ 15,249 $ 15,249 $ 16,349 Variable rate — — 5,082 5,082 3,266
Interest rates(c) —% —% 0.79–8.75% 0.79–8.75% 0.78–8.75% Subtotal $ — $ — $ 20,331 $ 20,331 $ 19,615
Total long-term debt(d)(e)(f) $ 45,878 $ 114,767 $ 87,024 $ 247,669(h)(i) $ 266,318
Long-term beneficial interests: Fixed rate $ 3,095 $ 4,328 $ 2,372 $ 9,795 $ 1,034 Variable rate 10,798 24,691 7,270 42,759 9,404 Interest rates 0.28–7.00% 0.25–11.00% 0.05–7.47% 0.05–11.00% 0.25–7.13%
Total long-term beneficial interests(g) $ 13,893 $ 29,019 $ 9,642 $ 52,554 $ 10,438
(a) Included $18.5 billion and $21.6 billion as of December 31, 2010 and 2009, respectively, guaranteed by the FDIC under the TLG Program. (b) Included $17.9 billion and $19.3 billion as of December 31, 2010 and 2009, respectively, guaranteed by the FDIC under the TLG Program. (c) The interest rates shown are the range of contractual rates in effect at year-end, including non-U.S. dollar fixed- and variable-rate issuances, which excludes the effects
of the associated derivative instruments used in hedge accounting relationships, if applicable. The use of these derivative instruments modifies the Firm’s exposure to the contractual interest rates disclosed in the table above. Including the effects of the hedge accounting derivatives, the range of modified rates in effect at December 31, 2010, for total long-term debt was (0.12)% to 14.21%, versus the contractual range of 0.21% to 14.21% presented in the table above. The interest rate ranges shown exclude structured notes accounted for at fair value.
(d) Included long-term debt of $8.3 billion and $8.1 billion secured by assets totaling $11.7 billion and $11.4 billion at December 31, 2010 and 2009, respectively. Ex-cludes amounts related to hybrid instruments.
(e) Included $38.8 billion and $49.0 billion of outstanding structured notes accounted for at fair value at December 31, 2010 and 2009, respectively. (f) Included $879 million and $3.4 billion of outstanding zero-coupon notes at December 31, 2010 and 2009, respectively. The aggregate principal amount of these notes
at their respective maturities was $2.7 billion and $6.6 billion, respectively. (g) Included on the Consolidated Balance Sheets in beneficial interests issued by consolidated VIEs. Also included $1.5 billion and $1.4 billion of outstanding structured
notes accounted for at fair value at December 31, 2010 and 2009, respectively. Excluded short-term commercial paper and other short-term beneficial interests of $25.1 billion and $4.8 billion at December 31, 2010 and 2009, respectively.
(h) At December 31, 2010, long-term debt aggregating $35.6 billion was redeemable at the option of JPMorgan Chase, in whole or in part, prior to maturity, based on the terms specified in the respective notes.
(i) The aggregate carrying values of debt that matures in each of the five years subsequent to 2010 is $45.9 billion in 2011, $51.9 billion in 2012, $20.4 billion in 2013, $23.5 billion in 2014 and $18.9 billion in 2015.
The weighted-average contractual interest rates for total long-term
debt excluding structured notes accounted for at fair value were
3.78% and 3.52% as of December 31, 2010 and 2009, respectively.
In order to modify exposure to interest rate and currency exchange rate
movements, JPMorgan Chase utilizes derivative instruments, primarily
interest rate and cross-currency interest rate swaps, in conjunction with
some of its debt issues. The use of these instruments modifies the
Firm’s interest expense on the associated debt. The modified weighted-
average interest rates for total long-term debt, including the effects of
related derivative instruments, were 2.52% and 1.86% as of Decem-
ber 31, 2010 and 2009, respectively.
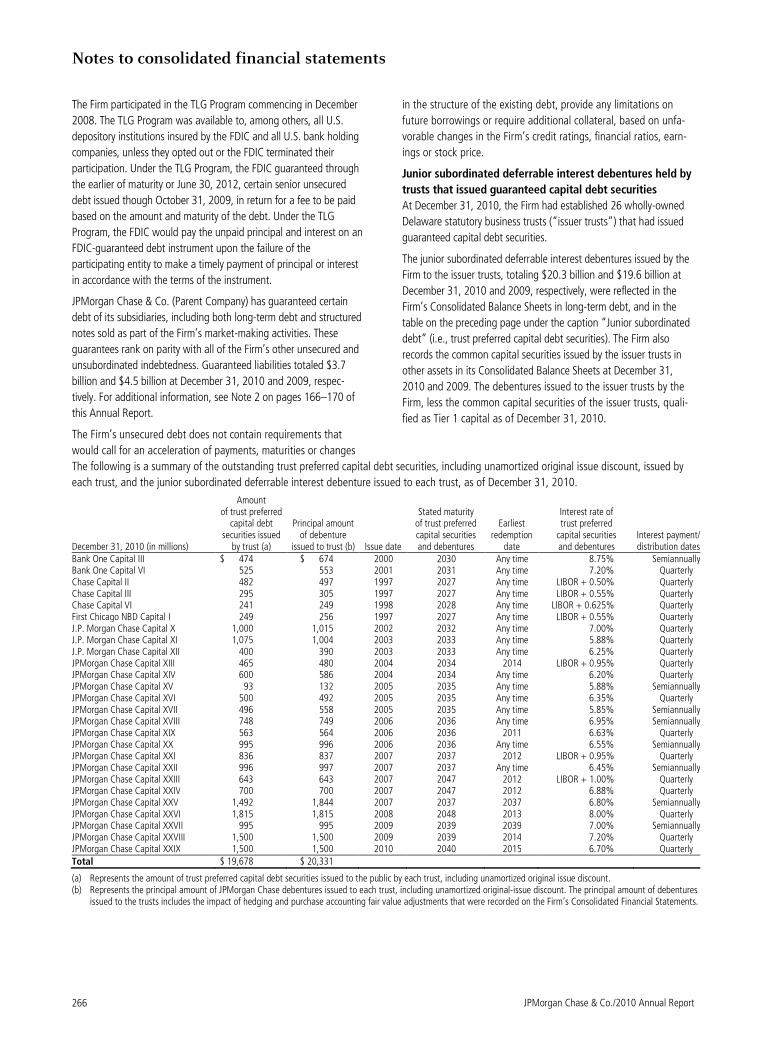
Notes to consolidated financial statements
JPMorgan Chase & Co./2010 Annual Report 266
The Firm participated in the TLG Program commencing in December
2008. The TLG Program was available to, among others, all U.S.
depository institutions insured by the FDIC and all U.S. bank holding
companies, unless they opted out or the FDIC terminated their
participation. Under the TLG Program, the FDIC guaranteed through
the earlier of maturity or June 30, 2012, certain senior unsecured
debt issued though October 31, 2009, in return for a fee to be paid
based on the amount and maturity of the debt. Under the TLG
Program, the FDIC would pay the unpaid principal and interest on an
FDIC-guaranteed debt instrument upon the failure of the
participating entity to make a timely payment of principal or interest
in accordance with the terms of the instrument.
JPMorgan Chase & Co. (Parent Company) has guaranteed certain
debt of its subsidiaries, including both long-term debt and structured
notes sold as part of the Firm’s market-making activities. These
guarantees rank on parity with all of the Firm’s other unsecured and
unsubordinated indebtedness. Guaranteed liabilities totaled $3.7
billion and $4.5 billion at December 31, 2010 and 2009, respec-
tively. For additional information, see Note 2 on pages 166–170 of
this Annual Report.
The Firm’s unsecured debt does not contain requirements that
would call for an acceleration of payments, maturities or changes
in the structure of the existing debt, provide any limitations on
future borrowings or require additional collateral, based on unfa-
vorable changes in the Firm’s credit ratings, financial ratios, earn-
ings or stock price.
Junior subordinated deferrable interest debentures held by
trusts that issued guaranteed capital debt securities
At December 31, 2010, the Firm had established 26 wholly-owned
Delaware statutory business trusts (“issuer trusts”) that had issued
guaranteed capital debt securities.
The junior subordinated deferrable interest debentures issued by the
Firm to the issuer trusts, totaling $20.3 billion and $19.6 billion at
December 31, 2010 and 2009, respectively, were reflected in the
Firm’s Consolidated Balance Sheets in long-term debt, and in the
table on the preceding page under the caption “Junior subordinated
debt” (i.e., trust preferred capital debt securities). The Firm also
records the common capital securities issued by the issuer trusts in
other assets in its Consolidated Balance Sheets at December 31,
2010 and 2009. The debentures issued to the issuer trusts by the
Firm, less the common capital securities of the issuer trusts, quali-
fied as Tier 1 capital as of December 31, 2010.
The following is a summary of the outstanding trust preferred capital debt securities, including unamortized original issue discount, issued by
each trust, and the junior subordinated deferrable interest debenture issued to each trust, as of December 31, 2010.
December 31, 2010 (in millions)
Amount of trust preferred
capital debt securities issued
by trust (a)
Principal amount of debenture
issued to trust (b) Issue date
Stated maturity of trust preferred capital securities and debentures
Earliest redemption
date
Interest rate of trust preferred
capital securities and debentures
Interest payment/ distribution dates
Bank One Capital III $ 474 $ 674 2000 2030 Any time 8.75% Semiannually Bank One Capital VI 525 553 2001 2031 Any time 7.20% Quarterly Chase Capital II 482 497 1997 2027 Any time LIBOR + 0.50% Quarterly Chase Capital III 295 305 1997 2027 Any time LIBOR + 0.55% Quarterly Chase Capital VI 241 249 1998 2028 Any time LIBOR + 0.625% Quarterly First Chicago NBD Capital I 249 256 1997 2027 Any time LIBOR + 0.55% Quarterly J.P. Morgan Chase Capital X 1,000 1,015 2002 2032 Any time 7.00% Quarterly J.P. Morgan Chase Capital XI 1,075 1,004 2003 2033 Any time 5.88% Quarterly J.P. Morgan Chase Capital XII 400 390 2003 2033 Any time 6.25% Quarterly JPMorgan Chase Capital XIII 465 480 2004 2034 2014 LIBOR + 0.95% Quarterly JPMorgan Chase Capital XIV 600 586 2004 2034 Any time 6.20% Quarterly JPMorgan Chase Capital XV 93 132 2005 2035 Any time 5.88% Semiannually JPMorgan Chase Capital XVI 500 492 2005 2035 Any time 6.35% Quarterly JPMorgan Chase Capital XVII 496 558 2005 2035 Any time 5.85% Semiannually JPMorgan Chase Capital XVIII 748 749 2006 2036 Any time 6.95% Semiannually JPMorgan Chase Capital XIX 563 564 2006 2036 2011 6.63% Quarterly JPMorgan Chase Capital XX 995 996 2006 2036 Any time 6.55% Semiannually JPMorgan Chase Capital XXI 836 837 2007 2037 2012 LIBOR + 0.95% Quarterly JPMorgan Chase Capital XXII 996 997 2007 2037 Any time 6.45% Semiannually JPMorgan Chase Capital XXIII 643 643 2007 2047 2012 LIBOR + 1.00% Quarterly JPMorgan Chase Capital XXIV 700 700 2007 2047 2012 6.88% Quarterly JPMorgan Chase Capital XXV 1,492 1,844 2007 2037 2037 6.80% Semiannually JPMorgan Chase Capital XXVI 1,815 1,815 2008 2048 2013 8.00% Quarterly JPMorgan Chase Capital XXVII 995 995 2009 2039 2039 7.00% Semiannually JPMorgan Chase Capital XXVIII 1,500 1,500 2009 2039 2014 7.20% Quarterly JPMorgan Chase Capital XXIX 1,500 1,500 2010 2040 2015 6.70% Quarterly Total $ 19,678 $ 20,331
(a) Represents the amount of trust preferred capital debt securities issued to the public by each trust, including unamortized original issue discount. (b) Represents the principal amount of JPMorgan Chase debentures issued to each trust, including unamortized original-issue discount. The principal amount of debentures
issued to the trusts includes the impact of hedging and purchase accounting fair value adjustments that were recorded on the Firm’s Consolidated Financial Statements.

JPMorgan Chase & Co./2010 Annual Report 267
Note 23 – Preferred stock
At December 31, 2010 and 2009, JPMorgan Chase was author-
ized to issue 200 million shares of preferred stock, in one or more
series, with a par value of $1 per share.
In the event of a liquidation or dissolution of the Firm, JPMorgan
Chase’s preferred stock then outstanding takes precedence over
the Firm’s common stock for the payment of dividends and the
distribution of assets.
Generally, dividends on shares of each outstanding series of
preferred stock are payable quarterly, except for the Fixed-to-
Floating Rate Non-Cumulative Perpetual Preferred Stock, Series I
(“Series I”), which is payable semiannually as discussed below.
On April 23, 2008, the Firm issued 600,000 shares of Series I
preferred stock, for total proceeds of $6.0 billion. Dividends on
Series I shares are payable semiannually at a fixed annual divi-
dend rate of 7.90% through April 2018, and then become pay-
able quarterly at an annual dividend rate of three-month LIBOR
plus 3.47%.
On July 15, 2008, each series of Bear Stearns preferred stock
then issued and outstanding was exchanged into a series of
JPMorgan Chase preferred stock with substantially identical terms
(6.15% Cumulative Preferred Stock, Series E (“Series E”); 5.72%
Cumulative Preferred Stock, Series F (“Series F”); and 5.49%
Cumulative Preferred Stock, Series G (“Series G”)). As a result of
the exchange, these series ranked equally with other series of the
Firm’s preferred stock. On August 20, 2010, the Firm redeemed
all of the outstanding shares of its Series E, Series F and Series G
preferred stock at their stated redemption value.
On August 21, 2008, the Firm issued 180,000 shares of 8.625%
Non-Cumulative Preferred Stock, Series J (“Series J”), for total
proceeds of $1.8 billion.
On October 28, 2008, pursuant to the U.S. Treasury’s Capital
Purchase Program, the Firm issued to the U.S. Treasury, for total
proceeds of $25.0 billion, (i) 2.5 million shares of the Firm’s Fixed
Rate Cumulative Perpetual Preferred Stock, Series K, par value $1
per share and liquidation preference $10,000 per share (the
“Series K Preferred Stock”); and (ii) a warrant to purchase up to
88,401,697 shares of the Firm’s common stock at an exercise
price of $42.42 per share (the “Warrant”), subject to certain
antidilution and other adjustments. The Series K Preferred Stock
was nonvoting, qualified as Tier 1 capital and ranked equally with
other series of the Firm’s preferred stock in terms of dividend
payments and upon liquidation of the Firm. On June 17, 2009,
the Firm redeemed all outstanding shares of the Series K Pre-
ferred Stock and repaid the full $25.0 billion principal amount
together with accrued but unpaid dividends. See Note 24 on
page 268 for further discussion regarding the Warrant.
The following is a summary of JPMorgan Chase’s preferred stock outstanding as of December 31, 2010 and 2009.
Share value and
redemption Shares(b) Carrying value (in millions) Earliest
Contractual rate in effect at December 31,
December 31, price per share(a) 2010 2009 2010 2009 redemption date 2010 Cumulative Preferred Stock,
Series E $ 200 — 818,113 $ — $ 164 — NA Cumulative Preferred Stock,
Series F 200 — 428,825 — 86 — NA Cumulative Preferred Stock,
Series G 200 — 511,169 — 102 — NA Fixed-to-Floating Rate
Non-Cumulative Perpetual Preferred Stock, Series I 10,000 600,000 600,000 6,000 6,000 4/30/2018 7.90 %
Non-Cumulative Perpetual Preferred Stock, Series J 10,000 180,000 180,000 1,800 1,800 9/1/2013 8.63
Total preferred stock 780,000 2,538,107 $ 7,800 $ 8,152
(a) The redemption price includes the amount shown in the table plus any accrued but unpaid dividends. (b) Represented by depositary shares.

Notes to consolidated financial statements
JPMorgan Chase & Co./2010 Annual Report 268
Dividend and stock repurchase restrictions
Prior to the redemption of the Series K Preferred Stock on June
17, 2009, the Firm was subject to certain restrictions regarding
the declaration of dividends and share repurchases. As a result of
the redemption of the Series K Preferred Stock, JPMorgan Chase
is no longer subject to any of these restrictions.
Note 24 – Common stock
At December 31, 2010 and 2009, JPMorgan Chase was authorized
to issue 9.0 billion shares of common stock with a par value of $1
per share. On June 5, 2009, the Firm issued $5.8 billion, or 163
million new shares, of its common stock at $35.25 per share. On
September 30, 2008, the Firm issued $11.5 billion, or 284 million
new shares, of its common stock at $40.50 per share.
On April 8, 2008, pursuant to the Share Exchange Agreement
dated March 24, 2008, between JPMorgan Chase and Bear
Stearns, 20.7 million newly issued shares of JPMorgan Chase
common stock were issued to Bear Stearns in a transaction that
was exempt from registration under the Securities Act of 1933,
pursuant to Section 4(2) thereof, in exchange for 95.0 million newly
issued shares of Bear Stearns common stock (or 39.5% of Bear
Stearns common stock after giving effect to the issuance). Upon the
consummation of the Bear Stearns merger, on May 30, 2008, the
20.7 million shares of JPMorgan Chase common stock and 95.0
million shares of Bear Stearns common stock were cancelled. For a
further discussion of this transaction, see Note 2 on pages 166–
170 of this Annual Report.
Common shares issued (newly issued or distributed from treasury)
by JPMorgan Chase during the years ended December 31, 2010,
2009 and 2008 were as follows.
Year ended December 31, (in millions) 2010 2009 2008 Issued – balance at January 1 4,104.9 3,941.6 3,657.7 Newly issued:
Common stock: Open market issuance — 163.3 283.9 Bear Stearns Share Exchange
Agreement — — 20.7 Total newly issued — 163.3 304.6 Canceled shares — — (20.7 ) Total issued – balance at
December 31 4,104.9 4,104.9 3,941.6 Treasury – balance at January 1 (162.9) (208.8) (290.3 ) Purchase of treasury stock (77.9) — — Share repurchases related to employee
stock-based awards(a) (0.1) (1.1) (0.5 ) Issued from treasury:
Net change from the Bear Stearns merger as a result of the reissuance of Treasury stock and the Share Exchange Agreement — — 26.5
Employee benefits and compensation plans 45.3 45.7 54.4
Employee stock purchase plans 1.0 1.3 1.1 Total issued from treasury 46.3 47.0 82.0 Total treasury – balance at
December 31 (194.6) (162.9) (208.8 ) Outstanding 3,910.3 3,942.0 3,732.8
(a) Participants in the Firm’s stock-based incentive plans may have shares withheld to cover income taxes.
As noted in Note 23 on pages 267–268, pursuant to the U.S.
Treasury’s Capital Purchase Program, the Firm issued to the U.S.
Treasury a Warrant to purchase up to 88,401,697 shares of the
Firm’s common stock, at an exercise price of $42.42 per share,
subject to certain antidilution and other adjustments. The U.S.
Treasury exchanged the Warrant for 88,401,697 warrants, each of
which was a warrant to purchase a share of the Firm’s common
stock at an exercise price of $42.42 per share and, on December
11, 2009, sold the warrants in a secondary public offering for $950
million. The warrants are exercisable, in whole or in part, at any
time and from time to time until October 28, 2018. The Firm did
not purchase any of the warrants sold by the U.S. Treasury.
Under the stock repurchase program authorized by the Firm’s Board of Directors, the Firm is authorized to repurchase up to $10.0
billion of the Firm’s common stock plus 88 million warrants sold by
the U.S. Treasury in 2009. During 2009, the Firm did not repur-
chase any shares of its common stock or warrants. In the second
quarter of 2010, the Firm resumed common stock repurchases, and
during the year repurchased an aggregate of 78 million shares for
$3.0 billion at an average price per share of $38.49. The Firm’s
share repurchase activities in 2010 were intended to offset share-
count increases resulting from employee stock-based incentive
awards and were consistent with the Firm’s goal of maintaining an
appropriate sharecount. The Firm did not repurchase any of the
warrants during 2010. As of December 31, 2010, $3.2 billion of
authorized repurchase capacity remained with respect to the com-
mon stock, and all of the authorized repurchase capacity remained
with respect to the warrants.
The Firm may, from time to time, enter into written trading plans
under Rule 10b5-1 of the Securities Exchange Act of 1934 to
facilitate the repurchase of common stock and warrants in accor-
dance with the repurchase program. A Rule 10b5-1 repurchase
plan allows the Firm to repurchase its equity during periods when it
would not otherwise be repurchasing common stock – for example
during internal trading “black-out periods.” All purchases under a
Rule 10b5-1 plan must be made according to a predefined plan
established when the Firm is not aware of material nonpublic
information.
As of December 31, 2010, approximately 564 million unissued
shares of common stock were reserved for issuance under various
employee incentive, compensation, option and stock purchase
plans, director compensation plans, and the warrants sold by the
U.S. Treasury as discussed above.

JPMorgan Chase & Co./2010 Annual Report 269
Note 25 – Earnings per share
Effective January 1, 2009, the Firm implemented accounting guid-
ance for participating securities, which clarifies that unvested stock-
based compensation awards containing nonforfeitable rights to
dividends or dividend equivalents (collectively, “dividends”) are
participating securities and should be included in the earnings per
share (“EPS”) calculation using the two-class method. Under the
two-class method, all earnings (distributed and undistributed) are
allocated to each class of common stock and participating securi-
ties, based on their respective rights to receive dividends. JPMorgan
Chase grants restricted stock and RSUs to certain employees under
its stock-based compensation programs, which entitle the recipients
to receive nonforfeitable dividends during the vesting period on a
basis equivalent to the dividends paid to holders of common stock;
these unvested awards meet the definition of participating securi-
ties. EPS data for the prior periods were revised as required by the
accounting guidance. Options issued under employee benefit plans
that have an antidilutive effect are excluded from the computation
of diluted EPS.
The following table presents the calculation of basic and diluted
EPS for the years ended December 31, 2010, 2009 and 2008.
Year ended December 31, (in millions, except per share amounts) 2010 2009 2008Basic earnings per share Income before extraordinary gain $ 17,370 $ 11,652 $ 3,699Extraordinary gain — 76 1,906Net income 17,370 11,728 5,605Less: Preferred stock dividends 642 1,327 674Less: Accelerated amortization
from redemption of preferred stock issued to the U.S. Treasury — 1,112(c) —
Net income applicable to common equity 16,728 9,289(c) 4,931
Less: Dividends and undistributed earnings allocated to participat-ing securities 964 515 189
Net income applicable to common stockholders $ 15,764 $ 8,774 $ 4,742
Total weighted-average basic shares outstanding 3,956.3 3,862.8 3,501.1
Per share
Income before extraordinary gain $ 3.98 $ 2.25(c) $ 0.81Extraordinary gain — 0.02 0.54
Net income $ 3.98 $ 2.27(c) $ 1.35
Year ended December 31, (in millions, except per share amounts) 2010
2009 2008
Diluted earnings per share Net income applicable to
common stockholders $ 15,764 $ 8,774 $ 4,742 Total weighted-average basic
shares outstanding 3,956.3 3,862.8 3,501.1 Add: Employee stock options, SARs
and warrants(a) 20.6 16.9 20.7 Total weighted-average
diluted shares outstanding(b) 3,976.9 3,879.7 3,521.8 Per share
Income before extraordinary gain $ 3.96 $ 2.24(c) $ 0.81 Extraordinary gain — 0.02 0.54
Net income per share $ 3.96 $ 2.26(c) $ 1.35
(a) Excluded from the computation of diluted EPS (due to their antidilutive effect) were options issued under employee benefit plans and the warrants originally issued in 2008 under the U.S. Treasury’s Capital Purchase Pro-gram to purchase shares of the Firm’s common stock aggregating 233 mil-lion, 266 million and 209 million for the full years ended December 31, 2010, 2009 and 2008, respectively.
(b) Participating securities were included in the calculation of diluted EPS using the two-class method, as this computation was more dilutive than the cal-culation using the treasury stock method.
(c) The calculation of basic and diluted EPS and net income applicable to common equity for full year 2009 includes a one-time, noncash reduction of $1.1 billion, or $0.27 per share, resulting from repayment of the U.S. Trou-bled Asset Relief Program (“TARP”) preferred capital.
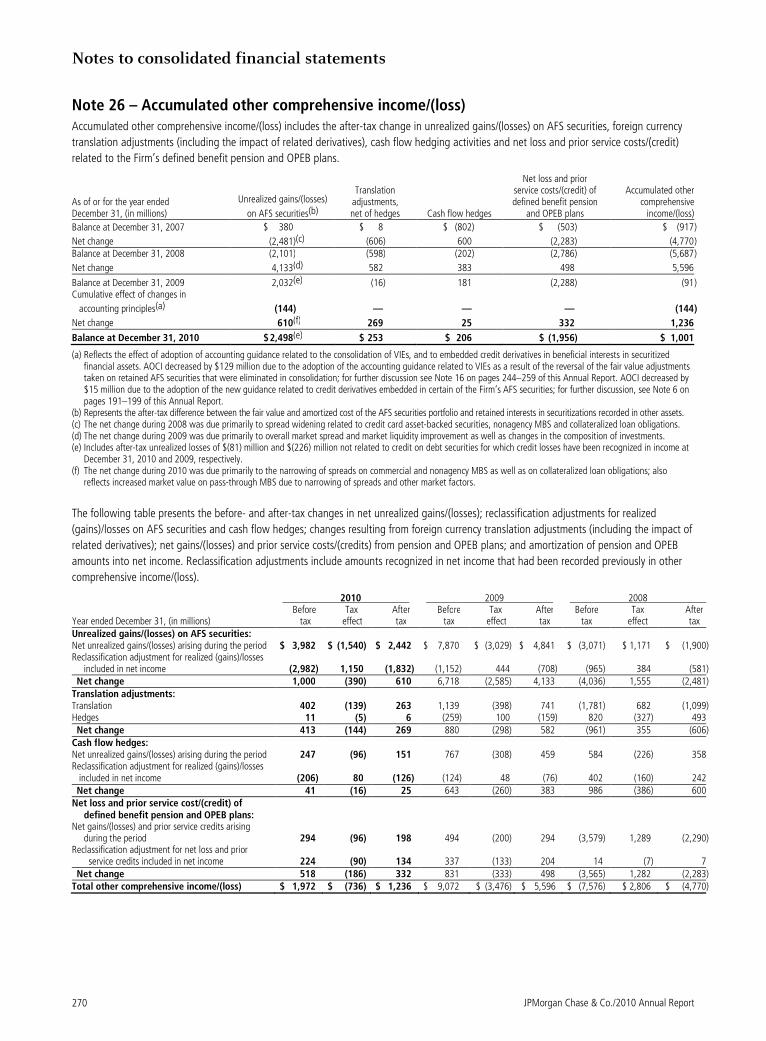
Notes to consolidated financial statements
JPMorgan Chase & Co./2010 Annual Report 270
Note 26 – Accumulated other comprehensive income/(loss) Accumulated other comprehensive income/(loss) includes the after-tax change in unrealized gains/(losses) on AFS securities, foreign currency
translation adjustments (including the impact of related derivatives), cash flow hedging activities and net loss and prior service costs/(credit)
related to the Firm’s defined benefit pension and OPEB plans.
As of or for the year ended December 31, (in millions)
Unrealized gains/(losses)
on AFS securities(b)
Translation adjustments, net of hedges Cash flow hedges
Net loss and prior service costs/(credit) of defined benefit pension
and OPEB plans
Accumulated other comprehensive
income/(loss)
Balance at December 31, 2007 $ 380 $ 8 $ (802) $ (503) $ (917 )
Net change (2,481)(c) (606) 600 (2,283) (4,770 ) Balance at December 31, 2008 (2,101) (598) (202) (2,786) (5,687 )
Net change 4,133(d) 582 383 498 5,596
Balance at December 31, 2009 2,032(e) (16) 181 (2,288) (91 ) Cumulative effect of changes in
accounting principles(a) (144) — — — (144 )
Net change 610(f) 269 25 332 1,236
Balance at December 31, 2010 $ 2,498(e) $ 253 $ 206 $ (1,956) $ 1,001
(a) Reflects the effect of adoption of accounting guidance related to the consolidation of VIEs, and to embedded credit derivatives in beneficial interests in securitized financial assets. AOCI decreased by $129 million due to the adoption of the accounting guidance related to VIEs as a result of the reversal of the fair value adjustments taken on retained AFS securities that were eliminated in consolidation; for further discussion see Note 16 on pages 244–259 of this Annual Report. AOCI decreased by $15 million due to the adoption of the new guidance related to credit derivatives embedded in certain of the Firm’s AFS securities; for further discussion, see Note 6 on pages 191–199 of this Annual Report.
(b) Represents the after-tax difference between the fair value and amortized cost of the AFS securities portfolio and retained interests in securitizations recorded in other assets. (c) The net change during 2008 was due primarily to spread widening related to credit card asset-backed securities, nonagency MBS and collateralized loan obligations. (d) The net change during 2009 was due primarily to overall market spread and market liquidity improvement as well as changes in the composition of investments. (e) Includes after-tax unrealized losses of $(81) million and $(226) million not related to credit on debt securities for which credit losses have been recognized in income at
December 31, 2010 and 2009, respectively. (f) The net change during 2010 was due primarily to the narrowing of spreads on commercial and nonagency MBS as well as on collateralized loan obligations; also
reflects increased market value on pass-through MBS due to narrowing of spreads and other market factors.
The following table presents the before- and after-tax changes in net unrealized gains/(losses); reclassification adjustments for realized
(gains)/losses on AFS securities and cash flow hedges; changes resulting from foreign currency translation adjustments (including the impact of
related derivatives); net gains/(losses) and prior service costs/(credits) from pension and OPEB plans; and amortization of pension and OPEB
amounts into net income. Reclassification adjustments include amounts recognized in net income that had been recorded previously in other
comprehensive income/(loss).
2010 2009 2008 Before Tax After Before Tax After Before Tax After Year ended December 31, (in millions) tax effect tax tax effect tax tax effect tax Unrealized gains/(losses) on AFS securities: Net unrealized gains/(losses) arising during the period $ 3,982 $ (1,540) $ 2,442 $ 7,870 $ (3,029) $ 4,841 $ (3,071) $ 1,171 $ (1,900) Reclassification adjustment for realized (gains)/losses
included in net income (2,982) 1,150 (1,832) (1,152) 444 (708) (965) 384 (581) Net change 1,000 (390) 610 6,718 (2,585) 4,133 (4,036) 1,555 (2,481) Translation adjustments: Translation 402 (139) 263 1,139 (398) 741 (1,781) 682 (1,099) Hedges 11 (5) 6 (259) 100 (159) 820 (327) 493 Net change 413 (144) 269 880 (298) 582 (961) 355 (606) Cash flow hedges: Net unrealized gains/(losses) arising during the period 247 (96) 151 767 (308) 459 584 (226) 358 Reclassification adjustment for realized (gains)/losses included in net income (206) 80 (126) (124) 48 (76) 402 (160) 242 Net change 41 (16) 25 643 (260) 383 986 (386) 600 Net loss and prior service cost/(credit) of
defined benefit pension and OPEB plans: Net gains/(losses) and prior service credits arising
during the period 294 (96) 198 494 (200) 294 (3,579) 1,289 (2,290) Reclassification adjustment for net loss and prior
service credits included in net income 224 (90) 134 337 (133) 204 14 (7) 7 Net change 518 (186) 332 831 (333) 498 (3,565) 1,282 (2,283) Total other comprehensive income/(loss) $ 1,972 $ (736) $ 1,236 $ 9,072 $ (3,476) $ 5,596 $ (7,576) $ 2,806 $ (4,770)

JPMorgan Chase & Co./2010 Annual Report 271
Note 27 – Income taxes
JPMorgan Chase and its eligible subsidiaries file a consolidated U.S.
federal income tax return. JPMorgan Chase uses the asset and
liability method to provide income taxes on all transactions re-
corded in the Consolidated Financial Statements. This method
requires that income taxes reflect the expected future tax conse-
quences of temporary differences between the carrying amounts of
assets or liabilities for book and tax purposes. Accordingly, a de-
ferred tax asset or liability for each temporary difference is deter-
mined based on the tax rates that the Firm expects to be in effect
when the underlying items of income and expense are realized.
JPMorgan Chase’s expense for income taxes includes the current
and deferred portions of that expense. A valuation allowance is
established to reduce deferred tax assets to the amount the Firm
expects to realize.
Due to the inherent complexities arising from the nature of the
Firm’s businesses, and from conducting business and being taxed in
a substantial number of jurisdictions, significant judgments and
estimates are required to be made. Agreement of tax liabilities
between JPMorgan Chase and the many tax jurisdictions in which
the Firm files tax returns may not be finalized for several years.
Thus, the Firm’s final tax-related assets and liabilities may ulti-
mately be different from those currently reported.
The components of income tax expense/(benefit) included in the
Consolidated Statements of Income were as follows for each of the
years ended December 31, 2010, 2009 and 2008.
Year ended December 31, (in millions) 2010 2009 2008Current income tax
expense U.S. federal $ 4,001 $ 4,698 $ 395 Non-U.S. 2,712 2,368 1,009 U.S. state and local 1,744 971 307 Total current income tax expense 8,457 8,037 1,711
Deferred income tax expense/(benefit) U.S. federal (753) (2,867) (3,015 ) Non-U.S. 169 (454) 1 U.S. state and local (384) (301) 377 Total deferred income tax expense/(benefit) (968) (3,622) (2,637 )
Total income tax expense/ (benefit) before extraordinary gain $ 7,489 $ 4,415 $ (926 )
Total income tax expense includes $485 million, $280 million and
$55 million of tax benefits recorded in 2010, 2009 and 2008,
respectively, as a result of tax audit resolutions.
The preceding table does not reflect the tax effect of certain items
that are recorded each period directly in stockholders’ equity and
certain tax benefits associated with the Firm’s employee stock-
based compensation plans. The tax effect of all items recorded
directly to stockholders’ equity resulted in an increase of $1.8
billion in 2010, a decrease of $3.7 billion in 2009, and an increase
of $3.0 billion in 2008.
U.S. federal income taxes have not been provided on the undis-
tributed earnings of certain non-U.S. subsidiaries, to the extent
that such earnings have been reinvested abroad for an indefinite
period of time. During 2008, as part of JPMorgan Chase’s peri-
odic review of the business requirements and capital needs of its
non-U.S. subsidiaries, combined with the formation of specific
strategies and steps taken to fulfill these requirements and needs,
the Firm determined that the undistributed earnings of certain of
its subsidiaries, for which U.S. federal income taxes had been
provided, would be indefinitely reinvested to fund the current and
future growth of the related businesses. As management does
not intend to use the earnings of these subsidiaries as a source of
funding for its U.S. operations, such earnings will not be distrib-
uted to the U.S. in the foreseeable future. This determination
resulted in the release of deferred tax liabilities and the recogni-
tion of an income tax benefit of $1.1 billion associated with these
undistributed earnings in 2008. For 2010, pretax earnings of
approximately $3.5 billion were generated that will be indefi-
nitely reinvested in these subsidiaries. At December 31, 2010, the
cumulative amount of undistributed pretax earnings in these
subsidiaries approximated $19.3 billion. If the Firm were to
record a deferred tax liability associated with these undistributed
earnings, the amount would be $4.3 billion at December 31,
2010.
Tax expense applicable to securities gains and losses for the years
2010, 2009 and 2008 was $1.1 billion, $427 million, and $608
million, respectively.
A reconciliation of the applicable statutory U.S. income tax rate to
the effective tax rate for each of the years ended December 31,
2010, 2009 and 2008, is presented in the following table.
Year ended December 31, 2010 2009 2008
Statutory U.S. federal tax rate 35.0% 35.0% 35.0 % Increase/(decrease) in tax rate
resulting from: U.S. state and local income taxes, net of U.S. federal income tax benefit 3.6 2.7 16.0
Tax-exempt income (2.4) (3.9) (14.8 )
Non-U.S. subsidiary earnings(a) (2.2) (1.7) (53.6 ) Business tax credits (3.7) (5.5) (24.5 ) Bear Stearns equity losses — — 5.7 Other, net (0.2) 0.9 2.8
Effective tax rate 30.1% 27.5% (33.4 )%
(a) Includes earnings deemed to be reinvested indefinitely in non-U.S. subsidiaries.
Deferred income tax expense/(benefit) results from differences be-
tween assets and liabilities measured for financial reporting versus
income-tax return purposes. Deferred tax assets are recognized if, in
management’s judgment, their realizability is determined to be
more likely than not. If a deferred tax asset is determined to be
unrealizable, a valuation allowance is established. The significant
components of deferred tax assets and liabilities are reflected in the
following table as of December 31, 2010 and 2009.
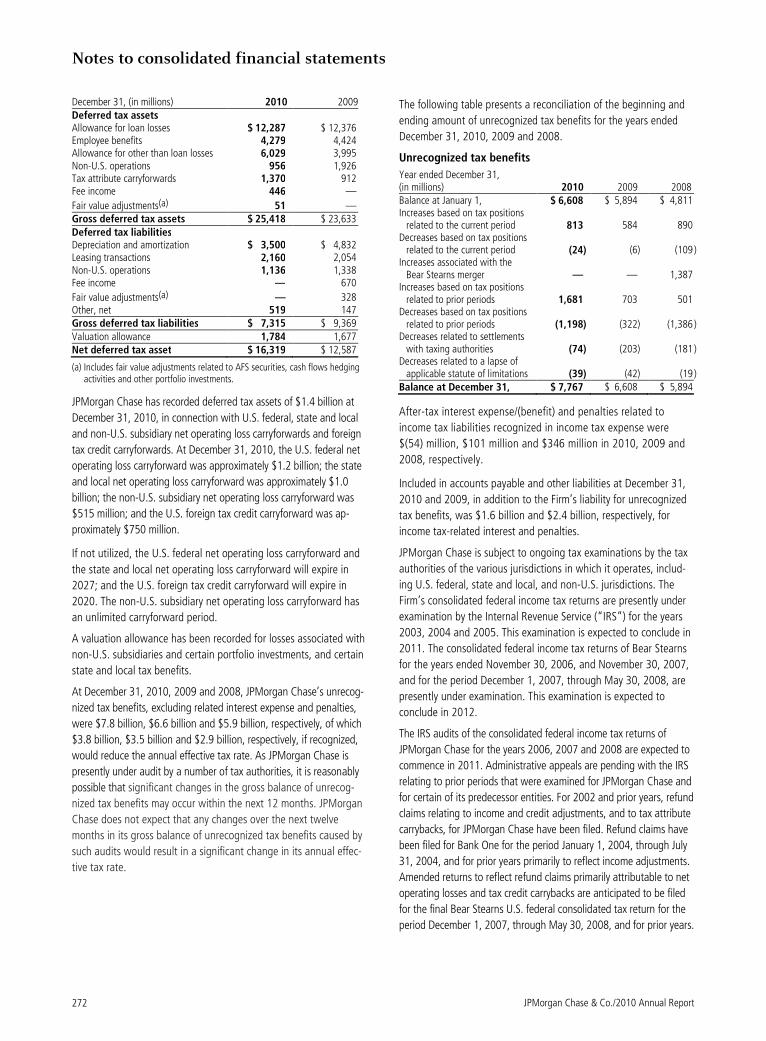
Notes to consolidated financial statements
JPMorgan Chase & Co./2010 Annual Report 272
December 31, (in millions) 2010 2009 Deferred tax assets Allowance for loan losses $ 12,287 $ 12,376 Employee benefits 4,279 4,424 Allowance for other than loan losses 6,029 3,995 Non-U.S. operations 956 1,926 Tax attribute carryforwards 1,370 912 Fee income 446 —
Fair value adjustments(a) 51 — Gross deferred tax assets $ 25,418 $ 23,633 Deferred tax liabilities Depreciation and amortization $ 3,500 $ 4,832 Leasing transactions 2,160 2,054 Non-U.S. operations 1,136 1,338 Fee income — 670
Fair value adjustments(a) — 328 Other, net 519 147 Gross deferred tax liabilities $ 7,315 $ 9,369 Valuation allowance 1,784 1,677 Net deferred tax asset $ 16,319 $ 12,587
(a) Includes fair value adjustments related to AFS securities, cash flows hedging activities and other portfolio investments.
JPMorgan Chase has recorded deferred tax assets of $1.4 billion at
December 31, 2010, in connection with U.S. federal, state and local
and non-U.S. subsidiary net operating loss carryforwards and foreign
tax credit carryforwards. At December 31, 2010, the U.S. federal net
operating loss carryforward was approximately $1.2 billion; the state
and local net operating loss carryforward was approximately $1.0
billion; the non-U.S. subsidiary net operating loss carryforward was
$515 million; and the U.S. foreign tax credit carryforward was ap-
proximately $750 million.
If not utilized, the U.S. federal net operating loss carryforward and
the state and local net operating loss carryforward will expire in
2027; and the U.S. foreign tax credit carryforward will expire in
2020. The non-U.S. subsidiary net operating loss carryforward has
an unlimited carryforward period.
A valuation allowance has been recorded for losses associated with
non-U.S. subsidiaries and certain portfolio investments, and certain
state and local tax benefits.
At December 31, 2010, 2009 and 2008, JPMorgan Chase’s unrecog-
nized tax benefits, excluding related interest expense and penalties,
were $7.8 billion, $6.6 billion and $5.9 billion, respectively, of which
$3.8 billion, $3.5 billion and $2.9 billion, respectively, if recognized,
would reduce the annual effective tax rate. As JPMorgan Chase is
presently under audit by a number of tax authorities, it is reasonably
possible that significant changes in the gross balance of unrecog-
nized tax benefits may occur within the next 12 months. JPMorgan
Chase does not expect that any changes over the next twelve
months in its gross balance of unrecognized tax benefits caused by
such audits would result in a significant change in its annual effec-
tive tax rate.
The following table presents a reconciliation of the beginning and
ending amount of unrecognized tax benefits for the years ended
December 31, 2010, 2009 and 2008.
Unrecognized tax benefits
Year ended December 31, (in millions) 2010 2009 2008 Balance at January 1, $ 6,608 $ 5,894 $ 4,811 Increases based on tax positions
related to the current period 813 584 890 Decreases based on tax positions
related to the current period (24) (6) (109
) Increases associated with the
Bear Stearns merger — — 1,387 Increases based on tax positions
related to prior periods 1,681 703 501 Decreases based on tax positions
related to prior periods (1,198) (322) (1,386
) Decreases related to settlements
with taxing authorities (74) (203) (181
) Decreases related to a lapse of
applicable statute of limitations (39) (42) (19
) Balance at December 31, $ 7,767 $ 6,608 $ 5,894
After-tax interest expense/(benefit) and penalties related to
income tax liabilities recognized in income tax expense were
$(54) million, $101 million and $346 million in 2010, 2009 and
2008, respectively.
Included in accounts payable and other liabilities at December 31,
2010 and 2009, in addition to the Firm’s liability for unrecognized
tax benefits, was $1.6 billion and $2.4 billion, respectively, for
income tax-related interest and penalties.
JPMorgan Chase is subject to ongoing tax examinations by the tax
authorities of the various jurisdictions in which it operates, includ-
ing U.S. federal, state and local, and non-U.S. jurisdictions. The
Firm’s consolidated federal income tax returns are presently under
examination by the Internal Revenue Service (“IRS”) for the years
2003, 2004 and 2005. This examination is expected to conclude in
2011. The consolidated federal income tax returns of Bear Stearns
for the years ended November 30, 2006, and November 30, 2007,
and for the period December 1, 2007, through May 30, 2008, are
presently under examination. This examination is expected to
conclude in 2012.
The IRS audits of the consolidated federal income tax returns of
JPMorgan Chase for the years 2006, 2007 and 2008 are expected to
commence in 2011. Administrative appeals are pending with the IRS
relating to prior periods that were examined for JPMorgan Chase and
for certain of its predecessor entities. For 2002 and prior years, refund
claims relating to income and credit adjustments, and to tax attribute
carrybacks, for JPMorgan Chase have been filed. Refund claims have
been filed for Bank One for the period January 1, 2004, through July
31, 2004, and for prior years primarily to reflect income adjustments.
Amended returns to reflect refund claims primarily attributable to net
operating losses and tax credit carrybacks are anticipated to be filed
for the final Bear Stearns U.S. federal consolidated tax return for the
period December 1, 2007, through May 30, 2008, and for prior years.

JPMorgan Chase & Co./2010 Annual Report 273
The following table presents the U.S. and non-U.S. components of
income before income tax expense/(benefit) and extraordinary gain
for the years ended December 31, 2010, 2009 and 2008.
Year ended December 31, (in millions) 2010 2009 2008 U.S. $ 16,568 $ 6,263 $ (2,094) Non-U.S.(a) 8,291 9,804 4,867 Income before income tax
expense/(benefit) and extraordinary gain $ 24,859 $ 16,067 $ 2,773
(a) For purposes of this table, non-U.S. income is defined as income generated from operations located outside the U.S.
Note 28 – Restrictions on cash and intercompany funds transfers
The business of JPMorgan Chase Bank, National Association
(“JPMorgan Chase Bank, N.A.”) is subject to examination and
regulation by the Office of the Comptroller of the Currency
(“OCC”). The Bank is a member of the U.S. Federal Reserve Sys-
tem, and its deposits in the U.S. are insured by the FDIC.
The Board of Governors of the Federal Reserve System (the “Fed-
eral Reserve”) requires depository institutions to maintain cash
reserves with a Federal Reserve Bank. The average amount of
reserve balances deposited by the Firm’s bank subsidiaries with
various Federal Reserve Banks was approximately $803 million and
$821 million in 2010 and 2009, respectively.
Restrictions imposed by U.S. federal law prohibit JPMorgan Chase
and certain of its affiliates from borrowing from banking subsidiar-
ies unless the loans are secured in specified amounts. Such secured
loans to the Firm or to other affiliates are generally limited to 10%
of the banking subsidiary’s total capital, as determined by the risk-
based capital guidelines; the aggregate amount of all such loans is
limited to 20% of the banking subsidiary’s total capital.
The principal sources of JPMorgan Chase’s income (on a parent
company–only basis) are dividends and interest from JPMorgan
Chase Bank, N.A., and the other banking and nonbanking subsidi-
aries of JPMorgan Chase. In addition to dividend restrictions set
forth in statutes and regulations, the Federal Reserve, the OCC and
the FDIC have authority under the Financial Institutions Supervisory
Act to prohibit or to limit the payment of dividends by the banking
organizations they supervise, including JPMorgan Chase and its
subsidiaries that are banks or bank holding companies, if, in the
banking regulator’s opinion, payment of a dividend would consti-
tute an unsafe or unsound practice in light of the financial condi-
tion of the banking organization.
At January 1, 2011, JPMorgan Chase’s banking subsidiaries could
pay, in the aggregate, $2.0 billion in dividends to their respective
bank holding companies without the prior approval of their relevant
banking regulators. The capacity to pay dividends in 2011 will be
supplemented by the banking subsidiaries’ earnings during the
year.
In compliance with rules and regulations established by U.S. and
non-U.S. regulators, as of December 31, 2010 and 2009, cash in
the amount of $25.0 billion and $24.0 billion, respectively, and
securities with a fair value of $9.7 billion and $10.2 billion, respec-
tively, were segregated in special bank accounts for the benefit of
securities and futures brokerage customers.
Note 29 – Capital
The Federal Reserve establishes capital requirements, including
well-capitalized standards for the consolidated financial holding
company. The OCC establishes similar capital requirements and
standards for the Firm’s national banks, including JPMorgan Chase
Bank, N.A., and Chase Bank USA, N.A.
There are two categories of risk-based capital: Tier 1 capital and
Tier 2 capital. Tier 1 capital consists of common stockholders’
equity, perpetual preferred stock, noncontrolling interests in sub-
sidiaries and trust preferred capital debt securities, less goodwill
and certain other adjustments. Tier 2 capital consists of preferred
stock not qualifying as Tier 1, subordinated long-term debt and
other instruments qualifying as Tier 2, and the aggregate allowance
for credit losses up to a certain percentage of risk-weighted assets.
Total capital is Tier 1 capital plus Tier 2 capital. Under the risk-
based capital guidelines of the Federal Reserve, JPMorgan Chase is
required to maintain minimum ratios of Tier 1 and Total capital to
risk-weighted assets, as well as minimum leverage ratios (which are
defined as Tier 1 capital divided by adjusted quarterly average
assets). Failure to meet these minimum requirements could cause
the Federal Reserve to take action. Banking subsidiaries also are
subject to these capital requirements by their respective primary
regulators. As of December 31, 2010 and 2009, JPMorgan Chase
and all of its banking subsidiaries were well-capitalized and met all
capital requirements to which each was subject.

Notes to consolidated financial statements
JPMorgan Chase & Co./2010 Annual Report 274
The following table presents the regulatory capital, assets and risk-based capital ratios for JPMorgan Chase and its significant banking subsidiaries at
December 31, 2010 and 2009. These amounts are determined in accordance with regulations issued by the Federal Reserve and/or OCC.
Well- capitalized
ratios(g)
Minimum capital
ratios(g) December 31, JPMorgan Chase & Co.(e) JPMorgan Chase Bank, N.A.(e) Chase Bank USA, N.A.(e) (in millions, except ratios) 2010 2009 2010 2009 2010 2009 Regulatory capital
Tier 1(a) $ 142,450 $ 132,971 $ 91,764 $ 96,372 $ 12,966 $ 15,534 Total 182,216 177,073 130,444 136,646 16,659 19,198
Assets
Risk-weighted(b)(c) 1,174,978(f) 1,198,006 965,897 1,011,995 116,992 114,693
Adjusted average(d) 2,024,515(f) 1,933,767 1,611,486 1,609,081 117,368 74,087
Capital ratios
Tier 1(a) 12.1%(f) 11.1% 9.5% 9.5% 11.1% 13.5% 6.0% 4.0 % Total 15.5 14.8 13.5 13.5 14.2 16.7 10.0 8.0
Tier 1 leverage 7.0 6.9 5.7 6.0 11.0 21.0 5.0(h) 3.0 (i)
(a) At December 31, 2010, for JPMorgan Chase and JPMorgan Chase Bank, N.A., trust preferred capital debt securities were $19.8 billion and $600 million, respec-tively. If these securities were excluded from the calculation at December 31, 2010, Tier 1 capital would be $122.7 billion and $91.2 billion, respectively, and the Tier 1 capital ratio would be 10.4% and 9.4%, respectively. At December 31, 2010, Chase Bank USA, N.A. had no trust preferred capital debt securities.
(b) Risk-weighted assets consist of on– and off–balance sheet assets that are assigned to one of several broad risk categories and weighted by factors representing their risk and potential for default. On–balance sheet assets are risk-weighted based on the perceived credit risk associated with the obligor or counterparty, the nature of any collateral, and the guarantor, if any. Off–balance sheet assets such as lending-related commitments, guarantees, derivatives and other applicable off–balance sheet positions are risk-weighted by multiplying the contractual amount by the appropriate credit conversion factor to determine the on–balance sheet credit-equivalent amount, which is then risk-weighted based on the same factors used for on–balance sheet assets. Risk-weighted assets also incorporate a measure for the market risk related to applicable trading assets—debt and equity instruments, and foreign exchange and commodity derivatives. The resulting risk-weighted val-ues for each of the risk categories are then aggregated to determine total risk-weighted assets.
(c) Includes off–balance sheet risk-weighted assets at December 31, 2010, of $282.9 billion, $274.2 billion and $31 million, and at December 31, 2009, of $367.4 billion, $312.3 billion and $49.9 billion, for JPMorgan Chase, JPMorgan Chase Bank, N.A. and Chase Bank USA, N.A., respectively.
(d) Adjusted average assets, for purposes of calculating the leverage ratio, include total quarterly average assets adjusted for unrealized gains/(losses) on securities, less deductions for disallowed goodwill and other intangible assets, investments in certain subsidiaries, and the total adjusted carrying value of nonfinancial equity in-vestments that are subject to deductions from Tier 1 capital.
(e) Asset and capital amounts for JPMorgan Chase’s banking subsidiaries reflect intercompany transactions; whereas the respective amounts for JPMorgan Chase reflect the elimination of intercompany transactions.
(f) Effective January 1, 2010, the Firm adopted new guidance that amended the accounting for the consolidation of VIEs, which resulted in a decrease in the Tier 1 capital ratio of 34 basis points. See Note 16 on pages 244–259 of this Annual Report for further information.
(g) As defined by the regulations issued by the Federal Reserve, OCC and FDIC. (h) Represents requirements for banking subsidiaries pursuant to regulations issued under the FDIC Improvement Act. There is no Tier 1 leverage component in the
definition of a well-capitalized bank holding company. (i) The minimum Tier 1 leverage ratio for bank holding companies and banks is 3% or 4%, depending on factors specified in regulations issued by the Federal Reserve
and OCC. Note: Rating agencies allow measures of capital to be adjusted upward for deferred tax liabilities, which have resulted from both nontaxable business combinations and
from tax-deductible goodwill. The Firm had deferred tax liabilities resulting from nontaxable business combinations totaling $647 million and $812 million at December 31, 2010 and 2009, respectively; and deferred tax liabilities resulting from tax-deductible goodwill of $1.9 billion and $1.7 billion at December 31, 2010 and 2009, respectively.
A reconciliation of the Firm’s Total stockholders’ equity to Tier 1 capital and Total qualifying capital is presented in the table below.
December 31, (in millions) 2010 2009
Tier 1 capital Total stockholders’ equity $ 176,106 $ 165,365Effect of certain items in accumulated other comprehensive income/(loss) excluded from Tier 1 capital (748) 75
Qualifying hybrid securities and noncontrolling interests(a) 19,887 19,535
Less: Goodwill(b) 46,915 46,630Fair value DVA on derivative and structured note liabilities related to the Firm’s credit quality 1,261 912Investments in certain subsidiaries and other 1,032 802
Other intangible assets(b) 3,587 3,660Total Tier 1 capital 142,450 132,971Tier 2 capital Long-term debt and other instruments qualifying as Tier 2 25,018 28,977Qualifying allowance for credit losses 14,959 15,296Adjustment for investments in certain subsidiaries and other (211) (171) Total Tier 2 capital 39,766 44,102Total qualifying capital $ 182,216 $ 177,073
(a) Primarily includes trust preferred capital debt securities of certain business trusts. (b) Goodwill and other intangible assets are net of any associated deferred tax liabilities.

JPMorgan Chase & Co./2010 Annual Report 275
Note 30 – Off–balance sheet lending-related financial instruments, guarantees and other commitments
JPMorgan Chase utilizes lending-related financial instruments (e.g.,
commitments and guarantees) to meet the financing needs of its
customers. The contractual amount of these financial instruments
represents the Firm’s maximum possible credit risk should the
counterparty draw upon the commitment or the Firm be required to
fulfill its obligation under the guarantee, and should the counter-
party subsequently fail to perform according to the terms of the
contract. Most of these commitments and guarantees expire with-
out being drawn or a default occurring. As a result, the total con-
tractual amount of these instruments is not, in the Firm’s view,
representative of its actual future credit exposure or funding re-
quirements.
To provide for the risk of loss inherent in wholesale and consumer
(excluding credit card) related contracts, an allowance for credit
losses on lending-related commitments is maintained. See Note 15
on pages 239–243 of this Annual Report for further discussion
regarding the allowance for credit losses on lending-related com-
mitments.
The following table summarizes the contractual amounts and
carrying values of off-balance sheet lending-related financial in-
struments, guarantees and other commitments at December 31,
2010 and 2009. The amounts in the table below for credit card and
home equity lending-related commitments represent the total
available credit for these products. The Firm has not experienced,
and does not anticipate, that all available lines of credit for these
products will be utilized at the same time. The Firm can reduce or
cancel credit card lines of credit by providing the borrower prior
notice or, in some cases, without notice as permitted by law. The
Firm may reduce or close home equity lines of credit when there are
significant decreases in the value of the underlying property or
when there has been a demonstrable decline in the creditworthi-
ness of the borrower.
Off–balance sheet lending-related financial instruments, guarantees and other commitments
Contractual amount Carrying value(l) December 31, (in millions) 2010 2009 2010 2009 Lending-related Consumer, excluding credit card:
Home equity — senior lien $ 16,060 $ 19,246 $ — $ — Home equity — junior lien 28,681 37,231 — — Prime mortgage 1,266 1,654 — — Subprime mortgage — — — — Auto 5,246 5,467 2 7 Business banking 9,702 9,040 4 5 Student and other 579 2,189 — —
Total consumer, excluding credit card 61,534 74,827 6 12 Credit card 547,227 569,113 — — Total consumer 608,761 643,940 6 12 Wholesale:
Other unfunded commitments to extend credit(a)(b)(c) 199,859 192,145 364 356
Asset purchase agreements(b) — 22,685 — 126
Standby letters of credit and other financial guarantees(a)(c)(d)(e) 94,837 91,485 705 919 Unused advised lines of credit 44,720 35,673 — —
Other letters of credit(a)(e) 6,663 5,167 2 1 Total wholesale 346,079 347,155 1,071 1,402 Total lending-related $ 954,840 $ 991,095 $ 1,077 $ 1,414 Other guarantees and commitments
Securities lending indemnifications(f) $ 181,717 $ 170,777 $ NA $ NA
Derivatives qualifying as guarantees(g) 87,768 98,052(k) 294 896(k)
Unsettled reverse repurchase and securities borrowing agreements 39,927 48,187 — —
Equity investment commitments(h) 2,468 2,374 — — Building purchase commitments 258 670 — —
Other guarantees and commitments(i) 3,766 3,671 6 6 Loan sale and securitization-related indemnifications:
Repurchase liability(j) NA NA 3,285 1,705 Loans sold with recourse 10,982 13,544 153 271
(a) At December 31, 2010 and 2009, represents the contractual amount net of risk participations totaling $542 million and $643 million, respectively, for other unfunded com-mitments to extend credit; $22.4 billion and $24.6 billion, respectively, for standby letters of credit and other financial guarantees; and $1.1 billion and $690 million, respec-tively, for other letters of credit. In regulatory filings with the Federal Reserve Board these commitments are shown gross of risk participations.
(b) Upon the adoption of the accounting guidance related to VIEs, $24.2 billion of lending-related commitments between the Firm and Firm-administered multi-seller conduits were eliminated upon consolidation. The decrease in lending-related commitments was partially offset by the addition of $6.5 billion of unfunded commit-ments directly between the multi-seller conduits and clients; these unfunded commitments of the consolidated conduits are now included as off–balance sheet lending-related commitments of the Firm. The carrying value of asset purchase agreements of $126 million at December 31, 2009 was comprised of $18 million for the allowance for lending-related commitments; and $108 million for the guarantee liability and corresponding asset.

Notes to consolidated financial statements
JPMorgan Chase & Co./2010 Annual Report 276
(c) Includes credit enhancements and bond and commercial paper liquidity commitments to U.S. states and municipalities, hospitals and other not-for-profit entities of $43.4 billion and $44.1 billion, at December 31, 2010 and 2009, respectively.
(d) At December 31, 2010 and 2009, includes unissued standby letters of credit commitments of $41.6 billion and $38.4 billion, respectively. (e) At December 31, 2010 and 2009, JPMorgan Chase held collateral relating to $37.8 billion and $31.5 billion, respectively, of standby letters of credit; and $2.1 billion and
$1.3 billion, respectively, of other letters of credit. (f) At December 31, 2010 and 2009, collateral held by the Firm in support of securities lending indemnification agreements was $185.0 billion and $173.2 billion, respectively.
Securities lending collateral comprises primarily cash, and securities issued by governments that are members of the Organisation for Economic Co-operation and Development (“OECD”) and U.S. government agencies.
(g) Represents notional amounts of derivatives qualifying as guarantees. The carrying value at December 31, 2010 and 2009, reflects derivative payables of $390 million and $974 million, respectively, less derivative receivables of $96 million and $78 million, respectively.
(h) At December 31, 2010 and 2009, includes unfunded commitments of $1.0 billion and $1.5 billion, respectively, to third-party private equity funds that are generally fair valued at net asset value as discussed in Note 3 on pages 170–187 of this Annual Report; and $1.4 billion and $897 million, respectively, to other equity investments.
(i) Amounts include letters of credit hedged by derivative transactions and managed on a market risk basis. (j) Represents estimated repurchase liability related to indemnifications for breaches of representations and warranties in loan sale and securitization agreements. For
additional information, see Loan sale and securitization-related indemnifications on pages 278–279 of this Note. (k) The prior period has been revised to conform to current presentation. (l) For lending-related products the carrying value represents the allowance for lending-related commitments and the fair value of the guarantee liability, for derivative-related
products the carrying value represents the fair value. For all other products the carrying value represents the valuation reserve.
Other unfunded commitments to extend credit
Other unfunded commitments to extend credit are generally com-
prised of commitments for working capital and general corporate
purposes as well as extensions of credit to support commercial
paper facilities and bond financings in the event that those obliga-
tions cannot be remarketed to new investors.
Also included in other unfunded commitments to extend credit are
commitments to noninvestment-grade counterparties in connection
with leveraged and acquisition finance activities which were $5.9
billion and $7.0 billion at December 31, 2010 and 2009, respec-
tively. For further information, see Note 3 and Note 4 on pages
170–187 and 187–189 respectively, of this Annual Report.
Guarantees
U.S. GAAP requires that a guarantor recognize, at the inception of
a guarantee, a liability in an amount equal to the fair value of the
obligation undertaken in issuing the guarantee. U.S. GAAP defines
a guarantee as a contract that contingently requires the guarantor
to pay a guaranteed party based upon: (a) changes in an underlying
asset, liability or equity security of the guaranteed party; or (b) a
third party’s failure to perform under a specified agreement. The
Firm considers the following off–balance sheet lending-related
arrangements to be guarantees under U.S. GAAP: certain asset
purchase agreements, standby letters of credit and financial guar-
antees, securities lending indemnifications, certain indemnification
agreements included within third-party contractual arrangements
and certain derivative contracts.
As required by U.S. GAAP, the Firm initially records guarantees at
the inception date fair value of the obligation assumed (e.g., the
amount of consideration received, the net present value of the
premium receivable). For certain types of guarantees, the Firm
records this fair value amount in other liabilities with an offsetting
entry recorded in cash (for premiums received), or other assets (for
premiums receivable). Any premium receivable recorded in other
assets is reduced as cash is received under the contract, and the fair
value of the liability recorded at inception is amortized into income
as lending- and deposit-related fees over the life of the guarantee
contract. For indemnifications provided in sales agreements, a
portion of the sale proceeds is allocated to the guarantee, which
adjusts the gain or loss that would otherwise result from the trans-
action. For these indemnifications, the initial liability is amortized to
income as the Firm’s risk is reduced (i.e., over time or when the
indemnification expires). Any contingent liability that exists as a
result of issuing the guarantee or indemnification is recognized
when it become probable and reasonably estimable. The contingent
portion of the liability is not recognized if the estimated amount is
less than the carrying amount of the liability recognized at inception
(adjusted for any amortization). The recorded amounts of the
liabilities related to guarantees and indemnifications at December
31, 2010 and 2009, excluding the allowance for credit losses on
lending-related commitments, are discussed in footnote (b) to the
table above and below in this Note on pages 276–280.
Standby letters of credit
Standby letters of credit (“SBLC”) and other financial guarantees
are conditional lending commitments issued by the Firm to guaran-
tee the performance of a customer to a third party under certain
arrangements, such as commercial paper facilities, bond financings,
acquisition financings, trade and similar transactions. The carrying
values of standby and other letters of credit were $707 million and
$920 million at December 31, 2010 and 2009, respectively, which
were classified in accounts payable and other liabilities on the
Consolidated Balance Sheets; these carrying values include $347
million and $553 million, respectively, for the allowance for lend-
ing-related commitments, and $360 million and $367 million,
respectively, for the guarantee liability and corresponding asset.

JPMorgan Chase & Co./2010 Annual Report 277
The following table presents standby letters of credit and other letters of credit arrangements by the ratings profiles of the Firm’s customers as
of December 31, 2010 and 2009.
Standby letters of credit and other financial guarantees and other letters of credit
2010 2009
December 31, (in millions)
Standby letters of credit and other
financial guarantees Other letters
of credit
Standby letters of credit and other financial guarantees
Other letters of credit
Investment-grade(a) $ 70,236 $ 5,289 $ 66,786 $ 3,861
Noninvestment-grade(a) 24,601 1,374 24,699 1,306
Total contractual amount(b) 94,837(c) 6,663 91,485(c) 5,167Allowance for lending-related commitments 345 2 552 1Commitments with collateral 37,815 2,127 31,454 1,315
(a) The ratings scale is based on the Firm’s internal ratings which generally correspond to ratings as defined by S&P and Moody’s. (b) At December 31, 2010 and 2009, represents the contractual amount net of risk participations totaling $22.4 billion and $24.6 billion, respectively, for standby letters of
credit and other financial guarantees; and $1.1 billion and $690 million, respectively, for other letters of credit. In regulatory filings with the Federal Reserve these commitments are shown gross of risk participations.
(c) At December 31, 2010 and 2009, includes unissued standby letters of credit commitments of $41.6 billion and $38.4 billion, respectively.
Indemnification agreements – general
In connection with issuing securities to investors, the Firm may enter
into contractual arrangements with third parties that require the Firm
to make a payment to them in the event of a change in tax law or an
adverse interpretation of tax law. In certain cases, the contract also
may include a termination clause, which would allow the Firm to
settle the contract at its fair value in lieu of making a payment under
the indemnification clause. The Firm may also enter into indemnifica-
tion clauses in connection with the licensing of software to clients
(“software licensees”) or when it sells a business or assets to a third
party (“third-party purchasers”), pursuant to which it indemnifies
software licensees for claims of liability or damages that may occur
subsequent to the licensing of the software, or third-party purchasers
for losses they may incur due to actions taken by the Firm prior to the
sale of the business or assets. It is difficult to estimate the Firm’s
maximum exposure under these indemnification arrangements, since
this would require an assessment of future changes in tax law and
future claims that may be made against the Firm that have not yet
occurred. However, based on historical experience, management
expects the risk of loss to be remote.
Securities lending indemnification
Through the Firm’s securities lending program, customers’ securi-
ties, via custodial and non-custodial arrangements, may be lent to
third parties. As part of this program, the Firm provides an indemni-
fication in the lending agreements which protects the lender
against the failure of the third-party borrower to return the lent
securities in the event the Firm did not obtain sufficient collateral.
To minimize its liability under these indemnification agreements,
the Firm obtains cash or other highly liquid collateral with a market
value exceeding 100% of the value of the securities on loan from
the borrower. Collateral is marked to market daily to help assure
that collateralization is adequate. Additional collateral is called
from the borrower if a shortfall exists, or collateral may be released
to the borrower in the event of overcollateralization. If a borrower
defaults, the Firm would use the collateral held to purchase re-
placement securities in the market or to credit the lending customer
with the cash equivalent thereof. Also, as part of this program, the
Firm invests cash collateral received from the borrower in accor-
dance with approved guidelines.
Derivatives qualifying as guarantees
In addition to the contracts described above, the Firm transacts
certain derivative contracts that meet the characteristics of a guar-
antee under U.S. GAAP. These contracts include written put options
that require the Firm to purchase assets upon exercise by the option
holder at a specified price by a specified date in the future. The
Firm may enter into written put option contracts in order to meet
client needs, or for trading purposes. The terms of written put
options are typically five years or less. Derivative guarantees also
include contracts such as stable value derivatives that require the
Firm to make a payment of the difference between the market
value and the book value of a counterparty’s reference portfolio of
assets in the event that market value is less than book value and
certain other conditions have been met. Stable value derivatives,
commonly referred to as “stable value wraps”, are transacted in
order to allow investors to realize investment returns with less
volatility than an unprotected portfolio and are typically longer-term
or may have no stated maturity, but allow the Firm to terminate the
contract under certain conditions.
Derivative guarantees are recorded on the Consolidated Balance
Sheets at fair value in trading assets and trading liabilities. The
total notional amount of the derivatives that the Firm deems to be
guarantees was $87.8 billion and $98.1 billion at December 31,
2010 and 2009, respectively. The notional amount generally repre-
sents the Firm’s maximum exposure to derivatives qualifying as
guarantees. However, exposure to certain stable value derivatives is
contractually limited to a substantially lower percentage of the
notional amount; the notional amount on these stable value con-
tracts was $25.9 billion and $24.9 billion and the maximum expo-
sure to loss was $2.7 billion and $2.5 billion, at December 31,
2010 and 2009, respectively. The fair values of the contracts re-
flects the probability of whether the Firm will be required to per-
form under the contract. The fair value related to derivative
guarantees were derivative payables of $390 million and $974 mil-
lion and derivative receivables of $96 million and $78 million at

Notes to consolidated financial statements
JPMorgan Chase & Co./2010 Annual Report 278
December 31, 2010 and 2009, respectively. The Firm reduces expo-
sures to these contracts by entering into offsetting transactions, or by
entering into contracts that hedge the market risk related to the
derivative guarantees.
In addition to derivative contracts that meet the characteristics of
a guarantee, the Firm is both a purchaser and seller of credit
protection in the credit derivatives market. For a further discus-
sion of credit derivatives, see Note 6 on pages 191–199 of this
Annual Report.
Unsettled reverse repurchase and securities borrowing
agreements
In the normal course of business, the Firm enters into reverse
repurchase agreements and securities borrowing agreements that
settle at a future date. At settlement, these commitments require
that the Firm advance cash to and accept securities from the
counterparty. These agreements generally do not meet the defini-
tion of a derivative, and therefore, are not recorded on the Con-
solidated Balance Sheets until settlement date. At December 31,
2010 and 2009, the amount of commitments related to forward
starting reverse repurchase agreements and securities borrowing
agreements were $14.4 billion and $23.4 billion, respectively.
Commitments related to unsettled reverse repurchase agreements
and securities borrowing agreements with regular way settlement
periods were $25.5 billion and $24.8 billion at December 31,
2010 and 2009, respectively.
Building purchase commitments
In connection with the Bear Stearns merger, the Firm succeeded to an
operating lease arrangement for the building located at 383 Madison
Avenue in New York City (the “Synthetic Lease”). Under the terms of
the Synthetic Lease, the Firm was obligated to a maximum residual
value guarantee of approximately $670 million if the building were
sold and the proceeds of the sale were insufficient to satisfy the
lessor’s debt obligation. Effective November 1, 2010, the lease ex-
pired and the Firm purchased the property recognizing the $670
million purchase price in premises and equipment.
On December 15, 2010, the Firm entered into an agreement to
purchase the leasehold property at 60 Victoria Embankment in
London, a building the Firm has leased since 1991, for approxi-
mately $253 million. The purchase of this building is expected to
close in the second quarter of 2011.
Loan sale and securitization-related indemnifications
Indemnifications for breaches of representations and warranties
In connection with the Firm’s loan sale and securitization activities
with the GSEs and other loan sale and private-label securitization
transactions, as described in Notes 14 and 16 on pages 220–238
and 244–259, respectively, of this Annual Report, the Firm has
made representations and warranties that the loans sold meet
certain requirements. For transactions with the GSEs, these repre-
sentations include type of collateral, underwriting standards, valid-
ity of certain borrower representations in connection with the loan,
that primary mortgage insurance is in force for any mortgage loan
with an LTV ratio greater than 80%, and the use of the GSEs’
standard legal documentation. The Firm may be, and has been,
required to repurchase loans and/or indemnify the GSEs and other
investors for losses due to material breaches of these representa-
tions and warranties; however, predominantly all of the repurchase
demands received by the Firm and the Firm’s losses realized to date
are related to loans sold to the GSEs. Generally, the maximum
amount of future payments the Firm would be required to make for
breaches of these representations and warranties would be equal
to the unpaid principal balance of such loans that are deemed to
have defects sold to purchasers (including securitization-related
SPEs) plus, in certain circumstances, accrued and unpaid interest on
such loans and certain expense.
Subsequent to the Firm’s acquisition of certain assets and liabilities of
Washington Mutual from the FDIC in September 2008, the Firm
resolved and/or limited certain current and future repurchase de-
mands for loans sold to the GSEs by Washington Mutual, although it
remains the Firm’s position that such obligations remain with the
FDIC receivership. Nevertheless, certain payments have been made
with respect to certain of the then current and future repurchase
demands, and the Firm will continue to evaluate and may pay
certain future repurchase demands related to individual loans. In
addition to the payments already made, the Firm has a remaining
repurchase liability of approximately $190 million as of December 31,
2010, relating to unresolved and future demands on the Washington
Mutual portfolio.
The primary reasons for repurchase demands from the GSEs relate to
alleged misrepresentations primarily driven by: (i) credit quality and/or
undisclosed debt of the borrower; (ii) income level and/or employ-
ment status of the borrower; and (iii) appraised value of collateral.
Ineligibility of the borrower for the particular product, mortgage
insurance rescissions and missing documentation are other reasons
for repurchase demands.
Beginning in 2009, mortgage insurers more frequently rescinded
mortgage insurance coverage. The successful rescission of mortgage
insurance typically results in a violation of representations and war-
ranties made to the GSEs and, therefore, has been a significant cause
of repurchase demands from the GSEs. The Firm actively reviews all
rescission notices from mortgage insurers and contests them when
appropriate. In addition, the Firm is engaged in discussions with
various mortgage insurers on their rights and practices related to
rescinding mortgage insurance coverage. The Firm has entered into
agreements with two mortgage insurers to make processes more
efficient and reduce exposure on claims on certain portfolios for
which the Firm is a servicer. The impact of these agreements is re-
flected in the repurchase liability as of December 31, 2010.
When the Firm accepts a repurchase demand from one of the GSEs,
the Firm may either (a) repurchase the loan or the underlying col-
lateral from the GSE at the unpaid principal balance of the loan
plus accrued interest, or (b) reimburse the GSE for its realized loss
on a liquidated property (a “make-whole” payment).
To estimate the Firm’s repurchase liability arising from breaches of
representations and warranties, the Firm considers:

JPMorgan Chase & Co./2010 Annual Report 279
(i) the level of current unresolved repurchase demands and mortgage
insurance rescission notices,
(ii) estimated probable future repurchase demands based upon loans
that are or ever have been 90 days past due considering historical
experience,
(iii) the potential ability of the Firm to cure the defects identified in the
repurchase demands,
(iv) the estimated severity of loss upon repurchase of the loan or collat-
eral, make-whole settlement, or indemnification,
(v) the Firm’s potential ability to recover its losses from third-party
originators, and
(vi) the terms of agreements with certain mortgage insurers and other
parties.
Based on these factors, the Firm has recognized a repurchase
liability of $3.3 billion and $1.7 billion, including the Washington
Mutual liability described above, as of December 31, 2010 and
2009, respectively, which is reported in accounts payable and other
liabilities net of probable recoveries from third parties.
Substantially all of the estimates and assumptions underlying the
Firm’s established methodology for computing its recorded repur-
chase liability – including factors such as the amount of probable
future demands from purchasers, the ability of the Firm to cure
identified defects, the severity of loss upon repurchase or foreclo-
sure, and recoveries from third parties – require application of a
significant level of management judgment. Estimating the repur-
chase liability is further complicated by limited and rapidly changing
historical data and uncertainty surrounding numerous external
factors, including: (i) macro-economic factors, and (ii) the level of
future demands, which is dependent, in part, on actions taken by
third parties such as the GSEs and mortgage insurers. While the
Firm uses the best information available to it in estimating its
repurchase liability, the estimation process is inherently uncertain
and imprecise and, accordingly, losses in excess of the amounts
accrued as of December 31, 2010 are reasonably possible.
The Firm believes the estimate of the range of reasonably possible
losses, in excess of reserves established, for its repurchase liability is
from $0 to approximately $2 billion at December 31, 2010. This
estimated range of reasonably possible loss is based on an as-
sumed peak to trough decline in home prices of 46%, which is an
additional 12 percentage point decline in home prices beyond the
Firm’s current assumptions. Such a decline could increase the level
of loan delinquencies, thereby potentially increasing the repurchase
demand rate from the GSEs and increasing loss severity on repur-
chased loans, each of which could affect the Firm’s repurchase
liability. The Firm does not consider such a further decline in home
prices to be likely to occur, and actual repurchase losses could vary
significantly from the Firm’s recorded repurchase liability or this
estimate of reasonably possible additional losses, depending on the
outcome of various factors, including those considered above.
The following table summarizes the change in the repurchase
liability for each of the periods presented.
Summary of changes in repurchase liability
Year ended December 31, (in millions) 2010 2009 2008 Repurchase liability at begin-
ning of period $ 1,705 $ 1,093 $ 15
Realized losses(a) (1,423) (1,253)(c) (155)
Provision for repurchase losses 3,003 1,865 1,233(d) Repurchase liability at end
of period $ 3,285(b) $ 1,705 $ 1,093
(a) Includes principal losses and accrued interest on repurchased loans, “make-whole” settlements, settlements with claimants, and certain related expense. For the years ended December 31, 2010, 2009 and 2008, make-whole settlements were $632 million, $277 million and $34 million, respectively.
(b) Includes $190 million at December 31, 2010, related to future demands on loans sold by Washington Mutual to the GSEs.
(c) Includes the Firm’s resolution of certain current and future repurchase demands for certain loans sold by Washington Mutual.
(d) Includes a repurchase liability assumed for certain loans sold by Washington Mutual; this assumed liability was reported as a reduction of the extraordinary gain rather than as a charge to the provision for credit losses.
Loans sold with recourse
The Firm provides servicing for mortgages and certain commercial
lending products on both a recourse and nonrecourse basis. In
nonrecourse servicing, the principal credit risk to the Firm is the
cost of temporary servicing advances of funds (i.e., normal servic-
ing advances). In recourse servicing, the servicer agrees to share
credit risk with the owner of the mortgage loans, such as Fannie
Mae or Freddie Mac or a private investor, insurer or guarantor.
Losses on recourse servicing predominantly occur when foreclo-
sure sales proceeds of the property underlying a defaulted loan
are less than the sum of the outstanding principal balance, plus
accrued interest on the loan and the cost of holding and dispos-
ing of the underlying property. The Firm’ s securitizations are
predominantly nonrecourse, thereby effectively transferring the
risk of future credit losses to the purchaser of the mortgage-
backed securities issued by the trust. At December 31, 2010 and
2009, the unpaid principal balance of loans sold with recourse
totaled $11.0 billion and $13.5 billion, respectively. The carrying
value of the related liability that the Firm has recorded, which is
representative of the Firm’ s view of the likelihood it will have to
perform under this guarantee, was $153 million and $271 million
at December 31, 2010 and 2009, respectively.
Credit card charge-backs
Prior to November 1, 2008, the Firm was a partner with one of
the leading companies in electronic payment services in a joint
venture operating under the name of Chase Paymentech Solu-
tions, LLC (the “joint venture”). The joint venture provided mer-
chant processing services in the U.S. and Canada. The dissolution
of the joint venture was completed on November 1, 2008, and
JPMorgan Chase retained approximately 51% of the business
under the Chase Paymentech name.

Notes to consolidated financial statements
JPMorgan Chase & Co./2010 Annual Report 280
Under the rules of Visa USA, Inc., and MasterCard International,
JPMorgan Chase Bank, N.A., is liable primarily for the amount of
each processed credit card sales transaction that is the subject of a
dispute between a cardmember and a merchant. If a dispute is
resolved in the cardmember’s favor, Chase Paymentech will
(through the cardmember’s issuing bank) credit or refund the
amount to the cardmember and will charge back the transaction to
the merchant. If Chase Paymentech is unable to collect the amount
from the merchant, Chase Paymentech will bear the loss for the
amount credited or refunded to the cardmember. Chase Paymen-
tech mitigates this risk by withholding future settlements, retaining
cash reserve accounts or by obtaining other security. However, in
the unlikely event that: (1) a merchant ceases operations and is
unable to deliver products, services or a refund; (2) Chase Paymen-
tech does not have sufficient collateral from the merchant to pro-
vide customer refunds; and (3) Chase Paymentech does not have
sufficient financial resources to provide customer refunds, JPMor-
gan Chase Bank, N.A., would be liable for the amount of the
transaction. For the year ended December 31, 2010, Chase Pay-
mentech incurred aggregate credit losses of $12 million on $469.3
billion of aggregate volume processed, and at December 31, 2010,
it held $189 million of collateral. For the year ended December 31,
2009, Chase Paymentech incurred aggregate credit losses of $11
million on $409.7 billion of aggregate volume processed, and at
December 31, 2009, it held $213 million of collateral. For the year
ended December 31, 2008, Chase Paymentech incurred aggregate
credit losses of $13 million on $713.9 billion of aggregate volume
processed, and at December 31, 2008, it held $222 million of
collateral. The Firm believes that, based on historical experience
and the collateral held by Chase Paymentech, the fair value of the
Firm’s charge back-related obligations, which are representative of
the payment or performance risk to the Firm, is immaterial.
Exchange and clearinghouse guarantees
The Firm is a member of several securities and futures exchanges
and clearinghouses, both in the U.S. and other countries. Member-
ship in some of these organizations requires the Firm to pay a pro
rata share of the losses incurred by the organization as a result of
the default of another member. Such obligations vary with different
organizations. These obligations may be limited to members who
dealt with the defaulting member or to the amount (or a multiple of
the amount) of the Firm’s contribution to a member’s guarantee
fund, or, in a few cases, the obligation may be unlimited. It is
difficult to estimate the Firm’s maximum exposure under these
membership agreements, since this would require an assessment of
future claims that may be made against the Firm that have not yet
occurred. However, based on historical experience, management
expects the risk of loss to be remote.
Note 31 – Commitments, pledged assets, collateral and contingencies
Lease commitments
At December 31, 2010, JPMorgan Chase and its subsidiaries were
obligated under a number of noncancelable operating leases for
premises and equipment used primarily for banking purposes, and
for energy-related tolling service agreements. Certain leases contain
renewal options or escalation clauses providing for increased rental
payments based on maintenance, utility and tax increases, or they
require the Firm to perform restoration work on leased premises.
No lease agreement imposes restrictions on the Firm’s ability to pay
dividends, engage in debt or equity financing transactions or enter
into further lease agreements.
The following table presents required future minimum rental pay-
ments under operating leases with noncancelable lease terms that
expire after December 31, 2010.
Year ended December 31, (in millions) 2011 $ 1,884 2012 1,804 2013 1,674 2014 1,497 2015 1,363 After 2015 7,778
Total minimum payments required(a) 16,000 Less: Sublease rentals under noncancelable subleases (1,848) Net minimum payment required $ 14,152
(a) Lease restoration obligations are accrued in accordance with U.S. GAAP, and are not reported as a required minimum lease payment.
Total rental expense was as follows.
Year ended December 31, (in millions) 2010 2009 2008 Gross rental expense $ 2,212 $ 1,884 $ 1,917 Sublease rental income (545) (172) (415) Net rental expense $ 1,667 $ 1,712 $ 1,502

JPMorgan Chase & Co./2010 Annual Report 281
Pledged assets
At December 31, 2010, assets were pledged to collateralize repur-
chase agreements, other securities financing agreements, derivative
transactions and for other purposes, including to secure borrowings
and public deposits. Certain of these pledged assets may be sold or
repledged by the secured parties and are identified as financial
instruments owned (pledged to various parties) on the Consoli-
dated Balance Sheets. In addition, at December 31, 2010 and
2009, the Firm had pledged $288.7 billion and $344.6 billion,
respectively, of financial instruments it owns that may not be sold
or repledged by the secured parties. The significant components of
the Firm’s pledged assets were as follows.
December 31, (in billions) 2010 2009Securities $ 112.1 $ 155.3Loans 214.8 285.5Trading assets and other 123.2 84.6
Total assets pledged(a) $ 450.1 $ 525.4
(a) Total assets pledged do not include assets of consolidated VIEs; these assets are used to settle the liabilities of those entities. See Note 16 on pages 244–259 of this Annual Report for additional information on assets and liabilities of consolidated VIEs.
Collateral
At December 31, 2010 and 2009, the Firm had accepted assets as
collateral that it could sell or repledge, deliver or otherwise use
with a fair value of approximately $655.0 billion and
$635.6 billion, respectively. This collateral was generally obtained
under resale agreements, securities borrowing agreements, cus-
tomer margin loans and derivative agreements. Of the collateral
received, approximately $521.3 billion and $472.7 billion were sold
or repledged, generally as collateral under repurchase agreements,
securities lending agreements or to cover short sales and to collat-
eralize deposits and derivative agreements. The reporting of collat-
eral sold or repledged was revised in 2010 to include certain
securities used to cover short sales and to collateralize deposits and
derivative agreements. Prior period amounts have been revised to
conform to the current presentation. This revision had no impact on
the Firm’s Consolidated Balance Sheets or its results of operations.
Contingencies
In 2008, the Firm resolved with the IRS issues related to compliance
with reporting and withholding requirements for certain accounts
transferred to The Bank of New York Mellon Corporation (“BNYM”)
in connection with the Firm’s sale to BNYM of its corporate trust
business. The resolution of these issues did not have a material
effect on the Firm.

Notes to consolidated financial statements
282 JPMorgan Chase & Co./2010 Annual Report
Note 32 – Litigation
As of December 31, 2010, the Firm and its subsidiaries are defen-
dants or putative defendants in more than 10,000 legal proceed-
ings, in the form of regulatory/government investigations as well as
private, civil litigations. The litigations range from individual actions
involving a single plaintiff to class action lawsuits with potentially
millions of class members. Investigations involve both formal and
informal proceedings, by both governmental agencies and self-
regulatory organizations. These legal proceedings are at varying
stages of adjudication, arbitration or investigation, and involve
each of the Firm’s lines of business and geographies and a wide
variety of claims (including common law tort and contract claims
and statutory antitrust, securities and consumer protection claims),
some of which present novel claims or legal theories.
The Firm believes the estimate of the aggregate range of reasona-
bly possible losses, in excess of reserves established, for its legal
proceedings is from $0 to approximately $4.5 billion at December
31, 2010. This estimated aggregate range of reasonably possible
losses is based upon currently available information for those
proceedings in which the Firm is involved, taking into account the
Firm’s best estimate of such losses for those cases for which such
estimate can be made. For certain cases, the Firm does not believe
that an estimate can currently be made. The Firm’s estimate in-
volves significant judgment, given the varying stages of the pro-
ceedings (including the fact that many of them are currently in
preliminary stages), the existence of multiple defendants (including
the Firm) in many of such proceedings whose share of liability has
yet to be determined, the numerous yet-unresolved issues in many
of the proceedings (including issues regarding class certification
and the scope of many of the claims), and the attendant uncer-
tainty of the various potential outcomes of such proceedings.
Accordingly, the Firm’s estimate will change from time to time, and
actual losses may be more than the current estimate.
Set forth below are descriptions of the Firm’s material legal pro-
ceedings.
Auction-Rate Securities Investigations and Litigation. Beginning in
March 2008, several regulatory authorities initiated investigations
of a number of industry participants, including the Firm, concerning
possible state and federal securities law violations in connection
with the sale of auction-rate securities. The market for many such
securities had frozen and a significant number of auctions for those
securities began to fail in February 2008.
The Firm, on behalf of itself and affiliates, agreed to a settlement in
principle with the New York Attorney General’s Office which pro-
vided, among other things, that the Firm would offer to purchase at
par certain auction-rate securities purchased from J.P. Morgan
Securities LLC (“JPMorgan Securities”; formerly J.P. Morgan Securi-
ties Inc.), Chase Investment Services Corp. and Bear, Stearns & Co.
Inc. by individual investors, charities and small- to medium-sized
businesses. The Firm also agreed to a substantively similar settle-
ment in principle with the Office of Financial Regulation for the
State of Florida and the North American Securities Administrator
Association (“NASAA”) Task Force, which agreed to recommend
approval of the settlement to all remaining states, Puerto Rico and
the U.S. Virgin Islands. The Firm has finalized the settlement
agreements with the New York Attorney General’s Office and the
Office of Financial Regulation for the State of Florida. The settle-
ment agreements provide for the payment of penalties totaling $25
million to all states. The Firm is currently in the process of finalizing
consent agreements with NASAA’s member states; over 40 of these
consent agreements have been finalized to date.
The Firm also faces a number of civil actions relating to the Firm’s
sales of auction-rate securities, including a putative securities class
action in the United States District Court for the Southern District of
New York that seeks unspecified damages, and individual arbitrations
and lawsuits in various forums brought by institutional and individual
investors that, together, seek damages totaling more than $200
million relating to the Firm’s sales of auction-rate securities. One
action is brought by an issuer of auction-rate securities. The actions
generally allege that the Firm and other firms manipulated the market
for auction-rate securities by placing bids at auctions that affected
these securities’ clearing rates or otherwise supported the auctions
without properly disclosing these activities. Some actions also allege
that the Firm misrepresented that auction-rate securities were short-
term instruments. The Firm has filed motions to dismiss each of the
actions, which are being coordinated before the Southern District.
These motions are currently pending.
Additionally, the Firm was named in two putative antitrust class
actions in the United States District Court for the Southern District
of New York. The actions allege that the Firm, along with numerous
other financial institution defendants, colluded to maintain and
stabilize the auction-rate securities market and then to withdraw
their support for the auction-rate securities market. In January
2010, the District Court dismissed both actions. The Second Circuit
Court of Appeals consolidated the two appeals. That appeal is
currently pending.
Bear Stearns Hedge Fund Matters. Bear Stearns, certain current or
former subsidiaries of Bear Stearns, including Bear Stearns Asset
Management, Inc. (“BSAM”) and Bear, Stearns & Co. Inc., and
certain current or former Bear Stearns employees are named defen-
dants (collectively the “Bear Stearns defendants”) in multiple civil
actions and arbitrations relating to alleged losses of more than $1
billion resulting from the failure of the Bear Stearns High Grade
Structured Credit Strategies Master Fund, Ltd. (the “High Grade
Fund”) and the Bear Stearns High Grade Structured Credit Strate-
gies Enhanced Leverage Master Fund, Ltd. (the “Enhanced Lever-
age Fund”) (collectively, the “Funds”). BSAM served as investment
manager for both of the Funds, which were organized such that
there were U.S. and Cayman Islands “feeder funds” that invested
substantially all their assets, directly or indirectly, in the Funds. The
Funds are in liquidation.
There are currently four civil actions pending in the United States
District Court for the Southern District of New York relating to the
Funds. Two of these actions involve derivative lawsuits brought on
behalf of purchasers of partnership interests in the two U.S. feeder

JPMorgan Chase & Co./2010 Annual Report 283
funds, alleging that the Bear Stearns defendants mismanaged the
Funds and made material misrepresentations to and/or withheld
information from investors in the feeder funds. These actions seek,
among other things, unspecified compensatory damages based on
alleged investor losses. The third action, brought by the Joint Vol-
untary Liquidators of the Cayman Islands feeder funds, makes
allegations similar to those asserted in the derivative lawsuits
related to the U.S. feeder funds, and seeks compensatory and
punitive damages. Motions to dismiss in these three cases have
been granted in part and denied in part. An agreement in principle
has been reached, pursuant to which BSAM would pay a maximum
of approximately $19 million to settle the one derivative action
relating to the feeder fund to the High Grade Fund. BSAM has
reserved the right not to proceed with this settlement if plaintiff is
unable to secure the participation of investors whose net contribu-
tions meet a prescribed percentage of the aggregate net contribu-
tions to the High Grade Fund. The agreement in principle remains
subject to documentation and approval by the Court. Discovery in
the other two actions is ongoing.
The fourth action was brought by Bank of America and Banc of
America Securities LLC (together “BofA”) alleging breach of contract
and fraud in connection with a May 2007 $4 billion securitization,
known as a “CDO-squared,” for which BSAM served as collateral
manager. This securitization was composed of certain collateralized
debt obligation (“CDO”) holdings that were purchased by BofA from
the Funds. Bank of America seeks in excess of $3 billion in damages.
Defendants’ motion to dismiss in this action was largely denied, an
amended complaint was filed and discovery is ongoing.
Bear Stearns Shareholder Litigation and Related Matters. Various
shareholders of Bear Stearns have commenced purported class
actions against Bear Stearns and certain of its former officers
and/or directors on behalf of all persons who purchased or other-
wise acquired common stock of Bear Stearns between December
14, 2006 and March 14, 2008 (the “Class Period”). During the
Class Period Bear Stearns had between 115 and 120 million com-
mon shares outstanding, and the price of those securities declined
from a high of $172.61 to a low of $30 at the end of the period.
The actions, originally commenced in several federal courts, allege
that the defendants issued materially false and misleading state-
ments regarding Bear Stearns’ business and financial results and
that, as a result of those false statements, Bear Stearns’ common
stock traded at artificially inflated prices during the Class Period.
Separately, several individual shareholders of Bear Stearns have
commenced or threatened to commence arbitration proceedings
and lawsuits asserting claims similar to those in the putative class
actions. In addition, Bear Stearns and certain of its former officers
and/or directors have also been named as defendants in a number
of purported class actions commenced in the United States District
Court for the Southern District of New York seeking to represent
the interests of participants in the Bear Stearns Employee Stock
Ownership Plan (“ESOP”) during the time period of December
2006 to March 2008. These actions, brought under the Employee
Retirement Income Security Act (“ERISA”), allege that defendants
breached their fiduciary duties to plaintiffs and to the other partici-
pants and beneficiaries of the ESOP by (a) failing to manage pru-
dently the ESOP’s investment in Bear Stearns securities; (b) failing
to communicate fully and accurately about the risks of the ESOP’s
investment in Bear Stearns stock; (c) failing to avoid or address
alleged conflicts of interest; and (d) failing to monitor those who
managed and administered the ESOP.
Bear Stearns, former members of Bear Stearns’ Board of Directors
and certain of Bear Stearns’ former executive officers have also
been named as defendants in two purported shareholder derivative
suits, subsequently consolidated into one action, pending in the
United States District Court for the Southern District of New York.
Plaintiffs are asserting claims for breach of fiduciary duty, violations
of federal securities laws, waste of corporate assets and gross
mismanagement, unjust enrichment, abuse of control and indemni-
fication and contribution in connection with the losses sustained by
Bear Stearns as a result of its purchases of subprime loans and
certain repurchases of its own common stock. Certain individual
defendants are also alleged to have sold their holdings of Bear
Stearns common stock while in possession of material nonpublic
information. Plaintiffs seek compensatory damages in an unspeci-
fied amount. Plaintiffs later filed a second amended complaint
asserting, for the first time, purported class action claims, as well as
new allegations concerning events that took place in March 2008.
All of the above-described actions filed in federal courts were
ordered transferred and joined for pre-trial purposes before the
United States District Court for the Southern District of New York.
Defendants moved to dismiss the purported securities class action,
the shareholders’ derivative action and the ERISA action. In January
2011, the District Court granted the motions to dismiss the deriva-
tive and ERISA actions, and denied the motion as to the securities
action. Plaintiffs in the derivative action have filed a motion for
reconsideration of the dismissal. Discovery will now commence in
the securities action.
City of Milan Litigation and Criminal Investigation. In January 2009,
the City of Milan, Italy (the “City”) issued civil proceedings against
(among others) JPMorgan Chase Bank, N.A. and J.P. Morgan
Securities Ltd. (together, “JPMorgan Chase”) in the District Court
of Milan. The proceedings relate to (a) a bond issue by the City in
June 2005 (the “Bond”) and (b) an associated swap transaction,
which was subsequently restructured on a number of occasions
between 2005 and 2007 (the “Swap”). The City seeks damages
and/or other remedies against JPMorgan Chase (among others) on
the grounds of alleged “fraudulent and deceitful acts” and alleged
breach of advisory obligations by JPMorgan Chase (among others)
in connection with the Swap and the Bond, together with related
swap transactions with other counterparties. The civil proceedings
continue and there will be an initial hearing on March 9, 2011.
JPMorgan Chase Bank, N.A. will seek an adjournment on the
grounds that it has filed a challenge to the Italian Supreme Court’s
jurisdiction over JPMorgan Chase Bank, N.A., which has yet to be
decided. The judge directed four current and former JPMorgan
Chase personnel and JPMorgan Chase Bank, N.A. (as well as other
individuals and three other banks) to go forward to a full trial that

Notes to consolidated financial statements
284 JPMorgan Chase & Co./2010 Annual Report
started in May 2010. Although the Firm is not charged with any
crime and does not face criminal liability, if one or more of its
employees were found guilty, the Firm could be subject to adminis-
trative sanctions, including restrictions on its ability to conduct
business in Italy and monetary penalties. In the initial hearings, the
City successfully applied to join some of the claims in the civil
proceedings against the individuals and JPMorgan Chase Bank,
N.A. to the criminal proceedings. In addition, a consumer associa-
tion has also been given leave to join the criminal proceedings to
seek damages from the defendant banks.
Enron Litigation. JPMorgan Chase and certain of its officers and
directors are involved in several lawsuits that together seek sub-
stantial damages arising out of the Firm’s banking relationships
with Enron Corp. and its subsidiaries (“Enron”). A number of
actions and other proceedings against the Firm previously were
resolved, including a class action lawsuit captioned Newby v. Enron
Corp. and adversary proceedings brought by Enron’s bankruptcy
estate. The remaining Enron-related actions include individual
actions by Enron investors, an action by an Enron counterparty, and
a purported class action filed on behalf of JPMorgan Chase em-
ployees who participated in the Firm’s 401(k) plan asserting claims
under the ERISA for alleged breaches of fiduciary duties by JPMor-
gan Chase, its directors and named officers. That action has been
dismissed, and is on appeal to the United States Court of Appeals
for the Second Circuit.
Interchange Litigation. A group of merchants has filed a series of
putative class action complaints in several federal courts. The
complaints allege that VISA and MasterCard, as well as certain
other banks and their respective bank holding companies, con-
spired to set the price of credit and debit card interchange fees,
enacted respective association rules in violation of anti-trust laws,
and engaged in tying/bundling and exclusive dealing. The com-
plaint seeks unspecified damages and injunctive relief based on the
theory that interchange would be lower or eliminated but for the
challenged conduct. Based on publicly available estimates, Visa and
MasterCard branded payment cards generated approximately $40
billion of interchange fees industry-wide in 2009. All cases have
been consolidated in the United States District Court for the Eastern
District of New York for pretrial proceedings. The Court has dis-
missed all claims relating to periods prior to January 2004. The
Court has not yet ruled on motions relating to the remainder of the
case. Fact and expert discovery in the case have closed. The plain-
tiffs have filed a motion seeking class certification, and the defen-
dants have opposed that motion. The Court has not yet ruled on
the class certification motion.
In addition to the consolidated class action complaint, plaintiffs
filed supplemental complaints challenging the initial public offer-
ings (“IPOs”) of MasterCard and Visa (the “IPO Complaints”). With
respect to the MasterCard IPO, plaintiffs allege that the offering
violated Section 7 of the Clayton Act and Section 1 of the Sherman
Act and that the offering was a fraudulent conveyance. With re-
spect to the Visa IPO, plaintiffs are challenging the Visa IPO on
antitrust theories parallel to those articulated in the MasterCard
IPO pleading. Defendants have filed motions to dismiss the IPO
Complaints. The Court has not yet ruled on those motions.
Investment Management Litigation. Four cases have been filed
claiming that investment portfolios managed by JPMorgan Invest-
ment Management Inc. (“JPMorgan Investment Management”)
were inappropriately invested in securities backed by subprime
residential real estate collateral. Plaintiffs claim that JPMorgan
Investment Management and related defendants are liable for
losses of more than $1 billion in market value of these securities.
The first case was filed by NM Homes One, Inc. in federal District
Court in New York, and the Court granted JPMorgan Chase Bank,
N.A.’s motion to dismiss nine of plaintiff’s ten causes of action,
leaving a breach of contract claim. The Court thereafter granted the
plaintiff’s motion for reconsideration and reinstated the common
law non-fraud claims for breach of fiduciary duty, negligence, and
gross negligence. The plaintiff withdrew its claim for negligent
misrepresentation. The Firm has filed a renewed motion to dismiss
the common law non-fraud claims and a motion for judgment on
the pleadings as to the breach of contract claim. In the second
case, which was filed by Assured Guaranty (U.K.) in New York state
court, the New York State Appellate Division allowed plaintiff to
proceed with its claims for breach of fiduciary duty and gross negli-
gence, and for breach of contract based on alleged violations of the
Delaware Insurance Code. The Firm sought and has obtained leave
to appeal to the New York State Court of Appeals the decision by
the Appellate Division to allow the breach of fiduciary duty and
gross negligence claims to proceed. In the third case, filed by
Ambac Assurance UK Limited in New York state court, the lower
court granted JPMorgan Investment Management’s motion to
dismiss, and plaintiff has filed a notice of appeal. The fourth case
was filed by CMMF LLP in New York state court; the lower court
granted JPMorgan Investment Management’s motion to dismiss the
claims, other than claims for breach of contract and negligent
misrepresentation. The Appellate Division affirmed the lower
court’s decision. Plaintiff has since filed an amended complaint
seeking to assert claims under New York law for breach of fiduciary
duty, gross negligence, breach of contract and negligent misrepre-
sentation.
Lehman Brothers Bankruptcy Proceedings. In March 2010, the
Examiner appointed by the Bankruptcy Court presiding over the
Chapter 11 bankruptcy proceedings of Lehman Brothers Holdings
Inc (“LBHI”) and several of its subsidiaries (collectively, “Lehman”)
released a report as to his investigation into Lehman’s failure and
related matters. The Examiner concluded that one common law
claim potentially could be asserted against the Firm for contributing
to Lehman’s failure, though he characterized the claim as “not
strong.” The Examiner also opined that certain cash and securities
collateral provided by LBHI to the Firm in the weeks and days
preceding LBHI’s demise potentially could be challenged under the
Bankruptcy Code’s fraudulent conveyance or preference provisions,
though the Firm is of the view that its right to such collateral is
protected by the Bankruptcy Code’s safe harbor provisions. In May
2010, LBHI and its Official Committee of Unsecured Creditors filed
an adversary proceeding against JPMorgan Chase Bank, N.A. in the

JPMorgan Chase & Co./2010 Annual Report 285
United States Bankruptcy Court for the Southern District of New
York. The complaint asserts both federal bankruptcy law and state
common law claims, and seeks, among other relief, to recover $8.6
billion in collateral that was transferred to JPMorgan Chase Bank,
N.A. in the week preceding LBHI’s bankruptcy. The complaint also
seeks unspecified damages on the grounds that JPMorgan Chase
Bank, N.A.’s collateral requests hastened LBHI’s demise. The Firm
has moved to dismiss plaintiffs’ amended complaint in its entirety.
The Firm also filed counterclaims against LBHI alleging that LBHI
fraudulently induced the Firm to make large clearing advances to
Lehman against inappropriate collateral, which left the Firm with
more than $25 billion in claims against the estate of Lehman's
broker-dealer, which could be unpaid if the Firm is required to
return any collateral to Lehman. The case is in the early stages,
with a trial scheduled for 2012. In addition, the Firm may also face
claims in the liquidation proceeding pending before the same
Bankruptcy Court under the Securities Investor Protection Act
(“SIPA”) for LBHI’s U.S. broker-dealer subsidiary, Lehman Brothers
Inc. (“LBI”). The SIPA Trustee has advised the Firm that certain of
the securities and cash pledged as collateral for the Firm’s claims
against LBI may be customer property free from any security inter-
est in favor of the Firm. The Firm has also responded to various
regulatory inquiries regarding the Lehman matter.
Madoff Litigation. JPMorgan Chase & Co., JPMorgan Chase Bank,
N.A., JPMorgan Securities LLC, and JPMorgan Securities Ltd. have
been named as defendants in a lawsuit brought by the trustee for
the liquidation of Bernard L. Madoff Investment Securities LLC (the
“Trustee”). The Trustee asserts 28 causes of action against JPMor-
gan Chase, 16 of which seek to avoid certain transfers (direct or
indirect) made to JPMorgan Chase that are alleged to have been
preferential or fraudulent under the federal Bankruptcy Code and
the New York Debtor and Creditor Law. The remaining causes of
action are for, among other things, aiding and abetting fraud,
aiding and abetting breach of fiduciary duty, conversion and unjust
enrichment. The complaint generally alleges that JPMorgan Chase,
as Madoff’s long-time bank, facilitated the maintenance of Mad-
off’s Ponzi scheme and overlooked signs of wrongdoing in order to
obtain profits and fees. The complaint purports to seek approxi-
mately $6 billion in damages from JPMorgan Chase, and to recover
approximately $425 million in transfers that JPMorgan Chase
allegedly received directly or indirectly from Bernard Madoff’s
brokerage firm. JPMorgan Chase has filed a motion to return the
case from the Bankruptcy Court to the District Court, and intends to
seek the dismissal of all or most of the Trustee’s claims once that
motion is decided.
Separately, J.P. Morgan Trust Company (Cayman) Limited, JPMor-
gan (Suisse) SA, and J.P. Morgan Securities Ltd. have been named
as defendants in several suits in Bankruptcy Court and state and
federal courts in New York arising out of the liquidation proceed-
ings of Fairfield Sentry Limited and Fairfield Sigma Limited (to-
gether, “Fairfield”), so-called Madoff feeder funds. These actions
advance theories of mistake and restitution and seek to recover
payments previously made to defendants by the funds totaling
approximately $140 million.
Mortgage-Backed Securities Litigation and Regulatory Investiga-
tions. JPMorgan Chase and affiliates, Bear Stearns and affiliates
and Washington Mutual and affiliates have been named as defen-
dants in a number of cases in their various roles as issuer and/or
underwriter in mortgage-backed securities (“MBS”) offerings.
These cases include purported class action suits, actions by individ-
ual purchasers of securities and actions by insurance companies
that guaranteed payments of principal and interest for particular
tranches. Although the allegations vary by lawsuit, these cases
generally allege that the offering documents for more than $100
billion of securities issued by dozens of securitization trusts con-
tained material misrepresentations and omissions, including state-
ments regarding the underwriting standards pursuant to which the
underlying mortgage loans were issued.
In the actions against the Firm as an MBS issuer (and, in some
cases, also as an underwriter of its own MBS offerings), three
purported class actions are pending against JPMorgan Chase and
Bear Stearns, and/or certain of their affiliates and current and
former employees, in the United States District Courts for the
Eastern and Southern Districts of New York. Defendants have
moved to dismiss these actions. In addition, Washington Mutual
affiliates, WaMu Asset Acceptance Corp. and WaMu Capital Corp.,
are defendants, along with certain former officers or directors of
WaMu Asset Acceptance Corp., have been named as defendants in
three now-consolidated purported class action cases pending in the
Western District of Washington. Defendants’ motion to dismiss was
granted in part to dismiss all claims relating to MBS offerings in
which a named plaintiff was not a purchaser. Discovery is ongoing.
In other actions brought against the Firm as an MBS issuer (and, in
some cases, also as an underwriter) certain JPMorgan Chase enti-
ties, several Bear Stearns entities, and certain Washington Mutual
affiliates are defendants in nine separate individual actions com-
menced by the Federal Home Loan Banks of Pittsburgh, Seattle,
San Francisco, Chicago, Indianapolis and Atlanta in various state
courts around the country; and certain JPMorgan Chase, Bear
Stearns and Washington Mutual entities are also among the defen-
dants named in separate individual actions commenced by Cam-
bridge Place Investment Management Inc. in Massachusetts state
court, by The Charles Schwab Corporation in state court in Califor-
nia and by Allstate in state court in New York.
EMC Mortgage Corporation (“EMC”), a subsidiary of JPMorgan
Chase, is a defendant in four pending actions commenced by bond
insurers that guaranteed payments of principal and interest on
approximately $3.6 billion of certain classes of seven different MBS
offerings sponsored by EMC. Three of those actions, commenced by
Assured Guaranty Corp., Ambac Assurance Corporation and Syn-
cora Guarantee, Inc., respectively, are pending in the United States
District Court for the Southern District of New York. The fourth
action, commenced by CIFG Assurance North America, Inc., is
pending in state court in Texas. In each action, plaintiff claims that
the underlying mortgage loans had origination defects that pur-
portedly violate certain representations and warranties given by
EMC to plaintiffs, and that EMC has breached the relevant agree-

Notes to consolidated financial statements
286 JPMorgan Chase & Co./2010 Annual Report
ments between the parties by failing to repurchase allegedly defec-
tive mortgage loans. Each action seeks unspecified damages and
an order compelling EMC to repurchase those loans.
In the actions against the Firm solely as an underwriter of other
issuers’ MBS offerings, the Firm has contractual rights to indemnifi-
cation from the issuers, but those indemnity rights may prove
effectively unenforceable where the issuers are now defunct, such
as affiliates of IndyMac Bancorp (“IndyMac Trusts”) and Thornburg
Mortgage (“Thornburg”). With respect to the IndyMac Trusts,
JPMorgan Securities, along with numerous other underwriters and
individuals, is named as a defendant, both in its own capacity and
as successor to Bear Stearns in a purported class action pending in
the United States District Court for the Southern District of New
York brought on behalf of purchasers of securities in various Indy-
Mac Trust MBS offerings. The Court in that action has dismissed
claims as to certain such securitizations, including all offerings in
which no named plaintiff purchased securities, and allowed claims
as to other offerings to proceed. Plaintiffs’ motion to certify a class
of investors in certain offerings is pending, and discovery is ongo-
ing. In addition, JPMorgan Securities and JPMorgan Chase are
named as defendants in an individual action filed by the Federal
Home Loan Bank of Pittsburgh in connection with a single offering
by an affiliate of IndyMac Bancorp. Discovery in that action is
ongoing. Separately, JPMorgan Securities, as successor to Bear,
Stearns & Co. Inc., along with other underwriters and certain
individuals, are defendants in an action pending in state court in
California brought by MBIA Insurance Corp. (“MBIA”). The action
relates to certain securities issued by IndyMac trusts in offerings in
which Bear Stearns was an underwriter, and as to which MBIA
provided guaranty insurance policies. MBIA purports to be subro-
gated to the rights of the MBS holders, and seeks recovery of sums
it has paid and will pay pursuant to those policies. Discovery is
ongoing. With respect to Thornburg, a Bear Stearns subsidiary is a
named defendant in a purported class action pending in the United
States District Court for the District of New Mexico along with a
number of other financial institutions that served as depositors
and/or underwriters for three Thornburg MBS offerings.
In addition to the above-described litigation, the Firm has also
received, and responded to, a number of subpoenas and informal
requests for information from federal authorities concerning mort-
gage-related matters, including inquiries concerning a number of
transactions involving the Firm’s underwriting and issuance of MBS
and its participation in offerings of certain collateralized debt
obligations.
In addition to the above mortgage-related matters, the Firm is now a
defendant in an action commenced by Deutsche Bank, described in
more detail below with respect to the Washington Mutual Litigations.
Mortgage Foreclosure Investigations and Litigation. Multiple state
and federal officials have announced investigations into the proce-
dures followed by mortgage servicing companies and banks, includ-
ing JPMorgan Chase & Co. and its affiliates, relating to foreclosure
and loss mitigation processes. The Firm is cooperating with these
investigations, and these investigations could result in material fines,
penalties, equitable remedies (including requiring default servicing or
other process changes), or other enforcement actions, as well as
significant legal costs in responding to governmental investigations
and additional litigation. Three purported class action lawsuits have
also been filed against the Firm relating to its mortgage foreclosure
procedures.
These investigations and actions follow the Firm’s decision in late
September 2010 to commence a temporary suspension of obtaining
mortgage foreclosure judgments in the states and territories that
require a judicial foreclosure process. Subsequently, the Firm ex-
tended this temporary suspension to foreclosure sales in those
states and territories that require a judicial foreclosure process, and
to foreclosures and foreclosure sales in the majority of remaining
states where a judicial process is not required, but where affidavits
signed by Firm personnel may have been used as part of the fore-
closure process. In mid-October, the Firm also temporarily sus-
pended evictions in the states and territories in which it had
suspended foreclosures and foreclosure sales, as well as in certain
additional states in which an affidavit signed by Firm personnel may
have been used in connection with eviction proceedings.
The Firm’s temporary suspension arose out of certain questions
about affidavits of indebtedness prepared by local foreclosure
counsel, signed by Firm employees and filed or used in mortgage
foreclosure proceedings in certain states. Although the Firm be-
lieves, based on its work to date, that the statements in those
affidavits of indebtedness regarding the fact of default and amount
of indebtedness were materially accurate, in certain instances, the
underlying review and verification of this information was per-
formed by Firm personnel other than the affiants, or the affidavits
may not have been properly notarized.
As of January 2011, the Firm has resumed initiation of new foreclo-
sure proceedings in nearly all states in which it had previously
suspended such proceedings, utilizing revised procedures in con-
nection with the execution of affidavits and other documents used
by Firm employees in the foreclosure process. The Firm is also in the
process of reviewing pending foreclosure matters in these states to
determine whether remediation of specific documentation is neces-
sary, and intends to resume pending foreclosures as the review,
and if necessary, remediation, of each pending matter is completed.
The Firm intends to begin taking these same actions in all remain-
ing states in the near future.
Municipal Derivatives Investigations and Litigation. The Department
of Justice (in conjunction with the Internal Revenue Service), the
Securities and Exchange Commission (“SEC”), a group of state
attorneys general and the Office of the Comptroller of the Currency
(“OCC”) have been investigating JPMorgan Chase and Bear
Stearns for possible antitrust, securities and tax-related violations in
connection with the bidding or sale of guaranteed investment
contracts and derivatives to municipal issuers. The Philadelphia
Office of the SEC provided notice to JPMorgan Securities that it
intends to recommend that the SEC bring civil charges in connec-
tion with its investigation. JPMorgan Securities has responded to
that notice, as well as to a separate notice that that Philadelphia

JPMorgan Chase & Co./2010 Annual Report 287
Office of the SEC provided to Bear, Stearns & Co. Inc. The Firm has
been cooperating with all of these investigations, and is seeking to
resolve them on a negotiated basis.
Purported class action lawsuits and individual actions (the “Munici-
pal Derivatives Actions”) have been filed against JPMorgan Chase
and Bear Stearns, as well as numerous other providers and brokers,
alleging antitrust violations in the reportedly $100 billion to $300
billion annual market for financial instruments related to municipal
bond offerings referred to collectively as “municipal derivatives.”
The Municipal Derivatives Actions have been consolidated in the
United States District Court for the Southern District of New York.
The Court denied in part and granted in part defendants’ motions
to dismiss the purported class and individual actions, permitting
certain claims to proceed against the Firm and others under federal
and California state antitrust laws and under the California false
claims act. Subsequently, a number of additional individual actions
asserting substantially similar claims, including claims under New
York and West Virginia state antitrust statutes, were filed against
JPMorgan Chase, Bear Stearns and numerous other defendants.
Most of these cases have been coordinated for pretrial purposes in
the United States District Court for the Southern District of New
York. The Firm is seeking to have the balance of these cases coor-
dinated before the same court. Discovery is ongoing.
Following JPMorgan Securities’ settlement with the SEC in connec-
tion with certain Jefferson County, Alabama (the “County”) war-
rant underwritings and swap transactions, the County filed a
complaint against the Firm and several other defendants in the
Circuit Court of Jefferson County, Alabama. The suit alleges that
the Firm made payments to certain third parties in exchange for
being chosen to underwrite more than $3 billion in warrants issued
by the County and chosen as the counterparty for certain swaps
executed by the County. In its complaint, Jefferson County alleges
that the Firm concealed these third-party payments and that, but
for this concealment, the County would not have entered into the
transactions. The County further alleges that the transactions
increased the risks of its capital structure and that, following the
downgrade of certain insurers that insured the warrants, the
County’s interest obligations increased and the principal due on a
portion of its outstanding warrants was accelerated. The Court
denied the Firm’s motion to dismiss the complaint. The Firm filed a
mandamus petition with the Alabama Supreme Court, seeking
immediate appellate review of this decision. The petition is now
fully briefed and all proceedings have been stayed pending adjudi-
cation of the petition.
A putative class action was filed on behalf of sewer ratepayers
against JPMorgan Chase and Bear Stearns and numerous other
defendants, based on substantially the same alleged conduct
described above. The Firm’s motion to dismiss the complaint for
lack of standing was denied in January 2011.
Two insurance companies that guaranteed the payment of principal
and interest on warrants issued by Jefferson County have filed sepa-
rate actions against JPMorgan Chase (and one of the insurers has
also named Jefferson County) in New York state court asserting that
defendants fraudulently misled them into issuing the insurance cover-
age, based upon substantially the same alleged conduct described
above and other alleged non-disclosures. One insurer claims that it
insured an aggregate principal amount of nearly $1.2 billion in war-
rants, and seeks unspecified damages in excess of $400 million, as
well as unspecified punitive damages. The other insurer claims that it
insured an aggregate principal amount of more than $378 million
and seeks recovery of $4 million that it alleges it paid under the
policies to date as well as any payments it will make in the future and
unspecified punitive damages. In December 2010, the court denied
the Firm’s motions to dismiss each of the complaints and the parties
are currently engaged in discovery.
The Alabama Public Schools and College Authority (“APSCA”)
brought a declaratory judgment action in the United States District
Court for the Northern District of Alabama claiming that certain
interest rate swaption transactions entered into with JPMorgan
Chase Bank, N.A. are void on the grounds that the APSCA purport-
edly did not have the authority to enter into the transactions or,
alternatively, are voidable at the APSCA’s option because of its
alleged inability to issue refunding bonds in relation to the swaption.
The action was settled in December 2010 for a payment by APSCA
to the Firm and, pursuant to the settlement, the court dismissed the
action by order dated December 27, 2010.
Overdraft Fee/Debit Posting Order Litigation. JPMorgan Chase Bank,
N.A. has been named as a defendant in several purported class
actions relating to its practices in posting debit card transactions to
customers’ deposit accounts. Plaintiffs allege that the Firm improperly
re-ordered debit card transactions from the highest amount to lowest
amount before processing these transactions in order to generate
unwarranted overdraft fees. Plaintiffs contend that the Firm should
have processed such transactions in the chronological order they were
authorized. Plaintiffs seek the disgorgement of all overdraft fees paid
to the Firm by plaintiffs, since approximately 2003, as a result of the
re-ordering of debit card transactions. The claims against the Firm
have been consolidated with numerous complaints against other
national banks in Multi-District Litigation pending in the United States
District Court for the Southern District of Florida. The Firm’s motion to
compel arbitration of certain plaintiffs’ claims was denied by the
District Court. That ruling is currently on appeal. Discovery is proceed-
ing in the District Court. Plaintiffs’ motion for class certification is due
to be filed in April 2011.
Petters Bankruptcy and Related Matters. JPMorgan Chase and certain
of its affiliates, including One Equity Partners, LLC (“OEP”), have
been named as defendants in several actions filed in connection with
the receivership and bankruptcy proceedings pertaining to Thomas J.
Petters and certain entities affiliated with Petters (collectively, “Pet-
ters”) and the Polaroid Corporation. The principal actions against
JPMorgan Chase and its affiliates have been brought by the receiver
and bankruptcy trustee for Petters and generally seek to avoid, on
fraudulent transfer and preference grounds, certain purported trans-
fers in connection with (i) the 2005 acquisition of Polaroid by Petters,
which at the time was majority-owned by OEP; (ii) two credit facilities
that JPMorgan Chase and other financial institutions entered into

Notes to consolidated financial statements
288 JPMorgan Chase & Co./2010 Annual Report
with Polaroid; and (iii) a credit line and investment accounts held by
Petters. The actions collectively seek recovery of approximately $450
million.
Securities Lending Litigation. JPMorgan Chase Bank, N.A. has been
named as a defendant in four putative class actions asserting ERISA
and other claims pending in the United States District Court for the
Southern District of New York brought by participants in the Firm’s
securities lending business. A fifth lawsuit was filed in New York
state court by an individual participant in the program. Three of the
purported class actions, which have been consolidated, relate to
investments of approximately $500 million in medium-term notes
of Sigma Finance Inc. (“Sigma”). In August 2010, the Court certi-
fied a plaintiff class consisting of all securities lending participants
that held Sigma medium-term notes on September 30, 2008,
including those that held the notes by virtue of participation in the
investment of cash collateral through a collective fund, as well as
those that held the notes by virtue of the investment of cash collat-
eral through individual accounts. All discovery has been completed.
The Court has set a schedule for filing summary judgment briefs,
pursuant to which the Firm’s motion is to be fully briefed by April
2011.
The fourth putative class action concerns investments of approxi-
mately $500 million in Lehman Brothers medium-term notes. The
Firm has moved to dismiss the amended complaint and is awaiting
a decision. The Magistrate Judge ordered discovery to proceed
while the motion is pending, but this ruling is on appeal to the
District Judge and also is awaiting a decision. The New York state
court action, which is not a class action, concerns the plaintiff’s
alleged loss of money in both Sigma and Lehman Brothers medium-
term notes. The Firm has answered the complaint. The Court de-
nied the Firm’s motion to stay this action pending resolution of the
proceedings in federal court, and discovery has commenced.
Service Members Civil Relief Act and Housing and Economic Recov-
ery Act Investigations and Litigation. Multiple government officials
have announced their intent to commence, or have commenced,
inquiries into the Firm’s procedures related to the Service Members
Civil Relief Act (“SCRA”) and the Housing and Economic Recovery
Act of 2008 (“HERA”). These inquiries have been prompted by the
Firm’s public statements about its SCRA and HERA compliance and
actions to remedy certain instances in which the Firm mistakenly
charged active or recently-active military personnel mortgage
interest and fees in excess of that permitted by SCRA and HERA,
and in a number of instances, foreclosed on borrowers protected by
SCRA and HERA. The Firm has implemented a number of proce-
dural enhancements and controls to strengthen its SCRA and HERA
compliance and is still reviewing the circumstances under which
these issues arose. In addition, an individual borrower has filed a
purported nationwide class action in United States District Court for
South Carolina against the Firm alleging violations of the SCRA.
Washington Mutual Litigations. Subsequent to JPMorgan Chase’s
acquisition from the Federal Deposit Insurance Corporation
(“FDIC”) of substantially all of the assets and certain specified
liabilities of Washington Mutual Bank, Henderson Nevada (“Wash-
ington Mutual Bank”), in September 2008, Washington Mutual
Bank’s parent holding company, Washington Mutual, Inc. (“WMI”)
and its wholly-owned subsidiary, WMI Investment Corp. (together,
the “Debtors”), both commenced voluntary cases under Chapter 11
of Title 11 of the United States Code in the United States Bank-
ruptcy Court for the District of Delaware (the “Bankruptcy Case”).
In the Bankruptcy Case, the Debtors have asserted rights and
interests in certain assets. The assets in dispute include principally
the following: (a) approximately $4 billion in trust securities con-
tributed by WMI to Washington Mutual Bank (the “Trust Securi-
ties”); (b) the right to tax refunds arising from overpayments
attributable to operations of Washington Mutual Bank and its
subsidiaries; (c) ownership of and other rights in approximately $4
billion that WMI contends are deposit accounts at Washington
Mutual Bank and one of its subsidiaries; and (d) ownership of and
rights in various other contracts and other assets (collectively, the
“Disputed Assets”).
WMI, JPMorgan Chase and the FDIC have since been involved in
litigations over these and other claims pending in the Bankruptcy
Court and the United States District Court for the District of Columbia.
In May 2010, WMI, JPMorgan Chase and the FDIC announced a
global settlement agreement among themselves and significant
creditor groups (the “Global Settlement Agreement”). The Global
Settlement Agreement is incorporated into WMI’s proposed Chapter
11 plan (“the Plan”) that has been submitted to the Bankruptcy
Court. If approved by the Bankruptcy Court, the Global Settlement
would resolve numerous disputes among WMI, JPMorgan Chase, the
FDIC in its capacity as receiver for Washington Mutual Bank and the
FDIC in its corporate capacity, as well as those of significant creditor
groups, including disputes relating to the Disputed Assets.
Other proceedings related to Washington Mutual’s failure are also
pending before the Bankruptcy Court. Among other actions, in July
2010, certain holders of the Trust Securities commenced an adver-
sary proceeding in the Bankruptcy Court against JPMorgan Chase,
WMI, and other entities seeking, among other relief, a declaratory
judgment that WMI and JPMorgan Chase do not have any right,
title or interest in the Trust Securities. In early January 2011, the
Bankruptcy Court granted summary judgment to JPMorgan Chase
and denied summary judgment to the plaintiffs in the Trust Securi-
ties adversary proceeding.
The Bankruptcy Court considered confirmation of the Plan, including
the Global Settlement Agreement, in hearings in early December
2010. In early January 2011, the Bankruptcy Court issued an opinion
in which it concluded that the Global Settlement Agreement is fair
and reasonable, but that the Plan cannot be confirmed until the
parties correct certain deficiencies, which include the scope of re-
leases. None of these deficiencies relate to the Disputed Assets. The
Equity Committee has filed a petition seeking a direct appeal to the
United States Court of Appeals for the Third Circuit from so much of
the Bankruptcy Court’s ruling that found the settlement to be fair and
reasonable. A revised Plan was filed with the Bankruptcy Court in
February 2011, and the Bankruptcy Court has scheduled a hearing for
May 2, 2011. If the Global Settlement is effected and the Plan is

JPMorgan Chase & Co./2010 Annual Report 289
confirmed, the Firm currently estimates it will not incur additional
obligations beyond those already reflected in its liabilities for the
numerous disputes covered by the Global Settlement.
Other proceedings related to Washington Mutual’s failure are
pending before the United States District Court for the District of
Columbia include a lawsuit brought by Deutsche Bank National
Trust Company, initially against the FDIC, asserting an estimated $6
billion to $10 billion in damages based upon alleged breach of
various mortgage securitization agreements and alleged violation of
certain representations and warranties given by certain WMI sub-
sidiaries in connection with those securitization agreements.
Deutsche Bank filed an amended complaint in August 2010, adding
JPMorgan Chase Bank, N.A. as a party. The amended complaint
includes assertions that JPMorgan Chase may have assumed liabili-
ties relating to the mortgage securitization agreements. In Novem-
ber 2010, JPMorgan Chase and the FDIC moved to dismiss the
complaint. JPMorgan Chase also moved for a partial summary
judgment holding that the FDIC retained liability for Deutsche
Bank’s claims.
In addition, JPMorgan Chase was sued in an action originally filed
in State District Court in Texas (the “Texas Action”) by certain
holders of WMI common stock and debt of WMI and Washington
Mutual Bank who seek unspecified damages alleging that JPMor-
gan Chase acquired substantially all of the assets of Washington
Mutual Bank from the FDIC at an allegedly too-low price. The Texas
Action was transferred to the United States District Court for the
District of Columbia, which ultimately granted JPMorgan Chase’s
and the FDIC’s motions to dismiss the complaint. Plaintiffs have
appealed this dismissal to the United States Court of Appeals for
the District of Columbia Circuit. Oral argument is currently sched-
uled for April 5, 2011.
* * *
In addition to the various legal proceedings discussed above, JPMor-
gan Chase and its subsidiaries are named as defendants or otherwise
involved in a substantial number of other legal proceedings. The Firm
believes it has meritorious defenses to the claims asserted against it
in its currently outstanding legal proceedings and it intends to defend
itself vigorously in all such matters. Additional legal proceedings may
be initiated from time to time in the future.
The Firm has established reserves for several hundred of its cur-
rently outstanding legal proceedings. The Firm accrues for potential
liability arising from such proceedings when it is probable that such
liability has been incurred and the amount of the loss can be rea-
sonably estimated. The Firm evaluates its outstanding legal pro-
ceedings each quarter to assess its litigation reserves, and makes
adjustments in such reserves, upwards or downwards, as appropri-
ate, based on management’s best judgment after consultation with
counsel. During the years ended December 31, 2010 and 2009, the
Firm incurred $7.4 billion and $161 million, respectively, of litiga-
tion expense. During the year ended December 31, 2008, the Firm
recorded a net benefit of $781 million to litigation expense. There
is no assurance that the Firm’s litigation reserves will not need to
be adjusted in the future.
In view of the inherent difficulty of predicting the outcome of legal
proceedings, particularly where the claimants seek very large or
indeterminate damages, or where the matters present novel legal
theories, involve a large number of parties or are in early stages of
discovery, the Firm cannot state with confidence what the eventual
outcome of the currently pending matters will be, what the timing
of the ultimate resolution of these pending matters will be or what
the eventual loss, fines, penalties or impact related to each cur-
rently pending matter may be. JPMorgan Chase believes, based
upon its current knowledge, after consultation with counsel and
after taking into account its current litigation reserves, that the
legal proceedings currently pending against it should not have a
material adverse effect on the Firm’s consolidated financial condi-
tion. The Firm notes, however, that in light of the uncertainties
involved in such proceedings, there is no assurance the ultimate
resolution of these matters will not significantly exceed the reserves
currently accrued by the Firm; as a result, the outcome of a particu-
lar matter may be material to JPMorgan Chase’s operating results
for a particular period, depending on, among other factors, the size
of the loss or liability imposed and the level of JPMorgan Chase’s
income for that period.

Notes to consolidated financial statements
290 JPMorgan Chase & Co./2010 Annual Report
Note 33 – International operations
The following table presents income statement–related information
for JPMorgan Chase by major international geographic area. The
Firm defines international activities as business transactions that
involve customers residing outside of the U.S., and the information
presented below is based primarily upon the domicile of the cus-
tomer, the location from which the customer relationship is man-
aged or the location of the trading desk. However, many of the
Firm’s U.S. operations serve international businesses.
As the Firm’s operations are highly integrated, estimates and sub-
jective assumptions have been made to apportion revenue and
expense between U.S. and international operations. These esti-
mates and assumptions are consistent with the allocations used for
the Firm’s segment reporting as set forth in Note 34 on pages 290–
293 of this Annual Report.
The Firm’s long-lived assets for the periods presented are not
considered by management to be significant in relation to total
assets. The majority of the Firm’s long-lived assets are located in
the United States.
Year ended December 31, (in millions) Revenue(a) Expense(b)
Income (loss) before income tax expense/(benefit)
and extraordinary gain Net income Average assets 2010 Europe/Middle East and Africa $ 14,113 $ 8,712 $ 5,401 $ 3,655 $ 425,374 Asia and Pacific 5,791 3,577 2,214 1,470 134,787 Latin America and the Caribbean 1,810 1,152 658 395 30,021 Other 510 413 97 59 6,579 Total international 22,224 13,854 8,370 5,579 596,761 Total U.S. 80,470 63,981 16,489 11,791 1,456,490 Total $ 102,694 $ 77,835 $ 24,859 $ 17,370 $ 2,053,251
2009 Europe/Middle East and Africa $ 16,915 $ 8,610 $ 8,305 $ 5,485 $ 383,003 Asia and Pacific 5,088 3,438 1,650 1,119 100,932 Latin America and the Caribbean 1,982 1,112 870 513 23,227 Other 659 499 160 105 7,074 Total international 24,644 13,659 10,985 7,222 514,236 Total U.S. 75,790 70,708 5,082 4,506 1,509,965 Total $ 100,434 $ 84,367 $ 16,067 $ 11,728 $ 2,024,201
2008 Europe/Middle East and Africa $ 11,449 $ 8,403 $ 3,046 $ 2,483 $ 352,558 Asia and Pacific 4,097 3,580 517 672 108,751 Latin America and the Caribbean 1,353 903 450 274 30,940 Other 499 410 89 21 6,553 Total international 17,398 13,296 4,102 3,450 498,802 Total U.S. 49,854 51,183 (1,329) 2,155 1,292,815 Total $ 67,252 $ 64,479 $ 2,773 $ 5,605 $ 1,791,617
(a) Revenue is composed of net interest income and noninterest revenue. (b) Expense is composed of noninterest expense and the provision for credit losses.
Note 34 – Business segments
The Firm is managed on a line-of-business basis. There are six major
reportable business segments — Investment Bank, Retail Financial
Services, Card Services, Commercial Banking, Treasury & Securities Ser-
vices and Asset Management, as well as a Corporate/Private Equity
segment. The business segments are determined based on the products
and services provided, or the type of customer served, and they reflect the
manner in which financial information is currently evaluated by manage-
ment. Results of these lines of business are presented on a managed
basis. For a definition of managed basis, see Explanation and Reconcilia-
tion of the Firm’s use of non-GAAP financial measures, on pages 64–65
of this Annual Report. For a further discussion concerning JPMorgan
Chase’s business segments, see Business segment results on pages 67–
68 of this Annual Report.
The following is a description of each of the Firm’s business segments:
Investment Bank
J.P. Morgan is one of the world’s leading investment banks, with
deep client relationships and broad product capabilities. The clients
of IB are corporations, financial institutions, governments and
institutional investors. The Firm offers a full range of investment
banking products and services in all major capital markets, includ-
ing advising on corporate strategy and structure, capital-raising in
equity and debt markets, sophisticated risk management, market-
making in cash securities and derivative instruments, prime broker-
age, and research.

JPMorgan Chase & Co./2010 Annual Report 291
Retail Financial Services
RFS serves consumers and businesses through personal service at
bank branches and through ATMs, online banking and telephone
banking, as well as through auto dealerships and school financial-
aid offices. Customers can use more than 5,200 bank branches
(third-largest nationally) and 16,100 ATMs (second-largest nation-
ally), as well as online and mobile banking around the clock. More
than 28,900 branch salespeople assist customers with checking
and savings accounts, mortgages, home equity and business loans,
and investments across the 23-state footprint from New York and
Florida to California. Consumers also can obtain loans through
more than 16,200 auto dealerships and 2,200 schools and universi-
ties nationwide.
Card Services
CS is one of the nation’s largest credit card issuers, with over $137
billion in loans and over 90 million open accounts. Customers used
Chase cards to meet $313 billion of their spending needs in 2010.
Through its merchant acquiring business, Chase Paymentech Solu-
tions, CS is a global leader in payment processing and merchant
acquiring.
Commercial Banking
CB delivers extensive industry knowledge, local expertise and dedi-
cated service to nearly 24,000 clients nationally, including corpora-
tions, municipalities, financial institutions and not-for-profit entities
with annual revenue generally ranging from $10 million to $2 billion,
and nearly 35,000 real estate investors/owners. CB partners with the
Firm’s other businesses to provide comprehensive solutions, including
lending, treasury services, investment banking and asset manage-
ment to meet its clients’ domestic and international financial needs.
Treasury & Securities Services
TSS is a global leader in transaction, investment and information
services. TSS is one of the world’s largest cash management pro-
viders and a leading global custodian. Treasury Services (“TS”)
provides cash management, trade, wholesale card and liquidity
products and services to small- and mid-sized companies, multina-
tional corporations, financial institutions and government entities.
TS partners with IB, CB, RFS and AM businesses to serve clients
firmwide. Certain TS revenue is included in other segments’ results.
Worldwide Securities Services holds, values, clears and services
securities, cash and alternative investments for investors and bro-
ker-dealers, and manages depositary receipt programs globally.
Asset Management
AM, with assets under supervision of $1.8 trillion, is a global leader in
investment and wealth management. AM clients include institutions,
retail investors and high-net-worth individuals in every major market
throughout the world. AM offers global investment management in
equities, fixed income, real estate, hedge funds, private equity and
liquidity products, including money-market instruments and bank
deposits. AM also provides trust and estate, banking and brokerage
services to high-net-worth clients, and retirement services for corpora-
tions and individuals. The majority of AM’s client assets are in ac-
tively managed portfolios.
Corporate/Private Equity
The Corporate/Private Equity sector comprises Private Equity,
Treasury, the Chief Investment Office, corporate staff units and
expense that is centrally managed. Treasury and the Chief Invest-
ment Office manage capital, liquidity, and structural risks of the
Firm. The corporate staff units include Central Technology and
Operations, Internal Audit, Executive Office, Finance, Human Re-
sources, Marketing & Communications, Legal & Compliance, Cor-
porate Real Estate and General Services, Risk Management,
Corporate Responsibility and Strategy & Development. Other cen-
trally managed expense includes the Firm’s occupancy and pension-
related expense, net of allocations to the business.
Effective January 1, 2010, the Firm enhanced its line-of-business equity
framework to better align equity assigned to each line of business with
changes anticipated to occur in the business and in the competitive and
regulatory landscape. The lines of business are now capitalized based
on the Tier 1 common standard, rather than the Tier 1 capital standard.
Line-of-business equity increased during the second quarter of 2008 in
IB and AM due to the Bear Stearns merger and for AM, the purchase of
the additional equity interest in Highbridge. At the end of the third
quarter of 2008, equity was increased for each line of business with a
view toward the future implementation of the new Basel II capital
rules. In addition, equity allocated to RFS, CS and CB was increased as
a result of the Washington Mutual transaction.

Notes to consolidated financial statements
JPMorgan Chase & Co./2010 Annual Report 292
Segment results
The following table provides a summary of the Firm’s segment results for 2010, 2009 and 2008 on a managed basis. Prior to the January 1, 2010,
adoption of the accounting guidance related to VIEs, the impact of credit card securitization adjustments had been included in reconciling items so
that the total Firm results are on a reported basis. Finally, total net revenue (noninterest revenue and net interest income) for each of the segments
is presented on a tax-equivalent basis. Accordingly, revenue from tax-exempt securities and investments that receive tax credits are presented in
the managed results on a basis comparable to taxable securities and investments. This approach allows management to assess the comparability
of revenue arising from both taxable and tax-exempt sources. The corresponding income tax impact related to these items is recorded within
income tax expense/(benefit).
Segment results and reconciliation(a) (table continued on next page)
Year ended December 31, Investment
Bank Retail Financial
Services
Card
Services(f) Commercial
Banking (in millions, except ratios) 2010 2009 2008 2010 2009 2008 2010 2009 2008 2010 2009 2008
Noninterest revenue $ 18,253 $ 18,522 $ 2,051 $ 12,228 $ 12,200 $ 9,355 $ 3,277 $ 2,920 $ 2,719 $ 2,200 $ 1,817 $ 1,481 Net interest income 7,964 9,587 10,284 19,528 20,492 14,165 13,886 17,384 13,755 3,840 3,903 3,296
Total net revenue 26,217 28,109 12,335 31,756 32,692 23,520 17,163 20,304 16,474 6,040 5,720 4,777 Provision for credit losses (1,200) 2,279 2,015 9,452 15,940 9,905 8,037 18,462 10,059 297 1,454 464
Credit reimbursement
(to)/from TSS(b) — — — — — — — — — — — —
Noninterest expense(c) 17,265 15,401 13,844 17,864 16,748 12,077 5,797 5,381 5,140 2,199 2,176 1,946
Income/(loss) before income tax expense/ (benefit) and extraordinary gain 10,152 10,429 (3,524) 4,440 4 1,538 3,329 (3,539) 1,275 3,544 2,090 2,367
Income tax expense/(benefit) 3,513 3,530 (2,349) 1,914 (93) 658 1,255 (1,314) 495 1,460 819 928
Income/(loss) before extraordinary gain 6,639 6,899 (1,175) 2,526 97 880 2,074 (2,225) 780 2,084 1,271 1,439
Extraordinary gain(d) — — — — — — — — — — — —
Net income/(loss) $ 6,639 $ 6,899 $ (1,175) $ 2,526 $ 97 $ 880 $ 2,074 $ (2,225) $ 780 $ 2,084 $ 1,271 $ 1,439
Average common equity $ 40,000 $ 33,000 $ 26,098 $ 28,000 $ 25,000 $ 19,011 $ 15,000 $ 15,000 $ 14,326 $ 8,000 $ 8,000 $ 7,251 Average assets 731,801 699,039 832,729 381,337 407,497 304,442 145,750 192,749 173,711 133,654 135,408 114,299
Return on average equity(e) 17% 21% (5)% 9% —% 5% 14% (15)% 5% 26% 16% 20 % Overhead ratio 66 55 112 56 51 51 34 27 31 36 38 41
(a) In addition to analyzing the Firm’s results on a reported basis, management reviews the Firm’s lines of business results on a “managed basis,” which is a non-GAAP finan-cial measure. The Firm’s definition of managed basis starts with the reported U.S. GAAP results and includes certain reclassifications that do not have any impact on net income as reported by the lines of business or by the Firm as a whole.
(b) TSS was charged a credit reimbursement related to certain exposures managed within IB credit portfolio on behalf of clients shared with TSS. IB recognizes this credit reimbursement in its credit portfolio business in all other income.
(c) Includes merger costs, which are reported in the Corporate/Private Equity segment. There were no merger costs in 2010. Merger costs attributed to the business segments for 2009 and 2008 were as follows.
Year ended December 31, (in millions) 2009 2008 Investment Bank $ 27 $ 183 Retail Financial Services 228 90 Card Services 40 20 Commercial Banking 6 4 Treasury & Securities Services 11 — Asset Management 6 3 Corporate/Private Equity 163 132
(d) On September 25, 2008, JPMorgan Chase acquired the banking operations of Washington Mutual from the FDIC for $1.9 billion. The fair value of the net assets acquired exceeded the purchase price, which resulted in negative goodwill. In accordance with U.S. GAAP for business combinations, nonfinancial assets that are not held-for-sale, such as premises and equipment and other intangibles, acquired in the Washington Mutual transaction were written down against that negative goodwill. The negative goodwill that remained after writing down nonfinancial assets was recognized as an extraordinary gain.
(e) Ratio is based on income/(loss) before extraordinary gain for 2009 and 2008.
(f) Effective January 1, 2010, the Firm adopted accounting guidance related to VIEs. Prior to the adoption of the new guidance, managed results for credit card excluded the impact of credit card securitizations on total net revenue, provision for credit losses and average assets, as JPMorgan Chase treated the sold receivables as if they were still on the balance sheet in evaluating the credit performance of the entire managed credit card portfolio, as operations are funded, and decisions are made about allocating resources, such as employees and capital, based on managed information. These adjustments are eliminated in reconciling items to arrive at the Firm’s re-ported U.S. GAAP results. The related securitization adjustments were as follows.
Year ended December 31, (in millions) 2010 2009 2008 Noninterest revenue NA $ (1,494) $ (3,333) Net interest income NA 7,937 6,945 Provision for credit losses NA 6,443 3,612 Average assets NA 82,233 76,904
(g) Included a $1.5 billion charge to conform Washington Mutual’s credit loss reserve to JPMorgan Chase’s allowance methodology.
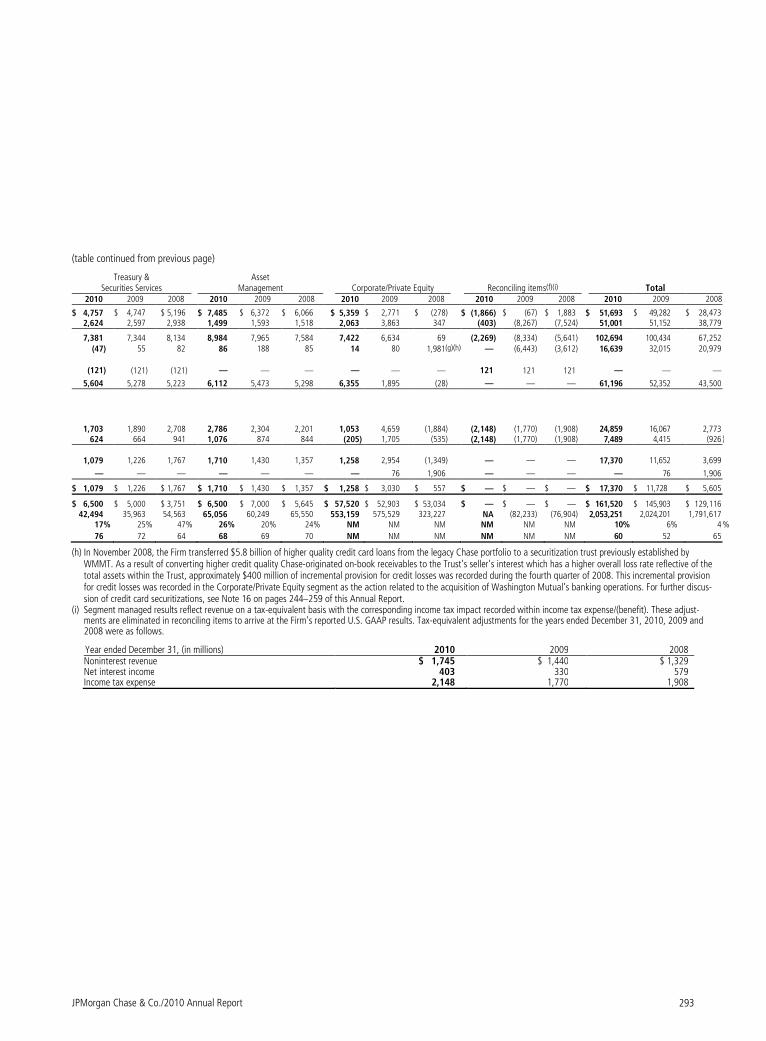
JPMorgan Chase & Co./2010 Annual Report 293
(table continued from previous page)
Treasury & Securities Services
Asset Management Corporate/Private Equity Reconciling items(f)(i) Total
2010 2009 2008 2010 2009 2008 2010 2009 2008 2010 2009 2008 2010 2009 2008
$ 4,757 $ 4,747 $ 5,196 $ 7,485 $ 6,372 $ 6,066 $ 5,359 $ 2,771 $ (278) $ (1,866) $ (67) $ 1,883 $ 51,693 $ 49,282 $ 28,473 2,624 2,597 2,938 1,499 1,593 1,518 2,063 3,863 347 (403) (8,267) (7,524) 51,001 51,152 38,779
7,381 7,344 8,134 8,984 7,965 7,584 7,422 6,634 69 (2,269) (8,334) (5,641) 102,694 100,434 67,252
(47) 55 82 86 188 85 14 80 1,981(g)(h) — (6,443) (3,612) 16,639 32,015 20,979
(121) (121) (121) — — — — — — 121 121 121 — — —
5,604 5,278 5,223 6,112 5,473 5,298 6,355 1,895 (28) — — — 61,196 52,352 43,500
1,703 1,890 2,708 2,786 2,304 2,201 1,053 4,659 (1,884) (2,148) (1,770) (1,908) 24,859 16,067 2,773 624 664 941 1,076 874 844 (205) 1,705 (535) (2,148) (1,770) (1,908) 7,489 4,415 (926 )
1,079 1,226 1,767 1,710 1,430 1,357 1,258 2,954 (1,349) — — — 17,370 11,652 3,699
— — — — — — — 76 1,906 — — — — 76 1,906
$ 1,079 $ 1,226 $ 1,767 $ 1,710 $ 1,430 $ 1,357 $ 1,258 $ 3,030 $ 557 $ — $ — $ — $ 17,370 $ 11,728 $ 5,605
$ 6,500 $ 5,000 $ 3,751 $ 6,500 $ 7,000 $ 5,645 $ 57,520 $ 52,903 $ 53,034 $ — $ — $ — $ 161,520 $ 145,903 $ 129,116 42,494 35,963 54,563 65,056 60,249 65,550 553,159 575,529 323,227 NA (82,233) (76,904) 2,053,251 2,024,201 1,791,617
17% 25% 47% 26% 20% 24% NM NM NM NM NM NM 10% 6% 4 %
76 72 64 68 69 70 NM NM NM NM NM NM 60 52 65
(h) In November 2008, the Firm transferred $5.8 billion of higher quality credit card loans from the legacy Chase portfolio to a securitization trust previously established by WMMT. As a result of converting higher credit quality Chase-originated on-book receivables to the Trust’s seller’s interest which has a higher overall loss rate reflective of the total assets within the Trust, approximately $400 million of incremental provision for credit losses was recorded during the fourth quarter of 2008. This incremental provision for credit losses was recorded in the Corporate/Private Equity segment as the action related to the acquisition of Washington Mutual’s banking operations. For further discus-sion of credit card securitizations, see Note 16 on pages 244–259 of this Annual Report.
(i) Segment managed results reflect revenue on a tax-equivalent basis with the corresponding income tax impact recorded within income tax expense/(benefit). These adjust-ments are eliminated in reconciling items to arrive at the Firm’s reported U.S. GAAP results. Tax-equivalent adjustments for the years ended December 31, 2010, 2009 and 2008 were as follows.
Year ended December 31, (in millions) 2010 2009 2008 Noninterest revenue $ 1,745 $ 1,440 $ 1,329 Net interest income 403 330 579 Income tax expense 2,148 1,770 1,908

Notes to consolidated financial statements
JPMorgan Chase & Co./2010 Annual Report 294
Note 35 – Parent company Parent company – statements of income
Year ended December 31, (in millions) 2010 2009 2008 Income Dividends from subsidiaries: Bank and bank holding company $ 16,554 $ 15,235 $ 3,085
Nonbank(a) 932 1,036 1,687 Interest income from subsidiaries 985 1,501 4,539 Other interest income 294 266 212 Other income from subsidiaries,
primarily fees: Bank and bank holding company 680 233 244 Nonbank 312 742 95 Other income/(loss) 157 844 (1,038) Total income 19,914 19,857 8,824 Expense
Interest expense to subsidiaries(a) 1,263 1,118 1,302 Other interest expense 3,782 4,696 6,879 Compensation expense 177 574 43 Other noninterest expense 363 414 732 Total expense 5,585 6,802 8,956 Income/(loss) before income tax benefit
and undistributed net income of subsidiaries 14,329
13,055 (132))
Income tax benefit 511 1,269 2,582 Equity in undistributed net income of
subsidiaries 2,530 (2,596) 3,155 Net income $ 17,370 $ 11,728 $ 5,605
Parent company – balance sheets December 31, (in millions) 2010 2009 Assets Cash and due from banks $ 96 $ 102 Deposits with banking subsidiaries 80,201 87,893 Trading assets 16,038 14,808 Available-for-sale securities 3,176 2,647 Loans 1,849 1,316 Advances to, and receivables from, subsidiaries:
Bank and bank holding company 54,887 54,152 Nonbank 72,080 81,365
Investments (at equity) in subsidiaries: Bank and bank holding company 150,876 157,412
Nonbank(a) 38,000 32,547 Goodwill and other intangibles 1,050 1,104 Other assets 17,171 14,793 Total assets $ 435,424 $ 448,139
Liabilities and stockholders’ equity
Borrowings from, and payables to, subsidiaries(a) $ 28,332 $ 39,532 Other borrowed funds, primarily commercial
paper 41,874 41,454 Other liabilities 7,302 8,035
Long-term debt(b) 181,810 193,753 Total liabilities 259,318 282,774 Total stockholders’ equity 176,106 165,365 Total liabilities and stockholders’ equity $ 435,424 $ 448,139
Parent company – statements of cash flows
Year ended December 31, (in millions) 2010 2009 2008 Operating activities Net income $ 17,370 $ 11,728 $ 5,605
Less: Net income of subsidiaries(a) 20,016 13,675 7,927 Parent company net loss (2,646) (1,947) (2,322 )
Cash dividends from subsidiaries(a) 17,432 16,054 4,648 Other, net 1,685 1,852 1,920 Net cash provided by operating
activities 16,471 15,959 4,246 Investing activities Net change in: Deposits with banking subsidiaries 7,692 (27,342) (7,579 ) Available-for-sale securities:
Purchases (1,387) (1,454) (1,475 ) Proceeds from sales and maturities 745 522 —
Loans, net (90) 209 (102 ) Advances to subsidiaries, net 8,051 28,808 (82,725 )
Investments (at equity) in subsidiaries, net(a) (871) (6,582) (26,212 ) Net cash provided by/(used in)
investing activities 14,140 (5,839) (118,093 ) Financing activities Net change in borrowings from
subsidiaries(a) (2,039) (4,935) 20,529 Net change in other borrowed funds (11,843) 1,894 (12,880 ) Proceeds from the issuance of long-term
debt 21,610 32,304 50,013 Proceeds from the assumption of
subsidiaries long-term debt(c) — 15,264 39,778 Repayments of long-term debt (32,893) (31,964) (22,972 ) Proceeds from issuance of common stock — 5,756 11,500 Excess tax benefits related to stock-based
compensation 26 17 148 Proceeds from issuance of preferred stock
and Warrant to the U.S. Treasury — — 25,000 Proceeds from issuance of other preferred
stock(d) — — 8,098 Redemption of preferred stock issued to
the U.S. Treasury — (25,000) — Redemption of other preferred stock (352) — — Treasury stock repurchased (2,999) — — Dividends paid (1,486) (3,422) (5,911 ) All other financing activities, net (641) 33 469 Net cash (used in)/provided by
financing activities (30,617) (10,053) 113,772 Net increase/(decrease) in cash and due
from banks (6) 67 (75 ) Cash and due from banks at the
beginning of the year, primarily with bank subsidiaries 102 35 110
Cash and due from banks at the end of the year, primarily with bank subsidiaries $ 96 $ 102 $ 35
Cash interest paid $ 5,090 $ 5,629 $ 7,485 Cash income taxes paid, net 7,001 3,124 156
(a) Subsidiaries include trusts that issued guaranteed capital debt securities (“issuer trusts”). The Parent received dividends of $13 million, $14 million and $15 million from the issuer trusts in 2010, 2009 and 2008, respectively. For further discussion on these issuer trusts, see Note 22 on pages 265–266 of this Annual Report.
(b) At December 31, 2010, long-term debt that contractually matures in 2011 through 2015 totaled $38.9 billion, $42.4 billion, $17.6 billion, $19.0 billion and $16.8 billion, respectively.
(c) Represents the assumption of Bear Stearns long-term debt by JPMorgan Chase & Co. (d) 2008 included the conversion of Bear Stearns’ preferred stock into JPMorgan Chase preferred stock.

Supplementary information
JPMorgan Chase & Co./2010 Annual Report 295
Selected quarterly financial data (unaudited) As of or for the period ended 2010 2009 (in millions, except per share, ratio and
headcount data) 4th quarter 3rd quarter 2nd quarter 1st quarter 4th quarter 3rd quarter 2nd quarter 1st quarterSelected income statement data Noninterest revenue $ 13,996 $ 11,322 $ 12,414 $ 13,961 $ 10,786 $ 13,885 $ 12,953 $ 11,658 Net interest income 12,102 12,502 12,687 13,710 12,378 12,737 12,670 13,367 Total net revenue 26,098 23,824 25,101 27,671 23,164 26,622 25,623 25,025 Total noninterest expense 16,043 14,398 14,631 16,124 12,004 13,455 13,520 13,373
Pre-provision profit(a) 10,055 9,426 10,470 11,547 11,160 13,167 12,103 11,652 Provision for credit losses 3,043 3,223 3,363 7,010 7,284 8,104 8,031 8,596 Income before income tax expense
and extraordinary gain 7,012 6,203 7,107 4,537 3,876 5,063 4,072 3,056 Income tax expense 2,181 1,785 2,312 1,211 598 1,551 1,351 915 Income before extraordinary gain 4,831 4,418 4,795 3,326 3,278 3,512 2,721 2,141 Extraordinary gain(b) — — — — — 76 — — Net income $ 4,831 $ 4,418 $ 4,795 $ 3,326 $ 3,278 $ 3,588 $ 2,721 $ 2,141
Per common share data Basic earnings
Income before extraordinary gain $ 1.13 $ 1.02 $ 1.10 $ 0.75 $ 0.75 $ 0.80 $ 0.28 $ 0.40 Net income 1.13 1.02 1.10 0.75 0.75 0.82 0.28 0.40
Diluted earnings(c) Income before extraordinary gain $ 1.12 $ 1.01 $ 1.09 $ 0.74 $ 0.74 $ 0.80 $ 0.28 $ 0.40 Net income 1.12 1.01 1.09 0.74 0.74 0.82 0.28 0.40
Cash dividends declared per share 0.05 0.05 0.05 0.05 0.05 0.05 0.05 0.05 Book value per share 43.04 42.29 40.99 39.38 39.88 39.12 37.36 36.78 Common shares outstanding Average: Basic 3,917.0 3,954.3 3,983.5 3,970.5 3,946.1 3,937.9 3,811.5 3,755.7 Diluted 3,935.2 3,971.9 4,005.6 3,994.7 3,974.1 3,962.0 3,824.1 3,758.7 Common shares at period-end 3,910.3 3,925.8 3,975.8 3,975.4 3,942.0 3,938.7 3,924.1 3,757.7 Share price(d) High $ 43.12 $ 41.70 $ 48.20 $ 46.05 $ 47.47 $ 46.50 $ 38.94 $ 31.64 Low 36.21 35.16 36.51 37.03 40.04 31.59 25.29 14.96 Close 42.42 38.06 36.61 44.75 41.67 43.82 34.11 26.58 Market capitalization 165,875 149,418 145,554 177,897 164,261 172,596 133,852 99,881 Financial ratios Return on common equity(c)
Income before extraordinary gain 11% 10% 12% 8% 8% 9% 3% 5% Net income 11 10 12 8 8 9 3 5
Return on tangible common equity(c) Income before extraordinary gain 16 15 17 12 12 13 5 8 Net income 16 15 17 12 12 14 5 8
Return on assets Income before extraordinary gain 0.92 0.86 0.94 0.66 0.65 0.70 0.54 0.42 Net income 0.92 0.86 0.94 0.66 0.65 0.71 0.54 0.42
Overhead ratio 61 60 58 58 52 51 53 53 Deposits-to-loans ratio 134 131 127 130 148 133 127 128 Tier 1 capital ratio(e) 12.1 11.9 12.1 11.5 11.1 10.2 9.7 11.4 Total capital ratio 15.5 15.4 15.8 15.1 14.8 13.9 13.3 15.2 Tier 1 leverage ratio 7.0 7.1 6.9 6.6 6.9 6.5 6.2 7.1 Tier 1 common capital ratio(f) 9.8 9.5 9.6 9.1 8.8 8.2 7.7 7.3 Selected balance sheet data
(period-end)(e) Trading assets $ 489,892 $ 475,515 $ 397,508 $ 426,128 $ 411,128 $ 424,435 $ 395,626 $ 429,700 Securities 316,336 340,168 312,013 344,376 360,390 372,867 345,563 333,861 Loans 692,927 690,531 699,483 713,799 633,458 653,144 680,601 708,243 Total assets 2,117,605 2,141,595 2,014,019 2,135,796 2,031,989 2,041,009 2,026,642 2,079,188 Deposits 930,369 903,138 887,805 925,303 938,367 867,977 866,477 906,969 Long-term debt 247,669 255,589 248,618 262,857 266,318 272,124 271,939 261,845 Common stockholders’ equity 168,306 166,030 162,968 156,569 157,213 154,101 146,614 138,201 Total stockholders’ equity 176,106 173,830 171,120 164,721 165,365 162,253 154,766 170,194 Headcount 239,831 236,810 232,939 226,623 222,316 220,861 220,255 219,569

Supplementary information
JPMorgan Chase & Co./2010 Annual Report 296
As of or for the period ended 2010 2009 (in millions, except ratio data) 4th quarter 3rd quarter 2nd quarter 1st quarter 4th quarter 3rd quarter 2nd quarter 1st quarterCredit quality metrics Allowance for credit losses $ 32,983 $ 35,034 $ 36,748 $ 39,126 $ 32,541 $ 31,454 $ 29,818 $ 28,019 Allowance for loan losses to total retained
loans 4.71% 4.97% 5.15% 5.40% 5.04% 4.74% 4.33% 3.95% Allowance for loan losses to retained loans
excluding purchased credit-impaired loans(g) 4.46 5.12 5.34 5.64 5.51 5.28 5.01 4.53 Nonperforming assets $ 16,557 $ 17,656 $ 18,156 $ 19,019 $ 19,741 $ 20,362 $ 17,517 $ 14,654Net charge-offs 5,104 4,945 5,714 7,910 6,177 6,373 6,019 4,396 Net charge-off rate 2.95% 2.84% 3.28% 4.46% 3.85% 3.84% 3.52% 2.51% Wholesale net charge-off rate 0.49 0.49 0.44 1.84 2.31 1.93 1.19 0.32
Consumer net charge-off rate(h) 4.12 3.90 4.49 5.56 4.60 4.79 4.69 3.61
(a) Pre-provision profit is total net revenue less noninterest expense. The Firm believes that this financial measure is useful in assessing the ability of a lending institution to generate income in excess of its provision for credit losses.
(b) On September 25, 2008, JPMorgan Chase acquired the banking operations of Washington Mutual. On May 30, 2008, a wholly-owned subsidiary of JPMorgan Chase merged with and into The Bear Stearns Companies, Inc. (“Bear Stearns”), and Bear Stearns became a wholly-owned subsidiary of JPMorgan Chase. The Washington Mutual acquisi-tion resulted in negative goodwill, and accordingly, the Firm recorded an extraordinary gain. A preliminary gain of $1.9 billion was recognized at December 31, 2008. The final total extraordinary gain that resulted from the Washington Mutual transaction was $2.0 billion. For additional information of these transactions, see Note 2 on pages 166–170 of this Annual Report.
(c) The calculation of second-quarter 2009 earnings per share and net income applicable to common equity includes a one-time, noncash reduction of $1.1 billion, or $0.27 per share, resulting from repayment of U.S. Troubled Asset Relief Program (“TARP”) preferred capital. Excluding this reduction, the adjusted return on common equity (“ROE”) and Return on tangible common equity (“ROTCE”) were 6% and 10%, respectively, for second-quarter 2009. The Firm views the adjusted ROE and ROTCE, both non-GAAP financial measures, as meaningful because they enable the comparability to prior periods. For further discussion, see “Explanation and reconciliation of the Firm’s use of non-GAAP financial measures” on pages 64–66 of this Annual Report.
(d) Share prices shown for JPMorgan Chase’s common stock are from the New York Stock Exchange. JPMorgan Chase’s common stock is also listed and traded on the London Stock Exchange and the Tokyo Stock Exchange.
(e) Effective January 1, 2010, the Firm adopted new guidance that amended the accounting for the transfer of financial assets and the consolidation of VIEs. Upon adoption of the new guidance, the Firm consolidated its Firm-sponsored credit card securitization trusts, Firm-administered multi-seller conduits and certain other consumer loan securiti-zation entities, primarily mortgage-related, adding $87.7 billion and $92.2 billion of assets and liabilities, respectively, and decreasing stockholders’ equity and the Tier 1 capi-tal ratio by $4.5 billion and 34 basis points, respectively. The reduction to stockholders’ equity was driven by the establishment of an allowance for loan losses of $7.5 billion (pretax) primarily related to receivables held in credit card securitization trusts that were consolidated at the adoption date.
(f) The Firm uses Tier 1 common along with the other capital measures to assess and monitor its capital position. The Tier 1 common ratio is Tier 1 common divided by risk-weighted assets. For further discussion, see Regulatory capital on pages 102–104 of this Annual Report.
(g) Excludes the impact of home lending PCI loans and loans held by the Washington Mutual Master Trust. For further discussion, see Allowance for credit losses on pages 139–141 of this Annual Report.
(h) The fourth quarter of 2010 includes an aggregate adjustment of $632 million to increase net charge-offs related to the estimated net realizable value of the collateral underly-ing delinquent residential home loans. Because these losses were previously recognized in the provision and allowance for loan losses, this adjustment had no impact on the Firm’s net income.

JPMorgan Chase & Co./2010 Annual Report 297
Selected annual financial data (unaudited)
As of or for the year ended December 31,
(in millions, except per share, ratio and headcount data) 2010 2009 2008(d) 2007 2006 Selected income statement data Noninterest revenue $ 51,693 $ 49,282 $ 28,473 $ 44,966 $ 40,757Net interest income 51,001 51,152 38,779 26,406 21,242Total net revenue 102,694 100,434 67,252 71,372 61,999Total noninterest expense 61,196 52,352 43,500 41,703 38,843
Pre-provision profit(a) 41,498 48,082 23,752 29,669 23,156Provision for credit losses 16,639 32,015 19,445 6,864 3,270
Provision for credit losses – accounting conformity(b) — — 1,534 — —Income from continuing operations before income tax expense/
(benefit) and extraordinary gain 24,859 16,067 2,773 22,805 19,886Income tax expense/(benefit) 7,489 4,415 (926) 7,440 6,237Income from continuing operations 17,370 11,652 3,699 15,365 13,649
Income from discontinued operations(c) — — — — 795Income before extraordinary gain 17,370 11,652 3,699 15,365 14,444
Extraordinary gain (d) — 76 1,906 — —Net income $ 17,370 $ 11,728 $ 5,605 $ 15,365 $ 14,444
Per common share data Basic earnings Income from continuing operations $ 3.98 $ 2.25 $ 0.81 $ 4.38 $ 3.83 Net income 3.98 2.27 1.35 4.38 4.05
Diluted earnings(e) Income from continuing operations $ 3.96 $ 2.24 $ 0.81 $ 4.33 $ 3.78 Net income 3.96 2.26 1.35 4.33 4.00 Cash dividends declared per share 0.20 0.20 1.52 1.48 1.36 Book value per share 43.04 39.88 36.15 36.59 33.45 Common shares outstanding Average: Basic 3,956.3 3,862.8 3,501.1 3,403.6 3,470.1 Diluted 3,976.9 3,879.7 3,521.8 3,445.3 3,516.1 Common shares at period-end 3,910.3 3,942.0 3,732.8 3,367.4 3,461.7
Share price(f) High $ 48.20 $ 47.47 $ 50.63 $ 53.25 $ 49.00 Low 35.16 14.96 19.69 40.15 37.88 Close 42.42 41.67 31.53 43.65 48.30 Market capitalization 165,875 164,261 117,695 146,986 167,199Financial ratios
Return on common equity(e) Income from continuing operations 10% 6% 2% 13% 12% Net income 10 6 4 13 13
Return on tangible common equity(e) Income from continuing operations 15 10 4 22 24 Net income 15 10 6 22 24Return on assets Income from continuing operations 0.85 0.58 0.21 1.06 1.04 Net income 0.85 0.58 0.31 1.06 1.10Overhead ratio 60 52 65 58 63Deposits-to-loans ratio 134 148 135 143 132
Tier 1 capital ratio(g) 12.1 11.1 10.9 8.4 8.7 Total capital ratio 15.5 14.8 14.8 12.6 12.3 Tier 1 leverage ratio 7.0 6.9 6.9 6.0 6.2
Tier 1 common capital ratio(h) 9.8 8.8 7.0 7.0 7.3
Selected balance sheet data (period-end)(g) Trading assets $ 489,892 $ 411,128 $ 509,983 $ 491,409 $ 365,738 Securities 316,336 360,390 205,943 85,450 91,975Loans 692,927 633,458 744,898 519,374 483,127Total assets 2,117,605 2,031,989 2,175,052 1,562,147 1,351,520 Deposits 930,369 938,367 1,009,277 740,728 638,788Long-term debt 247,669 266,318 270,683 199,010 145,630Common stockholders’ equity 168,306 157,213 134,945 123,221 115,790Total stockholders’ equity 176,106 165,365 166,884 123,221 115,790Headcount 239,831 222,316 224,961 180,667 174,360

Supplementary information
JPMorgan Chase & Co./2010 Annual Report 298
As of or for the year ended December 31, (in millions, except ratio data) 2010 2009 2008(d) 2007 2006 Credit quality metrics Allowance for credit losses $ 32,983 $ 32,541 $ 23,823 $ 10,084 $ 7,803 Allowance for loan losses to total retained loans 4.71% 5.04% 3.18% 1.88% 1.70% Allowance for loan losses to retained loans, excluding PCI loans(i) 4.46 5.51 3.62 1.88 1.70 Nonperforming assets $ 16,557 $ 19,741 $ 12,714 $ 3,933 $ 2,341Net charge-offs 23,673 22,965 9,835 4,538 3,042 Net charge-off rate 3.39% 3.42% 1.73% 1.00% 0.73% Wholesale net charge-off/(recovery) rate 0.81 1.40 0.18 0.04 (0.01) Consumer net charge-off rate 4.53 4.41 2.71 1.61 1.17
(a) Pre-provision profit is total net revenue less noninterest expense. The Firm believes that this financial measure is useful in assessing the ability of a lending institution to generate income in excess of its provision for credit losses.
(b) Results for 2008 included an accounting conformity loan loss reserve provision related to the acquisition of Washington Mutual Bank’s banking operations. (c) On October 1, 2006, JPMorgan Chase & Co. completed the exchange of selected corporate trust businesses for the consumer, business-banking and middle-market banking
businesses of The Bank of New York Company Inc. The results of operations of these corporate trust businesses were reported as discontinued operations. (d) On September 25, 2008, JPMorgan Chase acquired the banking operations of Washington Mutual. On May 30, 2008, a wholly-owned subsidiary of JPMorgan Chase merged
with and into Bear Stearns, and Bear Stearns became a wholly-owned subsidiary of JPMorgan Chase. The Washington Mutual acquisition resulted in negative goodwill, and accordingly, the Firm recorded an extraordinary gain. A preliminary gain of $1.9 billion was recognized at December 31, 2008. The final total extraordinary gain that resulted from the Washington Mutual transaction was $2.0 billion. For additional information on these transactions, see Note 2 on pages 166–170 of this Annual Report.
(e) The calculation of 2009 earnings per share and net income applicable to common equity includes a one-time, noncash reduction of $1.1 billion, or $0.27 per share, resulting from repayment of TARP preferred capital in the second quarter of 2009. Excluding this reduction, the adjusted return on equity (“ROE”) and return on tangible common equity (“ROTCE”) were 7% and 11%, respectively, for 2009. The Firm views the adjusted ROE and ROTCE, both non-GAAP financial measures, as meaningful because they enable the comparability to prior periods. For further discussion, see “Explanation and reconciliation of the Firm’s use of non-GAAP financial measures” on pages 64–66 of this Annual Report.
(f) Share prices shown for JPMorgan Chase’s common stock are from the New York Stock Exchange. JPMorgan Chase’s common stock is also listed and traded on the London Stock Exchange and the Tokyo Stock Exchange.
(g) Effective January 1, 2010, the Firm adopted new guidance that amended the accounting for the transfer of financial assets and the consolidation of VIEs. Upon adoption of the new guidance, the Firm consolidated its Firm-sponsored credit card securitization trusts, Firm-administered multi-seller conduits and certain other consumer loan securitiza-tion entities, primarily mortgage-related, adding $87.7 billion and $92.2 billion of assets and liabilities, respectively, and decreasing stockholders’ equity and the Tier 1 capital ratio by $4.5 billion and 34 basis points, respectively. The reduction to stockholders’ equity was driven by the establishment of an allowance for loan losses of $7.5 billion (pretax) primarily related to receivables held in credit card securitization trusts that were consolidated at the adoption date.
(h) The Firm uses Tier 1 common along with the other capital measures to assess and monitor its capital position. The Tier 1 common ratio is Tier 1 common divided by risk-weighted assets. For further discussion, see Regulatory capital on pages 102–104 of this Annual Report.
(i) Excludes the impact of home lending PCI loans and loans held by the Washington Mutual Master Trust. For further discussion, see Allowance for credit losses on pages 139–141 of this Annual Report.

JPMorgan Chase & Co./2010 Annual Report 299
Short-term and other borrowed funds The following table provides a summary of JPMorgan Chase’s short-term and other borrowed funds for the years indicated.
(a) Includes securities sold but not yet purchased. (b) Included on the Consolidated Balance Sheets in beneficial interests issued by consolidated variable interest entities. (c) Reflects a benefit from the favorable market environments for U.S. dollar-roll financings.
Federal funds purchased represent overnight funds. Securities
loaned or sold under repurchase agreements generally mature
between one day and three months. Commercial paper generally is
issued in amounts not less than $100,000, and with maturities of
270 days or less. Other borrowed funds consist of demand notes,
term federal funds purchased, and various other borrowings that
generally have maturities of one year or less.
As of or for the year ending December 31, (in millions, except rates) 2010 2009 2008 Federal funds purchased and securities loaned or sold under repurchase agreements: Balance at year-end $ 276,644 $ 261,413 $ 192,546 Average daily balance during the year 278,603 275,862 196,739 Maximum month-end balance 314,161 310,802 224,075 Weighted-average rate at December 31 0.18% 0.04% 0.97% Weighted-average rate during the year (0.07)(c) 0.21 2.37
Commercial paper: Balance at year-end $ 35,363 $ 41,794 $ 37,845 Average daily balance during the year 36,000 39,055 45,734 Maximum month-end balance 50,554 53,920 54,480 Weighted-average rate at December 31 0.21% 0.18% 0.82 % Weighted-average rate during the year 0.20 0.28 2.24
Other borrowed funds:(a)
Balance at year-end $ 134,256 $ 120,686 $ 177,674 Average daily balance during the year 121,949 130,767 118,714 Maximum month-end balance 137,347 188,004 244,040 Weighted-average rate at December 31 4.48% 3.37% 3.65 % Weighted-average rate during the year 2.34 2.92 4.29
Short-term beneficial interests:(b)
Commercial paper and other borrowed funds: Balance at year-end $ 25,095 $ 4,787 $ — Average daily balance during the year 21,853 3,275 1,846 Maximum month-end balance 25,095 7,751 3,459 Weighted-average rate at December 31 0.25% 0.17% NA Weighted-average rate during the year 0.27 0.24 2.49%
Glossary of Terms
JPMorgan Chase & Co./2010 Annual Report 300
ACH: Automated Clearing House.
Advised lines of credit: An authorization which specifies the
maximum amount of a credit facility the Firm has made available to
an obligor on a revolving but non-binding basis. The borrower
receives written or oral advice of this facility. The Firm may cancel
this facility at any time.
Allowance for loan losses to total loans: Represents period-
end Allowance for loan losses divided by retained loans.
Assets under management: Represent assets actively man-
aged by AM on behalf of Private Banking, Institutional and Retail
clients. Includes “Committed capital not Called,” on which AM
earns fees. Excludes assets managed by American Century Com-
panies, Inc., in which the Firm has a 41% ownership interest as
of December 31, 2010.
Assets under supervision: Represent assets under management
as well as custody, brokerage, administration and deposit accounts.
Average managed assets: Refers to total assets on the Firm’s
Consolidated Balance Sheets plus credit card receivables that have
been securitized and removed from the Firm’s Consolidated Bal-
ance Sheets, for periods ended prior to the January 1, 2010, adop-
tion of new accounting guidance requiring the consolidation of the
Firm-sponsored credit card securitization trusts.
Bear Stearns merger: Effective May 30, 2008, JPMorgan Chase
merged with The Bear Stearns Companies Inc. (“Bear Stearns”),
and Bear Stearns became a wholly-owned subsidiary of JPMorgan
Chase. The final total purchase price to complete the merger was
$1.5 billion. For additional information, see Note 2 on pages 166–
170 of this Annual Report.
Beneficial interest issued by consolidated VIEs: Represents
the interest of third-party holders of debt/equity securities, or other
obligations, issued by VIEs that JPMorgan Chase consolidates. The
underlying obligations of the VIEs consist of short-term borrowings,
commercial paper and long-term debt. The related assets consist of
trading assets, available-for-sale securities, loans and other assets.
Benefit obligation: Refers to the projected benefit obligation for
pension plans and the accumulated postretirement benefit obliga-
tion for OPEB plans.
CAGR: Compound annual growth rate.
Corporate/Private Equity: Includes Private Equity, Treasury and
Chief Investment Office, and Corporate Other, which includes other
centrally managed expense and discontinued operations.
Credit card securitizations: For periods ended prior to the
January 1, 2010, adoption of new guidance relating to the account-
ing for the transfer of financial assets and the consolidation of VIEs,
CS’ results were presented on a “managed” basis that assumed
that credit card loans that had been securitized and sold in accor-
dance with U.S. GAAP remained on the Consolidated Balance
Sheets and that earnings on the securitized loans were classified in
the same manner as the earnings on retained loans recorded on the
Consolidated Balance Sheets. “Managed” results excluded the
impact of credit card securitizations on total net revenue, the provi-
sion for credit losses, net charge-offs and loans. Securitization did
not change reported net income; however, it did affect the classifi-
cation of items on the Consolidated Statements of Income and
Consolidated Balance Sheets.
Credit derivatives: Contractual agreements that provide protec-
tion against a credit event on one or more referenced credits. The
nature of a credit event is established by the protection buyer and
protection seller at the inception of a transaction, and such events
include bankruptcy, insolvency or failure to meet payment obliga-
tions when due. The buyer of the credit derivative pays a periodic
fee in return for a payment by the protection seller upon the occur-
rence, if any, of a credit event.
Credit cycle: A period of time over which credit quality improves,
deteriorates and then improves again. The duration of a credit cycle
can vary from a couple of years to several years.
Deposit margin: Represents net interest income expressed as a
percentage of average deposits.
Discontinued operations: A component of an entity that is
classified as held-for-sale or that has been disposed of from ongo-
ing operations in its entirety or piecemeal, and for which the entity
will not have any significant, continuing involvement. A discontin-
ued operation may be a separate major business segment, a com-
ponent of a major business segment or a geographical area of
operations of the entity that can be separately distinguished opera-
tionally and for financial reporting purposes.
FASB: Financial Accounting Standards Board.
FDIC: Federal Deposit Insurance Corporation.
FICO: Fair Isaac Corporation.
Forward points: Represents the interest rate differential between
two currencies, which is either added to or subtracted from the
current exchange rate (i.e., “spot rate”) to determine the forward
exchange rate.
FRBB: Federal Reserve Bank of Boston.
Headcount-related expense: Includes salary and benefits (ex-
cluding performance-based incentives), and other noncompensation
costs related to employees.
Interchange income: A fee that is paid to a credit card issuer in
the clearing and settlement of a sales or cash advance transaction.
Interests in purchased receivables: Represents an ownership
interest in cash flows of an underlying pool of receivables trans-
ferred by a third-party seller into a bankruptcy-remote entity,
generally a trust.
Investment-grade: An indication of credit quality based on JPMor-
gan Chase’s internal risk assessment system. “Investment grade”
JPMorgan Chase & Co./2010 Annual Report 301
generally represents a risk profile similar to a rating of a “BBB-”/
”Baa3” or better, as defined by independent rating agencies.
LLC: Limited Liability Company.
Loan-to-value (“LTV”) ratio: For residential real estate loans,
the relationship expressed as a percent, between the principal
amount of a loan and the appraised value of the collateral (i.e.,
residential real estate) securing the loan.
Origination date LTV ratio
The LTV ratio at the origination date of the loan. Origination date
LTV ratios are calculated based on the actual appraised values of
collateral (i.e., loan-level data) at the origination date.
Current estimated LTV ratio
An estimate of the LTV as of a certain date. The current estimated
LTV ratios are calculated using estimated collateral values derived
from a nationally recognized home price index measured at the MSA
level. These MSA-level home price indices comprise actual data to the
extent available and forecasted data where actual data is not avail-
able. As a result, the estimated collateral values used to calculate
these ratios do not represent actual appraised loan-level collateral
values; as such, the resulting LTV ratios are necessarily imprecise and
should therefore be viewed as estimates.
Combined LTV ratio
The LTV ratio considering all lien positions related to the property.
Combined LTV ratios are used for junior lien home equity products.
Managed basis: A non-GAAP presentation of financial results
that includes reclassifications to present revenue on a fully taxable-
equivalent basis, and for periods ended prior to the January 1,
2010, adoption of accounting guidance relating to the accounting
for the transfer of financial assets and the consolidation of VIEs
related to credit card securitizations. Management uses this non-
GAAP financial measure at the segment level, because it believes
this provides information to enable investors to understand the
underlying operational performance and trends of the particular
business segment and facilitates a comparison of the business
segment with the performance of competitors.
Managed credit card portfolio: Refers to credit card receivables
on the Firm’s Consolidated Balance Sheets plus credit card receiv-
ables that have been securitized and removed from the Firm’s
Consolidated Balance Sheets, for periods ended prior to the January
1, 2010, adoption of new guidance requiring the consolidation of
the Firm-sponsored credit card securitization trusts.
Mark-to-market exposure: A measure, at a point in time, of the
value of a derivative or foreign exchange contract in the open
market. When the MTM value is positive, it indicates the counter-
party owes JPMorgan Chase and, therefore, creates credit risk for
the Firm. When the MTM value is negative, JPMorgan Chase owes
the counterparty; in this situation, the Firm has liquidity risk.
Master netting agreement: An agreement between two coun-
terparties who have multiple derivative contracts with each other
that provides for the net settlement of all contracts, as well as cash
collateral, through a single payment, in a single currency, in the
event of default on or termination of any one contract.
Merger costs: Reflects costs associated with the Bear Stearns
merger and the Washington Mutual transaction in 2008.
Mortgage product types:
Alt-A
Alt-A loans are generally higher in credit quality than subprime loans
but have characteristics that would disqualify the borrower from a
traditional prime loan. Alt-A lending characteristics may include one
or more of the following: (i) limited documentation; (ii) high com-
bined-loan-to-value (“CLTV”) ratio; (iii) loans secured by non-owner
occupied properties; or (iv) debt-to-income ratio above normal limits.
Perhaps the most important characteristic is limited documentation. A
substantial proportion of traditional Alt-A loans are those where a
borrower does not provide complete documentation of his or her
assets or the amount or source of his or her income.
Option ARMs
The option ARM real estate loan product is an adjustable-rate
mortgage loan that provides the borrower with the option each
month to make a fully amortizing, interest-only, or minimum
payment. The minimum payment on an option ARM loan is based
on the interest rate charged during the introductory period. This
introductory rate is usually significantly below the fully indexed
rate. The fully indexed rate is calculated using an index rate plus
a margin. Once the introductory period ends, the contractual
interest rate charged on the loan increases to the fully indexed
rate and adjusts monthly to reflect movements in the index. The
minimum payment is typically insufficient to cover interest ac-
crued in the prior month, and any unpaid interest is deferred and
added to the principal balance of the loan. Option ARM loans are
subject to payment recast, which converts the loan to a variable-
rate fully amortizing loan upon meeting specified loan balance
and anniversary date triggers.
Prime
Prime mortgage loans generally have low default risk and are made
to borrowers with good credit records and a monthly income that is
at least three to four times greater than their monthly housing
expense (mortgage payments plus taxes and other debt payments).
These borrowers provide full documentation and generally have
reliable payment histories.
Subprime
Subprime loans are designed for customers with one or more high
risk characteristics, including but not limited to: (i) unreliable or
poor payment histories; (ii) a high LTV ratio of greater than 80%
(without borrower-paid mortgage insurance); (iii) a high debt-to-
income ratio; (iv) an occupancy type for the loan is other than the
borrower’s primary residence; or (v) a history of delinquencies or
late payments on the loan.
MSR risk management revenue: Includes changes in MSR asset
fair value due to market-based inputs, such as interest rates and
volatility, as well as updates to assumptions used in the MSR

Glossary of Terms
JPMorgan Chase & Co./2010 Annual Report 302
valuation model; and derivative valuation adjustments and other,
which represents changes in the fair value of derivative instruments
used to offset the impact of changes in the market-based inputs to
the MSR valuation model.
Multi-asset: Any fund or account that allocates assets under
management to more than one asset class (e.g., long-term fixed
income, equity, cash, real assets, private equity, or hedge funds).
NA: Data is not applicable or available for the period presented.
Net charge-off ratio: Represents net charge-offs (annualized)
divided by average retained loans for the reporting period.
Net yield on interest-earning assets: The average rate for
interest-earning assets less the average rate paid for all sources of
funds.
NM: Not meaningful.
Nonconforming mortgage loans: Mortgage loans that do not
meet the requirements for sale to U.S. government agencies and
U.S. government sponsored enterprises. These requirements include
limits on loan-to-value ratios, loan terms, loan amounts, down
payments, borrower creditworthiness and other requirements.
OPEB: Other postretirement employee benefits.
Overhead ratio: Noninterest expense as a percentage of total net
revenue.
Participating securities: Represent unvested stock-based com-
pensation awards containing nonforfeitable rights to dividends or
dividend equivalents (collectively,”dividends”), which are included
in the earnings per share calculation using the two-class method.
JPMorgan Chase grants restricted stock and RSUs to certain em-
ployees under its stock-based compensation programs, which
entitle the recipients to receive nonforfeitable dividends during the
vesting period on a basis equivalent to the dividends paid to hold-
ers of common stock. These unvested awards meet the definition of
participating securities. Under the two-class method, all earnings
(distributed and undistributed) are allocated to each class of com-
mon stock and participating securities, based on their respective
rights to receive dividends.
Personal bankers: Retail branch office personnel who acquire,
retain and expand new and existing customer relationships by
assessing customer needs and recommending and selling appropri-
ate banking products and services.
Portfolio activity: Describes changes to the risk profile of existing
lending-related exposures and their impact on the allowance for
credit losses from changes in customer profiles and inputs used to
estimate the allowances.
Pre-provision profit: The Firm believes that this financial meas-
ure is useful in assessing the ability of a lending institution to
generate income in excess of its provision for credit losses.
Pretax margin: Represents income before income tax expense
divided by total net revenue, which is, in management’s view, a
comprehensive measure of pretax performance derived by measur-
ing earnings after all costs are taken into consideration. It is, there-
fore, another basis that management uses to evaluate the
performance of TSS and AM against the performance of their
respective competitors.
Principal transactions: Realized and unrealized gains and losses
from trading activities (including physical commodities inventories
that are accounted for at the lower of cost or fair value) and
changes in fair value associated with financial instruments held
predominantly by IB for which the fair value option was elected.
Principal transactions revenue also includes private equity gains and
losses.
Purchased credit-impaired (“PCI“) loans: Acquired loans
deemed to be credit-impaired under the FASB guidance for PCI
loans. The guidance allows purchasers to aggregate credit-impaired
loans acquired in the same fiscal quarter into one or more pools,
provided that the loans have common risk characteristics (e.g.,
FICO score, geographic location). A pool is then accounted for as a
single asset with a single composite interest rate and an aggregate
expectation of cash flows. Wholesale loans are determined to be
credit-impaired if they meet the definition of an impaired loan
under U.S. GAAP at the acquisition date. Consumer loans are
determined to be credit-impaired based on specific risk characteris-
tics of the loan, including product type, LTV ratios, FICO scores, and
past due status.
Real estate investment trust (“REIT”): A special purpose
investment vehicle that provides investors with the ability to par-
ticipate directly in the ownership or financing of real-estate related
assets by pooling their capital to purchase and manage income
property (i.e., equity REIT) and/or mortgage loans (i.e., mortgage
REIT). REITs can be publicly- or privately-held and they also qualify
for certain favorable tax considerations.
Receivables from customers: Primarily represents margin loans
to prime and retail brokerage customers which are included in
accrued interest and accounts receivable on the Consolidated
Balance Sheets for the wholesale lines of business.
Reported basis: Financial statements prepared under U.S. GAAP,
which excludes the impact of taxable-equivalent adjustments. For
periods ended prior to the January 1, 2010, adoption of new guid-
ance requiring the consolidation of the Firm-sponsored credit card
securitization trusts, the reported basis included the impact of credit
card securitizations.
Retained loans: Loans that are held for investment excluding
loans held-for-sale and loans at fair value.
Sales specialists: Retail branch office personnel who specialize in
the marketing of a single product, including mortgages, invest-
ments and business banking, by partnering with the personal
bankers.
Seed capital: Initial JPMorgan capital invested in products, such
as mutual funds, with the intention of ensuring the fund is of

JPMorgan Chase & Co./2010 Annual Report 303
sufficient size to represent a viable offering to clients, enabling
pricing of its shares, and allowing the manager to develop a com-
mercially attractive track record. After these goals are achieved, the
intent is to remove the Firm’s capital from the investment.
Stress testing: A scenario that measures market risk under
unlikely but plausible events in abnormal markets.
TARP: Troubled Asset Relief Program.
Taxable-equivalent basis: Total net revenue for each of the
business segments and the Firm is presented on a tax-equivalent
basis. Accordingly, revenue from tax-exempt securities and invest-
ments that receive tax credits is presented in the managed results
on a basis comparable to fully taxable securities and investments.
This non-GAAP financial measure allows management to assess the
comparability of revenue arising from both taxable and tax-exempt
sources. The corresponding income tax impact related to these
items is recorded within income tax expense.
Troubled debt restructuring (“TDR”): Occurs when the Firm
modifies the original terms of a loan agreement by granting a
concession to a borrower that is experiencing financial difficulty.
Unaudited: Financial statements and information that have not
been subjected to auditing procedures sufficient to permit an
independent certified public accountant to express an opinion.
U.S. GAAP: Accounting principles generally accepted in the United
States of America.
U.S. government and federal agency obligations: Obliga-
tions of the U.S. government or an instrumentality of the U.S.
government whose obligations are fully and explicitly guaranteed
as to the timely payment of principal and interest by the full faith
and credit of the U.S. government.
U.S. government-sponsored enterprise obligations: Obliga-
tions of agencies originally established or chartered by the U.S.
government to serve public purposes as specified by the U.S. Con-
gress; these obligations are not explicitly guaranteed as to the
timely payment of principal and interest by the full faith and credit
of the U.S. government.
U.S. Treasury: U.S. Department of the Treasury.
Value-at-risk (“VaR”): A measure of the dollar amount of poten-
tial loss from adverse market moves in an ordinary market envi-
ronment.
Washington Mutual transaction: On September 25, 2008,
JPMorgan Chase acquired the banking operations of Washington
Mutual Bank (“Washington Mutual”) from the FDIC for $1.9 bil-
lion. The final allocation of the purchase price resulted in the rec-
ognition of negative goodwill and an extraordinary gain of $2.0
billion. For additional information, see Note 2 on pages 166–170
of this Annual Report.