Embed Size (px)
Citation preview

Management of Containers by the Use of Automatic Cranes- New Handling Method Master of Science Thesis in Maritime Management
JAMIL HASSAN JASIM
Department of Technology Management and Economics Division of Logistics and Transportation CHALMERS UNIVERSITY OF TECHNOLOGY Gothenburg, Sweden 2015
Report No E 2015:081


I CHALMERS, Technology Management and Economics, Master’s Thesis E 2015: 081
MASTER’S THESIS E 2015:081
Management of Containers by the use of Automatic Cranes-
New Handling Method
JAMIL HASSAN JASIM
Examiner: Prof. Dr. Kent Lumsden
Supervisor Dr. Henrik Ringberg
Supervisor Mr. Olle Lindmark
Department of Technology Management and Economics
Division of Logistics and Transportation
CHALMERS UNIVERSITY OF TECHNOLOGY
Gothenburg, Sweden 2015

II CHALMERS, Technology Management and Economics, Master’s Thesis E 2015: 081
Management of Containers by the Use of Automatic Cranes- New Handling Method
Jamil Hassan Jasim
© JAMIL HASSAN JASIM, 2015.
Master’s Thesis E 2015: 081
Department of Technology Management and Economics
Division of Logistics and Transportation
Chalmers University of Technology
SE-412 96 Gothenburg, Sweden Telephone: + 46 (0)31-772 1000
Cover: Modified photo of 3DS Max® prototype, container terminal equipment, 2015
Chalmers Reproservice Gothenburg, Sweden 2015

III
CHALMERS, Technology Management and Economics, Master’s E 2015: 081
Master’s Thesis in the International Master’s Programme in Maritime Management
Department of Technology Management and Economics
Division of Logistics and Transportation
Chalmers University of Technology
Abstract
The sea-born trade represents the greatest proportion of the international trade activities, almost
90% of world freight cargoes being carried by sea. This high rate is normally accompanied by
regenerating problems. To master the challenges of the steady growth of overcrowding and
congestion issues in the world's major ports, we need to maintain a stable balance between supply
chain components within maritime transportation.
That required overcoming the disparity in performance between the various stages of productivity
operations. One of these stages is the stacking yard in the container terminals which suffers from
the unintended waste of time. In this research, we are trying to identify the potential causes for this
issue.
This study does not aim to reinvent the wheel, but to uncover the hidden advantages of the concept
of AS/RS in the maritime domain. This concept did not gain its fair share of the tremendous
quantity of technical applications. We find it will be of interest to shed some light on this issue
from the different point of view by highlighting the non-value added time steps. Especially if it
could be done with means at hand and circumstances as they are. The purpose of this research is
to highlight the importance of filling the gap between the more efficient mega- ship that use more
sophisticated technologies and the performance of the end station of its journey; the port, by
finding effective solutions to reduce the time problems arising during the operations within the
superior ports, the container terminals which in turn will reduce the cost.
Three materials used to produce this study are the statistical tools, literature reviews and one of
the most advanced graphic computer software, the 3ds Max®.
As a result, the study shows clearly that the causes are a bunch of unnecessary steps leads to time
losing.
Keywords: AS/RS, automation, containers, gantry crane, lead-time, Terminals

IV CHALMERS, Technology Management and Economics, Master’s Thesis E 2015: 081

CHALMERS, Technology Management and Economics, Master’s Thesis E 2015: 081 V
Contents
1 INTRODUCTION ................................................................................................................... 1
1.1. Background ................................................................................................................................... 1
1.2. Research Approach ....................................................................................................................... 5
1.3. Research Purpose and Question .................................................................................................... 6
1.4. Research Objectives ...................................................................................................................... 7
1.5. Limitations .................................................................................................................................... 7
2 METHODOLOGY .................................................................................................................. 9
2.1 Literature review ......................................................................................................................... 10
2.2 Hypothesis in Research ............................................................................................................... 11
2.2.1 Selection of Hypothesis Testing Variables ......................................................................... 11
Controlled Variables or Uncontrolled Variables................................................................................. 12
Operationalization of Variables .......................................................................................................... 12
2.2.2 Hypothesis formulation ....................................................................................................... 13
2.2.3 Hypothesis testing ............................................................................................................... 15
2.3 Research Validity ........................................................................................................................ 16
2.4 Analysis Framework ................................................................................................................... 17
3 EMPIRICAL DATA.............................................................................................................. 19
3.1 Scenarios Data Collection ........................................................................................................... 20
Size of Containers ............................................................................................................................... 21
Scenario 1 Target container picked up and relocated on the mover (one bay, one tier) ......................... 22
Scenario 2 Target container picked up and relocated on the mover (one bay, six tiers) ......................... 24
Scenario 3 Target container picked up and relocated on the mover (two different bays, six tiers) ........ 25
3.2 Summary Scenarios Data Collection .......................................................................................... 27
4 FRAME OF REFERENCE ................................................................................................... 29
4.1 The Emergence of Container Era ................................................................................................ 31
4.2 Automatic structures/ cranes ....................................................................................................... 32
4.3 Terminal Planning and Management operations ......................................................................... 33
4.4 Structure of the Stacking area ..................................................................................................... 35
4.5 Cranes ......................................................................................................................................... 37
Quay Cranes ........................................................................................................................................ 38

VI CHALMERS, Technology Management and Economics, Master’s Thesis E 2015: 081
Yard cranes ......................................................................................................................................... 39
Gantry crane of landside area .............................................................................................................. 40
4.6 Vehicles....................................................................................................................................... 41
Trucks ................................................................................................................................................. 42
Straddle carriers .................................................................................................................................. 42
Automatic Guided Vehicles (AGV) and Automated Lifting Vehicles (ALV) ................................... 43
5 RESULTS AND ANALYSIS ............................................................................................... 45
5.1 Impact on Lead-time ................................................................................................................... 45
5.2 Impact on Wasted Time (NVA-time) ......................................................................................... 46
5.3 Approaches to reducing lead-time and waste-time ..................................................................... 47
5.4 Advantages and disadvantages implementing automatic stacking systems ................................ 48
5.4.1 Automatic Storage and Retrieval System (AS/RS) ............................................................. 48
5.4.2 Automatic Gantry Crane (AGC) system ............................................................................. 49
6 CONCLUSIONS AND DISCUSSIONS ............................................................................... 51
6.1 Theoretical Contributions ........................................................................................................... 52
6.2 Practical contributions................................................................................................................. 54
REFERENCES ............................................................................................................................. 55
APPENDICIES ............................................................................................................................. 59
APPENDIX A: Scenario 1 – Calculations using MS-Excel ................................................................... 60
APPENDIX B: Scenario 2 – Calculations using MS-Excel ................................................................... 61
APPENDIX C: Implementation of simulated experiment using 3D Max® ........................................... 62
APPENDIX D: Container Dimensions (Metric) ..................................................................................... 63
APPENDIX E: Specifications of Automated Gantry Crane ................................................................... 64
APPENDIX F: Summary of container-stacking references .................................................................... 65

CHALMERS, Technology Management and Economics, Master’s Thesis E 2015: 081 VII
List of Figures
Figure 1: Remarkable analogy between how books organized, retrieved and handled in library (top) and
containers in terminal (bottom) ................................................................................................................... 2
Figure 2: A framework to execute the literature review .............................................................................. 5
Figure 3: Research Methodology (Yasir & Usman, 2009) ............................................................................. 9
Figure 4: Cause and Effect of impact in lead-time in SSA ........................................................................... 13
Figure 5: Data for testing hypothesis .......................................................................................................... 14
Figure 6: Normal distribution for the given hypothesis .............................................................................. 15
Figure 7: Analysis Framework ..................................................................................................................... 17
Figure 8: Lead-time within the container terminal ..................................................................................... 19
Figure 9: Distance- Speed-Time triangle ..................................................................................................... 21
Figure 10: ISO standard Container dimensions .......................................................................................... 21
Figure 11: Front view of the stack, scenario 1 ............................................................................................ 23
Figure 12: Front view of the stack, scenario 2 ............................................................................................ 24
Figure 13: Value Added-time of scenario 2 ................................................................................................ 25
Figure 14: Illustration of scenario 3 ............................................................................................................ 26
Figure 15: Cranes in cross- over configuration- Source (Valkengoed, 2004) ............................................. 30
Figure 16: Container terminal layout – Source (Böse, 2011) ...................................................................... 36
Figure 17: Stack configuration; a) block with transfer points. b) Block with side lane. c) Lane stack (Wiese,
2011) ........................................................................................................................................................... 37
Figure 18: Ship-To- Shore Crane, (konecranes, 2015) ................................................................................ 38
Figure 19: Quay crane: a) single cycling b) double cycling (Ioannou, 2008) ............................................... 39
Figure 20: Yard cranes: A) RTGC, B) RGC .................................................................................................... 40
Figure 21: Gantry carne of Landside ........................................................................................................... 41
Figure 22: A straddle carrier (Loretah, 2015) .............................................................................................. 42
Figure 23: ALV in action .............................................................................................................................. 44
Figure 24: Comparison between AGC and AS/RS ....................................................................................... 46
Figure 25: Visualization of a proposed AS/RS Systems ............................................................................... 48
List of Tables
Table 1: Comparison between the three scenarios .................................................................................... 27
Table 2: Calculation of Waste Time ............................................................................................................ 47
Table 3: Container Dimensions (Metric) - Standard External Container Dimensions- Source ................... 63
Table 4: Comparision between different references that handles containers-stacking ............................ 66

VIII CHALMERS, Technology Management and Economics, Master’s Thesis E 2015: 081

CHALMERS, Technology Management and Economics, Master’s Thesis E 2015: 081 IX
Preface
I would like to express my deepest gratitude to my supervisor DR. Henrik Ringsberg for the useful
comments, remarks and engagement through the learning process of this master thesis.
Furthermore, I would like to extend my thanks to Prof. Dr. Kent Lumsden and the director of the
program Mr. Olle Lindmark for evaluating and assessing my thesis and introducing me to the topic
as well for the support of the method.
Special thanks to the Department of Logistics and Transportation who agreed to introduce me to
my Dr. Henrik, who in turn with his motivation and enthusiasm encouraged my selection of the
topic.
I owe many thanks and appreciation to my beloved sister Wijdan for her support and endless
patience; I am blessed to have such a compassionate sister. Thank you for always being there,
standing by me through thick and thin.
My wife, Thank you for your patience and endurance, thanks for always took care of our kids,
Nawwar, Fadi and Sara. Kids, sorry for I could not play with you as much as we all wanted, and
promise to make it up to you.
I would like to thank my loved ones, who were patient and who have supported me spiritually
during the last two years. I will be thankful forever for your love.
I was privileged to get this opportunity to work with my teachers, supervisors and colleague.
During the last two years, this journey comes to the fruitful ends where it enriches my knowledge
and strengthen my experience. I am fortunate in being titled as one of a graduate from the
University of Chalmers.
Göteborg, June 2015

X CHALMERS, Technology Management and Economics, Master’s Thesis E 2015: 081
CHALMERS, Technology Management and Economics, Master’s Thesis E 2015: 081 XI
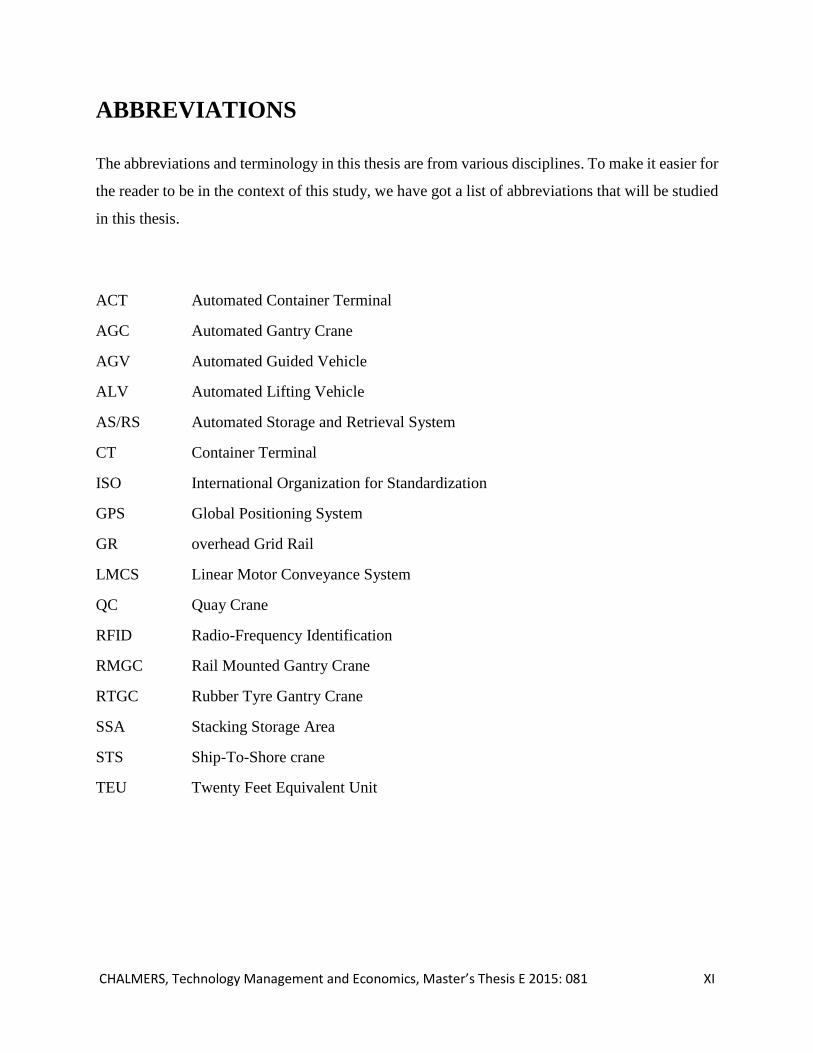
ABBREVIATIONS
The abbreviations and terminology in this thesis are from various disciplines. To make it easier for
the reader to be in the context of this study, we have got a list of abbreviations that will be studied
in this thesis.
ACT Automated Container Terminal
AGC Automated Gantry Crane
AGV Automated Guided Vehicle
ALV Automated Lifting Vehicle
AS/RS Automated Storage and Retrieval System
CT Container Terminal
ISO International Organization for Standardization
GPS Global Positioning System
GR overhead Grid Rail
LMCS Linear Motor Conveyance System
QC Quay Crane
RFID Radio-Frequency Identification
RMGC Rail Mounted Gantry Crane
RTGC Rubber Tyre Gantry Crane
SSA Stacking Storage Area
STS Ship-To-Shore crane
TEU Twenty Feet Equivalent Unit

XII CHALMERS, Technology Management and Economics, Master’s Thesis E 2015: 081

CHALMERS, Technology Management and Economics, Master’s Thesis E 2015: 081 1
1 INTRODUCTION
1.1. Background
Satisfying shipping liners by achieving their requirements represented by reducing the turnaround
time of the vessels, increasing throughput, dropping the costs and solve the problem of congestion
in the harbours is the main goal for every terminal within the maritime industry. Emerge of
containerization was a real solution to increase the speed of loading and discharging from the ships
and minimise costly berthing time. Furthermore, transport the cargo in containers providing an
excellent protection to the cargo itself from breakage, thefts and contaminations that help to thrive
in today’s global economy (Agerschou, 2004).
In the current business world; creating a competitive advantage in any industry considered as the
main criteria to differentiate the pioneer companies. This advantage could be achieved by
providing value to the customers as stakeholders in this industry. The value is their needs or more
than their expected needs. One of the quality management pillars that are serving this goal is the
lean production concept. Some of the main principles of this concept are: reduce movement and
eliminate the waste time, (Bo & Bengt, 2010).
The lead-time is the time between the initiation and completion of a production process (Angus &
Maurice, 2011). The part of “Lead-time” of a container handling process that falls within the
container terminals involves only two things: the value or the waste. It is important to identify the
process steps that don’t create value and minimize them as possible by using a new concepts and
technologies.
The inventory takes up space in the terminal, waste the time and eats capital as it is required
stacking, storage, retrieval and transportation.
The central point of this study focused on creating two peer models of container handling
equipment used for lift and move containers in a stacking storage area of a virtual container
terminal. The reason we opted for a virtual terminal because it is difficult to conduct research in a
port has no automatic handling equipment as the case in Sweden. The ground for selecting the
stacking storage area as the core of this study is because from our point of view the stacking area

2 CHALMERS, Technology Management and Economics, Master’s Thesis E 2015: 081
in the terminal bears to a large extent the brunt of the delay. This delay leads to confusion between
the operations stages.
One of these two models is derived from an existing unit in the real world, a modern automated
gantry crane KONECRANE that performs storage and relocating operations without man's
intervention (Business, 2012). That crane is doing the work with a high degree of efficient
performance but following the traditional way of container handling process, picking up
containers. The other model is a virtual unit that should act in a manner similar to the concept of
AS/RS systems in warehouses, large libraries and even in smart parking systems (Tan, 2015). This
concept suggests to pulling or pushing containers horizontally from storage racks with a specified
machine running beside the rack as illustrated in (Figure 1).
A three-dimensional software, 3d max® with high precision, rendering and animating of the
model’s activities been used to create the two models. By simulating three scenarios of handling
steps, we will draw a comparison between these two models to shedding a light on similarities and
differences and seek for whether the virtual model could suggest a promising results might enhance
Figure 1: Remarkable analogy between how books organized, retrieved and handled in library (top) and containers in terminal (bottom)

CHALMERS, Technology Management and Economics, Master’s Thesis E 2015: 081 3
the time and cost saving goal. As the container terminal involves several operation stages carrying
out sequentially to produce the service of loading and discharging so that any delay or waiting
time between stages consider as lost time affecting the entire performance of the terminal.
The fast increasing of the fundamental human needs that keep pace with the expected relative
growth of the population in the future. The related problems of congestion, increasing cargo
volumes, and the associated adverse environmental impacts, requires a review of the dynamic
circulation of goods. This review should involve the import/export operations, in the small or large
harbours that are considered the main hub ports of the process in international trade or within
inland transportations.
Inadequate planning, scheduling and managing of the processes within the harbour, add to time
waste by storage and retrieval operations will decrease the productivity and cause a delay in
transportation (Hans-Otto & Kap, 2005).
Nowadays, the size of massive ships, its high performance, efficiency and quality with the
optimum exploitation of new technology exceed the expectations of productivity and become more
sophisticated and integrated with that industries they served (Karlsen, 2015). This factor creates a
large gap among other partners in the supply chain of the shipping industry that are supposed to
complement each other to achieve the common goal. There is a proverb saying “A chain is no
stronger than its weakest link” (EnglishProverbs.in, 2015) which mean every part should be in a
same level of efficiency. One of the most important factors in the harbour performance efficiency
is the productivity that in turn is affected by the time spent in handling of cargo processes (Soberón,
2012).
Containerization as an essential component segment in combined with the bulk shipping and the
specialized shipping forming the new seaborne transport model that are leading the international
trade. This trade, which emerged gradually over the last five decades (Stopford, 2009).The
switching from the conventional pattern shipping of passenger liner, cargo liner and the tramp
shipping, demands a new systematically approach to coincides with the growth of the new
transport model. This model including the new types and size of ships, the establishment of new
4 CHALMERS, Technology Management and Economics, Master’s Thesis E 2015: 081
specialized terminals with suit depth of water and automated cargo-handling gear. All these
elements led to the dawn of the super- ports to serve these mammoth ships.
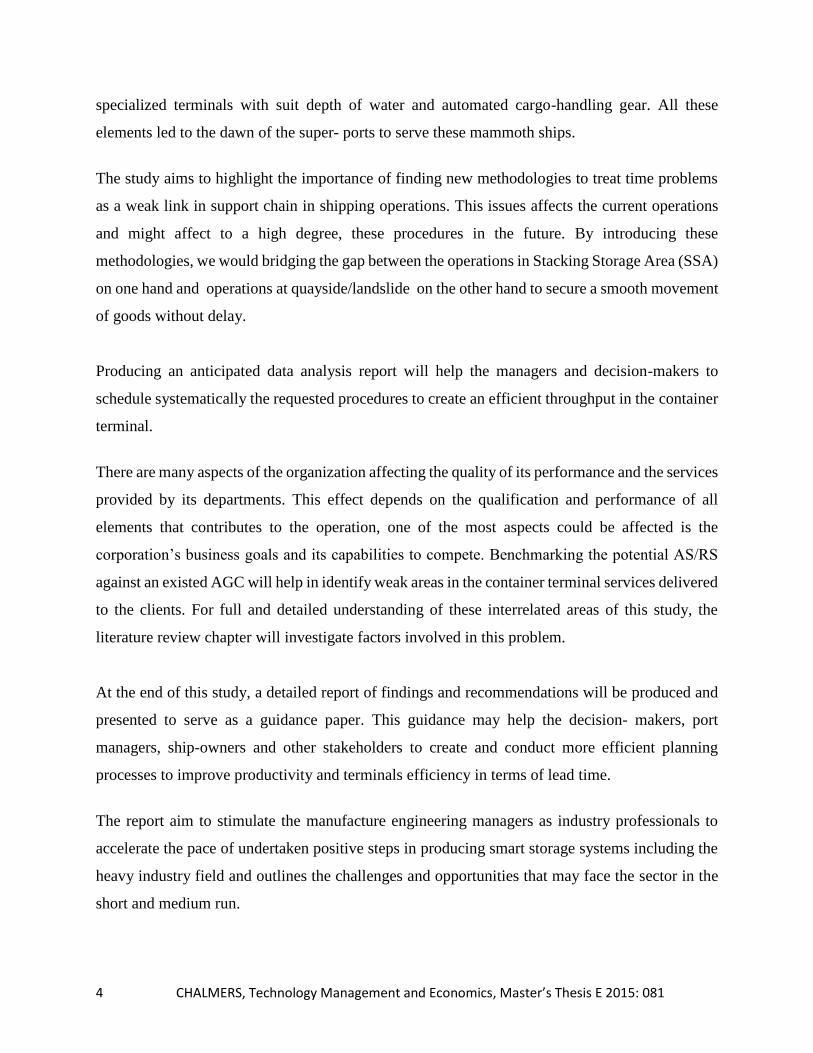
The study aims to highlight the importance of finding new methodologies to treat time problems
as a weak link in support chain in shipping operations. This issues affects the current operations
and might affect to a high degree, these procedures in the future. By introducing these
methodologies, we would bridging the gap between the operations in Stacking Storage Area (SSA)
on one hand and operations at quayside/landslide on the other hand to secure a smooth movement
of goods without delay.
Producing an anticipated data analysis report will help the managers and decision-makers to
schedule systematically the requested procedures to create an efficient throughput in the container
terminal.
There are many aspects of the organization affecting the quality of its performance and the services
provided by its departments. This effect depends on the qualification and performance of all
elements that contributes to the operation, one of the most aspects could be affected is the
corporation’s business goals and its capabilities to compete. Benchmarking the potential AS/RS
against an existed AGC will help in identify weak areas in the container terminal services delivered
to the clients. For full and detailed understanding of these interrelated areas of this study, the
literature review chapter will investigate factors involved in this problem.
At the end of this study, a detailed report of findings and recommendations will be produced and
presented to serve as a guidance paper. This guidance may help the decision- makers, port
managers, ship-owners and other stakeholders to create and conduct more efficient planning
processes to improve productivity and terminals efficiency in terms of lead time.
The report aim to stimulate the manufacture engineering managers as industry professionals to
accelerate the pace of undertaken positive steps in producing smart storage systems including the
heavy industry field and outlines the challenges and opportunities that may face the sector in the
short and medium run.

CHALMERS, Technology Management and Economics, Master’s Thesis E 2015: 081 5
1.2. Research Approach
Research approaches are plans and the procedures for research that span the steps from broad
assumptions to detailed methods of data collection, analysis, and interpretation (Creswell, 2003).
The selected research approach in this study is framework illustrated in (Figure 2).
Firstly we phrase a research question to address current lead-time problems by using current
handling equipment (within the stacking storage area of container terminals). Secondly, we
investigate and highlight the causes and effects of lead-time impact by use a simulation model of
AGC. This model derives from a real time and being compared with the lead-time of a virtual
AS/RS model. The virtual use the same real time’s specifications but executing the desired work
differently based on three scenarios and testing of hypothesis. The AS/RS model will be tested
based on empirical data from three different container-stacking scenarios.
Finally in a last stage the AS/RS system will be introduced as one of the potential solutions that
serve problem-solving.
The study will not involve any manufacturing engineering details. It is only a process of comparing
the performance of two machines, depending on the time difference calculations based on the data
collected from equipment profile, ports annual reports and reviewing the previous studies.
This study will be build based on the researcher thoughts represented by simulated situation about
the importance of saving time in the business as an invaluable asset for every corporation through
shipping industry, and the influence of increased performance gap between the supply chain parts.
Figure 2: A framework to execute the literature review

6 CHALMERS, Technology Management and Economics, Master’s Thesis E 2015: 081
As the research being conducted based on a literature reviews (look at the past), all information
that could be cited from another author will being mentioned in a well-respected manner and
protected editors rights far from any intentionally misinterpret or misrepresent.
1.3. Research Purpose and Question
The purpose of this study is to:
Investigate the factors affecting the performance productivity of one of the most modern
automated gantry crane in a container terminal.
These factors might cause non-value added time that in turn eliminate the port efficiency. The
results from this study aim to enhance the operation managers in the harbour to conducting
effective performance evaluations to test the processes outcomes of the current used equipment in
SSA of the terminal to re-estimate the accumulated time losing and search for a proper solution.
Based on the stated purpose; this study aims to answer the following research question:
“How lead-time within Stacking Storage Area of container terminals could be reduced to
improve the productivity and planning decisions?”

CHALMERS, Technology Management and Economics, Master’s Thesis E 2015: 081 7
1.4. Research Objectives
The purpose and the overall research question are rendered into six concrete and interdependent
research objectives;
1. To evaluate the potential establishment of Automated Storage and Retrieval facilities in ports
in term of compromising advantage against disadvantage.
2. To define different screening and handling processes and equipment in the container terminal.
3. To introduce the new concept of automation and integrated systems.
4. To give a tangible evidence of the scarcity in current manoeuvring of containers through the
stacking block.
5. To assess container terminal efficiency in term of the time required for processing and handling
containers compared to a traditional gantry crane.
6. To construct an analysis report to identify significant pros and cons.
1.5. Limitations
The aim of this study is to gather information about the scarcity of AGC performance by identify
the source of delay in time between the different stages of container handling operation in the
storage yard. We do that by reviewing as much relevant literature as possible for the subject and
using them to build a model of automation storage and retrieval systems that simulate reality. The
scale will be the existing and the potential virtual equipment working in various handling
operations in a modern container port. The limitation represented by the unavailability of real data
produced from using AS/RS system. Alternatively, a simulated experiment used to release data to
be employed in the hypothesis section. As well as the unavailability of AGC in the Sweden. Due
to the lack of information about acceleration and deceleration of the crane movement as it was not
present in the data sheet, so these will not be taken into consideration in the calculation section.
Also this study will investigate the advantages and disadvantages of the current procedures and of
the virtual one to determine and identify an efficient framework used in the handling process and
investigates any weakness and/or strength in these processes.

8 CHALMERS, Technology Management and Economics, Master’s Thesis E 2015: 081

CHALMERS, Technology Management and Economics, Master’s Thesis E 2015: 081 9
2 METHODOLOGY
Thomas Edison states “There is a better way! Find it!” and "There is always an easy solution to
every human problem - neat, plausible, and wrong.”. (Mencken, 1949, p. 443). Introducing new
ideas is not the core issue but how to change the old way of doing things is the real challenge.
(Henesey, 2006) Defined methodology provides tools and techniques that researchers can use for
gaining knowledge, firmer understanding and solving problems.
Reviewing what experts in the field have published about the value and drawbacks of the topic
and use this relevant literature review, considered valuable sources of data to achieve the study
and reveal the hiding aspect of the problem or interpret the concepts from different perspective,
that help to see the big picture of the puzzle.
As demonstrated in (Figure 3) it is clear that the desired research will follow a systematic approach
that supported by hypothesis. As a result, a model will be derived, developed and represented by
building and testing a hypothesis.
Approved description sheets for many types of
equipment provided by a reputable source could be a
well source of some general features required to
enhance the assessment process for choosing the best
among the peers. Such data easily collected from the
websites, purchase profiles, manuals and the published
annual reports of companies. Advanced software and
simulators will be used to get the results of
comparisons to approve the methodology.
By means of an intensive exploring of literature review; we have chosen the mixed methodology
research design by merging qualitative and quantitative data to understand each activity, horizontal
and vertical movement as well as loading and unloading operation within the container terminal.
Figure 3: Research Methodology (Yasir & Usman, 2009)

10 CHALMERS, Technology Management and Economics, Master’s Thesis E 2015: 081
A variety of resources has been consulted to derive and conclude the main concepts, knowledge
and understanding that is relevant to the subject of research. After careful consideration of the
factors that impact the operations in the terminal, a hypothesis will be used to test the assumption
of using the AS/RS system against the usage of traditional automated systems.
2.1 Literature review
The literature review is a necessity for the most of research studies. It is a systematic, explicit, and
reproducible method for identifying, evaluating, and synthesizing the existing body of completed
and recorded work produced by researchers, scholars, and practitioners (Fink, 2014). It is showing
that we have understood the main theories in the subject area and how they have been applied and
developed (Hart, 1998). We should bear in mind that a review should provide the reader with a
picture of the state of knowledge and major questions in the subject (Bell, 2005).
To enhance our experience in container terminals and become familiar with the terminologies,
theories and applications of the new concept, we investigated and consulted many others’ works
that dealing with the integration and evaluation processes. It is a proper way to gain an overview
of existing studies in a particular field.
There are many researchers tried to find the causes behind the unproductivity in the harbours and
fills the gap between the different stages of service producing. They introduced several ideas to
solve the congestion problems caused by applying the traditional approaches of handling,
especially with the existing of the computers that can process a high volume of data. They analysed
the effect of high labour costs and suggested the automation and semi-automation as a more cost-
efficient.
Recent developments in the business environment such as globalisation, off-shoring and
outsourcing have caused shipping and ports are to be managed and operated from a logistics and
supply chain perspective. (Dong-Wook & Photis, 2012). As it is a part of the international trading
supply chain, the port bear the burden of increase the level of efficiency within the maritime
shipping to keep in balance with the other parts.
To benefit from the economy of scale, the size of container ships has significantly increased during
the last decade. Frequently, a large container ship requires thousands of container lifts in a port

CHALMERS, Technology Management and Economics, Master’s Thesis E 2015: 081 11
terminal during one call. Since a container ship involves an important capital investment and
significant daily operating costs, customer service has become an important issue for container
port terminals. Many container terminals are attempting to improve their throughput and to reduce
the turnaround times of vessels and customers’ trucks (Hans-Otto & Kap, 2005). From the
perspective of operational decisions, most difficult decisions have to be made in the case of the
yard-crane-relay system because of its higher stacks of containers compared to the other handling
systems (Hans-Otto & Kap, 2005) that make the performance of this crane being the pivotal aspect
of this study.
2.2 Hypothesis in Research
Several scholarly papers have been published which emphasize the use of a hypothesis in testing
of quantitative research. According to (Kerlinger, 1956); “A hypothesis is a conjectural statement
of the relation between two or more variables”. It is obvious that to suggest a certain solution for
a current issue or situation, one needs to investigate first the key variables present in the situation,
and if so, we need to investigate if there is any relationship between them which will guide us to
build up and formulate the hypothesis for the subject of research.
2.2.1 Selection of Hypothesis Testing Variables
In every mixed, qualitative and qualitative research that based on hypothesis, identifying variables
considered a critical and core of the research study itself. By writing a clear research question with
the end in mind, these variables could be easily derived from this question.
Identification the dependent and independent variable in a research question means that we
determine the effect and cause accordingly. We need to ask ourselves which variable happened
first in time. Independent variables are considered as explanatory variables, and dependent
variables are response variables. Let’s identify these variables in the research question, so we will
re-arrange it as following:

12 CHALMERS, Technology Management and Economics, Master’s Thesis E 2015: 081
If the negative impact on lead-time increased; then the planning decisions will be poor, and the
productivity will be decreased.
Hence, negative impact on lead-time becomes an explanation for poor productivity (the response).
In conclusion; negative impact on lead-time will be considered as the independent variable while
the improved productivity will be regarded as the dependent variable in this research study.
Controlled Variables or Uncontrolled Variables
The negative impact on the lead-time is a result of undesired but impossible to be removed
activities that carrying out by traditional gantry cranes such as the relocating steps performed to
clear the target container. Such steps represent uncontrolled variables as it is out of our control
with the present crane design, and we have nothing to do with. Removing this unwanted effect
requires a new approach with a new technical design of handling equipment and new storage yard
layout which in turn demands an enormous amendment of the port infrastructure.
The specifically designed speed of the crane is also considered as uncontrolled variable, as we
achieve the work with maximum optimum speed and we have no choice to increase this value
above what has been specified by the manufacturers.
Operationalization of Variables
As a researcher, we chose to conduct this study with variables in mind as well as the relationship
between them, and then we need to operationalize those variables. In other words, we need to be
clear in term of variable definition and measurement as well as units of measurement (categories
or units).
Some variables are direct, others need to be explained in term of cause and effect (Figure 4). As
fishbone diagram shows, we focused only on the causes of AGC performance and excluded the
other factors. Lead-time, the independent variable is measurable, and it could be measured using
seconds, minutes or hours. However, the improved productivity could be measured using various
indicators. The researcher decided to use the number of containers handled per hour as the primary

CHALMERS, Technology Management and Economics, Master’s Thesis E 2015: 081 13
indicator for improved productivity. Thus, the number of containers will be considered as the unit
of measurement. In conclusion; both variables are identified clearly, and they are measurable.
2.2.2 Hypothesis formulation
Research hypothesis, is a statement of your tentative answers to these questions, what you think is
going on, these responses are usually based on your theories about or experiences with, the things
you are studying (Maxwell, 2012)
The hypothesis in qualitative research has been used widely by academics and scholars. It is an
excellent tool that help decision makers if the proposal they are about to make is doable or not.
The hypothesis can be formulated only after careful consideration of all the factors that has an
impact on the problem as well as the high number of relevant literature review investigated by the
researcher which is connected to the problem subject.
Thus, prior to formulate and develop the hypothesis for the study in hand, we need to ensure the
existence or expected relationship between the variables and whether these variables are
measurable which in turn; will ensure that our hypothesis is testable.
Figure 4: Cause and Effect of impact in lead-time in SSA

14 CHALMERS, Technology Management and Economics, Master’s Thesis E 2015: 081
As our independent variable is the lead-time, it will be used initially to build up and formulate the
hypothesis and is represented by the first part of our research question (the negative impact on
lead-time).
(Dirk, Stefan, & Robert, 2004) Stated that: Objective methods are necessary to support decisions.
Different logistic concepts, decision rules and optimization algorithms have to be compared by
simulation before they are implemented into real systems. Therefore, this study will be built solely
on assumptions and simulation technologies to help us visualise the anticipated solution.
By using technology such as 3D Max® in our simulation experiment (a pilot design is located in
Hong Kong) (Hans-Otto & Kap, 2005), we will select a sample of 25 containers that has a mean
lead-time 180 seconds using traditional gantry crane. Due to difficulty in calculating the mean
lead-time for a population, we will rely on T- distribution (a t-test is any statistical hypothesis test
in which the test statistic follows a student t-distribution (Bluman, 1991)). If we assume we have
a normal distribution, and by use these parameters we can conclude our one sample test of the
hypothesis as following using the data illustrated in (Figure 5).
From this data, we have the two following hypothesis:
The null hypothesis is H0: current mean lead-time (using gantry crane); 𝜇 ≥ 180 𝑆𝑒𝑐
The alternate hypothesis is: H1: mean lead-time reduced after using AS/RS; 𝜇 < 180 𝑠𝑒𝑐 (after
using AS/RS)-reduced.
Figure 5: Data for testing hypothesis
CHALMERS, Technology Management and Economics, Master’s Thesis E 2015: 081 15
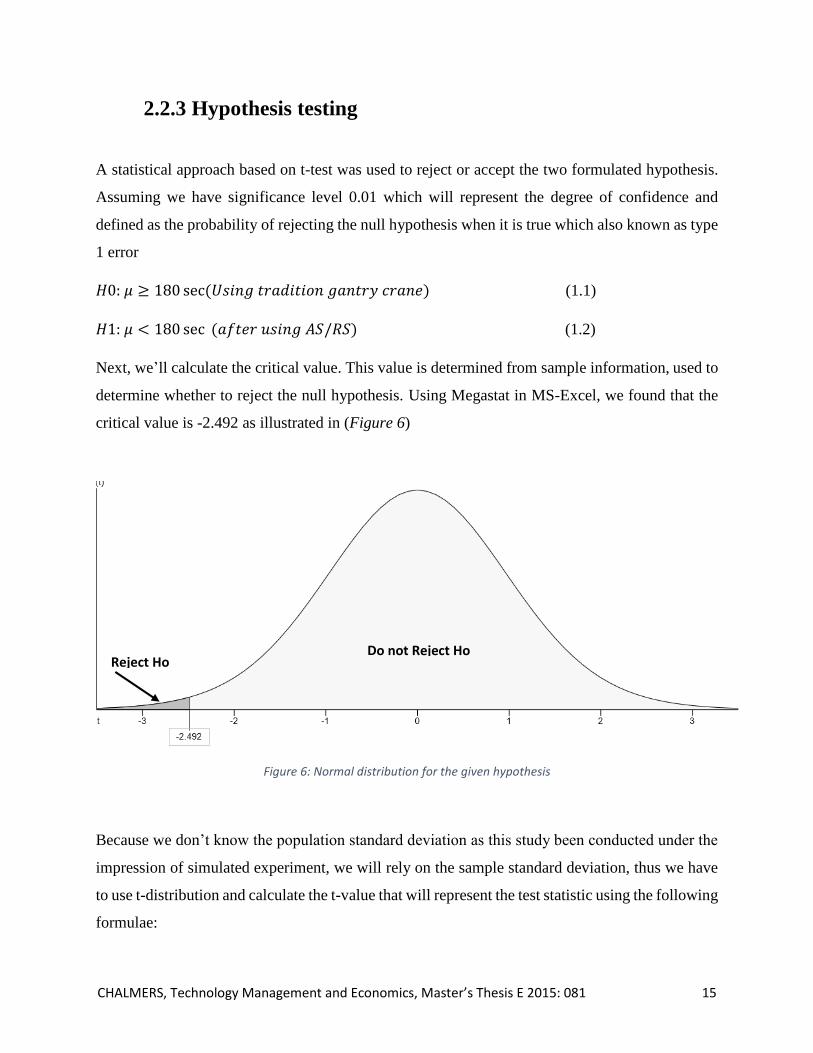
2.2.3 Hypothesis testing
A statistical approach based on t-test was used to reject or accept the two formulated hypothesis.
Assuming we have significance level 0.01 which will represent the degree of confidence and
defined as the probability of rejecting the null hypothesis when it is true which also known as type
1 error
𝐻0: 𝜇 ≥ 180 sec(𝑈𝑠𝑖𝑛𝑔 𝑡𝑟𝑎𝑑𝑖𝑡𝑖𝑜𝑛 𝑔𝑎𝑛𝑡𝑟𝑦 𝑐𝑟𝑎𝑛𝑒) (1.1)
𝐻1: 𝜇 < 180 sec (𝑎𝑓𝑡𝑒𝑟 𝑢𝑠𝑖𝑛𝑔 𝐴𝑆/𝑅𝑆) (1.2)
Next, we’ll calculate the critical value. This value is determined from sample information, used to
determine whether to reject the null hypothesis. Using Megastat in MS-Excel, we found that the
critical value is -2.492 as illustrated in (Figure 6)
Figure 6: Normal distribution for the given hypothesis
Because we don’t know the population standard deviation as this study been conducted under the
impression of simulated experiment, we will rely on the sample standard deviation, thus we have
to use t-distribution and calculate the t-value that will represent the test statistic using the following
formulae:
Do not Reject Ho Reject Ho

16 CHALMERS, Technology Management and Economics, Master’s Thesis E 2015: 081
t = �̅�− 𝝁
𝒔 √𝒏⁄=
𝟔𝟎 −𝟏𝟖𝟎
𝟖 √𝟐𝟓⁄ = -3 (1.3)
Furthermore, to test the two hypotheses we also have to consider the following assumption:
Let us consider we have X gantry crane performing transshipment and handling of containers in a
busy port. The hourly productivity of containers handling by the crane follows the normal
probability distribution with a mean of 180 seconds. We want to investigate whether at a
significance level of α = 0.01 there has been a reduction in the lead-time of the containers handling
using a new time reduction method represented by using AS/RS system. Given that the mean lead-
time using AS/RS system for a sample of 25 where the mean lead-time found to be 60 seconds
with a standard deviation of 8 seconds.
2.3 Research Validity
According to (Bluman, 1991, p. 3), “To accomplish a research in your field, you must be able to
design experiments;collect, organize, analyze, and summarize data; and possibly make reliable
predictions or forecasts for future use.”
To investigate the probability of reducing time-wasting at the storage area of the container
terminal, we have implemented a quantitative research approach by using a statistical hypothesis
testing. The results of this test strongly support our assumptions and efforts to reject the traditional
procedures and find out a new system with high productivity applications in container handling
process.
The variables have been randomly chosen for 25 varied scenarios(samples) which represent
different locations of containers stacking in one block. These number of scenarios summarized
and represented by three main scenarios; the easiest, the reasonable and the worst, as the rest of
the scenarios values, revolve around these three values.
The rejection of the null hypothesis as a primary result suggests proceeding to carry out more
accurate estimations as a second stage to collect the required quantities.

CHALMERS, Technology Management and Economics, Master’s Thesis E 2015: 081 17
2.4 Analysis Framework
As a generic reference, the research process chart is a practical tool to help the researcher in study
conducting. It is a logically and systematically roadmap details the steps needs to be followed to
accomplish the vision. To refine and concretizie our ideas we used the following flow chart as
primary plan (Figure 7):
Observing the maritime domain reveals the existence of many emerging issues in the shipping
sector. These issues being developed gradually without having signs of its progress. One of these
issues is the bottlenecks within the port’s area and congestion in large container terminals.
Figure 7: Analysis Framework

18 CHALMERS, Technology Management and Economics, Master’s Thesis E 2015: 081

CHALMERS, Technology Management and Economics, Master’s Thesis E 2015: 081 19
3 EMPIRICAL DATA
According to (James & Daniel, 2003); “The waste is any human activity that absorbs resources
but creates no value, or they are the processing steps that aren't needed”. One of lean production’s
principles is reducing the transport and movement of products during the producing process,
decrease the movement of equipment more than is required to perform the processing, and
eliminate the unnecessary steps that leads to time losing, with all that that implies reducing the
waste in lead-time that might happen between the phases of supply chain.
The “Lead-time”, sometimes called throughput time, is the number of minutes, hours, or days that
must be allowed for the completion of an operation or process, product or services, or must elapse
before a desired action takes place. (BusinessDictionary, 2015). From the supply chain
management point of view; the lead-time could be defined as the time from the moment the
customer places an order (the moment you learn of the demand) to the moment the customer
receives it.
The lead-time in the container terminal is the time needed to produce a service of receiving the
container and submitted it aboard ship. It begins from the moment that the container is passing
through the port gate until it reaches its location in the hold or deck. That covers all the three areas
of the terminal; the land side, storage yard and the ship side for outgoing containers and vice versa
for the incoming units as illustrated in (Figure 8).
Figure 8: Lead-time within the container terminal

20 CHALMERS, Technology Management and Economics, Master’s Thesis E 2015: 081
The part of lead-time of a container handling process that falls within the container terminals
involves only two things; the added value- time and the waste time.
The new competition criterion is built based on the time-saving concept. This implies that, we
must focus on reducing the lead-time by speeding up the handling operations and responding more
quickly to the shipping liner’s demands in presence of congestion and delay’s problems, recently
and in the foreseen future, especially in the large ports that works as hubs in the shipping network
and implements transhipment strategies.
It is quite important to identify the process steps that don’t create add value and minimize them as
possible by using a new concepts and technologies. The vertical and horizontal movement steps
that deal with the target container transporting directly, considered as positive impacts or value
creation while the other movements of relocating the containers that blocked the way to target
container are just time wasting as we could see in scenario 2 and should be eliminated to zero if
that possible.
In manufacturing processes the transport between producing stations/phases considered as no-
value- added time because there are no changes applied on the raw material during these
movements. In the shipping industry and because of the nature of terminal’s work as providing
service by transporting, moving the containers from in-gate until the ship hold considers as value-
added time.
Analysing the operations in the container terminal by breaking- down the complex process into
smaller parts and focusing on the real issue shows that the stacking storage yard is the most part
that bears the burden of negative impact in lead-time. Moreover, that require quick solutions to
overcome the problem.
3.1 Scenarios Data Collection
One of the aims of this master thesis project is to explore the use of sophisticated retrieval system
AS/RS to save the time and space in terminals. Based on this, the project attempts to find a solution
to solve the current and potential congestions in the harbours by shortening the lead-time. Since
there is a lack of AGC systems in all Swedish port the study will conducted based on a created
CHALMERS, Technology Management and Economics, Master’s Thesis E 2015: 081 21
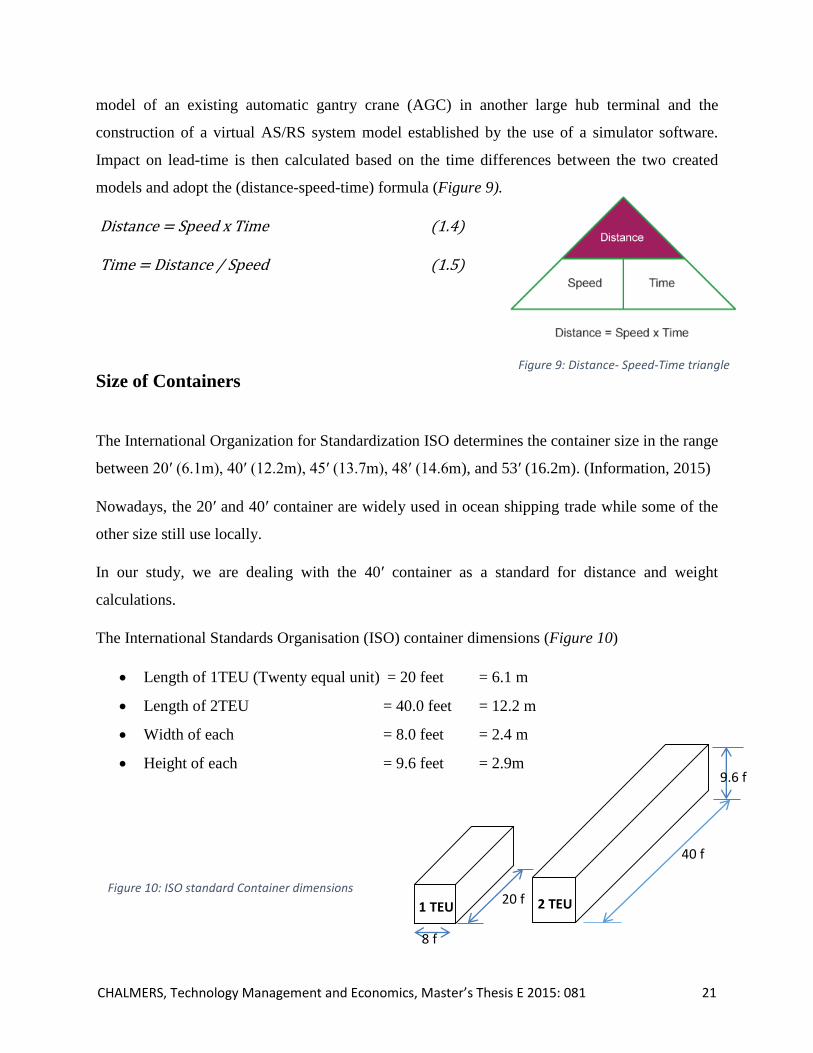
model of an existing automatic gantry crane (AGC) in another large hub terminal and the
construction of a virtual AS/RS system model established by the use of a simulator software.
Impact on lead-time is then calculated based on the time differences between the two created
models and adopt the (distance-speed-time) formula (Figure 9).
Distance = Speed x Time (1.4)
Time = Distance / Speed (1.5)
Size of Containers
The International Organization for Standardization ISO determines the container size in the range
between 20′ (6.1m), 40′ (12.2m), 45′ (13.7m), 48′ (14.6m), and 53′ (16.2m). (Information, 2015)
Nowadays, the 20′ and 40′ container are widely used in ocean shipping trade while some of the
other size still use locally.
In our study, we are dealing with the 40′ container as a standard for distance and weight
calculations.
The International Standards Organisation (ISO) container dimensions (Figure 10)
Length of 1TEU (Twenty equal unit) = 20 feet = 6.1 m
Length of 2TEU = 40.0 feet = 12.2 m
Width of each = 8.0 feet = 2.4 m
Height of each = 9.6 feet = 2.9m
20 f
8 f
1 TEU
9.6 f
40 f
2 TEU
Figure 9: Distance- Speed-Time triangle
Figure 10: ISO standard Container dimensions

22 CHALMERS, Technology Management and Economics, Master’s Thesis E 2015: 081
Furthermore, to estimate the differences in lead-time between the most sophisticated Rail Mounted
Gantry cranes currently in service, and a proposed virtual AS/RS system, three different stacking
scenarios have been created. These scenarios are based on the following four assumptions:
The specifications of Automatic Gantry Cranes ASC derived from the equipment brochure
The speed of vertical and horizontal movement are same for AGC and AS/RS
The vertical distance of the start point to move the pickup devices in both models are same.
The block consist of six tiers, six rows and ten bays
Scenario 1 Target container picked up and relocated on the mover (one bay, one tier)
Let us consider that we have a block with one tier, six rows in a particular bay, and we will pick
up the target container A from its position in the stack and relocate it on the mover (Truck or AGV)
to transfer it to sealand area. By the specified bay we mean that the gantry crane will not move,
only the trolley and the spreader traveling. We assume that the start point of the trolley movement
will be at its max height. In this case to complete the task the trolley will travel with four
movements, three vertical with varies speed plus one horizontal as in figure below:
The spreader will move downward 14.5m with empty speed 0f 62m/min
14.5*60s/62=14s
Then the spreader move upward 5.8m with load speed 0f 31m/min
5.8*60s/31=11.22s
Then the trolley move horizontally to the right 14.4m with 70m/min
14.4*60/70=12.34s
The last vertical movement of the spreader will be downward 4.35 m over the truck with load
speed of 31m/min
4.35*60/31=8.42s

CHALMERS, Technology Management and Economics, Master’s Thesis E 2015: 081 23
To be clear for the vehicle to move, the spreader should travel up with at least one container
height 2.9m and speed of 62m/min as a safety margin, which give time:
2.9*60/62= 2.81
By adding all values together, we get the total time for operation
14 + 11.22 + 12.34 + 8.42 + 2.81 = 49 s
The above calculation illustrated in (Figure 11).
AGC
Trolley
Spreader
Figure 11: Front view of the stack, scenario 1

24 CHALMERS, Technology Management and Economics, Master’s Thesis E 2015: 081
Scenario 2 Target container picked up and relocated on the mover (one bay, six tiers)
In reality, the case is not always similar to what we mentioned above. If each block consists only
of one tier then, the terminal need to occupy a wide area and that seem not practical.
Now, we will calculate the accumulated time spent to pick up the container A from its position in
a block of 6 rows. In this case, we might encounter challenges of container positioning or a
complex motion problem.
Note that there are five containers (Figure 12) stacked over the target container which requires to
relocate to another places within the same bay (it is most convenient to manoeuvre within the
individual bay than moving the AGC.
The dashed boxes in the (Figure 12) show the empty spaces that will occupy by the containers that
hinder the movement of the target container.
Figure 12: Front view of the stack, scenario 2

CHALMERS, Technology Management and Economics, Master’s Thesis E 2015: 081 25
The calculation involves each container separately (vertical & horizontal movement and moves
the spreader back empty to its initial position as a preparation for the next step) as follow:
Container 1: the spreader move four steps with time = 34.99 s
Container 2: the spreader move four steps with time = 22.26 s
Container 3: the spreader move three steps with time = 09.73 s
Container 4: the spreader move four steps with time = 19.45 s
Container 5: the spreader move four steps with time = 23.76 s
The target container A: the spreader moves four steps with time = 63.98 s
Then the spreader travels upward for safety margin of 2.9 m
By adding all the time segments together, we get the total operational time for handle one container
to its position on the mover (truck or AGV) =176.98 s =2.94 minutes.
From the above estimations it can be concluded that the transfer of the target container A could
considered as a productivity of our work and the moving of the other containers is just a waste
time needs to be addressed as illustrated in (Figure 13).
Figure 13: Value Added-time of scenario 2

26 CHALMERS, Technology Management and Economics, Master’s Thesis E 2015: 081
Scenario 3 Target container picked up and relocated on the mover (two different bays, six
tiers)
Because of the variety of destinations involved in the handling operation the incoming/outgoing
containers that reaches/leaves any block are not stacking in a same bay that makes the bay contains
several containers with various priorities even within the same vessel. It is often happen that we
transport consecutive containers listed in the loading plan but located in different bays, in this case
the process need to transfer the AGC (that have a heavy huge mass) between the bays generating
new wastage time.
To calculate the time taken to pick up two consecutive container lying in two different bays we
will copy the example of scenario 2 and taking in consider that the two bays lies in the both ends
of a block of 8 bays. The first stage of the process would be accomplished at rear end of the block
by picking up the target container and put it on the track, and then the next stage is to move the
AGC with a specified speed to reach the front bay of the block (Figure 14).
Figure 14: Illustration of scenario 3

CHALMERS, Technology Management and Economics, Master’s Thesis E 2015: 081 27
The length of a block with 8 bays being 97.6 m and this equal to the distance that the AGC will
move longitudinally with a speed of 90m/min (the load speed of AGC from the data sheet
(Appendix E) to achieves the next stage.
The time of the first stage = 177 s
The time of the second stage= 97.6*60/90= 65 s (the AGC horizontal movement)
The time of the third stage = 177 s (we just copy the situation on stage one)
By summing the time involved to accomplish the all three stage together we get the total time of
the procedure:
177 + 65 + 177 = 419 s = 7 min
3.2 Summary Scenarios Data Collection
Table 1: Comparison between the three scenarios
Scenario Time of operation (s) Bay Tier
Scenario 1 49 1 1
Scenario 2 176,98 1 6
Scenario 3 419 2 6
Table (1) shows that, in scenario (1) the time spent in achieving the operation for transfer the target
container was only 49 seconds. In scenario (2), it took approx. 3 minutes to achieve the same
work. In scenario (3), the movement of the crane between two bays lying on the both side of the
block led to spent long time; approx. 7 min.

28 CHALMERS, Technology Management and Economics, Master’s Thesis E 2015: 081

CHALMERS, Technology Management and Economics, Master’s Thesis E 2015: 081 29
4 FRAME OF REFERENCE
In this chapter, conceptualization of the theoretical concept of this study will be demonstrated. It
will comprise the theoretical structure for investigating different parties involved in the building
and designing of container terminals. Furthermore; various aspect will be discussed such as
terminal planning and operation, container terminal yard automation, types of cranes, and
automated transport system.
There was always a common policy objective for many large hub ports to shortening the lead-
time at ports. In 2005, in Japanese ports, for instance, there was a project to regain the
competitiveness and drastically increase the volume of handling containers at the port by reducing
the lead-time from a few days to approx. One day and a reduction of port costs per container by
thirty percent (Shinohara, 2012).
Fixing the resource allocation problems by an efficient planning and scheduling will improve the
terminal performance. Intelligent assignment of the technical equipment, e.g., the gantry cranes
and straddle carriers to the different areas of the terminal can contribute to some extent in lead-
time reduction (Hans-Otto & Kap, 2005).
Managing the handling process in the stacking yard of a container terminal is a crucial problem in
the shipping industry. That can be observed clearly in the case of congestion and speedy flow of a
huge number of containers in the hub ports that accompanied with great development in building
of giant ships. As we described in the previous sections, the issue is how to address the priority
problem and provide a clear access to the target containers that have been stacked in the lower tier
of the block. In the case of all target containers being stored in the top level of the stack or the
block has only one tier, we will do not face such problem.
To increase the productivity and solve the issue of reshuffling, some solutions has been suggested
such the twin cross-over crane system and the triple cross-over cranes system (Böse & Nils
Kemme, 2011). In this two types, the possibility for the cranes to crossing each other has
introduced to solve the problem of the single crane, as the latter cannot serve the transfer points
at both ends of the block at the same time (Valkengoed, 2004). However, another problem has
emerged, for the cranes cannot move independently but may block each other e.g.in the case of

30 CHALMERS, Technology Management and Economics, Master’s Thesis E 2015: 081
the trolley of large crane busy in handling a container. Moreover the scheduling process becomes
more complex, as shown in (Figure 15).
Some researchers have examined the issue of minimization the effect of relocation on total lead
time. According to (Kemme, 2012), a table produced (Appendix F) for the purpose of comparing
various references to find if authors researched the problem of container stacking adequately. It is
obvious that the problem of block relocating was not investigated thoroughly by many authors,
scholars and researchers. Among twenty-six references, only three studies clarify the container
stacking problem. Add to that; the concept that has been used and adapted by (Asef-Vaziri,
Ardavan, & Berok, 2006) in his study on which we strongly draw.
(Marco, Stefan, & Moshe, 2011) found the blocks relocation pattern that minimizes the total
number of movements required to comply with the retrieving sequence using algorithms and
corridor method. However, further research and investigation in linear programming should be
adapted to move forward with the proposed pattern.
(Miguel A. Salido, et al., 2009 )proposed a planning tool for finding the best configuration of
containers in a bay. They try to reduce the reshuffling steps to a minimum value by keep the
outgoing containers in the most upper tier. They based their theory on a manual stacking process
and a modified Blocks World planning problem solution. From our perspective, we see that the
results of this study does not completely remove the effect of the unnecessary movement of the
spreader for reshuffling. Add to that this process is greatly affected by the number and priority of
containers arriving first to the stack.
Figure 15: Cranes in cross- over configuration- Source (Valkengoed, 2004)

CHALMERS, Technology Management and Economics, Master’s Thesis E 2015: 081 31
4.1 The Emergence of Container Era
As it defined in many pieces of literature the shipping container or “intermodal freight container”
is a metal box made of steel or aluminium with a standard size (Council, 2015). Is designed to be
used as a storage unit to transport goods between countries and easy to be carried from one mode
of transport; ships, trains and trucks to another without unloading and reloading its contents.
Container advantages are to reduce the labour cost, eliminate the vessel's staying time in the
harbour, provide a good protection to the cargo itself from breakage, thefts, and contaminations
and to save the time (Levinson, 2008).
The ideas of what are known recently as Intermodalism and Containerization were a dream of an
American citizen owns a small trucking firm called Malcolm McLean in 1937. He was constantly
complaining about the delay in unloading his trucks and moving the load aboard ships. The process
took a long time to achieve and during this period the drivers have nothing to do just wasted their
time by waiting. Furthermore during loading process a large number of the goods were lost because
of damage or pilferage.
To solve this problem he suggested detaching the trucks from their gears and putting them with
their load aboard ship and discharging them again in a same manner in the next port of call.
Malcolm’s concept found its way into the domestic maritime industry in the United States after 19
years. The other regions found it is tough to adopt this approach without standardized sizes and
the lack of standard handling equipment for this process.
In 1956, the first container ship was modified from a T2 tanker. This type of tankers was commonly
used at that time to transport oil products from the oil fields and the refineries along the United
States coast. This vessel made its way due south along the east coast of US from the port of Newark
toward Houston with the first containers cargo onboard. Shortly afterwards, Malcolm changed its
company’s name to Sea-Land services company with a fleet of three ships (CUDAHY, 2006).
After two years and to take the advantage of this tactic, many other companies soon turned into
this approach such as Matson Navigation Company. The first ship that specifically designed for
transporting containers, Sea-Land's Gateway City, made its maiden voyage on October 1957 was
owned by Sea-land services. By this trip, a new era of transportation has been launched.

32 CHALMERS, Technology Management and Economics, Master’s Thesis E 2015: 081
4.2 Automatic structures/ cranes
One of the latest and most promising drifts in the shipping industry is the switching toward include
the automation in the evolution of container terminals design and layout (Hans-Otto & Kim, 2006).
It has been planned to comprise each region of the container terminal to attain perfection.
This perfection and integration expected to promote the effective performance and reduce the lead
time and the cost to reasonable limits. We agree with (Kemme, 2012), as he argues that the storage
of goods can be regarded as planned interruption of the material flow. This interruption is
necessary and desired to arrange both, the incoming and outgoing container to coincide with the
time of delivery or transshipment. Managing import, export and transshipment operations could
be accomplished by an automated system to keep goods smoothly flow.
In designing of automated container terminals (ACT), one have to consider the choice of a certain
type of equipment (Hans-Otto & Kap, 2005). There is a set of equipment are compatible with each
other and have the ability to integrate into the automation process.
Consequently, the cranes driven by man will replace by automated cranes, the multi-trailers
system, and the traditional trucks will substitute by the automated guided vehicles and automated
straddle carriers.
Typically, in container terminals the handling circulation done by; Quay cranes QCs for
loading/unloading, Rail mounted gantry cranes RMGC/ Rubber tyre gantry cranes RTGC for
picking up and stacking and transporter or mover for horizontal transportation between the three
areas of operations (Wiese, 2011).
For reasons of occupational safety, automated and manual operations usually have to be strictly
separated from each other (Kemme, 2012).
We agree with (Ioannou, 2008) as he states that the advanced technologies and automation is an
attractive way to increase capacity by replacing manual and often inefficient operations with
automated ones that are optimized for efficiency. New construction and infrastructure cannot be
short-term solutions, this might take a long time and consumes capital and funding.

CHALMERS, Technology Management and Economics, Master’s Thesis E 2015: 081 33
Regardless of the degree of automation, the shortcomings remain as an inherent feature of the
current system. That is not because of deficiencies in equipment but because of the currently
applied handling methods.
Many designs and structures have been introduced to achieve the automation concept in container
terminals to improve the operational efficiency and reduce the lead- time to meet future expected
demand.
(Ioannou, 2008) Demonstrate four different models of automated container terminals ACT that
has a strong potential to serve the lead- time shortening. These four concepts include AGV- ACT,
a linear motor conveyance system (LMCS), overhead grid rail (GR) and the AS/RS system.
However among all these systems, we support the AS/RS concept and consider the other models
are just a supplements. The AGV, LMCS and the GR are address only the horizontally transfer of
containers within the three areas of the terminal, while the AS/RS will be fully harnessed to
perform the handling process in the stacking storage area. (This is the gap we are studying).
All this concept aim to eliminate the human-machine interface errors that in turn lead to reducing
the turnaround time of the vessels.
4.3 Terminal Planning and Management operations
According to (Ilaria, Matteo, & Michel, 2010) : A container terminal is the zone of the port, where
vessels dock on a berth and containers, are loaded, unloaded and stored in a buffer area called yard.
Furthermore, (Henesey, 2006) defined the terminal as a specialized part of the port that handles a
particular type of goods, e.g. cars, containers, wood, people.
Normally, operations in container terminals involved berth allocation, scheduling of STS cranes,
yard truck scheduling, storage yard crane scheduling, and storage allocation (Lee,et al.,2009).
Container traffic problem was identified long time ago and many researchers, economist and
scholars, were investigating about potential problems and causes. One of the identified factors that
impact the traffic is the terminal planning and operation. The planning and scheduling of
operations at any terminal considered the backbone of everyday activities on the port. Usually, it

34 CHALMERS, Technology Management and Economics, Master’s Thesis E 2015: 081
needs human powers as well as automated systems that increase the efficiency (Hans-Otto & Kap,
2005) with this concept in mind, this study is about to investigate the potential advanced
computerized systems represented by AS/RS system to maximize the desired efficiency.
Achieving balanced movement between incoming and outgoing in a container terminal would be
ideal not in the number of containers but also in term of type and weight of containers. As of yet,
no such balance available. There will thus always be empty containers to be transported in one
direction or another. (Stopford, 2009).
Planning of terminals required an enormous capital investment as well as constitute of handling,
transport and storage of containers which considered a day-to-day activities on many ports plays
a vital role in the mechanism of the operations and strategic decisions and measures of its
effectiveness. Container terminal is considered as a complex system that functions efficiently only
when its layout is designed in such a way that the loading and discharging process of vessels run
smoothly. (Böse, 2011).
The first step of the terminal planning process is to determine the seaside capacity. Subsequently,
the needed landside and yard capacities are derived from the prior calculated seaside capacity.
Thus, both capacities have to be dimensioned for the handling of the container flow extrapolated
from the seaside capacity (Böse, 2011).
According to (Böse, 2011), the planning of a terminal could be broken into three runs, the short,
medium and the long term. The short planning term include the day-to-day operational activities
such the scheduling, allocating space, while the medium-term planning presenting as the technical
requirements. The long term usually comprises the strategic plans, as an instance; it may involve
the terminal expansion plan.
Inadequate planning, scheduling and managing of the processes within the port, add to time waste
by storage and retrieval operations will decrease the productivity and cause delay in transportation
(Hans-Otto & Kap, 2005).
Carrying out all transactions very fast and smoothly will lead to shortening the turnaround time of
the vessels. As a demand for competition, the terminals are trying to implement new techniques
like the automation processes of handling and more computerize control methods to reach this goal
(Böse, 2011).

CHALMERS, Technology Management and Economics, Master’s Thesis E 2015: 081 35
4.4 Structure of the Stacking area
The intelligent layouts of the terminal can increase the terminal capacity, shorten the time for
container transfer, and thus, decrease the turnaround time of ships largely (Gary,et al.,2008). For
newly built yards, there are many factors should be taken into account. The structure of a stacking
area as an intermediate area, affected largely by the terminal location, its entire layout, the available
space on which the yard will be established, the types and size of equipment will be used; are they
automated or not and the important of the terminal.
The direction of the blocks in storage yard can either be perpendicular or parallel to the quay. A
research conducted by (Wiese, 2011) present that in about 90% of cases where RTGs are used for
stacking a parallel layout with transfer lane is used.
In principle, there are three parts for any terminal layout design: the seaside, the storage yard and
the landside. The seaside is the connection point with the outside world; it has massive quay cranes
to achieve the handling task from/to the vessels. The stacking yard is the area where the container
being stored before loading or discharging to/from the ships. The performance in this area is
sensitive to sizes and types of handling equipment serving this region. The landside of the terminal,
sometimes called hinterland is the operation area that serving trains and truck and had facilities to
control, receive and deliver the containers. The distance between these three parts decided by the
manoeuvring ability of the carriers, which transport the container horizontally between these three
regions. A normal block of containers stack in a storage yard has the configuration illustration in
(Figure 16).

36 CHALMERS, Technology Management and Economics, Master’s Thesis E 2015: 081
Each stack consists of rows, bays and tiers as shown in (Figure 17). The intersection space of these
three coordinates referred as a cell or spot where a container can be storage or located. A cell fits
a 20ft container, so a 40ft container takes two cells. The dimensions of stack served by AGC cranes
differ per terminal. However, the order of magnitude one should think of is 30-60 bays length, 6-
10 lanes wide and 4-5 tiers high. In meters, the dimensions will be about 183- 366 meters long,
15-24 meters wide and a 10-13 meter high.
In general, the structure of stacking yard is significantly influenced by the type of the stacking
equipment used in exchange process that in turn affect the lead time of handling operation. Jöerge
describes this effect by three different scenarios of block structures, (Figure (17) (Wiese, 2011).
In the first structure the stack represented by a compact block with two transfer points one at each
end of the block, the front and the rare. One or two RMG cranes mounted on a rail along the block
to load and unload containers. To lift, stack a single container from these two points, the crane
should span several bays.
In the second structure design (b), a crane of type RTC uses to handle the containers. Instead of
the transfer points there are a side lane parallel the container rows for exchange operation. In this
case, the vehicles reach close to target bay and only the trolley and spreader move. Add to the
flexibility of transfer this crane to serve some other blocks if required.
Figure 16: Container terminal layout – Source (Böse, 2011)

CHALMERS, Technology Management and Economics, Master’s Thesis E 2015: 081 37
The third design different slightly. In this type, the block consists of line stacks, which mean there
are spaces between the containers rows. A straddle carrier uses this spaces to pass through rows
for lift or stack the container.
Stockpiling the containers by the current manner lead to creating an inevitable time problem. From
the previous sections, we know that arranging the container in one tier will take up the space in
the terminal. The long lead time will remain inherent to the crane operation unless we find a new
solution. Our opinion is that the solution lies in the use of automatic storage and retrieval system
as there are no reshuffling steps to prepare the target container, and the lead-time will be shortened.
4.5 Cranes
In container terminal, there are many types of cranes considered the key equipment to accomplish
different main tasks. Each crane is serving one area in the terminal with exceptions in some cases
when there no trainroad within the terminal and the outgoing truck could be served by the SSA
crane directly. In the next sections, we will give a brief distribution about each one of the three
cranes, the quay crane, the yard crane and the gantry or so-called bridge crane.
To shortening the lead time, using high efficient cranes is serving this objective. The lead time
could be improved by use smart and faster equipment and adopted automated container terminal
yard to work as an integrated system.
Figure 17: Stack configuration; a) block with transfer points. b) Block with side lane. c) Lane stack (Wiese, 2011)

38 CHALMERS, Technology Management and Economics, Master’s Thesis E 2015: 081
Quay Cranes
In the seaside area, a number of massive cranes
alongside the berth represent the interface link
between the mover and the container vessel, (Figure
18). These cranes using to load or discharge the
outgoing or incoming containers from ships moored
at the berth, sometimes they called ship-to-shore
(STS) crane (Böse, 2011). These cranes are
specialized for the purpose of handling only this type
of cargo. Some of these cranes are semi- automated,
but the majority are manned because of the nature of
loading and unloading operations. The size and the
capacity of each crane determined at first phases of building and this in its turn affected by the
capacity and the length of the berth.
The QCs are classified according to the boom mechanization, and there are two types; the high
profile (A-Frame) with tip-up boom above the water surface and prove of vessel anchor (A & O,
2013). The second category is the Low profile where the boom is able either to push in above
vessel deck or to push forwards.
The crane consists of a high steel structure with a trolley and spreader moving along a boom. In
large and well-developed hub ports, some of these cranes achieve the handling process in both
directions, which implies loading and discharging simultaneously.
The efficiency of quay cranes is related to minimizing the turnaround of the vessels that make use
of their berths and terminal facilities (Dong-Wook & Photis, 2012). The turnaround time for a ship
include the time spent with entering the port, the loading/ unloading time by the crane and the time
spent during departure.
The loading/unloading segment of the turnaround be affected by the quay crane efficiency while
the other two segments related to the pilotage operation in the harbour.
Figure 18: Ship-To- Shore Crane, (konecranes, 2015)

CHALMERS, Technology Management and Economics, Master’s Thesis E 2015: 081 39
Container terminals can decrease vessel turnaround time by improving ship-to-shore crane
efficiency, improve port productivity, and improve throughput in the freight transportation system
(Ioannou, 2008). To improve crane efficiency, many methods has being introduced such double-
cycling operations (loading/unloading at the same time) (Figure 20), twin lifts container crane,
triple lift container and multi-lift container.
Yard cranes
The container’s stacking operations in the stacking storage area usually performed by one type of
yard cranes. These cranes are serving SSA with a high complexity as it involves the storage and
retrieval containers processes. This processes could be described as bi-directional work as it is
including delivering and receiving containers to/from the seaside and landside areas. There are two
crane types often used in storage yard regardless of the method of operation; the rail mounted
gantry crane RMGC and the rubber tyre gantry crane RTGC. The former one can only serve one
block and have no ability to be transferred to other stacks, its movement limited by its rail length.
On the other hand, the RTGC can be moved to achieve the work in another block.
Both cranes might be driven manually or automatically. Certainly the latter method of performance
is preferred and being applied in many superior hub ports. The automated cranes give strong
showing in the goals-based evaluation.Time- saving is so clear compared with the manually driven
cranes (Bryfors, 2014).
Figure 19: Quay crane: a) single cycling b) double cycling (Ioannou, 2008)

40 CHALMERS, Technology Management and Economics, Master’s Thesis E 2015: 081
The containers usually being arranged in the storage yard either in compact block stacks or liner
stacks. In the first type, only the gantry crane carrying out the stacking and retrieval task, while in
liner stacks, the straddle carriers used to transport the containers horizontally from the quay crane
and do the stacking process. (Figure 21) illustrates both cranes (Business, 2012).
Gantry crane of landside area
It is a special type of RMG principally developed to load and unload container to/from trains in a
landside area of large ports that have railroad facilities (Figure 22). It may not be found in some
medium and small ports. Before the gantry crane entered service, the exchange process in landside
was carried out by straddle carriers.
Recently, by establishing the so-called “Intermediate Stacking Area” inland side of some hub
terminals as a primary storage area for hinterland service, the crane initiated the loading and
unloading the external trucks. Like the automated stacking crane, this crane has been developed to
be controlled remotely.
A B
Figure 20: Yard cranes: A) RTGC, B) RGC

CHALMERS, Technology Management and Economics, Master’s Thesis E 2015: 081 41
4.6 Vehicles
The Key components of a normal automated container terminal are the Automated Quay crane
(AQC) in seaside, Automated Stacking Crane (ASC) in stacking yard and the Automated
Hinterland Crane (AHC) in the landside area (Ri Choe, 2006). The horizontal movement of the
containers between these three different areas of the container terminal usually done by a set of
carriers is so- called the movers.
As the movers are the means of transport between these three areas, they affect the lead-time to a
large extent. Currently, there are different types of vehicles in service including the multi-trailer
systems with manned trucks, automated guided vehicles (including the automated lifting vehicles
(ALV)) and straddle carriers. If we exclude vehicles that operate by human, the three latter types
plays a key sensitive role to save time in the automated container terminal (Iris & Ismaeal, 2005).
There are two different classes of the transport vehicle, the active vehicle type which have lifting
gear to load and unload the container by themselves and including the straddle carriers SCs and
the automated lifting vehicles (ALV). The other type is the passive that has no lifting gears and
achieve the tasks with the help of cranes. This type includes the multi-trailer system that steer by
man and the automated guided vehicles (Bruce Golden, et al.,2008).
According to its design, performance, strengths and weaknesses, these carriers affect the entire
lead-time of the transportation process. Empty travel time, loading time of vehicles, waiting time
and congestion time are the significant variables should be addressed to enhance the productivity
Figure 21: Gantry carne of Landside

42 CHALMERS, Technology Management and Economics, Master’s Thesis E 2015: 081
of the terminal (Rajotia,et al.1998). The following three types of vehicles are explained in brief
with description about how it affect the lead time.
Trucks
The trucks in the container terminal considered as the conventional means to move the container
between the three areas of the terminal. These trucks are always manned with some rate of
disadvantages. The trend now in the large ports is to switch to AGV that controlled from one
station. This type of carrier does not comply with the automation trend and not support the efforts
of time-saving.
Straddle carriers
It is a rubber tyre overhead lifting vehicle for moving or
stacking containers on a level reinforced surface
(Economic Commission for Europe, 2001)(Figure23). SCs
can be used for all container-handling functions on seaport
container terminals except loading and discharging of
vessels (Kemme, 2012). This carrier used to keep the
containers transport and move between the three areas of
the CT. This type of carriers being categorised into two
classes, the classic straddle class and the auto-straddle
class. The classic straddle usually manned and affected by
the human behaviour. It is often driven by fuel and has
some proportion of environmental impact.
The auto-straddle carriers are fully automated and computerize controlled to follow the schedule
and allocation plan. Most of these types are electricity driven, energy-efficient machinery with low
noise and environment-friendly.
Figure 22: A straddle carrier (Loretah, 2015)

CHALMERS, Technology Management and Economics, Master’s Thesis E 2015: 081 43
Both classes have a high-performance efficiency with their flexibility, speed and reachability.
They considered the only single type of equipment that achieve all container operations in the
terminal. The straddle picks up the container from the quay under the STS and moves toward the
receiving stations or so-called transfer points of stacking yards to submit the container. In the case
of line stacks, the straddle accomplishes the stacking duty that consider an advantage to reduce the
lead-time, otherwise, in the event of the compact block stacks the sacking is the job of AGC.
Automatic Guided Vehicles (AGV) and Automated Lifting Vehicles (ALV)
The automated guided vehicle (AGV), It is so- called a self-guided vehicle, is a computer-
controlled transporting unit uses to transport materials horizontally with high flexible from one
station to another in manufacturing systems, loading-unloading systems in warehouses and
hospitals. These units have the ability to move freely and easily in all directions without direct
human intervention. In 1973, Volvo in Kalmar, the Swedish well-known trucks manufacturing
company, has developed the concept of the AGV to enhance its assembling processes (Omar
Lengerke & Max Suell, 2011).
In the maritime domain, this vehicles being used widely as an alternative to the conventional trucks
in container transport process at CT, particularly automated terminals. This vehicle need a crane
to receive and deliver containers.
An automated lifting vehicle, (Figure 24) is another type of AVG but have the ability to lift a
container from the ground without support from another external lifting equipment, it has supplies
with lifting gears controlled from the central control station that directs the vehicle.
Increasing of process efficiency, optimising and smooth transport flow of containers between the
operations areas of the terminal are the main advantages of AGVs use.

44 CHALMERS, Technology Management and Economics, Master’s Thesis E 2015: 081
Figure 23: ALV in action

CHALMERS, Technology Management and Economics, Master’s Thesis E 2015: 081 45
5 RESULTS AND ANALYSIS
In this chapter, we will discuss and analyze the outcomes of our research based on studying the
influential factors behind our research question.
“How lead-time within Stacking Storage Area of container terminals could be reduced to
improve the productivity and planning decisions?”
This problem absorbs cumulatively the capital returns in the long- term and eliminates the
competitive value of the terminal. Digging deep in the foundation of this trouble led to inspect the
entire supply chain of container terminals. Examine the performance of handling equipment in
various functional areas of the yard shows that our research target is the Stacking Storage area.
In our study, we have started with a diagnose process to find out which part of the SSA is
responsible for time-wasting. Then we decided to develop an effective approach to deal with this
trouble.
This research has a significant important as it will expand the knowledge and paying the attention
to speed up the adoption of new systems and methodologies. These methodologies should be
prepared and studied carefully to achieve its goal of addressing the time-waste issue.
The knowledge being gained from this research could be used as an introduction to further deep
studies in the field.
The researchers and other interested parties can expect to find this report as an additional aid may
assist to dig deeper, explore and extract potential unforeseen better solutions and best practices.
5.1 Impact on Lead-time
The results from the statistic testing of the two hypotheses shows that we can reject H0 and accept
H1 which presume that using the AS/RS vehicles may reduce the lead-time and lead to improving
decision-making procedures and more efficient productivity.
On the average, a gantry crane could furnish 18 FEU moves per hour (Asef-Vaziri, Ardavan, &
Berok, 2006). In the other hand, our simulation results showed that the use of AS/RS system in

46 CHALMERS, Technology Management and Economics, Master’s Thesis E 2015: 081
the stacking process of one container will not exceed one minute even in the worst-case scenario.
This results can not be reached with any conventional methods.
AS/RS system have been suggested to be the alternat of the current using traditional automated
crane of SSA of CT. Logically, the performance of the proposed system suggests a decrease of
lead-time of container handling.
5.2 Impact on Wasted Time (NVA-time)
To evaluate our assumptions numerically, we have used a professional 3D computer graphics
program (3ds Max® software) to create and animate the real-life process. This software has flexible
modeling features and easy to use functions. These features offer a set of powerful capabilities to
originate professional-quality 3D animations and models. With a systematic creative toolset, and
a correct imagination of the real scenarios we created a set of a 3d prototype in less time.
By generate a prototype of a stack in storage area with two models of AGC and AS/RS(Figure
24), it was possible to observe the behave of the process continuously, animate both handling
equipment models to pick-up two containers simultaneously and set them down on movers to
transfer them to seaside or land side in the terminal. Utilized the simulator’s advantage of
Figure 24: Comparison between AGC and AS/RS

CHALMERS, Technology Management and Economics, Master’s Thesis E 2015: 081 47
calculating the duration of animation we estimated the time for each distance covered by the
progress toward the goal.
Table 2: Calculation of Waste Time
Simulation Work Achievement Time
AS/RS AGC NVA-t
Scenario 1 ≤ 𝟏 𝐦𝐢𝐧 ≤ 𝟏 𝐦𝐢𝐧 0
Scenario 2 ≤ 𝟏 𝐦𝐢𝐧 ≥ 𝟑 𝐦𝐢𝐧 2 min
Scenario 3 ≤ 𝟏 𝐦𝐢𝐧 ≥ 𝟕 𝐦𝐢𝐧 6 min
5.3 Approaches to reducing lead-time and waste-time
By applying an integrated combination includes most advanced computer-controlled systems and
a special purpose machinery design with a smart layout design ensures making efficient use of the
available space, the lead-time will be reduced to the lowest possible value.
In applications with a very high degree circulation, using the AS/RS systems considered as a
typical solution for storage and retrieval process. This system will reduce human errors and the
underestimations that may accompany the systems operator decisions.
Retrieval strategy of picking up the container horizontally from a precisely identified location
without any obstructions results in a pure lead-time that cuts the potential costs.
The rack or so-called inventory location will consist of only bays and tiers. The space of
intersection of tiers and bays are referred to as cells. By RFID or GPS technology, we have the
means to decide the exact positions of the containers in the matter. (Figure 25), illustrates a
proposal of AS/RS configuration. The figure shows the main major components of AS/RS:
including the storage rack, storage and retrieval machine with its rail and the shuttle (Asef-Vaziri,
Ardavan, & Berok, 2006). The image is a snapshot from FlexSim® Simulator created by the
researcher.

48 CHALMERS, Technology Management and Economics, Master’s Thesis E 2015: 081
5.4 Advantages and disadvantages of implementing automated
stacking systems
From the literature review presented in this study, we can conclude and derive the following
advantages and disadvantages for both AS/RS and AGC systems. Thus, decision makers can
decide whether to adopt using automated systems over non-automated systems.
5.4.1 Automatic Storage and Retrieval System (AS/RS)
Using a combination of latest hardware and software as well as talented and well-trained
individuals; AS/RS system may improve to become the better choice for handling, storage and
retrieval. AS/RS may improve hugely the capability of storage and relocation if utilized and
embedded smartly within legacy systems.
Figure 25: Visualization of a proposed AS/RS Systems

CHALMERS, Technology Management and Economics, Master’s Thesis E 2015: 081 49
According to (Kees & Iris, 2009) an automated storage and retrieval system (AS/RS) usually
consists of racks served by cranes running through aisles between the racks. An AS/RS is capable
of handling pallets without the interference of an operator. Hence, the system is fully automated
and out of human errors.
Accordingly, with such system, the need for human interference is minimal which will lead to
reduced human errors as well as better time management and increased reliability. This point
considered one of the greatest advantages over the non-automated system that in turn will lead to
saving in labour cost. In term of required space for storage and relocation, AS/RS needs less square
footage that make it another advantage.
Obvious disadvantages are it requires an additional investment of $ 1,206,841 but saves $650,792
per year in operation costs for a single aisle AS/RS (Howard & Zollinger, 2001).
One of the main disadvantages might be the intensive need for training and familiarity with
troubleshooting the system so that no lateness may encounter as well as maintenance and repair
Though, preferably for efficient and operative container terminal operation, AS/RS system may
be a potential great replacement system from a performance perspective.
We agree with (Asef-Vaziri, Ardavan, & Berok, 2006) as he states that; AS/RS offers flexibility,
expandability, quality, and reliability. Accuracy and reliability of ASRS are higher than human-
operated equipment. ASRS is easily expanded through the construction of additional modules.
5.4.2 Automatic Gantry Crane (AGC) system
Because of automation there are many advantages gaining from the use of AGC system. For
instance, the system will lower the labor costs particularly in countries with high labor-cost. The
system in its nature of operation serving a compact block stacks, that implies there are no spaces
between the container lines which saving more piece of land and support land utilization. Another
benefits gain from the AGC is, in the case of one tier block the crane offer a very high productivity
in horizontal transport. (Brinkmann, 2005)
Disadvantage of this system can be summarized as following:

50 CHALMERS, Technology Management and Economics, Master’s Thesis E 2015: 081
High skilled and well-trained operator required
In the case of compact stack with many tiers, the crane productivity will strongly decrease
because of time- wasting.
Because of its huge mass, it is relatively slow
If the system failure, the operations in the whole block will be affected.
Educating the staff is a significant component to achieving a specific task related to AGC job.
We may need new operators to undertake instruction to control the operation remotely, to fix
the scheduling problem, overlapping and handling or a new relocating order. As the work being
achieved by computerized equipment that need a high level of training the financial cost of
training may be high. Also, it is difficult to replace a fully-trained operator in the case of leaving
the job.
Although the use of automation in this system, the waste of time remains an inherent element
in the handling process as long as the performance of work using the current approach.
Moving the total crane from one bay to another one within one block, is not like moving the
trolley alone, it will consume too long time to switch between the bays and consider as relative
slow maneuvering.
In the case of one crane serving a specific block, any failure or repair of the crane’s component
mean the crane will be out of order and the operations in this block will be affected until the
end of repair/replacement process. To overcome this problem, to avoid the process interruption
and to increase productivity many terminals decided to use two cranes to serve each block
(Bruce Golde, et al.,2008).

CHALMERS, Technology Management and Economics, Master’s Thesis E 2015: 081 51
6 CONCLUSIONS AND DISCUSSIONS
This report reveals the common underlying factors causes the negative impact affecting the lead-
time of handling operations in the storage area of the container terminals. It is alert the stakeholders
to shortfalls and pay attention to hidden risks of the iceberg that absorbs the resources without
value-creation. These factors seem to be unavoidable and as an integral part of the entire process.
This claim is true in the case of achieving the work by the traditional gantry cranes and current
stacking arrangement. In this approach, some steps are unnecessary and leads to time wasting that
in several cases could be much greater than the required process time.
By reviewing and discussed the previous works dealing with the same problem, we initiate from
where the others have ceased. We get rich materials to hold up our point of view without duplicate
the essential method that has been produced by others. Our perspective on the subject was from
different aspects.
We investigated the handling procedures in storage yard that being achieved by the AGC and
observed each step to calculate the time being spent on every movement. Then we distinguish the
value add time from the non-value-add time. This accumulated non-value adds time represent the
negative portion of time that causes the loss in productivity which needs to be addressed.
To overcome this problem, we have compared an alternative investment idea to identify these
undesired movements. We made it distinct from the other productive steps by creating a realistic
graphical animation to compare and calculate the lead-time to produce the service by two different
methods.
By concentrating on the lead production approach to reducing time-wasting, we have brought out
the concept of AS/RS as an alternate solution to achieve the handling operation smoothly with
high productivity. The AS/RS model has been compared with AGC in each step to highlight the
differences and approve the validity by mathematical calculations.
An additional statistical approval by a systematic hypothesis approach has been carried out to
increase the degree of reliability and satisfactory.

52 CHALMERS, Technology Management and Economics, Master’s Thesis E 2015: 081
To ensure a better level of quality and optimise prioritisation in the whole process we have
proposed the integration of stowage plan data obtained from the ships in question with the other
stored information being gathered at the control station. By using the new technology information
and fixing position systems like GPS and RFID, all containers are to be tracked by an attached tag,
sensors and the handling equipment will be guided remotely from the control stations. The tag chip
contains a memory that stores the unit's electronic product code (EPC) and some other details
about the product so that it can be read and tracked by RFID readers anywhere.
The transition from traditional to modern or new concepts may face strong opposition in many
organizations. Chiefly from the old guard in the industry, those who find it hard to predict the
future opportunities and difficult to change from the present status. Particularly, it is a costly
process, needs a complete restructuring of the terminal infrastructure.
6.1 Theoretical Contributions
Understanding the idea behind any new concept playing a crucial role to encourage the thinking
outside the box and don’t draw upon the tried and tested ideas that have worked for us in the past.
These exciting ideas and solutions may not suit the contemporary time. We might have the efficient
tools to demonstrate our plans, but not adequate practical steps for the implementation, which
considered the core of any business.
The concept of the AS/RS is not a new notion. It is being used in various practical applications for
many decades; it was a perfect solution for many large warehouses, libraries, microfilm systems
and car parking systems. However, in the maritime sector it is a little bit new, or at least it is not
getting the fair share as the others. We largely base our theoretical work on this concept.
Several pieces of literature are addressing various aspects of the topic before many years ago, but
the idea was not fully developed or matured and ready to be used or adopted. Nobody was willing
to take the risk and engage in such adventure. There were no mega- ships, no high numbers of
containers to be handled, no competition among container terminals, and no over-crowding in the

CHALMERS, Technology Management and Economics, Master’s Thesis E 2015: 081 53
harbors to motivate and attract the decision maker and the academic community to looking for
new solutions.
Theoretically, the study trying to make the concept of AS/RS comes to life in the marine realm to
keep along with the port improvement and the transformation from the technical- orientation to
economic- orientation, where even wasting few seconds could be costing a significant amount of
the capital in long-term.
Applying the concept of AS/RS will reduce the human factor effects in the industry, many
investigations show that the human errors represent the largest threat to the most sophisticated and
complex systems.
As a part of this study applying some statistical elements, such the hypothesis approach was
essential to approve the validity of the new concept in time-saving.
Examining some cases and carrying out experiments in reality might be limited, risky and
consuming the money and time with unsecured results. Then why not accept the first step and
adopt the shortest route to defeating this trouble by creating a real- life situation model using the
simulator techniques and simulate the mathematical operations to obtain precise results. Precisely
that is what was being practiced in this research.
Investigating the performance of couple different handling pieces of equipment based on high
precision technical information reveals the reasons behind the adverse impacts in lead-time within
the storage area. Getting an accurate diagnosis of the cause of these effects and remove this cause
will solve the problem and result in an apparent improvement in performance.
The analysis results of this study accompanied by other studies on the subject could be used in
further analysis, discusses and possible recommendations to look for the next stages of designing
and manufacturing.

54 CHALMERS, Technology Management and Economics, Master’s Thesis E 2015: 081
6.2 Practical contributions
Many practical implications from this study could be derived to enhance the operational producers
within the maritime industry. The result of this research, paving the way toward further studies
focuses on bridging the gap between the supply chain links of a transportation domain to achieve
the goal of efficiency. The thesis introduces a systematic guidance to implement a new modelling
approach to simulate all the process’s aspects in container terminals to acquire in advanced the
desired data needs to calculate performance time before take the next steps.
Several stakeholders have the opportunity to see a clear image of time-saving by use the suggested
AS/RS in storage yard as an essential component of the entire handling system. The manufacturing
engineers may found it very easy to understand our needs as a customer to produce such
equipment. The comparison between the traditional automated gantry crane and the AS/RS
performances highlight the pros and cons of these two methods that should be taken into account
in any future designs.
The investors in the marine sector could take into consider the result of this study in any reform or
planning for a newly land-based infrastructure to accomplish the differentiation and create a
competitive advantage in the market.
The research findings will support the operation managers in the port with scheduling, planning
and allocating the space and berths in a systematic manner leads to short the lead-time of
handling’s process. These activities will be affected positively to a large extent by integrating them
with the stowage plan that obtained from ships.

CHALMERS, Technology Management and Economics, Master’s Thesis E 2015: 081 55
REFERENCES
A, B., & O, M. (2013). Quay Cranes in Container Terminals. TRANSACTION ON TRANSPORT SCIENCES, 9-
18.
Agerschou. (2004). Planning and Design of Ports and Marine Terminals (2nd Edition). Thomas Telford
Ltd.
Al, R. C. (n.d.). ROUTING METHOD FOR AUTOMATED LIFTING VEHICLES CONSIDERING THE RESERVATION
SCHEDULE OF TRANSFER POINTS. International Journal of Business Tourism and Applied Science,
1-8.
Angus, S., & Maurice, W. (2011). Concise Oxford English Dictionary: Luxury Edition. Oxford: Oxford
University Press.
Asef-Vaziri, A., Ardavan, A.-V., & Berok, K. (2006). AUTOMATED TECHNOLOGIES IN MARITIME
CONTAINER TERMINALS. National Urban Freight Conference. California: METRANS.
Ashley, P. P. (2002). From Privacy Promises to Privacy Management: A New Approach for Enforcing
Privacy Throughout an Enterprise. Proc. of the, New Security Paradigms Workshop, 43–50.
Bell, J. (2005). Doing your Research Project. Berkshire: Open University Press.
Bluman, A. G. (1991). ELEMENTARY STATISTICS: A STEP BY STEP APPROACH. London: McGraw-Hill Higher
Education.
Bo, B., & Bengt, K. (2010). Quality From Customer Needs to Customer Satisfaction. Gothenburg:
StudentLiterature AB.
Böse, J. W. (2011). Handbook of Terminal Planning. Hamburg: Springer.
Böse, J. W. (2011). Operations Systems of Container Terminals: A Compendious Overview. In B.
Brinkmann, Handbook of Terminal Planning (pp. 24-65). Hamburg: Springer.
Böse, J. W., & Nils Kemme. (2011). Handbook of Terminal planning. New York: Springer.
Brinkmann, B. (2005). Seeh¨afen – Planung und Entwurf. Berlin: Springer.
BRUCE GOLDEN, S. RAGHAVAN, & EDWARD WASIL. (2008). THE VEHICLE ROUTING PROBLEM:LATEST
ADVANCES AND NEW CHALLENGES. New York: springer.
Bryfors, U. (2014, February). Embracing Automation. Port Planning,Design and Construction, p. 39.
Business, K. L. (2012). Automatic Stacking Cranes References. Hyvinkää: KoneCranes .
BusinessDictionary. (2015, May 20). Lead Time. Retrieved from Business Dictionary:
http://www.businessdictionary.com/definition/lead-time.html
Council, W. S. (2015, May 26). Containers. Retrieved from World Shipping Council:
http://www.worldshipping.org/about-the-industry/containers

56 CHALMERS, Technology Management and Economics, Master’s Thesis E 2015: 081
Creswell, J. W. (2003). RESEARCH DESIGN Qualitative, Quantitative.and Mixed Methods Approaches
SECOND EDITION. Nebraska,: SAGE Publication.
CUDAHY, B. J. (2006). THE CONTAINERSHIP REVOLUTION: Malcom McLean’s 1956 Innovation Goes
Global. Transportation Research Board of the National Academies, 246-266.
Dirk, S., Stefan, V., & Robert, S. (2004). Container terminal operation and operationsresearch – a
classification and literature review. OR Spectrum, 3-49.
Dong-Wook , S., & Photis, M. P. (2012). MARITIME LOGISTICS: CONTEMPORARY ISSUES.
Dutra, M. S. (n.d.).
Economic Commission for Europe. (2001). Terminology on combined transport. Retrieved from
http://www.unece.org/fileadmin/DAM/trans/wp24/documents/term.pdf
EnglishProverbs.in. (2015, May 26). A Chain Is No Stronger Than Its Weakest Link. Retrieved from English
Proverbs: http://www.englishproverbs.in/a-chain-is-no-stronger-than-its-weakest-link/
Fink, A. (2014). Evaluation Fundamentals:Insights into Program Effectiveness, Quality, and Value Third
Edition. Califorina: SAGE Publications.
Gary Froyland, Thorsten Koch, Nicole Megow, Emily Duane, & Howard Wren. (2008). Optimizing the
landside operation of a container terminal. OR Spectrum, 54-75.
Hans-Otto, G., & Kap, H. (2005). Container Terminals and Automated Transport Systems: Logistics
Control Issues and Quantitative Decision Support. Berlin: Springer.
Hans-Otto, G., & Kap, H. K. (n.d.). Container Terminals and Automated Transport Systems.
Hans-Otto, G., & Kim, K.-H. (2006). Container terminals and terminal operations. OR Spectrum, 437-445.
Harrison, R. (2006, 10 30). The Intermodal Container Era: History, Security, and Trends. TR NEWS,
Transportation research board of the National Academies, p. 246.
Hart, C. (1998). Doing a Literature Review. London: SAGE Publications.
Henesey, L. E. (2006). Multi-Agent Systems for Container Terminal Management. Karlskrona: Blekinge
Institute of Technology.
Howard, Z., & Zollinger, A. (2001). AS/RS APPLICATION, BENEFITS AND JUSTIFICATION IN COMPARISON
TO OTHER STORAGE METHODS. North Carolina: MHI.
Ilaria, V., Matteo, S., & Michel, B. (2010). Optimization of operations in container terminals: hierarchical
vs integrated approaches. Lausanne: STRC.
Information. (2015, May 26). Types of Container for Shipping Cargo. Retrieved from Canarship:
http://canarship.eu/en/types-of-container-for-shipping-cargo/
Ioannou, P. A. (2008). Intelligent Freight Transportation. California: CRC Press.

CHALMERS, Technology Management and Economics, Master’s Thesis E 2015: 081 57
Iris, F. V., & I. H. (2005). Comparison of vehicle types at an automated container terminal. In H.-O. G.
Kim, Container Terminals and Automated Transport Systems (pp. 51-77). New York: Springer
Berlin Heidelberg.
James, P. W., & Daniel, T. J. (2003). Lean Thinking. New York: Free Press.
Joaquin, G.-A., Guillermo, N.-A., Nora, C.-B., & Sabrina, D. (2012). Data Privacy Management and
Autonomous Spontaneus Security. Berlin: Springer.
Jürgen, w. (2011). Handbook of Terminal Planning. New York: Springer.
Karlsen, H. (2015, June 3). ABB. Retrieved from Switch to mega-ships raises stakes at ports:
http://www02.abb.com/global/gad/gad02465.nsf/0/596596caffddd247c1257bf2002c8cc7/$file
/switch+to+mega-ships+raises+stakes+at+ports.pdf
Kees, J. R., & Iris, F. V. (2009). A survey of literature on automated storage and retrieval systems.
European Journal of Operational Research, 343–362.
Kemme, N. (2012). Design and Operation of Automated Container Storage Systems. Hamburg: Springer.
Kerlinger, F. (1956). Kerlinger's Criterial Referents Theory Revisited. Educational and Psychological
Measurement, 923-930.
Konecranes. (2015, June 7). SHIP-TO-SHORE GANTRY CRANES. Retrieved from Konecranes:
http://www.konecranes.com/equipment/container-handling-cranes/ship-to-shore-gantry-
cranes
Lazic, M. B. (2006). Is the Semi-Automated or Automated Rail Mounted Gantry Operation a Green
Terminal? American Association of Port Authorities. Florida: AAAP.
Lee, D.-H., Cao, J. X., Shi, Q., & Chen, J. H. (2009, September). A heuristic algorithm for yard truck
scheduling and storage allocation problems. Transportation Research Part E: Logistics and
Transportation Review, pp. 810–820.
Levinson, M. (2008). The Box: How the Shipping Container Made the World Smaller and the World
Economy Bigger. New Jersey: Princton University Press.
Loretah. (2015, June 2). Straddle carrier. Retrieved from TurboSquid: http://www.turbosquid.com/3d-
models/straddle-carrier-3d-model/590184
Marco, C., Stefan, V., & Moshe, S. (2011). Applying the corridor method to a blocks relocation problem.
Operations Research-Spektrum, 915-929.
Maxwell, J. A. (2012). Qualitative Research Design: An Interactive Approach: An Interactive Approach.
California: SAGE Publication Inc.
Mencken, H. (1949). A Mencken Chrestomathy. New York: KNOPH.
Miguel A. Salido, Oscar Sapena, & Federico Barber. ( 2009 , Sept). THE CONTAINER STACKING PROBLEM:
AN ARTIFICIAL INTELLIGENCE PLANNING-BASED APPROACH. Retrieved from |IEEE Xplore Digital
Library: users.dsic.upv.es/grupos/grps/downloadPaper.php?paperId=112

58 CHALMERS, Technology Management and Economics, Master’s Thesis E 2015: 081
Milan, P., & Willem, J. (2007). Security, Privacy, and Trust in Modern Data Management. Berlin: Springer.
Omar Lengerke, & Max Suell. (2011). Mechatronics Series 1, Volume 1: Intelligent Transportation
Vehicles. Sharjah: Bentham Science Publishers.
Rajotia, S., Shanker, K., & Batra, J. (1998). Determination of optimal AGV fleet size for an FMS.
International Journal of Production, 1177-1198.
Ri Choe, D. L. (2006). ROUTING METHOD FOR AUTOMATED LIFTING VEHICLES CONSIDERING THE
RESERVATION SCHEDULE OF TRANSFER POINTS. International Journal of Business Tourism and
Applied Science.
Shinohara, M. (2012). Ports iCompetition Paradigims and japanees Port Clusters. In D. César, d. Peter, &
N. Dr Theo, Ports in Proximity: Competition and Coordination among Adjacent Seaports (pp. 237-
246). Surrey: Ashgate Publishing, Ltd.
Soberón, A. M. (2012). The Capacity in Container Port Terminals. Geneva: UNCTAD.
Stopford, M. (2009). Maritime Economics 3e. Oxon: Routledge.
Tan, J. (2015, May 26). Warehouse Management System. Retrieved from hello-dcm: http://hello-
dcm.blogspot.se/
Valkengoed, M. P. (2004). HOW PASSING CRANES INFLUENCE STACK OPERATIONS IN A CONTAINER
TERMINAL: A simulation study. Amsterdam: TBA Nederland.
Wiese, J. (2011). Quantitative decision support for the layout design of container terminals. Paderborn:
University of Paderborn.
Yasir, A., & Usman, F. (2009). Container Terminal Operations Modeling through Multi-Agent based
Simulation. RONNEBY: Blekinge Institute of Technology.

CHALMERS, Technology Management and Economics, Master’s Thesis E 2015: 081 59
APPENDICES

60 CHALMERS, Technology Management and Economics, Master’s Thesis E 2015: 081
APPENDIX A: Scenario 1 – Calculations using MS-Excel

CHALMERS, Technology Management and Economics, Master’s Thesis E 2015: 081 61
APPENDIX B: Scenario 2 – Calculations using MS-Excel

62 CHALMERS, Technology Management and Economics, Master’s Thesis E 2015: 081
APPENDIX C: Implementation of simulated experiment using 3D Max®
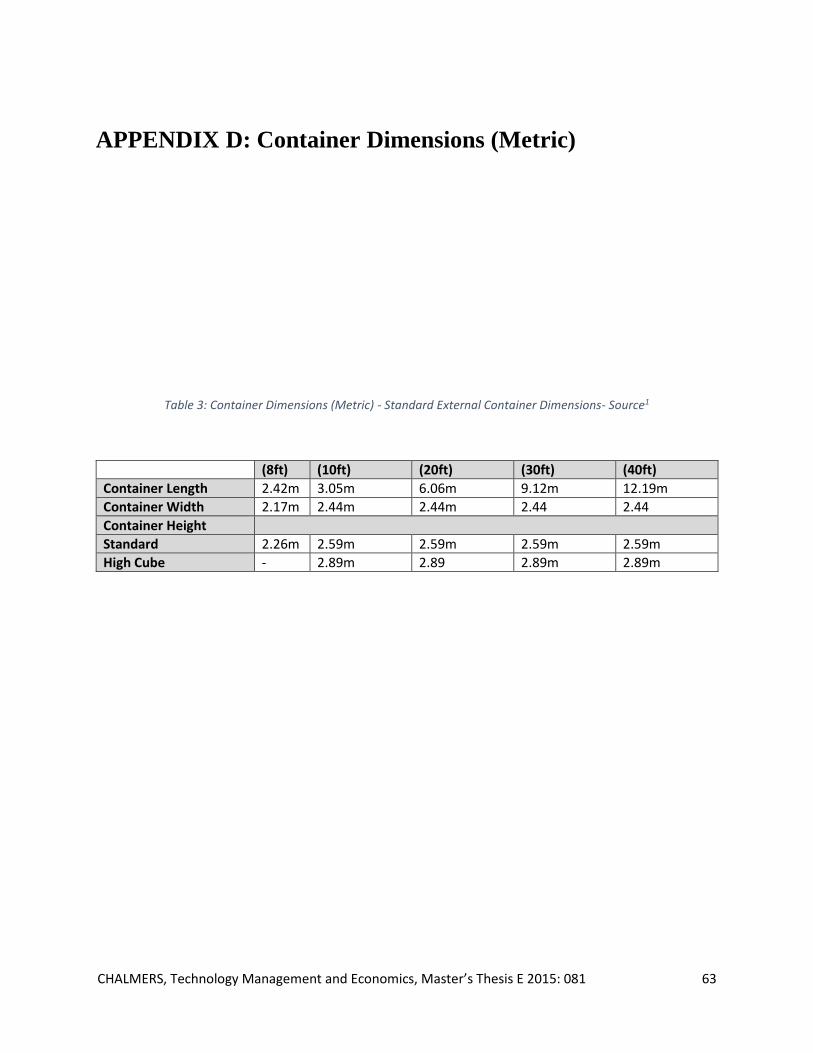
CHALMERS, Technology Management and Economics, Master’s Thesis E 2015: 081 63
APPENDIX D: Container Dimensions (Metric)
(8ft) (10ft) (20ft) (30ft) (40ft)
Container Length 2.42m 3.05m 6.06m 9.12m 12.19m
Container Width 2.17m 2.44m 2.44m 2.44 2.44
Container Height
Standard 2.26m 2.59m 2.59m 2.59m 2.59m
High Cube - 2.89m 2.89 2.89m 2.89m
Table 3: Container Dimensions (Metric) - Standard External Container Dimensions- Source1

64 CHALMERS, Technology Management and Economics, Master’s Thesis E 2015: 081
APPENDIX E: Specifications of Automated Gantry Crane
The specifications of the automated crane including the speed of horizontal and vertical
movements according to loading/ unloading status have been derived from the brochure data sheet
of KONCRANE crane.

CHALMERS, Technology Management and Economics, Master’s Thesis E 2015: 081 65
APPENDIX F: Summary of container stacking references

66 CHALMERS, Technology Management and Economics, Master’s Thesis E 2015: 081
Table 4: Comparision between different references that handles containers-stacking