Embed Size (px)
Citation preview
Country Profile 2006
Malaysia This Country Profile is a reference work, analysing the country�s history, politics, infrastructure and economy. It is revised and updated annually. The Economist Intelligence Unit�s Country Reports analyse current trends and provide a two-year forecast.
The full publishing schedule for Country Profiles is now available on our website at www.eiu.com/schedule The Economist Intelligence Unit 26 Red Lion Square London WC1R 4HQ United Kingdom
The Economist Intelligence Unit
The Economist Intelligence Unit is a specialist publisher serving companies establishing and managing operations across national borders. For over 50 years it has been a source of information on business developments, economic and political trends, government regulations and corporate practice worldwide.
The Economist Intelligence Unit delivers its information in four ways: through its digital portfolio, where the latest analysis is updated daily; through printed subscription products ranging from newsletters to annual reference works; through research reports; and by organising seminars and presentations. The firm is a member of The Economist Group.
London The Economist Intelligence Unit 26 Red Lion Square London WC1R 4HQ United Kingdom Tel: (44.20) 7576 8000 Fax: (44.20) 7576 8500 E-mail: [email protected]
New York The Economist Intelligence Unit The Economist Building 111 West 57th Street New York NY 10019, US Tel: (1.212) 554 0600 Fax: (1.212) 586 0248 E-mail: [email protected]
Hong Kong The Economist Intelligence Unit 60/F, Central Plaza 18 Harbour Road Wanchai Hong Kong Tel: (852) 2585 3888 Fax: (852) 2802 7638 E-mail: [email protected]
Website: www.eiu.com
Electronic delivery This publication can be viewed by subscribing online at www.store.eiu.com
Reports are also available in various other electronic formats, such as CD-ROM, Lotus Notes, online databases and as direct feeds to corporate intranets. For further information, please contact your nearest Economist Intelligence Unit office
Copyright © 2006 The Economist Intelligence Unit Limited. All rights reserved. Neither this publication nor any part of it may be reproduced, stored in a retrieval system, or transmitted in any form or by any means, electronic, mechanical, photocopying, recording or otherwise, without the prior permission of The Economist Intelligence Unit Limited.
All information in this report is verified to the best of the author's and the publisher's ability. However, the Economist Intelligence Unit does not accept responsibility for any loss arising from reliance on it.
ISSN 1741-0096
Symbols for tables �n/a� means not available; ��� means not applicable
Printed and distributed by Patersons Dartford, Questor Trade Park, 151 Avery Way, Dartford, Kent DA1 1JS, UK.
Ten
om
Ko
ta K
inab
alu
San
dak
anR
anu
Ran
uR
anu
Lah
ad D
atu Ta
wau
Sem
po
rna
Ku
dat
Bala
mba
ngan
Ba
ngg
iB
an
ggi
Ba
ngg
iB
an
ggi
Bea
ufo
rtB
eau
fort
Bea
ufo
rtLa
bua
n I
s. Bru
nei
Ba
y
Mir
i
BBin
tulu
Sib
u Sim
anSi
man
gg
ang
gg
ang
Sim
ang
gan
g
Ku
chin
g
Sem
atan
BR
UN
EI
IND
ON
ES
IA
SA
RA
WA
K
SA
BA
H
Cro
cker
Range
Cro
cker
Range
SOU
TH C
HIN
ASE
A
SULU
SEA
CELE
BES
SEA
Ba
lab
ac
Stra
itB
ala
ba
cSt
rait
Ba
lab
ac
Stra
it
THEPHILIP
PINES
Ipo
hIp
oh
Ku
ala
Lip
isK
ual
a Li
pis
Tap
ahTa
pah
Tem
erlo
hTe
mer
loh
KU
ALA
LU
MP
UR
KU
ALA
LU
MP
UR
aya
aya
KU
ALA
LU
MP
UR
Ku
ala
Tere
ng
gan
u
Ipo
h
Joh
or
Bah
aru
Pu
traj
aya
Pu
traj
aya
Pu
traj
aya
Pet
alin
g J
aya
Geo
rget
ow
n
Ko
ta B
ahar
u
Ku
ala
Ker
aiK
ual
a K
erai
Ku
ala
Ker
ai
Du
ng
un
Chu
kai
Ku
anta
n
Tum
pat
Tum
pat
Tum
pat
Mel
aka
Mel
aka
Klu
ang
Klu
ang
JOH
OR
JOH
OR
Mer
sin
g
Tio
ma
n I
s.
Klu
ang
Sere
mb
anSe
rem
ban
Seg
amat
Seg
amat
Sere
mb
an
Ku
ala
Lip
isTa
pah
Tem
erlo
h
Seg
amat
Mu
ar
Bat
u P
ahat
Kel
ang
Bag
an D
atu
kTe
luk
An
son
Bat
u G
ajah
Pari
t B
un
tai
Alu
r Se
tar Ta
ipin
g
Pera
iPe
rai
PE
RA
KP
ER
AK
KE
LA
NTA
NK
EL
AN
TAN
Pera
i
Kan
gar
Kan
gar
Kan
gar
MA
LA
YS
IAM
AL
AY
SIA
MA
LA
YS
IA
THA
ILA
ND
IND
ON
ES
IA
SIN
GA
PO
RE
SOU
TH C
HIN
A
SEA
Stra
it o
f M
ala
cca
TER
EN
GG
AN
UTE
RE
NG
GA
NU
TER
EN
GG
AN
U
PA
HA
NG
PE
RA
K NG
OR
NG
OR
SE
LA
NG
OR
AN
AN
NE
GE
RI
SE
MB
ILA
N
MA
LA
CC
AJO
HO
R
KE
DA
H
PE
RL
IS
PE
NA
NG
KE
LA
NTA
N
Mel
aka
0 k
m10
02
00
0 m
iles
100
150
50
0 k
m10
02
00
30
0
0 m
iles
100
150
50
Oct
obe
r 2
00
6
Mai
n r
ailw
ay
Mai
n r
oad
Inte
rnat
ion
al b
ou
nd
ary
Ad
min
istr
ativ
e b
ou
nd
ary
Mai
n a
irp
ort
Cap
ital
Maj
or
tow
n
Oth
er t
ow
n
© T
he
Eco
no
mis
t In
tell
igen
ce U
nit
Lim
ited
20
06
Country Profile 2006 www.eiu.com © The Economist Intelligence Unit Limited 2006
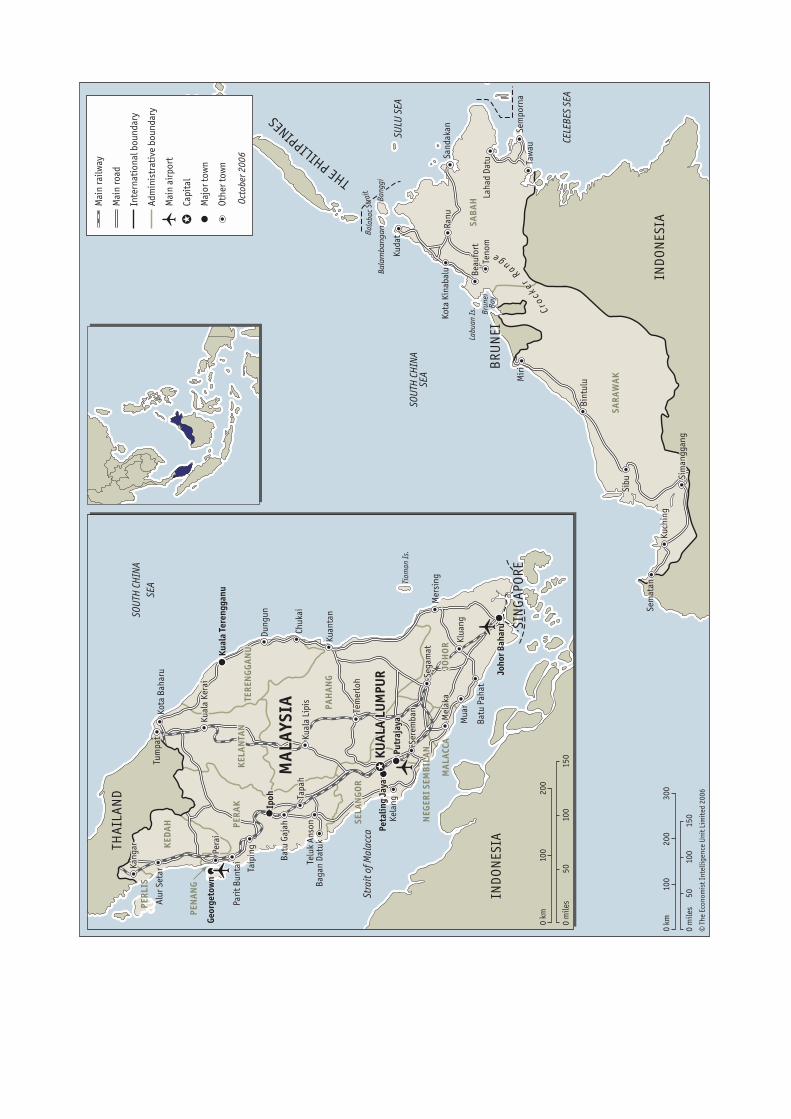
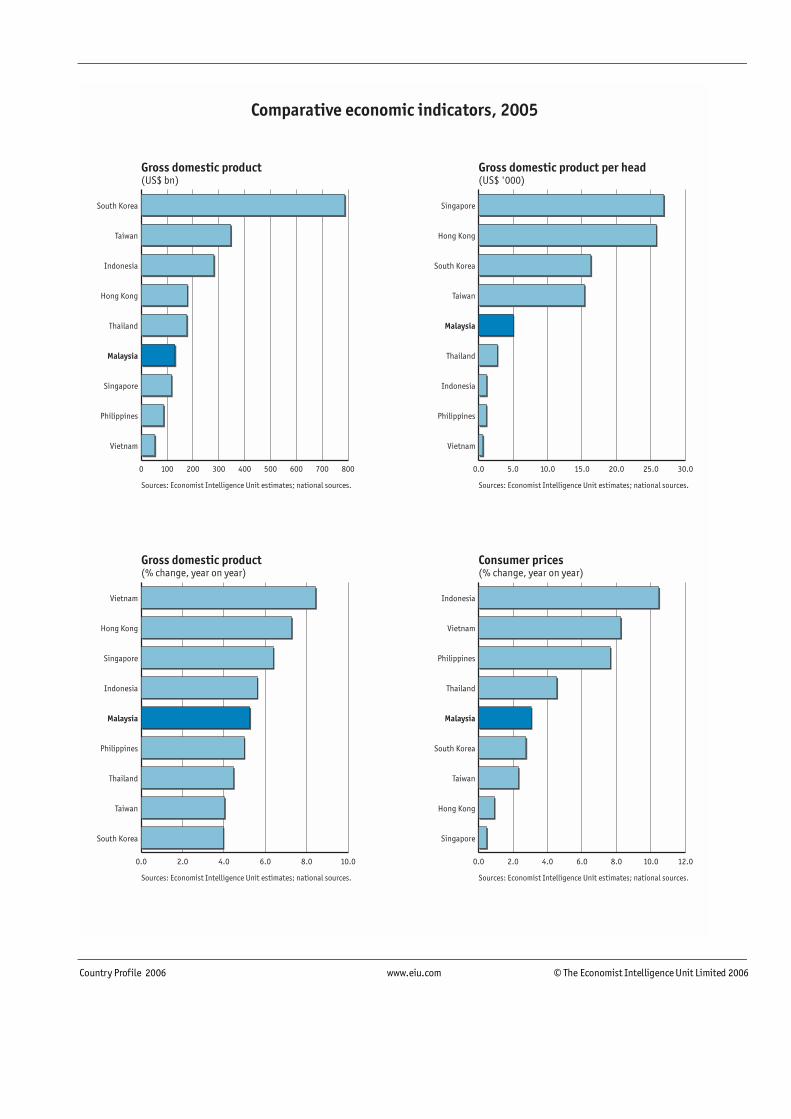
Comparative economic indicators, 2005
Gross domestic product(US$ bn)
Sources: Economist Intelligence Unit estimates; national sources.
Gross domestic product(% change, year on year)
Sources: Economist Intelligence Unit estimates; national sources.
Consumer prices(% change, year on year)
Sources: Economist Intelligence Unit estimates; national sources.
Gross domestic product per head(US$ '000)
Sources: Economist Intelligence Unit estimates; national sources.
0.0 5.0 10.0 15.0 20.0 25.0 30.0
Vietnam
Philippines
Indonesia
Thailand
Malaysia
Taiwan
South Korea
Hong Kong
Singapore
0 100 200 300 400 500 600 700 800
Vietnam
Philippines
Singapore
Malaysia
Thailand
Hong Kong
Indonesia
Taiwan
South Korea
0.0 2.0 4.0 6.0 8.0 10.0 12.0
Singapore
Hong Kong
Taiwan
South Korea
Malaysia
Thailand
Philippines
Vietnam
Indonesia
0.0 2.0 4.0 6.0 8.0 10.0
South Korea
Taiwan
Thailand
Philippines
Malaysia
Indonesia
Singapore
Hong Kong
Vietnam
Malaysia 1
© The Economist Intelligence Unit Limited 2006 www.eiu.com Country Profile 2006
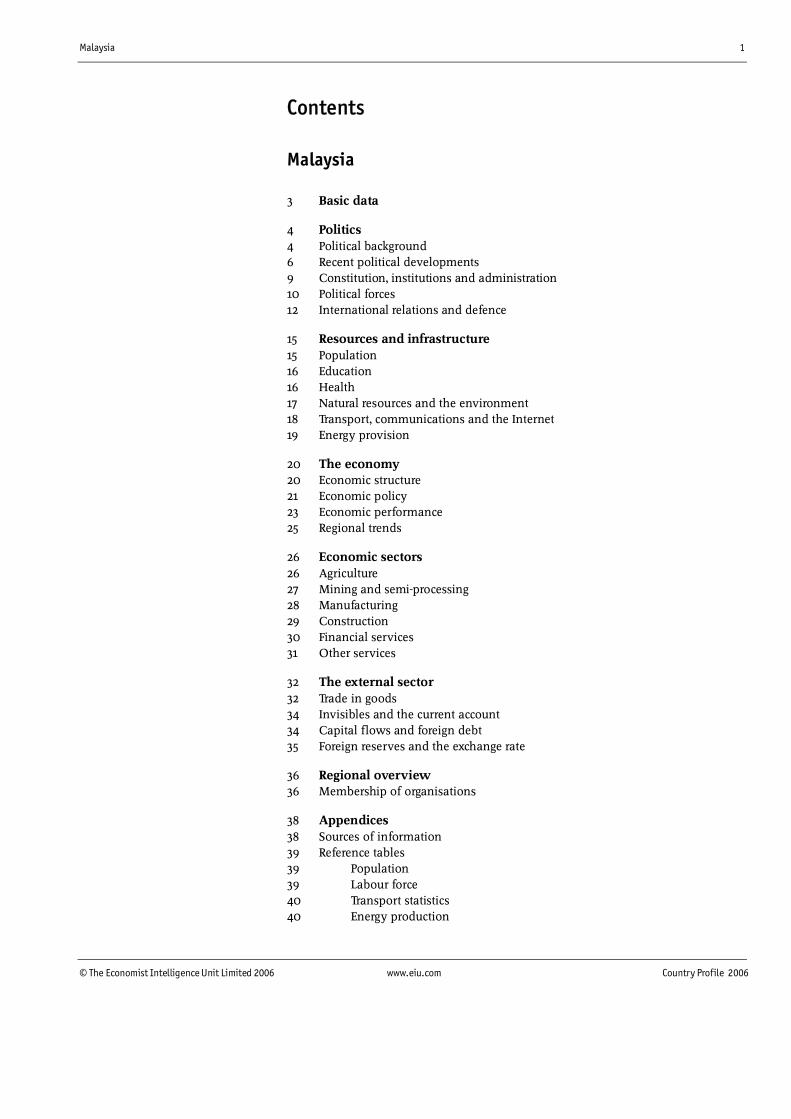
Contents
Malaysia
3 Basic data
4 Politics 4 Political background 6 Recent political developments 9 Constitution, institutions and administration 10 Political forces 12 International relations and defence
15 Resources and infrastructure 15 Population 16 Education 16 Health 17 Natural resources and the environment 18 Transport, communications and the Internet 19 Energy provision
20 The economy 20 Economic structure 21 Economic policy 23 Economic performance 25 Regional trends
26 Economic sectors 26 Agriculture 27 Mining and semi-processing 28 Manufacturing 29 Construction 30 Financial services 31 Other services
32 The external sector 32 Trade in goods 34 Invisibles and the current account 34 Capital flows and foreign debt 35 Foreign reserves and the exchange rate
36 Regional overview 36 Membership of organisations
38 Appendices 38 Sources of information 39 Reference tables 39 Population 39 Labour force 40 Transport statistics 40 Energy production
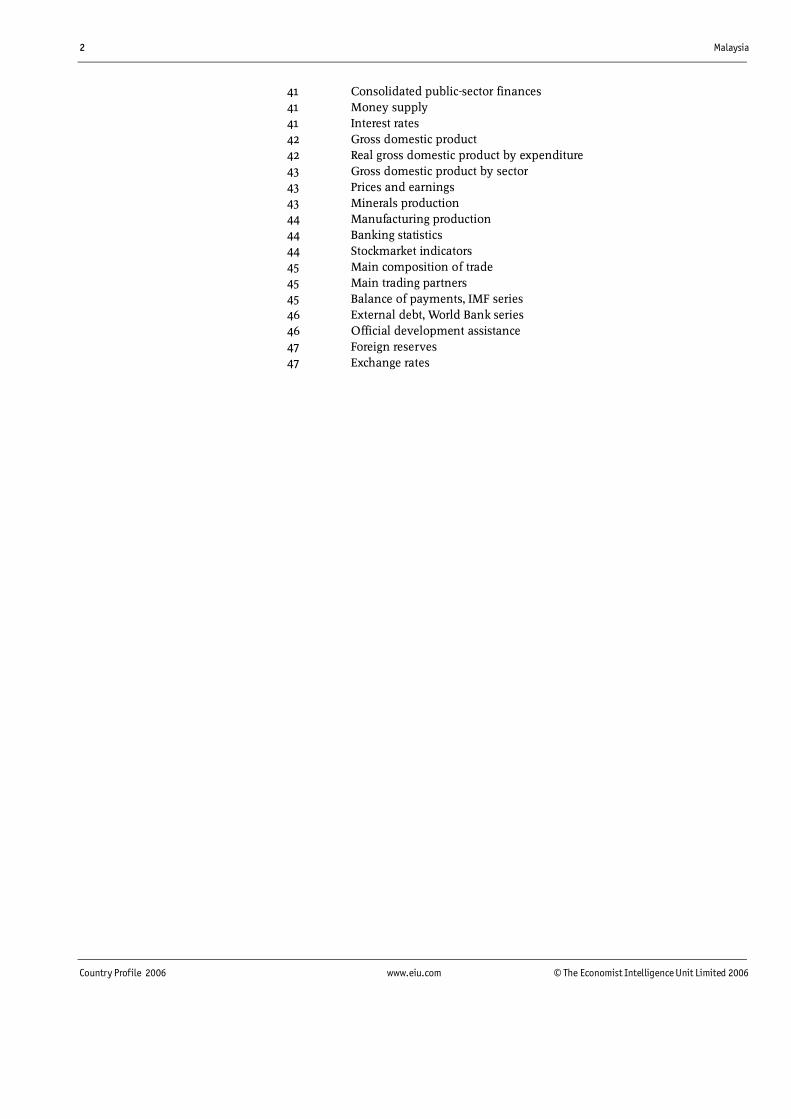
2 Malaysia
Country Profile 2006 www.eiu.com © The Economist Intelligence Unit Limited 2006
41 Consolidated public-sector finances 41 Money supply 41 Interest rates 42 Gross domestic product 42 Real gross domestic product by expenditure 43 Gross domestic product by sector 43 Prices and earnings 43 Minerals production 44 Manufacturing production 44 Banking statistics 44 Stockmarket indicators 45 Main composition of trade 45 Main trading partners 45 Balance of payments, IMF series 46 External debt, World Bank series 46 Official development assistance 47 Foreign reserves 47 Exchange rates
Malaysia 3
© The Economist Intelligence Unit Limited 2006 www.eiu.com Country Profile 2006
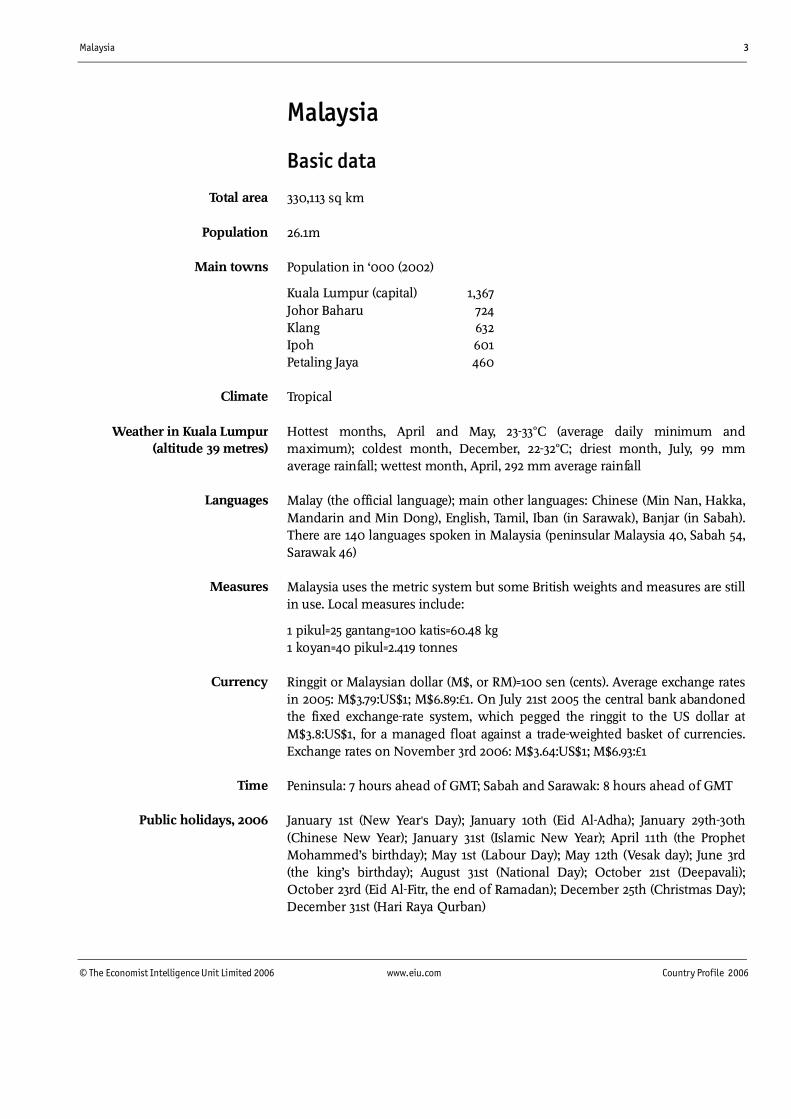
Malaysia
Basic data
330,113 sq km
26.1m
Population in �000 (2002)
Kuala Lumpur (capital) 1,367 Johor Baharu 724 Klang 632 Ipoh 601 Petaling Jaya 460
Tropical
Hottest months, April and May, 23-33°C (average daily minimum and maximum); coldest month, December, 22-32°C; driest month, July, 99 mm average rainfall; wettest month, April, 292 mm average rainfall
Malay (the official language); main other languages: Chinese (Min Nan, Hakka, Mandarin and Min Dong), English, Tamil, Iban (in Sarawak), Banjar (in Sabah). There are 140 languages spoken in Malaysia (peninsular Malaysia 40, Sabah 54, Sarawak 46)
Malaysia uses the metric system but some British weights and measures are still in use. Local measures include:
1 pikul=25 gantang=100 katis=60.48 kg 1 koyan=40 pikul=2.419 tonnes
Ringgit or Malaysian dollar (M$, or RM)=100 sen (cents). Average exchange rates in 2005: M$3.79:US$1; M$6.89:£1. On July 21st 2005 the central bank abandoned the fixed exchange-rate system, which pegged the ringgit to the US dollar at M$3.8:US$1, for a managed float against a trade-weighted basket of currencies. Exchange rates on November 3rd 2006: M$3.64:US$1; M$6.93:£1
Peninsula: 7 hours ahead of GMT; Sabah and Sarawak: 8 hours ahead of GMT
January 1st (New Year!s Day); January 10th (Eid Al-Adha); January 29th-30th (Chinese New Year); January 31st (Islamic New Year); April 11th (the Prophet Mohammed�s birthday); May 1st (Labour Day); May 12th (Vesak day); June 3rd (the king�s birthday); August 31st (National Day); October 21st (Deepavali); October 23rd (Eid Al-Fitr, the end of Ramadan); December 25th (Christmas Day); December 31st (Hari Raya Qurban)
Total area
Climate
Weather in Kuala Lumpur (altitude 39 metres)
Languages
Measures
Currency
Time
Public holidays, 2006
Population
Main towns
4 Malaysia
Country Profile 2006 www.eiu.com © The Economist Intelligence Unit Limited 2006
Politics
Political background
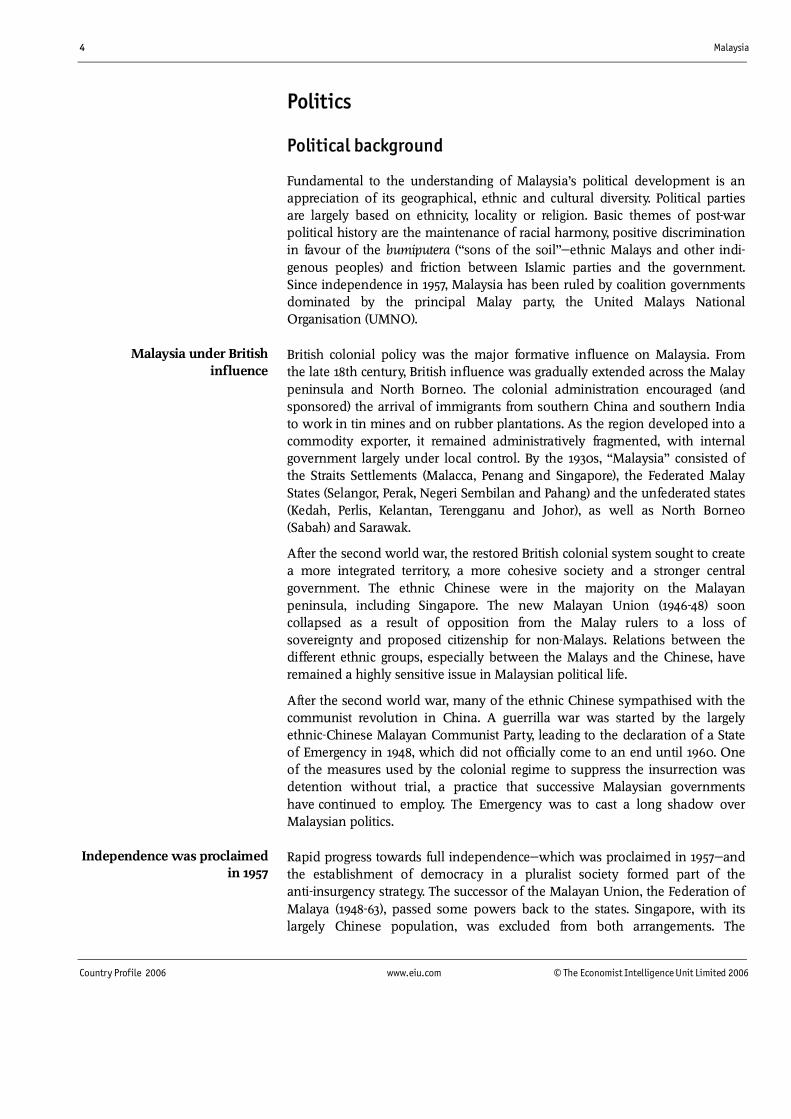
Fundamental to the understanding of Malaysia�s political development is an appreciation of its geographical, ethnic and cultural diversity. Political parties are largely based on ethnicity, locality or religion. Basic themes of post-war political history are the maintenance of racial harmony, positive discrimination in favour of the bumiputera (�sons of the soil�"ethnic Malays and other indi-genous peoples) and friction between Islamic parties and the government. Since independence in 1957, Malaysia has been ruled by coalition governments dominated by the principal Malay party, the United Malays National Organisation (UMNO).
British colonial policy was the major formative influence on Malaysia. From the late 18th century, British influence was gradually extended across the Malay peninsula and North Borneo. The colonial administration encouraged (and sponsored) the arrival of immigrants from southern China and southern India to work in tin mines and on rubber plantations. As the region developed into a commodity exporter, it remained administratively fragmented, with internal government largely under local control. By the 1930s, �Malaysia� consisted of the Straits Settlements (Malacca, Penang and Singapore), the Federated Malay States (Selangor, Perak, Negeri Sembilan and Pahang) and the unfederated states (Kedah, Perlis, Kelantan, Terengganu and Johor), as well as North Borneo (Sabah) and Sarawak.
After the second world war, the restored British colonial system sought to create a more integrated territory, a more cohesive society and a stronger central government. The ethnic Chinese were in the majority on the Malayan peninsula, including Singapore. The new Malayan Union (1946-48) soon collapsed as a result of opposition from the Malay rulers to a loss of sovereignty and proposed citizenship for non-Malays. Relations between the different ethnic groups, especially between the Malays and the Chinese, have remained a highly sensitive issue in Malaysian political life.
After the second world war, many of the ethnic Chinese sympathised with the communist revolution in China. A guerrilla war was started by the largely ethnic-Chinese Malayan Communist Party, leading to the declaration of a State of Emergency in 1948, which did not officially come to an end until 1960. One of the measures used by the colonial regime to suppress the insurrection was detention without trial, a practice that successive Malaysian governments have continued to employ. The Emergency was to cast a long shadow over Malaysian politics.
Rapid progress towards full independence"which was proclaimed in 1957"and the establishment of democracy in a pluralist society formed part of the anti-insurgency strategy. The successor of the Malayan Union, the Federation of Malaya (1948-63), passed some powers back to the states. Singapore, with its largely Chinese population, was excluded from both arrangements. The
Independence was proclaimed in 1957
Malaysia under British influence
Malaysia 5
© The Economist Intelligence Unit Limited 2006 www.eiu.com Country Profile 2006
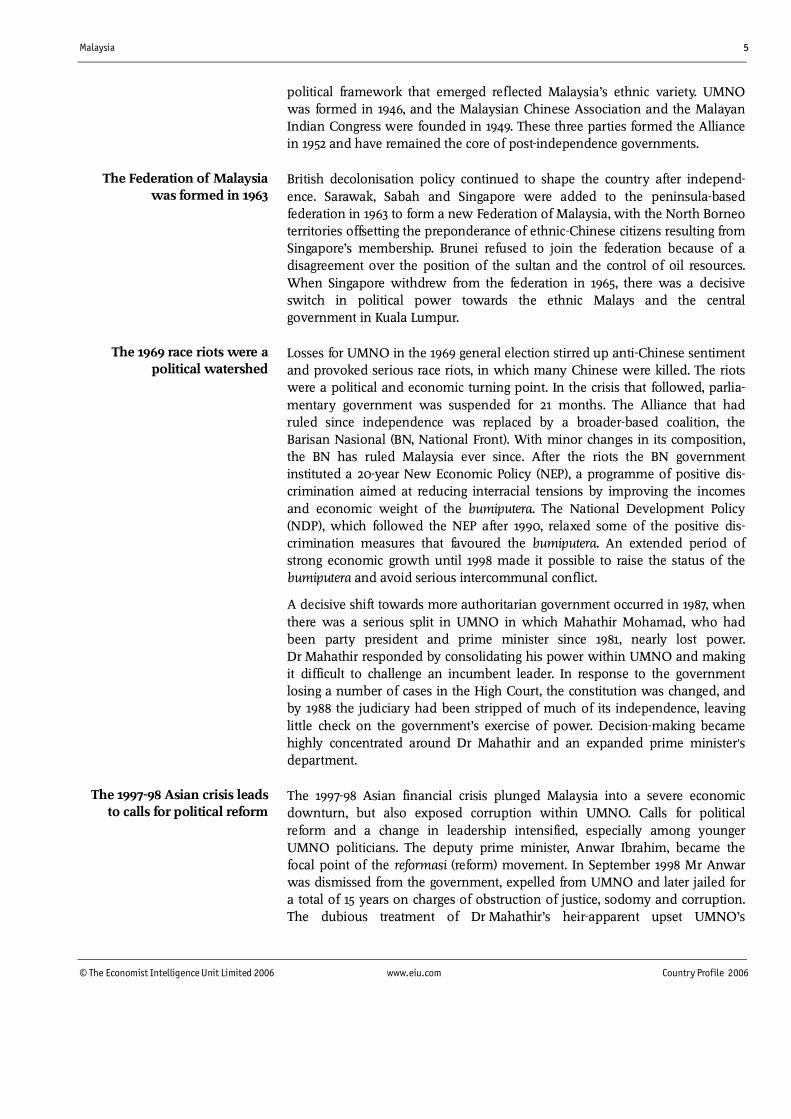
political framework that emerged reflected Malaysia�s ethnic variety. UMNO was formed in 1946, and the Malaysian Chinese Association and the Malayan Indian Congress were founded in 1949. These three parties formed the Alliance in 1952 and have remained the core of post-independence governments.
British decolonisation policy continued to shape the country after independ-ence. Sarawak, Sabah and Singapore were added to the peninsula-based federation in 1963 to form a new Federation of Malaysia, with the North Borneo territories offsetting the preponderance of ethnic-Chinese citizens resulting from Singapore�s membership. Brunei refused to join the federation because of a disagreement over the position of the sultan and the control of oil resources. When Singapore withdrew from the federation in 1965, there was a decisive switch in political power towards the ethnic Malays and the central government in Kuala Lumpur.
Losses for UMNO in the 1969 general election stirred up anti-Chinese sentiment and provoked serious race riots, in which many Chinese were killed. The riots were a political and economic turning point. In the crisis that followed, parlia-mentary government was suspended for 21 months. The Alliance that had ruled since independence was replaced by a broader-based coalition, the Barisan Nasional (BN, National Front). With minor changes in its composition, the BN has ruled Malaysia ever since. After the riots the BN government instituted a 20-year New Economic Policy (NEP), a programme of positive dis-crimination aimed at reducing interracial tensions by improving the incomes and economic weight of the bumiputera. The National Development Policy (NDP), which followed the NEP after 1990, relaxed some of the positive dis-crimination measures that favoured the bumiputera. An extended period of strong economic growth until 1998 made it possible to raise the status of the bumiputera and avoid serious intercommunal conflict.
A decisive shift towards more authoritarian government occurred in 1987, when there was a serious split in UMNO in which Mahathir Mohamad, who had been party president and prime minister since 1981, nearly lost power. Dr Mahathir responded by consolidating his power within UMNO and making it difficult to challenge an incumbent leader. In response to the government losing a number of cases in the High Court, the constitution was changed, and by 1988 the judiciary had been stripped of much of its independence, leaving little check on the government�s exercise of power. Decision-making became highly concentrated around Dr Mahathir and an expanded prime minister!s department.
The 1997-98 Asian financial crisis plunged Malaysia into a severe economic downturn, but also exposed corruption within UMNO. Calls for political reform and a change in leadership intensified, especially among younger UMNO politicians. The deputy prime minister, Anwar Ibrahim, became the focal point of the reformasi (reform) movement. In September 1998 Mr Anwar was dismissed from the government, expelled from UMNO and later jailed for a total of 15 years on charges of obstruction of justice, sodomy and corruption. The dubious treatment of Dr Mahathir�s heir-apparent upset UMNO�s
The Federation of Malaysia was formed in 1963
The 1969 race riots were a political watershed
The 1997-98 Asian crisis leads to calls for political reform
6 Malaysia
Country Profile 2006 www.eiu.com © The Economist Intelligence Unit Limited 2006
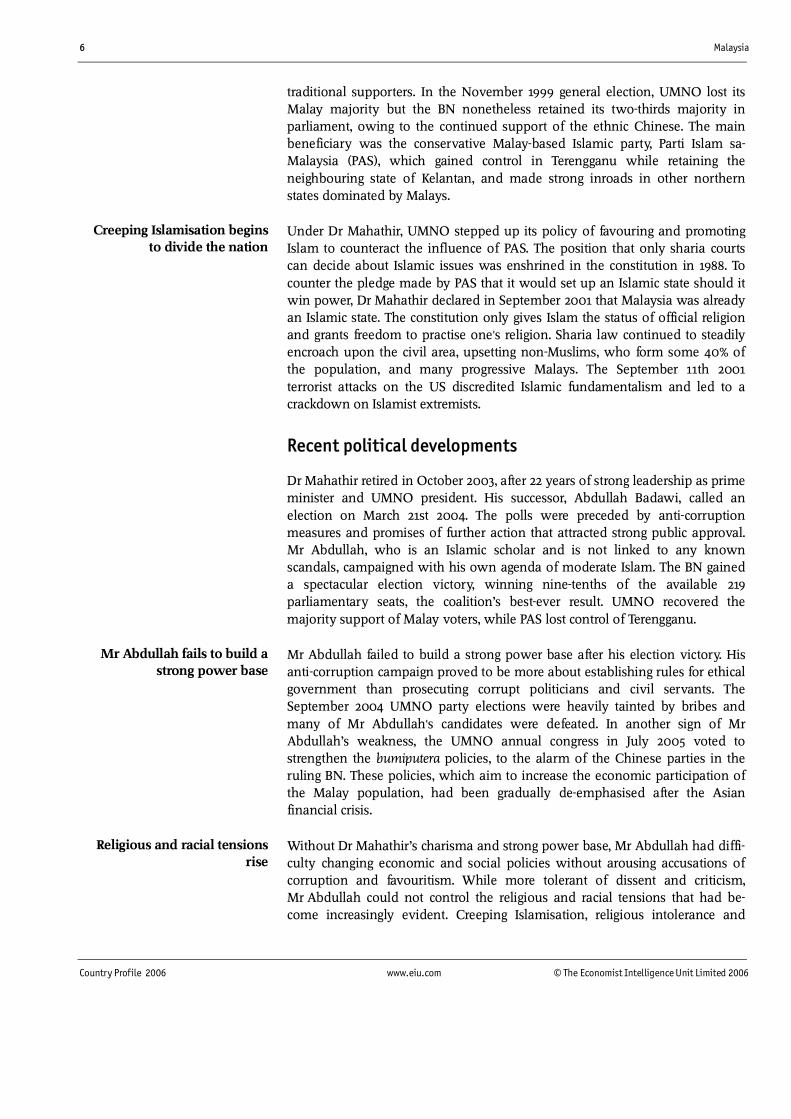
traditional supporters. In the November 1999 general election, UMNO lost its Malay majority but the BN nonetheless retained its two-thirds majority in parliament, owing to the continued support of the ethnic Chinese. The main beneficiary was the conservative Malay-based Islamic party, Parti Islam sa-Malaysia (PAS), which gained control in Terengganu while retaining the neighbouring state of Kelantan, and made strong inroads in other northern states dominated by Malays.
Under Dr Mahathir, UMNO stepped up its policy of favouring and promoting Islam to counteract the influence of PAS. The position that only sharia courts can decide about Islamic issues was enshrined in the constitution in 1988. To counter the pledge made by PAS that it would set up an Islamic state should it win power, Dr Mahathir declared in September 2001 that Malaysia was already an Islamic state. The constitution only gives Islam the status of official religion and grants freedom to practise one!s religion. Sharia law continued to steadily encroach upon the civil area, upsetting non-Muslims, who form some 40% of the population, and many progressive Malays. The September 11th 2001 terrorist attacks on the US discredited Islamic fundamentalism and led to a crackdown on Islamist extremists.
Recent political developments
Dr Mahathir retired in October 2003, after 22 years of strong leadership as prime minister and UMNO president. His successor, Abdullah Badawi, called an election on March 21st 2004. The polls were preceded by anti-corruption measures and promises of further action that attracted strong public approval. Mr Abdullah, who is an Islamic scholar and is not linked to any known scandals, campaigned with his own agenda of moderate Islam. The BN gained a spectacular election victory, winning nine-tenths of the available 219 parliamentary seats, the coalition�s best-ever result. UMNO recovered the majority support of Malay voters, while PAS lost control of Terengganu.
Mr Abdullah failed to build a strong power base after his election victory. His anti-corruption campaign proved to be more about establishing rules for ethical government than prosecuting corrupt politicians and civil servants. The September 2004 UMNO party elections were heavily tainted by bribes and many of Mr Abdullah!s candidates were defeated. In another sign of Mr Abdullah�s weakness, the UMNO annual congress in July 2005 voted to strengthen the bumiputera policies, to the alarm of the Chinese parties in the ruling BN. These policies, which aim to increase the economic participation of the Malay population, had been gradually de-emphasised after the Asian financial crisis.
Without Dr Mahathir�s charisma and strong power base, Mr Abdullah had diffi-culty changing economic and social policies without arousing accusations of corruption and favouritism. While more tolerant of dissent and criticism, Mr Abdullah could not control the religious and racial tensions that had be-come increasingly evident. Creeping Islamisation, religious intolerance and
Creeping Islamisation begins to divide the nation
Mr Abdullah fails to build a strong power base
Religious and racial tensions rise
Malaysia 7
© The Economist Intelligence Unit Limited 2006 www.eiu.com Country Profile 2006
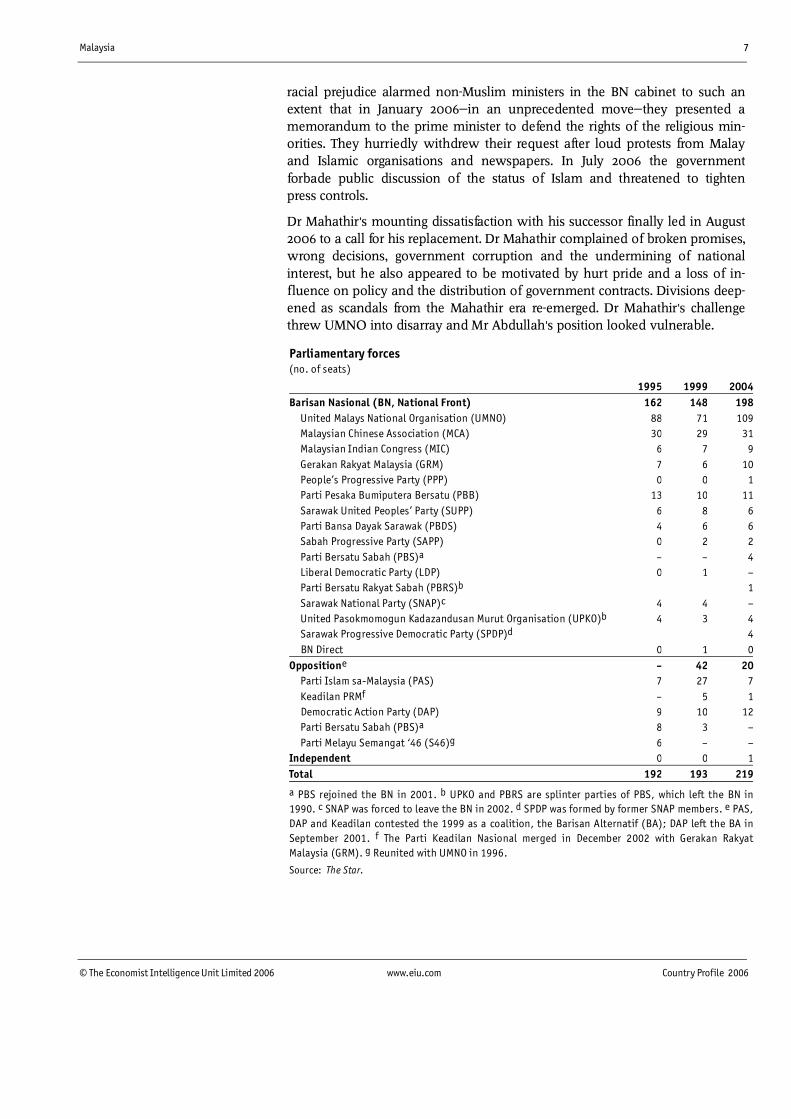
racial prejudice alarmed non-Muslim ministers in the BN cabinet to such an extent that in January 2006"in an unprecedented move"they presented a memorandum to the prime minister to defend the rights of the religious min-orities. They hurriedly withdrew their request after loud protests from Malay and Islamic organisations and newspapers. In July 2006 the government forbade public discussion of the status of Islam and threatened to tighten press controls.
Dr Mahathir!s mounting dissatisfaction with his successor finally led in August 2006 to a call for his replacement. Dr Mahathir complained of broken promises, wrong decisions, government corruption and the undermining of national interest, but he also appeared to be motivated by hurt pride and a loss of in-fluence on policy and the distribution of government contracts. Divisions deep-ened as scandals from the Mahathir era re-emerged. Dr Mahathir!s challenge threw UMNO into disarray and Mr Abdullah!s position looked vulnerable.
Parliamentary forces (no. of seats)
1995 1999 2004Barisan Nasional (BN, National Front) 162 148 198 United Malays National Organisation (UMNO) 88 71 109 Malaysian Chinese Association (MCA) 30 29 31 Malaysian Indian Congress (MIC) 6 7 9 Gerakan Rakyat Malaysia (GRM) 7 6 10 People�s Progressive Party (PPP) 0 0 1 Parti Pesaka Bumiputera Bersatu (PBB) 13 10 11 Sarawak United Peoples� Party (SUPP) 6 8 6 Parti Bansa Dayak Sarawak (PBDS) 4 6 6 Sabah Progressive Party (SAPP) 0 2 2 Parti Bersatu Sabah (PBS)a � � 4 Liberal Democratic Party (LDP) 0 1 � Parti Bersatu Rakyat Sabah (PBRS)b 1 Sarawak National Party (SNAP)c 4 4 � United Pasokmomogun Kadazandusan Murut Organisation (UPKO)b 4 3 4 Sarawak Progressive Democratic Party (SPDP)d 4 BN Direct 0 1 0Oppositione � 42 20 Parti Islam sa-Malaysia (PAS) 7 27 7 Keadilan PRMf � 5 1 Democratic Action Party (DAP) 9 10 12 Parti Bersatu Sabah (PBS)a 8 3 � Parti Melayu Semangat �46 (S46)g 6 � �Independent 0 0 1Total 192 193 219
a PBS rejoined the BN in 2001. b UPKO and PBRS are splinter parties of PBS, which left the BN in 1990. c SNAP was forced to leave the BN in 2002. d SPDP was formed by former SNAP members. e PAS, DAP and Keadilan contested the 1999 as a coalition, the Barisan Alternatif (BA); DAP left the BA inSeptember 2001. f The Parti Keadilan Nasional merged in December 2002 with Gerakan Rakyat Malaysia (GRM). g Reunited with UMNO in 1996.
Source: The Star.
8 Malaysia
Country Profile 2006 www.eiu.com © The Economist Intelligence Unit Limited 2006
The March 2004 election defeat had a devastating effect on the opposition alliance, the Barisan Alternatif (BA, Alternative Front), which consists of PAS and the Parti Keadilan Rakyat (Keadilan), the party led by Wan Azizah, the wife of Mr Anwar. The mainly ethnic-Chinese left-wing Democratic Action Party (DAP)"which left the BA in September 2001, protesting at the intention of PAS to found an Islamic state"became the largest opposition party. The release of Mr Anwar in September 2004, after his conviction for sodomy was overturned, gave new hope to a demoralised opposition. Mr Anwar used the greater leeway Mr Abdullah allowed the judiciary to rebuild his reputation and tried to prove that his downfall was the result of a conspiracy. It was often assumed that, if successful, he would rejoin UMNO, instead of becoming an opposition leader.
Important recent events
September 2001
Following the September 11th 2001 attacks on the US, the government tightens the already stringent security regulations. United Malays National Organisation (UMNO) gains support among Malay moderates by associating the opposition party, Parti Islam sa-Malaysia (PAS), with Islamist extremism. The prime minister, Mahathir Mohamad, declares that Malaysia is already an Islamic state and announces further Islamisation measures. The opposition coalition, Barisan Alternatif (BN, National Front), splits, as the Democratic Action Party (DAP) leaves over PAS!s Islamic agenda.
October 2003
Dr Mahathir retires and is succeeded by his deputy, Abdullah Badawi.
March 2004
The BN wins its largest-ever election victory with an anti-corruption agenda, thrashing PAS, which loses control of Terengganu, and reducing the Parti Keadilan Rakyat (Keadilan) to a single seat.
September 2004
The High Court overturns the conviction for sodomy of the former deputy prime minister, Anwar Ibrahim, who is set free after serving nearly six years for corruption. Corruption thrives at the UMNO party elections, in which many of Mr Abdullah!s candidates are defeated.
July 2005
UMNO�s annual congress votes to renew the system of Malay privileges; Mr Abdullah plays down its significance to his non-bumiputera coalition partners.
January 2006
Non-Muslim ministers in the BN cabinet call on Mr Abdullah to defend the rights of religious minorities.
August 2006
Dr Mahathir calls on UMNO to replace Mr Abdullah as party leader.
The opposition�s hopes are raised as Mr Anwar is freed
Malaysia 9
© The Economist Intelligence Unit Limited 2006 www.eiu.com Country Profile 2006
Constitution, institutions and administration
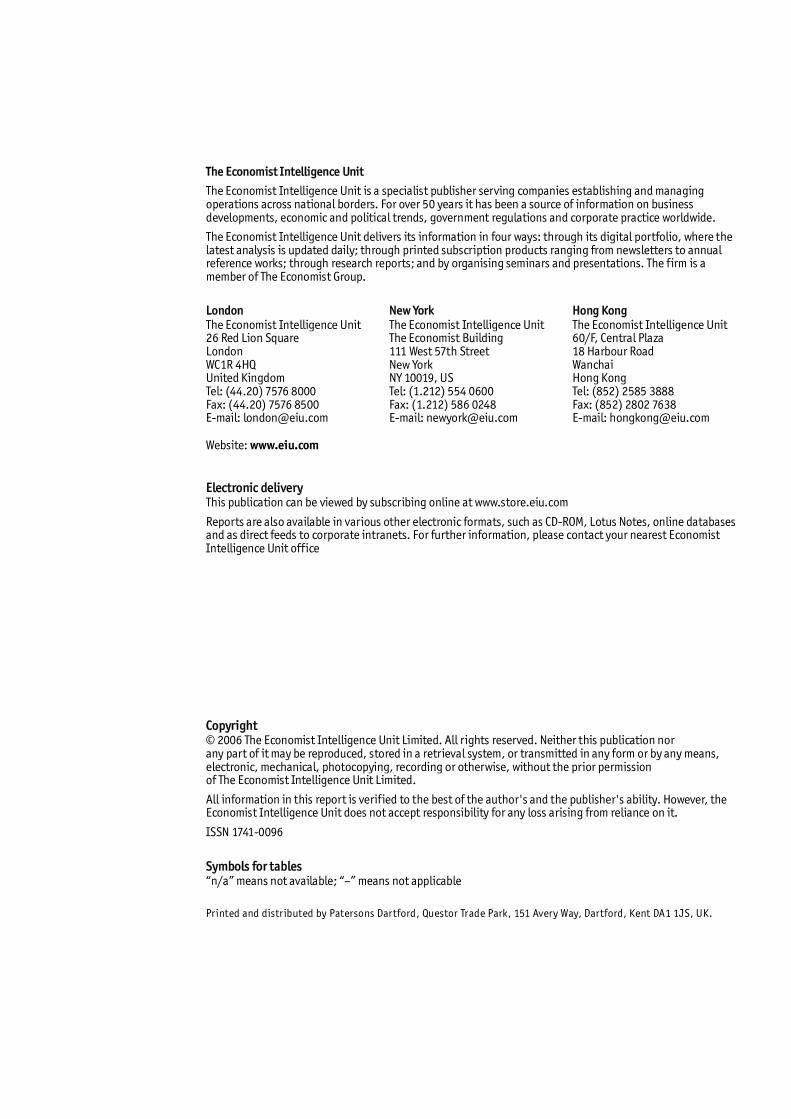
Malaysia is a federal, constitutional monarchy within the Commonwealth. The federation consists of 13 states (11 in peninsular Malaysia, plus Sarawak and Sabah); in addition there are three federal territories (Kuala Lumpur, Labuan island, and the federal administrative capital, Putrajaya).
The position of king (yang di-pertuan agung, meaning �supreme ruler�) is largely ceremonial and is rotated every five years. The nine-strong Conference of Rulers of the states of the peninsula, excluding Malacca and Penang (the sultans of Kedah, Perak, Johor, Selangor, Pahang, Terengganu and Kelantan; the yang di-pertuan besar, or supreme minister, of Negeri Sembilan; and the raja of Perlis) elects one of its number to serve as king. Each ruler is also the leader of the Islamic faith in his state.
The federal parliament consists of an upper chamber, the Senate or Dewan Negara (Council of the Nation), which has 70 members, 44 of whom are appointed by the king and 13 pairs are elected by the state legislatures, and a lower chamber, the House of Representatives or Dewan Rakyat (Council of the People), directly elected by universal suffrage, with 219 seats. The lower house has long been a rubber stamp for the BN, and little real debate on draft legislation or issues takes place there, but Mr Abdullah has introduced measures to stimulate parliamentary discussion and initiative.
Each of the 13 states in the Federation has an Executive Council dealing with non-federal matters under a menteri besar (chief minister), who is answerable to elected state assemblies. The constitutional head of each state government is either one of the traditional rulers or (in Penang, Malacca, Sabah and Sarawak) a state governor appointed by the king on the advice of the federal government. Federal territories are administered directly by the federal government.
The Malaysian judicial system still resembles the UK system inherited from the colonial period. The independence of the judiciary was effectively curbed by Dr Mahathir in 1987-88 in response to a court ruling declaring the April 1987 UMNO leadership elections invalid. The High Court was stripped of the power of judicial review and the separation of executive and judicial power was terminated. Judges were given a code of conduct, the breaching of which could result in dismissal. In the years that followed the powers of the executive were increased further. The legal framework leaves little room for the judiciary to reassert its independence. The acquittal by the High Court of Mr Anwar in September 2004 is widely viewed as a sign that Mr Abdullah will allow the judiciary greater independence, but there has been no sign of judicial reform.
In September 2001, to counter criticism from PAS, Dr Mahathir stated that Malaysia was �already� an Islamic state. This raised fear among the non-Muslim 40% of the population and remained a controversial subject. The constitution says that Islam is the official religion, but other religions are free to be practised. During the past two decades the government has actively
A federal constitutional monarchy
The federal parliament
The states� executive councils
Islam is the official religion
The independence of the judiciary has been curbed
10 Malaysia
Country Profile 2006 www.eiu.com © The Economist Intelligence Unit Limited 2006
promoted and favoured Islam. Islamic or sharia law is enforced at a state rather than federal level, and applies only to Muslims. Ethnic Malays are by definition Muslim. Apostasy or deviation from the established (Sunni) Muslim faith is likely to be punished by sharia courts. Continuing Islamisation means that conflicts between sharia law and human rights principles, enshrined in the federal constitution, are increasing.
After the May 1969 race riots, the government decided to marginalise Chinese and Indians in the civil and armed services. A few non-Malays have been promoted to high ranks of office, but the careers of the majority of non-Malays are strictly circumscribed unless they become Muslim.
Political forces
Race is the major defining feature of the political system: all major political parties are organised along racial lines. Malaysia has been ruled by coalition governments since independence, but in reality the BN coalition is totally dom-inated by UMNO and is unlikely to lose power. UMNO controls the Election Commission, which supervises elections and checks electoral rolls, and the redrawing of constituency boundaries. Because of rock-solid support for the BN in Sarawak and Sabah, the BN coalition seems almost impossible to dislodge.
UMNO, the party of Malay nationalists in the colonial period, remains the most important of the Malay parties. In the March 2004 election it regained the majority support of the Malay section of the population, which it had lost in the 1999 election. The president of UMNO invariably serves as the prime minister and UMNO members hold the deputy prime minister and key cabinet posts. Elections to the UMNO supreme council determine the leadership succession. The party voting system makes it difficult to challenge an incumbent leader but encourages bribery for other positions.
PAS is the alternative to UMNO for the Malay population; it is an ultra-conservative Islamic party and a haven for Malay protest votes, offering a greater devotion to Islam and possibly also a stronger commitment to Malay nationalism than UMNO. From its inception, PAS has intended to set up an Islamic state and introduce Islamic law. Its intention of creating an Islamic state presents a major obstacle to the building of a coalition of opposition forces.
UMNO!s position within the BN coalition is disproportionate to the number of votes it attracts. This reflects the subservient position of the Chinese parties (the Malaysian Chinese Association, or MCA, and the Parti Gerakan Rakyat Malaysia, or Gerakan) and the Indian party (Malaysian Indian Congress, or MIC), which goes back to the supposed acceptance by the immigrant community of a constitutional bargain at independence in 1957. Chinese and Indian community leaders accepted the notion of Malay special rights and the special status of Islam in exchange for citizenship.
The March 2004 election defeat had a devastating effect on the opposition alliance, the BA, which consists of PAS and the Parti Keadilan Rakyat (Keadilan), the party led by Wan Azizah, the wife of Mr Anwar. The left-of-centre, largely
Racial discrimination in administration
The BN coalition is dominated by UMNO
The opposition is weak and divided
Malaysia 11
© The Economist Intelligence Unit Limited 2006 www.eiu.com Country Profile 2006
ethnic-Chinese DAP"which left the BA in September 2001, protesting at the intention of PAS to found an Islamic state"became the largest opposition party. The release of Mr Anwar in September 2004, after his conviction for sodomy was overturned, gave new hope to a demoralised opposition.
The entitlement of the bumiputera to special rights is laid down in the constitution. UMNO regularly warns other parties not to question Malay special privileges, the position of Islam or relations between the different races; those who do will be accused of sedition. The political system has remained stuck in this mode for nearly 50 years. But the gap between the races has widened noticeably over the past decade. Residents continue to define themselves in the first place by race, rather than by a Malaysian identity.
Key political figures
Abdullah Ahmad Badawi
Malaysia�s prime minister and president of the United Malays National Organisation (UMNO). Mr Abdullah, an Islamic studies graduate, has had limited success in fighting corruption. Lacking the charisma and strong power base of his predecessor, Mahathir Mohamad, disappointment is growing over his ineffectiveness and failure to fulfil promises.
Najib Razak
Deputy prime minister and UMNO�s deputy president, defence minister and son of a former prime minister. As a rival to Mr Abdullah, he is expected to challenge the prime minister in the future.
Mahathir Mohamad
Prime minister and president of UMNO from July 1981 until November 2003. He is the principal architect of the economic advancement of the Malay community and the rapid industrial growth of Malaysia. Dr Mahathir dominated political life for two decades, and has become increasingly critical of his successor. In August 2006 he asked UMNO to replace Mr Abdullah.
Anwar Ibrahim
Former deputy prime minister, dismissed in 1998 and jailed for abuse of power and sodomy. Mr Anwar was released in September 2004 after his sodomy conviction was overturned by the High Court. He is trying to prove, in the courts, that he was the victim of a conspiracy by his rivals within UMNO. As an advocate of political reform and a possible bridge between UMNO and ultra-conservative Islam, he remains a powerful political influence and a possible future prime minister.
Khairy Jamaluddin
The son-in-law of the prime minister and deputy head of UMNO Youth, who is believed to control access to Mr Abdullah and the distribution of many government contracts. He became a focal point of Dr Mahathir!s criticism in 2005-06.
Political structure is fossilised
12 Malaysia
Country Profile 2006 www.eiu.com © The Economist Intelligence Unit Limited 2006
International relations and defence
Under Mr Abdullah, Malaysia�s diplomatic relations have begun to reflect economic interests more closely than under Dr Mahathir, who irritated some Western governments with his controversial opinions. Malaysia remains a champion of the interests of the developing world and a defender of the interests of the Islamic world. Membership of the Association of South-East Asian Nations (ASEAN) remains central to Malaysia�s foreign policy. Greater economic integration, through bilateral trade agreements, is also leading to closer relations with its largest trading partners.
Malaysia!s relations with Singapore, the US and Australia have warmed notably. Co-operation rather than constant bickering now characterises relations with Singapore, although several long-standing disagreements remain to be solved. Malaysia works closely with the US in the fight against international terrorism but remains critical of US intervention in Iraq. The strongest improvement is in relations with Australia (which Dr Mahathir refused to visit during his tenure as prime minister). In 2005 Malaysia entered into free-trade negotiations with Australia.
Relations with Indonesia, Malaysia!s largest provider of foreign labour, are generally good, despite Indonesia!s poor record of dealing with terrorist threats within its borders, illegal immigration and air pollution from forest fires. Islamic militancy among the 3m ethnic-Malays in southern Thailand, and the heavy-handed response of the Thai army, is souring relations between the two countries.
Given the proliferation of trade agreements concluded or being negotiated"either multilaterally in Asia or bilaterally, for instance the free-trade agreement with the US, Malaysia!s largest export market"economic diplomacy is playing a larger role. But growing competition for energy resources in Asia has increased the chances of territorial disputes. Malaysia has border disagreements with Indonesia, Singapore, the Philippines and China.
In 2002 Malaysia restarted the modernisation of the armed forces that was derailed by the Asian economic crisis. The intention is to develop an all-round modern conventional capability, with enhanced maritime security, from what was originally a counter-insurgency force. Malaysia, together with Singapore, the UK, Australia and New Zealand, is a member of the Five Power Defence Arrangement, which provides for co-operation and consultation in case of attack. Malaysia co-operates on border security with its neighbours. According to Mr Razak, Malaysia�s primary security threat is internal; counter-terrorism and urban warfare capabilities are being developed to deal with violent extremism. In 2004 Malaysia started a limited obligatory national service, although mainly as a nation-building exercise.
Defence spending is to remain high
Islamic militancy is souring relations with Thailand
Foreign relations have improved under Mr Abdullah
There is an increasing chance of territorial disputes
Malaysia 13
© The Economist Intelligence Unit Limited 2006 www.eiu.com Country Profile 2006
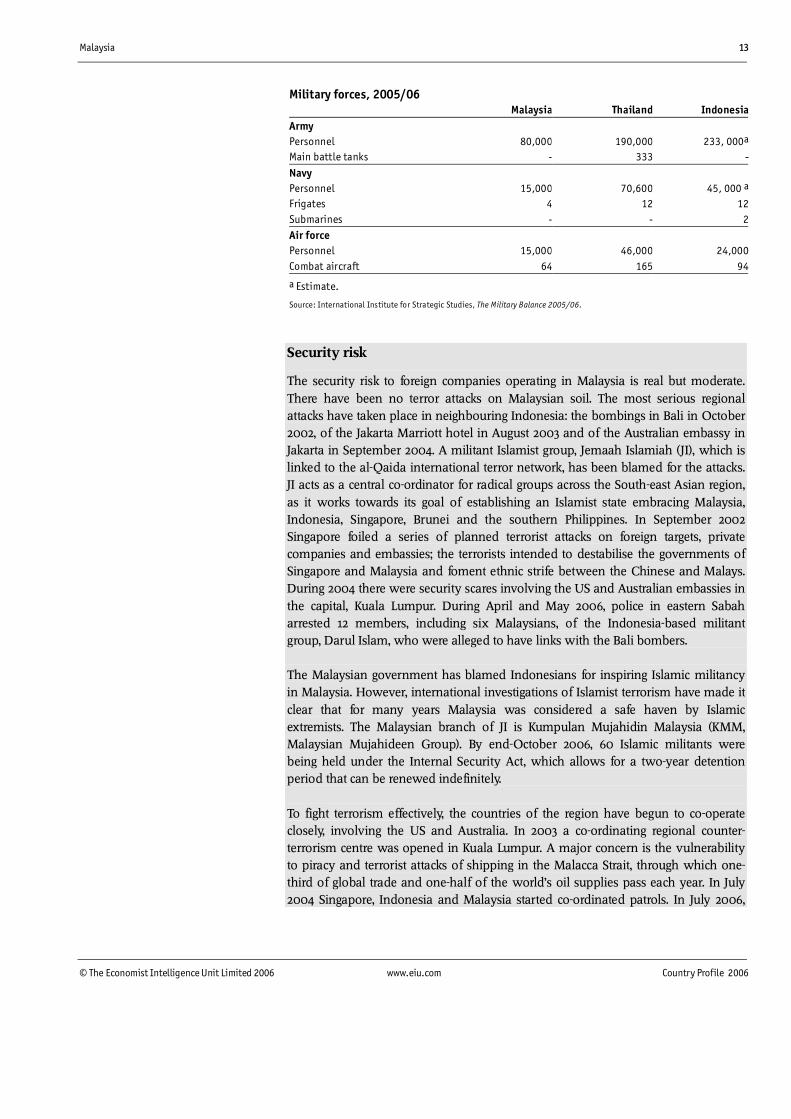
Military forces, 2005/06 Malaysia Thailand IndonesiaArmy Personnel 80,000 190,000 233, 000a
Main battle tanks - 333 -
Navy Personnel 15,000 70,600 45, 000 a
Frigates 4 12 12Submarines - - 2Air force Personnel 15,000 46,000 24,000Combat aircraft 64 165 94
a Estimate.
Source: International Institute for Strategic Studies, The Military Balance 2005/06.
Security risk
The security risk to foreign companies operating in Malaysia is real but moderate. There have been no terror attacks on Malaysian soil. The most serious regional attacks have taken place in neighbouring Indonesia: the bombings in Bali in October 2002, of the Jakarta Marriott hotel in August 2003 and of the Australian embassy in Jakarta in September 2004. A militant Islamist group, Jemaah Islamiah (JI), which is linked to the al-Qaida international terror network, has been blamed for the attacks. JI acts as a central co-ordinator for radical groups across the South-east Asian region, as it works towards its goal of establishing an Islamist state embracing Malaysia, Indonesia, Singapore, Brunei and the southern Philippines. In September 2002 Singapore foiled a series of planned terrorist attacks on foreign targets, private companies and embassies; the terrorists intended to destabilise the governments of Singapore and Malaysia and foment ethnic strife between the Chinese and Malays. During 2004 there were security scares involving the US and Australian embassies in the capital, Kuala Lumpur. During April and May 2006, police in eastern Sabah arrested 12 members, including six Malaysians, of the Indonesia-based militant group, Darul Islam, who were alleged to have links with the Bali bombers. The Malaysian government has blamed Indonesians for inspiring Islamic militancy in Malaysia. However, international investigations of Islamist terrorism have made it clear that for many years Malaysia was considered a safe haven by Islamic extremists. The Malaysian branch of JI is Kumpulan Mujahidin Malaysia (KMM, Malaysian Mujahideen Group). By end-October 2006, 60 Islamic militants were being held under the Internal Security Act, which allows for a two-year detention period that can be renewed indefinitely. To fight terrorism effectively, the countries of the region have begun to co-operate closely, involving the US and Australia. In 2003 a co-ordinating regional counter-terrorism centre was opened in Kuala Lumpur. A major concern is the vulnerability to piracy and terrorist attacks of shipping in the Malacca Strait, through which one-third of global trade and one-half of the world�s oil supplies pass each year. In July 2004 Singapore, Indonesia and Malaysia started co-ordinated patrols. In July 2006,
14 Malaysia
Country Profile 2006 www.eiu.com © The Economist Intelligence Unit Limited 2006
Malaysia signed a mutual legal assistance treaty with the United States, to ease criminal investigations, including into corruption and terrorism.
Social unrest
The major long-term risk to business comes from a return of economic and political conditions that could lead to an outbreak of racial violence. Tensions persist below the surface between the majority Malays on one hand and the minority ethnic Chinese and Indian populations on the other. In the most serious post-war racial conflict, in 1969, divisions within the Malay majority led to the scapegoating of the ethnic Chinese, hundreds of whom were killed in riots. Any attempt to reduce the privileges of the bumiputera (ethnic Malays and other indigenous peoples) could stoke Malay resentment. An even more sensitive issue is religion; a growing feeling on the part of Muslims that the position of Islam is being undermined may cause unrest. Nonetheless, the short-term risk of large-scale racial violence appears low. Large-scale demonstrations against the government and the ruling United Malays National Organisation (UMNO) were last held in 1998, when the deposed deputy prime minister, Anwar Ibrahim, led reformasi (reform) demonstrations. Although Mr Anwar was released from prison in September 2004, a revival of large-scale public protests looks unlikely under the reform-minded Mr Abdullah, even though most traditional means of protest remain blocked. There is widespread awareness within Malaysia that it is heavily dependent on foreign direct investment, and the opposition is unlikely to target foreign businesses specifically.
Armed conflict
The risk of armed conflict affecting business is low. Sporadic Islamist violence has occurred during the past few years. In 2001 KMM members were arrested and accused of involvement in bank robberies, the murder of a state assembly representative, and the bombing of a church and a temple. There are no �no-go areas� in Malaysia, and the government remains very much in control of the country. It is unlikely that Islamist extremists could develop the ability to stage an armed conflict. Islamic militancy in southern Thailand, where the population is mainly of Malay origin, poses no direct threat to Malaysian security but strains relations with Thailand.
Organised crime
Malaysia is, in general, a fairly safe country. Violent crime, kidnapping and extortion are rare, although they have attracted more publicity in recent years. Organised crime is seldom a threat to foreign business. Foreigners are, however, often the target of pickpockets, burglars, car break-ins and purse-snatching. Credit-card fraud is a growing problem. Chinese criminal gangs, or triads, do operate in Malaysia but their activities do not usually attract much publicity. Illegal activities by organised Malaysian groups that are most frequently mentioned by law-enforcement agencies are piracy"the illegal copying and distribution of CDs and DVDs"as well as credit-card counterfeiting and drug trafficking.
Malaysia 15
© The Economist Intelligence Unit Limited 2006 www.eiu.com Country Profile 2006
Resources and infrastructure
Population
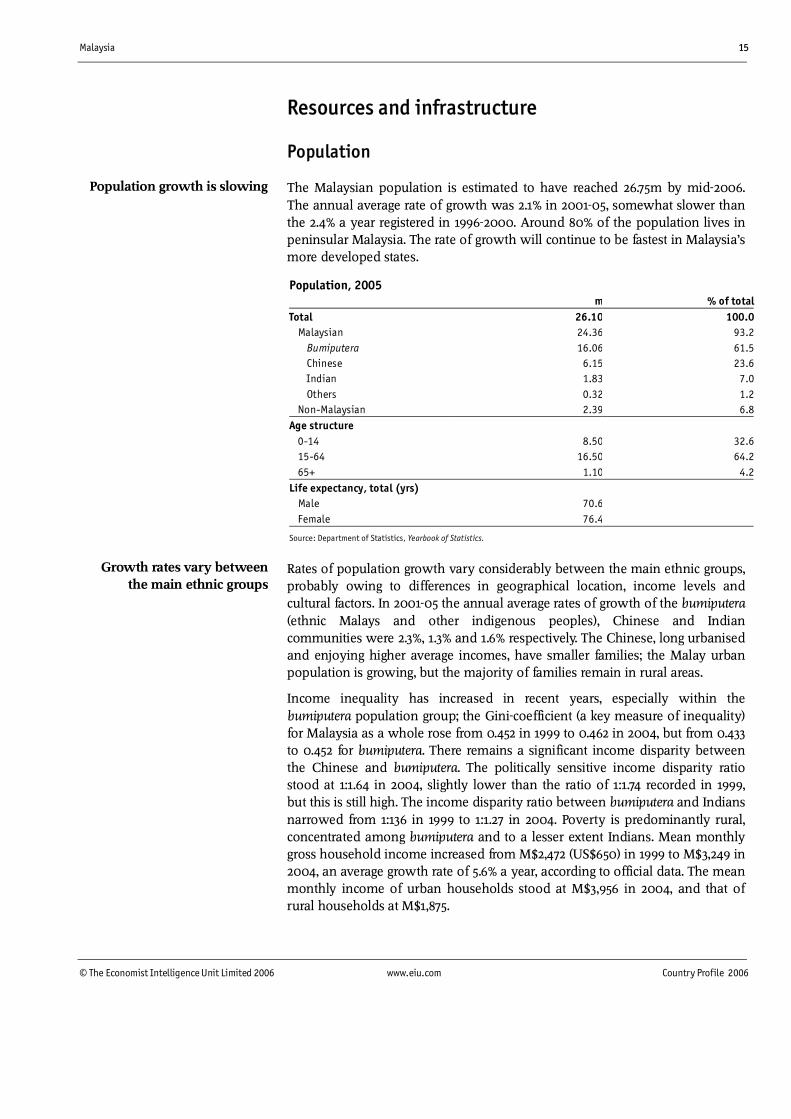
The Malaysian population is estimated to have reached 26.75m by mid-2006. The annual average rate of growth was 2.1% in 2001-05, somewhat slower than the 2.4% a year registered in 1996-2000. Around 80% of the population lives in peninsular Malaysia. The rate of growth will continue to be fastest in Malaysia�s more developed states.
Population, 2005 m % of totalTotal 26.10 100.0 Malaysian 24.36 93.2 Bumiputera 16.06 61.5 Chinese 6.15 23.6 Indian 1.83 7.0 Others 0.32 1.2 Non-Malaysian 2.39 6.8Age structure 0-14 8.50 32.6 15-64 16.50 64.2 65+ 1.10 4.2Life expectancy, total (yrs) Male 70.6 Female 76.4
Source: Department of Statistics, Yearbook of Statistics.
Rates of population growth vary considerably between the main ethnic groups, probably owing to differences in geographical location, income levels and cultural factors. In 2001-05 the annual average rates of growth of the bumiputera (ethnic Malays and other indigenous peoples), Chinese and Indian communities were 2.3%, 1.3% and 1.6% respectively. The Chinese, long urbanised and enjoying higher average incomes, have smaller families; the Malay urban population is growing, but the majority of families remain in rural areas.
Income inequality has increased in recent years, especially within the bumiputera population group; the Gini-coefficient (a key measure of inequality) for Malaysia as a whole rose from 0.452 in 1999 to 0.462 in 2004, but from 0.433 to 0.452 for bumiputera. There remains a significant income disparity between the Chinese and bumiputera. The politically sensitive income disparity ratio stood at 1:1.64 in 2004, slightly lower than the ratio of 1:1.74 recorded in 1999, but this is still high. The income disparity ratio between bumiputera and Indians narrowed from 1:136 in 1999 to 1:1.27 in 2004. Poverty is predominantly rural, concentrated among bumiputera and to a lesser extent Indians. Mean monthly gross household income increased from M$2,472 (US$650) in 1999 to M$3,249 in 2004, an average growth rate of 5.6% a year, according to official data. The mean monthly income of urban households stood at M$3,956 in 2004, and that of rural households at M$1,875.
Growth rates vary between the main ethnic groups
Population growth is slowing
16 Malaysia
Country Profile 2006 www.eiu.com © The Economist Intelligence Unit Limited 2006
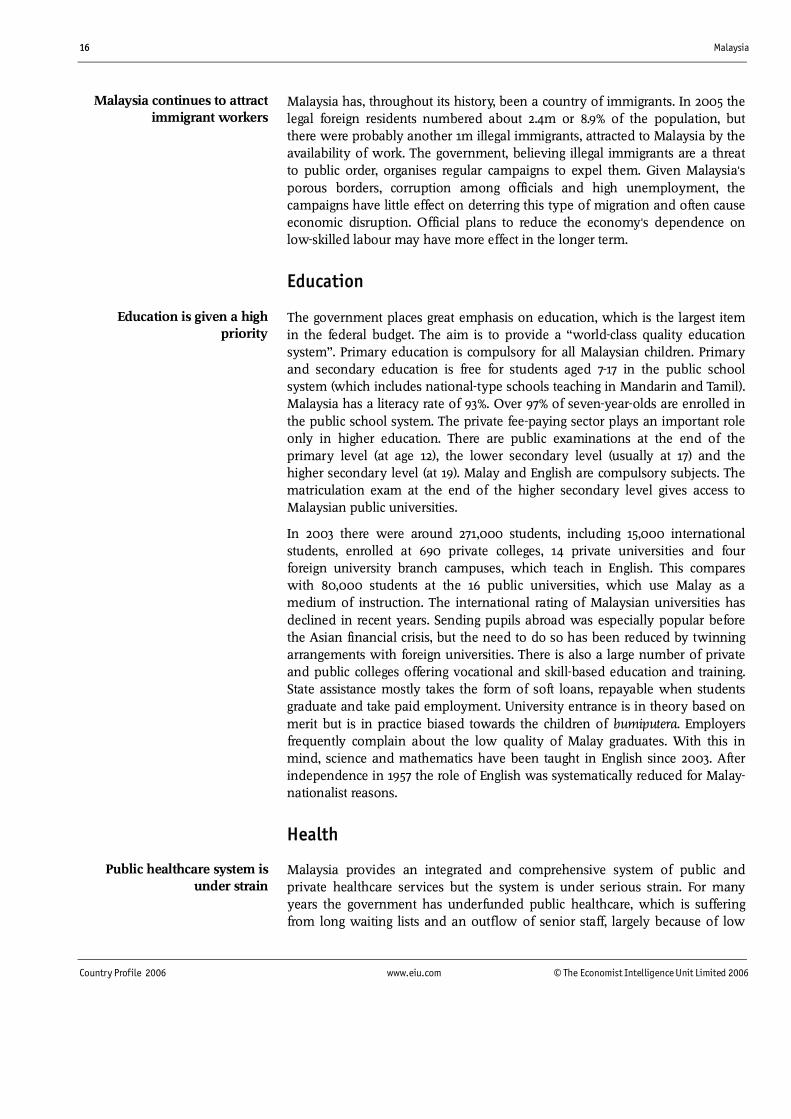
Malaysia has, throughout its history, been a country of immigrants. In 2005 the legal foreign residents numbered about 2.4m or 8.9% of the population, but there were probably another 1m illegal immigrants, attracted to Malaysia by the availability of work. The government, believing illegal immigrants are a threat to public order, organises regular campaigns to expel them. Given Malaysia!s porous borders, corruption among officials and high unemployment, the campaigns have little effect on deterring this type of migration and often cause economic disruption. Official plans to reduce the economy!s dependence on low-skilled labour may have more effect in the longer term.
Education
The government places great emphasis on education, which is the largest item in the federal budget. The aim is to provide a �world-class quality education system�. Primary education is compulsory for all Malaysian children. Primary and secondary education is free for students aged 7-17 in the public school system (which includes national-type schools teaching in Mandarin and Tamil). Malaysia has a literacy rate of 93%. Over 97% of seven-year-olds are enrolled in the public school system. The private fee-paying sector plays an important role only in higher education. There are public examinations at the end of the primary level (at age 12), the lower secondary level (usually at 17) and the higher secondary level (at 19). Malay and English are compulsory subjects. The matriculation exam at the end of the higher secondary level gives access to Malaysian public universities.
In 2003 there were around 271,000 students, including 15,000 international students, enrolled at 690 private colleges, 14 private universities and four foreign university branch campuses, which teach in English. This compares with 80,000 students at the 16 public universities, which use Malay as a medium of instruction. The international rating of Malaysian universities has declined in recent years. Sending pupils abroad was especially popular before the Asian financial crisis, but the need to do so has been reduced by twinning arrangements with foreign universities. There is also a large number of private and public colleges offering vocational and skill-based education and training. State assistance mostly takes the form of soft loans, repayable when students graduate and take paid employment. University entrance is in theory based on merit but is in practice biased towards the children of bumiputera. Employers frequently complain about the low quality of Malay graduates. With this in mind, science and mathematics have been taught in English since 2003. After independence in 1957 the role of English was systematically reduced for Malay-nationalist reasons.
Health
Malaysia provides an integrated and comprehensive system of public and private healthcare services but the system is under serious strain. For many years the government has underfunded public healthcare, which is suffering from long waiting lists and an outflow of senior staff, largely because of low
Malaysia continues to attract immigrant workers
Public healthcare system is under strain
Education is given a high priority
Malaysia 17
© The Economist Intelligence Unit Limited 2006 www.eiu.com Country Profile 2006
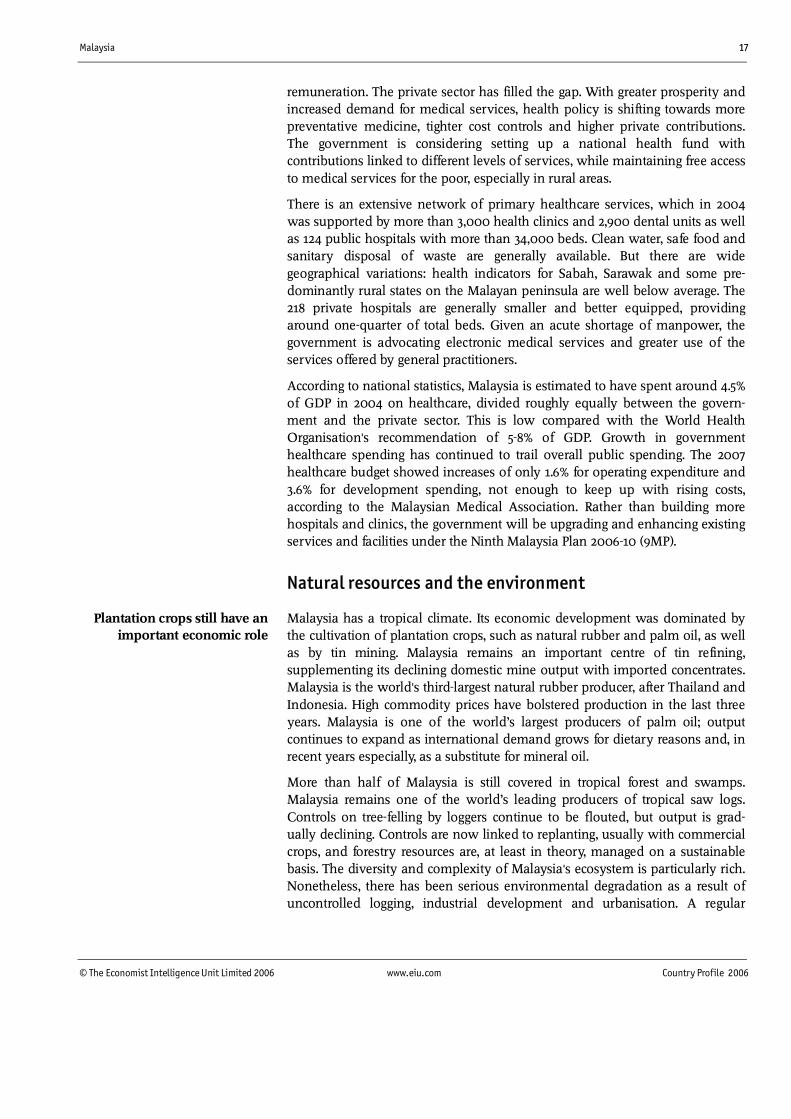
remuneration. The private sector has filled the gap. With greater prosperity and increased demand for medical services, health policy is shifting towards more preventative medicine, tighter cost controls and higher private contributions. The government is considering setting up a national health fund with contributions linked to different levels of services, while maintaining free access to medical services for the poor, especially in rural areas.
There is an extensive network of primary healthcare services, which in 2004 was supported by more than 3,000 health clinics and 2,900 dental units as well as 124 public hospitals with more than 34,000 beds. Clean water, safe food and sanitary disposal of waste are generally available. But there are wide geographical variations: health indicators for Sabah, Sarawak and some pre-dominantly rural states on the Malayan peninsula are well below average. The 218 private hospitals are generally smaller and better equipped, providing around one-quarter of total beds. Given an acute shortage of manpower, the government is advocating electronic medical services and greater use of the services offered by general practitioners.
According to national statistics, Malaysia is estimated to have spent around 4.5% of GDP in 2004 on healthcare, divided roughly equally between the govern-ment and the private sector. This is low compared with the World Health Organisation!s recommendation of 5-8% of GDP. Growth in government healthcare spending has continued to trail overall public spending. The 2007 healthcare budget showed increases of only 1.6% for operating expenditure and 3.6% for development spending, not enough to keep up with rising costs, according to the Malaysian Medical Association. Rather than building more hospitals and clinics, the government will be upgrading and enhancing existing services and facilities under the Ninth Malaysia Plan 2006-10 (9MP).
Natural resources and the environment
Malaysia has a tropical climate. Its economic development was dominated by the cultivation of plantation crops, such as natural rubber and palm oil, as well as by tin mining. Malaysia remains an important centre of tin refining, supplementing its declining domestic mine output with imported concentrates. Malaysia is the world!s third-largest natural rubber producer, after Thailand and Indonesia. High commodity prices have bolstered production in the last three years. Malaysia is one of the world�s largest producers of palm oil; output continues to expand as international demand grows for dietary reasons and, in recent years especially, as a substitute for mineral oil.
More than half of Malaysia is still covered in tropical forest and swamps. Malaysia remains one of the world�s leading producers of tropical saw logs. Controls on tree-felling by loggers continue to be flouted, but output is grad-ually declining. Controls are now linked to replanting, usually with commercial crops, and forestry resources are, at least in theory, managed on a sustainable basis. The diversity and complexity of Malaysia!s ecosystem is particularly rich. Nonetheless, there has been serious environmental degradation as a result of uncontrolled logging, industrial development and urbanisation. A regular
Plantation crops still have an important economic role
18 Malaysia
Country Profile 2006 www.eiu.com © The Economist Intelligence Unit Limited 2006
annual occurrence and threat to public health is haze, which is caused by forest fires in Indonesia.
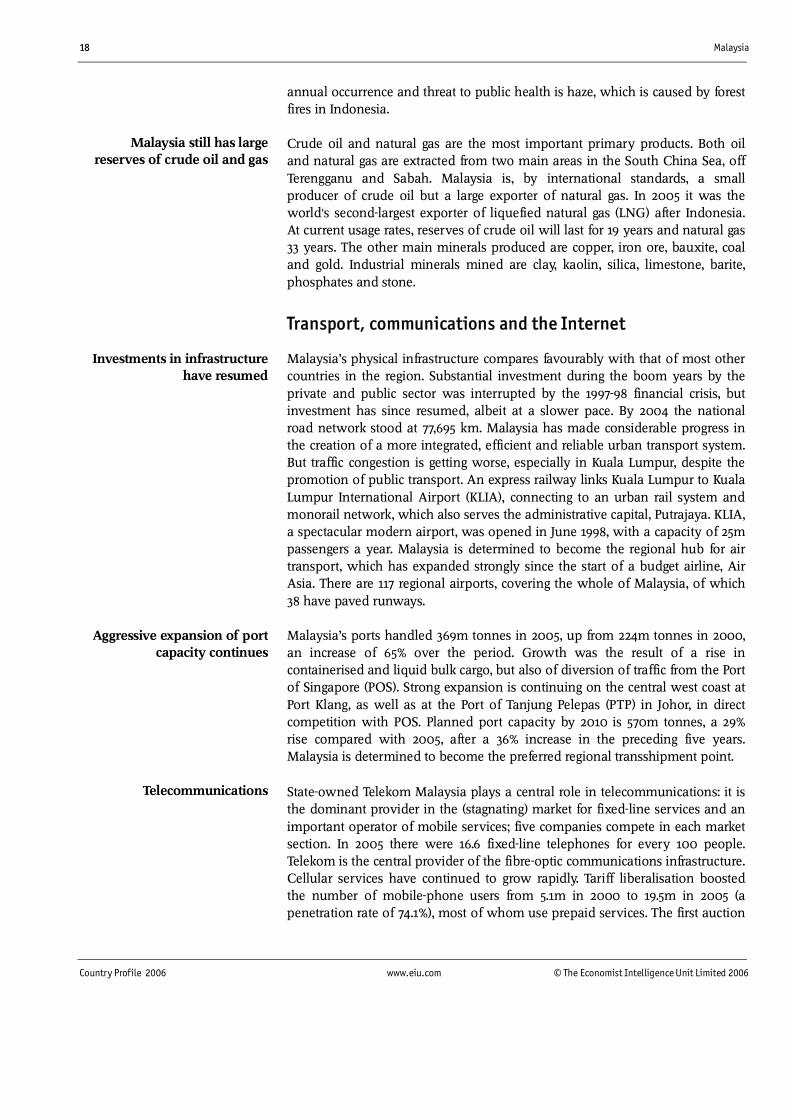
Crude oil and natural gas are the most important primary products. Both oil and natural gas are extracted from two main areas in the South China Sea, off Terengganu and Sabah. Malaysia is, by international standards, a small producer of crude oil but a large exporter of natural gas. In 2005 it was the world!s second-largest exporter of liquefied natural gas (LNG) after Indonesia. At current usage rates, reserves of crude oil will last for 19 years and natural gas 33 years. The other main minerals produced are copper, iron ore, bauxite, coal and gold. Industrial minerals mined are clay, kaolin, silica, limestone, barite, phosphates and stone.
Transport, communications and the Internet
Malaysia�s physical infrastructure compares favourably with that of most other countries in the region. Substantial investment during the boom years by the private and public sector was interrupted by the 1997-98 financial crisis, but investment has since resumed, albeit at a slower pace. By 2004 the national road network stood at 77,695 km. Malaysia has made considerable progress in the creation of a more integrated, efficient and reliable urban transport system. But traffic congestion is getting worse, especially in Kuala Lumpur, despite the promotion of public transport. An express railway links Kuala Lumpur to Kuala Lumpur International Airport (KLIA), connecting to an urban rail system and monorail network, which also serves the administrative capital, Putrajaya. KLIA, a spectacular modern airport, was opened in June 1998, with a capacity of 25m passengers a year. Malaysia is determined to become the regional hub for air transport, which has expanded strongly since the start of a budget airline, Air Asia. There are 117 regional airports, covering the whole of Malaysia, of which 38 have paved runways.
Malaysia�s ports handled 369m tonnes in 2005, up from 224m tonnes in 2000, an increase of 65% over the period. Growth was the result of a rise in containerised and liquid bulk cargo, but also of diversion of traffic from the Port of Singapore (POS). Strong expansion is continuing on the central west coast at Port Klang, as well as at the Port of Tanjung Pelepas (PTP) in Johor, in direct competition with POS. Planned port capacity by 2010 is 570m tonnes, a 29% rise compared with 2005, after a 36% increase in the preceding five years. Malaysia is determined to become the preferred regional transshipment point.
State-owned Telekom Malaysia plays a central role in telecommunications: it is the dominant provider in the (stagnating) market for fixed-line services and an important operator of mobile services; five companies compete in each market section. In 2005 there were 16.6 fixed-line telephones for every 100 people. Telekom is the central provider of the fibre-optic communications infrastructure. Cellular services have continued to grow rapidly. Tariff liberalisation boosted the number of mobile-phone users from 5.1m in 2000 to 19.5m in 2005 (a penetration rate of 74.1%), most of whom use prepaid services. The first auction
Malaysia still has large reserves of crude oil and gas
Investments in infrastructure have resumed
Aggressive expansion of port capacity continues
Telecommunications
Malaysia 19
© The Economist Intelligence Unit Limited 2006 www.eiu.com Country Profile 2006
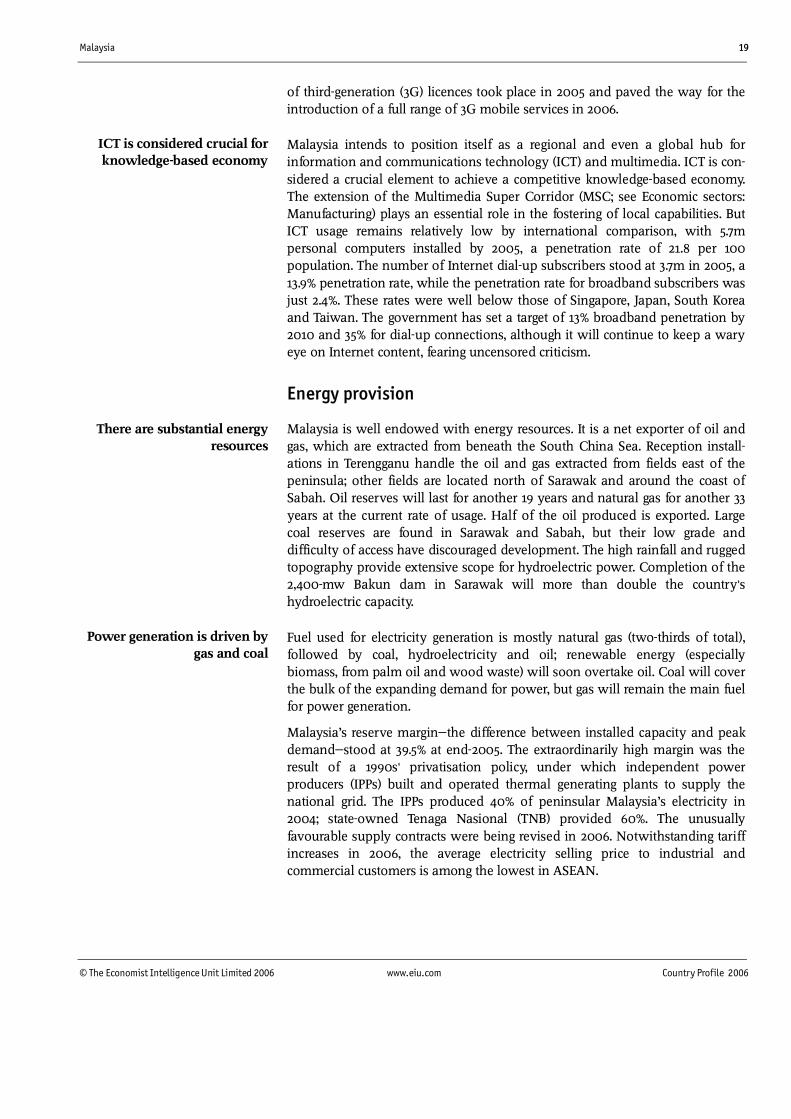
of third-generation (3G) licences took place in 2005 and paved the way for the introduction of a full range of 3G mobile services in 2006.
Malaysia intends to position itself as a regional and even a global hub for information and communications technology (ICT) and multimedia. ICT is con-sidered a crucial element to achieve a competitive knowledge-based economy. The extension of the Multimedia Super Corridor (MSC; see Economic sectors: Manufacturing) plays an essential role in the fostering of local capabilities. But ICT usage remains relatively low by international comparison, with 5.7m personal computers installed by 2005, a penetration rate of 21.8 per 100 population. The number of Internet dial-up subscribers stood at 3.7m in 2005, a 13.9% penetration rate, while the penetration rate for broadband subscribers was just 2.4%. These rates were well below those of Singapore, Japan, South Korea and Taiwan. The government has set a target of 13% broadband penetration by 2010 and 35% for dial-up connections, although it will continue to keep a wary eye on Internet content, fearing uncensored criticism.
Energy provision
Malaysia is well endowed with energy resources. It is a net exporter of oil and gas, which are extracted from beneath the South China Sea. Reception install-ations in Terengganu handle the oil and gas extracted from fields east of the peninsula; other fields are located north of Sarawak and around the coast of Sabah. Oil reserves will last for another 19 years and natural gas for another 33 years at the current rate of usage. Half of the oil produced is exported. Large coal reserves are found in Sarawak and Sabah, but their low grade and difficulty of access have discouraged development. The high rainfall and rugged topography provide extensive scope for hydroelectric power. Completion of the 2,400-mw Bakun dam in Sarawak will more than double the country!s hydroelectric capacity.
Fuel used for electricity generation is mostly natural gas (two-thirds of total), followed by coal, hydroelectricity and oil; renewable energy (especially biomass, from palm oil and wood waste) will soon overtake oil. Coal will cover the bulk of the expanding demand for power, but gas will remain the main fuel for power generation.
Malaysia�s reserve margin"the difference between installed capacity and peak demand"stood at 39.5% at end-2005. The extraordinarily high margin was the result of a 1990s! privatisation policy, under which independent power producers (IPPs) built and operated thermal generating plants to supply the national grid. The IPPs produced 40% of peninsular Malaysia�s electricity in 2004; state-owned Tenaga Nasional (TNB) provided 60%. The unusually favourable supply contracts were being revised in 2006. Notwithstanding tariff increases in 2006, the average electricity selling price to industrial and commercial customers is among the lowest in ASEAN.
ICT is considered crucial for knowledge-based economy
There are substantial energy resources
Power generation is driven by gas and coal
20 Malaysia
Country Profile 2006 www.eiu.com © The Economist Intelligence Unit Limited 2006
The economy
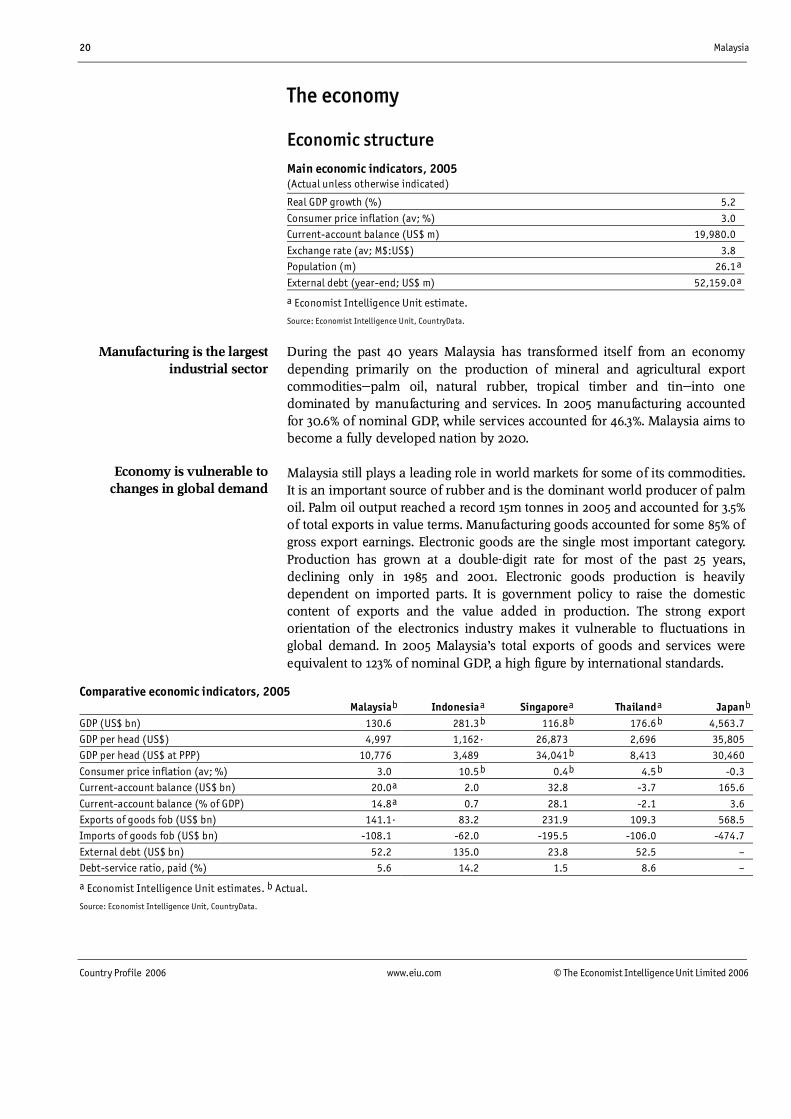
Economic structure Main economic indicators, 2005 (Actual unless otherwise indicated)
Real GDP growth (%) 5.2
Consumer price inflation (av; %) 3.0
Current-account balance (US$ m) 19,980.0
Exchange rate (av; M$:US$) 3.8
Population (m) 26.1a
External debt (year-end; US$ m) 52,159.0 a
a Economist Intelligence Unit estimate.
Source: Economist Intelligence Unit, CountryData.
During the past 40 years Malaysia has transformed itself from an economy depending primarily on the production of mineral and agricultural export commodities"palm oil, natural rubber, tropical timber and tin"into one dominated by manufacturing and services. In 2005 manufacturing accounted for 30.6% of nominal GDP, while services accounted for 46.3%. Malaysia aims to become a fully developed nation by 2020.
Malaysia still plays a leading role in world markets for some of its commodities. It is an important source of rubber and is the dominant world producer of palm oil. Palm oil output reached a record 15m tonnes in 2005 and accounted for 3.5% of total exports in value terms. Manufacturing goods accounted for some 85% of gross export earnings. Electronic goods are the single most important category. Production has grown at a double-digit rate for most of the past 25 years, declining only in 1985 and 2001. Electronic goods production is heavily dependent on imported parts. It is government policy to raise the domestic content of exports and the value added in production. The strong export orientation of the electronics industry makes it vulnerable to fluctuations in global demand. In 2005 Malaysia�s total exports of goods and services were equivalent to 123% of nominal GDP, a high figure by international standards.
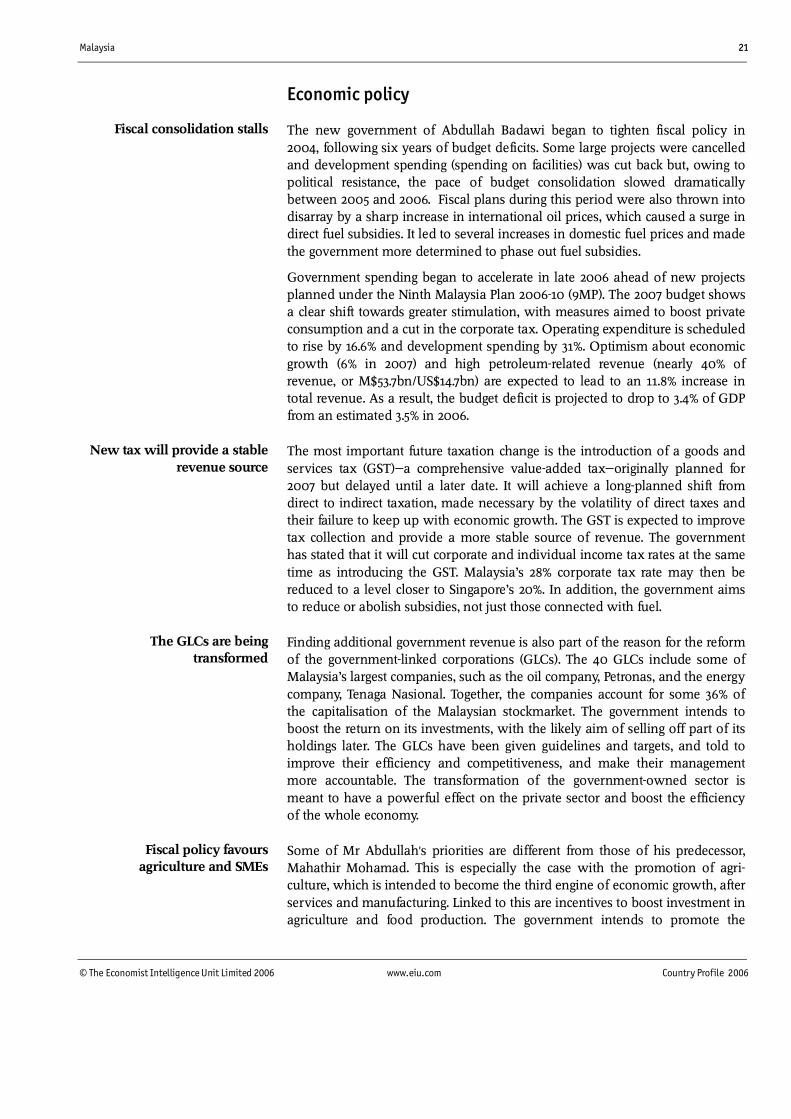
Comparative economic indicators, 2005 Malaysiab Indonesiaa Singapore a Thailanda Japanb
GDP (US$ bn) 130.6 281.3b 116.8 b 176.6b 4,563.7
GDP per head (US$) 4,997 1,162. 26,873 2,696 35,805
GDP per head (US$ at PPP) 10,776 3,489 34,041 b 8,413 30,460
Consumer price inflation (av; %) 3.0 10.5b 0.4 b 4.5b -0.3
Current-account balance (US$ bn) 20.0a 2.0 32.8 -3.7 165.6
Current-account balance (% of GDP) 14.8a 0.7 28.1 -2.1 3.6
Exports of goods fob (US$ bn) 141.1. 83.2 231.9 109.3 568.5
Imports of goods fob (US$ bn) -108.1 -62.0 -195.5 -106.0 -474.7
External debt (US$ bn) 52.2 135.0 23.8 52.5 �
Debt-service ratio, paid (%) 5.6 14.2 1.5 8.6 �
a Economist Intelligence Unit estimates. b Actual.
Source: Economist Intelligence Unit, CountryData.
Manufacturing is the largest industrial sector
Economy is vulnerable to changes in global demand
Malaysia 21
© The Economist Intelligence Unit Limited 2006 www.eiu.com Country Profile 2006
Economic policy
The new government of Abdullah Badawi began to tighten fiscal policy in 2004, following six years of budget deficits. Some large projects were cancelled and development spending (spending on facilities) was cut back but, owing to political resistance, the pace of budget consolidation slowed dramatically between 2005 and 2006. Fiscal plans during this period were also thrown into disarray by a sharp increase in international oil prices, which caused a surge in direct fuel subsidies. It led to several increases in domestic fuel prices and made the government more determined to phase out fuel subsidies.
Government spending began to accelerate in late 2006 ahead of new projects planned under the Ninth Malaysia Plan 2006-10 (9MP). The 2007 budget shows a clear shift towards greater stimulation, with measures aimed to boost private consumption and a cut in the corporate tax. Operating expenditure is scheduled to rise by 16.6% and development spending by 31%. Optimism about economic growth (6% in 2007) and high petroleum-related revenue (nearly 40% of revenue, or M$53.7bn/US$14.7bn) are expected to lead to an 11.8% increase in total revenue. As a result, the budget deficit is projected to drop to 3.4% of GDP from an estimated 3.5% in 2006.
The most important future taxation change is the introduction of a goods and services tax (GST)"a comprehensive value-added tax"originally planned for 2007 but delayed until a later date. It will achieve a long-planned shift from direct to indirect taxation, made necessary by the volatility of direct taxes and their failure to keep up with economic growth. The GST is expected to improve tax collection and provide a more stable source of revenue. The government has stated that it will cut corporate and individual income tax rates at the same time as introducing the GST. Malaysia�s 28% corporate tax rate may then be reduced to a level closer to Singapore�s 20%. In addition, the government aims to reduce or abolish subsidies, not just those connected with fuel.
Finding additional government revenue is also part of the reason for the reform of the government-linked corporations (GLCs). The 40 GLCs include some of Malaysia�s largest companies, such as the oil company, Petronas, and the energy company, Tenaga Nasional. Together, the companies account for some 36% of the capitalisation of the Malaysian stockmarket. The government intends to boost the return on its investments, with the likely aim of selling off part of its holdings later. The GLCs have been given guidelines and targets, and told to improve their efficiency and competitiveness, and make their management more accountable. The transformation of the government-owned sector is meant to have a powerful effect on the private sector and boost the efficiency of the whole economy.
Some of Mr Abdullah!s priorities are different from those of his predecessor, Mahathir Mohamad. This is especially the case with the promotion of agri-culture, which is intended to become the third engine of economic growth, after services and manufacturing. Linked to this are incentives to boost investment in agriculture and food production. The government intends to promote the
New tax will provide a stable revenue source
The GLCs are being transformed
Fiscal policy favours agriculture and SMEs
Fiscal consolidation stalls
22 Malaysia
Country Profile 2006 www.eiu.com © The Economist Intelligence Unit Limited 2006
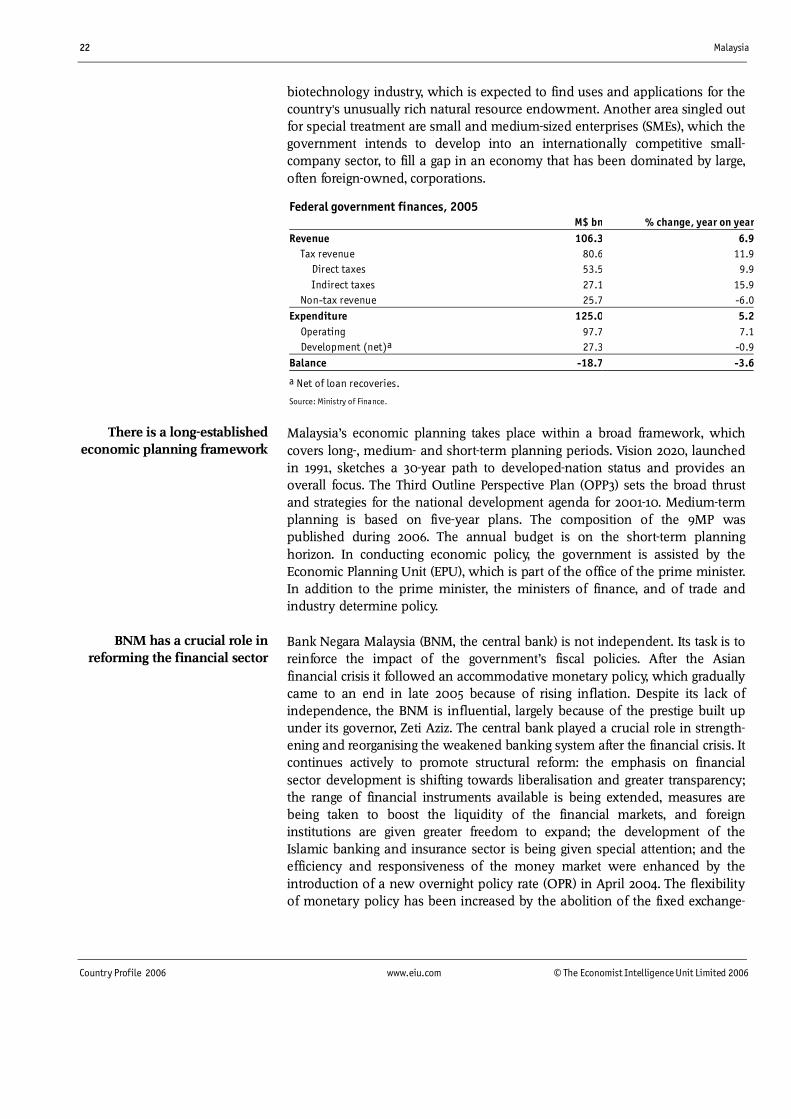
biotechnology industry, which is expected to find uses and applications for the country!s unusually rich natural resource endowment. Another area singled out for special treatment are small and medium-sized enterprises (SMEs), which the government intends to develop into an internationally competitive small-company sector, to fill a gap in an economy that has been dominated by large, often foreign-owned, corporations.
Federal government finances, 2005 M$ bn % change, year on yearRevenue 106.3 6.9 Tax revenue 80.6 11.9 Direct taxes 53.5 9.9 Indirect taxes 27.1 15.9 Non-tax revenue 25.7 -6.0Expenditure 125.0 5.2 Operating 97.7 7.1 Development (net)a 27.3 -0.9Balance -18.7 -3.6
a Net of loan recoveries.
Source: Ministry of Finance.
Malaysia�s economic planning takes place within a broad framework, which covers long-, medium- and short-term planning periods. Vision 2020, launched in 1991, sketches a 30-year path to developed-nation status and provides an overall focus. The Third Outline Perspective Plan (OPP3) sets the broad thrust and strategies for the national development agenda for 2001-10. Medium-term planning is based on five-year plans. The composition of the 9MP was published during 2006. The annual budget is on the short-term planning horizon. In conducting economic policy, the government is assisted by the Economic Planning Unit (EPU), which is part of the office of the prime minister. In addition to the prime minister, the ministers of finance, and of trade and industry determine policy.
Bank Negara Malaysia (BNM, the central bank) is not independent. Its task is to reinforce the impact of the government�s fiscal policies. After the Asian financial crisis it followed an accommodative monetary policy, which gradually came to an end in late 2005 because of rising inflation. Despite its lack of independence, the BNM is influential, largely because of the prestige built up under its governor, Zeti Aziz. The central bank played a crucial role in strength-ening and reorganising the weakened banking system after the financial crisis. It continues actively to promote structural reform: the emphasis on financial sector development is shifting towards liberalisation and greater transparency; the range of financial instruments available is being extended, measures are being taken to boost the liquidity of the financial markets, and foreign institutions are given greater freedom to expand; the development of the Islamic banking and insurance sector is being given special attention; and the efficiency and responsiveness of the money market were enhanced by the introduction of a new overnight policy rate (OPR) in April 2004. The flexibility of monetary policy has been increased by the abolition of the fixed exchange-
BNM has a crucial role in reforming the financial sector
There is a long-established economic planning framework
Malaysia 23
© The Economist Intelligence Unit Limited 2006 www.eiu.com Country Profile 2006
rate system in favour of a managed float against a trade-weighted index of currencies of Malaysia!s major trading partners in July 2005.
Economic performance
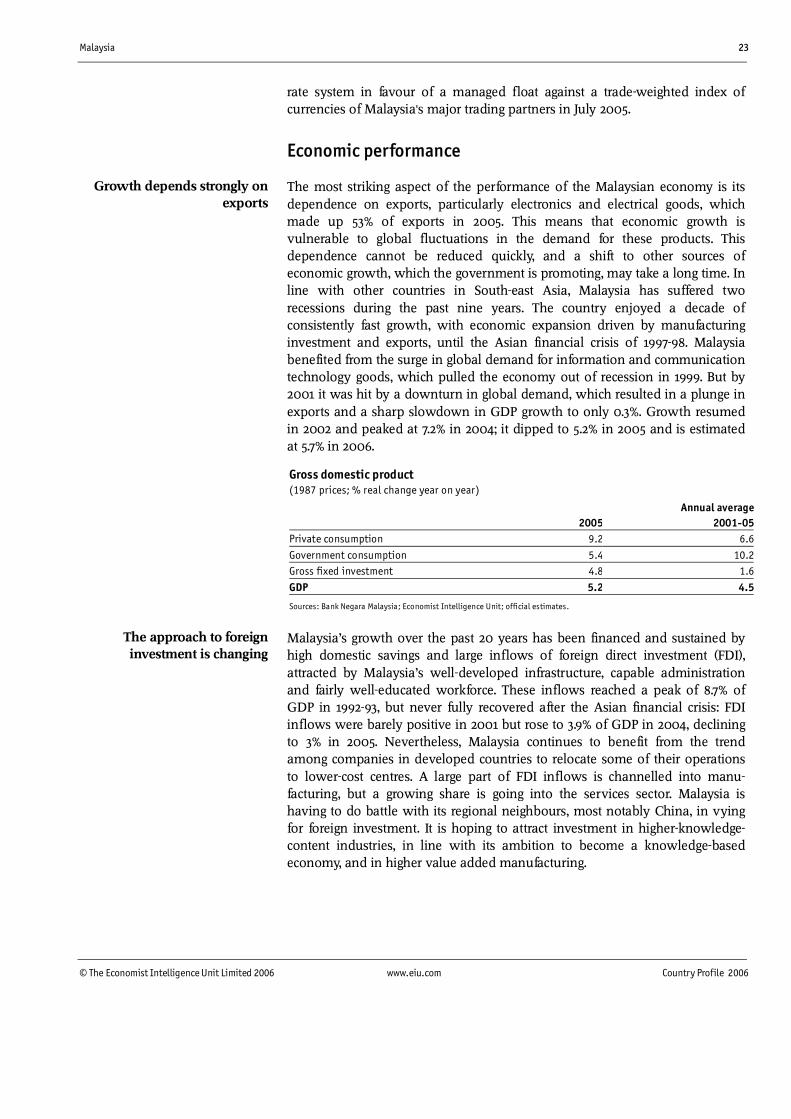
The most striking aspect of the performance of the Malaysian economy is its dependence on exports, particularly electronics and electrical goods, which made up 53% of exports in 2005. This means that economic growth is vulnerable to global fluctuations in the demand for these products. This dependence cannot be reduced quickly, and a shift to other sources of economic growth, which the government is promoting, may take a long time. In line with other countries in South-east Asia, Malaysia has suffered two recessions during the past nine years. The country enjoyed a decade of consistently fast growth, with economic expansion driven by manufacturing investment and exports, until the Asian financial crisis of 1997-98. Malaysia benefited from the surge in global demand for information and communication technology goods, which pulled the economy out of recession in 1999. But by 2001 it was hit by a downturn in global demand, which resulted in a plunge in exports and a sharp slowdown in GDP growth to only 0.3%. Growth resumed in 2002 and peaked at 7.2% in 2004; it dipped to 5.2% in 2005 and is estimated at 5.7% in 2006.
Gross domestic product (1987 prices; % real change year on year)
Annual average 2005 2001-05Private consumption 9.2 6.6
Government consumption 5.4 10.2Gross fixed investment 4.8 1.6
GDP 5.2 4.5
Sources: Bank Negara Malaysia; Economist Intelligence Unit; official estimates.
Malaysia�s growth over the past 20 years has been financed and sustained by high domestic savings and large inflows of foreign direct investment (FDI), attracted by Malaysia�s well-developed infrastructure, capable administration and fairly well-educated workforce. These inflows reached a peak of 8.7% of GDP in 1992-93, but never fully recovered after the Asian financial crisis: FDI inflows were barely positive in 2001 but rose to 3.9% of GDP in 2004, declining to 3% in 2005. Nevertheless, Malaysia continues to benefit from the trend among companies in developed countries to relocate some of their operations to lower-cost centres. A large part of FDI inflows is channelled into manu-facturing, but a growing share is going into the services sector. Malaysia is having to do battle with its regional neighbours, most notably China, in vying for foreign investment. It is hoping to attract investment in higher-knowledge-content industries, in line with its ambition to become a knowledge-based economy, and in higher value added manufacturing.
The approach to foreign investment is changing
Growth depends strongly on exports
24 Malaysia
Country Profile 2006 www.eiu.com © The Economist Intelligence Unit Limited 2006
According to the central bank, Malaysia!s potential output growth, determined by the expansion and non-inflationary utilisation of physical capital and the labour force, as well as by total factor productivity growth (TFP), stood at 5.7% in 2005. In the years before the Asian financial crisis, the Malaysian economy was growing at a rate that exceeded its potential growth. After the crisis, a gap opened between actual and potential production (more commonly referred to as the output gap)"largely owing to plunging capital investment"which did not disappear until 2004, when private investment recovered modestly. The biggest difference in the composition of economic growth after the Asian crisis is the significantly larger contribution made in recent years by TFP, which incorporates technological progress and greater efficiency. Capital is being used more efficiently, in part owing to past infrastructure investments and structural reforms. Government policy is aiming to boost productivity growth, for instance, by increasing the efficiency of the GLCs. The evidence on labour productivity is mixed: there are regular complaints about skill shortages and the low quality of Malay graduates. But the authorities have high hopes that the implementation of the Knowledge-Based Economy Master Plan, which includes large investments in education and training, will help to close the output gap.
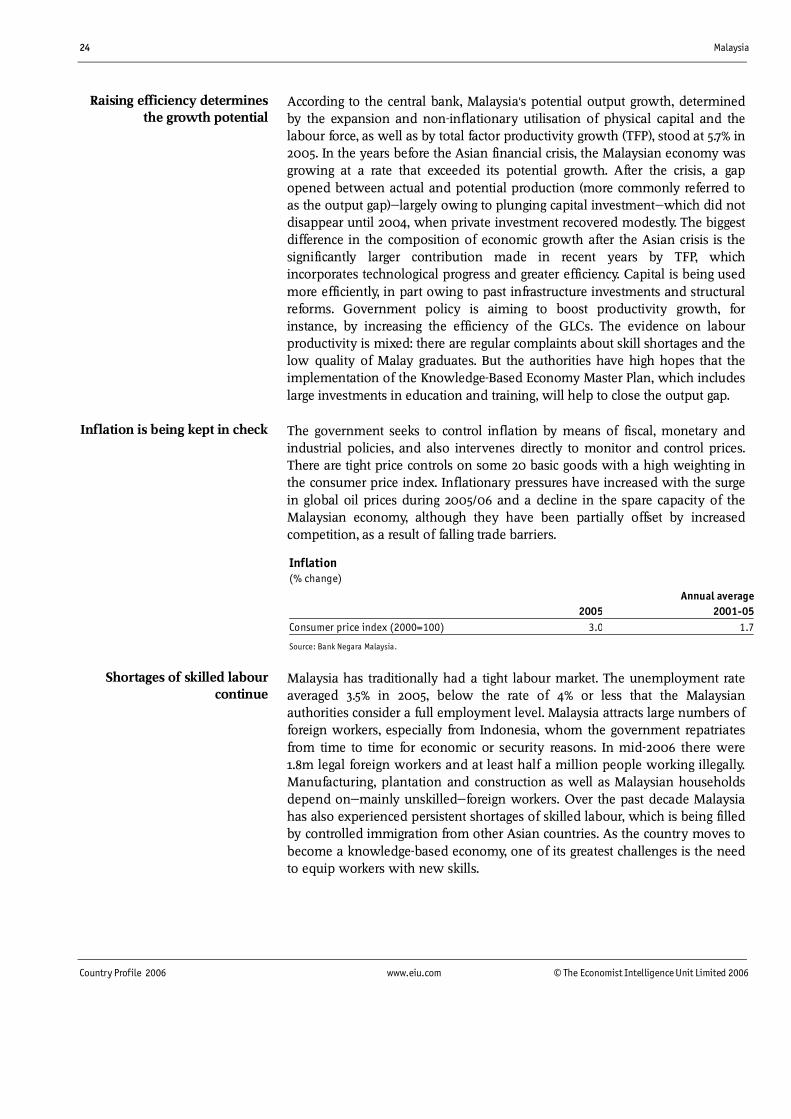
The government seeks to control inflation by means of fiscal, monetary and industrial policies, and also intervenes directly to monitor and control prices. There are tight price controls on some 20 basic goods with a high weighting in the consumer price index. Inflationary pressures have increased with the surge in global oil prices during 2005/06 and a decline in the spare capacity of the Malaysian economy, although they have been partially offset by increased competition, as a result of falling trade barriers.
Inflation (% change)
Annual average 2005 2001-05Consumer price index (2000=100) 3.0 1.7
Source: Bank Negara Malaysia.
Malaysia has traditionally had a tight labour market. The unemployment rate averaged 3.5% in 2005, below the rate of 4% or less that the Malaysian authorities consider a full employment level. Malaysia attracts large numbers of foreign workers, especially from Indonesia, whom the government repatriates from time to time for economic or security reasons. In mid-2006 there were 1.8m legal foreign workers and at least half a million people working illegally. Manufacturing, plantation and construction as well as Malaysian households depend on"mainly unskilled"foreign workers. Over the past decade Malaysia has also experienced persistent shortages of skilled labour, which is being filled by controlled immigration from other Asian countries. As the country moves to become a knowledge-based economy, one of its greatest challenges is the need to equip workers with new skills.
Inflation is being kept in check
Raising efficiency determines the growth potential
Shortages of skilled labour continue
Malaysia 25
© The Economist Intelligence Unit Limited 2006 www.eiu.com Country Profile 2006
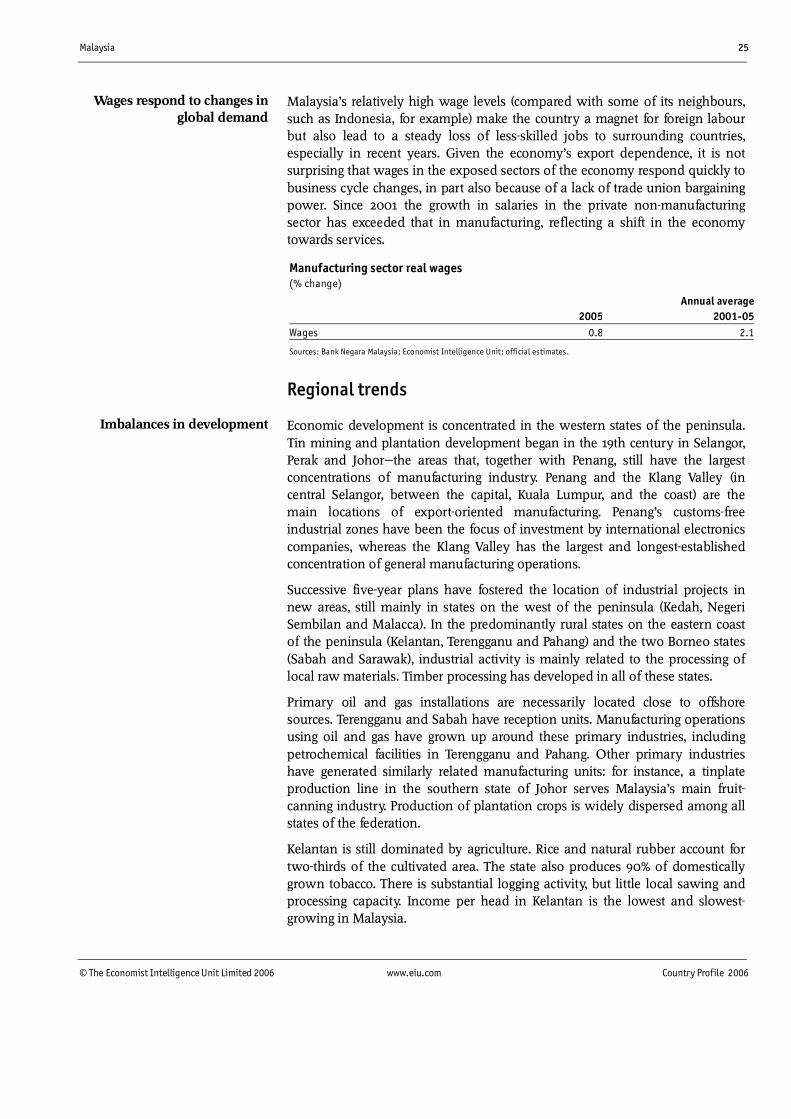
Malaysia�s relatively high wage levels (compared with some of its neighbours, such as Indonesia, for example) make the country a magnet for foreign labour but also lead to a steady loss of less-skilled jobs to surrounding countries, especially in recent years. Given the economy�s export dependence, it is not surprising that wages in the exposed sectors of the economy respond quickly to business cycle changes, in part also because of a lack of trade union bargaining power. Since 2001 the growth in salaries in the private non-manufacturing sector has exceeded that in manufacturing, reflecting a shift in the economy towards services.
Manufacturing sector real wages (% change)
Annual average 2005 2001-05Wages 0.8 2.1
Sources: Bank Negara Malaysia; Economist Intelligence Unit; official estimates.
Regional trends
Economic development is concentrated in the western states of the peninsula. Tin mining and plantation development began in the 19th century in Selangor, Perak and Johor"the areas that, together with Penang, still have the largest concentrations of manufacturing industry. Penang and the Klang Valley (in central Selangor, between the capital, Kuala Lumpur, and the coast) are the main locations of export-oriented manufacturing. Penang�s customs-free industrial zones have been the focus of investment by international electronics companies, whereas the Klang Valley has the largest and longest-established concentration of general manufacturing operations.
Successive five-year plans have fostered the location of industrial projects in new areas, still mainly in states on the west of the peninsula (Kedah, Negeri Sembilan and Malacca). In the predominantly rural states on the eastern coast of the peninsula (Kelantan, Terengganu and Pahang) and the two Borneo states (Sabah and Sarawak), industrial activity is mainly related to the processing of local raw materials. Timber processing has developed in all of these states.
Primary oil and gas installations are necessarily located close to offshore sources. Terengganu and Sabah have reception units. Manufacturing operations using oil and gas have grown up around these primary industries, including petrochemical facilities in Terengganu and Pahang. Other primary industries have generated similarly related manufacturing units: for instance, a tinplate production line in the southern state of Johor serves Malaysia�s main fruit-canning industry. Production of plantation crops is widely dispersed among all states of the federation.
Kelantan is still dominated by agriculture. Rice and natural rubber account for two-thirds of the cultivated area. The state also produces 90% of domestically grown tobacco. There is substantial logging activity, but little local sawing and processing capacity. Income per head in Kelantan is the lowest and slowest-growing in Malaysia.
Wages respond to changes in global demand
Imbalances in development
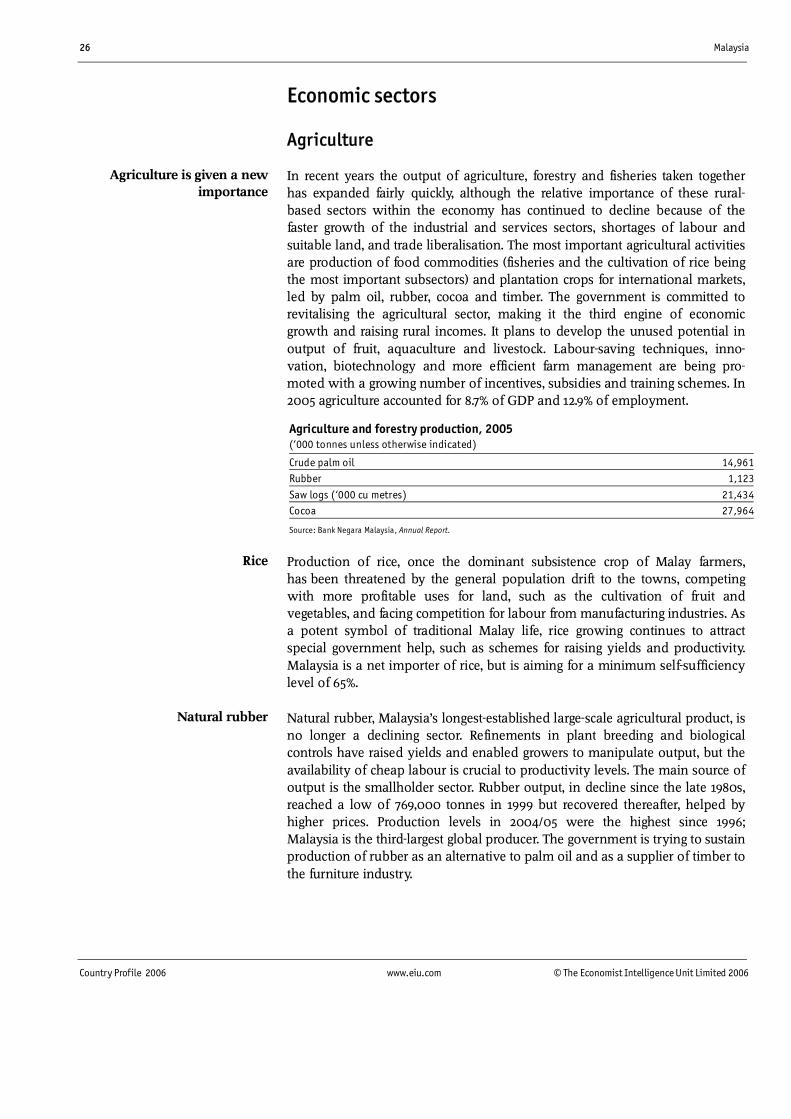
26 Malaysia
Country Profile 2006 www.eiu.com © The Economist Intelligence Unit Limited 2006
Economic sectors
Agriculture
In recent years the output of agriculture, forestry and fisheries taken together has expanded fairly quickly, although the relative importance of these rural-based sectors within the economy has continued to decline because of the faster growth of the industrial and services sectors, shortages of labour and suitable land, and trade liberalisation. The most important agricultural activities are production of food commodities (fisheries and the cultivation of rice being the most important subsectors) and plantation crops for international markets, led by palm oil, rubber, cocoa and timber. The government is committed to revitalising the agricultural sector, making it the third engine of economic growth and raising rural incomes. It plans to develop the unused potential in output of fruit, aquaculture and livestock. Labour-saving techniques, inno-vation, biotechnology and more efficient farm management are being pro-moted with a growing number of incentives, subsidies and training schemes. In 2005 agriculture accounted for 8.7% of GDP and 12.9% of employment.
Agriculture and forestry production, 2005 (�000 tonnes unless otherwise indicated)
Crude palm oil 14,961Rubber 1,123
Saw logs (�000 cu metres) 21,434Cocoa 27,964
Source: Bank Negara Malaysia, Annual Report.
Production of rice, once the dominant subsistence crop of Malay farmers, has been threatened by the general population drift to the towns, competing with more profitable uses for land, such as the cultivation of fruit and vegetables, and facing competition for labour from manufacturing industries. As a potent symbol of traditional Malay life, rice growing continues to attract special government help, such as schemes for raising yields and productivity. Malaysia is a net importer of rice, but is aiming for a minimum self-sufficiency level of 65%.
Natural rubber, Malaysia�s longest-established large-scale agricultural product, is no longer a declining sector. Refinements in plant breeding and biological controls have raised yields and enabled growers to manipulate output, but the availability of cheap labour is crucial to productivity levels. The main source of output is the smallholder sector. Rubber output, in decline since the late 1980s, reached a low of 769,000 tonnes in 1999 but recovered thereafter, helped by higher prices. Production levels in 2004/05 were the highest since 1996; Malaysia is the third-largest global producer. The government is trying to sustain production of rubber as an alternative to palm oil and as a supplier of timber to the furniture industry.
Natural rubber
Rice
Agriculture is given a new importance
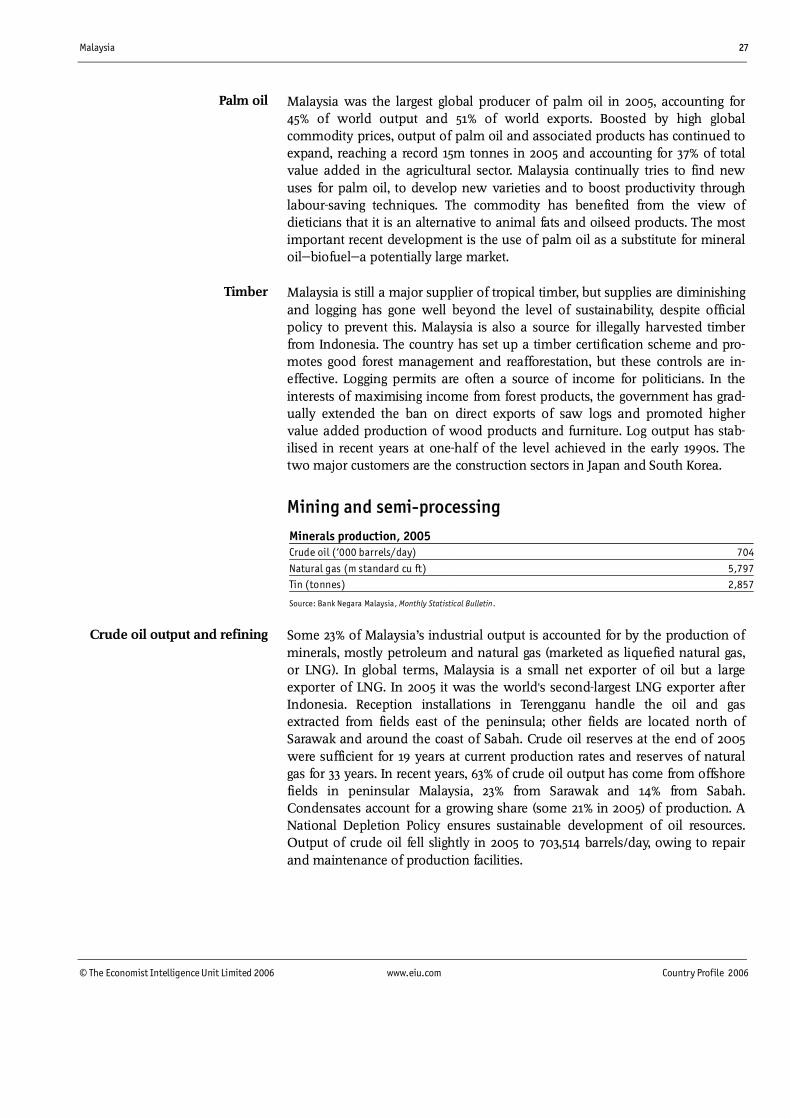
Malaysia 27
© The Economist Intelligence Unit Limited 2006 www.eiu.com Country Profile 2006
Malaysia was the largest global producer of palm oil in 2005, accounting for 45% of world output and 51% of world exports. Boosted by high global commodity prices, output of palm oil and associated products has continued to expand, reaching a record 15m tonnes in 2005 and accounting for 37% of total value added in the agricultural sector. Malaysia continually tries to find new uses for palm oil, to develop new varieties and to boost productivity through labour-saving techniques. The commodity has benefited from the view of dieticians that it is an alternative to animal fats and oilseed products. The most important recent development is the use of palm oil as a substitute for mineral oil"biofuel"a potentially large market.
Malaysia is still a major supplier of tropical timber, but supplies are diminishing and logging has gone well beyond the level of sustainability, despite official policy to prevent this. Malaysia is also a source for illegally harvested timber from Indonesia. The country has set up a timber certification scheme and pro-motes good forest management and reafforestation, but these controls are in-effective. Logging permits are often a source of income for politicians. In the interests of maximising income from forest products, the government has grad-ually extended the ban on direct exports of saw logs and promoted higher value added production of wood products and furniture. Log output has stab-ilised in recent years at one-half of the level achieved in the early 1990s. The two major customers are the construction sectors in Japan and South Korea.
Mining and semi-processing
Minerals production, 2005 Crude oil (�000 barrels/day) 704
Natural gas (m standard cu ft) 5,797Tin (tonnes) 2,857
Source: Bank Negara Malaysia, Monthly Statistical Bulletin.
Some 23% of Malaysia�s industrial output is accounted for by the production of minerals, mostly petroleum and natural gas (marketed as liquefied natural gas, or LNG). In global terms, Malaysia is a small net exporter of oil but a large exporter of LNG. In 2005 it was the world!s second-largest LNG exporter after Indonesia. Reception installations in Terengganu handle the oil and gas extracted from fields east of the peninsula; other fields are located north of Sarawak and around the coast of Sabah. Crude oil reserves at the end of 2005 were sufficient for 19 years at current production rates and reserves of natural gas for 33 years. In recent years, 63% of crude oil output has come from offshore fields in peninsular Malaysia, 23% from Sarawak and 14% from Sabah. Condensates account for a growing share (some 21% in 2005) of production. A National Depletion Policy ensures sustainable development of oil resources. Output of crude oil fell slightly in 2005 to 703,514 barrels/day, owing to repair and maintenance of production facilities.
Palm oil
Timber
Crude oil output and refining
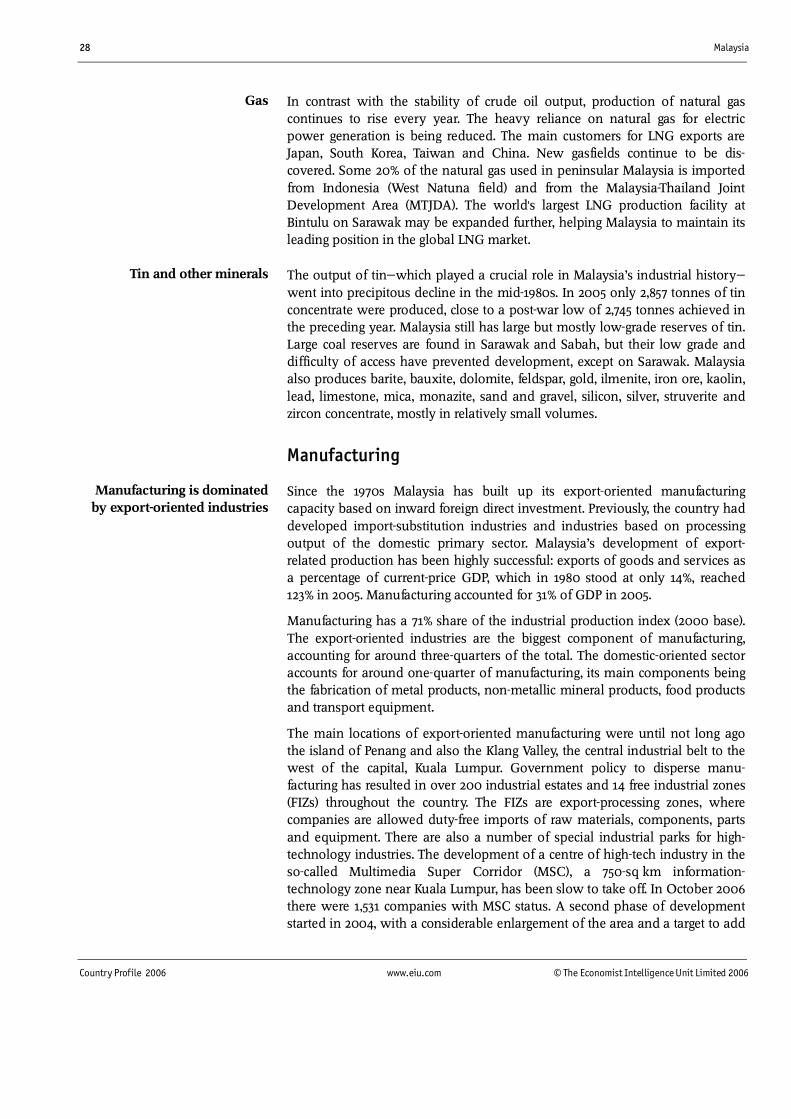
28 Malaysia
Country Profile 2006 www.eiu.com © The Economist Intelligence Unit Limited 2006
In contrast with the stability of crude oil output, production of natural gas continues to rise every year. The heavy reliance on natural gas for electric power generation is being reduced. The main customers for LNG exports are Japan, South Korea, Taiwan and China. New gasfields continue to be dis-covered. Some 20% of the natural gas used in peninsular Malaysia is imported from Indonesia (West Natuna field) and from the Malaysia-Thailand Joint Development Area (MTJDA). The world!s largest LNG production facility at Bintulu on Sarawak may be expanded further, helping Malaysia to maintain its leading position in the global LNG market.
The output of tin"which played a crucial role in Malaysia�s industrial history"went into precipitous decline in the mid-1980s. In 2005 only 2,857 tonnes of tin concentrate were produced, close to a post-war low of 2,745 tonnes achieved in the preceding year. Malaysia still has large but mostly low-grade reserves of tin. Large coal reserves are found in Sarawak and Sabah, but their low grade and difficulty of access have prevented development, except on Sarawak. Malaysia also produces barite, bauxite, dolomite, feldspar, gold, ilmenite, iron ore, kaolin, lead, limestone, mica, monazite, sand and gravel, silicon, silver, struverite and zircon concentrate, mostly in relatively small volumes.
Manufacturing
Since the 1970s Malaysia has built up its export-oriented manufacturing capacity based on inward foreign direct investment. Previously, the country had developed import-substitution industries and industries based on processing output of the domestic primary sector. Malaysia�s development of export-related production has been highly successful: exports of goods and services as a percentage of current-price GDP, which in 1980 stood at only 14%, reached 123% in 2005. Manufacturing accounted for 31% of GDP in 2005.
Manufacturing has a 71% share of the industrial production index (2000 base). The export-oriented industries are the biggest component of manufacturing, accounting for around three-quarters of the total. The domestic-oriented sector accounts for around one-quarter of manufacturing, its main components being the fabrication of metal products, non-metallic mineral products, food products and transport equipment.
The main locations of export-oriented manufacturing were until not long ago the island of Penang and also the Klang Valley, the central industrial belt to the west of the capital, Kuala Lumpur. Government policy to disperse manu-facturing has resulted in over 200 industrial estates and 14 free industrial zones (FIZs) throughout the country. The FIZs are export-processing zones, where companies are allowed duty-free imports of raw materials, components, parts and equipment. There are also a number of special industrial parks for high-technology industries. The development of a centre of high-tech industry in the so-called Multimedia Super Corridor (MSC), a 750-sq km information-technology zone near Kuala Lumpur, has been slow to take off. In October 2006 there were 1,531 companies with MSC status. A second phase of development started in 2004, with a considerable enlargement of the area and a target to add
Tin and other minerals
Gas
Manufacturing is dominated by export-oriented industries

Malaysia 29
© The Economist Intelligence Unit Limited 2006 www.eiu.com Country Profile 2006
biotechnology to information and communications technology activities over the next seven years.
Although the government aims to stimulate inward investment, all industrial projects are subject to an approval system, operated through the Malaysian Industrial Development Agency (MIDA). This involves vetting equity stakes, financing, technology transfer, local content and, increasingly, the products and processes concerned. With a growing shortage of skilled workers and an official policy to encourage high value-added production, MIDA stopped granting approvals to low-productivity industries. The government is encouraging exist-ing low-productivity industries to relocate elsewhere and making it more ex-pensive to attract unskilled foreign workers. Growing competition from China has made it difficult in recent years to attract foreign manufacturing investment to Malaysia, notwithstanding stronger incentives and reduced restrictions.
A long period of strong growth ended in 1998, when manufacturing production fell by 10.2%, undermined by the regional downturn. Fluctuations in overseas demand for products from the electronics sector continue to be the major determining influence on manufacturing production. However, the electronics sector is losing some of its dynamism as regional competition increases and the economic structure switches towards services. Manufacturing is becoming more diversified, with higher value added products and new emerging industries. Future growth in manufacturing will be more moderate than before the Asian economic crisis, more focused on domestic and regional demand than in recent decades, and less heavily dependent on electronics production.
Construction
A period of exceptionally fast expansion in the construction industry came to an end with the 1997-98 regional financial crisis. Construction had been an important contributor to GDP growth, with a powerful impact on other parts of the economy and employment. Activity in the construction sector, which had regularly expanded at a double-digit rate, plunged by 24% year on year when the crisis hit in 1998 and by 4.4% in 1999, as major projects were cancelled or abandoned and planned infrastructure developments dropped. Despite heavy government support, the construction sector remained in the doldrums, to be hit again by public works cutbacks at the start of the government of Abdullah Badawi in 2004. The outlook improved with the start of new projects under the Ninth Malaysia Plan 2006-10 (9MP) and the deepening of the recovery in private investment.
The construction industry employs more than 600,000 workers (over 100,000 legal foreign workers and many more working illegally) in 54,500 mainly small- and medium-sized companies. However, the industry is inefficient and riddled with corruption, caused in part by excessive red tape; shoddy work, delays, un-finished projects and cost overruns are a frequent occurrence. To boost pro-ductivity, lower costs and reduce the number of foreign workers, the govern-ment is promoting the use of new building techniques, using prefabricated
Foreign investment is discouraged in some industries
More subdued growth in manufacturing
Construction sector faces brighter prospects
The construction industry is inefficient
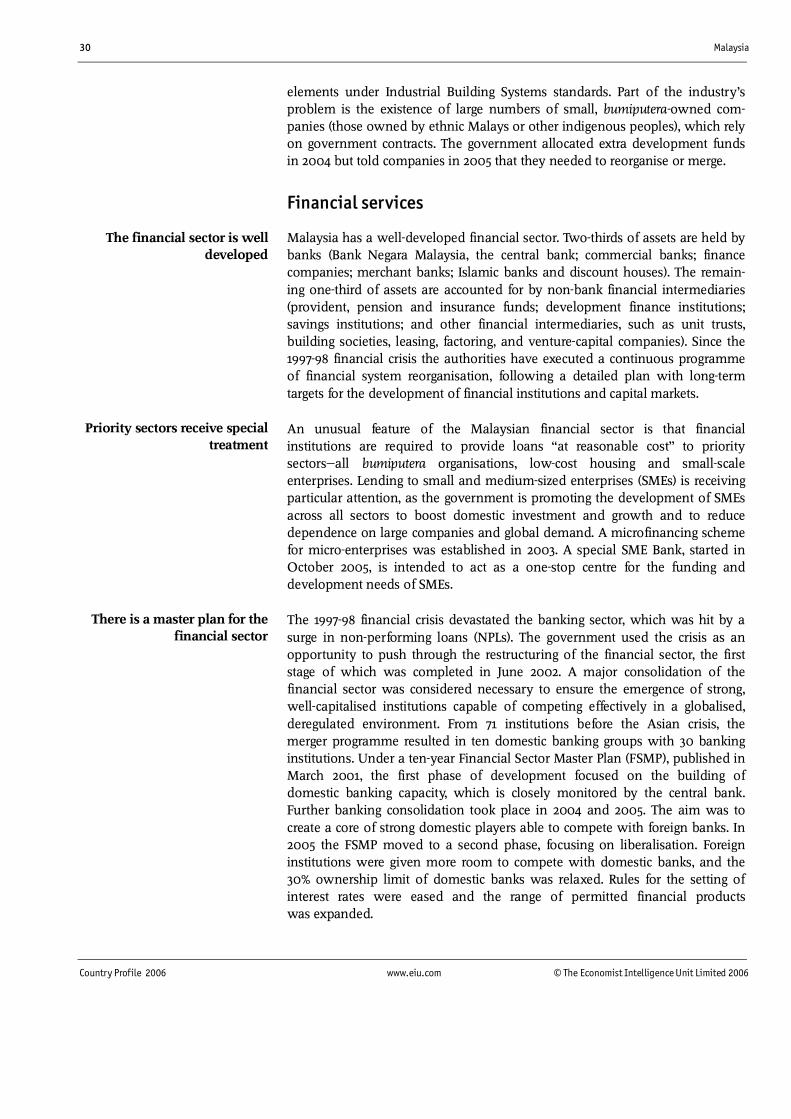
30 Malaysia
Country Profile 2006 www.eiu.com © The Economist Intelligence Unit Limited 2006
elements under Industrial Building Systems standards. Part of the industry�s problem is the existence of large numbers of small, bumiputera-owned com-panies (those owned by ethnic Malays or other indigenous peoples), which rely on government contracts. The government allocated extra development funds in 2004 but told companies in 2005 that they needed to reorganise or merge.
Financial services
Malaysia has a well-developed financial sector. Two-thirds of assets are held by banks (Bank Negara Malaysia, the central bank; commercial banks; finance companies; merchant banks; Islamic banks and discount houses). The remain-ing one-third of assets are accounted for by non-bank financial intermediaries (provident, pension and insurance funds; development finance institutions; savings institutions; and other financial intermediaries, such as unit trusts, building societies, leasing, factoring, and venture-capital companies). Since the 1997-98 financial crisis the authorities have executed a continuous programme of financial system reorganisation, following a detailed plan with long-term targets for the development of financial institutions and capital markets.
An unusual feature of the Malaysian financial sector is that financial institutions are required to provide loans �at reasonable cost� to priority sectors"all bumiputera organisations, low-cost housing and small-scale enterprises. Lending to small and medium-sized enterprises (SMEs) is receiving particular attention, as the government is promoting the development of SMEs across all sectors to boost domestic investment and growth and to reduce dependence on large companies and global demand. A microfinancing scheme for micro-enterprises was established in 2003. A special SME Bank, started in October 2005, is intended to act as a one-stop centre for the funding and development needs of SMEs.
The 1997-98 financial crisis devastated the banking sector, which was hit by a surge in non-performing loans (NPLs). The government used the crisis as an opportunity to push through the restructuring of the financial sector, the first stage of which was completed in June 2002. A major consolidation of the financial sector was considered necessary to ensure the emergence of strong, well-capitalised institutions capable of competing effectively in a globalised, deregulated environment. From 71 institutions before the Asian crisis, the merger programme resulted in ten domestic banking groups with 30 banking institutions. Under a ten-year Financial Sector Master Plan (FSMP), published in March 2001, the first phase of development focused on the building of domestic banking capacity, which is closely monitored by the central bank. Further banking consolidation took place in 2004 and 2005. The aim was to create a core of strong domestic players able to compete with foreign banks. In 2005 the FSMP moved to a second phase, focusing on liberalisation. Foreign institutions were given more room to compete with domestic banks, and the 30% ownership limit of domestic banks was relaxed. Rules for the setting of interest rates were eased and the range of permitted financial products was expanded.
The financial sector is well developed
Priority sectors receive special treatment
There is a master plan for the financial sector
Malaysia 31
© The Economist Intelligence Unit Limited 2006 www.eiu.com Country Profile 2006
Malaysia has a sizeable, fast-growing Islamic banking sector, which at end-2005 accounted for 11.3% of banking system assets and 11.7% of deposits. Rapid expansion has been fostered by the introduction of new Islamic financial instruments, as well as by official promotion of Islamic banking and of Kuala Lumpur as a regional Islamic financial centre. In 2005 foreign Islamic banks were admitted and the formation of Islamic subsidiaries by domestic banking groups was allowed. The FSMP has set a target for Islamic banking to account for 20% of banking assets by 2010.
Malaysia!s reputation with investors was compromised during the 1997-98 financial crisis by the government�s imposition of currency and capital controls, and by bail-outs of politically well-connected entrepreneurs to the detriment of minority shareholders. In February 2001 the government published a ten-year Capital Market Master Plan (CMP), to establish an internationally competitive capital market. Corporate governance and surveillance were strengthened and the financial markets reorganised, with the aim of developing a broad corporate bond market and boosting market liquidity, to make fundraising more efficient and reduce transaction costs. The second phase of the CMP started in 2004 and involves liberalisation of stockbroking and investment management, removal of structural impediments to market access, deregulation, enhancing secondary-market liquidity and allowing greater international participation in the domestic capital market. The liberalisation is, in part, a reflection of the need to invest Malaysia!s excess savings abroad.
Other services
Services (including financial services) are the largest part of national output, accounting for 58.2% of constant-price GDP in 2005. The share of services in GDP has increased steadily, but its share tends to decline when manufacturing grows strongly, usually during export-led recoveries. The sector is divided into intermediate services (24.1%) and final services (34.1%). Intermediate services include transport, storage and communications, and finance, insurance, property and business services. Final services consist of utilities; wholesale and retail trade, hotels and restaurants; government services; and other services.
During the past four years, intermediate services have expanded rapidly. The sector has benefited from the fast growth of mobile-phone and Internet services and strong demand for financial services, as well as increasing transshipment activities in local ports, which have been promoted as an alternative to the Port of Singapore; all three factors are likely to persist in the near future. Production of intermediate services grew in real terms by 5.9% in 2005.
The growth of final services has generally been firm in recent years, unaffected by a mild slowdown in government spending. Final services grew in real terms by 6.6% in 2004 and 6.9% in 2005. Growth in 2005 was supported by a 7.6% year-on-year increase in government services and a continued strong performance from the wholesale and retail trade, hotel and restaurants category. The production of utilities (gas, water and electricity) grew by 5.6%, the smallest rise for four years.
Islamic banking continues to grow strongly
A capital market master plan
Services sector continues to expand
32 Malaysia
Country Profile 2006 www.eiu.com © The Economist Intelligence Unit Limited 2006
The trade, restaurants and hotels subsector accounts for 43.1% of total final services. Tourism has become Malaysia�s most successful services sector, and continues to increase in importance as a source of economic growth. The gov-ernment considers the tourist industry a means of diversifying and broadening the economic structure. It is Malaysia!s second-largest foreign currency earner, after the electronics and electrical goods sector. The sector recovered strongly from the outbreak of severe acute respiratory syndrome (SARS) in the region in 2004, and posted a record number of tourist arrivals in 2005. Malaysia is benefiting from the strong growth in disposable incomes in the Asia region, and it also increasingly appeals to tourists from Islamic countries. In addition, the government is increasingly promoting tourism by hosting international con-ventions and major sporting events. Under the Ninth Malaysia Plan 2006-10 (9MP) the tourism industry is targeted to remain a major source of new growth and a key driver of the development of the services sector.
The external sector
Trade in goods
International trade has played a crucial role in Malaysia�s economic develop-ment, starting with the export of raw materials in the 19th century. In the 1970s industrial development was mainly based on export-oriented manufacturing and on imported inputs. Many of the production lines, particularly in the electronics sector, were set up on the basis of low local content, with the result that the bill for imported manufactures tends to rise in revenue from exports. Malaysia�s merchandise trade account has usually been in surplus; the surplus soared during the 1997-98 recession, and has remained high in its aftermath.
The continued high merchandise and current-account surpluses reflect the fact that Malaysia!s economy failed to recover fully after the Asian financial crisis. In particular, demand for imported capital goods did not return to its pre-crisis level, as private investment remained relatively low. In 2005 the trade surplus (customs basis) rose to a record M$99.8bn (US$26.3bn) from M$80.7bn in 2004. Although domestic demand remained firm, import growth weakened, while export earnings were boosted by high commodity prices.
High global commodity prices have in recent years pushed up the share of the primary commodity sector in total exports from 11.4% in 2001 to 15.3% in 2005. Minerals accounted for 9.4% and agricultural commodities 5.9%. The govern-ment�s intention to make agriculture an important engine of economic growth, if successful, will be felt mainly in a reduction of the food import bill, rather than in a change in the composition of agricultural exports. With the exception of palm oil, Malaysia�s economy continues to move away from plantation and forestry products, which form the bulk of agricultural exports. Exports of minerals consist almost entirely of crude oil and liquefied natural gas. The main determinant of primary export earnings is the global oil price; fluctuations in export volumes are of less importance.
Tourism is the most successful services sector
The global market determines primary export earnings
Export growth is matched by rising imports
Malaysia 33
© The Economist Intelligence Unit Limited 2006 www.eiu.com Country Profile 2006
Exports of manufactured goods accounted for 80.5% of total exports in 2005, compared with just 20% in the late 1970s. Exports of electronic and electrical goods accounted for 65.8% of manufactured goods exports in 2005, a share that stood at around 30% in the late 1970s. The heavy dependence on electronic and electrical goods means that total exports rise and fall as global demand for the products of the two sectors fluctuates. The government is encouraging manu-facturers and exporters to move up the value chain and improve product quality in order to maintain international competitiveness, especially in relation to China. The government promotes export trade through the Malaysian External Trade Development Corporation (Matrade).
According to data from the IMF, the US remains Malaysia!s largest export market, absorbing 22.4% of total exports in 2005. In value terms, exports increased to US$31.5bn in 2005 from US$23.7bn in 2004. Singapore remains Malaysia�s principal source of imports. The importance of Japan is gradually declining as trade with other Asian countries intensifies. The expansion of port facilities in Malaysia is taking entrepôt trade away from Singapore.
Main trading partners, 2005 Exports to: % of total Imports from: % of totalUS 22.4 Singapore 29.2Singapore 17.6 Japan 12.1China 13.0 China 10.2Japan 9.5 US 10.0
Source: IMF, Direction of Trade Statistics; International Financial Statistics.
Radical changes in trade patterns are taking place, particularly in regional trade. Trade with China surged following China�s accession to the World Trade Organisation (WTO) in December 2001. In 2005, according to data from national sources (Bank Negara Malaysia, or BNM, the central bank, and the Department of Statistics) China was Malaysia�s fifth-largest single trading partner, with an 8.8% share of total trade (exports plus imports). Trade with Greater China (comprising mainland China, Taiwan and Hong Kong) reached M$165.9bn (US$43.8bn) in 2005, surpassing trade with the US. Internal trade between the countries of the Association of South-East Asian Nations (ASEAN) also continued to expand rapidly. In 2005 Malaysia�s trade with other ASEAN countries was worth M$244.2bn, or 25.2% of total trade. Intra-regional trade tends to reflect fluctuations in global demand for manufactured products, but the region is quickly becoming a source of trade growth in its own right.
Trade liberalisation and regional economic integration will be highly significant for economic growth in next decade. China and ASEAN are negotiating a free-trade agreement (FTA), which may include Australia and New Zealand. Malaysia is likely to conclude an FTA with the US in the next couple of years. The Malaysian prime minister, Abdullah Badawi, has called for the setting up of an Asian inter-regional trading group similar to the EU, to include ASEAN, China, Japan and South Korea.
Manufactured goods form the bulk of exports
Trade with Greater China has overtaken trade with US
Trade liberalisation will be a major influence
Malaysia�s main trading partners
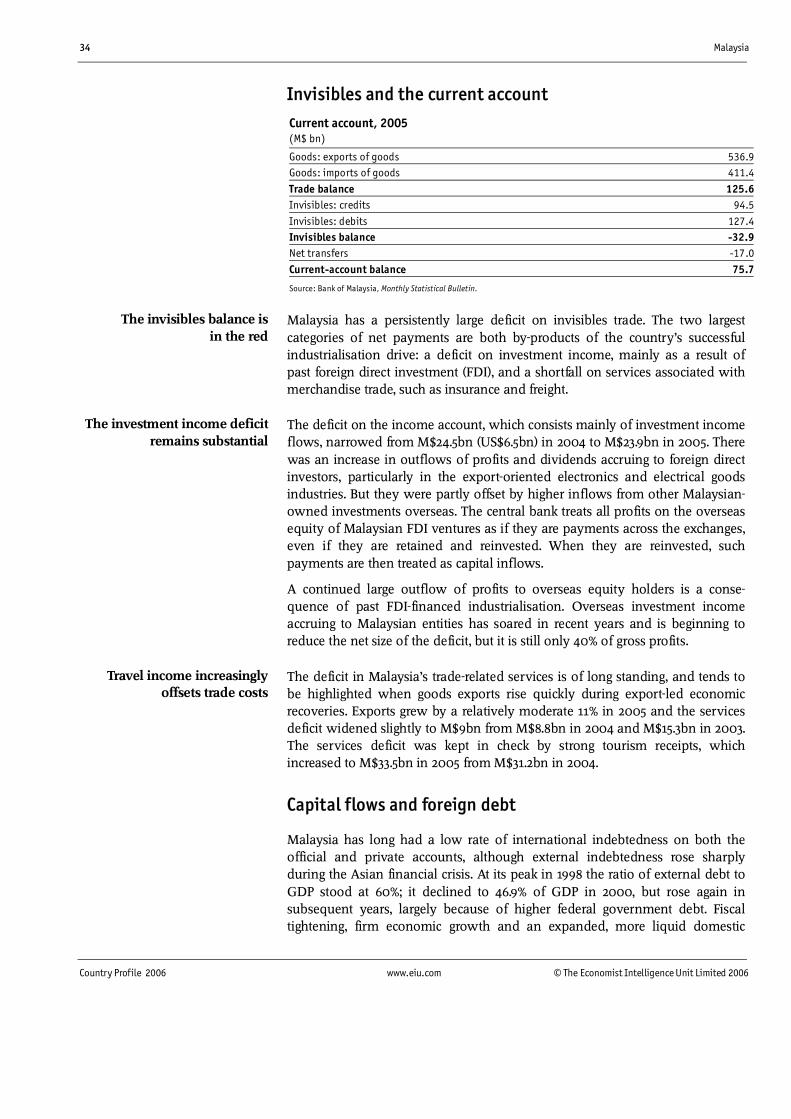
34 Malaysia
Country Profile 2006 www.eiu.com © The Economist Intelligence Unit Limited 2006
Invisibles and the current account Current account, 2005 (M$ bn)
Goods: exports of goods 536.9Goods: imports of goods 411.4
Trade balance 125.6Invisibles: credits 94.5
Invisibles: debits 127.4Invisibles balance -32.9Net transfers -17.0
Current-account balance 75.7
Source: Bank of Malaysia, Monthly Statistical Bulletin.
Malaysia has a persistently large deficit on invisibles trade. The two largest categories of net payments are both by-products of the country�s successful industrialisation drive: a deficit on investment income, mainly as a result of past foreign direct investment (FDI), and a shortfall on services associated with merchandise trade, such as insurance and freight.
The deficit on the income account, which consists mainly of investment income flows, narrowed from M$24.5bn (US$6.5bn) in 2004 to M$23.9bn in 2005. There was an increase in outflows of profits and dividends accruing to foreign direct investors, particularly in the export-oriented electronics and electrical goods industries. But they were partly offset by higher inflows from other Malaysian-owned investments overseas. The central bank treats all profits on the overseas equity of Malaysian FDI ventures as if they are payments across the exchanges, even if they are retained and reinvested. When they are reinvested, such payments are then treated as capital inflows.
A continued large outflow of profits to overseas equity holders is a conse-quence of past FDI-financed industrialisation. Overseas investment income accruing to Malaysian entities has soared in recent years and is beginning to reduce the net size of the deficit, but it is still only 40% of gross profits.
The deficit in Malaysia�s trade-related services is of long standing, and tends to be highlighted when goods exports rise quickly during export-led economic recoveries. Exports grew by a relatively moderate 11% in 2005 and the services deficit widened slightly to M$9bn from M$8.8bn in 2004 and M$15.3bn in 2003. The services deficit was kept in check by strong tourism receipts, which increased to M$33.5bn in 2005 from M$31.2bn in 2004.
Capital flows and foreign debt
Malaysia has long had a low rate of international indebtedness on both the official and private accounts, although external indebtedness rose sharply during the Asian financial crisis. At its peak in 1998 the ratio of external debt to GDP stood at 60%; it declined to 46.9% of GDP in 2000, but rose again in subsequent years, largely because of higher federal government debt. Fiscal tightening, firm economic growth and an expanded, more liquid domestic
The invisibles balance is in the red
The investment income deficit remains substantial
Travel income increasingly offsets trade costs
Malaysia 35
© The Economist Intelligence Unit Limited 2006 www.eiu.com Country Profile 2006
bond market reduced the external debt to GDP ratio to an estimated 39.8% by end-2005, down from 44% in 2004 and 46.7% in 2003.
Malaysia has been careful to avoid becoming dependent on external debt, and this determination has intensified since the Asian financial crisis. The govern-ment�s external debt management strategy requires that corporations seeking external funds for operations in Malaysia must assure the authorities that they will have the foreign-exchange income to repay the debt. The government en-courages companies to raise medium- and long-term loans and avoid short-term debt. In 2005, 76% of external debt was medium- and long-term debt. Short-term debt is matched against international reserves. National sources indicate that by end-2005 short-term debt was equivalent to 17.3% of international reserves and represented only 24% of total external debt. The bulk (80.1%) of Malaysia�s medium- and long-term external debt was denominated in US dollars; 11.9% was denominated in yen and only 2.2% in euro at end-2005.
The share of government external borrowing increased rapidly after the 1997-98 crisis to finance the expansionary fiscal programme but by end-2005 it had fallen to 15.2% of total external debt from 17.3% at end-2004, as the government continued to pursue a tighter fiscal policy. Federal government external debt outstanding fell to M$30bn at end-2005, down from M$34.7bn at end-2004, according to government sources. The main funding source for the govern-ment�s financing requirement is the domestic capital market.
Foreign reserves and the exchange rate
Malaysia!s foreign reserves have more than doubled in size since the end of 2002. The acceleration in the build-up of foreign reserves is the result of a number of factors. It reflects record levels of trade and current-account surpluses as well as FDI inflows and especially inflows from portfolio funds. Net reserves peaked at M$303bn (US$82.8bn) in August 2005, but declined slightly in the last four months of the year. The reserve build-up resumed during 2006, reflecting the persistent current-account surplus, to reach M$291.3bn at the end of August.
In July 2005 the BNM replaced the ringgit:US dollar peg, which was fixed at M$3.80:US$1 during the 1997-98 Asian crisis, with a managed float of the ringgit against a trade-weighted index of currencies of Malaysia�s major trading partners. Shortly before, China�s government declared that it had replaced its renminbi peg with the US dollar with a managed floating exchange-rate system. The BNM stated that it had made the change to secure the stability of the ringgit against its major trading partners and, in particular, other countries in the region. By adopting a managed float against a trade-weighted basket of currencies, the BNM is, in effect, returning to the currency management that existed between 1971 and September 1998. Under the new system, ringgit short-selling, ringgit trading overseas, and ringgit lending to non-residents continue to be forbidden.
Most external debt is medium- and long-term
The ringgit moves to a managed float
Foreign reserves are substantial
36 Malaysia
Country Profile 2006 www.eiu.com © The Economist Intelligence Unit Limited 2006
Regional overview
Membership of organisations
The Association of South-East Asian Nations (ASEAN) was established in 1967. The five original members were Indonesia, Malaysia, the Philippines, Singapore and Thailand. Brunei joined in 1984, as did Vietnam in 1995, Laos and Myanmar in 1997 and, most recently, Cambodia in 1999.
ASEAN summit meetings, which bring together the heads of government of member states, must be held every three years. The most recent took place in Malaysia in December 2005. Informal summits of heads of governments are also held. In addition, the foreign and economic affairs ministers of member countries meet annually. Joint meetings of foreign and economic affairs ministers are held before each ASEAN summit. There is also a standing committee (consisting of the members! accredited ambassadors to the host country), which usually meets every two months. There is a permanent secretariat, based in the Indonesian capital, Jakarta, and a number of committees.
The organisation started with some grand objectives, but has failed to deliver in most areas, with the exception of tariff reform. Early hopes that ASEAN could engineer a regional economic development strategy"with particular countries concentrating on particular industries"were soon dashed. In 1977 the Basic Agreement on the Establishment of ASEAN Preferential Tariffs was concluded, but members were permitted to exclude "sensitive" sectors, a let-out clause that a subsequent agreement in 1987 curtailed only slightly.
Plans for a proper ASEAN Free-Trade Area (AFTA) were unveiled in 1992, with the aim of implementing it by 2008. A common effective preferential tariff (CEPT) scheme was applied in 1993, providing for the gradual reduction of tariffs on intra-ASEAN trade in certain goods over a number of years. Again, however, member states could exclude sensitive items, limiting progress. A new AFTA programme, covering a wider range of products, was launched in 1994. During the mid-1990s the timescale for implementing the programme was steadily tightened, with the aim of reducing tariffs on most goods to below 5% by 2000. A limited AFTA, between the six earliest members of ASEAN and involving a reduction of tariffs on intra-ASEAN trade to between zero and 5%, came into operation on January 1st 2002. (Countries joining more recently have been allowed additional time.) The momentum for change has been maintained in recent years, and an ASEAN finance ministers! meeting in September 2004 agreed to abolish tariffs in 11 industrial sectors by 2012.
Before the recent acceleration in tariff reform, ASEAN!s slow progress towards AFTA had encouraged some of its members, notably Singapore and Thailand, to opt instead for bilateral trade pacts. But ASEAN!s hopes of further multilateral deals have not been extinguished. In December 2004 ASEAN and China signed a major trade deal, which aims to eliminate most tariffs on trade between ASEAN and China by 2010 (2015 for the less developed members of ASEAN). Tariffs will not go completely: countries will be able to designate a number of sectors as sensitive, and the greatest liberalisation is therefore likely to occur in
Association of South-East Asian Nations (ASEAN)
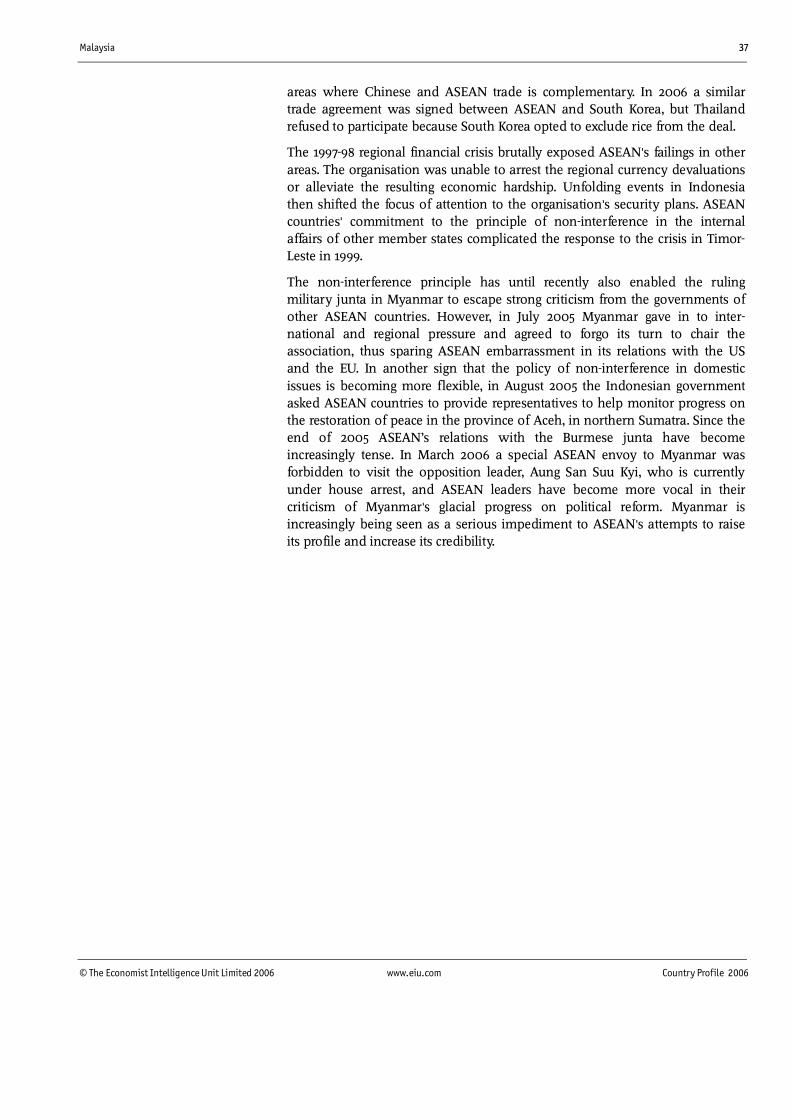
Malaysia 37
© The Economist Intelligence Unit Limited 2006 www.eiu.com Country Profile 2006
areas where Chinese and ASEAN trade is complementary. In 2006 a similar trade agreement was signed between ASEAN and South Korea, but Thailand refused to participate because South Korea opted to exclude rice from the deal.
The 1997-98 regional financial crisis brutally exposed ASEAN!s failings in other areas. The organisation was unable to arrest the regional currency devaluations or alleviate the resulting economic hardship. Unfolding events in Indonesia then shifted the focus of attention to the organisation!s security plans. ASEAN countries! commitment to the principle of non-interference in the internal affairs of other member states complicated the response to the crisis in Timor-Leste in 1999.
The non-interference principle has until recently also enabled the ruling military junta in Myanmar to escape strong criticism from the governments of other ASEAN countries. However, in July 2005 Myanmar gave in to inter-national and regional pressure and agreed to forgo its turn to chair the association, thus sparing ASEAN embarrassment in its relations with the US and the EU. In another sign that the policy of non-interference in domestic issues is becoming more flexible, in August 2005 the Indonesian government asked ASEAN countries to provide representatives to help monitor progress on the restoration of peace in the province of Aceh, in northern Sumatra. Since the end of 2005 ASEAN�s relations with the Burmese junta have become increasingly tense. In March 2006 a special ASEAN envoy to Myanmar was forbidden to visit the opposition leader, Aung San Suu Kyi, who is currently under house arrest, and ASEAN leaders have become more vocal in their criticism of Myanmar!s glacial progress on political reform. Myanmar is increasingly being seen as a serious impediment to ASEAN!s attempts to raise its profile and increase its credibility.
38 Malaysia
Country Profile 2006 www.eiu.com © The Economist Intelligence Unit Limited 2006
Appendices
Sources of information
Bank Negara Malaysia, Annual Report
Bank Negara Malaysia, Monthly Statistical Bulletin
Department of Statistics, External Trade Summary
Department of Statistics, Survey of Manufacturing Industries
Department of Statistics, Yearbook of Statistics
Economic Planning Unit, Ninth Malaysia Five-Year Plan (2006-2010)
Malaysian Industrial Development Agency (MIDA), Statistics on the Manufacturing Sector
Ministry of Finance, Economic Report (annual)
Asian Development Bank, Key Indicators
Bank for International Settlements, International Banking and Financial Market Developments (quarterly)
IMF, International Financial Statistics (monthly)
International Institute for Strategic Studies, Military Balance (annual)
OECD, Financial Statistics (monthly)
OECD, Geographical Distribution of Financial Flows to Developing Countries (annual)
UN, Monthly Bulletin of Statistics
UN, World Investment Report (annual)
World Bank, World Debt Tables (annual)
World Bank, World Development Report (annual)
J H Drabble, An Economic History of Malaysia, c. 1800-1990, Palgrave Macmillan, Canberra, 2000
E T Gomez (ed.), The State of Malaysia: Ethnicity, Equity and Reform, Routledge Curzon, London, 2004
T N Harper, The End of Empire and the Making of Malaya, Cambridge, 1999
J Hilley, Malaysia: Mahathirism, Hegemony and the New Opposition, Zed Books, London 2001
Ho Khai Leong and James Chin (eds), Mahathir�s Administration: Performance and Crisis in Government, Times Academic Press, Singapore, 2001
Select bibliography and websites
International statistical sources
National statistical sources
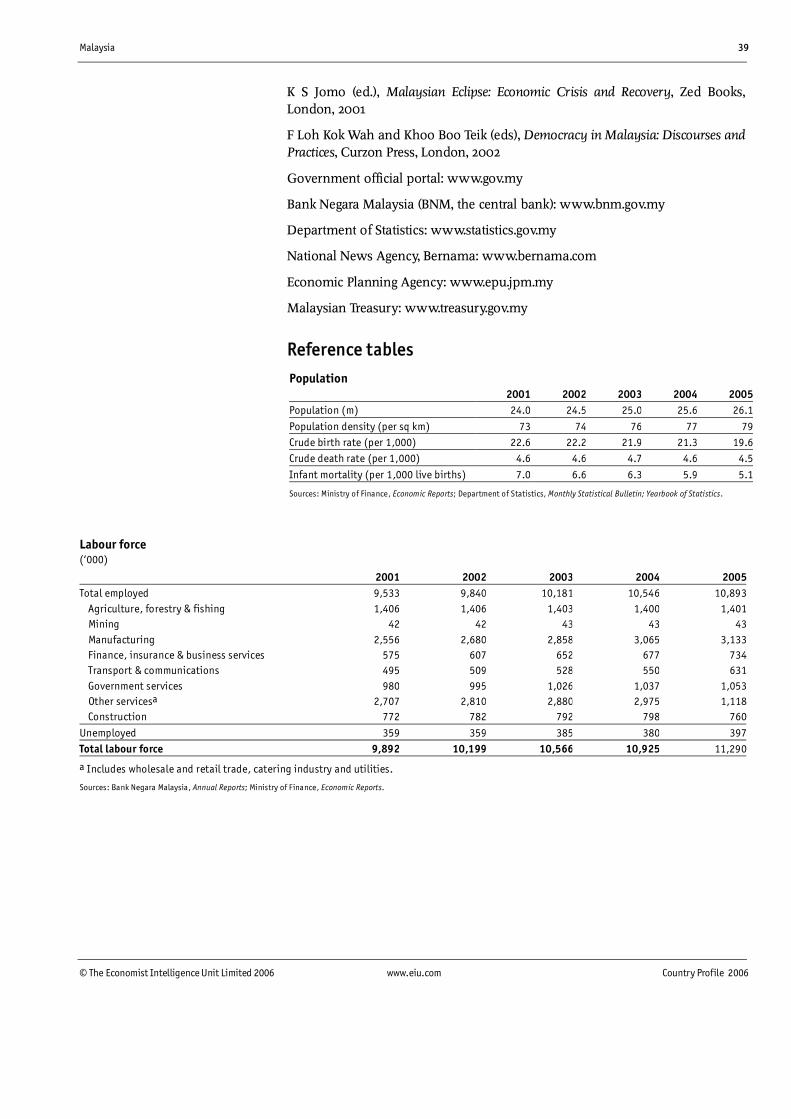
Malaysia 39
© The Economist Intelligence Unit Limited 2006 www.eiu.com Country Profile 2006
K S Jomo (ed.), Malaysian Eclipse: Economic Crisis and Recovery, Zed Books, London, 2001
F Loh Kok Wah and Khoo Boo Teik (eds), Democracy in Malaysia: Discourses and Practices, Curzon Press, London, 2002
Government official portal: www.gov.my
Bank Negara Malaysia (BNM, the central bank): www.bnm.gov.my
Department of Statistics: www.statistics.gov.my
National News Agency, Bernama: www.bernama.com
Economic Planning Agency: www.epu.jpm.my
Malaysian Treasury: www.treasury.gov.my
Reference tables Population 2001 2002 2003 2004 2005Population (m) 24.0 24.5 25.0 25.6 26.1
Population density (per sq km) 73 74 76 77 79Crude birth rate (per 1,000) 22.6 22.2 21.9 21.3 19.6Crude death rate (per 1,000) 4.6 4.6 4.7 4.6 4.5
Infant mortality (per 1,000 live births) 7.0 6.6 6.3 5.9 5.1
Sources: Ministry of Finance, Economic Reports; Department of Statistics, Monthly Statistical Bulletin; Yearbook of Statistics.
Labour force (�000)
2001 2002 2003 2004 2005Total employed 9,533 9,840 10,181 10,546 10,893 Agriculture, forestry & fishing 1,406 1,406 1,403 1,400 1,401 Mining 42 42 43 43 43 Manufacturing 2,556 2,680 2,858 3,065 3,133 Finance, insurance & business services 575 607 652 677 734 Transport & communications 495 509 528 550 631 Government services 980 995 1,026 1,037 1,053 Other servicesa 2,707 2,810 2,880 2,975 1,118 Construction 772 782 792 798 760
Unemployed 359 359 385 380 397Total labour force 9,892 10,199 10,566 10,925 11,290
a Includes wholesale and retail trade, catering industry and utilities.
Sources: Bank Negara Malaysia, Annual Reports; Ministry of Finance, Economic Reports.
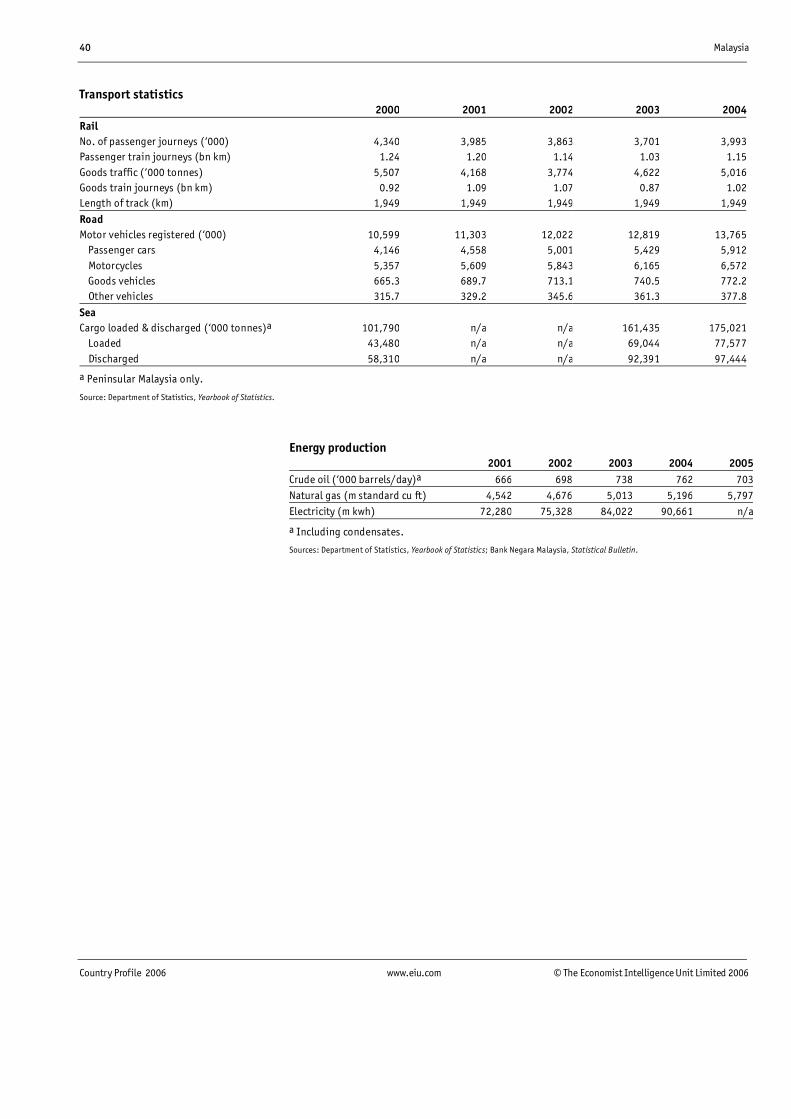
40 Malaysia
Country Profile 2006 www.eiu.com © The Economist Intelligence Unit Limited 2006
Transport statistics 2000 2001 2002 2003 2004Rail No. of passenger journeys (�000) 4,340 3,985 3,863 3,701 3,993Passenger train journeys (bn km) 1.24 1.20 1.14 1.03 1.15Goods traffic (�000 tonnes) 5,507 4,168 3,774 4,622 5,016Goods train journeys (bn km) 0.92 1.09 1.07 0.87 1.02Length of track (km) 1,949 1,949 1,949 1,949 1,949
Road Motor vehicles registered (�000) 10,599 11,303 12,022 12,819 13,765 Passenger cars 4,146 4,558 5,001 5,429 5,912 Motorcycles 5,357 5,609 5,843 6,165 6,572 Goods vehicles 665.3 689.7 713.1 740.5 772.2 Other vehicles 315.7 329.2 345.6 361.3 377.8
Sea Cargo loaded & discharged (�000 tonnes)a 101,790 n/a n/a 161,435 175,021 Loaded 43,480 n/a n/a 69,044 77,577 Discharged 58,310 n/a n/a 92,391 97,444
a Peninsular Malaysia only.
Source: Department of Statistics, Yearbook of Statistics.
Energy production 2001 2002 2003 2004 2005Crude oil (�000 barrels/day)a 666 698 738 762 703Natural gas (m standard cu ft) 4,542 4,676 5,013 5,196 5,797Electricity (m kwh) 72,280 75,328 84,022 90,661 n/a
a Including condensates.
Sources: Department of Statistics, Yearbook of Statistics; Bank Negara Malaysia, Statistical Bulletin.
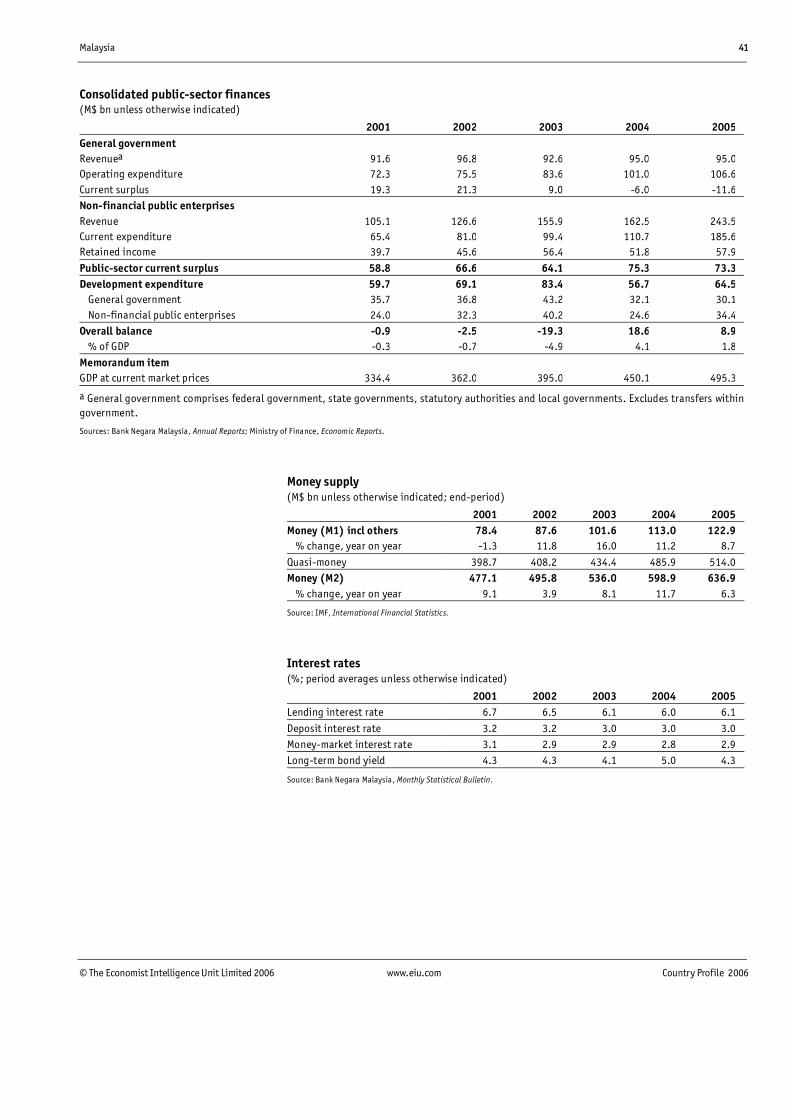
Malaysia 41
© The Economist Intelligence Unit Limited 2006 www.eiu.com Country Profile 2006
Consolidated public-sector finances (M$ bn unless otherwise indicated)
2001 2002 2003 2004 2005
General government
Revenuea 91.6 96.8 92.6 95.0 95.0
Operating expenditure 72.3 75.5 83.6 101.0 106.6
Current surplus 19.3 21.3 9.0 -6.0 -11.6
Non-financial public enterprises
Revenue 105.1 126.6 155.9 162.5 243.5
Current expenditure 65.4 81.0 99.4 110.7 185.6
Retained income 39.7 45.6 56.4 51.8 57.9
Public-sector current surplus 58.8 66.6 64.1 75.3 73.3
Development expenditure 59.7 69.1 83.4 56.7 64.5
General government 35.7 36.8 43.2 32.1 30.1
Non-financial public enterprises 24.0 32.3 40.2 24.6 34.4
Overall balance -0.9 -2.5 -19.3 18.6 8.9
% of GDP -0.3 -0.7 -4.9 4.1 1.8
Memorandum item
GDP at current market prices 334.4 362.0 395.0 450.1 495.3
a General government comprises federal government, state governments, statutory authorities and local governments. Excludes transfers withingovernment.
Sources: Bank Negara Malaysia, Annual Reports; Ministry of Finance, Economic Reports.
Money supply (M$ bn unless otherwise indicated; end-period)
2001 2002 2003 2004 2005
Money (M1) incl others 78.4 87.6 101.6 113.0 122.9
% change, year on year -1.3 11.8 16.0 11.2 8.7
Quasi-money 398.7 408.2 434.4 485.9 514.0
Money (M2) 477.1 495.8 536.0 598.9 636.9
% change, year on year 9.1 3.9 8.1 11.7 6.3
Source: IMF, International Financial Statistics.
Interest rates (%; period averages unless otherwise indicated)
2001 2002 2003 2004 2005
Lending interest rate 6.7 6.5 6.1 6.0 6.1
Deposit interest rate 3.2 3.2 3.0 3.0 3.0
Money-market interest rate 3.1 2.9 2.9 2.8 2.9
Long-term bond yield 4.3 4.3 4.1 5.0 4.3
Source: Bank Negara Malaysia, Monthly Statistical Bulletin.
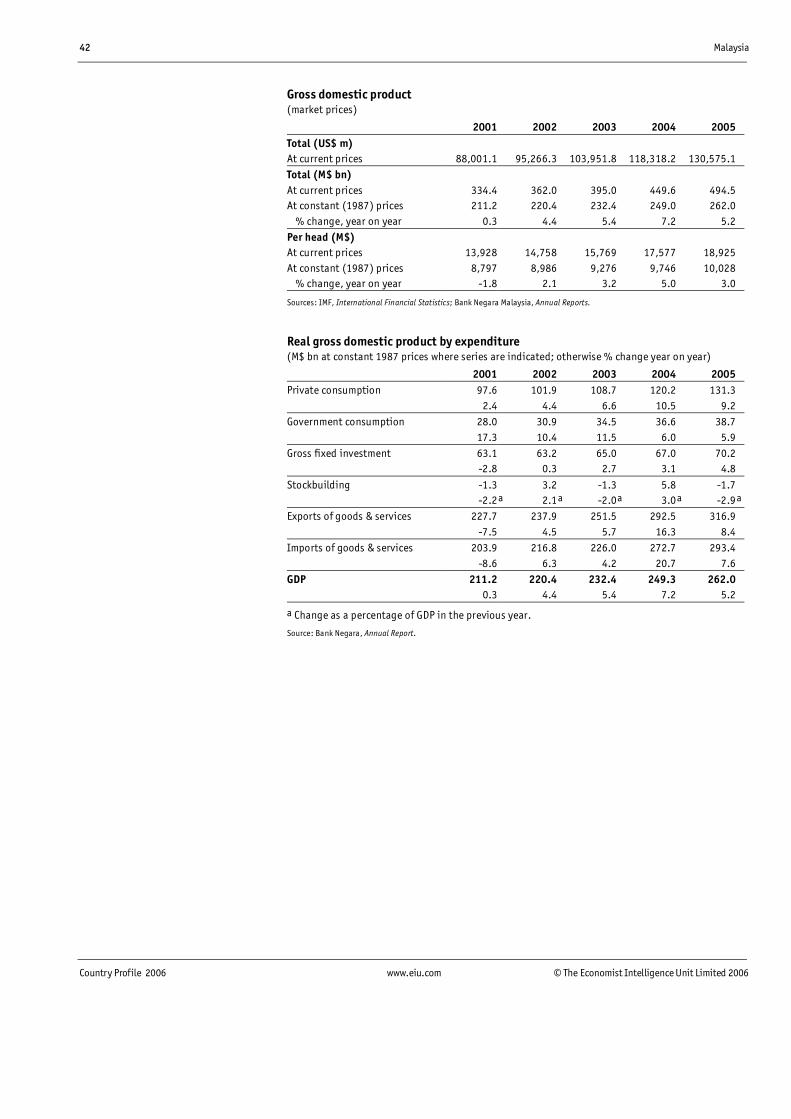
42 Malaysia
Country Profile 2006 www.eiu.com © The Economist Intelligence Unit Limited 2006
Gross domestic product (market prices)
2001 2002 2003 2004 2005
Total (US$ m) At current prices 88,001.1 95,266.3 103,951.8 118,318.2 130,575.1
Total (M$ bn) At current prices 334.4 362.0 395.0 449.6 494.5
At constant (1987) prices 211.2 220.4 232.4 249.0 262.0
% change, year on year 0.3 4.4 5.4 7.2 5.2
Per head (M$) At current prices 13,928 14,758 15,769 17,577 18,925
At constant (1987) prices 8,797 8,986 9,276 9,746 10,028
% change, year on year -1.8 2.1 3.2 5.0 3.0
Sources: IMF, International Financial Statistics; Bank Negara Malaysia, Annual Reports.
Real gross domestic product by expenditure (M$ bn at constant 1987 prices where series are indicated; otherwise % change year on year)
2001 2002 2003 2004 2005
Private consumption 97.6 101.9 108.7 120.2 131.3
2.4 4.4 6.6 10.5 9.2
Government consumption 28.0 30.9 34.5 36.6 38.7
17.3 10.4 11.5 6.0 5.9
Gross fixed investment 63.1 63.2 65.0 67.0 70.2
-2.8 0.3 2.7 3.1 4.8
Stockbuilding -1.3 3.2 -1.3 5.8 -1.7
-2.2a 2.1a -2.0 a 3.0a -2.9a
Exports of goods & services 227.7 237.9 251.5 292.5 316.9
-7.5 4.5 5.7 16.3 8.4
Imports of goods & services 203.9 216.8 226.0 272.7 293.4
-8.6 6.3 4.2 20.7 7.6
GDP 211.2 220.4 232.4 249.3 262.0
0.3 4.4 5.4 7.2 5.2
a Change as a percentage of GDP in the previous year.
Source: Bank Negara, Annual Report.
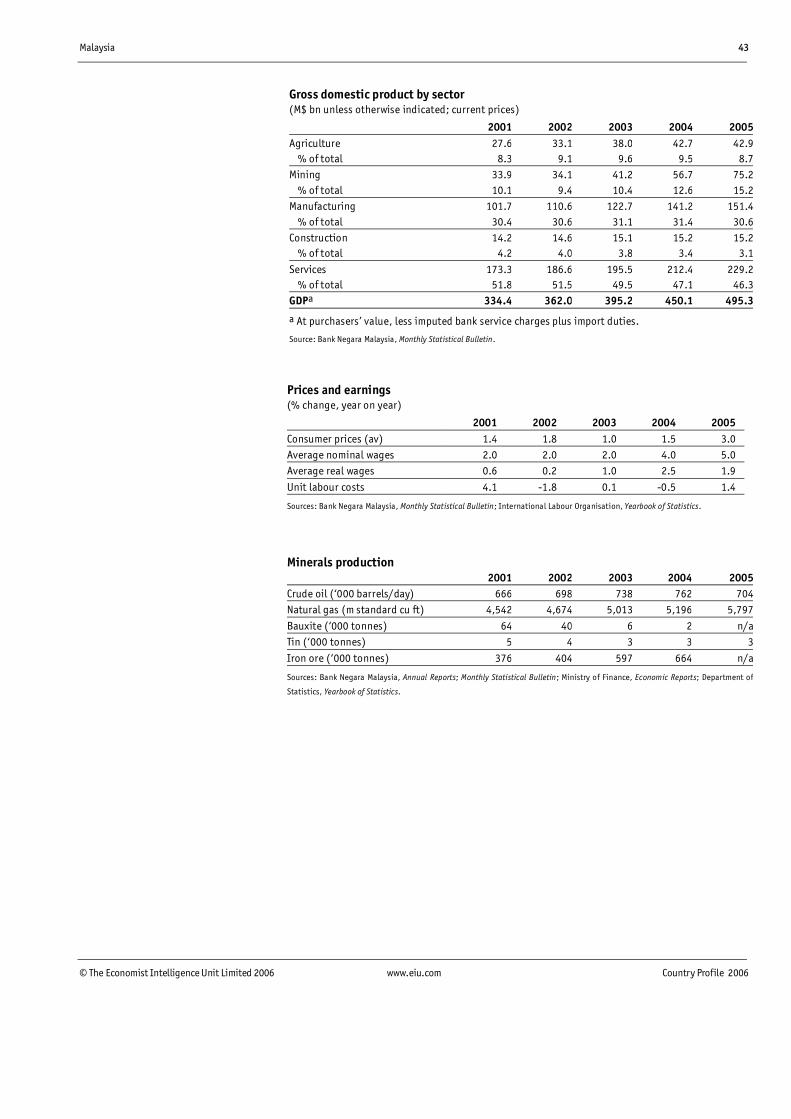
Malaysia 43
© The Economist Intelligence Unit Limited 2006 www.eiu.com Country Profile 2006
Gross domestic product by sector (M$ bn unless otherwise indicated; current prices)
2001 2002 2003 2004 2005Agriculture 27.6 33.1 38.0 42.7 42.9 % of total 8.3 9.1 9.6 9.5 8.7Mining 33.9 34.1 41.2 56.7 75.2 % of total 10.1 9.4 10.4 12.6 15.2Manufacturing 101.7 110.6 122.7 141.2 151.4 % of total 30.4 30.6 31.1 31.4 30.6Construction 14.2 14.6 15.1 15.2 15.2 % of total 4.2 4.0 3.8 3.4 3.1
Services 173.3 186.6 195.5 212.4 229.2 % of total 51.8 51.5 49.5 47.1 46.3GDPa 334.4 362.0 395.2 450.1 495.3
a At purchasers� value, less imputed bank service charges plus import duties.
Source: Bank Negara Malaysia, Monthly Statistical Bulletin.
Prices and earnings (% change, year on year)
2001 2002 2003 2004 2005
Consumer prices (av) 1.4 1.8 1.0 1.5 3.0
Average nominal wages 2.0 2.0 2.0 4.0 5.0
Average real wages 0.6 0.2 1.0 2.5 1.9
Unit labour costs 4.1 -1.8 0.1 -0.5 1.4
Sources: Bank Negara Malaysia, Monthly Statistical Bulletin; International Labour Organisation, Yearbook of Statistics.
Minerals production 2001 2002 2003 2004 2005Crude oil (�000 barrels/day) 666 698 738 762 704Natural gas (m standard cu ft) 4,542 4,674 5,013 5,196 5,797
Bauxite (�000 tonnes) 64 40 6 2 n/aTin (�000 tonnes) 5 4 3 3 3
Iron ore (�000 tonnes) 376 404 597 664 n/a
Sources: Bank Negara Malaysia, Annual Reports; Monthly Statistical Bulletin; Ministry of Finance, Economic Reports; Department of
Statistics, Yearbook of Statistics.
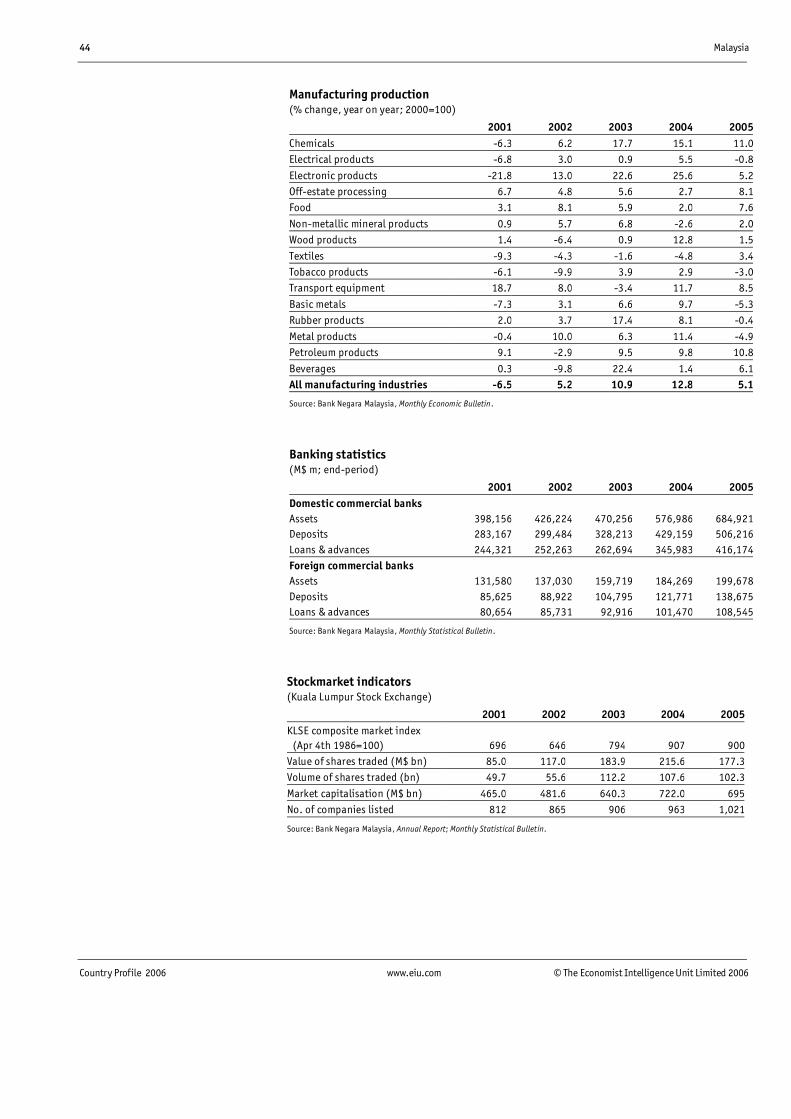
44 Malaysia
Country Profile 2006 www.eiu.com © The Economist Intelligence Unit Limited 2006
Manufacturing production (% change, year on year; 2000=100)
2001 2002 2003 2004 2005Chemicals -6.3 6.2 17.7 15.1 11.0Electrical products -6.8 3.0 0.9 5.5 -0.8
Electronic products -21.8 13.0 22.6 25.6 5.2Off-estate processing 6.7 4.8 5.6 2.7 8.1Food 3.1 8.1 5.9 2.0 7.6
Non-metallic mineral products 0.9 5.7 6.8 -2.6 2.0Wood products 1.4 -6.4 0.9 12.8 1.5
Textiles -9.3 -4.3 -1.6 -4.8 3.4Tobacco products -6.1 -9.9 3.9 2.9 -3.0Transport equipment 18.7 8.0 -3.4 11.7 8.5
Basic metals -7.3 3.1 6.6 9.7 -5.3Rubber products 2.0 3.7 17.4 8.1 -0.4
Metal products -0.4 10.0 6.3 11.4 -4.9Petroleum products 9.1 -2.9 9.5 9.8 10.8
Beverages 0.3 -9.8 22.4 1.4 6.1All manufacturing industries -6.5 5.2 10.9 12.8 5.1
Source: Bank Negara Malaysia, Monthly Economic Bulletin.
Banking statistics (M$ m; end-period)
2001 2002 2003 2004 2005Domestic commercial banks Assets 398,156 426,224 470,256 576,986 684,921Deposits 283,167 299,484 328,213 429,159 506,216Loans & advances 244,321 252,263 262,694 345,983 416,174Foreign commercial banks Assets 131,580 137,030 159,719 184,269 199,678Deposits 85,625 88,922 104,795 121,771 138,675Loans & advances 80,654 85,731 92,916 101,470 108,545
Source: Bank Negara Malaysia, Monthly Statistical Bulletin.
Stockmarket indicators (Kuala Lumpur Stock Exchange)
2001 2002 2003 2004 2005KLSE composite market index
(Apr 4th 1986=100) 696 646 794 907 900Value of shares traded (M$ bn) 85.0 117.0 183.9 215.6 177.3Volume of shares traded (bn) 49.7 55.6 112.2 107.6 102.3
Market capitalisation (M$ bn) 465.0 481.6 640.3 722.0 695No. of companies listed 812 865 906 963 1,021
Source: Bank Negara Malaysia, Annual Report; Monthly Statistical Bulletin.
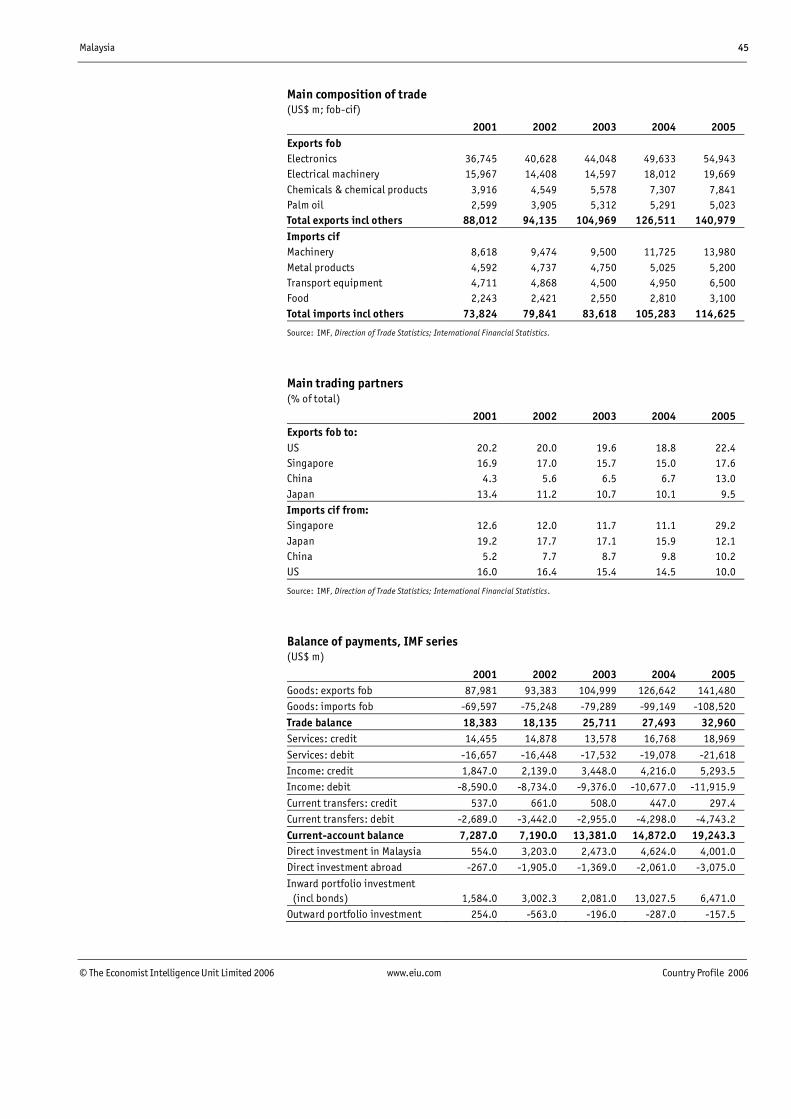
Malaysia 45
© The Economist Intelligence Unit Limited 2006 www.eiu.com Country Profile 2006
Main composition of trade (US$ m; fob-cif)
2001 2002 2003 2004 2005
Exports fob Electronics 36,745 40,628 44,048 49,633 54,943
Electrical machinery 15,967 14,408 14,597 18,012 19,669
Chemicals & chemical products 3,916 4,549 5,578 7,307 7,841
Palm oil 2,599 3,905 5,312 5,291 5,023
Total exports incl others 88,012 94,135 104,969 126,511 140,979
Imports cif Machinery 8,618 9,474 9,500 11,725 13,980
Metal products 4,592 4,737 4,750 5,025 5,200
Transport equipment 4,711 4,868 4,500 4,950 6,500
Food 2,243 2,421 2,550 2,810 3,100
Total imports incl others 73,824 79,841 83,618 105,283 114,625
Source: IMF, Direction of Trade Statistics; International Financial Statistics.
Main trading partners (% of total)
2001 2002 2003 2004 2005
Exports fob to: US 20.2 20.0 19.6 18.8 22.4
Singapore 16.9 17.0 15.7 15.0 17.6
China 4.3 5.6 6.5 6.7 13.0
Japan 13.4 11.2 10.7 10.1 9.5
Imports cif from: Singapore 12.6 12.0 11.7 11.1 29.2
Japan 19.2 17.7 17.1 15.9 12.1
China 5.2 7.7 8.7 9.8 10.2
US 16.0 16.4 15.4 14.5 10.0
Source: IMF, Direction of Trade Statistics; International Financial Statistics.
Balance of payments, IMF series (US$ m)
2001 2002 2003 2004 2005
Goods: exports fob 87,981 93,383 104,999 126,642 141,480
Goods: imports fob -69,597 -75,248 -79,289 -99,149 -108,520
Trade balance 18,383 18,135 25,711 27,493 32,960
Services: credit 14,455 14,878 13,578 16,768 18,969
Services: debit -16,657 -16,448 -17,532 -19,078 -21,618
Income: credit 1,847.0 2,139.0 3,448.0 4,216.0 5,293.5
Income: debit -8,590.0 -8,734.0 -9,376.0 -10,677.0 -11,915.9
Current transfers: credit 537.0 661.0 508.0 447.0 297.4
Current transfers: debit -2,689.0 -3,442.0 -2,955.0 -4,298.0 -4,743.2
Current-account balance 7,287.0 7,190.0 13,381.0 14,872.0 19,243.3
Direct investment in Malaysia 554.0 3,203.0 2,473.0 4,624.0 4,001.0
Direct investment abroad -267.0 -1,905.0 -1,369.0 -2,061.0 -3,075.0
Inward portfolio investment (incl bonds) 1,584.0 3,002.3 2,081.0 13,027.5 6,471.0
Outward portfolio investment 254.0 -563.0 -196.0 -287.0 -157.5
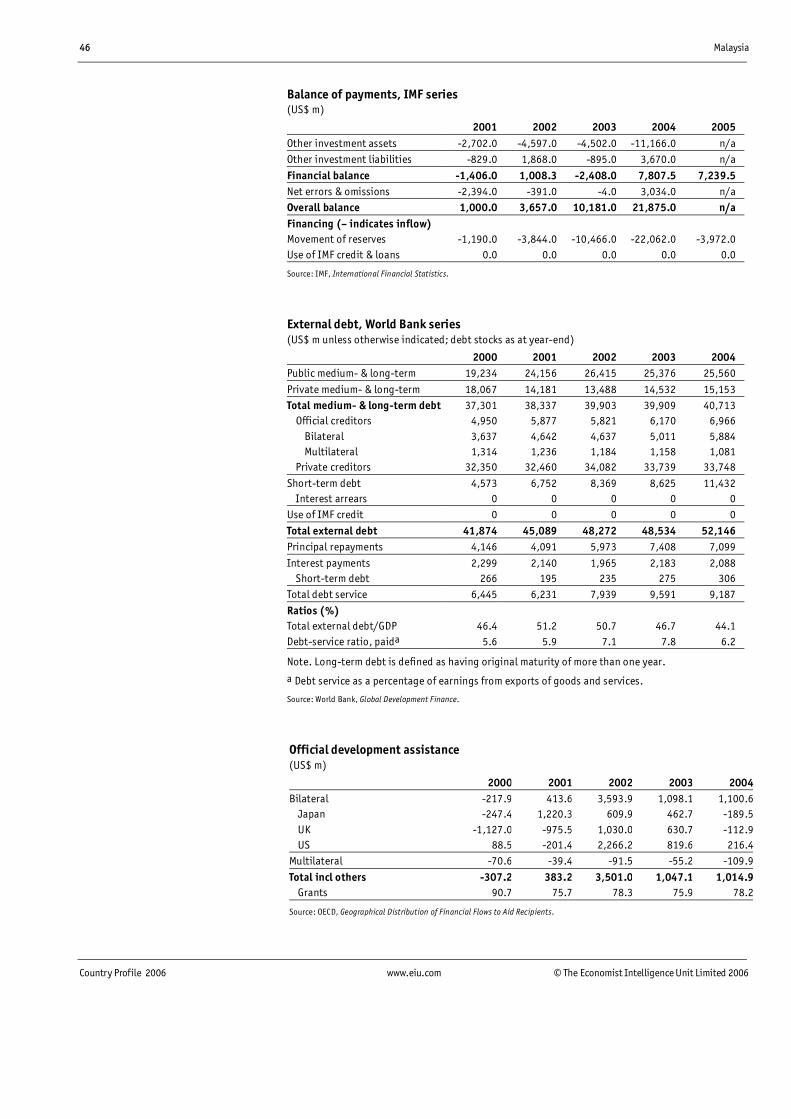
46 Malaysia
Country Profile 2006 www.eiu.com © The Economist Intelligence Unit Limited 2006
Balance of payments, IMF series (US$ m)
2001 2002 2003 2004 2005
Other investment assets -2,702.0 -4,597.0 -4,502.0 -11,166.0 n/a
Other investment liabilities -829.0 1,868.0 -895.0 3,670.0 n/a
Financial balance -1,406.0 1,008.3 -2,408.0 7,807.5 7,239.5
Net errors & omissions -2,394.0 -391.0 -4.0 3,034.0 n/a
Overall balance 1,000.0 3,657.0 10,181.0 21,875.0 n/a
Financing (� indicates inflow) Movement of reserves -1,190.0 -3,844.0 -10,466.0 -22,062.0 -3,972.0
Use of IMF credit & loans 0.0 0.0 0.0 0.0 0.0
Source: IMF, International Financial Statistics.
External debt, World Bank series (US$ m unless otherwise indicated; debt stocks as at year-end)
2000 2001 2002 2003 2004
Public medium- & long-term 19,234 24,156 26,415 25,376 25,560
Private medium- & long-term 18,067 14,181 13,488 14,532 15,153
Total medium- & long-term debt 37,301 38,337 39,903 39,909 40,713
Official creditors 4,950 5,877 5,821 6,170 6,966
Bilateral 3,637 4,642 4,637 5,011 5,884
Multilateral 1,314 1,236 1,184 1,158 1,081
Private creditors 32,350 32,460 34,082 33,739 33,748
Short-term debt 4,573 6,752 8,369 8,625 11,432
Interest arrears 0 0 0 0 0
Use of IMF credit 0 0 0 0 0
Total external debt 41,874 45,089 48,272 48,534 52,146
Principal repayments 4,146 4,091 5,973 7,408 7,099
Interest payments 2,299 2,140 1,965 2,183 2,088
Short-term debt 266 195 235 275 306
Total debt service 6,445 6,231 7,939 9,591 9,187
Ratios (%) Total external debt/GDP 46.4 51.2 50.7 46.7 44.1
Debt-service ratio, paida 5.6 5.9 7.1 7.8 6.2
Note. Long-term debt is defined as having original maturity of more than one year.
a Debt service as a percentage of earnings from exports of goods and services.
Source: World Bank, Global Development Finance.
Official development assistance (US$ m)
2000 2001 2002 2003 2004Bilateral -217.9 413.6 3,593.9 1,098.1 1,100.6 Japan -247.4 1,220.3 609.9 462.7 -189.5 UK -1,127.0 -975.5 1,030.0 630.7 -112.9 US 88.5 -201.4 2,266.2 819.6 216.4Multilateral -70.6 -39.4 -91.5 -55.2 -109.9
Total incl others -307.2 383.2 3,501.0 1,047.1 1,014.9 Grants 90.7 75.7 78.3 75.9 78.2
Source: OECD, Geographical Distribution of Financial Flows to Aid Recipients.
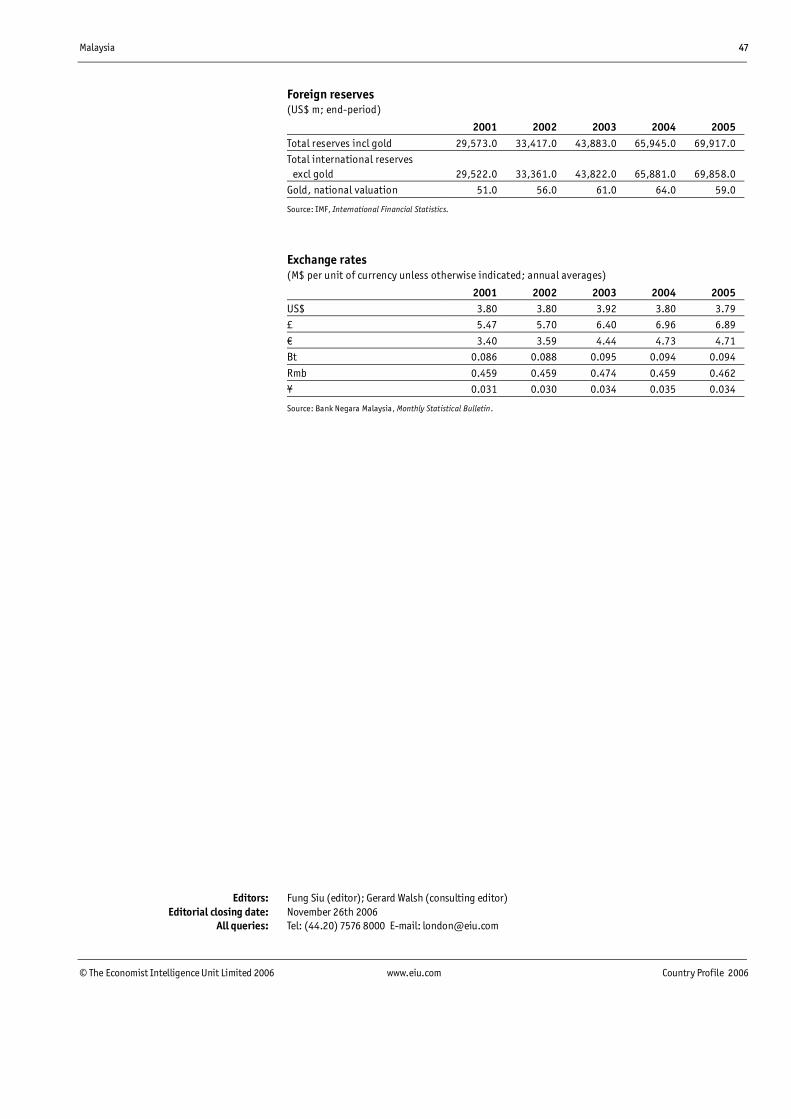
Malaysia 47
© The Economist Intelligence Unit Limited 2006 www.eiu.com Country Profile 2006
Foreign reserves (US$ m; end-period)
2001 2002 2003 2004 2005
Total reserves incl gold 29,573.0 33,417.0 43,883.0 65,945.0 69,917.0
Total international reserves excl gold 29,522.0 33,361.0 43,822.0 65,881.0 69,858.0
Gold, national valuation 51.0 56.0 61.0 64.0 59.0
Source: IMF, International Financial Statistics.
Exchange rates (M$ per unit of currency unless otherwise indicated; annual averages)
2001 2002 2003 2004 2005
US$ 3.80 3.80 3.92 3.80 3.79
£ 5.47 5.70 6.40 6.96 6.89
� 3.40 3.59 4.44 4.73 4.71
Bt 0.086 0.088 0.095 0.094 0.094
Rmb 0.459 0.459 0.474 0.459 0.462
¥ 0.031 0.030 0.034 0.035 0.034
Source: Bank Negara Malaysia, Monthly Statistical Bulletin.
Editors: Fung Siu (editor); Gerard Walsh (consulting editor) Editorial closing date: November 26th 2006 All queries: Tel: (44.20) 7576 8000 E-mail: [email protected]