Embed Size (px)
Citation preview

For further information please contact:
Global Malaria ProgrammeWorld Health Organization20, avenue AppiaCH-1211 Geneva 27Web: www.who.int/malariaEmail: [email protected]
m a l a r i a a t l a s p r o j e c t
The mark “CDC” is owned by the US Dept. of Health and Human Services and is used with permission. Use of
this logo is not an endorsement by HHS or CDC of any particular product, service, or enterprise.
WO
RL
D M
AL
AR
IA R
EP
OR
T 2017
ISBN 978 92 4 156552 3


World malaria report 2017
ISBN 978-92-4-156552-3
© World Health Organization 2017
Some rights reserved. This work is available under the Creative Commons Attribution-NonCommercial-ShareAlike 3.0 IGO licence (CC BY-NC-SA 3.0 IGO; https://creativecommons.org/licenses/by-nc-sa/3.0/igo).
Under the terms of this licence, you may copy, redistribute and adapt the work for non-commercial purposes, provided the work is appropriately cited, as indicated below. In any use of this work, there should be no suggestion that WHO endorses any specific organization, products or services. The use of the WHO logo is not permitted. If you adapt the work, then you must license your work under the same or equivalent Creative Commons licence. If you create a translation of this work, you should add the following disclaimer along with the suggested citation: “This translation was not created by the World Health Organization (WHO). WHO is not responsible for the content or accuracy of this translation. The original English edition shall be the binding and authentic edition”.
Any mediation relating to disputes arising under the licence shall be conducted in accordance with the mediation rules of the World Intellectual Property Organization.
Suggested citation. World malaria report 2017. Geneva: World Health Organization; 2017. Licence: CC BY-NC-SA 3.0 IGO.
Cataloguing-in-Publication (CIP) data. CIP data are available at http://apps.who.int/iris.
Sales, rights and licensing. To purchase WHO publications, see http://apps.who.int/bookorders. To submit requests for commercial use and queries on rights and licensing, see http://www.who.int/about/licensing.
Third-party materials. If you wish to reuse material from this work that is attributed to a third party, such as tables, figures or images, it is your responsibility to determine whether permission is needed for that reuse and to obtain permission from the copyright holder. The risk of claims resulting from infringement of any third-party-owned component in the work rests solely with the user.
General disclaimers. The designations employed and the presentation of the material in this publication do not imply the expression of any opinion whatsoever on the part of WHO concerning the legal status of any country, territory, city or area or of its authorities, or concerning the delimitation of its frontiers or boundaries. Dotted and dashed lines on maps represent approximate border lines for which there may not yet be full agreement.
The mention of specific companies or of certain manufacturers’ products does not imply that they are endorsed or recommended by WHO in preference to others of a similar nature that are not mentioned. Errors and omissions excepted, the names of proprietary products are distinguished by initial capital letters.
All reasonable precautions have been taken by WHO to verify the information contained in this publication. However, the published material is being distributed without warranty of any kind, either expressed or implied. The responsibility for the interpretation and use of the material lies with the reader. In no event shall WHO be liable for damages arising from its use.
Map production: WHO Global Malaria Programme and WHO Public Health Information and Geographic Systems.
Layout: designisgood.info
Please consult the WHO Global Malaria Programme website for the most up-to-date version of all documents (www.who.int/malaria)
Printed in Switzerland

ContentsForeword ivAcknowledgements viiAbbreviations xiKey points xii
1. Global malaria targets and milestones 22. Investments in malaria programmes and research 4
2.1. Total expenditure for malaria control and elimination 42.2 Total expenditure for malaria research and development 62.3 Deliveries of insecticide-treated mosquito nets 72.4 Deliveries of rapid diagnostic tests 92.5 Deliveries of artemisinin-based combination therapies 10
3. Preventing malaria 123.1 Population at risk sleeping under an insecticide-treated mosquito net 123.2 Population at risk protected by indoor residual spraying 153.3 Population at risk sleeping under an insecticide-treated mosquito net or
protected by indoor residual spraying 173.4 Pregnant women receiving three or more doses of intermittent preventive treatment 183.5 Seasonal malaria chemoprevention 19
4. Diagnostic testing and treatment 224.1 Children aged under 5 years with fever for whom advice or treatment was
sought from a trained provider 224.2 Suspected malaria cases receiving a parasitological test 244.3 Malaria cases receiving first-line antimalarial treatment according to national policy 264.4 Artemisinin-based combination therapy treatments among all malaria treatments 274.5 Integrated community case management 28
5. Malaria surveillance systems 305.1 Health facility reports received at national level 305.2 Malaria cases detected by surveillance systems 30
6. Regional and global trends in malaria cases and deaths 326.1 Estimated number of malaria cases by WHO region, 2000–2015 336.2 Malaria case incidence rate 386.3 Estimated number of malaria deaths and mortality rate by WHO region, 2010–2016 41
7. Malaria elimination and prevention of re-establishment 447.1 E-2020 initiative 467.2 WHO support structures for malaria eliminating countries 47
8. Responding to threats to the fight against malaria 488.1 Funding for malaria 488.2 Malaria in complex situations 508.3 False-positive diagnosis due to parasite deletion of histidine-rich proteins 548.4 Parasite resistance – antimalarial drug efficacy and response 548.5 Insecticide resistance 58
9. Conclusion 60
References 62Annexes 65
WORLD MALARIA REPORT 2017 iii

Foreword
Dr Tedros Adhanom GhebreyesusDirector-GeneralWorld Health Organization
For many years, the global response to malaria was considered one of the world’s great public health achievements. WHO reported time and again on the massive roll-out of effective disease-cutting tools, and on impressive reductions in cases and deaths.
Last December, we noted a troubling shift in the trajectory of this disease. The data showed that less than half of countries with ongoing transmission were on track to reach critical targets for reductions in the death and disease caused by malaria. Progress appeared to have stalled.
The World malaria report 2017 shows that this worrying trend continues. Although there are some bright spots in the data, the overall decline in the global malaria burden has unquestionably leveled off. And, in some countries and regions, we are beginning to see reversals in the gains achieved.
Global disease burden and trends
In 2016, 91 countries reported a total of 216 million cases of malaria, an increase of 5 million cases over the previous year. The global tally of malaria deaths reached 445 000 deaths, about the same number reported in 2015.
Although malaria case incidence has fallen globally since 2010, the rate of decline has stalled and even reversed in some regions since 2014. Mortality rates have followed a similar pattern.
The WHO African Region continues to account for about 90% of malaria cases and deaths worldwide. Fifteen countries – all but one in sub-Saharan Africa – carry 80% of the global malaria burden. Clearly, if we are to get the global malaria response back on track, supporting the most heavily affected countries in this region must be our primary focus.
Extending health care to all
As WHO Director-General, achieving universal health coverage is my top priority. This is based on the moral conviction that all people should be guaranteed access to the health services they need, when and where they need them, regardless of where they live or their financial status.
To this end, how have countries fared in delivering services that prevent, diagnose and treat malaria for all in need? While we have made important headway, the pace of progress must be greatly accelerated if we are to reach our global malaria targets for 2020 and beyond.
In 2016, just over half (54%) of people at risk of malaria in sub-Saharan Africa were sleeping under an insecticide-treated mosquito net – the primary prevention method. This level of coverage represents a considerable increase since 2010 but is far from the goal of universal access.
WORLD MALARIA REPORT 2017iv

Spraying the inside walls of homes with insecticides (indoor residual spraying, IRS) is another important prevention measure. The report documents a precipitous drop in IRS coverage in the WHO African Region since 2010, as well as declines in all other WHO regions over this same period.
Prompt diagnosis and treatment is the most effective means of preventing a mild case of malaria from developing into severe disease and death. In the WHO African Region, most people who seek treatment for malaria in the public health system receive an accurate diagnosis and effective medicines.
However, access to the public health system remains far too low. National-level surveys in the WHO African Region show that only about one third (34%) of children with a fever are taken to a medical provider in this sector.
Inadequate investment
A minimum investment of US$ 6.5 billion will be required annually by 2020 in order to meet the 2030 targets of the WHO global malaria strategy. The US$ 2.7 billion invested in 2016 represents less than half of that amount. Of particular concern is that, since 2014, investments in malaria control have, on average, declined in many high-burden countries.
Malaria response at a cross-roads
The choice before us is clear. If we continue with a “business as usual” approach – employing the same level of resources and the same interventions – we will face near-certain increases in malaria cases and deaths.
It is our hope that countries and the global health community choose another approach, resulting in a boost in funding for malaria programmes, expanded access to effective interventions and greater investment in the research and development of new tools.
As I have said before, countries must be in the driver’s seat; they alone are ultimately responsible for the health of their citizens. Universal health coverage is indeed a political choice – one that takes courage, compassion and long-term vision.
After spending many years fighting the scourge of malaria in Ethiopia, I know that we are up against a tough adversary. But I am also convinced that this is a winnable battle. With robust financial resources and political leadership, we can – and will – swing the pendulum back towards a malaria-free world.
WORLD MALARIA REPORT 2017 v


Acknowledgements
We are very grateful to the numerous people who contributed to the production of the World malaria report 2017. The following people collected and reviewed data from malaria endemic countries and territories:
Ahmad Mureed and Mohammad Shoaib Tamim (Afghanistan); Lammali Karima (Algeria); Pedro Rafael Dimbu and Yava Luvundo Ricardo (Angola); Mario Zaidenberg (Argentina); Rajaa Alsalloom and Ahmed Habib (Bahrain); Anjan Kumar Saha (Bangladesh); Kim Bautista (Belize); Bella Dos Santos Hounkpe (Benin); Sonam Gyeltshen (Bhutan); Raúl Marcelo Manjón Tellería (Bolivia [Plurinational State of]); Mpho Motlaleng (Botswana); Cássio Roberto Leonel Peterka, Poliana de Brito Ribeiro Reis and Edília Sâmela Freitas Santos (Brazil); Yacouba Savadogo (Burkina Faso); Félicien Ndayizeye (Burundi); António Lima Moreira (Cabo Verde); Tol Bunkea (Cambodia); Jean Fosso (Cameroon); Christophe Ndoua (Central African Republic); Mahamat Idriss Djaskano (Chad); Shan Jiang (China); Daniela Salas Botero (Colombia); Astafieva Marina (Comoros); Jean Mermoz Youndouka (Congo); Adriana Alfaro Nájera and José Luis Garcés Fernández (Costa Rica); Ehui Anicet Parfait Katche (Côte d’Ivoire); Kim Yun Chol (Democratic People’s Republic of Korea); Joris Losimba Likwela (Democratic Republic of the Congo); Abdullahi Ahmed (Djibouti); Juan Leonidas Castro Jimenez (Dominican Republic); Adriana Estefanía Echeverría Matute (Ecuador); Noha Swellam (Egypt); Jaime Enrique Alemán (El Salvador); Angela Katherien Lao Seoane (Equatorial Guinea); Selam Mihreteab (Eritrea); Hiwot Solomon and Mebrahtom Haile (Ethiopia); Alice Sanna (French Guiana); Alain Mbongo (Gabon); Momodou Kalleh (Gambia); Constance Bart-Plange (Ghana); Erica Chávez Vásquez (Guatemala); Nouman Diakité (Guinea); Paulo Djata (Guinea-Bissau); Quacy Grant (Guyana); Darlie Antoine, Jean Duval Fort Fervil and Samson Marseille (Haiti); Engels Banegas, Miguel Bobadilla, Dennis Escobar and Jose Orlinder Nicolas (Honduras); P.K. Sen (India); M. Epid and Elvieda Sariwati (Indonesia); Leyla Faraji and Ahmad Raeisi (Iran [Islamic Republic of]); Muthana Ibrahim Abdul Kareem (Iraq); Khalil Kanani ( Jordan); James Kiarie (Kenya); Bouasy Hongvanthong (Lao People’s Democratic Republic); Najib Achi (Lebanon); Oliver J. Pratt (Liberia); Abdunnaser Ali El-Buni (Libya); Thierry Franchard (Madagascar); Austin Albert Gumbo (Malawi); Jenarun Jelip (Malaysia); Fathimath Raseeda (Maldives); Diakalia Kone (Mali); Diop Cheikhou Oumar (Mauritania); Frédéric Pagès (Mayotte); Juan Carlos Carpio, José Cruz Rodríguez Martínez and Héctor Olguín Bernal (Mexico); Souâd Bouhout (Morocco); Guidion Mathe (Mozambique); Aung Thi (Myanmar); Mwalenga Nghipumbwa (Namibia); Bhim Acharya, Bibek Kumar Lal, Rajendra Mishra and Uttam Raj Pyakurel (Nepal); Julio Cesar Rosales Caballero (Nicaragua); Hadiza Jackou (Niger); Audu Bala Mohammed (Nigeria); Muhammad Suleman Memon (Pakistan); Elsa Benavides Arauz, Carlos Victoria and Fernando Vizcaíno (Panama); John Deli (Papua New Guinea); Monica Ozorio Rojas and Cynthia Viveros (Paraguay); José Oswaldo Cabanillas Angulo (Peru); Raffy Deray (Philippines); Maha Hammam Alshamali (Qatar); Jonghee Kim (Republic of Korea); Monique Murindahabi Ruyange (Rwanda); Jessica da Veiga dos Santos de Sousa Soares (Sao Tome and Principe); Mohammed Hassan Al-Zahrani (Saudi Arabia); Medoune Ndiop (Senegal); Samuel Juana Smith (Sierra Leone); John Leaburi (Solomon Islands); Fahmi Essa Yusuf (Somalia); Bridget Shandukani (South Africa); Harriet Pasquale (South Sudan); Tikiri Rambukwelle (Sri Lanka); Abd Alla Ahmed Ibrahim Mohammed (Sudan); Beatrix Jubithana (Suriname); Zulisile Zulu (Swaziland); Atef Al Tawil (Syrian Arab Republic), Preecha Prempree (Thailand); Maria do Rosario de Fatima Mota (Timor-Leste); Tchadjobo Tchassama (Togo); Dhikrayet Gamara (Tunisia); Damian Rutazana (Uganda); Mary John (United Arab Emirates); Anna Mahendeka (United Republic of Tanzania, [Mainland]); Abdul-wahid H. Al-mafazy (United Republic of Tanzania [Zanzibar]); Esau Nackett (Vanuatu); Jesus Toro Landaeta (Venezuela [Bolivarian Republic of]); Nguyen Quy Anh (Viet Nam); Moamer Mohamed Badi (Yemen); Mercy Mwanza Ingwe (Zambia); and Wonder Sithole (Zimbabwe).
WORLD MALARIA REPORT 2017 vii

We are grateful to the Seasonal Malaria Chemoprevention (SMC) working group (P. Batienon, M.-R. Fabry, H. Jakou, M. Kalleh, J.L. Ndiaye and C. Rwagacondo), Malaria Consortium (E. Baba, H. Kivumbi and D. Moroso), Catholic Relief Services (E. Hubbard, S. van Hulle and L. Razafindralambo), London School of Hygiene & Tropical Medicine and partners (K. Beshir, K. Bojang, M. Cairns, S.J. Ceesay, A. Diallo, A. Dicko, A. Djimde, T. Eloike, J.-P. Gami, H. Kessely, M.I. Laminou, K.M. Loua, P. Milligan, S.J. Ogboi, J.B. Ouedraogo, I. Sagara, S. Scott, P. Snell, C. Sutherland and I. Zongo), the Special Programme for Research and Training in Tropical Diseases (TDR) (C. Merle), Centre Anti Poison et de Pharmacovigilance du Maroc (CAPM) (H. Sefiani and R. Soulaymani), WHO (I. Noha and S. Pal) and the SMC Safety Committee (A. Dodoo, A. Isah, N. Kshirsagar and R. Soulaymani) for providing the context and data for the SMC section.
Carol D’Souza and Jurate Juskaite (Global Fund to Fight AIDS, Tuberculosis and Malaria [Global Fund]) supplied information on financial disbursements from the Global Fund. Adam Wexler (Kaiser Family Foundation) provided information on financial contributions for malaria control from the United States of America. John Milliner (Milliner Global Associates) provided information on long-lasting insecticidal nets delivered by manufacturers. Dr Samir Bhatt (Imperial College, University of London) and the Malaria Atlas Project (MAP, www.map.ox.ac.uk, University of Oxford, led by Professor Peter Gething), with the support of the Bill & Melinda Gates Foundation and the Medical Research Council (United Kingdom of Great Britain and Northern Ireland [United Kingdom]), produced estimates of insecticide-treated mosquito net (ITN) coverage for African countries using data from household surveys, ITN deliveries by manufacturers, ITNs distributed by national malaria control programmes (NMCPs), and ITN coverage indicators. They also produced estimates of Plasmodium falciparum parasite prevalence in sub-Saharan Africa. Dr Donal Bisanzio and Dr Katherine Battle of MAP produced estimates of treatment-seeking trends in both the public and private sector. MAP’s work was managed and coordinated by Dr Dan Weiss and Mike Thorn. Nicola Wardrop (Department for International Development) provided information on financial contributions for malaria control from the United Kingdom.
John Painter, Anna Bowen and Nelli Westercamp (US Centers for Disease Control and Prevention) provided data analysis and interpretation for the section on intermittent preventive treatment in pregnancy. Li Liu ( Johns Hopkins Bloomberg School of Public Health), Dan Hogan and Colin Mathers (WHO Department of Health Statistics and Information Systems) prepared estimates of malaria mortality in children aged under 5 years, on behalf of the Child Health Epidemiology Reference Group. We thank Professor Peter Ruckdeschel for his collaboration in the use of the “distr” package for R statistical software.
The following WHO staff in regional and subregional offices assisted in the design of data collection forms; the collection and validation of data; and the review of epidemiological estimates, country profiles, regional profiles and sections:
Birkinesh Amenshewa, Magaran Bagayoko, Steve Banza Kubenga and Jackson Sillah (WHO Regional Office for Africa [AFRO]); Spes Ntabangana (AFRO/Inter-country Support Team [IST] Central Africa); Khoti Gausi (AFRO/IST East and Southern Africa); Abderrahmane Kharchi Tfeil (AFRO/IST West Africa); Maria Paz Ade, Janina Chavez, Rainier Escalada, Valerie Mize, Roberto Montoya, Eric Ndofor and Prabhjot Singh (WHO Regional Office for the Americas [AMRO]); Hoda Atta, Caroline Barwa and Ghasem Zamani (WHO Regional Office for the Eastern Mediterranean [EMRO]); Elkhan Gasimov and Karen Taksoe-Vester (WHO Regional Office for Europe [EURO]); Eva-Maria Christophel, Steven Mellor and Risintha Premaratne (WHO Regional Office for South-East Asia [SEARO]); Rabindra Abeyasinghe, James Kelley and Raymond Mendoza (WHO Regional Office for the Western Pacific [WPRO]).
WORLD MALARIA REPORT 2017viii
Acknowledgements
The maps for country and regional profiles were produced by MAP’s ROAD-MAPII team (led by Mike Thorn); map production was led and coordinated by Jen Rozier, with help from Daniel Pfeffer, Kate Twohig, Joe Harris and Harry Gibson. ROAD-MAPII is supported by the Bill & Melinda Gates Foundation and the Medical Research Council (United Kingdom).
We are also grateful to:
■ Melanie Renshaw (African Leaders Malaria Alliance [ALMA]), Trenton Ruebush (independent consultant) and Laurence Slutsker (Program for Appropriate Technology in Health [PATH]), who graciously reviewed all sections and provided substantial comments for improvement;
■ Claudia Nannini (WHO) for legal review;
■ Martha Quiñones (WHO consultant) and Laurent Bergeron (WHO) for the translation into Spanish and French, respectively, of the foreword and key points;
■ Claude Cardot and the Designisgood team for the design and layout of the report;
■ Blossom (Milan, Italy) for the report cover; and
■ Hilary Cadman and the Cadman Editing Services team for technical editing of the report.
Abdisalan Noor (WHO Global Malaria Programme) was the lead author of the World malaria report 2017, with significant contributions from John Aponte, Maru Aregawi, Amy Barrette, Nelly Biondi, Tessa Knox, Edith Patouillard and Ryan Williams on behalf of the WHO Global Malaria Programme. Laurent Bergeron (WHO Global Malaria Programme) provided programmatic support for overall management of the project. The editorial committee for the report comprised Pedro Alonso, Andrea Bosman, Richard Cibulskis, Jan Kolaczinski, Kimberly Lindblade, Leonard Ortega, Pascal Ringwald and David Schellenberg from the WHO Global Malaria Programme.
We are grateful to our colleagues in the Global Malaria Programme who made significant contributions and reviewed sections of the report: Laurent Bergeron, Jane Cunningham, Gawrie Galappaththy, Peter Olumese, Charlotte Rasmussen, Silvia Schwarte, Erin Shutes, Saira Stewart and Emmanuel Temu.
Funding for the production of this report was gratefully received from the Bill & Melinda Gates Foundation; Luxembourg’s Ministry of Foreign and European Affairs – Directorate for Development Cooperation and Humanitarian Affairs; the Spanish Agency for International Development Cooperation; and the United States Agency for International Development.
WORLD MALARIA REPORT 2017 ix

ACTAIDS
AIMGTS
IQR
LLIN
MPAC
SMC
DDT GAP MEOCSDGIRS
MECP ANC WHO TESASAQ
RDT
ASMQNMCP
IPTp
ICCM
HRP
Abbreviations
ACT artemisinin-based combination therapy
AIDS acquired immunodeficiency syndrome
AIM Action and investment to defeat malaria 2016–2030
AL artemether-lumefantrine
AMFm Affordable Medicine Facility–malaria
ANC antenatal care
AQ amodiaquine
AS artesunate
ASAQ artesunate-amodiaquine
ASMQ artesunate-mefloquine
BMGF Bill & Melinda Gates Foundation
CI confidence interval
CQ chloroquine
DDT dichloro-diphenyl-trichloroethane
DP dihydroartemisinin-piperaquine
GAP Global Action Plan
Global Fund Global Fund to Fight AIDS, Tuberculosis and Malaria
GTS Global technical strategy for malaria 2016–2030
HRP histidine-rich protein
iCCM integrated community case management
IMCI integrated management of childhood illnesses
IPTi intermittent preventive treatment in infants
IPTp intermittent preventive treatment in pregnancy
IQR interquartile range
IRS indoor residual spraying
ITN insecticide-treated mosquito net
LLIN long-lasting insecticidal net
MECP Malaria Elimination Certification Panel
MEOC Malaria Elimination Oversight Committee
MPAC Malaria Policy Advisory Committee
NMCP national malaria control programme
P. Plasmodium
PQ primaquine
RDT rapid diagnostic test
SDG Sustainable Development Goal
SMC seasonal malaria chemoprevention
SP sulfadoxine-pyrimethamine
TES therapeutic efficacy study
UNICEF United Nations Children’s Fund
USA United States of America
WHO World Health Organization
Abbreviations of WHO regions and officesAFR WHO African Region
AFRO WHO Regional Office for Africa
AMR WHO Region of the Americas
AMRO WHO Regional Office for the Americas
EMR WHO Eastern Mediterranean Region
EMRO WHO Regional Office for the Eastern Mediterranean
EUR WHO European Region
EURO WHO Regional Office for Europe
SEAR WHO South-East Asia Region
SEARO WHO Regional Office for South-East Asia
WPR WHO Western Pacific Region
WPRO WHO Regional Office for the Western Pacific
WORLD MALARIA REPORT 2017 xi

KEY POINTS BY SECTION
This year’s report at a glance
> The 2017 World malaria report presents a comprehensive state of play in global progress in the fight against malaria up to the end of 2016. It tracks progress in investments in malaria programmes and research, malaria prevention, diagnosis and treatment, surveillance, trends in malaria disease burden, malaria elimination, and threats in tackling malaria and safeguarding the investments made.
> This year’s report comes 1 year after the launch of three time-bound milestones to accelerate progress towards malaria control and elimination: the WHO Global technical strategy for malaria 2016–2030 (GTS); the Roll Back Malaria advocacy plan, Action and investment to defeat malaria 2016-2030 (AIM); and the Sustainable Development Goals (SDGs), with Target 3.3 focused on AIDS, tuberculosis, malaria and neglected tropical diseases.
> The GTS and AIM are aligned with the SDGs, with targets set for the years 2020, 2025 and 2030, compared with a baseline of 2015. For malaria, achieving SDG Target 3.3 by 2030 is interpreted as the attainment of the GTS and AIM targets.
> The primary sources of information for this year’s edition of the World malaria report are reports from 94 countries. This information is supplemented by data from nationally representative household surveys and databases held by other partner organizations.
WORLD MALARIA REPORT 2017xii

INVESTMENTS IN MALARIA PROGRAMMES AND RESEARCH
Malaria control and elimination investments ■ In 2016, an estimated US$ 2.7 billion was invested in malaria control and elimination efforts globally by
governments of malaria endemic countries and international partners. ■ The majority (74%) of investments in 2016 were spent in the WHO African Region, followed by the WHO
regions of South-East Asia (7%), the Eastern Mediterranean and the Americas (each 6%), and the Western Pacific (4%).
■ Governments of endemic countries contributed 31% of total funding (US$ 800 million) in 2016. ■ The United States of America (USA) was the largest international source of malaria financing in 2016,
providing US$ 1 billion (38%), followed by the United Kingdom of Great Britain and Northern Ireland (United Kingdom) and other international donors, including France, Germany and Japan.
■ More than half (57%) of resources in 2016 were channelled through the Global Fund to Fight AIDS, Tuberculosis and Malaria (Global Fund).
Investment outlook ■ Although funding for malaria has remained relatively stable since 2010, the level of investment in 2016
is far from what is required to reach the first milestone of the GTS, which is a reduction of at least 40% in malaria case incidence and mortality rates globally when compared to 2015 levels.
■ To reach this milestone, the GTS estimated that annual funding would need to increase to US$ 6.5 billion per year by 2020. The US$ 2.7 billion invested in malaria in 2016 represents less than half (41%) of that amount.
■ Stepping up investments in malaria research and development is key to achieving the GTS targets. In 2015, US$ 572 million was spent in this area, representing 83% of the estimated annual need for research and development.
Deliveries of malaria commoditiesInsecticide-treated mosquito nets
■ Between 2014 and 2016, a total of 582 million insecticide-treated mosquito nets (ITNs) were reported by manufacturers as having been delivered globally.
■ Of this amount, 505 million ITNs were delivered in sub-Saharan Africa, compared with 301 million bednets in the preceding 3-year period (2011–2013).
■ Data from national malaria control programmes (NMCPs) in Africa indicate that, between 2014 and 2016, 75% of ITNs were distributed through mass distribution campaigns.
Rapid diagnostic tests ■ An estimated 312 million rapid diagnostic tests (RDTs) were delivered globally in 2016. Of these,
269 million were delivered in the WHO African Region. ■ The number of RDTs distributed by NMCPs increased between 2010 and 2015, but fell from 247 million
in 2015 to 221 million in 2016. The decrease was entirely in sub-Saharan Africa, where distributions dropped from 219 million to 177 million RDTs over the 2015–2016 period.
Artemisinin-based combination therapy ■ An estimated 409 million treatment courses of artemisinin-based combination therapy (ACT) were
procured by countries in 2016, an increase from 311 million in 2015. Over 69% of these procurements were reported to have been made for the public sector.
■ The number of ACT treatments distributed by NMCPs to the public sector increased from 192 million in 2013 to 198 million in 2016. Most of the NMCP distributions of ACTs (99%) in 2016 occurred in the WHO African Region.
WORLD MALARIA REPORT 2017 xiii

PREVENTING MALARIA
Vector control ■ Across sub-Saharan Africa, household ownership of at least one ITN increased from 50% in 2010 to 80%
in 2016. However, the proportion of households with sufficient nets (i.e. one net for every two people) remains inadequate, at 43% in 2016.
■ More people at risk of malaria in Africa are sleeping under an ITN. In 2016, 54% of the population was protected by this intervention, an increase from 30% in 2010.
■ Fewer people at risk of malaria are being protected by indoor residual spraying (IRS), a prevention method that involves spraying the inside walls of dwellings with insecticides. Globally, IRS protection declined from a peak of 5.8% in 2010 to 2.9% in 2016, with decreases seen across all WHO regions. In the WHO African Region, coverage dropped from 80 million people at risk in 2010 to 45 million in 2016.
■ The declines in IRS coverage are occurring as countries change or rotate insecticides to more expensive chemicals.
Preventive therapies ■ To protect women in areas of moderate and high malaria transmission in Africa, WHO recommends
“intermittent preventive treatment in pregnancy” (IPTp) with the antimalarial drug sulfadoxine-pyrimethamine. Among 23 African countries that reported on IPTp coverage levels in 2016, an estimated 19% of eligible pregnant women received the recommended three or more doses of IPTp, compared with 18% in 2015 and 13% in 2014.
■ In 2016, 15 million children in 12 countries in Africa’s Sahel subregion were protected through seasonal malaria chemoprevention (SMC) programmes. However, about 13 million children who could have benefited from this intervention were not covered, mainly due to a lack of funding. Since 2012, SMC has been recommended by WHO for children aged 3-59 months living in areas of highly seasonal malaria transmission in this subregion.
DIAGNOSTIC TESTING AND TREATMENT
Accessing care ■ Prompt diagnosis and treatment is the most effective means of preventing a mild case of malaria from
developing into severe disease and death. Among national-level surveys completed in 18 countries in sub-Saharan Africa between 2014 and 2016 (representing 61% of the population at risk), a median of 47% (interquartile range [IQR]: 38–56%) of children with a fever (febrile) were taken to a trained medical provider for care. This includes public sector hospitals and clinics, formal private sector facilities and community health workers.
■ More febrile children sought care in the public sector (median: 34%, IQR: 28–44%) than in the private sector (median: 22%, IQR: 14–34%). However, the surveys from Africa also indicate that a high proportion of febrile children did not receive medical attention (median: 39%, IQR: 29–44%). Possible reasons include poor access to health-care providers or lack of awareness among caregivers.
Diagnosing malaria ■ Among 17 national-level surveys completed in sub-Saharan Africa between 2014 and 2016, the
proportion of children with a fever who received a finger or a heel stick – suggesting that a malaria diagnostic test may have been performed – was greater in the public sector (median: 52%, IQR: 34–59%) than in both the formal and informal private sector.
■ Testing of suspected cases in the public health system increased in most WHO regions since 2010. The WHO African Region recorded the biggest rise, with diagnostic testing in the public health sector increasing from 36% of suspected cases in 2010 to 87% in 2016.
WORLD MALARIA REPORT 2017xiv

Treating malaria ■ Among 18 household surveys conducted in sub-Saharan Africa between 2014 and 2016, the proportion
of children aged under 5 years with a fever who received any antimalarial drug was 41% (IQR: 21–49%). ■ A majority of patients (70%) who sought treatment for malaria in the public health sector received ACTs,
the most effective antimalarial drugs. Children are more likely to be given ACTs if medical care is sought at public health facilities than in the private sector.
■ To bridge the treatment gap among children, WHO recommends the uptake of integrated community case management (iCCM). This approach promotes integrated management of common life-threatening conditions in children – malaria, pneumonia and diarrhoea – at health facility and community levels. In 2016, 26 malaria-affected countries had iCCM policies in place, of which 24 had started implementing those policies. An evaluation from Uganda found that districts with iCCM experienced a 21% increase in care-seeking for fever compared with districts without an iCCM policy in place.
■ Outside the WHO African Region, only a handful of countries in each of the other regions reported having such policies in place, though data on the level of implementation are unavailable for most countries.
MALARIA SURVEILLANCE SYSTEMS
■ Effective surveillance of malaria cases and deaths is essential for identifying the areas or population groups that are most affected by malaria, and for targeting resources for maximum impact. A strong surveillance system requires high levels of access to care and case detection, and complete reporting by all health sectors, whether public or private.
■ In 2016, 37 out of 46 countries in the WHO African Region indicated that at least 80% of public health facilities had reported data on malaria through their national health information system. Rates vary within other WHO regions. For example, in the WHO Eastern Mediterranean Region, only three out of eight countries had 80% or more public health facilities reporting in 2016.
■ Among 55 countries where the burden of malaria was estimated, 31 countries have a malaria case reporting rate by surveillance systems of less than 50%. This includes the high-burden countries of India and Nigeria.
GLOBAL AND REGIONAL MALARIA TRENDS IN NUMBERS
Malaria cases ■ In 2016, an estimated 216 million cases of malaria occurred worldwide (95% confidence interval [CI]:
196–263 million), compared with 237 million cases in 2010 (95% CI: 218–278 million) and 211 million cases in 2015 (95% CI: 192–257 million).
■ Most malaria cases in 2016 were in the WHO African Region (90%), followed by the WHO South-East Asia Region (3%) and the WHO Eastern Mediterranean Region (2%).
■ Of the 91 countries reporting indigenous malaria cases in 2016, 15 countries – all in sub-Saharan Africa, except India – carried 80% of the global malaria burden.
■ The incidence rate of malaria is estimated to have decreased by 18% globally, from 76 to 63 cases per 1000 population at risk, between 2010 and 2016. The WHO South-East Asia Region recorded the largest decline (48%) followed by the WHO Region of the Americas (22%) and the WHO African Region (20%).
■ Despite these reductions, between 2014 and 2016, substantial increases in case incidence occurred in the WHO Region of the Americas, and marginally in the WHO South-East Asia, Western Pacific and African regions.
■ Plasmodium falciparum is the most prevalent malaria parasite in sub-Saharan Africa, accounting for 99% of estimated malaria cases in 2016. Outside of Africa, P. vivax is the predominant parasite in the WHO Region of the Americas, representing 64% of malaria cases, and is above 30% in the WHO South-East Asia and 40% in the Eastern Mediterranean regions.
■ New data from improved surveillance systems in several countries in the WHO African Region indicate that the number of malaria cases presented in this year’s report are conservative estimates. WHO will review its malaria burden estimation methods for sub-Saharan Africa in 2018.
WORLD MALARIA REPORT 2017 xv

Malaria deaths ■ In 2016, there were an estimated 445 000 deaths from malaria globally, compared to
446 000 estimated deaths in 2015. ■ The WHO African Region accounted for 91% of all malaria deaths in 2016, followed by the WHO South-
East Asia Region (6%). ■ Fifteen countries accounted for 80% of global malaria deaths in 2016; all of these countries are in
sub-Saharan Africa, except for India. ■ All regions recorded reductions in mortality in 2016 when compared with 2010, with the exception of
the WHO Eastern Mediterranean Region, where mortality rates remained virtually unchanged in the period. The largest decline occurred in the WHO regions of South-East Asia (44%), Africa (37%) and the Americas (27%).
■ However, between 2015 and 2016, mortality rates stalled in the WHO regions of South-East Asia, the Western Pacific and Africa, and increased in the Eastern Mediterranean and the Americas.
MALARIA ELIMINATION
■ Globally, more countries are moving towards elimination: in 2016, 44 countries reported fewer than 10 000 malaria cases, up from 37 countries in 2010.
■ Kyrgyzstan and Sri Lanka were certified by WHO as malaria free in 2016. ■ In 2016, WHO identified 21 countries with the potential to eliminate malaria by the year 2020. WHO
is working with the governments in these countries – known as “E-2020 countries” – to support their elimination acceleration goals.
■ Although some of E-2020 countries remain on track to achieve their elimination goals, 11 have reported increases in indigenous malaria cases since 2015, and five countries reported an increase of more than 100 cases in 2016 compared with 2015.
CHALLENGES TO ACHIEVING A MALARIA FREE WORLD
■ Some of the challenges impeding countries’ abilities to stay on track and advance towards elimination include lack of sustainable and predictable international and domestic funding, risks posed by conflict in malaria endemic zones, anomalous climate patterns, the emergence of parasite resistance to antimalarial medicines and mosquito resistance to insecticides.
■ WHO is supporting malaria emergency responses in Nigeria, South Sudan, Venezuela (Bolivarian Republic of) and Yemen, where ongoing humanitarian crises pose serious health risks. In Nigeria’s Borno State, WHO supported the launch of a mass antimalarial drug administration campaign that reached an estimated 1.2 million children aged under 5 years in targeted areas. Early results point to a reduction in malaria cases and deaths in this state.
Funding ■ In 34 out of 41 high-burden countries, which rely mainly on external funding for malaria program mes,
the average level of funding available per person at risk in the past 3 years (2014–2016) reduced when compared with 2011–2013. Exceptions were Democratic Republic of the Congo, Guinea, Mauritania, Mozambique, Niger, Pakistan and Senegal, which recorded increases.
■ Among the 41 high-burden countries, overall, funding per person at risk of malaria remains below US$ 2.
WORLD MALARIA REPORT 2017xvi

Histidine-rich protein 2 deletions ■ In some settings, increasing levels of histidine-rich protein 2 gene (HRP2) deletions threaten the ability
to diagnose and appropriately treat people infected with falciparum malaria. An absence of the HRP2 gene enables parasites to evade detection by HRP2-based RDTs, resulting in a false-negative test result. Although the prevalence of HRP2 gene deletions in most high-transmission countries remains low, further monitoring is required.
Drug resistance ■ ACTs have been integral to the recent success of global malaria control, and protecting their efficacy
for the treatment of malaria is a global health priority. ■ Although multidrug resistance, including artemisinin (partial) resistance and partner drug resistance,
has been reported in five countries of the Greater Mekong subregion (GMS), there has been a massive reduction in malaria cases and deaths in this subregion. Monitoring the efficacy of antimalarial drugs has led to timely treatment policy updates across the GMS.
■ In Africa, artemisinin (partial) resistance has not been reported to date and first-line ACTs remain efficacious in all malaria endemic settings.
Insecticide resistance ■ Of the 76 malaria endemic countries that provided data for 2010 to 2016, resistance to at least one
insecticide in one malaria vector from one collection site was detected in 61 countries. In 50 countries, resistance to two or more insecticide classes was reported.
■ In 2016, resistance to one or more insecticides was present in all WHO regions, although the extent of monitoring varied.
■ Resistance to pyrethroids – the only insecticide class currently used in ITNs – is widespread. The proportion of malaria endemic countries that monitored and subsequently reported pyrethroid resistance increased from 71% in 2010 to 81% in 2016. The prevalence of confirmed resistance to pyrethroids differed between regions, and was highest in the WHO African and Eastern Mediterranean regions, where it was detected in malaria vectors in over two thirds of all sites monitored.
■ ITNs continue to be an effective tool for malaria prevention, even in areas where mosquitoes have developed resistance to pyrethroids. This was evidenced in a large multicountry evaluation coordinated by WHO between 2011 and 2016, which did not find an association between malaria disease burden and pyrethroid resistance across study locations in five countries.
WORLD MALARIA REPORT 2017 xvii

Avant-propos
Dr Tedros Adhanom GhebreyesusDirecteur général de l’Organisation mondiale de la Santé (OMS)
Pendant plusieurs années, la lutte engagée au niveau mondial face au paludisme a été considérée comme l’une des réussites majeures en matière de santé publique. Maintes fois, l’OMS a fait état du déploiement massif des interventions préventives et thérapeutiques, et de la diminution impressionnante du nombre de cas de paludisme et de décès associés.
En décembre dernier, nous avions noté que la lutte antipaludique suivait une trajectoire inquiétante. En effet, les données indiquaient que moins de la moitié des pays d’endémie palustre étaient en passe d’atteindre les objectifs de baisse de la morbidité et de la mortalité liées au paludisme. Les progrès semblaient alors s’arrêter.
Le Rapport sur le paludisme dans le monde 2017 montre que cette trajectoire inquiétante se poursuit. Même si les données révèlent quelques points vraiment positifs, la baisse du poids du paludisme au niveau mondial s’est incontestablement ralentie. Par ailleurs, dans certaines régions et dans certains pays, la lutte contre cette maladie est même en recul.
Le poids du paludisme et les tendances au niveau mondial
En 2016, 216 millions de cas de paludisme ont été rapportés dans 91 pays au total, soit une augmentation de 5 millions par rapport à l’année précédente. Le nombre de décès associés a atteint 445 000, quasiment comme en 2015.
Même si l’incidence du paludisme a diminué au niveau mondial depuis 2010, cette tendance ralentit, voire s’inverse dans certaines régions depuis 2014, et l’évolution de la mortalité liée au paludisme est similaire.
La mortalité liée au paludisme a suivi la même tendance, à savoir une baisse de 2010 à 2014, puis une hausse en 2015 et 2016. D’après ce rapport, c’est dans la région Afrique de l’OMS que l’augmentation des cas de paludisme et des décès associés a été la plus significative.
La région Afrique concentre toujours quelque 90 % des cas de paludisme et des décès associés dans le monde. Quinze pays, tous en Afrique subsaharienne sauf un, représentent 80 % du poids du paludisme au niveau mondial. De toute évidence, pour corriger le tir et ramener la lutte contre le paludisme dans la bonne direction, notre priorité doit être d’aider les pays les plus durement touchés dans cette région.
La couverture sanitaire universelle
En tant que Directeur général de l’OMS, atteindre la couverture universelle des soins de santé est ma priorité. Cet objectif repose sur la conviction morale que toutes les personnes et toutes les
WORLD MALARIA REPORT 2017xviii

communautés doivent accéder à des services de santé de qualité, partout et à tout moment, indépendamment de leur lieu de résidence et situation financière.
À cet égard, où en sont les pays par rapport à la prestation de services de prévention, de dépistage et de traitement du paludisme pour tous ceux qui en ont besoin ? Même si des avancées considérables ont été réalisées sur cette voie, les progrès doivent nettement s’accentuer pour que nous puissions atteindre nos cibles mondiales pour 2020 et au-delà en matière de paludisme.
En 2016, à peine plus de la moitié (54 %) de la population exposée au risque de paludisme en Afrique subsaharienne dormait sous moustiquaire imprégnée d’insecticide, la principale mesure préventive. Ce taux de couverture est largement supérieur à celui de 2010, mais reste loin de l’objectif d’accès universel.
La pulvérisation intradomiciliaire d’insecticides à effet rémanent (PID) est une autre mesure importante de prévention du paludisme. Le présent rapport révèle néanmoins que la couverture en PID a diminué dans toutes les régions de l’OMS depuis 2010, et qu’elle est en chute libre dans la région Afrique.
Un diagnostic précoce et un traitement rapide sont les moyens les plus efficaces de prévenir l’aggravation des cas de paludisme et les décès associés. Dans la région Afrique de l’OMS, la plupart des personnes qui sollicitent des soins dans le secteur public reçoivent un diagnostic précis et un traitement efficace.
Néanmoins, l’accès au système de santé publique reste très limité. Des enquêtes nationales réalisées dans la région Afrique de l’OMS indiquent que seulement un tiers environ (34 %) des enfants fiévreux consultent un prestataire médical qualifié.
Un niveau d’investissement inadéquat
Un niveau d’investissement annuel de l’ordre de US$ 6,5 milliards au moins est requis d’ici à 2020 pour atteindre les cibles de la Stratégie technique mondiale de lutte contre le paludisme de l’OMS. Or, les US$ 2,7 milliards investis en 2016 représentent moins de la moitié de ce montant. Depuis 2014, les investissements dans le contrôle du paludisme ont, en moyenne, diminué dans de nombreux pays où le poids de la maladie est le plus lourd ; il s’agit là d’un élément très préoccupant.
La lutte contre le paludisme à la croisée des chemins
Le choix est clair à présent. Si nous continuons comme si de rien n’était, à savoir nous dégageons le même niveau de ressources et utilisons les mêmes interventions, le nombre de cas de paludisme et de décès associés augmentera à coup sûr.
Nous espérons que les pays et la communauté sanitaire mondiale choisiront une autre approche, laquelle permettra d’entraîner une augmentation des financements pour les programmes de lutte contre le paludisme, un accès plus étendu aux interventions efficaces et des investissements plus importants pour la recherche et le développement de nouveaux outils.
Comme je l’ai dit précédemment, les pays doivent être aux commandes. Ce sont eux qui, au bout du compte, sont seuls responsables de la santé de leurs citoyens. La couverture sanitaire universelle est en effet un choix politique qui demande du courage, de la compassion et une vision à long terme.
Après avoir combattu pendant de nombreuses années le fléau du paludisme en Éthiopie, je sais que nous sommes face à un adversaire coriace. Je reste cependant convaincu que nous pouvons gagner cette bataille. Avec des ressources financières adéquates et une direction politique forte, nous pouvons et nous allons repartir dans le bon sens, sur la voie d’un monde sans paludisme.
WORLD MALARIA REPORT 2017 xix

POINTS ESSENTIELS PAR CHAPITRE
Le rapport de cette année en un clin d’œil
> Le Rapport sur le paludisme dans le monde 2017 fournit un état des lieux complet des progrès réalisés au niveau mondial en matière de lutte contre le paludisme jusque fin 2016. Il suit les progrès dans les domaines suivants : investissements dans les programmes et la recherche antipaludiques ; prévention, diagnostic et traitement du paludisme ; surveillance ; morbidité et mortalité palustres ; élimination du paludisme et surveillance. Enfin, il fait état des problématiques qui menacent la lutte antipaludique et les investissements consentis à ce jour.
> Le rapport de cette année paraît un an après l’introduction i) de la Stratégie technique de lutte contre le paludisme 2016-2030 (GTS) et ses trois objectifs assortis d’échéances précises pour l’accélération des progrès vers le contrôle et l’élimination du paludisme, ii) du plan de plaidoyer Action et Investissement pour vaincre le paludisme 2016-2030 – pour un monde sans paludisme (AIM) élaboré par le Partenariat RBM, et iii) des Objectifs de développement durable (ODD) et la cible 3.3 visant à mettre fin à l’épidémie de sida, à la tuberculose, au paludisme et aux maladies tropicales négligées.
> Le GTS et l’AIM sont cohérents avec les ODD, avec des cibles définies pour 2020, 2025 et 2030 par rapport à un point de référence qui est 2015. Dans le domaine du paludisme, l’atteinte de la cible 3.3. des ODD d’ici 2030 est interprétée comme la réalisation des cibles du GTS et de l’AIM.
> Les principales sources d’informations pour cette édition 2017 sont les rapports émanant de 94 pays. Ces informations sont complétées par des données issues d’enquêtes nationales réalisées auprès des ménages et des bases de données d’autres organisations partenaires.
WORLD MALARIA REPORT 2017xx

INVESTISSEMENTS DANS LES PROGRAMMES ET LA RECHERCHE ANTIPALUDIQUES
Investissements dans le contrôle et l’élimination du paludisme ■ En 2016, US$ 2,7 milliards ont été investis par les gouvernements des pays endémiques et les partenaires
internationaux pour le contrôle et l’élimination du paludisme. ■ En 2016, la majorité (74 %) des investissements ont été dirigés vers la région Afrique de l’OMS, suivie
par les régions Asie du Sud-Est (7 %), Méditerranée orientale et Amériques (6 % chacune), et Pacifique occidental (4 %).
■ En 2016, les gouvernements des pays endémiques sont à l’origine de 31 % du financement total (US$ 800 millions).
■ Les États-Unis ont été le premier bailleur de fonds international pour les programmes de lutte contre le paludisme en 2016 avec US$ 1 milliard investis (38 % du total), suivis d’autres bailleurs de fonds internationaux, notamment la France, l’Allemagne et le Japon.
■ En 2016, plus de la moitié (57 %) des ressources financières ont transité par le Fonds mondial de lutte contre le sida, la tuberculose et le paludisme (Fonds mondial).
Perspectives d’investissement ■ Même si le financement de la lutte contre le paludisme est relativement stable depuis 2010,
l’investissement de 2016 est loin d’atteindre le niveau requis pour réaliser le premier objectif intermédiaire du GTS, à savoir réduire d’au moins 40 % l’incidence du paludisme et la mortalité associée au plan mondial par rapport à 2015.
■ Pour atteindre cet objectif, le GTS a estimé que les financements devaient passer à US$ 6,5 milliards par an d’ici 2020. Les US$ 2,7 milliards investis pour lutter contre le paludisme en 2016 représentent moins de la moitié (41 %) de ce montant.
■ Pour réaliser les objectifs du GTS, il est essentiel d’augmenter les investissements dans la recherche et le développement sur le paludisme. En 2015, US$ 572 millions ont été dépensés dans ce domaine, soit 83 % des besoins annuels estimés.
Livraison de produits antipaludiquesMoustiquaires imprégnées d’insecticide
■ Les fabricants de moustiquaires imprégnées d’insecticide (MII) ont indiqué en avoir livré 582 millions dans le monde entre 2014 et 2016.
■ À elle seule, l’Afrique subsaharienne en a reçu 505 millions, par rapport à 301 millions sur la précédente période de trois ans (2011-2013).
■ En Afrique, les données issues des programmes nationaux de lutte contre le paludisme (PNLP) indiquent qu’entre 2014 et 2016, 75 % des MII ont été distribuées par le biais des campagnes de distribution de masse.
Tests de diagnostic rapide ■ En 2016, 312 millions de tests de diagnostic rapide (TDR) ont été livrés dans le monde, dont 269 millions
dans la région Afrique de l’OMS. ■ Le nombre de TDR distribués par les PNLP a augmenté entre 2010 et 2015, mais a baissé entre 2015
et 2016, passant de 247 à 221 millions. Cette diminution est uniquement causée par la baisse des livraisons en Afrique subsaharienne sur cette période, de 219 millions de TDR en 2015 à 177 millions en 2016.
Combinaisons thérapeutiques à base d’artémisinine ■ En 2016, les pays ont acheté 409 millions de traitements par combinaison thérapeutique à base
d’artémisinine (ACT), contre 311 millions en 2015. Plus de 69 % de ces achats auraient été effectués pour le secteur public.
■ Le nombre de traitements par ACT distribués par les PNLP au secteur public a augmenté de 192 millions en 2013 à 198 millions en 2016. Quasiment tous (99 %) les ACT distribués l’ont été dans la région Afrique de l’OMS.
WORLD MALARIA REPORT 2017 xxi
PRÉVENTION DU PALUDISME
Lutte antivectorielle ■ En Afrique subsaharienne, le pourcentage des ménages ayant au moins une MII a augmenté, passant
de 50 % en 2010 à 80 % en 2016. Néanmoins, la part des ménages ayant un nombre de MII suffisant (une MII pour deux membres du foyer) est encore trop faible (43 %) en 2016.
■ En Afrique, la population à risque est plus nombreuse à dormir sous MII. En 2016, la part de la population protégée par cette intervention était de 54 %, contre 30 % en 2010.
■ La part de la population à risque protégée par pulvérisation intradomiciliaire d’insecticides à effet rémanent (PID), une mesure préventive qui consiste à pulvériser d’insecticides les murs intérieurs des habitations, a diminué. Au niveau mondial, le taux de couverture de cette intervention a baissé, d’un pic de 5,8 % en 2010 à 2,9 % en 2016, et cette tendance a été observée dans toutes les régions de l’OMS. Dans la région Afrique, la population à risque protégée par PID est passé de 80 millions en 2010 à 45 millions en 2016.
■ Le taux de couverture en PID diminue dès lors que les pays changent de classe d’insecticides pour utiliser des produits moins onéreux.
Traitements préventifs ■ En Afrique, pour protéger les femmes vivant dans des zones de transmission modérée à élevée,
l’OMS recommande le traitement préventif intermittent pendant la grossesse (TPIp) par sulfadoxine-pyriméthamine. Sur 23 pays africains ayant communiqué des données de couverture en TPIp en 2016, 19 % des femmes enceintes éligibles avaient reçu au moins trois doses de TPIp (comme recommandé par l’OMS), contre 18 % en 2015 et 13 % en 2014.
■ En 2016, 15 millions d’enfants vivant dans 12 pays d’Afrique sahélienne ont été protégés par des programmes de chimioprévention du paludisme saisonnier (CPS). Cependant, quelque 13 millions d’enfants qui auraient pu bénéficier de cette intervention n’ont pas été couverts, principalement à cause d’un manque de financements. Depuis 2012, la CPS est recommandée par l’OMS pour les enfants âgés de 3 à 59 mois vivant dans des zones de cette sous-région où la transmission du paludisme a un caractère fortement saisonnier.
DIAGNOSTIC ET TRAITEMENT
Accès aux soins ■ Un diagnostic précoce et un traitement rapide sont les moyens les plus efficaces de prévenir
l’aggravation des cas de paludisme et les décès associés. D’après les enquêtes nationales réalisées dans 18 pays d’Afrique subsaharienne entre 2014 et 2016 (représentant 61 % de la population à risque), une médiane de 47 % (écart interquartile [ÉI] : 38 %-56 %) des enfants ayant eu de la fièvre ont sollicité des soins auprès d’un prestataire formé, à savoir qu’ils se sont rendus dans un hôpital ou une clinique du secteur public, un établissement privé formel ou ont consulté un agent de santé communautaire.
■ Les enfants ayant eu de la fièvre et ayant sollicité des soins ont été plus nombreux à se rendre dans un établissement public (médiane de 34 %, ÉI : 28 %-44 %) que dans un établissement privé (médiane de 22 %, ÉI : 14 %-34 %). Toutefois, les enquêtes réalisées en Afrique indiquent également qu’une part importante des enfants n’ont pas reçu de soins médicaux (médiane de 39 %, ÉI : 29 %-44 %), ce qui s’explique peut-être par un accès limité aux prestataires de santé ou par un manque de connaissances de la part du personnel soignant.
Diagnostic ■ Sur 17 enquêtes nationales réalisées en Afrique subsaharienne entre 2014 et 2016, la part des enfants
fiévreux ayant subi un prélèvement sanguin au doigt ou au talon (laissant penser qu’un test de dépistage du paludisme a été réalisé) a été plus élevée dans le secteur public (médiane de 52 %, ÉI : 34 %-59 %) que dans le secteur privé formel et informel.
■ Le dépistage des cas suspectés de paludisme a augmenté dans le secteur public depuis 2010 et ce, dans la plupart des régions de l’OMS. La hausse la plus prononcée est observée dans la région Afrique de l’OMS, avec un taux de dépistage passé de 36 % en 2010 à 87 % en 2016.
WORLD MALARIA REPORT 2017xxii

Traitement ■ Sur 18 enquêtes nationales réalisées en Afrique subsaharienne auprès des ménages entre 2014 et 2016,
le pourcentage d’enfants de moins de 5 ans, fiévreux et ayant reçu un médicament antipaludique, a atteint 41 % (ÉI : 21 %-49 %).
■ La majorité des patients (70 %) ayant sollicité un traitement antipaludique dans le secteur public ont reçu un ACT, le médicament le plus efficace. Lorsque les soins sont sollicités dans un établissement public, les enfants sont plus susceptibles de recevoir un traitement antipaludique par ACT que lorsqu’ils sont orientés vers le secteur privé.
■ Pour combler les écarts de traitement parmi les enfants, l’OMS recommande la prise en charge intégrée des cas dans la communauté (PEC-C). Cette approche favorise la gestion intégrée des causes de mortalité infantile, à savoir paludisme, pneumonie et diarrhée, au niveau des établissements de santé et de la communauté. En 2016, 26 pays d’endémie palustre avaient des politiques de PEC-C en place, et leur mise en œuvre avait commencé dans 24 d’entre eux. D’après une évaluation réalisée en Ouganda, les districts où la PEC-C est en place enregistrent des taux de sollicitation des soins en cas de fièvre 21 % plus élevés qu’ailleurs.
■ En dehors de la région Afrique de l’OMS, seuls quelques pays dans chacune des autres régions ont indiqué avoir cette politique en place. Les données quant à leur niveau de mise en œuvre ne sont cependant pas disponibles pour la plupart de ces pays.
SYSTÈMES DE SURVEILLANCE DU PALUDISME
■ Des systèmes efficaces pour la surveillance des cas de paludisme et des décès associés sont essentiels pour identifier les groupes de population ou les zones les plus touché(e)s par le paludisme et pour cibler les ressources en vue d’un impact optimal. Un système de surveillance solide requiert des niveaux élevés d’accès aux soins et au dépistage des cas, et présuppose que les secteurs public et privé de la santé communiquent des rapports exhaustifs.
■ En 2016, 37 des 46 pays de la région Afrique ont indiqué qu’au moins 80 % des établissements publics avaient rapporté des données sur le paludisme par le biais de leur système national d’information sanitaire. Ce pourcentage est variable au sein des différentes régions : par exemple, il n’est supérieur ou égal à 80 % que dans seulement trois des huit pays de la région Méditerranée orientale de l’OMS en 2016.
■ Sur les 55 pays pour lesquels le poids du paludisme a fait l’objet d’une estimation, 31 ont un taux de déclaration des cas par les systèmes de surveillance inférieur à 50 %. Parmi eux on retrouve deux pays où le paludisme pèse lourdement : l’Inde et le Nigéria.
CHIFFRES SUR L’ÉVOLUTION DU PALUDISME AU NIVEAU RÉGIONAL ET MONDIAL
Cas de paludisme ■ Au niveau mondial, le nombre de cas de paludisme est estimé à 216 millions en 2016 (intervalle de
confiance [IC] de 95 % : 196-263 millions), contre 237 millions en 2010 (IC de 95 % : 218-278 millions) et 211 millions en 2015 (IC de 95 % : 192-257 millions).
■ La plupart des cas (90 %) ont été enregistrés dans la région Afrique de l’OMS, loin devant la région Asie du Sud-Est (3 %) et la région Méditerranée orientale (2 %).
■ Sur les 91 pays ayant rapporté des cas de paludisme indigène en 2016, 15 représentent 80 % du nombre de cas de paludisme dans le monde et tous, sauf l’Inde, sont en Afrique subsaharienne.
■ Au niveau mondial, l’incidence du paludisme est estimée en baisse de 18 % ; elle passe en effet de 76 cas de paludisme pour 1 000 habitants exposés au risque de paludisme en 2010 à 63 pour 1 000 en 2016. La région Asie du Sud-Est de l’OMS enregistre la baisse la plus prononcée (48 %), suivie des régions Amériques (22 %) et Afrique (20 %).
■ En dépit de ces progrès, l’incidence du paludisme a augmenté de façon significative entre 2014 et 2016 dans la région Amériques de l’OMS, et de manière plus marginale, dans les régions Afrique, Asie du Sud-Est et Pacifique occidental de l’OMS.
WORLD MALARIA REPORT 2017 xxiii

■ P. falciparum est le parasite du paludisme le plus prévalent en Afrique subsaharienne ; il est en effet à l’origine de 99 % des cas de paludisme estimés en 2016. Hors Afrique, P. vivax prédomine dans la région Amériques (64 % des cas) de l’OMS, et représente plus de 30 % des cas dans la région Méditerranée orientale et plus de 40 % dans la région Asie du Sud-Est de l’OMS.
■ Les nouvelles données issues des systèmes de surveillance améliorés dans plusieurs pays d’Afrique subsaharienne laissent apparaître que le nombre de cas de paludisme, tel qu’indiqué dans le présent rapport, reflète une estimation conservatrice. En 2018, l’OMS reverra ses méthodes d’estimation du poids du paludisme en Afrique subsaharienne.
Mortalité associée ■ Au niveau mondial, le nombre de décès dus au paludisme a été estimé à 445 000, contre 446 000 en
2015. ■ En 2016, la plupart de ces décès sont survenus dans la région Afrique (91 %) de l’OMS, loin devant la
région Asie du Sud-Est (6 %). ■ L’an passé, 80 % des décès dus au paludisme dans le monde ont été concentrés dans 15 pays et tous,
sauf l’Inde, sont en Afrique subsaharienne. ■ Par rapport à 2010, la mortalité liée au paludisme diminue dans toutes les régions de l’OMS en 2016,
sauf dans la région Méditerranée orientale où elle demeure quasiment inchangée. Les baisses les plus prononcées ont été observées dans les régions Asie du Sud-Est (44 %), Afrique (37 %) et Amériques (27 %).
■ Toutefois, entre 2015 et 2016, la baisse de la mortalité liée au paludisme a connu un coup d’arrêt dans les régions Asie du Sud-Est, Pacifique occidental et Afrique, et elle a augmenté dans les régions Amériques et Méditerranée orientale.
ÉLIMINATION DU PALUDISME
■ Au niveau mondial, les pays qui avancent sur la voie de l’élimination sont plus nombreux : en 2016, 44 pays ont rapporté moins de 10 000 cas de paludisme, contre 37 en 2010.
■ En 2016, le Kirghizistan et le Sri Lanka ont été certifiés exempts de paludisme par l’OMS. ■ En 2016, l’OMS a identifié 21 pays ayant le potentiel pour éliminer le paludisme d’ici 2020. L’OMS
travaille avec les gouvernements de ces pays « E-2020 » pour les aider à atteindre leurs objectifs d’élimination.
■ Même si certains de ces pays restent sur la bonne voie pour atteindre leurs objectifs d’élimination du paludisme, 11 ont rapporté une augmentation des cas de paludisme indigène depuis 2015 et 5 ont recensé une augmentation de plus de 100 cas en 2016 par rapport à 2015.
DÉFIS SUR LA VOIE D’UN MONDE SANS PALUDISME
■ Certaines des problématiques empêchant les pays d’avancer sur la voie de l’élimination sont, en particulier, le manque de financements nationaux et internationaux durables et prévisibles, les risques liés aux conflits dans les zones d’endémie, les schémas climatiques anormaux, l’émergence de la résistance du parasite aux médicaments antipaludiques et la résistance du moustique aux insecticides.
■ L’OMS apporte son soutien aux opérations d’urgence au Nigéria, Soudan du Sud, Venezuela (République bolivarienne du) et Yémen, là où les crises humanitaires posent de sérieux problèmes sanitaires. Dans l’état de Borno au Nigéria, l’OMS a contribué au lancement d’une campagne d’administration de masse de médicaments auprès de quelque 1,2 million d’enfants de moins de 5 ans dans les zones ciblées. Des résultats préliminaires laissent supposer une réduction du nombre de cas et de décès dans cet état.
WORLD MALARIA REPORT 2017xxiv

Financement ■ Dans 34 des 41 pays où le paludisme sévit le plus, lesquels dépendent en grande partie des financements
externes pour leurs programmes de lutte contre le paludisme, le niveau moyen de financement disponible par personne à risque au cours des trois dernières années (2014 à 2016) a diminué par rapport à la période 2011-2013. Les exceptions sont la Guinée, la Mauritanie, le Mozambique, le Niger, le Pakistan, la République démocratique du Congo et le Sénégal qui ont enregistré des augmentations.
■ Dans l’ensemble des 41 pays où le paludisme sévit le plus, le financement par personne à risque reste en deçà de US$ 2.
Suppression de la protéine riche en histidine 2 ■ Dans certaines zones, des niveaux croissants de suppression de la protéine riche en histidine 2 (HRP2)
menacent la capacité à dépister et à traiter de manière appropriée les personnes infectées par le parasite P. falciparum. Le gène HRP2 manquant permet au parasite d’échapper au dépistage par un TDR courant, ce qui produit un faux résultat de test négatif. Même si la prévalence de la suppression du gène HRP2 reste faible dans la plupart des zones à forte transmission, un renforcement du suivi est nécessaire.
Résistance aux antipaludiques ■ Les ACT ont un rôle important dans le succès de la lutte contre le paludisme au niveau mondial, et
protéger leur efficacité de traitement est une priorité mondiale en matière de santé. ■ Même si la multirésistance, qui inclut la résistance (partielle) aux artémisinines et aux médicaments
partenaires, a été détectée dans cinq pays de la sous-région du Grand Mékong, on a pu observer une réduction massive du nombre de cas de paludisme et de décès associés dans cette sous-région. La surveillance de l’efficacité des médicaments antipaludiques a permis une mise à jour rapide des politiques de traitement dans la sous-région.
■ En Afrique, aucune résistance (partielle) aux artémisinines n’a été rapportée à ce jour, et les ACT de première ligne restent efficaces dans toutes les zones d’endémie palustre.
Résistance aux insecticides ■ Sur les 76 pays d’endémie palustre ayant fourni des données pour la période 2010-2016, la résistance à
au moins un insecticide chez l’un des vecteurs du paludisme sur un site de collecte a été détectée dans 61 pays. Dans 50 pays, la résistance a été rapportée à au moins deux classes d’insecticides.
■ En 2016, la résistance à au moins un insecticide a été observée dans toutes les régions de l’OMS, malgré des niveaux de suivi variables d’une région à l’autre.
■ La résistance aux pyréthoïdes, la seule classe d’insecticides actuellement utilisés dans les MII, est étendue. La part des pays d’endémie palustre ayant effectué un suivi et rapporté une résistance aux pyréthoïdes a augmenté de 71 % en 2010 à 81 % en 2016. La prévalence d’une résistance confirmée aux pyréthoïdes diffère d’une région à l’autre ; elle est ainsi plus élevée dans les régions Afrique et Méditerranée orientale là où elle a été détectée chez les vecteurs du paludisme sur les deux tiers des sites suivis.
■ Les MII restent efficaces pour la prévention du paludisme, même dans les zones où les moustiques ont développé une résistance aux pyréthoïdes. Il s’agit là du résultat d’une large évaluation coordonnée par l’OMS dans plusieurs pays entre 2011 et 2016, et n'ayant établi d'association entre poids du paludisme et résistance aux pyréthoïdes sur aucun site d’essai dans cinq pays.
WORLD MALARIA REPORT 2017 xxv

Prefacio
Dr Tedros Adhanom GhebreyesusDirector GeneralOrganización Mundial de la Salud
Durante muchos años, la respuesta mundial al paludismo fue considerada uno de los grandes logros mundiales de la salud pública. La OMS informó una y otra vez sobre la distribución masiva de herramientas efectivas para cortar con la enfermedad y sobre reducciones impresionantes en casos y muertes.
En diciembre pasado, notamos un cambio preocupante en la trayectoria de esta enfermedad. Los datos mostraron que menos de la mitad de los países con transmisión continua, estaban en camino de alcanzar los objetivos críticos para la reducción en muertes y casos causados por el paludismo. El progreso parecía haberse estancado.
El Informe Mundial sobre el Paludismo de 2017 muestra que esta preocupante tendencia continúa. Si bien hay algunas excepciones, la tendencia general de disminución de la carga mundial del paludismo se ha estancado sin lugar a dudas. Y, en algunos países y regiones, estamos comenzando a ver retrocesos en los logros.
Carga y tendencias globales de la enfermedad
En 2016, 91 países reportaron un total de 216 millones de casos de paludismo, un incremento de 5 millones de casos con relación al año anterior. El total de muertes a nivel global llegó a 445 000, similar a lo reportado en 2015.
Si bien la incidencia de casos de paludismo ha disminuido a nivel mundial desde 2010, la tasa de disminución se ha estancado e incluso revertido en algunas regiones desde 2014. Las tasas de mortalidad han seguido un patrón similar.
La Región de África continúa representando alrededor del 90% de los casos de paludismo y muertes en todo el mundo. Quince países, todos menos uno en el África subsahariana, tienen el 80% de la carga mundial de paludismo. Claramente, si queremos volver a encarrilar la respuesta mundial al paludismo, nuestro foco principal debe ser respaldar a los países más gravemente afectados en esta región.
Extender la atención médica a todos
Como Director General de la OMS, lograr la cobertura universal en salud es mi principal prioridad. Esto se basa en la convicción moral de que se debe garantizar a todas las personas el acceso a los servicios de salud que necesitan, cuando y donde los necesiten, independientemente de dónde vivan o de su situación financiera.
WORLD MALARIA REPORT 2017xxvi

Con este fin, ¿cómo han avanzado los países en la prestación de servicios para prevenir, diagnosticar y tratar el paludismo a todos los que lo necesitan? Si bien hemos avanzado mucho, el ritmo del progreso debe acelerarse enormemente si queremos alcanzar nuestros objetivos mundiales contra el paludismo para 2020 y posteriormente.
En 2016, poco más de la mitad (54%) de las personas en riesgo de contraer paludismo en el África subsahariana dormían bajo un mosquitero tratado con insecticida, el método principal de prevención. Este nivel de cobertura representa un aumento considerable desde 2010, pero está lejos del objetivo de acceso universal.
Rociar las paredes interiores de las casas con insecticidas (RRI) es otra medida de prevención importante. El informe documenta una caída precipitada en la cobertura del RRI en la región de África desde 2010, así como una disminución en todas las demás regiones de la OMS en este mismo período.
El diagnóstico y el tratamiento oportunos son los medios más eficaces para prevenir que un caso leve de paludismo se convierta en una enfermedad grave y en la muerte. En la región de África de la OMS, la mayoría de las personas que buscan tratamiento para el paludismo en el sistema de salud pública reciben un diagnóstico preciso y medicamentos efectivos.
Sin embargo, el acceso al sistema de salud pública sigue siendo demasiado bajo. Las encuestas a nivel nacional en la región de África de la OMS muestran que solo alrededor de un tercio (34%) de los niños con fiebre son llevados a un proveedor médico en este sector.
Inversión inadecuada
Se requerirá una inversión mínima de 6,5 mil millones de dólares anuales para 2020 a fin de cumplir los objetivos 2030 de la estrategia mundial de la OMS contra el paludismo. Los US $ 2,7 mil millones invertidos en 2016 representan menos de la mitad de esa cantidad. De particular preocupación: desde 2014, las inversiones en control del paludismo han disminuido, en promedio, en muchos países de alta carga.
Respuesta al paludismo en una encrucijada
La elección que tenemos ante nosotros es clara. Si continuamos con un enfoque de "negocios normales", empleando el mismo nivel de recursos y las mismas intervenciones, tendremos que enfrentar aumentos en los casos de paludismo y muertes.
Es nuestra esperanza que los países y la comunidad de salud global elijan otro enfoque, lo que resultará en un impulso en el financiamiento de los programas contra el paludismo, un mayor acceso a intervenciones efectivas y una mayor inversión en investigación y en desarrollo de nuevas herramientas.
Como he dicho antes, los países deben estar en el asiento del conductor; ellos son los últimos responsables de la salud de sus ciudadanos. La cobertura universal de salud es de hecho una opción política, una que requiere coraje, compasión y visión a largo plazo.
Después de pasar muchos años luchando contra el flagelo del paludismo en Etiopía, sé que nos enfrentamos a un adversario duro. Pero también estoy convencido de que esta es una batalla que se puede ganar. Con sólidos recursos financieros y liderazgo político, podemos, y lo haremos, volver el péndulo hacia un mundo libre de paludismo.
WORLD MALARIA REPORT 2017 xxvii

PUNTOS CLAVE POR CAPITULO
El informe de este año de un vistazo
> El Informe Mundial sobre el Paludismo de 2017 presenta el estado actual del progreso global en la lucha contra el paludismo hasta el final de 2016. Hace un seguimiento del progreso de las inversiones en los programas y de las investigaciones sobre el paludismo; su prevención; diagnóstico y tratamiento; vigilancia; tendencias en la carga de la enfermedad; eliminación del paludismo y amenazas para enfrentar esta enfermedad y salvaguardar las inversiones realizadas.
> El informe de este año llega un año después del lanzamiento de tres hitos, con plazos definidos, para acelerar el progreso hacia el control y la eliminación del paludismo: la Estrategia Técnica Mundial contra la Malaria 2016–2030 (ETM) de la OMS, el plan de acción para Hacer Retroceder el Paludismo, Acción e Inversión para derrotar el Paludismo 2016-2030 (AIP) y los Objetivos de Desarrollo Sostenible (ODS) con la meta 3.3 centrada en el SIDA, la tuberculosis, el paludismo y las enfermedades tropicales desatendidas.
> El ETM y el AIP están alineados con los ODS, con los objetivos establecidos para los años 2020, 2025 y 2030, tomando como referencia el 2015. Para el paludismo, lograr el objetivo 3.3 de los ODS en 2030 se interpreta como el logro de los objetivos de la ETM y el AIP.
> Las principales fuentes de información para la edición de este año son los informes de 94 países. Esta información se complementa con datos de encuestas de hogares representativas a nivel nacional y bases de datos de otras organizaciones asociadas.
WORLD MALARIA REPORT 2017xxviii

INVERSIONES EN LOS PROGRAMAS DE PALUDISMO E INVESTIGACIÓN
Inversiones para el control y eliminación del paludismo ■ En 2016, los gobiernos de países con paludismo endémico y socios internacionales invirtieron
aproximadamente 2,7 mil millones de dólares estadounidenses para el control de paludismo y esfuerzos de eliminación a nivel mundial.
■ La mayoría de los recursos (74%) se invirtieron, en 2016, en la región de África de la OMS, seguido por la región de Asia Sudoriental (7%), el Mediterráneo Oriental y la región de las Américas (cada uno con 6%) y el Pacifico Occidental (4%).
■ Los gobiernos de países endémicos proporcionaron el 31% del financiamiento total (US $ 800 millones) en 2016.
■ Los Estados Unidos de América (EE. UU.) fueron el principal financiador internacional en 2016, aportando mil millones de dólares estadounidenses (38%), seguidos por el Reino Unido de Gran Bretaña e Irlanda del Norte (Reino Unido), y otros socios internacionales, incluyendo a Francia, Alemania y Japón.
■ Más de la mitad (57%) de los recursos en 2016 se canalizaron a través del Fondo Mundial de Lucha contra el SIDA, la Tuberculosis y el Paludismo (Fondo Mundial).
Perspectiva de inversión ■ Si bien la financiación para el paludismo se ha mantenido relativamente estable desde 2010, el nivel
de inversión en 2016 está lejos de lo requerido para alcanzar el primer hito del EMT, que es lograr una reducción del 40% en la incidencia de casos y mortalidad por paludismo a nivel mundial en comparación con 2015.
■ Para alcanzar este hito, el EMT estimó que la financiación anual tendría que aumentar a 6.500 millones de dólares estadounidenses por año para 2020. Los 2.700 millones de dólares invertidos en paludismo en 2016 representan menos de la mitad (41%) de esa cantidad.
■ Intensificar las inversiones en investigación del paludismo y desarrollo es clave para lograr el EMT. En 2015, se gastaron US $ 572 millones en esta área, lo que representa el 83% del estimado anual necesario para investigación y desarrollo.
Entrega de productos básicos para el paludismoMosquiteros tratados con insecticida
■ Entre 2014 y 2016, los fabricantes informaron de que un total de 582 millones de mosquiteros tratados con insecticida (MTI) han sido entregados en todo el mundo.
■ De esta cantidad, se entregaron 505 millones de MTI en el África subsahariana, en comparación con 301 millones de mosquiteros durante los tres años anteriores (2011-2013).
■ Los datos de los programas nacionales de control del paludismo (PNCP) en África indican que entre 2014 y 2016, el 75% de los MTI se distribuyeron a través de campañas de distribución masiva.
Pruebas de diagnóstico rápido ■ Un estimado de 312 millones de pruebas de diagnóstico rápido (PDR) se entregaron a nivel mundial en
2016. De éstos, 269 millones se entregaron en la región de África de la OMS. ■ El número de PDR distribuidas por los PNCP aumentó entre 2010 y 2015, pero disminuyó de 247 millones
en 2015 a 221 millones en 2016. La disminución se produjo completamente en el África subsahariana, donde las distribución disminuyó de 219 millones a 177 millones de PDR durante el período 2015 -2016.
Terapia combinada basada en artemisinina ■ Un estimado de 409 millones de tratamientos de terapia combinada basada en artemisinina (TCA)
fueron adquiridos por los países en 2016, un aumento comparado con 311 millones en 2015. Se informó que más del 69% de estas adquisiciones se hicieron por el sector público.
■ El número de tratamientos de TCA distribuidos por los PNCP al sector público aumentó de 192 millones en 2013 a 198 millones en 2016. La mayoría de las distribuciones de TCA (99%) por los PNCP en 2016 ocurrieron en la región de África de la OMS.
WORLD MALARIA REPORT 2017 xxix

PREVENCIÓN DEL PALUDISMO
Control de vectores ■ En el África subsahariana, las viviendas con al menos un MTI aumentó del 50% en 2010 al 80% en 2016.
Sin embargo, la proporción de viviendas con mosquiteros suficientes (un mosquitero por cada dos personas) sigue siendo inadecuado, 43% en 2016.
■ Más personas en riesgo de paludismo en África están durmiendo bajo un MTI. En 2016, el 54% de la población estaba protegida por esta intervención, aumentando del 30% en 2010.
■ Menos personas en riesgo de paludismo están siendo protegidas por el rociamiento residual intradomiciliar (RRI), un método de prevención que consiste en rociar con insecticidas las paredes interiores de las viviendas. A nivel mundial, la protección con RRI disminuyó de un pico del 5,8% en 2010 al 2,9% en 2016, con disminuciones en todas las regiones de la OMS. En la región de África de la OMS, la cobertura disminuyó de 80 millones de personas protegidas en 2010 a 45 millones en 2016.
■ Las reducciones en la cobertura del RRI ocurren a medida que los países cambian o rotan la clase de insecticidas a químicos más caros.
Terapias preventivas ■ Para proteger a las mujeres en áreas de transmisión alta y moderada de paludismo en África, la
OMS recomienda “tratamiento preventivo intermitente en el embarazo” (TPI) con el medicamento antipalúdico sulfadoxina-pirimetamina. Entre los 23 países africanos que informaron niveles de cobertura de TPI en 2016, se estima que el 19% de las mujeres embarazadas elegibles recibieron las tres o más dosis recomendadas de TPI, en comparación con el 18% en 2015 y el 13% en 2014.
■ En 2016, 15 millones de niños de 12 países de la subregión del Sahel en África fueron protegidos mediante programas de quimio-prevención estacional del paludismo (QEP). Sin embargo, alrededor de 13 millones de niños que podrían haberse beneficiado de esta intervención no se cubrieron, principalmente debido a la falta de fondos. Desde 2012, QEP ha sido recomendado por la OMS para niños de entre 3 y 59 meses que viven en áreas de transmisión altamente estacional de paludismo en esta subregión.
DIAGNÓSTICO Y TRATAMIENTO
Acceso a la atención ■ El diagnóstico y el tratamiento oportunos son los medios más eficaces para prevenir que un caso
leve de paludismo se convierta en una enfermedad grave y en la muerte. Entre las encuestas a nivel nacional realizadas en 18 países del África subsahariana entre 2014 y 2016 (que representan el 61% de la población en riesgo), una mediana del 47% (Rango Intercuartil (RI): 38-56%) de niños con fiebre (febriles) fueron llevados a un proveedor de atención médica capacitado para su cuidado. Esto incluye hospitales y clínicas del sector público, instalaciones formales del sector privado y trabajadores de salud comunitarios.
■ Más niños febriles buscaron atención en el sector público (mediana: 34%, RI: 28-44%) que en el sector privado (mediana: 22%, RI: 14-34%). Sin embargo, las encuestas de África también indican que una alta proporción de niños febriles no recibió atención médica (mediana: 39%; RI: 29-44%). Las posibles razones incluyen acceso deficiente a los prestadores de servicios de salud o la falta de conciencia entre los cuidadores.
Diagnóstico del paludismo ■ En 17 encuestas a nivel nacional realizadas en África subsahariana entre 2014 y 2016, la proporción de
niños con fiebre que recibieron punción digital o de talón, lo que sugiere que se pudo haber realizado una prueba diagnóstica de paludismo, fue mayor en el sector público (mediana: 52%, RI: 34-59%) que en el sector privado formal e informal.
■ Las pruebas diagnósticas en casos sospechosos en el sistema de salud pública aumentaron en la mayoría de las regiones de la OMS desde 2010. La región de África registró el mayor aumento, con pruebas diagnósticas en el sector de salud pública que aumentaron del 36% en casos sospechosos en 2010 al 81% en 2015.
WORLD MALARIA REPORT 2017xxx

Tratamiento del paludismo ■ En 18 encuestas de hogares realizadas en África subsahariana entre 2014 y 2016, la proporción de
niños menores de cinco años con fiebre que recibieron algún medicamento antipalúdico fue del 41% (RI: 21-49%).
■ La mayoría de los pacientes (70%) que buscaron tratamiento para el paludismo en el sector público recibieron TCA, que son los medicamentos antipalúdicos más efectivos. Es más probable que los niños reciban TCA si se busca atención médica en centros de salud públicos que en el sector privado.
■ Para cerrar la brecha de tratamiento entre los niños, la OMS recomienda la adopción del manejo integrado de casos comunitarios (MICC). Este enfoque promueve el manejo integrado de afecciones comunes que amenazan la vida en los niños (paludismo, neumonía y diarrea) en los establecimientos de salud y a nivel comunitario. En 2016, 26 países afectados por el paludismo tenían políticas de MICC, de los cuales en 24 comenzaron a implementarse. Una evaluación en Uganda descubrió que los distritos con MICC experimentaron un aumento del 21% en la búsqueda de atención por fiebre en comparación con los distritos sin una política de MICC.
■ Fuera de la Región de África de la OMS, solo un puñado de países en cada una de las otras regiones informaron haber implementado tales políticas, aunque los datos sobre el nivel de implementación no están disponibles para la mayoría de los países.
SISTEMAS DE VIGILANCIA DEL PALUDISMO
■ La vigilancia efectiva de casos y muertes por paludismo es esencial para identificar las áreas o grupos de población que se ven más afectados por esta enfermedad, y para focalizar los recursos y lograr un impacto máximo. Un sistema de vigilancia fuerte requiere altos niveles de acceso a la atención y detección de casos, y un informe completo por parte de todos los sectores de la salud, públicos y privados.
■ En 2016, 37 de los 46 países de la Región de África de la OMS indicaron que al menos el 80% de los establecimientos de salud pública habían informado datos sobre paludismo a través de su sistema nacional de información de salud. Las tasas varían en otras y entre regiones de la OMS. Por ejemplo, en la Región del Mediterráneo Oriental de la OMS, solo tres de los ocho países tenían un 80% o más de instalaciones de salud pública que informaron en 2016.
■ Entre los 55 países donde se calculó la carga del paludismo, 31 países tienen una tasa de notificación de casos de paludismo por sistemas de vigilancia de menos del 50%. Esto incluye a India e Nigeria, países de alta carga.
TENDENCIAS MUNDIALES Y REGIONALES DEL PALUDISMO EN CIFRAS
Casos de paludismo ■ En 2016, se estima que hubo 216 millones de casos de paludismo en todo el mundo (Intervalo de
Confianza (IC) 95%: 196-263 millones), en comparación con 237 millones de casos en 2010 (IC 95%: 218-278 millones) y 211 millones de casos en 2015 (95% IC: 192-257 millones).
■ La mayoría de los casos de paludismo en 2016 se registraron en la Región de África de la OMS (90%), seguidos por la Región de Asia Sudoriental de la OMS (3%) y la Región del Mediterráneo Oriental de la OMS (2%).
■ De los 91 países que informaron casos de paludismo autóctono en 2016, 15 países, todos en el África subsahariana, excepto India, tuvieron el 80% de la carga mundial de paludismo.
■ Se estima que la tasa de incidencia del paludismo disminuyó en un 18% a nivel mundial, de 76 a 63 casos por cada 1000 habitantes en riesgo, entre 2010 y 2016. La región de Asia Sudoriental registró el mayor descenso (48%) seguido de las Américas (22%) y la región Africana (20%).
■ A pesar de estas reducciones, entre 2014 y 2016 las tendencias en la incidencia de casos incrementaron sustancialmente en las Américas, y marginalmente en las regiones de Asia Sudoriental, Pacífico Occidental y África de la OMS.
■ P. falciparum es el parásito del paludismo más prevalente en el África subsahariana, representando el 99% de los casos estimados de paludismo en 2016. Fuera de África, P. vivax es el parásito predominante en las Américas, representa el 64% de los casos de paludismo, y está por encima del 30% en las regiones del Asia Sudoriental y por encima del 40% en el Mediterráneo Oriental.
WORLD MALARIA REPORT 2017 xxxi

■ Nuevos datos de sistemas de vigilancia mejorados en varios países de la región de África de la OMS indican que el número de casos de paludismo presentados en el informe de este año son estimaciones conservadoras. La OMS revisará sus métodos de estimación de la carga del paludismo para el África subsahariana en 2018.
Muertes por paludismo ■ En 2016, hubo un estimado de 445 000 muertes por paludismo a nivel mundial, en comparación con
446 000 muertes estimadas en 2015. ■ La región Africana de la OMS representó el 91% de todas las muertes por paludismo en 2016, seguida
de la región de Asia Sudoriental (6%). ■ En 15 países se presentaron el 80% de las muertes mundiales de paludismo el año pasado; todos estos
países están en África subsahariana, a excepción de India. ■ Todas las regiones registraron reducciones en la mortalidad en 2016 en comparación con 2010, con
la excepción de la región del Mediterráneo Oriental, donde las tasas de mortalidad se mantuvieron prácticamente sin cambios en éste período. El mayor descenso se produjo en las regiones de Asia Sudoriental (44%), África (37%) y en las Américas (27%).
■ Sin embargo, entre 2015 y 2016, la tendencia al descenso de la mortalidad se estancó en las regiones de la OMS de África, Asia Sudoriental y el Pacífico Occidental, se ha aumentó en las regiones del Mediterráneo Oriental y las Américas.
ELIMINACIÓN DEL PALUDISMO
■ A nivel mundial, cada vez más países avanzan hacia la eliminación: en 2016, 44 países informaron menos de 10 000 casos de paludismo, en comparación con 37 países en 2010.
■ Kirguistán y Sri Lanka fueron certificados por la OMS como libres de paludismo en 2016. ■ En 2016, la OMS identificó 21 países con potencial para eliminar el paludismo para el año 2020.
Conocidos como países “E-2020”, la OMS está trabajando con los gobiernos de estos países para apoyar sus objetivos de acelerar la eliminación.
■ Si bien algunos de estos países siguen encami nados a lograr sus objetivos de eliminación, 11 han informado aumentos en casos autóctonos de paludismo desde 2015, y cinco países informaron un aumento de más de 100 casos en 2016 en comparación con 2015.
DESAFÍOS PARA LOGRAR UN MUNDO LIBRE DE PALUDISMO
■ Algunos de los desafíos que obstaculizan las capacidades de los países para mantenerse en el buen camino y avanzar hacia la eliminación incluyen: falta de financiamiento internacional y doméstico sostenible y predecible; los riesgos planteados por conflictos en zonas endémicas de paludismo; patrones climáticos anómalos; la aparición de resistencia parasitaria a medicamentos antipalúdicos; y la resistencia de los mosquitos a los insecticidas, entre otros.
■ La OMS está apoyando respuestas de emergencia al paludismo en Nigeria, Sudán del Sur, Venezuela y Yemen, donde las crisis humanitarias en curso plantean serios riesgos para la salud. En el estado de Borno, en Nigeria, la OMS apoyó el lanzamiento de una campaña de administración masiva de medicamentos antipalúdicos que cubrió a aproximadamente 1,2 millones de niños menores de cinco años en áreas específicas. Los primeros resultados apuntan a una reducción en los casos y las muertes de paludismo en el estado.
Financiación ■ En 34 de los 41 países de alta carga de la enfermedad, que dependen principalmente de financiamiento
externo para los programas de paludismo, el nivel promedio de financiamiento disponible por persona en riesgo en los últimos tres años (2014-2016) se redujo en comparación con 2011-2013. Las excepciones incluyen la República Democrática del Congo, Guinea, Mauritania, Mozambique, Níger, Paquistán y Senegal, donde se registraron aumentos.
WORLD MALARIA REPORT 2017xxxii

■ Entre los 41 países de alta carga de la enfermedad, en general, el financiamiento por persona en riesgo permanece por debajo de 2 dólares estadounidenses.
Deleciones de la proteína 2 rica en histidina ■ En algunas áreas, los niveles crecientes de deleciones del gen de la proteína 2 rica en histidina (HRP2)
amenazan la capacidad de diagnosticar y tratar adecuadamente a las personas infectadas con paludismo por P. falciparum. La ausencia del gen HRP2 permite a los parásitos evadir la detección mediante pruebas de diagnóstico rápido (PDR) basadas en HRP2, lo que da como resultado un falso negativo en las pruebas. Si bien la prevalencia de las deleciones del gen HRP2 en la mayoría de los países de alta transmisión sigue siendo baja, se requiere una mayor vigilancia.
Resistencia a los medicamentos ■ Los TCA han sido claves para el reciente éxito en el control mundial del paludismo, y proteger su
eficacia para el tratamiento del paludismo es una prioridad en materia de salud pública. ■ Si bien se ha detectado resistencia a múltiples fármacos, que incluye la resistencia (parcial) a las
artemisininas y los medicamentos asociados, en cinco países de la subregión del Gran Mekong, se ha producido una reducción masiva en el número de casos y muertes por paludismo en esta subregión. El monitoreo de la eficacia de los medicamentos antipalúdicos ha dado lugar a una actualización rápida de las políticas de tratamiento en la subregión.
■ En África, hasta la fecha no se ha reportado ninguna resistencia (parcial) a la artemisinina, y los TCA de primera línea siguen siendo efectivos en todas las áreas endémicas de paludismo.
Resistencia a los insecticidas ■ De los 76 países con paludismo endémico que proporcionaron datos de 2010 a 2016, se detectó
resistencia a al menos un insecticida en un vector de paludismo de un sitio en 61 países. En 50 países, se informó resistencia a dos o más clases de insecticidas.
■ En 2016, la resistencia a uno o más insecticidas estuvo presente en todas las regiones de la OMS, aunque la extensión del monitoreo varió.
■ La resistencia a los piretroides, la única clase de insecticida actualmente utilizada en los mosquiteros tratados con insecticidas, está muy extendida. La proporción de países endémicos de paludismo que monitorearon y posteriormente informaron resistencia a piretroides aumentó del 71% en 2010 al 81% en 2016. La prevalencia de resistencia confirmada a piretroides difirió entre las regiones, y fue más alta en las regiones de la OMS de África y del Mediterráneo Oriental, donde fue detectada en vectores de paludismo en más de dos tercios de todos los sitios evaluados.
■ Los mosquiteros tratados con insecticidas siguen siendo una herramienta muy efectiva para el control del paludismo, incluso en áreas donde los mosquitos han desarrollado resistencia a los piretroides, como se puso de manifiesto en un gran estudio de evaluación multinacional de cinco países coordinado por la OMS entre el año 2011 y 2016, en el cual no se encontraron pruebas de una asociación entre la carga de la enfermedad del paludismo y la resistencia a los piretroides en las áreas de estudio.
WORLD MALARIA REPORT 2017 xxxiii

The World malaria report 2017 summarizes global achievements in the fight against malaria up to the end of 2016. This marks a year after the launch of:
> the WHO Global technical strategy for malaria 2016–2030 (GTS) (1), which sets out a vision for accelerating progress towards malaria elimination;
> the Roll Back Malaria advocacy plan, Action and investment to defeat malaria 2016–2030 (AIM) (2), which builds the case for investment in malaria; and
> the Sustainable Development Goals (SDGs) (3), a set of interconnected global goals agreed on by United Nations member states as a ‘plan of action for people, the planet and prosperity’.
The GTS and AIM are aligned with the SDGs, with targets set for the years 2020, 2025 and 2030 compared with a baseline of 2015. For malaria, Target 3.3 of the SDGs – to end the epidemics of AIDS, tuberculosis, malaria and neglected tropical diseases by 2030 – is interpreted as the attainment of the GTS and AIM targets. The indicator used to track progress against Target 3.3 is malaria case incidence. In addition, universal access to malaria prevention and treatment interventions for populations at risk of malaria will contribute to SDG Goal 3.8, which is to ensure universal health coverage.
The World malaria report aims to track achievements towards the primary GTS goals on malaria morbidity, mortality and attainment of elimination, as presented in Table 1.1. To better contextualize the progress towards these goals, the report also tracks the total funding for malaria control and elimination, and for malaria research; the supply of key commodities to endemic countries (Section 2) and the associated population level coverage (Sections 3 and 4). The status of surveillance systems (Pillar 3) is presented in Section 5. Analysis of the global trends in malaria morbidity and mortality are presented in Section 6 and progress towards elimination in Section 7. The GTS identifies several threats including
inadequate funding, the biological evolution of resistance of parasites to drugs and vectors to insecticides, and the interruption of interventions due to complex situations such as insecurity. Section 8 reports on these threats. The main text is followed by annexes that contain data sources and methods, regional profiles and data tables. Country profiles are available online at www.who.int/malaria/publications/country-profiles/en/.
The World malaria report is produced by the WHO Global Malaria Programme, with the support of WHO regional and country offices, ministries of health in endemic countries and a broad range of other partners. The primary sources of information are reports from national malaria control programmes (NMCPs) in the 94 countries that had malaria transmission in 2000. This information is supplemented by data from nationally representative household surveys (demographic and health surveys, malaria indicator surveys and multiple indicator cluster surveys) and databases held by other organizations: the Alliance for Malaria Prevention; the Global Fund to Fight AIDS, Tuberculosis and Malaria (Global Fund); the Organisation for Economic Co-operation and Development; Policy Cures; the US President’s Malaria Initiative; and WHO. A description of data sources and methods is provided in Annex 1.
1GLOBAL MALARIA TARGETS AND MILESTONES
WORLD MALARIA REPORT 20172

FIG. 1.1.
Countries and territories with indigenous cases in 2000 and their status by 2016 Countries with zero indigenous cases over at least the past 3 consecutive years are eligible to request certification of malaria free status from WHO. All countries in the WHO European Region reported zero indigenous cases in 2016. Kyrgyzstan and Sri Lanka were certified malaria free in 2016. Source: WHO database
TABLE 1.1.
GTS: Global targets for 2030 and milestones for 2020 and 2025 (1)
Vision – A world free of malaria
Pillars
Pillar 1 Ensure universal access to malaria prevention, diagnosis and treatment
Pillar 2 Accelerate efforts towards elimination and attainment of malaria free status
Pillar 3 Transform malaria surveillance into a core intervention
GoalsMilestones Targets
2020 2025 2030
1. Reduce malaria mortality rates globally compared with 2015 At least 40% At least 75% At least 90%
2. Reduce malaria case incidence globally compared with 2015 At least 40% At least 75% At least 90%
3. Eliminate malaria from countries in which malaria was transmitted in 2015 At least 10 countries At least 20 countries At least 35 countries
4. Prevent re-establishment of malaria in all countries that are malaria free
Re-establishment prevented
Re-establishment prevented
Re-establishment prevented
GTS, Global technical strategy for malaria 2016–2030
■ ≥1 cases■ Zero cases in 2016■ Zero cases (≥3 years)
■ Certified malaria free since year 2000■ No malaria■ Not applicable
WORLD MALARIA REPORT 2017 3

2The period since 2000 has been one of unprecedented investment of funds in the fight against malaria. The GTS, however, estimated that annual investments in malaria control and elimination need to increase substantially – to about US$ 6.5 billion1 by 2020 – to meet the first milestone under that strategy of a 40% reduction in malaria incidence and mortality rates (4). The GTS also recognized that innovations in tools and approaches are needed to achieve its targets, and estimated that an additional US$ 686 million1 would be required annually for malaria research and development between 2016 and 2030.
This section of the report examines the trends in the financing of malaria programmes and of malaria research and development since 2010, and documents the quantities of commodities delivered as a result of some of these investments.
2.1. TOTAL EXPENDITURE FOR MALARIA CONTROL AND ELIMINATION
1 Published estimate (1) converted into US$ 2016 equivalent.
Fig. 2.1, Fig. 2.2 and Fig. 2.3 show the origin of funds for malaria control, the channels through which they are delivered and the geographical destination of funds, respectively. In 2016 total funding for malaria control and elimination was estimated to be US$ 2.7 billion, just 41% of the 2020 milestone of US$ 6.5 billion. Funding for malaria has remained relatively stable since 2010, and if this trend continues there is no prospect of the 2020 milestone being attained.
Contributions from governments of endemic countries amounted to US$ 0.8 billion in 2016, representing 31% of total funding that year (Fig. 2.1). Of the US$ 0.8 billion invested, US$ 586 million was spent through NMCPs, and US$ 241 million on malaria patient care services. Since 2010, government contributions through NMCPs have been relatively stable globally whereas government spending towards malaria patient care services has declined by 11%, reflecting gains in malaria control. However, the recent upward trend in the number of malaria cases translated into a 4% rise in spending on malaria patient care services, from US$ 232 million in 2015 to US$ 241 million in 2016.
The United States of America (USA) was the largest international source of malaria control financing,
with bilateral and multilateral contributions of US$ 1 billion (38%) in 2016, followed by the United Kingdom of Great Britain and Northern Ireland (United Kingdom), with contributions of nearly US$ 0.3 billion (11%) Other international funding sources together represented 21% of global funding in 2016, of which nearly half originated from France, Germany and Japan (together 10%, US$ 0.27 billion) and the remainder from all other funders (11%, US$ 0.29 billion). Over the period 2010–2016 total malaria contributions from the USA have increased while those from the United Kingdom and other funders have fluctuated (Fig. 2.1).
More than half (57%) of international funding was channelled through the Global Fund in 2016 (Fig. 2.2). The USA and United Kingdom bilateral channels accounted for most of the remainder of international funding received by endemic countries in 2016 (34% and 7%, respectively).
The majority (74%) of funds were spent in the WHO African Region followed by the WHO regions of South-East Asia (7%), Eastern Mediterranean and the Americas (each 6%) and Western Pacific (4%) (Fig. 2.3).
INVESTMENTS IN MALARIA PROGRAMMES AND RESEARCH
WORLD MALARIA REPORT 20174

FIG. 2.3.
Investments in malaria control and elimination by WHO region (constant 2016 US$), 2010–2016
EU, European Union; Global Fund, Global Fund to Fight AIDS, Tuberculosis and Malaria; UK, United Kingdom of Great Britain and Northern Ireland; UNICEF, United Nations Children’s Fund; USA, United States of America; WHO, World Health OrganizationRecipient category “Unspecified” refers to funding flows with no information on the geographical localization of their recipient (under 3% of total flow in 2016)Sources: ForeignAssistance.gov, Global Fund, national malaria control programmes, Organisation for Economic Co-operation and Development creditor reporting system, the World Bank Data Bank, Department for International Development and estimated government spending on malaria patient care services
FIG. 2.1.
Investments in malaria control and elimination by source of funds1 (constant 2016 US$), 2010–2016
FIG. 2.2.
Investments in malaria control and elimination by channel delivered (constant 2016 US$), 2010–2016
1 For detailed information on data sources and methodology, refer to Annex 1 of this report.
US$
(billi
on)
2016201520142013201220112010
3
2
1
4
0
■ Governments of endemic countries ■ USA ■ UK■ France, Germany, Japan ■ Other funders
US$
(billi
on)
2016201520142013201220112010
3
2
1
4
0
■ Governments of endemic countries ■ Global Fund■ USA bilateral ■ UK bilateral ■ World Bank■ EU, WHO, UNICEF ■ Other funders
US$
(billi
on)
2016201520142013201220112010
3
2
1
4
0
■ African ■ Americas ■ Eastern Mediterranean■ South-East Asia ■ Western Pacific ■ Unspecified
WORLD MALARIA REPORT 2017 5

2.2 TOTAL EXPENDITURE FOR MALARIA RESEARCH AND DEVELOPMENT
1 http://www.policycuresresearch.org/g-finder-2016/#. This section reports on the year 2015 because all the data available are for 2015 only.2 Published estimate (1) converted into US$ 2016 equivalent
Total research and development funding for malaria was estimated at US$ 572 million in 20151 (constant 2016 US$). This represents 83% of the estimated annual funding required for research and development of US$ 686 million.2 Among funders who reported in both years, research and development funding decreased by 3% in 2015 compared with 2014.3 This was partly due to large disbursements for vaccine research in 2014 from the Bill & Melinda Gates Foundation returning to previous levels.3 Other major funders of malaria research also decreased their funding, including the
Australian National Health and Medical Research Council, the Wellcome Trust and the European Union. An increase in research and development funding from the private sector and US Government agencies was mostly for drug development. Over the past 3 years, the three main funding channels were the US Government National Institutes of Health, the Bill & Melinda Gates Foundation, and pharmaceutical and biotechnology companies, representing 27%, 22% and 21% of total funding, respectively.
FIG. 2.4.
Investments in malaria research and development by source and by research area3, 2010–2015 (in US$ million) Source: G-FINDER Public Search Tool Policy Cures. https://gfinder.policycuresresearch.org/PublicSearchTool
NGO, nongovernmental organization
3 Public sector category includes governments, government agencies and government-affiliated research institutions.
Academic and other research institutions
Aggregate pharmaceuticaland biotechnology companies
Product developmentpartnership
Public sector
Private sector philanthropicfoundations, trusts, NGOs
Other
Drugs
Basic research
VaccinesVector control
Diagnostics
Unspecified
Sources Research areas
999
798731518
842
129
85
191
5958
12651257
WORLD MALARIA REPORT 20176
Investments in malaria programmes and research2

2.3 DELIVERIES OF INSECTICIDE-TREATED MOSQUITO NETS
Between 2014 and 2016, a total of 582 million insecticide-treated mosquito nets (ITNs) were reported by manufacturers as having been delivered globally, of which almost 505 million ITNs (87%) were delivered to countries in sub-Saharan Africa (Fig. 2.5). During the preceding 3-year period (2011–2013), 301 million ITNs were delivered in sub-Saharan Africa. This marks a substantial increase of ITNs delivered by manufacturers over the past 3-year period relative to the preceding 3 years.
In sub-Saharan Africa, 16 countries accounted for more than 80% of deliveries in the period 2014–2016. These countries were Nigeria (78.0 million), Demo-cratic Republic of the Congo (61.2 million), Uganda (35.6 million), Ethiopia (33.0 million), United Republic
of Tanzania (29.2 million), Ghana (19.6 million), Mozambique (17.6 million), Côte d’Ivoire (16.9 million), Kenya (16.9 million), Senegal (15.1 million), Burkina Faso (14.6 million), Mali (14.1 million), Sudan (13.6 million), Cameroon (13.6 million), Madagascar (12.7 million) and Malawi (12.4 million).
Outside sub-Saharan Africa, most deliveries of ITNs were accounted for by eight countries: India, 15.5 million ITNs; Myanmar, 11.0 million; Indonesia, 7.7 million; Pakistan, 5.1 million; Cambodia, 5.0 million; Afghanistan, 4.4 million; Bangladesh, 4.4 million; and Yemen, 2.9 million.
FIG. 2.5.
Number of ITNs delivered by manufacturers and delivered by NMCPs, 2010–2016 Sources: Milliner Global Associates and national malaria control programme reports
ITN, insecticide-treated mosquito net; NMCP, national malaria control programme
Num
ber o
f ITN
s (m
illion
)
2016201520142013201220112010
200
150
100
250
50
0
Manufacturer ■ Sub-Saharan Africa NMCP ■ Sub-Saharan Africadeliveries: ■ Outside Africa deliveries: ■ Outside Africa
WORLD MALARIA REPORT 2017 7

NMCP distributions of ITNs to households generally happen between 6 months and 1 year after the nets have been delivered to countries by the manu-facturer. Hence, it is expected that some of the reported manufacturer deliveries for the year 2016 will be reported as NMCP distributions in 2017. In the final quarter of 2016, almost 138 million ITNs were reported by manufacturers as deliveries to sub-Saharan Africa, and a considerable proportion of these nets may be distributed in 2017.
WHO recommends the universal scale-up of ITNs through mass distribution campaigns. Such cam-paigns should be supplemented with continuous distribution of ITNs to all pregnant women attending antenatal care (ANC) facilities and all infants
attending child immunization clinics, to ensure the most vulnerable populations are protected (5). Data reported by NMCPs indicate that, between 2014 and 2016, mass campaigns accounted for 75% of ITNs distributed in sub-Saharan Africa, while antenatal clinics accounted for 13% and immunization clinics for 5% (Fig. 2.6). Other channels account for 7% of all ITN distribution in sub-Saharan Africa; these other channels remain undefined in country reports, but may include distribution through schools, to refugees or to special groups such as armed forces.
FIG. 2.6.
Proportion of ITNs distributed through different delivery channels in sub-Saharan Africa, 2014–2016 Source: National malaria control programme reports
ITN, insecticide-treated mosquito net
Mass campaign
75%
Antenatal care clinics
13%
Child immunization
5%
Others
7%
WORLD MALARIA REPORT 20178
Investments in malaria programmes and research2

2.4 DELIVERIES OF RAPID DIAGNOSTIC TESTS
In the period 2010–2016, 1.66 billion rapid diagnostic tests (RDTs) were sold globally by manufacturers eligible for the Malaria RDT Product Testing Programme. The peak year for RDT deliveries was 2013, when almost 320 million were delivered, declining to 270 million in 2015 before rising to almost 312 million in 2016 (Fig. 2.7). Compared to 2015, manufacturer deliveries of RDTs increased from 240 million to 269 million in 2016 in Africa. In the same period, deliveries to the Asian region decreased from almost 47 million to 24 million RDTs, mainly due to reduced sales of RDTs for falciparum only. RDTs manufacturer delivery data are collected on a regional level, and country-specific splits are not available.
The number of RDTs distributed by NMCPs rose between 2010 and 2015, but fell from 247 million in 2015 to 221 million in 2016. The decrease was entirely in sub-Saharan Africa, where distributions fell from 219 million to 177 million RDTs in the same period. In all other regions combined, RDT distributions by NMCPs rose from 28 million in 2015 to 44 million in 2016. The sharp reductions in NMCP distributions of RDTs in sub-Saharan Africa between 2015 and 2016 occurred despite increases in reported manufacturer deliveries.
When NMCP distributions in sub-Saharan Africa were analysed by country, 22 countries had a total increase of RDT distributions of 33 million tests,
FIG. 2.7.
Number of RDTs sold by manufacturers and distributed by NMCPs, 2010–2016 Sources: National malaria control programme reports and sales data from manufacturers eligible for the Malaria Rapid Diagnostic Test Product Testing Programme run by WHO
NMCP, national malaria control programme; P. falciparum, Plasmodium falciparum; RDT, rapid diagnostic test
Num
ber o
f RDT
s (m
illion
)
2016201520142013201220112010
300
250
200
150
100
350
50
0
Manufacturer deliveriesSub-Saharan Africa:■ P. falciparum only tests■ Combination testsOutside Africa:■ P. falciparum only tests■ Combination tests
NMCP distributions:■ Sub-Saharan Africa■ Outside Africa
WORLD MALARIA REPORT 2017 9

whereas 21 countries had a total reduction of 75 million tests. Among the latter, over 95% of these reductions were reported from Nigeria (29.9 million), Uganda (26.0 million), Kenya (4.0 million), Mada-gascar (3.6 million), Ethiopia (3.4 million), Rwanda (2.0 million), Sudan (2.0 million) and Mali (1.1 million).
Several factors could account for differences between manufacturer sales and NMCP distribu-tions. The differences may arise because:
■ manufacturer data include both public and private health sector sales, whereas RDTs distributed by NMCPs represent tests in the public sector only;
■ a high distribution may be followed by a lower one as countries use commodities procured the previous year;
■ of misreporting, in cases where RDTs in ministry of health central stores are not included in NMCP distributions; and
■ of weak reporting systems or manufacturer data representing recent orders that are yet to arrive in the country.
2.5 DELIVERIES OF ARTEMISININ-BASED COMBINATION THERAPIES
Manufacturer delivery reports show that the number of treatment courses of artemisinin-based
combi nation therapy (ACT) procured by countries fell from 393 million in 2013 to 337 million in 2014
FIG. 2.8.
Number of ACT treatment courses delivered by manufacturers and distributed by NMCPs, 2010–2016 AMFm/GF indicates AMFm operated from 2010 to 2013, and GF co-payment mechanism from 2014. Sources: Companies eligible for procurement by WHO/United Nations Children’s Fund (UNICEF) and national malaria control programme reports
ACT, artemisinin-based combination therapy; AMFm, Affordable Medicines Facility–malaria; GF, Global Fund to Fight AIDS, Tuberculosis and Malaria; NMCP, national malaria control programme
ACT
treat
men
t cou
rses
(milli
on)
2016201520142013201220112010
400
300
200
100
500
0
■ Public sector ■ Public sector – AMFm/GF ■ Private sector – AMFm/GF ■ Distributed by NMCPs
WORLD MALARIA REPORT 201710
Investments in malaria programmes and research2

and 311 million in 2015, before rising again to 409 million in 2016 (Fig. 2.8). Over 69% of these procurements were reported to have been made for the public sector.
The number of ACT treatments distributed by NMCPs to the public sector increased from 192 million in 2013 to 198 million in 2016. Most of the NMCP distributions of ACTs (99%) in 2016 occurred in the WHO African Region.
Despite the increase in reported procurements, the ratio of manufacturer to NMCP deliveries has remained between 1.5 and 2.1, with less than half of the number of treatment courses reported by man-ufacturers as deliveries in 2016 distributed by NMCPs. The discrepancy between manufacturer deliveries to the public sector and the number of courses distributed through public facilities can be accounted for, in part, by incomplete reporting by NMCPs.
According to the WHO recommendations, each patient who is suspected of having malaria should be tested using RDT or microscopy, and only those who are positive for the Plasmodium parasite should be treated with ACTs or other recommended first-line treatment (6). Where adherence to such a recommendation is high, the number of ACT treatments should be roughly equal to the number of malaria positive cases. The ratio of tests to treatments will therefore also be roughly equal to the test positivity rate. In 2010, the ratio of tests (RDTs and microscopy) to ACT treatments reported by countries was 2.5, reducing to 0.9 in 2016, while the test positivity rate changed from 0.4 to 0.6 in the same period (Fig. 2.9). This shows that although ACT treatments are increasingly targeted only at malaria positive cases, about 30% of ACT treatments may have been given to patients who were either not tested or were negative for malaria.
FIG. 2.9.
Ratio of ACT treatment courses distributed to diagnostic tests performed (RDTs or microscopy) and test positivity rate, WHO African Region, 2010–2016 Source: National malaria control programme reports
ACT, artemisinin-based combination therapy; RDT, rapid diagnostic test
2016201520142013201220112010
2
1
3
0
■ Ratio of ACT:RDT ■ Test positivity rate
Ratio
of A
CTs:
test
s und
erta
ken
and
test
pos
itivi
ty ra
te
0.9
0.6
WORLD MALARIA REPORT 2017 11

3PREVENTING MALARIA
WHO recommends the use of vector control (i.e. stopping mosquitoes from biting human beings) or chemoprevention (i.e. providing drugs that suppress infections) in specific population subgroups (i.e. pregnant women, children and other high-risk groups) or for specific contexts (elimination). This section presents trends in the population level coverage of ITNs, indoor residual spraying (IRS), intermittent preventive treatment of malaria in pregnancy (IPTp) and seasonal malaria chemoprevention (SMC). Analysis of coverage indicators for ITNs is limited to sub-Saharan Africa, where there are sufficient household survey data to measure progress. IPTp and SMC are also reported only for sub-Saharan Africa, where these interventions are applicable. The coverage of intermittent preventive treatment of infants (IPTi) is not reported because of its current limited adoption.
Vector controlThe most commonly used methods to prevent mosquito bites are sleeping under an ITN and spraying the inside walls of a dwelling with an insecticide – an intervention known as IRS. Use of ITNs has been shown to reduce malaria case incidence rates by 50% in a range of settings, and to reduce malaria mortality rates by 55% in children aged under 5 years in sub-Saharan Africa (7,8).
Historical and programme documentation suggest a similar impact for IRS, but randomized trial data are limited (9). These two core vector-control interventions – use of ITNs and IRS – are considered to have made a major contribution to the reduction in malaria burden since 2000 (10). In a few specific settings and circumstances, ITNs and IRS can be supplemented by larval source management (11) or other environmental modifications that reduce suitability of environments as mosquito habitats, or that otherwise reduce mosquito biting of humans.
ChemopreventionIn sub-Saharan Africa, IPTp with sulfadoxine-pyrimethamine (SP) has been shown to reduce
maternal anaemia (12), low birth weight (13) and perinatal mortality (14). IPTi with SP provides protection against clinical malaria and anaemia (15); however, as of 2015, no countries have reported implementation of an IPTi policy. SMC with amodiaquine (AQ) plus SP (AQ+SP) for children aged 3–59 months reduces the incidence of clinical attacks and severe malaria by about 75% (16,17), and could avert millions of cases and thousands of deaths among children living in areas of highly seasonal malaria transmission in the Sahel subregion (18). Since March 2012, SMC has been recommended by WHO for children aged 3–59 months living in areas of highly seasonal malaria transmission in the Sahel subregion of Africa. Mass drug administration – defined as the time-limited administration of antimalarial treatment to all age groups of a defined population or every person living in a defined geographical area (except those for whom the medicine is contraindicated) at about the same time and often at repeated intervals – is recommended as a potential accelerator in elimination settings and a means of rapidly reducing malaria burden among restricted high-risk groups (19).
3.1 POPULATION AT RISK SLEEPING UNDER AN INSECTICIDE-TREATED MOSQUITO NET
Indicators of population-level coverage of ITNs were estimated for countries in sub-Saharan Africa in which ITNs are the main method of vector control. Long-lasting insecticidal nets (LLINs) are the predominant type of ITNs distributed by countries and are estimated to have an effective lifespan of 3 years (5). In 2016 in sub Saharan Africa, 54% of the population at risk slept under an ITN (95% confidence interval [CI]: 50–58%), increasing from 30% in 2010 (95% CI: 28–32%) (Fig. 3.1). Household ownership of at least one ITN was high (80%) in 2016 (95% CI: 76–84%), rising from 50% in 2010 (95% CI: 48–52%). This result suggests that the channels NMCPs use for delivery of ITNs can reach most households; hence, individual access to ITNs
increased from 34% in 2010 (95% CI: 32–35%) to 61% in 2016 (95% CI: 58–65%).
The proportion of households with sufficient nets, however, was only 43% in 2016 (95% CI: 40–47%), up from 19% in 2010 (95% CI: 18–20%), but still substantially lower than the universal coverage targets. This relatively low level in the adequacy of available nets explains, in part, the relatively low use rates. The map in Fig. 3.2 shows the rate of access to ITNs in sub-Saharan Africa by country. Twelve countries had populations with less than 50% access to ITNs in 2016.
WORLD MALARIA REPORT 201712

FIG. 3.1.
Proportion of population at risk with access to an ITN and sleeping under an ITN, and proportion of households with at least one ITN and enough ITNs for all occupants, sub-Saharan Africa, 2010–2016 Source: Insecticide-treated mosquito net coverage model from Malaria Atlas Project 1
ITN, insecticide-treated mosquito net
1 http://www.map.ox.ac.uk/
FIG. 3.2.
Proportion of population at risk with access to an ITN, sub-Saharan Africa, 2010–2016 Source: Insecticide-treated mosquito net coverage model from Malaria Atlas Project 1
ITN, insecticide-treated mosquito net
2016201520142013201220112010
80%
60%
40%
20%
100%
0
■ Households with at least one ITN ■ Population with access to an ITN in household■ Households with enough ITNs for all occupants ■ Population sleeping under an ITN
Prop
ortio
n of
pop
ulat
ion
at ri
sk o
r hou
seho
lds
79.7%
61.2%
54.1%
43.4%
■ ≥80%■ 50–80%■ <50%■ Not malaria endemic■ Not applicable
WORLD MALARIA REPORT 2017 13

An analysis of the ownership gap for household ITNs is presented in Fig. 3.3. The indicator is computed as 1 minus the ratio of households with one net for two people, and the households with at least one net. It reflects the ITN gap in households that have some nets but not enough nets for every two occupants.
The closer the value is to 1, the higher the ITN ownership gap; the analysis suggests that all countries in sub-Saharan Africa had an ITN ownership gap over the study period, and that 14 of those 40 countries had a gap of more than 0.5.
1 http://www.map.ox.ac.uk/
FIG. 3.3.
Household ITN ownership gap, 2016 Source: Insecticide-treated mosquito net coverage model from Malaria Atlas Project 1
ITN, insecticide-treated mosquito net
10.80.60.40.20
Gabon
Mauritania
Djibouti
Somalia
United Republic of Tanzania
Equatorial Guinea
Zimbabwe
Congo
Angola
Sudan
South Sudan
Eritrea
Benin
Nigeria
Togo
Ethiopia
Cameroon
Guinea
Niger
Uganda
Chad
Gambia
Burundi
Mozambique
Côte d'Ivoire
Central African Republic
Sierra Leone
Comoros
Kenya
Malawi
Democratic Republic of the Congo
Madagascar
Zambia
Mali
Guinea-Bissau
Burkina Faso
Ghana
Rwanda
Senegal
Liberia
ITN ownership gap10.80.60.40.20
ITN ownership gap
WORLD MALARIA REPORT 201714
Preventing malaria 3

3.2 POPULATION AT RISK PROTECTED BY INDOOR RESIDUAL SPRAYING
The proportion of the population at risk protected by IRS declined globally from a peak of 5.8% in 2010 to 2.9% in 2016, with decreases seen in all WHO regions (Fig. 3.4). The number of people protected in 2010 was 180 million globally, reducing to about
100 million in 2016. The WHO African Region had the highest number of populations at risk protected by IRS, but also had the largest reduction in IRS coverage (from 80 million in 2010 to 45 million in 2016).
FIG. 3.4.
Proportion of the population at risk protected by IRS by WHO region, 2010–2016 Source: National malaria control programme reports
AFR, WHO African Region; AMR, WHO Region of the Americas; EMR, WHO Eastern Mediterranean Region; IRS, indoor residual spraying; SEAR, WHO South-East Asia Region; WPR, WHO Western Pacific Region
2016201520142013201220112010
10%
8%
6%
4%
2%
12%
0
■ AFR ■ EMR ■ AMR ■ SEAR ■ WPR ■ World
Prop
ortio
n of
pop
ulat
ion
at ri
sk
4.7%
3.3%2.9%
1.9%1.6%
0.3%
WORLD MALARIA REPORT 2017 15

In the WHO African Region, 25 out of 47 countries that reported some level of IRS implementation between 2010 and 2016 also reported either zero implementation of IRS in a given year since 2010, or reducing populations at risk protected with IRS relative to a preceding year (Table 3.1). Nearly all of these countries had fewer populations protected with IRS in 2016 relative to 2015, or in 2015 relative to 2014. It is unclear whether the populations who were no longer protected with IRS had universal access to
ITNs and, for those that did, whether at some period there was a gap in vector control that could have led to increases in transmission.
The numbers of countries implementing IRS globally have also declined since 2012 (Fig. 3.5). These reductions in overall IRS coverage may be attributed to reduced reliance on pyrethroids, and a corresponding switch to more expensive chemicals to manage vector insecticide resistance, resulting in lower coverage.
TABLE 3.1.
Countries and territories of sub-Saharan Africa that have reported reduced IRS coverage in any year between 2010 and 2016 Years shaded orange represent zero population protected by IRS in that year or reduction relative to preceding year. Population presented as x1000. Source: National malaria control programme reports
Country/territory 2010 2011 2012 2013 2014 2015 2016
Angola 651 690 676 419 58 0 0
Botswana 251 208 164 177 206 143 116
Burkina Faso 113 117 116 0 0 0 0
Burundi 255 224 59 0 0 0 0
Comoros 0 32 0 31 22 20 0
Equatorial Guinea 0 0 148 129 166 0 0
Ethiopia 27 029 20 866 15 469 23 150 16 709 16 147 15 050
Gambia 387 747 484 800 350 438 399
Ghana 850 927 2117 2936 2155 1326 1410
Guinea 35 0 0 0 0 0 0
Kenya 1487 1832 2436 0 0 0 0
Liberia 421 835 960 0 0 0 0
Madagascar 9806 10 013 1597 1580 1307 1327 2857
Malawi 2036 322 1873 0 0 0 0
Mali 441 698 758 826 837 494 789
Mayotte 41 24 4 0.381 0.45 0 0
Mozambique 7513 8533 1789 9647 5598 3660 0
Namibia 566 600 559 599 468 387 486
Nigeria 200 177 2416 132 316 0 130
Sao Tome and Principe 65 116 147 154 125 144 150
Senegal 952 887 1095 690 709 515 497
Sierra Leone 308 851 987 0 0 0 0
South Africa 5000 5000 5000 2318 5650 1179 1166
South Sudan 0 0 170 333 737 297 0
United Republic of Tanzania 7531 7190 6774 3793 2225 14 685 2405
IRS, indoor residual spraying
WORLD MALARIA REPORT 201716
Preventing malaria 3

3.3 POPULATION AT RISK SLEEPING UNDER AN INSECTICIDE-TREATED MOSQUITO NET OR PROTECTED BY INDOOR RESIDUAL SPRAYING
Combining data on the proportion of the population sleeping under an ITN with information on the proportion protected by IRS – and accounting for households that may receive both interventions – the
proportion of the population in sub-Saharan Africa protected by vector control was estimated at 58% in 2016 compared with 27% in 2010 (Fig. 3.6).
FIG. 3.5.
Chemical class used for IRS, 2010–2016 Source: National malaria control programme reports
IRS, indoor residual spraying
FIG. 3.6.
Proportion of the population protected by IRS or sleeping under an ITN in sub-Saharan Africa, 2010–2016 Sources: Insecticide-treated mosquito net coverage model from Malaria Atlas Project (20), national malaria control programme reports and further analysis by WHO
IRS, indoor residual spraying; ITN, insecticide-treated mosquito net
2016201520142013201220112010
60
40
20
80
0
Num
ber o
f cou
ntrie
s rep
ortin
g IR
S im
plem
enta
tion
■ Pyrethroids only ■ Pyrethroids and other insecticides■ Other insecticides only
2016201520142013201220112010
80%
60%
40%
20%
100%
0
Prop
ortio
n of
pop
ulat
ion
at ri
sk
■ ITN only ■ ITN & IRS ■ IRS only
WORLD MALARIA REPORT 2017 17

3.4 PREGNANT WOMEN RECEIVING THREE OR MORE DOSES OF INTERMITTENT PREVENTIVE TREATMENT
Since October 2012, WHO has recommended that IPTp be given to all pregnant women at ANC visits, starting as early as possible in the second trimester (i.e. not during the first trimester). Each IPTp-SP dose should be given at least 1 month apart, with at least three doses during each pregnancy (21).
As of 2016, 36 African countries have adopted a policy of providing three or more doses of IPTp to pregnant women. Progress in adherence to this policy has increased marginally: among 23 countries
that reported in 2016, an estimated 19% of eligible pregnant women received three or more doses of IPTp, compared with 18% in 2015 and 13% in 2014 (Fig. 3.7).
In 2016, at least 50% of pregnant women reportedly received one or more doses of IPTp in 20 countries, two or more doses in 13 countries, and three or more doses in two countries. In 2015, only one country reported that at least 50% of pregnant women received three or more doses of IPTp. Similar to
FIG. 3.7.
Proportion of pregnant women attending ANC at least once and receiving IPTp, by dose, sub-Saharan Africa, 2010–2016 IPTp3 estimates for this report are different from the 31% reported in the World malaria report 2016 due to corrections to data and slight changes in the quantification of the denominator. Source: National malaria control programme reports
ANC, antenatal care; IPTp, intermittent preventive treatment in pregnancy
2016201520142013201220112010
60%
40%
20%
80%
0
■ IPTp1 ■ IPTp2 ■ IPTp3
Prop
ortio
n of
pre
gnan
t wom
en
56%
43%
19%
WORLD MALARIA REPORT 201718
Preventing malaria 3

previous years, many pregnant women did not attend ANC facilities (approximately 26% in 2016 and
29% in 2015). Among women who did attend ANC, an estimated 75% received at least one dose of IPTp.
3.5 SEASONAL MALARIA CHEMOPREVENTION
Following the WHO policy recommendation on SMC for falciparum malaria control in highly seasonal transmission areas of the Sahel subregion in Africa in March 2012 and dissemination of a field implementation guide in November 2012 (22), countries were quick to adopt SMC and include its implementation in their strategic plans for malaria control (Fig. 3.8). Implementation of SMC was
scaled up in 2015 and 2016, supported by financing from Unitaid through the ACCESS-SMC initiative and from other partners. Delivery is primarily door-to-door in most countries – an approach that has been shown to achieve higher and more equitable coverage than delivery through fixed distribution points, which was implemented in Mali.
FIG. 3.8.
Maps of countries and subnational areas where SMC has been scaled up, 2014–2016 Source: Seasonal Malaria Chemoprevention Working Group
SMC, seasonal malaria chemoprevention
2014
2016
■ SMC■ No SMC■ Not applicable
■ SMC■ No SMC■ Not applicable
WORLD MALARIA REPORT 2017 19

In 2016, about 15 million children were included in SMC programmes in 12 countries (Burkina Faso, Cameroon, Chad, Gambia, Ghana, Guinea, Guinea-Bissau, Mali, Niger, Nigeria, Senegal and Togo) and about 60 million monthly treatments were administered (Fig. 3.9).
Coverage surveys conducted in seven countries for the ACCESS-SMC project in 2016 found that, in areas where SMC was implemented through the project,
91% of eligible children were included in SMC programmes and received SMC at least once, and 70% received SMC at least three times. In practice, children aged over 5 years often receive SMC along with their younger siblings. In Senegal, SMC policy specifically provides for SMC for children aged up to 10 years, and those aged 6–10 years receive a dose appropriate for their age. SMC in older children has been piloted in Mali.
FIG. 3.9.
Number of SMC treatments administered in scale-up countries, 2012–2016 (in million) Source: Seasonal Malaria Chemoprevention Working Group
SMC, seasonal malaria chemoprevention
20162015201420132012
15
10
5
20
0
■ Mali ■ Burkina Faso ■ Niger
18.6
10.6
9.1
20162015201420132012
9
6
3
12
0
■ Nigeria ■ Cameroon ■ Chad
6.3
4.3
3.2
WORLD MALARIA REPORT 201720
Preventing malaria 3

Within each country SMC has been funded from a variety of sources including Unitaid, the Global Fund, the World Bank, the United Nations Children’s Fund (UNICEF), the US President’s Malaria Initiative/United States Agency for International Development (USAID), the Islamic Development Bank, national governments and other agencies. The scale-up of SMC in 2015 and 2016 was organized largely through the ACCESS-SMC project, funded by Unitaid, in seven countries (Burkina Faso, Chad, Gambia, Guinea, Mali, Niger and Nigeria).
In the 12 countries that are currently implementing SMC, the estimated target population of children was 28.1 million in 2016, of whom 15.3 million were reached, accounting for 58.7 million treatments. Hence, the gap in these countries for 2016 was 53.8 million treatments, to cover the children who were not reached. Extending the analysis to all eligible countries – including Benin, Mauritania, Sierra Leone, South Sudan and Sudan – the gap in 2016 was 18.7 million children, or an additional 77.2 million treatments.
20162015201420132012
3
2
1
4
0
■ Senegal ■ Guinea ■ Togo ■ Ghana ■ Gambia ■ Guinea-Bissau
1.91.8
1.31.2
0.30.2
WORLD MALARIA REPORT 2017 21

4DIAGNOSTIC TESTING AND TREATMENT
Prompt diagnosis and treatment of malaria patients is the most effective intervention to ensure that a mild case of malaria does not develop into severe disease and probable death. High levels of access to effective malaria case management may also help to reduce the pool of individuals who can contribute to onward transmission.
WHO recommends that every suspected malaria case be confirmed by microscopy or an RDT before treatment (6). Accurate diagnosis improves the management of febrile illnesses and ensures that antimalarial medicines are used only when necessary. Only in areas where parasite-based diagnostic testing is not possible should malaria treatment be initiated solely on clinical suspicion. WHO recommends ACTs for the treatment of uncomplicated falciparum malaria. ACTs have been estimated to reduce malaria mortality in children aged 1–23 months by 99% (range: 94–100%), and in children aged 24–59 months by 97% (range: 86–99%) (23).
This section of the report discusses indicators covering the trends in the proportion of children with fever for whom care is sought, and the rates of diagnostic testing and treatment among them.
4.1 CHILDREN AGED UNDER 5 YEARS WITH FEVER FOR WHOM ADVICE OR TREATMENT WAS SOUGHT FROM A TRAINED PROVIDER
Malaria is a febrile disease, and in most malaria endemic countries the disease is often suspected in children (or older patients) with fevers who seek treatment at health facilities. The WHO recommendation is that such patients are first tested for malaria and, if positive, treated appropriately by a trained health worker. Hence, the extent to which patients with fever seek treatment has been used as a measure for treatment seeking for malaria; however, this approach has some limitations. For example, what constitutes a “fever” varies by cultural context, which means that making comparisons across cultural groups can be problematic. In addition, not all fevers are due to malaria, and there is no conclusive evidence that the household and individual level decision-making processes for treatment seeking for malaria fevers are the same as for other fevers or across different ages. The proportion of
fevers attributable to malaria may therefore differ among those who seek treatment and those who do not. Surveys of households often only document one source of treatment for fever to be linked to reported use of medicines, but individuals may receive treatment from more than one source for the same episode of fever. Finally, a proportion of respondents may not recall the medication they received, resulting in misclassification of the drugs that were prescribed.
Despite the limitations, treatment seeking for fever remains the most consistently measured proxy of treatment seeking for malaria, particularly for sub-Saharan Africa, which accounts for more than 90% of global malaria cases, and in children aged under 5 years – the age group in which most cases are reported.
WORLD MALARIA REPORT 201722

Among 18 nationally representative surveys comple-ted in sub-Saharan Africa between 2014 and 2016 (representing 61% of the population at risk), care was sought for a higher proportion of febrile children (with reported fever in the past 2 weeks) in the public sector (median: 34%, interquartile range [IQR]: 28–44%) than in the private sector (median: 22%, IQR: 14–34%), as shown in Fig. 4.1. Most visits to the private sector were to the informal sector (median: 11%, IQR: 6–22%), which comprises pharmacies, kiosks, traditional healers, friends and relatives, and other non-medical facilities, rather than to the
formal private sector (median: 8%, IQR: 5–10%), which comprises private hospitals and clinics. Overall, a median of 47% (IQR: 38–56%) of febrile children were taken to a trained provider (i.e. to public sector health facilities, formal private sector facilities or community health workers).
A large proportion of febrile children were not brought for care (median: 39%, IQR: 29–44%). Possible reasons for this are poor access to health-care providers or a lack of awareness among caregivers about necessary care for febrile children.
FIG. 4.1.
Proportion of febrile children for whom care was sought, by health sector, sub-Saharan Africa, 2014–2016 Sources: Nationally representative household survey data from demographic and health surveys, and malaria indicator surveys
80%
60%
40%
20%
100%
0
Prop
ortio
n of
chi
ldre
n <5
year
s with
feve
r in
prev
ious
2 w
eeks
No treatmentsought
Communityhealth worker
Informalprivate sector
Formalprivate sector
Public sector
WORLD MALARIA REPORT 2017 23

4.2 SUSPECTED MALARIA CASES RECEIVING A PARASITOLOGICAL TEST
Seventeen nationally representative surveys completed in sub-Saharan Africa between 2014 and 2016 asked questions on diagnostic testing. Among these surveys, the proportion of febrile children who received a finger or a heel stick – suggesting that a malaria diagnostic test may have been performed – was greater in the public sector (median: 52%, IQR: 34–59%) than in both the formal private sector (median: 36%, IQR: 29–67%) and the informal private sector (median: 10%, IQR: 6–13%), as shown in Fig. 4.2.
Although the proportion of children seeking care from a community health worker was low, about a third received a diagnostic test (median: 30%, IQR:
16–39%). Combining the proportion of febrile children aged under 5 years for whom care was sought with the proportion of those for whom care was sought who received a parasitological test, a median of 30% of febrile children received a parasitological test among the 21 nationally representative household surveys analysed between 2014 and 2016 (IQR: 16–36%).
A trend of increased testing in the public sector is notable in the results of household surveys, where the proportion of febrile children who received a malaria diagnostic test in the public sector rose from a median of 28% in 2010 (IQR: 19–50%) to a median of 52% in 2016 (IQR: 34–59%) (Fig. 4.3).
FIG. 4.2.
Proportion of febrile children seeking care that received a blood test, by health sector, sub-Saharan Africa, 2014–2016 Sources: Nationally representative household survey data from demographic and health surveys, and malaria indicator surveys
80%
60%
40%
20%
100%
0Prop
ortio
n of
febr
ile c
hild
ren
that
so
ught
car
e at
trea
tmen
t out
let
Informal private sector
Community health worker
Formalprivate sector
Public sector
FIG. 4.3.
Proportion of febrile children attending public health facilities that received a blood test, sub-Saharan Africa, 2010–2016 Sources: Nationally representative household survey data from demographic and health surveys, and malaria indicator surveys
80%
60%
40%
20%
100%
0
Prop
ortio
n of
chi
ldre
n <5
year
sw
ith fe
ver i
n pr
evio
us 2
wee
ks
2014–20162013–20152012–20142011–20132010–2012
WORLD MALARIA REPORT 201724
Diagnostic testing and treatment4

In comparison, data reported by NMCPs indicate that the proportion of suspected malaria cases receiving a parasitological test among patients presenting for care in the public sector has increased in most WHO regions since 2010 (Fig. 4.4). The largest increase has been in the WHO African Region, where diagnostic testing increased from 36% of suspected malaria cases in 2010 to 87% in 2016, mainly owing to an increase in the use of RDTs, which accounted for 63% of diagnostic testing among suspected cases in 2016.
The household survey estimates may underestimate the testing rate in the public sector, due to both respondent recall problems and misclassification of the type of testing. On the other hand, the reported testing rate from public health facilities may
overestimate the true extent of diagnostic testing in the public sector. This is partly because the rate relies on accurate reporting of suspected malaria cases, and reporting completeness may be higher in countries with stronger surveillance systems and higher testing rates. In addition, the two sources of information are not always directly comparable because the numbers reported by NMCPs relate to all age groups, and because household surveys are undertaken in only a limited number of countries each year and are not representative of the regional estimates. It is encouraging, however, that both sources of data show a similar trend.
FIG. 4.4.
Proportion of suspected malaria cases attending public health facilities who received a diagnostic test by WHO region, 2010–2016 Source: National malaria control programme reports
2010201120122013201420152016
2010201120122013201420152016
2010201120122013201420152016
2010201120122013201420152016
2010201120122013201420152016
80%60%40%20%0 100%Proportion of suspected cases who were tested in public health facilities
AMR
EMR
SEAR
AFR
WPR
AFR, WHO African Region; AMR, WHO Region of the Americas; EMR, WHO Eastern Mediterranean Region; SEAR, WHO South-East Asia Region; WPR, WHO Western Pacific Region WORLD MALARIA REPORT 2017 25

4.3 MALARIA CASES RECEIVING FIRST-LINE ANTIMALARIAL TREATMENT ACCORDING TO NATIONAL POLICY
The median proportion of children aged under 5 years for whom care was sought and who received any antimalarial drug was 41% among 18 household surveys conducted in sub-Saharan Africa in 2014–2016 (IQR: 21–49%). The median proportion receiving an ACT was 19% (IQR: 6–31%) (Fig. 4.5). The low values can be attributed to two factors: many febrile children are not taken for care to a qualified provider (Section 4.1) and, in cases where children are taken for care, a significant proportion of
antimalarial treatments dispensed are not ACTs, especially in the private sector (Section 4.4). The apparent propor tions and trends indicated are uncertain because the IQRs of the medians are wide, indicating considerable variation among countries. Moreover, the number of household surveys is comparatively small, covering an average of 37% of the population at risk in sub-Saharan Africa in any one 3-year period.
FIG. 4.5.
Proportion of febrile children seeking care that received antimalarial medicines, sub-Saharan Africa, 2010–2016 Sources: Nationally representative household survey data from demographic and health surveys, and malaria indicator surveys
80%
60%
40%
20%
100%
0
Prop
ortio
n of
chi
ldre
n <5
year
s with
feve
r in
prev
ious
2 w
eeks
2014–20162013–20152012–20142011–20132010–2012Any ACTAny ACTAny ACTAny ACT Any ACT
ACT, artemisinin-based combination therapy; Any, any antimalarial
WORLD MALARIA REPORT 201726
Diagnostic testing and treatment4

Further investments are needed to better track malaria treatment at health facilities (through routine reporting systems and surveys) and at community level, to gain a greater understanding of the extent of barriers to accessing malaria treatment. Analysis should be focused on the
apparent mismatch between the large number of tests reported and the ACTs distributed by NMCPs, the relatively low levels of ACT prescriptions reported by patients who sought treatment, and the relatively low use of the public health sector reported from household surveys.
4.4 ARTEMISININ-BASED COMBINATION THERAPY TREATMENTS AMONG ALL MALARIA TREATMENTS
Based on nationally representative household surveys, the proportion of antimalarial treatments that were ACTs (for children with both a fever in the previous 2 weeks and for whom care was sought)
increased from a median of 39% in 2010–2012 (IQR: 24–68%) to 54% in 2014–2016 (IQR: 29–86%) (Fig. 4.6).
FIG. 4.6.
Proportion of febrile children seeking care and treated with antimalarial medicines that received an ACT, sub-Saharan Africa, 2010–2016 Sources: Nationally representative household survey data from demographic and health surveys, and malaria indicator surveys
ACT, artemisinin-based combination therapy
80%
60%
40%
20%
100%
0
Prop
ortio
n of
chi
ldre
n <5
year
s with
feve
r in
prev
ious
2 w
eeks
2014–20162013–20152012–20142011–20132010–2012
WORLD MALARIA REPORT 2017 27

However, the ranges associated with the medians are wide, indicating large variation between countries, and the number of household surveys covering any one 3-year period is relatively small. Antimalarial treatments are more likely to be ACTs if
treatment is sought for children at public health facilities (70% in 2014–2016, IQR: 43–94%) than if treatment is sought in the private sector (52% in 2010–2012, IQR: 33–80%) (Fig. 4.7).
4.5 INTEGRATED COMMUNITY CASE MANAGEMENT
A considerable proportion of the population, particularly those in rural remote areas, do not have access to prompt diagnosis and effective treatment of malaria. Integrated management of childhood illnesses (IMCI) and integrated community case management (iCCM) promote the integrated management of common life-threatening conditions in children at health facility and community levels. The introduction and increased availability of reliable malaria RDTs and effective malaria
treatment (ACTs), together with training of local community health workers, has made it possible to improve access to malaria case management in remote communities (24). For over a decade, WHO and UNICEF have been supporting and documenting the implementation of iCCM: the diagnosis and treatment of malaria, pneumonia and diarrhoea at community level, because these are responsible for over one third of deaths in children aged under 5 years.
FIG. 4.7.
Proportion of febrile children with a positive RDT at time of survey and treated with antimalarial medicines who received an ACT, by health sector, sub-Saharan Africa, 2014–2016 Sources: Nationally representative household survey data from demographic and health surveys, and malaria indicator surveys
ACT, artemisinin-based combination therapy; RDT, rapid diagnostic test
80%
60%
40%
20%
100%
0
Prop
ortio
n of
chi
ldre
n <5
year
s with
feve
r in
pre
viou
s 2 w
eeks
Communityhealth worker
Informalprivate sector
Formalprivate sector
Public sector
WORLD MALARIA REPORT 201728
Diagnostic testing and treatment4

FIG. 4.8.
iCCM policy adoption and implementation by WHO region by 2016 Source: WHO/UNICEF Global Integrated Management of Childhood Illness (IMCI) survey
AFR, WHO African Region; AMR, WHO Region of the Americas; EMR, WHO Eastern Mediterranean Region; iCCM, integrated community case management; SEAR, WHO South-East Asia Region; WPR, WHO Western Pacific Region
iCCM has been shown to increase (up to twofold) the treatment rate for malaria when treatment services for malaria are delivered with treatment for two other illnesses (25). iCCM also increases care seeking, as demonstrated by a recent evaluation from Uganda (26), which found that districts with iCCM experienced a 21% increase in care seeking for fever compared with districts without iCCM. Other advantages include reduced burden on health-care facilities; in one study, these have been shown to reduce costs of care by up to 31% (27).
The scale of iCCM implementation varies greatly (Fig. 4.8). As of 2016, 26 malaria affected countries in Africa had policies in place, of which 24 had started national or subnational implementation. In each of the WHO regions of South-East Asia, Eastern Mediterranean and the Americas, seven countries
had iCCM policies in place. However, in the Eastern Mediterranean and the Americas, only six countries in each region had embarked on some level of implementation. Few countries have nationwide implementation of iCCM, but data on coverage and quality of services are unavailable for most countries at this time.
A number of challenges hinder the full scale-up of iCCM. Effective iCCM relies heavily on community health workers being properly trained, equipped and supervised, which in turn requires government stewardship and investments, but resources are currently insufficient. There is increasing recognition of the need for institutionalization of community health workers into the formal health system to ensure continued provision of their needed health services.
WPRSEAREMRAMRAFR
25
20
15
10
5
30
0
Num
ber o
f cou
ntrie
s
■ Has national policy and is implementing iCCM ■ Has national policy but is not implementing iCCM
WORLD MALARIA REPORT 2017 29

Pillar 3 of the GTS is to transform malaria surveillance into a core intervention. This involves the establishment of passive case detection systems that perform optimally and are complemented, in elimination settings, with active case detection, to ensure that potentially all malaria cases are detected and treated. The information from surveillance systems is then used to optimize the deployment and impact of interventions to accelerate elimination, and eventually to confirm the interruption of transmission. Effective surveillance of malaria cases and deaths is essential for identifying which areas or population groups are most affected by malaria, and for targeting resources to communities most in need. Such surveillance also alerts ministries of health to epidemics, enabling control measures to be intensified when necessary.
Cases and deaths from the surveillance system reported by countries are often from the public health sector, predominantly through passive case detection. In elimination settings, data on cases may also be recorded during active case detection. Often, data from the private sector remain sparse, and in countries with moderate to high transmission it is possible that a substantial proportion of patients who do not seek care remain undocumented by the surveillance system.
A strong surveillance system therefore requires high levels of access to care and case detection, and complete reporting by all health sectors. This section describes the reporting rates in the public health sector by WHO region, and the proportion of overall malaria cases detected by this sector.
5.1 HEALTH FACILITY REPORTS RECEIVED AT NATIONAL LEVEL
The completeness of health facility reporting is a good indicator of a surveillance system’s performance. A high reporting rate is also critical to the accurate estimation of the burden of malaria. Health facility reporting rates become less relevant as countries progress towards elimination and begin to report individual cases. Nonetheless, to ensure that coverage of surveillance systems is complete, the number of health facilities testing for malaria should continue to be tracked.
In the WHO African Region, 37 out of 46 countries had at least 80% of public health facilities reporting
in 2016, and it was not possible to compute this indicator for two countries (Fig. 5.1). In the WHO Eastern Mediterranean Region, however, only three out of eight countries had 80% or more of public health facilities reporting in 2016. These measures of reporting rates may be uncertain because many countries may not know exactly how many public health facilities they should expect reports from, given that health facility lists may not be updated. Reporting from the private sector was present in only a few countries, accounting for less than 2% of all reported malaria cases.
5.2 MALARIA CASES DETECTED BY SURVEILLANCE SYSTEMS
Among 55 countries where the burden of malaria was estimated – from either adjustment of the routine data or the transformation of prevalence to incidence (Section 6) – the proportion of estimated cases reported by surveillance systems was lowest in Gabon (8%) and highest in the Bolivarian Republic of Venezuela (84%) (Fig. 5.2). Countries with weak malaria surveillance systems include India and Nigeria, two major contributors to the global burden
of malaria, with 8% and 16% of cases, respectively, detected by the surveillance system.
Countries shown in Fig. 5.2 represent over 90% of the global burden of malaria. Prioritizing investments in surveillance in these countries will yield a substantial return in resource optimization and accurate tracking of progress.
5MALARIA SURVEILLANCE SYSTEMS
WORLD MALARIA REPORT 201730

FIG. 5.1.
Health facility reporting rates by WHO region, 2014–2016 Source: National malaria control programme reports
AFR, WHO African Region; AMR, WHO Region of the Americas; EMR, WHO Eastern Mediterranean Region; EUR, WHO European Region; SEAR, WHO South-East Asia Region; WPR, WHO Western Pacific Region
FIG. 5.2.
Proportion of all cases that have been captured by the surveillance system in countries where malaria burden was estimated from either parasite rate-to-incidence model or adjustments of national routine data Sources: National malaria control programme reports and WHO estimates
100%80%60%40%20%0 100%80%60%40%20%0
Venezuela (Bolivarian Republic of)Brazil
RwandaCentral African Republic
ZambiaKenya
Democratic Republic of the CongoEthiopia
Côte d'IvoireChad
Solomon IslandsMozambique
ColombiaMalawi
Sierra LeoneGuinea-Bissau
GambiaNamibia
Burkina FasoBurundi
NigerAngola
Equatorial GuineaNicaragua
United Republic of TanzaniaSenegal
SudanPeru
ZimbabweBenin
Lao People's Democratic RepublicGuyana
TogoPapua New Guinea
EritreaMyanmar
MadagascarCameroon
South SudanCambodia
MaliUganda
GhanaHaiti
LiberiaAfghanistan
PakistanYemenGuinea
IndonesiaCongo
NigeriaMauritania
IndiaGabon
Proportion of estimated cases that have been reported through the surveillance system
2014 2015 20162014 2015 20162014 2015 20162014 2015 20162014 2015SEAREUREMRAMRAFR WPR
2016 2014 2015 2016
40
30
20
10
50
0
Num
ber o
f cou
ntrie
s
■ ≥80% ■ 70% to <80% ■ 70% ■ Unable to calculate
WORLD MALARIA REPORT 2017 31

To assess progress towards the targets and milestones of the GTS, this section of the report reviews the total number of cases and deaths estimated to have occurred in 2016.
Due to differences in the coverage and quality of surveillance systems in different countries, three main methods were used to estimate the number of malaria cases and incidence (see Annex 1 for method use by country).
Category 1 method – adjusted routine dataThis method usually applies to countries outside sub-Saharan Africa and to Botswana, Ethiopia, Namibia and Rwanda, where the public health sector surveillance system is good but some clinical diagnosis of cases still occurs and a substantial proportion of patients use the private sector or do not seek treatment. For such countries, case
data reported by the NMCPs were adjusted for test positivity rate (where clinical cases were also reported), public health sector reporting rates, fever treatment-seeking rates in the private sector and the rates of not seeking treatment.
6REGIONAL AND GLOBAL TRENDS IN MALARIA CASES AND DEATHS
WORLD MALARIA REPORT 201732

Category 2 method – parasite rate-to-incidenceFor many countries in sub-Saharan Africa, the surveillance systems do not capture all malaria cases, and data often come from the public health sector only. Not all cases in the public sector are reported consistently and, where cases are reported, a proportion of them may not be parasitologically confirmed. In addition, many patients either use the private sector or do not have adequate access to health care and therefore do not seek treatment.
Hence, the routine data remain unreliable for estimating malaria burden, with the reliability becoming poorer going further back in time. For these countries, a method developed by the Malaria Atlas Project is used, which estimates cases by employing an epidemiological model of the relationship between parasite prevalence and case incidence within a geospatial framework.
Category 3 method – unadjusted routine dataThis approach involves use of routine data reported by NMCPs without any adjustments. Countries for which this approach was used were Algeria, Argentina, Belize, Bhutan, Cabo Verde, China, Comoros, Costa Rica, Democratic People’s Republic of Korea, Ecuador, El Salvador, Iran (Islamic Republic of), Iraq, Malaysia, Mexico, Paraguay,
Republic of Korea, Sao Tome and Principe, Saudi Arabia, South Africa, Suriname, Swaziland and Thailand. These are countries that have high-quality surveillance systems and are near elimination, having reported few malaria cases (<10 000 cases) in most of the years since 2010 (Annex 1).
6.1 ESTIMATED NUMBER OF MALARIA CASES BY WHO REGION, 2000–2015
In 2016, an estimated 216 million cases of malaria occurred worldwide (95% CI: 196–263 million) compared with 237 million cases in 2010 (95% CI:
218–278 million) (Table 6.1). Compared with 2015, 5 million more malaria cases were estimated to have occurred globally in 2016.
TABLE 6.1.
Estimated malaria cases, 2010–2016 Estimated cases are shown with 95% upper and lower confidence intervals. Source: WHO estimates
Number of cases (000)
2010 2011 2012 2013 2014 2015 2016
Lower 95% CI 218 000 207 000 199 000 191 000 191 000 192 000 196 000
Estimated total 237 000 225 000 217 000 210 000 210 000 211 000 216 000
Upper 95% CI 278 000 267 000 262 000 256 000 256 000 257 000 263 000
Estimated P. vivax
Lower 95% CI 10 490 11 170 9 930 6 800 6 440 6 060 6 430
Estimated total 15 860 14 730 13 200 10 250 8 750 8 160 8 550
Upper 95% CI 21 680 19 630 18 000 14 600 11 520 10 640 11 140
WORLD MALARIA REPORT 2017 33

Most of the cases in 2016 were in the WHO African Region (90%), followed by the WHO South-East Asia Region (3%) and the WHO Eastern Mediterranean Region (2%) (Table 6.2, Fig. 6.1). About 4% of estimated cases globally were caused by P. vivax, but outside the African continent this proportion was 36% (Table 6.2).
P. vivax is the predominant parasite in the Americas (64%) and above 30% in South-East Asia and 40% in the Eastern Mediterranean regions (Table 6.2). Most cases of malaria caused by P. vivax occur in the WHO South-East Asia Region (58%), followed by the WHO Eastern Mediterranean Region (21%) and the WHO African Region (10%) (Table 6.2). Vivax
TABLE 6.2.
Estimated malaria cases by WHO region, 2016 Estimated cases are shown with 95% upper and lower confidence intervals (CI). Source: WHO estimates
Number of cases (000)
African Americas Eastern Mediterranean
South-East Asia
Western Pacific World
Lower 95% CI 176 000 665 3 600 10 900 1 200 196 000
Estimated total 194 000 875 4 300 14 600 1 600 216 000
Upper 95% CI 242 000 1 190 5 900 19 800 2 100 263 000
Estimated P. vivax
Lower 95% CI 182 405 1 360 3 280 214 6 430
Estimated total 859 556 1 790 4 960 385 8 550
Upper 95% CI 2 090 786 2 340 7 234 592 11 140
Proportion of P. vivax cases 0.4% 64% 42% 34% 24% 4%
FIG. 6.1.
Estimated malaria cases (millions) by WHO region, 2016 The area of the circles is proportional to the estimated number of cases in each region. Source: WHO estimates
AFR, WHO African Region; AMR, WHO Region of the Americas; EMR, WHO Eastern Mediterranean Region; SEAR, WHO South-East Asia Region; WPR, WHO Western Pacific Region
AFR194
SEAR14.6
EMR4.3
WPR1.6 AMR
0.9
■ P. falciparum ■ P. vivax
36%
0.3%
23%77%
42%58%
66%
34%99.7%
64%
WORLD MALARIA REPORT 201734
6 Regional and global trends in malaria cases and deaths

malaria cases reduced by more than 45% between 2010 and 2016.
Fifteen countries accounted for 80% of all malaria cases globally (Fig. 6.2a). Nigeria accounted for the highest proportion of cases globally (27%), followed
by the Democratic Republic of the Congo (10%), India (6%) and Mozambique (4%). In 2016, 85% of estimated vivax malaria cases occurred in just five countries (Afghanistan, Ethiopia, India, Indonesia and Pakistan) (Fig. 6.2b).
FIG. 6.2.
Estimated country share of (a) total malaria cases and (b) vivax malaria cases, 2016 Source: WHO estimates
(a)
(b)
■ Nigeria■ Democratic Republic of the Congo■ India■ Mozambique■ Ghana■ Mali■ Burkina Faso■ Niger■ Uganda■ United Republic of Tanzania■ Cameroon■ Côte d’Ivoire■ Guinea■ Rwanda■ Malawi■ Others
■ India■ Pakistan■ Ethiopia■ Afghanistan■ Indonesia■ Others
51%
27%
10%
4%
6%
4%4%4%
4%
4%
3%
3%
2%2%2%2%
20%
12%
10%
6%
6%
15%
WORLD MALARIA REPORT 2017 35

Of the 91 countries that had an indigenous malaria case in 2016, a decrease in malaria cases of more than 20% compared with 2015 was estimated in 16 countries, while an increase of a similar magnitude was estimated in 25 countries (Fig. 6.3).
The WHO regions of the Americas and Africa accounted for nearly 70% (n=17) of the countries that had increases of more than 20% in 2016 compared with 2015.
FIG. 6.3.
Number of countries where a reduction (green) or increase (red) of more than 20% in malaria cases has occurred between 2015 and 2016, by WHO region Source: WHO estimates
AFR, WHO African Region; AMR, WHO Region of the Americas; EMR, WHO Eastern Mediterranean Region; SEAR, WHO South-East Asia Region; WPR, WHO Western Pacific Region
15105051015Number of countries
■ >20% decrease, 2015–2016 ■ >20% increase, 2015–2016
SEAR 4 2
WPR 34
EMR 1 3
AFR 4 8
AMR 3 9
J Decrease Increase D
WORLD MALARIA REPORT 201736
6 Regional and global trends in malaria cases and deaths

Twenty-nine high-burden countries that accounted for 85% of malaria cases in 2016 had a change of more than 50 000 cases compared with 2015 (Fig. 6.4). Twenty-four had estimated increases of
between 50 500 (Chad) and over one million (Nigeria and Rwanda) cases, while five had decreases of between 151 000 (Gambia) and 856 000 (Madagascar).
FIG. 6.4.
Differences in malaria cases of more than 50 000 in 2015 and 2016 in countries with more than 300 000 malaria cases in 2015 Positive values indicate an increase, and negative values indicate a decrease. Source: WHO estimates
1 000 000750 000500 000250 0000250 000J Decrease Increase D
500 000750 0001 000 000
Rwanda
Nigeria
Democratic Republic of the Congo
Papua New Guinea
Niger
Mali
United Republic of Tanzania
Mozambique
Burkina Faso
Ghana
Uganda
Afghanistan
Guinea
Pakistan
Côte d’Ivoire
Malawi
Yemen
Cameroon
South Sudan
Zambia
Mauritania
Togo
Kenya
Chad
Gambia
Ethiopia
Zimbabwe
Senegal
Madagascar
WORLD MALARIA REPORT 2017 37

6.2 MALARIA CASE INCIDENCE RATE
For a balanced understanding, changes in numbers of malaria cases should be viewed in parallel with changes in incidence (i.e. the number of cases per 1000 population at risk), to account for population growth over time. The incidence rate of malaria globally declined steadily from 76 to 63 cases per 1000 population at risk from 2010 to 2016 (Fig. 6.5a),
representing an 18% decline (Fig. 6.6). In the WHO African Region, malaria incidence reduced from 256 to 206 cases per 1000 population at risk from 2010 to 2016 (Fig. 6.5a), representing a 20% reduction in case incidence (Fig 6.6). Among other regions, the WHO South-East Asia Region registered the largest decline (48%), followed by the WHO Region of the
FIG. 6.5.
Trends in malaria case incidence rate globally and by WHO region, 2010–2016 No indigenous cases were recorded in the WHO European Region in 2015. Source: WHO estimates
2016201520142013201220112010
250
200
150
100
50
300(a)
(b)
0
Mal
aria
inci
denc
e pe
r 100
0 po
pula
tion
at ri
sk
AFR
World
2016201520142013201220112010
20
15
10
5
25
0
Mal
aria
inci
denc
e pe
r 100
0 po
pula
tion
at ri
sk
EMR
SEAR
AMR
WPR
AFR, WHO African Region; AMR, WHO Region of the Americas; EMR, WHO Eastern Mediterranean Region; SEAR, WHO South-East Asia Region; WPR, WHO Western Pacific Region
WORLD MALARIA REPORT 201738
6 Regional and global trends in malaria cases and deaths

Americas (22%) and the WHO Western Pacific Region (12%) (Fig 6.5b and Fig. 6.6).
Between 2014 and 2016, however, the malaria case incidence rate remained unchanged globally and increased in all WHO regions except in the WHO European Region (Fig. 6.6). The highest percentage
increase was in the WHO Region of the Americas (36%) where malaria incidence began rising in 2013, largely due to increases in Brazil and Venezuela (Bolivarian Republic of).
FIG. 6.6.
Percentage change in malaria case incidence rate globally and by WHO region, 2010–2016 and 2014–2016 No indigenous cases were recorded in the WHO European Region in 2015. Source: WHO estimates
6040200-20-40-60-80-100
■ 2010–2016 ■ 2014–2016
EUR 100
SEAR 48 4
AMR 22 36
AFR 20 3
WPR 12 5
EMR 5 1.2
World 18 0.5
AFR, WHO African Region; AMR, WHO Region of the Americas; EMR, WHO Eastern Mediterranean Region; EUR, WHO European Region; SEAR, WHO South-East Asia Region; WPR, WHO Western Pacific Region
WORLD MALARIA REPORT 2017 39

In a number of countries in the WHO African Region, the reported number of cases confirmed using RDT or microscopy in the public health sector alone is greater than the number of estimated cases in 2016 (Table 6.3). In others, confirmed cases are ≥70% higher than the estimated cases from the parasite rate-to-incidence model, suggesting an improbably
high use of the public sector, given evidence of treatment seeking from household surveys (Section 4). WHO will review the data and methods to identify reasons for these differences and to potentially improve surveillance data and estimates of cases.
TABLE 6.3.
Cases estimated using: parasite rate-to-incidence model (current WHO approach); cases confirmed in the public health sector; and cases confirmed in the public health sector, adjusted for confirmation, reporting and treatment seeking rates Source: National malaria control programme reports and WHO estimates
Country Method i) Parasite-to-incidence model (current WHO approach)
Method ii) Confirmed cases in the public health sector
Method iii) Cases confirmed in the public health sector, adjusted for confirmation, reporting and treatment seeking rates
Ratio of cases (Method i:Method iii)
Angola 3 465 156 3 794 253 7 369 301 0.47
Burkina Faso 7 892 794 9 779 154 17 751 661 0.44
Burundi 1 643 872 8 274 062 15 468 564 0.11
Guinea-Bissau 132 586 150 903 253 423 0.52
Kenya 3 519 272 2 783 846 9 583 406 0.37
Liberia 1 093 659 1 191 137 4 659 583 0.23
Malawi 4 506 310 4 827 373 9 890 653 0.46
Mozambique 8 872 978 8 520 376 14 503 748 0.61
Sierra Leone 2 244 481 1 775 306 2 977 452 0.75
United Republic of Tanzania 6 880 659 5 193 520 10 865 481 0.63
Uganda 7 768 405 9 385 132 31 288 839 0.25
Zambia 3 148 638 4 851 319 8 541 200 0.37
Total 51 168 810 60 526 381 133 153 311 0.38
WORLD MALARIA REPORT 201740
6 Regional and global trends in malaria cases and deaths

TABLE 6.4.
Estimated number of malaria deaths by WHO region, 2010–2016 Source: WHO estimates
Number of deaths
2010 2011 2012 2013 2014 2015 2016
African 538 000 484 000 445 000 430 000 423 000 409 000 407 000
Eastern Mediterranean 7 200 7 100 7 700 7 800 7 800 7 600 8 200
European 0 0 0 0 0 0 0
Americas 830 790 630 620 420 450 650
South-East Asia 41 700 34 000 29 000 22 000 25 000 26 000 27 000
Western Pacific 3 800 3 300 4 000 4 300 2 900 2 600 3 300
World 591 000 529 000 487 000 465 000 459 000 446 000 445 000
FIG. 6.7.
Proportion of estimated malaria deaths attributable to the 15 countries with nearly 80% of malaria deaths globally in 2016 Source: WHO estimates
■ Nigeria■ Democratic Republic of the Congo■ Burkina Faso■ India■ Mali■ United Republic of Tanzania■ Niger■ Mozambique■ Ghana■ Uganda■ Kenya■ Angola■ Cameroon■ Guinea■ Chad
30%
14%
7%7%
5%
6%
5%
4%
4%
4%
3%3%
3%3% 2%
6.3 ESTIMATED NUMBER OF MALARIA DEATHS AND MORTALITY RATE BY WHO REGION, 2010–2016
In 2016, it was estimated that 445 000 deaths due to malaria had occurred globally, of which 407 000 deaths (approximately 91%) were in the WHO African Region (Table 6.4). This represents broadly similar levels of deaths to 2015, when 446 000 deaths were estimated to have occurred
globally. Approximately 80% of all deaths in 2016 occurred in 15 countries, all of which are in the WHO African Region, except for India. Nigeria, Democratic Republic of the Congo, Burkina Faso and India accounted for 58% of all malaria deaths globally (Fig. 6.7).
WORLD MALARIA REPORT 2017 41

FIG. 6.8.
Percentage decrease in malaria mortality rate (deaths per 100 000 population at risk) by WHO region, 2010–2016 Source: WHO estimates
040% 20%60%80%100%
EUR 100%
WPR 17%
AMR 27%
AFR 37%
SEAR 44%
World 32%
EMR <1%
AFR, WHO African Region; AMR, WHO Region of the Americas; EMR, WHO Eastern Mediterranean Region; EUR, WHO European Region; SEAR, WHO South-East Asia Region; WPR, WHO Western Pacific Region
Estimates of malaria mortality rate per 100 000 population at risk show that, compared with 2010, all regions where an indigenous malaria death was reported or estimated had recorded reductions by 2016, except the WHO Eastern Mediterranean Region where there has been a slight increase in mortality rate (Fig. 6.8). The largest decline in
mortality rate occurred in the WHO regions of South East Asia (44%), Africa (37%) and the Americas (27%). Between 2015 and 2016, however, there was no significant change in mortality rate in the WHO African Region, while a slight increase was reported in all other WHO regions (Fig. 6.9 and Fig. 6.10).
WORLD MALARIA REPORT 201742
6 Regional and global trends in malaria cases and deaths

FIG. 6.9.
Trends in malaria mortality rate (deaths per 100 000 population at risk) globally and in the WHO African Region, 2010–2016 Source: WHO estimates
FIG. 6.10.
Trends in malaria mortality rate (deaths per 100 000 population at risk) in WHO regions, 2010–2016 Source: WHO estimates
2016201520142013201220112010
60
40
20
80
0
Num
ber o
f mal
aria
dea
ths
per 1
00 0
00 p
opul
atio
n at
risk
12.9
43.0
■ AFR ■ World
2016201520142013201220112010
3
2
1
4
0
Num
ber o
f mal
aria
dea
ths
per 1
00 0
00 p
opul
atio
n at
risk
0.5
0.5
2.7
2.0
■ EMR ■ AMR ■ SEAR ■ WPR
AFR, WHO African Region
AMR, WHO Region of the Americas; EMR, WHO Eastern Mediterranean Region; SEAR, WHO South-East Asia Region; WPR, WHO Western Pacific Region
In the analysis of mortality, WHO uses a model that has parasite rate among children as a covariate to quantify malaria deaths among children aged under 5 in high-burden countries in sub-Saharan Africa. Malaria deaths over age five are imputed from malaria deaths under age 5 (see methods notes for Table 6.4) to compute total malaria deaths. This estimation approach currently does not use routine case incidence data from sub-Saharan
Africa in the mortality analysis, leading to a difference in trends between the routine case data and mortality estimates. The same issue is present as is seen with the parasite-to-incidence model (Table 6.3). As part of the broader review of malaria burden estimation methods, in 2018, the WHO will be looking into ways to incorporate case incidence data in the analysis of malaria mortality in sub-Saharan Africa.
WORLD MALARIA REPORT 2017 43

One of the GTS milestones for 2020 is elimination of malaria in at least 10 countries that were malaria endemic in 2015. A country can be considered for WHO certification of malaria elimination after it has reported zero indigenous cases of malaria for at least the past 3 consecutive years. Between 2000 and 2016, 18 countries attained zero indigenous cases for 3 years or more (Fig. 7.1); 10 of these countries attained zero indigenous cases for 3 years within the period 2011–2016. Between 2000 and 2016, six of the 18 countries that attained zero indigenous cases for 3 years or more were certified as free of malaria by WHO (Fig. 7.1).
Plans are under way to begin the certification process for Argentina and Paraguay, and Uzbekistan will formally request WHO certification of elimination by the end of 2017. Globally, the number of countries that were malaria endemic in 2000 and reported fewer than 10 000 malaria cases, and are therefore nearing elimination, increased from 37 in 2010 to 44 in 2016 (Fig. 7.2). These countries are distributed across the WHO regions as follows: the Americas (14), European (8), African (7), South-East Asia (6), Western Pacific (5) and Eastern Mediterranean (4).
7MALARIA ELIMINATION AND PREVENTION OF RE-ESTABLISHMENT
WORLD MALARIA REPORT 201744

FIG. 7.1.
Countries attaining zero indigenous malaria cases since 2000 Countries are shown by the year that they attained 3 consecutive years of zero indigenous cases; countries that have been certified as free of malaria are shown in green, with the year of certification in brackets. Source: Country reports
2000 Egypt United Arab Emirates (2007)
2001
2002
2003
2004 Oman Kazakhstan
2005
2006
2007 Morocco (2010) Syrian Arab Republic
2008 Armenia (2011)
2009 Turkmenistan (2010)
2010
2011 Iraq
2012 Georgia Turkey
2013 Argentina Kyrgyzstan (2016) Uzbekistan
2014 Paraguay
2015 Azerbaijan Sri Lanka (2016)
2016 Algeria
FIG. 7.2.
Number of countries that were malaria endemic in 2000 with fewer than 10 000 indigenous malaria cases in 2010 and 2016, by WHO region Source: National malaria control programme reports
AFR, WHO African Region; AMR, WHO Region of the Americas; EMR, WHO Eastern Mediterranean Region; EUR, WHO European Region; SEAR, WHO South-East Asia Region; WPR, WHO Western Pacific Region
5015 4540353025201050
World
Number of countries
■ Number of countries with <10 000 cases in 2010 ■ Number of countries with <10 000 cases in 2016
3744
EMR 44
SEAR 26
AMR13
14
WPR 35
EUR88
AFR77
WORLD MALARIA REPORT 2017 45

7.1 E-2020 INITIATIVE
In April 2016, WHO published an assessment of the likelihood of countries achieving malaria elimination by 2020. The assessment was based not only on the number of cases but also on countries’ declared malaria objectives and the informed opinions of WHO experts in the field (28). A total of 21 countries, spread across five WHO regions, were identified as the most likely to reach zero indigenous cases by 2020 (Table 7.1). These countries were termed eliminating countries for 2020 (E-2020) and are the special focus of WHO efforts to accelerate national elimination efforts and monitor progress towards malaria free status. An inaugural meeting of the NMCPs of the E-2020 countries was organized by WHO in March 2017 in Geneva.
Given a target of zero indigenous cases by 2020, the progress indicator for the countries is annual reports of indigenous cases. Overall, 11 E-2020 countries reported an increase of between four (Costa Rica) and 3768 (South Africa) cases between 2015 and 2016 (Table 7.1). Among the three E-2020 countries with zero indigenous cases in 2015, two (Algeria and Paraguay) maintained their malaria free status in 2016, and one (Costa Rica) saw an increase to four cases.
Of the three countries that had fewer than 10 cases in 2015, two (Cabo Verde and El Salvador) saw increases in cases in 2016, and one (Belize) saw a reduction in the number of cases from nine in 2015 to four in 2016. Of the four countries with between 10
TABLE 7.1.
Trends in indigenous malaria cases in the E-2020 countries Source: National malaria control programme reports
WHO region Country 2010 2011 2012 2013 2014 2015 2016Change 2015 to
2016
African Algeria 1 1 55 0 0 0 0 0Botswana 7 592 1 223 537 1221 3 594 878 1 911 +1 033Cabo Verde 47 7 1 22 26 7 48 +41Comoros 36 538 24 856 49 840 53 156 2 203 1 300 1 066 –234South Africa 8 060 9 866 5 629 8 645 11 705 555 4 323 +3 768Swaziland 268 549 562 962 711 157 350 +193
Americas Belize 150 72 33 20 19 9 4 –5Costa Rica 110 10 6 0 0 0 4 +4Ecuador 1 888 1 219 544 368 242 618 1 191 +573El Salvador 19 9 13 6 6 3 13 +10Mexico 1 226 1 124 833 495 656 517 551 +34Paraguay 18 1 0 0 0 0 0 0Suriname 1 712 771 356 729 401 81 76 –5
Eastern Mediterranean
Iran (Islamic Republic of) 1 847 1 632 756 479 358 167 84 –83
Saudi Arabia 29 69 82 34 30 83 272 +189South-East Asia
Bhutan 436 194 82 15 19 34 15 –19Nepal 43 377 32 650 20 542 16 241 8 033 6 599 4 218 –2 381Timor-Leste 113 260 36 185 8 078 1 564 521 122 143 +21
Western Pacific China 4 990 3 367 244 86 56 39 3 –36Malaysia 5 194 3 954 3 662 2 921 3 147 242 266 +24Republic of Korea 1 267 505 394 383 557 627 601 –26
E-2020, malaria eliminating countries for 2020
WORLD MALARIA REPORT 201746
Malaria elimination and prevention of re-establishment7

and 100 cases in 2015, three saw decreases in numbers of cases (Bhutan, China and Suriname) and one (Saudi Arabia) experienced an increase. In 2015, nine countries had between 100 and 1000 cases, and two of these (Iran [Islamic Republic of] and Republic
of Korea) experienced decreases in 2016. Comoros and Nepal, the only E-2020 countries reporting more than 1000 cases in 2015, both reported fewer cases in 2016.
7.2 WHO SUPPORT STRUCTURES FOR MALARIA ELIMINATING COUNTRIES
In March 2017, WHO launched the Framework for malaria elimination to provide guidance to all countries on the tools, activities and dynamic strategies required to achieve interruption of transmission and prevent re-establishment of malaria transmission. To further assist countries to achieve malaria elimination, the WHO Malaria Policy Advisory Committee (MPAC) endorsed the creation of two new committees to support malaria elimination goals: the Malaria Elimination Oversight
Committee (MEOC) and the Malaria Elimination Certification Panel (MECP). The MEOC (see Section 7.2.1) provides independent operational and programmatic advice as well as oversight monitoring of malaria elimination globally, to help guide WHO and countries’ elimination efforts. The MECP (see Section 7.2.2) reviews countries’ applications for elimination certification, and recommends whether countries should receive WHO certification.
7.2.1 The Malaria Elimination Oversight CommitteeThe purpose of the MEOC is to monitor and guide malaria elimination activities as part of a transparent, responsive and effective approach to malaria elimination in countries and regions actively pursuing that goal. The MEOC will review progress towards elimination, and the quality and coverage of malaria elimination strategies, in order to provide recommendations on how to accelerate elimination and prevent re-establishment of transmission.
The specific responsibilities of the MEOC are to: ■ evaluate national and regional progress towards
malaria elimination according to established milestones and timelines;
■ determine the need for corrective actions to address programmatic or operational bottlenecks, and evaluate plans developed to address such issues;
■ identify any risks to malaria elimination that need to be addressed by WHO, regional initiatives or national programmes;
■ provide observations or draft recommen dations to the WHO Global Malaria Programme with respect to policies or guidance related to malaria elimination; and
■ question the status quo and confront difficult issues.
The MEOC will have up to 10 full and two adjunct members. Full members are experts in the field of malaria or disease elimination, and adjunct members are representatives of NMCPs.
7.2.2 The Malaria Elimination Certification PanelCountries that have achieved at least 3 consecutive years with zero indigenous malaria cases may request WHO certification of elimination. The MECP is charged with reviewing the evidence submitted by national programmes, conducting evaluation missions to verify reports, and recommending when a country has met the criteria for elimination and should be certified by the WHO Director-General.
The specific duties of the MECP are to:
■ review submitted country documentation and national elimination reports;
■ conduct field missions to verify findings in the national elimination report; and
■ develop a final evaluation report with a recommen-dation on whether to certify malaria elimination.
The MECP comprises at least eight malaria experts representing different specialties and regions of the world.
WORLD MALARIA REPORT 2017 47

The GTS (1) recognizes that the fight against malaria may be prolonged, and in some places slowed down, by several interconnected challenges. These challenges include the lack of robust, predictable and sustained international and domestic financing; the risks posed by conflict and other complex situations; the emergence of parasite resistance to antimalarial medicines and of mosquito resistance to insecticides; and the inadequate performance of health systems.
This section of the report documents some of these challenges and their current status, to focus global attention on the potential issues that may have already slowed progress in some countries or reversed gains in others.
8.1 FUNDING FOR MALARIA
Despite the unprecedented funding for malaria in recent years, the US$ 2.7 billion invested in 2016 accounts for only 41% of the estimated annual investment required to achieve the GTS goals. Funding levels per capita at risk have either plateaued or decreased across most WHO regions relative to the peak years of 2012 or 2013 (Fig. 8.1).
The flattening or decreasing trends in funding mean that, for some countries, available resources may only be sufficient to make limited progress; in other countries, progress may be reversed altogether.
An analysis of malaria funding in 41 high-burden countries that rely mainly on external funding for the implementation of malaria interventions shows a
mixed picture. Funding (domestic and international) per capita population at risk in the past 3 years (2014–2016) has reduced relative to 2011–2013 estimates in all these countries, except for Democratic Republic of the Congo, Guinea, Mauritania, Mozambique, Niger and Senegal (Fig. 8.2). In 10 of these countries, there was a reduction in average per capita population at risk funding of more than 50%. Although further work is required to analyse the effect of funding patterns on disease burden in these countries, the average funding per person at risk remains below US$ 2 over the past 3 years and it is likely that decreasing funds will lead to gradual deterioration of the coverage and quality of interventions, and eventually to loss of previous gains.
8RESPONDING TO THREATS TO THE FIGHT AGAINST MALARIA
WORLD MALARIA REPORT 201748

FIG. 8.2.
Percentage change in average of funding (US$) per capita population at risk in 2011–2013 and 2014–2016 in 41 high-burden countries Sources: ForeignAssistance.gov; Global Fund to Fight AIDS, Tuberculosis and Malaria; national malaria control programmes; Organisation for Economic Co-operation and Development creditor reporting system; the World Bank Data Bank; Department for International Development
FIG. 8.1.
Per capita expenditure for malaria control and elimination by WHO region, 2010–2016 For detailed information on data sources and methodology, refer to Annex 1. Sources: ForeignAssistance.gov; Global Fund to Fight AIDS, Tuberculosis and Malaria; national malaria control programmes; Organisation for Economic Co-operation and Development creditor reporting system; the World Bank Data Bank; Department for International Development
2016201520142013201220112010
3
2
1
4
0
US$
per c
apita 2.28
1.99
0.84
0.290.24
1.14
■ AFR ■ AMR ■ EMR ■ SEAR ■ WPR ■ World
Congo
Yemen
Togo
Papua New Guinea
Eritrea
Afghanistan
Gambia
Ethiopia
Kenya
Mali
Central African Republic
Benin
Côte d’Ivoire
Angola
Gabon
Ghana
Rwanda
United Republic of Tanzania
Burundi
Madagascar
Uganda
Burkina Faso
Cameroon
South Sudan
Sierra Leone
Somalia
Liberia
Malawi
Sudan
Zambia
Zimbabwe
Nigeria
Chad
Guinea-Bissau
Pakistan
Senegal
Guinea
Mozambique
Democratic Republic of the Congo
Niger
Mauritania
1007550250255075100 1007550250255075100
Percentage change in per capita population at risk funding (US$) Percentage change in per capita population at risk funding (US$)
J Decrease Increase D J Decrease Increase D
AFR, WHO African Region; AMR, WHO Region of the Americas; EMR, WHO Eastern Mediterranean Region; EUR, WHO European Region; SEAR, WHO South-East Asia Region; WPR, WHO Western Pacific Region
WORLD MALARIA REPORT 2017 49

8.2 MALARIA IN COMPLEX SITUATIONS
Complex situations, whether as a result of natural factors such as excessive rains, flooding or earthquakes, or human-made ones such as conflict and political crises, often disrupt service delivery and the implementation of interventions. Where the ecological conditions are suitable for malaria, such situations often result in increased malaria transmission, disease and deaths. The burden of disease can be exceptionally high among the most vulnerable, such as children and pregnant women, especially when worsening nutritional conditions impair their capacity to fight the disease.
The Global Malaria Programme, in collaboration with the WHO Health Emergencies Programme, pays close attention to the malaria situation in complex settings, and facilitates the response. This section highlights recent malaria trends and responses in four countries where complex conditions have led to an increase in malaria cases: Nigeria (Borno State), South Sudan, Yemen and the Bolivarian Republic of Venezuela. WHO is also providing continued support to other countries with complex situations, such as Afghanistan and Somalia.
8.2.1 Nigeria: Borno StateBetween 2009 and 2013, Boko Haram has led an insurgency in Borno State that has caused high levels of insecurity, substantial population displacements and near total disruption of public services, including disruption of an already very weak health system. With the violence becoming widespread, the Nigerian Government declared a state of emergency in northern Nigeria in May 2013. In August 2016, the government declared that Boko Haram had been defeated, meaning that humanitarian agencies could now reach 3.7 million people in previously inaccessible parts of Borno State. By this time, nearly 60% of the health facilities in Borno had either been damaged or destroyed. Record child death rates of up to 8.4 deaths per 10 000 children per day were observed among displaced populations. On 26 August 2016, WHO declared the Borno situation an emergency. Given the high levels of P. falciparum transmission in the state, malaria was reported as being the single largest contributor to morbidity (60%), and was a major cause of death among children aged under 5 years (40%) as of September 2016.
In response to this emergency, the Global Malaria Programme, in collaboration with the Borno State Ministry of Health, developed a malaria response component as part of the WHO emergencies response toolkit, which includes vector control, case management and mass drug adminis tration (19), to dramatically reduce malaria mortality in the region, particularly among young children. To complement improvements in vector control and case management, WHO recommended the use of repeated rounds of mass drug administration for children aged under 5 years, the most vulnerable
population groups, whether or not they show symptoms of the disease. Mass drug administration is a WHO-recommended approach for preventing malaria mortality and morbidity in high-risk groups. Through mass drug administration, all individuals in a target population are given antimalarial treatment (often at repeated intervals), regardless of whether or not they show symptoms of the disease. Beginning in July 2017, at the onset of the peak malaria transmission season, all children aged under 5 years in targeted areas received their first monthly round of treatments. Second, third and fourth cycles were implemented in August, October and November 2017. These interventions reached a total of 1.2 million children, and early results suggest a reduction of malaria cases in Borno. These activities were integrated into the WHO polio campaigns.
WORLD MALARIA REPORT 201750
Responding to threats to the fight against malaria 8

8.2.2 South SudanSince 2013, ongoing widespread factional conflicts have put the South Sudan health system under severe strain and have interrupted malaria control in most parts of the country. This situation is com-pounded by generalized advanced food insecurity, and massive internal and external population move-ments.
Despite these difficulties, the South Sudanese Ministry of Health, with the support of WHO and several international nongovernmental organiza-tions (NGOs), has been able to deliver a substantial degree of emergency health services as part of an integrated strategic and operational response plan. Achievements include strengthening case manage-
ment through training and dispatching of community volunteers to attend to inaccessible villages. Substantial efforts have also gone into the distribu-tion of LLINs. However, in large pockets of the country there is neither vector control nor access to functioning health facilities, and the burden of malaria continues to rise relative to the status before the civil conflict (Fig. 8.3). Continued external support and expansion of the humanitarian inter-ventions must remain a priority. An additional priority is the millions of refugees that have crossed to neighbouring countries, especially into Uganda, where 1 million refugees from South Sudan have settled in the north-east of the country (29).
FIG. 8.3.
Malaria cases in South Sudan, 2010–2016 Sources: WHO estimates
2016201520142013201220112010
2 000 000
1 900 000
1 800 000
1 700 000
1 600 000
2 100 000
1 500 000
Num
ber o
f mal
aria
cas
es
1 945 060
WORLD MALARIA REPORT 2017 51

8.2.3 YemenThe current Yemeni civil war began in March 2015 and has since spread across the whole country. WHO estimates that about 15 million people lack access to basic health care, including 8.8 million living in severely underserved areas. As of October 2016, at least 274 health facilities had been damaged or destroyed, and 13 health workers had been killed and 31 injured (30). The main causes of avoidable deaths in Yemen are communicable dis-eases; maternal, perinatal and nutritional conditions (together accounting for 50% of mortality); and non communicable diseases (39% of mortality). There have been two waves of cholera in Yemen, the first beginning in October 2016 and the second in April 2017. As part of a broader project between UNICEF, the World Bank and WHO, activities have started to support 65 hospitals and more than 1000 primary health centres across Yemen (31).
Before the civil war, Yemen had achieved impressive results in reducing the burden of malaria, and was considering launching elimination activities in a number of very low transmission states (32). Since the war, direct government support to the NMCP reduced to a point where staff had not received salaries for 1 year, and the national health information system has been badly weakened. Direct donor support to the NMCP has either reduced or stopped, leading to major scale-back of implementation activities. Although there has been some funding support through the Global Fund and the World Bank, funds remain inadequate; also, it has sometimes been difficult to monitor activities where operational support to NMCP staff has not been available. Consequently, the malaria cases are beginning to increase again, with an additional estimated 100 000 malaria cases in 2016 relative to 2015 (Fig. 8.4).
FIG. 8.4.
Malaria cases in Yemen, 2010–2016 Sources: WHO estimates
2016201520142013201220112010
500 000
400 000
300 000
200 000
100 000
600 000
0
Num
ber o
f mal
aria
cas
es
433 092
WORLD MALARIA REPORT 201752
Responding to threats to the fight against malaria 8

8.2.4 Bolivarian Republic of VenezuelaHistorically, the Bolivarian Republic of Venezuela has served as a model for malaria eradication in the Americas, with its northern region declared malaria free by the WHO in 1961 (33). Following the recent political and economic crises, malaria has been increasing annually since 2008. Between 2015 and 2016, reported cases increased by over 76% (from 136 402 to 240 613), with the country overtaking Brazil as the larger contributor to the malaria burden in the Americas, and the cases reported in 2016 were the highest in the country’s history (Fig. 8.5).
The malaria problem is focal and is concentrated in the state of Bolivar (74% of cases), which borders Guyana. The municipality of Sifontes in Bolivar state reported 43% of all the cases in the Bolivarian Republic of Venezuela in 2016. The areas most affected are those where gold mining occurs; the population of these areas has increased in recent times due to the harsh economic conditions. Miners are not legally registered, and most settlements are informal and hard to reach. About 40% of all cases in the Bolivarian Republic of Venezuela were reported in miners. Most of the malaria cases are due to P. vivax with only about 25% due to P. falciparum. Recently, malaria has gradually spread into other areas, includ-ing some that were previously declared malaria free.
Although malaria treatment is free in the public health sector, availability of antimalarial drugs has reduced. The number of people protected by IRS has declined significantly, from over 2.7 million people in 2015 to around 30 000 people in 2016. Bednet coverage was never high in the country, pro-tecting a maximum of 30 000 people in 2010 and declining since then. ITNs were used by only a small proportion of the population because they were not considered the main vector control intervention, but the coverage of ITNs is also reducing among tar-geted populations. Anopheles darlingi, the predo mi nant vector in the country, is considered to be anthropophilic, and has highly adaptable resting and feeding behaviour. Given the precarious situa-tion in which miners live, vector-control interventions are vital for decreasing malaria in the country.
The Bolivarian Republic of Venezuela is not currently eligible for funding from the Global Fund and does not receive funding from other external sources. Since 2010, government spending on malaria has varied; it reached almost US$ 10 million in 2015, but in 2016 declined to about one fifth of this amount (US$ 2.2 million), even though malaria almost doubled during that time.
FIG. 8.5.
Malaria cases in the Bolivarian Republic of Venezuela, 2010–2016 Sources: National malaria control programme reports and WHO estimates
2016201520142013201220112010
250 000
200 000
150 000
100 000
50 000
300 000
0
Num
ber o
f mal
aria
cas
es
240 613
WORLD MALARIA REPORT 2017 53

8.3 FALSE-POSITIVE DIAGNOSIS DUE TO PARASITE DELETION OF HISTIDINE-RICH PROTEINS
Distributions of malaria RDTs have increased, which has helped to improve the accurate diagnosis of malaria and thus increase the likelihood of appro-priate treatment. Ensuring the safety and quality of the RDTs used in malaria control and case manage-ment has been a major focus of WHO and its partners. The tests that are most sensitive for detect-ing falciparum malaria contain antibodies to detect histidine-rich protein 2 (HRP2) or the related HRP3 protein. These protein targets, which are specific to P. falciparum, are strongly expressed by asexual parasites. About 10 years ago, researchers working in the Amazon region of Peru identified patients infected with P. falciparum strains in which the genes that encode these proteins (pfhrp2 and pfhrp3) were deleted (34), which meant the strains were not detected with HRP2-based RDTs. Since then, such strains have been found in other countries and regions. The frequency and global distribution of this phenomenon is not yet fully understood; however, in a few countries, the relative incidence of these dele-tions has been found to be high enough to threaten the usefulness of HRP2-only RDTs.
In 2016, WHO started a rigorous process of collating all information on pfhrp2 deletions studies and of providing direct support to Member States to inves-tigate patients who were suspected of being infected with P. falciparum but returned a negative RDT result (35). In May 2016, WHO released infor-mation notes targeted at NMCPs and partners, and it released revised notes in September 2017. These notes provided updated information on the implica-tions of reports of pfhrp2 and pfhrp3 gene deletions in the case of management of patients infected with
P. falciparum parasites, and advised on procedures for investigating suspected false-negative RDT results. WHO is currently finalizing a protocol for determining whether the number of pfhrp2 deletions that cause negative results in HRP2 RDTs among symptomatic patients with confirmed falciparum malaria has reached a threshold that requires a change in diagnostic strategy. This protocol includes a sampling tool, a report form and data entry tem-plates.
WHO continues to recognize the urgency of this issue and, during the November meeting of the MPAC, discussed a Global Action Plan (GAP) for a response to pfhrp2 and pfhrp3 deletions. The aim is to support NMCPs and their implementing partners to address this problem pragmatically. Thus, it is expected that the GAP will focus on:
■ defining the frequency and distribution of these diagnostically relevant mutations in circulating P. falciparum strains;
■ providing concrete guidance to countries on malaria diagnosis and treatment in settings where such mutations are found to be frequent;
■ identifying gaps in knowledge about the genesis and spread of strains with pfhrp2 or pfhrp3 deletions (or both), and the actions required to develop new, accurate tests for malaria based on alternative target antigens; and
■ coordinating advocacy and communication with donors, policy-makers, test developers, research agencies, technical partners and disease control programmes to assist in planning.
8.4 PARASITE RESISTANCE – ANTIMALARIAL DRUG EFFICACY AND RESPONSE
ACTs have been integral to the recent success of global malaria control, and protecting their efficacy for the treatment of malaria is a global health priority. The main advantage of ACTs is that the artemisinin quickly reduces most of the malaria parasites and the partner drug clears the remaining ones. However, the efficacy of ACTs is threatened by the emergence of both artemisinin and partner drug resistance. Partial resistance to artemisinin causes delayed parasite clearance following treatment with an ACT. Such resistance does not usually lead to treatment failure; however, if the artemisinin component is less effective, the partner drug has to clear a greater parasite mass,
jeopardizing the future efficacy of the partner drug. In addition, partner drug resistance can arise independently of artemisinin resistance. Given that an effective partner drug is essential for clearing all remaining parasites, partner drug resistance carries a high risk of treatment failure. Because of their different roles, the efficacy of the artemisinin and the partner drug must be monitored concomitantly but separately.
For P. vivax, chloroquine (CQ) remains an effective first-line treatment in many countries. Countries endemic for vivax malaria recommend either CQ or an ACT for treating uncomplicated P. vivax. Most also
WORLD MALARIA REPORT 201754
Responding to threats to the fight against malaria 8

include primaquine (PQ) to eliminate latent liver stage infections and prevent relapse. In addition, PQ improves the activity of CQ against CQ-resistant
blood stage parasites. Where there is a high treatment failure rate with CQ (>10%), countries are encouraged to change their first-line treatment to an ACT.
8.4.1 Status of antimalarial drug efficacy (2010–2016)The WHO global database on antimalarial drug efficacy and resistance contains data on therapeutic efficacy studies (TESs) for P. falciparum and P. vivax and, more recently, data from studies of molecular markers. Up-to-date summary reports of the global
database are available on the Global Malaria Programme website at www.who.int/malaria/areas/drug_resistance/drug_efficacy_database/en/. This section outlines the status of antimalarial drug efficacy in the WHO regions for 2010–2016.
WHO AFRICAN REGIONArtemether-lumefantrine (AL) and artesunate-amo-diaquine (ASAQ) are the first-line treatment policies used in most African countries, with some countries adding dihydroartemisinin-piperaquine (DP). Bet-ween 2010 and 2016, the overall average efficacy of DP, ASAQ and AL were 98.7%, 98.3% and 97.9%, respectively. When the failure rates of all three treat-ments were analysed separately by year, it was found that their high efficacy has remained constant over time. In studies of AL, treatment failure rates above 10% occurred in three countries (Angola,
Gambia and Malawi), although lumefantrine resis-tance could not be confirmed by molecular marker, in vitro test or blood dosage levels. In Africa, arte-misinin resistance was not confirmed.
Studies of P. vivax were conducted in Ethiopia, Madagascar (both of which had previously reported CQ resistance) and Mauritania. In Ethiopia, treat-ment failure rates ranged from 3% to 22% (median: 5.1%). Treatment failure rates of 0% for ASAQ were reported in Madagascar and for CQ in Mauritania.
WHO REGION OF THE AMERICASThe first-line treatment policy is AL in Bolivia (Plurinational State of), Brazil, Colombia, Ecuador, French Guiana, Guyana, Panama and Suriname; artesunate-mefloquine (ASMQ) in Brazil, Peru and Venezuela (Bolivarian Republic of); and CQ+PQ in Costa Rica, Dominican Republic, Guatemala, Haiti, Honduras and Nicaragua. Apart from one small study conducted in Suriname in 2011 (which detected a 9% treatment failure rate with AL), studies in the period 2010–2016 showed effective first-line treat-ment for P. falciparum (treatment failure rates 0%). Artemisinin resistance was suspected in French Guiana, Guyana and Suriname, but molecular markers of artemisinin resistance (PfK13 C580Y) were only detected in a retrospective study of Guyanese samples from 2010, and a larger survey in 2016 confirmed the emergence of artemisinin resis-tance with a genetic profile compatible with a South American origin. In Guatemala, Haiti, Honduras and
Nicaragua, molecular marker studies of Pfcrt are conducted in lieu of TESs. Between 2010 and 2015, more than 1000 samples were analysed and the mutation was rarely observed. Two TESs conducted in Haiti reported treatment failures, but reinfections were not excluded and no Pfcrt mutants were detected in the failing cases.
For P. vivax, treatment failures or confirmed resis-tance (or both) were reported previously in Bolivia (Plurinational State of), Brazil, Colombia, Guyana and Peru. Between 2010 and 2016, studies of P. vivax were conducted in Bolivia (Plurinational State of), Brazil, Colombia and Peru. All countries conducted studies for P. vivax with CQ alone or with CQ and PQ. In Bolivia (Plurinational State of), a study con-ducted in 2011 found a CQ treatment failure rate of 10.4%, with 6.3% confirmed resistance. Treatment failure rates in the other three countries were all below 10%.
WHO SOUTH-EAST ASIA REGIONAL is the first-line treatment policy in Bangladesh, Bhutan, Nepal and Timor-Leste; AL and artesuna-te+sulfadoxine-pyrimethamine (AS+SP) are the first-line treatments in India, and DP is the first-line treatment in Indonesia and Thailand. Myanmar has
several first-line treatments for P. falciparum, including AL, ASMQ and DP. With the exception of four studies, first-line treatment for P. falciparum was effective, with treatment failures of less than 10% during this period. The exceptions were in India,
WORLD MALARIA REPORT 2017 55

where three studies conducted in 2012 detected treatment failure rates of 12.1%, 17.3% and 21.4% with AS+SP, which led the country to change its treatment policy to AL in the north-eastern part of the country; and one study from Bangladesh, where there was a 11.1% treatment failure rate with AL in a small sample size. Studies of molecular markers of artemisinin resistance have been conducted in Bangladesh, India, Indonesia, Myanmar, Nepal and Thailand, and the presence of molecular markers of artemisi-nin resistance has been reported in Myanmar and
Thailand. Currently, there is no evidence of artemis-inin (partial) resistance in Bangladesh or India, in contrast to Myanmar and Thailand.
For P. vivax, treatment failures or confirmed resis-tance to CQ were reported previously in India, Indonesia, Myanmar and Thailand. Although most studies demonstrated high efficacy of CQ, very high treatment failure rates with CQ were reported from Myanmar in 2012, but this finding was not confirmed later. Similarly, one study from Timor-Leste found high treatment failure rates.
WHO EASTERN MEDITERRANEAN REGIONUntil recently, the first-line treatment for all countries in the WHO Eastern Mediterranean Region was AS+SP, with the exception of Djibouti, where AL is the current first-line treatment. High treatment failure rates with AS+SP were observed in Somalia and Sudan. These results were further supported by investigations of the presence of Pfdhps and Pfdhfr quadruple and quintuple mutations. The evidence prompted a treatment policy change in both
Somalia and Sudan to AL (first-line) and DP (sec-ond-line). Recent studies of both treatments indicate high efficacy. In Afghanistan, Iran (Islamic Republic of), Pakistan and Yemen, treatment failure rates with AS+SP were all less than 10%.
Studies of P. vivax were conducted in Afghanistan, Iran (Islamic Republic of), Pakistan and Sudan. TESs con-ducted on CQ and several ACTs all indicated high treatment efficacy, with failure rates of 0%.
WHO WESTERN PACIFIC REGIONAL is the first-line treatment policy for most countries in the region, with the exception of Cambodia, China and Viet Nam, where the first-line treatment is ASMQ or DP. In Cambodia, high treatment failure rates were identified in Cambodia (2010–2017 DP; 2014 artesunate-pyronaridine [2 studies]; 2016 ASAQ [2 studies]), but the efficacy of the current first-line treatment, ASMQ, is now high (0% failure 2014–2016), contrary to a study conducted in 2010 detecting a treatment failure rate of 11.1%. Further in vitro analy-ses reported absence of cross-resistance between piperaquine and pyronaridine, and molecular studies indicated that artesunate-pyronaridine treat-ment failures were unrelated to the presence of molecular markers of piperaquine and mefloquine resistance. ASMQ has continued to have high effi-cacy over the past 3 years, despite a high prevalence of PfK13 C580Y mutants in the area. In Lao People’s Democratic Republic, two among eight studies of AL observed high treatment failure rates (10% and 14.3%) in 2013 and 2014, respectively. In Viet Nam, four of the 35 studies conducted during this period demon-strated high treatment failure rates with DP in 2014 and 2015 (range: 25.9–46.3%). Subsequent investiga-tions confirmed the presence of piperaquine resistance. The evidence prompted a treatment policy change in Viet Nam from DP to other ACTs in September 2016 in areas where DP is failing. All TESs conducted in China, Papua New Guinea, Philippines
and Solomon Islands in 2010–2016 confirmed that the national treatment policy is still effective.
For P. vivax, the first-line treatment in most countries in the region is CQ with primaquine, except for Cambodia (DP) and Papua New Guinea, Solomon Islands and Vanuatu (AL). Treatment failures or con-firmed resistance to CQ were reported previously in Cambodia, Malaysia, Papua New Guinea, Republic of Korea, Solomon Islands, Vanuatu and Viet Nam. All countries conducted studies on their first-line treatment. In Malaysia, a TES of CQ in 2012 found a high treatment failure rate (61.9%), and one study of CQ in Viet Nam found a failure rate of 11.1% (2015). High treatment failure rates were also observed with AL in Papua New Guinea (35% in 2011), Solomon Islands (31.6% in 2011) and Vanuatu (12.1% in 2013), possibly explained by the short half-life of lumefan-trine in areas where early relapses occur.
WORLD MALARIA REPORT 201756
Responding to threats to the fight against malaria 8

ACT, artemisinin-based combination therapy
8.4.2 Preventing and responding to antimalarial drug resistanceIn areas where the recommended antimalarial treat-ments remain fully efficacious, the correct use of medicine is essential; this requires expansion of diag-nostic testing, quality-assured treatment and good patient adherence to the prescribed treatment. Further extending basic malaria interventions, includ-ing vector control, will reduce the number of parasites exposed to a drug and the risk of resistance.
Use of oral artemisinin-based monotherapy is con-sidered a contributing factor in the development and spread of resistance to artemisinins. WHO has urged regulatory authorities in malaria endemic countries to take measures to halt the production and marketing of oral artemisinin-based monother-apy, and to promote access to quality-assured ACTs for the treatment of falciparum malaria.
In countries where resistance is reported either to artemisinins or to ACT partner drugs, it is necessary to intensify malaria control to reduce the burden of disease, and delay or prevent the spread of resis-tance. In areas of low transmission where antimalarial drug resistance is present, countries
should target rapid elimination of falciparum malaria, to limit the risk of spread and minimize the impact of resistance in the region.
8.4.3 Global public health implications of antimalarial drug resistanceAntimalarial drug resistance is a threat to malaria control and has important implications for global public health. In particular, when CQ resistance emerged in Africa in the 1980s, there were docu-mented increases in hospital admissions and mortality, mainly due to severe malaria and increased transmission. Resistance to antimalarial drugs has had a significant impact on the cost of global malaria control (due to the need for new drugs, and the social and health costs of treatment failure).
The consequences of the development of resistance to antimalarial medicines today are likely to be less severe than those observed when CQ resistance developed in the 1980s, owing to the implementation of combination therapies, improvements to health systems, increased surveillance systems to monitor first- and second-line treatment, and the availability of guidelines on policy change.
Currently, five ACTs are recommended by WHO in the Greater Mekong subregion: AL, AS+AM, ASMQ, AS+SP and DP. A sixth ACT, artesunate-pyronaridine, was given a positive scientific opinion by the European Medicines Agency (EMA) under article 58 and is being considered for recommendation by WHO. By default, AS+SP is considered to have a high failure rate in the region because of high treatment failure rates with SP, or because quadruple and quintuple Pfdhfr and Pfdhps mutations (which are usually fixed) have been reported in the region. The countries are classified by numbers of ACTs failing (>10% treatment failure) after 2010.
India
Myanmar
China
Viet Nam
Thailand
Cambodia
Lao People’sDemocratic
Republic
High ACT failurerate (>10%) to:
■ 1 ACT■ 2 ACTs■ 3 ACTs■ 4 ACTs
WORLD MALARIA REPORT 2017 57
FIG. 8.6.
Number of ACTs failing in the Greater Mekong subregion

8.5 INSECTICIDE RESISTANCE
Resistance of malaria vectors to the four insecticide classes commonly used in ITNs or IRS threatens malaria prevention and control efforts. Of the 76 malaria endemic countries that reported stan-dard monitoring data for 2010 to 2016, resistance was detected in 61 countries to at least one insecti-cide in one malaria vector from one collection site. In 50 countries there was resistance to two or more insecticide classes. Resistance to the four insecticide classes was detected in vectors present in all WHO regions except Europe, although the extent of mon-itoring varied between regions. The majority of data were reported by countries of the WHO African Region (70%) (Fig. 8.7).
Resistance to pyrethroids – the insecticide class used in all ITNs – is widespread (Fig. 8.8). The proportion of malaria endemic countries that reported pyre-throid resistance (of those that monitored for it) increased from 71% in 2010 to 81% in 2016; 16 of the 72 countries that monitored throughout this period did not detect pyrethroid resistance. The prevalence of confirmed pyrethroid resistance differed between regions, and was highest in the WHO African and Eastern Mediterranean regions, where it was detected in malaria vectors in over two thirds of all sites monitored (Fig. 8.7).
Resistance to the three other insecticide classes used in adult malaria vector control is also present across all WHO regions except Europe. In countries that conducted monitoring between 2010 and 2016, resis-tance was confirmed to at least one organochlorine, carbamate and organophosphate insecticide in 80%, 65% and 51% of countries, respectively. Organochlorine (mainly DDT) resistance was detected in at least one malaria vector species at almost two thirds of the sites tested in four regions, with low prevalence in the WHO Region of the Americas and no testing in the WHO European Region (Fig. 8.7). Carbamate resistance was detected in malaria vectors at a third of all locations monitored worldwide. Organophosphate resistance was detected in malaria vectors at over half of sites monitored in the WHO Eastern Mediterranean, South-East Asia and Western Pacific regions, but was less prevalent in vectors in Africa and the Americas.
Further data as reported to WHO – such as on the mechanisms underpinning vector resistance and results from intensity concentration and synergist-in-secticide assays – are available via the new WHO Malaria Threats Map. This map tracks biological challenges to malaria control and elimination, and is accessible at www.who.int/malaria/maps/threats.
8.5.1 Addressing the challenge of insecticide resistanceUp-to-date and representative data on insecticide resistance are needed for planning and implementa-tion of vector control. Monitoring should be conducted in all malaria endemic countries at least once per year, and should include all major vector species from the different eco-epidemiological zones. Tests should be conducted with insecticide classes that are either in use or planned for use in vector control.
Monitoring of insecticide resistance in major malaria vector species is critical to track changes over time and between areas, to guide locally appropriate vector control. However, resistance monitoring is usually not conducted on a routine basis because of limited human and financial resources. Management, sharing and reporting of available data are also weak in many countries. As a result of these limita-tions, information continues to be inadequate, particularly on resistance intensity. In 2017, only 23 countries reported having completed plans for resistance monitoring and management.
The impact of pyrethroid resistance on ITN effective-ness is not yet well known. A WHO-coordinated five-country evaluation conducted in areas with pyrethroid-resistant malaria vectors did not find an association between malaria disease burden and
levels of resistance, and showed that ITNs still pro-vided personal protection. Nevertheless, evidence of geographical spread of resistance and intensifica-tion in some areas underscores the urgent need to better understand the implication of insecticide resistance on the effectiveness of malaria vector control tools, as well as to reduce reliance on pyre-throids through the development, evaluation and implementation of new tools.
Priority actions to address malaria vector resistance include establishing and applying national insecticide resistance monitoring and management plans, in line with WHO’s 2012 Global plan for insecticide resistance management in malaria vectors (36). Guidance on such plans is provided in the 2017 Framework for a national plan for monitoring and management of insecticide resistance in malaria vectors (37). New vector monitoring and control tools and approaches are also urgently required. The WHO process for the evaluation of vector-control products has been revised to accelerate product evaluation, in order to enable continued scale-up and strengthening of vector control, and to address key challenges such as vector insecticide resistance. Further information is available at www.who.int/vector-control/.
WORLD MALARIA REPORT 201758
Responding to threats to the fight against malaria 8

FIG. 8.7.
Reported insecticide resistance status as a proportion of sites for which monitoring was conducted by WHO region, 2010–2016 Highest resistance status is shown, with confirmed resistance considered if this was reported in at least one major malaria vector species to at least one insecticide of the class indicated. Sources: National malaria control programme reports, African Network for Vector Resistance, Liverpool School of Tropical Medicine, Malaria Atlas Project, US President’s Malaria Initiative and scientific publications
FIG. 8.8.
Reported pyrethroid resistance status of malaria vectors measured with insecticide bioassays, 2010–2016 Data are from standard WHO insecticide susceptibility or Centers for Disease Control and Prevention (CDC) bottle bioassays. Where multiple insecticide classes or types, mosquito species or time points were tested, the most recent resistance status is shown. Sources: National malaria control programme reports, African Network for Vector Resistance, Liverpool School of Tropical Medicine, Malaria Atlas Project, US President’s Malaria Initiative and scientific publications
■ ≥1 cases■ Zero cases in 2016■ Zero cases (≥3 years)
Resistance status● Confirmed resistance● Possible resistance● Susceptible
■ Certified malaria free since year 2000■ No malaria■ Not applicable
WPRSEAREUREMR
Organochlorines
Carbamates Organophosphates
AMRAFR WPRSEAREUREMRAMRAFR
80%
60%
40%
20%
100%
0
80%
60%
40%
20%
100%
0
Prop
ortio
n of
mos
quito
col
lect
ion
sites
■ Confirmed resistance ■ Possible resistance ■ Susceptible
n=1182 n=150 n=252 n=3 n=287 n=285 n=735 n=32 n=155 n=0 n=96 n=90
n=831 n=27 n=140 n=0 n=2n=108 n=13 n=729 n=56 n=118 n=60 n=47
Pyrethroids
AFR, WHO African Region; AMR, WHO Region of the Americas; EMR, WHO Eastern Mediterranean Region; EUR, WHO European Region; SEAR, WHO South-East Asia Region; WPR, WHO Western Pacific Region
WORLD MALARIA REPORT 2017 59

The World malaria report 2017 summarizes global achievements in the fight against malaria up to the end of 2016, a year after the launch of the GTS (1), AIM (2) and the SDGs (3). The information provided shows countries and the global malaria community whether we are on a trajectory towards achieving the global strategic vision and goals for 2020 and beyond. A baseline year of 2010 provides sufficient trend data to relate the current status to past trends.
Substantial funding continues to be invested in the fight against malaria, with over US$ 19 billion invested by governments of malaria endemic countries and international partners since 2010. In 2016 alone, the total investment in malaria control and elimination was estimated to be US$ 2.7 billion. However, the trends have remained flat, and in some high-burden countries funding support has reduced considerably. Overall, malaria funding in 2016 was only 41% of the 2020 milestone of US$ 6.5 billion (4), putting the 2020 milestones at great risk.
Pillar 1 of the GTS calls for universal access to malaria interventions (1). The distribution of ITNs has increased considerably since 2010 but the rate of increase has slowed since 2014. In 2015 and 2016, a total 360 million ITNs were distributed by NMCPs globally; of these, over 90% were distributed in sub-Saharan Africa, where the proportion of the population with access to ITNs was 61% in 2016. Access to ITNs, however, remained variable, with many high-burden countries having a large gap in household ITN ownership. About 100 million people were protected by IRS in 2016, but the proportion of the population at risk who benefited from this intervention fell substantially, to nearly a half of those protected in 2010.
Preventive treatment of pregnant women in malaria endemic countries has risen since 2010; however, it is still low (only 19%) when the three recommended doses of SP for IPTp are considered. In the 12 countries currently implementing SMC, impressive gains have been made since 2014, with over 15 million children reached with treatments
by 2016. However, there are still important gaps in coverage, with about 13 million children who could have benefited from this intervention not covered, mainly due to lack of funding.
The increasing distribution of RDTs by NMCPs since 2010 has led to considerable improvements in the accurate diagnosis of patients who seek care in public health facilities. In the WHO African Region, where confirmation was historically the lowest, 87% of all patients suspected of having malaria at public health facilities were tested, mainly with RDTs. This represented a more than two-fold increase in the diagnosis rate compared with 2010. Similarly, considerably more patients now receive effective antimalarial drugs, with 70% of all malaria patients in the public health sector in sub-Saharan Africa receiving ACTs for malaria in 2016. Despite this progress, overall coverage with ACTs is compromised by the low access to clinical services, as indicated by the very low proportion of people with fevers who seek treatment. In several countries, iCCM policies were adopted to improve access to care but coverage remains low, with most countries reporting only subnational scale-up. Inadequate resources and low levels of integration with national health plans have been some of the main bottlenecks to increasing the proportion of the population reached through iCCM.
9CONCLUSION
WORLD MALARIA REPORT 201760

Pillar 2 of the GTS calls for countries to accelerate efforts towards malaria elimination (1). Globally, the number of countries that were malaria endemic in 2000 and reported fewer than 10 000 malaria cases increased from 37 in 2010 to 44 in 2016. In 2016, Kyrgyzstan and Sri Lanka were certified by WHO as malaria free. Plans are under way to begin the certification process for Argentina and Paraguay, and Uzbekistan will formally request WHO certification of elimination by the end of 2017.
In March 2017, WHO held the inaugural meeting of the 21 countries of the E-2020 initiative (which com-prises countries with the potential to reach zero indigenous cases in 2020) in Geneva. Although several of these countries remain on track to achieve the E-2020 goal, 11 have reported increases in indig-enous malaria cases since 2015. Also, five of these 11 countries (Botswana, Ecuador, Saudi Arabia, South Africa and Swaziland) have reported an increase of more than 100 cases in 2016 compared with 2015.
Pillar 3 of the GTS is to transform malaria surveil-lance into a core intervention (1). Public health sector malaria surveillance systems continue to detect a higher proportion of cases and, with increasing rates of diagnosis, the reported data are becoming increasingly reliable for estimating trends. However, surveillance systems in 31 countries with high malaria burden captured less than 50% of malaria cases, and improved data from these countries will have a substantial impact on future estimates of malaria burden and trends. The relatively high usage of private health service providers and the lack of data from this sector continue to be a major surveillance bottleneck.
Target 3.3 of the SDGs aligns with the GTS malaria burden reduction goals (1,3). The analysis of global progress summarized in this report suggests that the world is not on a trajectory to achieve the GTS targets. Although substantial reductions in malaria burden have occurred since 2010, the trend indicates an increasing burden between 2014 and 2016. Globally, conservative estimates suggest that malaria cases have increased by 5 million in 2016 compared with 2015. In the same period, the number of deaths remained largely the same. Many of these increases in malaria cases have occurred in the WHO African Region, but all other regions have also reported increases in this period. New data from national surveillance systems suggests that we may be underestimating the burden of malaria and WHO will embark on a detailed review of national data and estimation methods in 2018. Even with the
current conservative estimates, however, globally, the fight against malaria is at a crossroads.
Factors that may have contributed to the reversal in recent progress in many countries include inade-quate funding, inefficient implementation of interventions, conflict and other crises, and anoma-lous climate patterns. Many high-burden but low-income countries have reported reducing the funding per capita for the population at risk of malaria. The complex situations in northern Nigeria, South Sudan, Venezuela (Bolivarian Republic of) and Yemen have all resulted in interruption of services and increasing malaria burden. Biologically, increasing levels of pfhrp2 deletions threaten the ability to diagnose and appropriately treat malaria patients infected with P. falciparum parasites. Prevalence of pfhrp2 deletions in most high-burden countries remains low, and further monitoring is required. Although the threat of drug resistance remains serious and global vigilance must remain high, the immediate threat is low and ACTs remain efficacious in most malaria endemic settings. Also, recent evidence indicates that although ITNs remain effective in protecting populations from mosquito bites, vector resistance to most of the commonly used insecticides is widespread and further research is needed into the overall public health impact of insecticide resistance. Investments in new diagnostic tools, drugs and insecticides must remain a priority. Most importantly, insufficient resources remain the greatest threat to the gains the world has made so far in the fight against malaria.
WORLD MALARIA REPORT 2017 61

1. WHO. Global technical strategy for malaria 2016–2030. Geneva: World Health Organization (WHO); 2015 (http://www.who.int/malaria/areas/global_technical_strategy/en, accessed 19 October 2017).
2. Roll Back Malaria Partnership Secretariat. Action and investment to defeat malaria 2016–2030. For a malaria-free world. Geneva: World Health Organization (WHO); 2015 (http://www.rollbackmalaria.org/files/files/aim/RBM_AIM_Report_A4_EN-Sept2015.pdf, accessed 19 October 2017).
3. UN. Sustainable development goals: 17 goals to transform our world [website]. United Nations (UN); 2015 (http://www.un.org/sustainabledevelopment/sustainable-development-goals, accessed 19 October 2017).
4. Patouillard E, Griffin J, Bhatt S, Ghani A, Cibulskis R. Global investment targets for malaria control and elimination between 2016 and 2030. BMJ Global Health. 2017;2(2):e000176 (http://gh.bmj.com/content/2/2/e000176, accessed 23 October 2017).
5. WHO. WHO recommendations for achieving universal coverage with long-lasting insecticidal nets in malaria control (revised March 2014). Geneva: World Health Organization (WHO); 2013 (http://www.who.int/malaria/publications/atoz/who_recommendations_universal_coverage_llins.pdf?ua=1, accessed 19 October 2016).
6. WHO. Guidelines for the treatment of malaria, third edition. Geneva: World Health Organization (WHO); 2015 (http://www.who.int/malaria/publications/atoz/9789241549127/en, accessed 19 October 2017).
7. Lengeler C. Insecticide-treated bed nets and curtains for preventing malaria. Cochrane Database Syst Rev. 2004;(2):CD000363 (http://www.ncbi.nlm.nih.gov/pubmed/15106149, accessed 19 October 2017).
8. Eisele TP, Larsen D, Steketee RW. Protective efficacy of interventions for preventing malaria mortality in children in Plasmodium falciparum endemic areas. Int J Epidemiol. 2010;39:i88–i101.
9. Pluess B, Tanser FC, Lengeler C, Sharp BL. Indoor residual spraying for preventing malaria. Cochrane Database of Syst Rev. 2010;(4):CD006657 (http://www.ncbi.nlm.nih.gov/pubmed/20393950, accessed 30 November 2016).
10. Bhatt S, Weiss DJ, Cameron E, Bisanzio D, Mappin B, Dalrymple U et al. The effect of malaria control on Plasmodium falciparum in Africa between 2000 and 2015. Nature. 2015;526(7572):207–211.
11. WHO. Larval source management – a supplementary measure for malaria vector control. An operational manual. Geneva: World Health Organization (WHO); 2013 (http://apps.who.int/iris/bitstream/10665/85379/1/9789241505604_eng.pdf?ua=1, accessed 19 October 2017).
12. Radeva-Petrova D, Kayentao K, ter Kuile FO, Sinclair D, Garner P. Drugs for preventing malaria in pregnant women in endemic areas: any drug regimen versus placebo or no treatment. Cochrane Database Syst Rev. 2014;(10):CD000169 (https://www.ncbi.nlm.nih.gov/pubmed/25300703, accessed 24 October 2017).
13. Kayentao K, Garner P, van Eijk AM, Naidoo I, Roper C, Mulokozi A et al. Intermittent preventive therapy for malaria during pregnancy using 2 vs 3 or more doses of sulfadoxine-pyrimethamine and risk of low birth weight in Africa: systematic review and meta-analysis. JAMA. 2013;309(6):594–604 (https://www.ncbi.nlm.nih.gov/pubmed/23403684, accessed 24 October 2017).
14. Garner P, Gulmezoglu AM. Drugs for preventing malaria-related illness in pregnant women and death in the newborn. Cochrane Database Syst Rev. 2003;(1):CD000169 (https://www.ncbi.nlm.nih.gov/pubmed/12535391, accessed 24 October 2017).
15. Aponte JJ, Schellenberg D, Egan A, Breckenridge A, Carneiro I, Critchley J et al. Efficacy and safety of intermittent preventive treatment with sulfadoxine-pyrimethamine for malaria in African infants: a pooled analysis of six randomised, placebo-controlled trials. Lancet. 2009;374(9700):1533–1542 (http://www.ncbi.nlm.nih.gov/pubmed/19765816, accessed 15 November 2016).
16. Meremikwu MM, Donegan S, Sinclair D, Esu E, Oringanje C. Intermittent preventive treatment for malaria in children living in areas with seasonal transmission. Cochrane Database Syst Rev. 2012;2(2):CD003756.
17. Wilson AL, IPTc Taskforce. A systematic review and meta-analysis of the efficacy and safety of intermittent preventive treatment of malaria in children (IPTc). PLoS One. 2011;6(2):e16976.
18. Cairns M, Roca-Feltrer A, Garske T, Wilson AL, Diallo D, Milligan PJ et al. Estimating the potential public health impact of seasonal malaria chemoprevention in African children. Nat Commun. 2012;3:881.
19. WHO. Mass drug administration for falciparum malaria: a practical field manual. Geneva: World Health Organization (WHO); 2017 (https://extranet.who.int/iris/restricted/handle/10665/259367, accessed 27 October 2017).
References
WORLD MALARIA REPORT 201762

20. Bhatt S, Gething P. Insecticide-treated nets (ITNs) in Africa 2000–2016: coverage, system efficiency and future needs for achieving international targets. Malar J. 2014;13(Suppl 1):029.
21. WHO. WHO policy brief for the implementation of intermittent preventive treatment of malaria in pregnancy using sulfadoxine-pyrimethamine (IPTp-SP) (WHO/HTM/GMP/2014.4) – revised January 2014). Geneva: World Health Organization (WHO); 2013 (http://www.who.int/malaria/publications/atoz/iptp-sp-updated-policy-brief-24jan2014.pdf?ua=1, accessed 22 October 2017).
22. WHO. Seasonal malaria chemoprevention with sulfadoxine-pyrimethamine plus amodiaquine in children: a field guide. World Health Organization (WHO); 2013 (http://www.who.int/malaria/publications/atoz/9789241504737/en/, accessed 25 October 2017).
23. Thwing J, Eisele TP, Steketee RW. Protective efficacy of malaria case management and intermittent preventive treatment for preventing malaria mortality in children: a systematic review for the Lives Saved Tool. BMC Public Health. 2011;11:S14 (http://www.ncbi.nlm.nih.gov/pubmed/21501431, accessed 19 November 2014).
24. WHO. The Roll Back Malaria strategy for improving access to treatment through home management of malaria. Geneva: World Health Organization (WHO); 2005 (http://www.who.int/malaria/publications/atoz/who_htm_mal_2005_1101/en/, accessed 23 October 2017).
25. Diaz T, Aboubaker S, Young M. Current scientific evidence for integrated community case management (iCCM) in Africa: findings from the iCCM Evidence Symposium. J Glob Health. 2014;4(2):020101 (https://www.ncbi.nlm.nih.gov/pubmed/25520783, accessed 27 October 2017).
26. Mukanga D, Tiono AB, Anyorigiya T, Kallander K, Konate AT, Oduro AR et al. Integrated community case management of fever in children under five using rapid diagnostic tests and respiratory rate counting: a multi-country cluster randomized trial. Am J Trop Med Hyg. 2012;87(5 Suppl):21–29 (https://www.ncbi.nlm.nih.gov/pubmed/23136274, accessed 23 October 2017).
27. Chanda P, Hamainza B, Moonga HB, Chalwe V, Banda P, Pagnoni F. Relative costs and effectiveness of treating uncomplicated malaria in two rural districts in Zambia: implications for nationwide scale-up of home-based management. Malar J. 2011;10:159 (https://www.ncbi.nlm.nih.gov/pubmed/21651828, accessed 23 October 2017).
28. WHO. Malaria elimination: report from the inaugural global forum of countries with potential to eliminate malaria by 2020. Wkly Epidemiol Rec. 2017;92(39):578–586 (https://www.ncbi.nlm.nih.gov/pubmed/28960948, accessed 27 October 2017).
29. UNHCR. Khaled Hosseini marks one millionth South Sudanese refugee in Uganda. The UN Refugee Agency (UNHCR); (http://www.unhcr.org/news/stories/2017/8/59944a0b4/khaled-hosseini-marks-millionth-south-sudanese-refugee-uganda.html, accessed 31 October 2017).
30. WHO. Yemen Humanitarian Response Plan 2017. Geneva, World Health Organization (WHO); (http://www.who.int/emergencies/response-plans/2017/yemen/en/, accessed 31 October 2017).
31. WHO. Inside the struggling Al-Jumhoori Hospital in Sa’ada, Yemen. Geneva, World Health Organization (WHO); (http://www.who.int/emergencies/yemen/health-workers/en/, accessed 29 October 2017).
32. Towards a malaria-free Yemen. The national strategy for malaria control and elimination 2014–2018. Yemen: National Malaria Control Programme, Ministry of Public Health & Population, Republic of Yemen; 2014.
33. Griffing SM, Villegas L, Udhayakumar V. Malaria control and elimination, Venezuela, 1800s -1970s. Emerg Infect Dis. 2014;20(10):1697-1704 (https://www.ncbi.nlm.nih.gov/pubmed/25396258, accessed 3 November 2017).
34. Gamboa D, Ho MF, Bendezu J, Torres K, Chiodini PL, Barnwell JW et al. A large proportion of P. falciparum isolates in the Amazon region of Peru lack pfhrp2 and pfhrp3: implications for malaria rapid diagnostic tests. PLoS One. 2010;5(1):e8091 (https://www.ncbi.nlm.nih.gov/pubmed/20111602, accessed 27 October 2017).
35. WHO. False-negative RDT results and implications of new reports of P. falciparum histidine-rich protein 2/3 gene deletions World Health Organization (WHO); 2017 (http://apps.who.int/iris/bitstream/10665/258972/1/WHO-HTM-GMP-2017.18-eng.pdf, accessed 27 October 2017).
36. WHO. Global plan for insecticide resistance management in malaria vectors. Geneva: World Health Organization (WHO); 2012 (http://www.who.int/malaria/publications/atoz/gpirm/en/, accessed 19 October 2017).
37. WHO. Framework for a national plan for monitoring and management of insecticide resistance in malaria vectors. Geneva: World Health Organization (WHO); 2017 (http://www.who.int/malaria/publications/atoz/9789241512138/en/, accessed 23 October 2017).
WORLD MALARIA REPORT 2017 63


AnnexesAnnex 1 - Data sources and methodsAnnex 2 - Regional profiles
> A. West Africa > B. Central Africa > C. East and Southern Africa > D. Countries with low transmission in East and Southern Africa > E. Region of the Americas > F. Eastern Mediterranean Region > G. European Region > H. South-East Asia Region > I. Western Pacific Region
Annex 3 - Data tables > A. Policy adoption, 2016 > B. Antimalarial drug policy, 2016 > C. Funding for malaria control, 2014–2016 > D. Commodities distribution and coverage, 2014–2016 > E. Household survey results, 2014–2016 > F.a. Estimated malaria cases and deaths, 2010–2016 > F.b. Population at risk for estimates of malaria cases and deaths, 2010–2016 > G. Population at risk and reported malaria cases by place of care, 2016 > H. Reported malaria cases by method of confirmation, 2010–2016 > I. Reported malaria cases by species, 2010–2016 > J. Reported malaria deaths, 2010–2016
WORLD MALARIA REPORT 2017 65

Annex 1 – Data sources and methods
Fig. 1.1. Countries and territories with indigenous cases in 2000 and their status by 2016Data on the number of indigenous cases (an indicator of whether countries are endemic for malaria) were as reported to WHO by national malaria control programmes (NMCPs). Countries with 3 consecutive years of zero indigenous cases are considered to have eliminated malaria.
Table 1.1. GTS: Global targets for 2030 and milestones for 2020 and 2025Targets and milestones are as described in the Global technical strategy for malaria 2016–2030 (GTS) (1) and Action and investment to defeat malaria 2016–2030 (AIM) (2).
Fig. 2.1. Investments in malaria control and elimination by source of funds (constant 2016 US$), 2010–2016Contributions from governments of endemic countries are estimated as the sum of NMCP expenditures reported by NMCPs for the world malaria report of the relevant year plus the estimated costs of delivery of patient-care services at government health facilities. If NMCP contributions were missing for 2016, data from previous years were used after conversion to the equivalent 2016 US$ value. The number of malaria cases attending outpatient services at government facilities was derived from WHO estimates of malaria cases (see methods notes for Table 6.1) multiplied by the proportion of estimated cases seeking care at government facilities (data from NMCP reports). Between 1% and 3% of uncomplicated cases were assumed to have moved to the severe stage of disease, and 50–80% of these severe cases were assumed to have been hospitalized. Costs of outpatient visits and inpatient bed-stays were estimated from the perspective of the public health-care provider, using WHO-CHOICE unit cost estimates in current international dollars for 2010–2016.1 Years with missing gross domestic product (GDP) data were imputed by inflating the GDP per capita by 3% per year over the period of the missing years before running the CHOICE model. Years with missing country-level unit cost data were imputed using the regional average when no data were available in previous years. CHOICE estimates were then converted to local currency in each year using purchasing power parity (PPP) conversion factors and to US$ using official exchange rate of local currency per US$, sourced from the World Bank.2 Uncertainty around unit cost estimates
1 http://www.who.int/choice/en/2 https://data.worldbank.org/indicator3 https://stats.oecd.org/Index.aspx?DataSetCode=CRS1, accessed 03 October 20174 https://www.theglobalfund.org/en/government/, accessed 25 September 20175 https://stats.oecd.org/Index.aspx?DataSetCode=CRS1, accessed 30 September 2017
was estimated through probabilistic uncertainty analysis. Fig. 2.1 shows the mean total costs of service delivery to malaria patients from 1000 estima tions.
International bilateral funding data were obtained from several sources. Data on funding from the Government of the United States of America (USA) were sourced from the US Foreign Aid Dashboard, with the technical assistance of the Kaiser Family Foundation. Funding data were available for the United States Agency for International Development (USAID), the US Centers for Disease Control and Prevention (CDC) and the US Department of Defense. Contributions from the Department for International Development (DFID) of the Government of the United Kingdom on funding for malaria control were extracted from the DFID management information systems and converted to 2016 US$ (note this data excludes funding from other departments of the Government of the United Kingdom of Great Britain and Northern Ireland). In this report, contributions from the United Kingdom do not capture all spending that may affect malaria outcomes such as support to overall health-system strengthening in malaria endemic countries. Bilateral funding from other countries included annual disbursement flows for 2010–2015 obtained from the Organisation for Economic Co-operation and Development (OECD) creditor reporting system (CRS) database on aid activity.3 For each year and each funder, the country-level and regional-level project-type interventions and other technical assistance were extracted. The 2015 value converted to constant 2016 US$ was used as the 2016 estimated disbursement. Estimates of total spent by bilateral donors on malaria control and elimination exclude health-system strengthening contributions that may benefit malaria control. Fig. 2.1 also excludes household spending on malaria prevention and treatment, and malaria-related research and development investments.
Multilateral funding amounts in terms of core contributions from donors to multilateral agencies were sourced from data on core pledges and contributions published by the Global Fund to Fight AIDS, Tuberculosis and Malaria (Global Fund)4 (i) and annual disbursements for malaria grants to malaria endemic countries between 2010 and 2016 as reported by the Global Fund, and (ii) the CRS and the Development Assistance Committee (DAC) members’ total use of the multilateral system.5 All funding flows were converted to the equivalent 2016 US$ value.
For (i), the amount of funding contributed by each donor was estimated as the proportion of funding contributed by each donor out of the total amount of funding pledged
WORLD MALARIA REPORT 201766

by all donors in a given period, multiplied by the total amount disbursed by the Global Fund in that given year, assuming equal contributions every year by each donor over the 3-year periods for which data were available. The proportion of funding contributed by each donor was adjusted by the “amount pledged to amount paid” ratio.
For (ii), contributions from donors to multilateral channels were estimated by calculating the proportion of the total contributions received by a multilateral agency each year by each donor, then multiplying that amount by the multilateral agency’s estimated investment in malaria in the same year. Contributions by malaria endemic countries to multilateral agencies were allocated to governments of endemic countries under the “funding source” category. Contributions from non-DAC countries and other sources were not available and were therefore not included in the “Other funders” category.
Fig. 2.2. Investments in malaria control and elimination by channel delivered (constant 2016 US$), 2010–2016See methods notes for Fig. 2.1 for sources of information on funding from governments of malaria endemic countries and on international funding flows.
Fig. 2.3. Investments in malaria control and elimination by WHO region (constant 2016 US$), 2010–2016See methods notes for Fig. 2.1 for sources of information on funding from governments of malaria endemic countries and on international funding flows. The “Unspecified” category includes all funding for which there was no geographical information on the recipient.
Fig. 2.4. Investments in malaria research and development by source and by research area, 2010–2015 (in US$ million)Data on funding for malaria-related research and development for 2010–2015 were collected directly from the G-FINDER Public Search Tool.1 All data were converted to constant 2016 US$.
Fig. 2.5. Number of ITNs delivered by manufacturers and delivered by NMCPs, 2010–2016Data on the number of insecticide-treated mosquito nets (ITNs) delivered by manufacturers to countries were provided to WHO by Milliner Global Associates. Data from NMCP reports were used for the number of ITNs distributed within countries.
1 https://gfinder.policycuresresearch.org/PublicSearchTool2 http://www.map.ox.ac.uk/
Fig. 2.6. Proportion of ITNs distributed through different delivery channels in sub-Saharan Africa, 2014–2016Data were derived from NMCP reports.
Fig. 2.7. Number of RDTs sold by manufacturers and distributed by NMCPs, 2010–2016The numbers of rapid diagnostic tests (RDTs) distributed by WHO region are the annual totals reported as having been distributed by NMCPs. Numbers of RDT sales were reported by 41 manufacturers that participated in RDT product testing by WHO, the Foundation for Innovative New Diagnostics (FIND), the CDC, and the Special Programme for Research and Training in Tropical Diseases. The number of RDTs reported by manufacturers represents total sales to the public and private sectors worldwide.
Fig. 2.8. Number of ACT treatment courses delivered by manufacturers and distributed by NMCPs, 2010–2016Data on artemisinin-based combination therapy (ACT) sales were provided by eight manufacturers eligible for procurement by WHO or the United Nations Children’s Fund (UNICEF). ACT sales were categorized as being to either the public sector or the private sector. Data on ACTs distributed within countries through the public sector were taken from NMCP reports to WHO.
Fig. 2.9. Ratio of ACT treatment courses distributed to diagnostic tests performed (RDTs or microscopy) and test positivity rate, WHO African Region, 2010–2016The ratio was calculated using the number of ACTs distributed, the number of microscopic examinations of blood slides, and the number of RDTs performed in the WHO African Region, as reported by NMCPs to WHO. The test positivity rate was calculated as the total number of positive tests (i.e. slide examinations or RDTs) divided by the total number of tests undertaken, as reported by countries in the WHO African Region.
Fig. 3.1. Proportion of population at risk with access to an ITN and sleeping under an ITN and proportion of households with at least one ITN and enough ITNs for all occupants, sub-Saharan Africa, 2010–2016Estimates of ITN coverage were derived from a model developed by the Malaria Atlas Project,2 using a two-stage process. First, we defined a mechanism for estimating net crop (i.e. the total number of ITNs in
WORLD MALARIA REPORT 2017 67

Annex 1 – Data sources and methods
households in a country at a given point in time), taking into account inputs to the system (e.g. deliveries of ITNs to a country) and outputs (e.g. loss of ITNs from households). We then used empirical modelling to translate estimated net crops into resulting levels of coverage (e.g. access within households, use in all ages and use among children aged under 5 years).
The model incorporates data from three sources:
■ the number of ITNs delivered by manufacturers to countries, as provided to WHO by Milliner Global Associates;
■ the number of ITNs distributed within countries, as reported to WHO by NMCPs; and
■ data from nationally representative household surveys from 39 countries in sub-Saharan Africa, from 2001 to 2016.
Countries for analysis
The main analysis covered 40 of the 47 malaria endemic countries or areas of sub-Saharan Africa. The islands of Mayotte (for which no ITN delivery or distribution data were available) and Cabo Verde (which does not distribute ITNs) were excluded, as were the low-transmission countries of Namibia, Sao Tome and Principe, South Africa and Swaziland, for which ITNs comprise a small proportion of vector control. Analyses were limited to populations categorized by NMCPs as being at risk.
Estimating national net crops through time
As described by Flaxman et al. (3) , national ITN systems were represented using a discrete-time stock-and-flow model. Nets delivered to a country by manufacturers were modelled as first entering a “country stock” compartment (i.e. stored in-country but not yet distributed to households). Nets were then available from this stock for distribution to households by the NMCP or other distribution channels. To accommodate uncertainty in net distribution, the number of nets distributed in a given year was specified as a range, with all available country stock (i.e. the maximum number of nets that could be delivered) as the upper end of the range and the NMCP-reported value (i.e. the assumed minimum distribution) as the lower end. New nets reaching households joined older nets remaining from earlier time steps to constitute the total household net crop, with the duration of net retention by households governed by a loss function. Rather than fitting the loss function to a small external dataset, as was done by Flaxman et al. (3), the loss function was fitted directly to the distribution and net crop data within the stock-and-flow model itself. Loss functions were fitted on a country-by-country basis, were allowed to vary through time, and were defined separately for conventional ITNs
(cITNs) and long-lasting insecticidal nets (LLINs). The fitted loss functions were compared to existing assumptions about rates of net loss from households. The stock-and-flow model was fitted using Bayesian inference and Markov chain Monte Carlo methods, which provided time-series estimates of national household net crop for cITNs and LLINs in each country, and an evaluation of under distribution, all with posterior credible intervals.
Estimating indicators of national ITN access and use from the net crop
Rates of ITN access within households depend not only on the total number of ITNs in a country (i.e. the net crop), but also on how those nets are distributed among households. One factor that is known to strongly influence the relationship between net crop and net distribution patterns among households is the size of households, which varies among countries, particularly across sub-Saharan Africa.
Many recent national surveys report the number of ITNs observed in each household surveyed. Hence, it is possible to not only estimate net crop, but also to generate a histogram that summarizes the household net ownership pattern (i.e. the proportion of households with zero nets, one net, two nets and so on). In this way, the size of the net crop was linked to distribution patterns among households while accounting for household size in order to generate ownership distributions for each stratum of household size. The bivariate histogram of net crop to distribution of nets among households by household size made it possible to calculate the proportion of households with at least one ITN. Also, because the number of both ITNs and people in each household was available, it was possible to directly calculate two additional indicators: the proportion of households with at least one ITN for every two people, and the proportion of the population with access to an ITN within their household. For the final ITN indicator – the proportion of the population who slept under an ITN the previous night – the relationship between ITN use and access was defined using 62 surveys in which both these indicators were available (ITN useall ages = 0.8133 × ITN accessall ages + 0.0026, R2 = 0.773). This relationship was applied to the Malaria Atlas Project’s country–year estimates of household access in order to obtain ITN use among all ages. The same method was used to obtain the country–year estimates of ITN use in children aged under 5 years (ITN usechildren under 5 = 0.9327 x ITN access children under 5 + 0.0282, R2 = 0.754).
Fig. 3.2. Proportion of population at risk with access to an ITN, sub-Saharan Africa, 2010–2016Data on the number of ITNs distributed within countries were as reported to WHO by 39 countries where ITNs are the primary method of vector control.
WORLD MALARIA REPORT 201768

Fig. 3.3. Household ITN ownership gap, 2016See methods notes for Fig. 3.1.
Fig. 3.4. Proportion of the population at risk protected by IRS by WHO region, 2010–2016The number of persons protected by indoor residual spraying (IRS) was reported to WHO by NMCPs. The total population of each country was taken from the 2016 revision of the World population prospects (4) and the proportion at risk of malaria was derived from NMCP reports.
Table 3.1. Countries and territories of sub-Saharan Africa that have reported reduced IRS coverage in any year between 2010 and 2016Data were derived from NMCP reports.
Fig. 3.5. Chemical class used for IRS, 2010–2016Data on the type of insecticide used for IRS were reported to WHO by NMCPs. Insecticides were classified into pyrethroids or other classes (carbamates, organochlorines or organophos phates). If data were not reported for a particular year, data from the most recent year were used. For the period 2010–2016 this method of imputation was used for an average of 19 countries each year.
Fig. 3.6. Proportion of the population protected by IRS or sleeping under an ITN in sub-Saharan Africa, 2010–2016The proportion of the population at risk sleeping under an ITN was derived as described for Fig. 3.1, and the proportion benefiting from IRS was derived as for Fig. 3.4. In combining these proportions, the extent to which populations benefit from one or both of these interventions must be estimated. Analysis of household survey data indicates that about half of the people in IRS-sprayed households are also protected by ITNs, but the extent of overlap between intervention coverage can vary from 0% to 100% (if the proportions sum to <1). To reflect this uncertainty, we assumed the combined coverage to have a rectangular distribution with the range of maximum (0%, ITN coverage + IRS coverage – 100%) to minimum (ITN coverage, IRS coverage). Palisade’s @RISK software (version 6.0)1 was used to sample from the distributions for each country, and a continental estimate of vector-control coverage was obtained by summing the combined ITN and IRS coverage of all countries.
1 https://www.palisade.com/risk/
Fig. 3.7. Proportion of pregnant women attending ANC at least once and receiving IPTp, by dose, sub-Saharan Africa, 2010–2016The total number of pregnant women eligible for intermittent preventive treatment in pregnancy (IPTp) was calculated by adding total live births calculated from the United Nations (UN) population data and spontaneous pregnancy loss (specifically, miscarriages and stillbirths) after the first trimester. Spontaneous pregnancy loss has previously been calculated by Dellicour et al. (5). Country-specific estimates of IPTp coverage were calculated as the ratio of pregnant women receiving IPTp at antenatal care (ANC) clinics to the estimated number of IPTp-eligible pregnant women in a given year. ANC attendance rates were derived in the same way, using the number of initial ANC visits reported through routine information systems. Local linear interpolation was used to compute missing values. Annual aggregate estimates exclude countries for which a report or interpolation was not available for the specific year. Among 34 countries with IPTp policy, IPTp1 dose coverage could be calculated for 34 countries, IPTp2 for 33 countries and IPTp3 for 20 countries. Aggregate estimates of IPTp1 and IPTp2 coverage for 20 countries with IPTp3 estimates were similar to estimates of IPTp1 and IPTp2 coverage using data from all countries.
Fig. 3.8. Maps of countries and subnational areas where SMC has been scaled up, 2014–2016Data were provided by the Seasonal Malaria Chemoprevention (SMC) Working Group.
Fig. 3.9. Number of SMC treatments administered in scale-up countries, 2012–2016 (in million)Data were provided by the SMC Working Group.
Fig. 4.1. Proportion of febrile children for whom care was sought, by health sector, sub-Saharan Africa, 2014–2016Estimates were derived from 18 nationally representative household surveys (demographic health surveys and malaria indicator surveys) conducted between 2014 and 2016. The surveys asked caregivers whether their child had had a fever in the 2 weeks preceding the survey, whether care was sought for the fever and, if so, where care was sought.
WORLD MALARIA REPORT 2017 69
Annex 1 – Data sources and methods
Fig. 4.2. Proportion of febrile children seeking care that received a blood test, by health sector, sub-Saharan Africa, 2014–2016Estimates were derived from 17 nationally representative household surveys (demographic health surveys and malaria indicator surveys) conducted between 2014 and 2016. The surveys asked caregivers whether their child had had a fever in the 2 weeks preceding the survey, whether care was sought for the fever and, if so, where care was sought; they also asked whether the child had received a finger or heel stick as part of the care (indicating that a malaria diagnostic test was performed).
Fig. 4.3. Proportion of febrile children attending public health facilities that received a blood test, sub-Saharan Africa, 2010–2016Estimates were derived from 44 nationally representative household surveys (demographic health surveys and malaria indicator surveys) conducted between 2010 and 2016. The surveys asked caregivers whether their child had had a fever in the 2 weeks preceding the survey, whether care was sought for the fever and, if so, where care was sought; they also asked whether the child had received a finger or heel stick as part of the care (indicating that a malaria diagnostic test was performed). Median values and interquartile ranges were calculated from available surveys in 3-year moving averages.
Fig. 4.4. Proportion of suspected malaria cases attending public health facilities who received a diagnostic test by WHO region, 2010–2016The proportion of suspected malaria cases receiving a malaria diagnostic test in public facilities was calculated from NMCP reports to WHO. The number of malaria diagnostic tests performed comprised the number of RDTs and the number of microscopic slide examinations. Few countries reported the number of suspected malaria cases as an independent value. For countries reporting the total number of malaria cases as the sum of presumed malaria cases (i.e. cases classified as malaria without undergoing malaria parasitological testing) and confirmed malaria cases, the number of suspected cases was calculated by adding the number of negative diagnostic tests to the number of presumed and confirmed cases. Using this method, for countries that reported only confirmed malaria cases as the total number of malaria cases, the number of suspected cases is equal to the number of cases tested. This value is not informative in determining the proportion of suspected cases tested; therefore, countries were excluded from the regional calculation for the years in which they reported only confirmed cases as total malaria cases.
Fig. 4.5. Proportion of febrile children seeking care that received antimalarial medicines, sub-Saharan Africa, 2010–2016Estimates were derived from 49 nationally representative household surveys (demographic health surveys and malaria indicator surveys) conducted between 2010 and 2016. The surveys asked caregivers whether their child had had a fever in the 2 weeks preceding the survey, and what treatment was received for the fever, particularly whether the child had received an ACT or other antimalarial medicine. Median values and interquartile ranges were calculated from available surveys in 3-year moving averages.
Fig. 4.6. Proportion of febrile children seeking care and treated with antimalarial medicines that received an ACT, sub-Saharan Africa, 2010–2016See methods notes for Fig. 4.5.
Fig. 4.7. Proportion of febrile children with a positive RDT at time of survey and treated with antimalarial medicines who received an ACT, by health sector, sub-Saharan Africa, 2014–2016Data from nationally representative household surveys were used to examine the treatment received by children who had had a fever in the previous 2 weeks and a positive RDT at the time of the survey, and received antimalarial medicines. Estimates were derived from 12 nationally representative household surveys (demo-graphic health surveys and malaria indicator surveys) conducted between 2014 and 2016. Surveys included those that undertook diagnostic testing with a histidine rich protein 2 (HRP2) RDT, and that asked caregivers whether their child had had a fever in the 2 weeks preceding the survey, where care was sought, and what treatment was received for the fever, particularly whether the child received an ACT or other antimalarial medicine.
Fig. 4.8. iCCM policy adoption and implementation by WHO region by 2016Data were derived from the WHO/UNICEF Global Integrated Management of Childhood Illness (IMCI) survey.
Fig. 5.1. Health facility reporting rates by WHO region, 2014–2016Using data provided by NMCPs, reporting rates of health facilities were calculated by NMCPs as follows: (number of health facility reports received in 2016) divided by (number of health facilities providing treatment for uncomplicated malaria × reporting frequency).
WORLD MALARIA REPORT 201770

Fig. 5.2. Proportion of all cases that have been captured by the surveillance system in countries where malaria burden was estimated from either parasite rate-to-incidence model or adjustments of national routine dataThis indicator was computed using the following formulae: number of cases reported by the surveillance system divided by the number of estimated cases. The numerator consists of the reported confirmed cases plus the presumed cases adjusted for test positivity rate. For computation of estimated cases, see methods for Table 6.1.
Table 6.1. Estimated malaria cases, 2010–2016The number of malaria cases was estimated by one of two methods. Method 1 was used for countries outside Africa and for low-transmission countries in Africa. Estimates were made by adjusting the number of reported malaria cases for completeness of reporting, the likelihood that cases were parasite positive, and the extent of health-service use. The procedure, which is described in the World malaria report 2008 (6), combines data reported by NMCPs (reported cases, reporting completeness and likelihood that cases are parasite positive) with data obtained from nationally representative household surveys on health-service use. Briefly,
Casepublic sector = (Casesconfirmed + Casespresumed
× Test positivity rate)⁄Reporting completeness
Casesprivate sector = Casespublic sector
× Prop.seeking careprivate
sector⁄Prop.seeking carepublic sector
CasesNot seeking treatment = Casespublic sector
× Prop.not seeking care⁄Prop.seeking carepublic sector.
To estimate the uncertainty around the number of cases, the test positivity rate (Fig. 2.9) was assumed to have a normal distribution centred on the Test positivity rate value and standard deviation defined as 0.244 × Test positivity rate0.5547 and truncated to be in the range 0, 1. Reporting completeness was assumed to have one of three distributions, depending on the value reported by the NMCP. If the value was greater than 80% the distribution was assumed to be triangular, with limits of 0.8 and 1 and the peak at 0.8. If the value was greater than 50% then the distribution was assumed to be rectangular, with limits of 0.5 and 0.8. Finally, if the value was lower than 50% the distribution was assumed to be triangular, with limits of 0 and 0.5 and the peak at 0.5 (7). The proportions of children for whom care was sought in the private sector and in the public sector (Fig. 4.1) were assumed to have a beta distribution, with the mean value being the estimated value in the survey and the standard
1 For methods on the development of maps by the Malaria Atlas Project, see www.map.ox.ac.uk/making-maps/.
deviation calculated from the range of the estimated 95% confidence intervals (CI) divided by 4. The proportion of children for whom care was not sought was assumed to have a rectangular distribution, with the lower limit 0 and upper limit calculated as:
1-Prop.seeking carepublic sector - Prop.seeking careprivate sector.
Values for the proportion seeking care were linearly interpolated between the years that have a survey, and were extrapolated for the years before the first or after the last survey. Missing values for the distributions were imputed using a mixture of the distribution of the country, with equal probability for the years where values were present or, if there was no value at all for any year in the country, a mixture of the distribution of the region for that year. The data were analysed using the R statistical software (8). Convolution of the distributions was made using the package “distr” (9,10). Method 1 was used for Afghanistan, Armenia, Azerbaijan, Bangladesh, Bolivia (Plurinational State of), Botswana, Brazil, Cambodia, Colombia, Dominican Republic, Eritrea, Ethiopia, French Guiana, Gambia, Georgia, Guatemala, Guyana, Haiti, Honduras, India, Indonesia, Kyrgyzstan, Lao People’s Democratic Republic, Madagascar, Mauritania, Mayotte, Myanmar, Namibia, Nepal, Nicaragua, Pakistan, Panama, Papua New Guinea, Peru, Philippines, Rwanda, Senegal, Solomon Islands, Sri Lanka, Tajikistan, Timor-Leste, Turkey, Turkmenistan, Uzbekistan, Vanuatu, Venezuela (Bolivarian Republic of), Viet Nam, Yemen and Zimbabwe. For India, the values were obtained at subnational level using the same methodology, but adjusting the private sector for an additional factor due to the active case detection. This factor was estimated to have a normal distribution with mean value and standard deviation calculated from the values reported in 2010.
Method 2 was used for high-transmission countries in Africa and for some countries in the WHO Eastern Mediterranean Region in which the quality of surveillance data did not permit a robust estimate from the number of reported cases. In this method, estimates of the number of malaria cases were derived from information on parasite prevalence obtained from household surveys. First, data on parasite prevalence from nearly 60 000 survey records were assembled within a spatiotemporal Bayesian geostatistical model, along with environmental and sociodemographic covariates, and data distribution on interventions such as ITNs, antimalarial drugs and IRS. The geospatial model enabled predictions of Plasmodium falciparum prevalence in children aged 2–10 years, at a resolution of 5 × 5 km2, throughout all malaria endemic African countries for each year from 2000 to 2016.1 Second, an ensemble model was developed to predict malaria
WORLD MALARIA REPORT 2017 71

Annex 1 – Data sources and methods
incidence as a function of parasite prevalence. The model was then applied to the estimated parasite prevalence in order to obtain estimates of the malaria case incidence at 5 × 5 km2 resolution for each year from 2000 to 2016. Data for each 5 × 5 km2 area were then aggregated within country and regional boundaries to obtain both national and regional estimates of malaria cases (11). Method 2 was used for Angola, Benin, Burkina Faso, Burundi, Cameroon, Central African Republic, Chad, Congo, Côte d’Ivoire, Democratic Republic of the Congo, Djibouti, Equatorial Guinea, Gabon, Ghana, Guinea, Guinea-Bissau, Kenya, Liberia, Malawi, Mali, Mozambique, Niger, Nigeria, Sierra Leone, Somalia, South Sudan, Sudan, Togo, Uganda, United Republic of Tanzania and Zambia.
For some years, information was not always available or not of sufficient quality to be used with Method 1. For those countries, the number of cases was imputed from other years where the quality of the data was better, adjusting for population growth, as follows: for Gambia 2010, values were imputed from 2011 to 2013; for Namibia 2012, values were imputed from 2010 and 2013; for Haiti 2010, values where imputed from 2006 to 2008; for Papua New Guinea, 2012 values were imputed from 2009 to 2011; and for Ethiopia, the values were taken from a mixed distribution between values from Method 1 and Method 2 (50% from each method).
For most of the elimination countries, the number of indigenous cases registered by the NMCPs are reported without further adjustments. The countries in this category were Algeria, Argentina, Belize, Bhutan, Cabo Verde, China, Comoros, Costa Rica, Democratic People’s Republic of Korea, Ecuador, El Salvador, Iran (Islamic Republic of), Iraq, Malaysia, Mexico, Paraguay, Republic of Korea, Sao Tome and Principe, Saudi Arabia, South Africa, Suriname, Swaziland and Thailand.
The number of malaria cases caused by P. vivax in each country was estimated by multiplying the country’s reported proportion of (1– P. falciparum) cases by the total number of estimated cases for the country. For countries where the estimated proportion was not 0 or 1, the proportion of P. falciparum was assumed to have a triangular distribution with limits ±20% of the value of the estimated proportion, and limited to the range 0, 1.
To transform malaria cases to incidence, a population at risk estimate was used. The proportion of population at high, low or no risk of malaria was provided by NMCPs. This was applied to UN population estimates to compute the number of people at risk of malaria.
Table 6.2. Estimated malaria cases by WHO region, 2016See methods notes for Table 6.1.
Fig. 6.1. Estimated malaria cases (millions) by WHO region, 2016See methods notes for Table 6.1.
Fig. 6.2. Estimated country share of (a) total malaria cases and (b) vivax malaria cases, 2016See methods notes for Table 6.1.
Fig. 6.3. Number of countries where a reduction (green) or increase (red) of more than 20% in malaria cases has occurred between 2015 and 2016, by WHO regionSee methods notes for Table 6.1.
Fig. 6.4. Differences in malaria cases of more than 50 000 in 2015 and 2016 in countries with more than 300 000 malaria cases in 2015See methods notes for Table 6.1.
Fig. 6.5. Trends in malaria case incidence rate globally and by WHO region, 2010–2016See methods notes for Table 6.1.
Fig. 6.6. Percentage change in malaria case incidence rate globally and by WHO region, 2010–2016 and 2014–2016See methods notes for Table 6.1.
Table 6.3. Cases estimated using: parasite rate-to-incidence model (current WHO approach); cases confirmed in the public health sector; and cases confirmed in the public health sector, adjusted for confirmation, reporting and treatment seeking ratesData were derived from NMCP reports; also, see methods notes for Table 6.1.
Table 6.4. Estimated number of malaria deaths by WHO region, 2010–2016Numbers of malaria deaths were estimated using methods from Category 1, 2 or 3, as outlined below.
Category 1 method
A Category 1 method was used for countries outside Africa and for low-transmission countries in Africa. A case fatality rate of 0.256% was applied to the estimated number of P. falciparum cases, which represents the average of case fatality rates reported in the literature (12-14) and rates from unpublished data from Indonesia, 2004–2009 (Dr Ric Price, Menzies School of Health Research, Australia,
WORLD MALARIA REPORT 201772

personal communication). The proportion of deaths follows then a categorical distribution of 0.01%, 0.19%, 0.30%, 0.38% and 0.40%, each one with equal probability. A case fatality rate of 0.0375% was applied to the estimated number of P. vivax cases, representing the midpoint of the range of case fatality rates reported in a study by Douglas et al. (15), following a rectangular distribution between 0.012% and 0.063%. Following the nonlinear association explained for the Category 2 method below, the proportion of deaths in children under 5 was estimated as: Proportion of deaths under 5
= -0.288 × Mortalityoverall
2 + 0.823 × Mortalityoverall + 0.2239, where the
Mortalityoverall is the number of estimated deaths over the population at risk per 1000 (see Annex 3. F.b. for national estimates of population at risk). Countries where this method was used were: Afghanistan, Armenia, Azerbaijan, Bangladesh, Bolivia (Plurinational State of), Botswana, Cambodia, Comoros, Djibouti, Dominican Republic, Eritrea, Ethiopia, French Guiana, Georgia, Guatemala, Guyana, Haiti, Honduras, India, Indonesia, Kyrgyzstan, Lao People’s Democratic Republic, Madagascar, Mayotte, Myanmar, Namibia, Nepal, Nicaragua, Pakistan, Papua New Guinea, Philippines, Solomon Islands, Somalia, Sri Lanka, Sudan, Swaziland, Tajikistan, Timor-Leste, Turkey, Turkmenistan, Uzbekistan, Vanuatu, Venezuela (Bolivarian Republic of), Viet Nam, Yemen and Zimbabwe.
Category 2 method
A Category 2 method was used for countries in Africa with a high proportion of deaths due to malaria. In this method, child malaria deaths were estimated using a verbal autopsy multicause model that was developed by the Maternal and Child Health Epidemiology Estimation Group (MCEE) to estimate causes of death in children aged 1–59 months (16). Mortality estimates (and 95% CI) were derived for seven causes of post-neonatal death (pneumonia, diarrhoea, malaria, meningitis, injuries, pertussis and other disorders), four causes arising in the neonatal period (prematurity, birth asphyxia and trauma, sepsis, and other conditions of the neonate), and other causes (e.g. malnutrition). Deaths due to measles, unknown causes and HIV/AIDS were estimated separately. The resulting cause-specific estimates were adjusted, country by country, to fit the estimated mortality envelope of 1–59 months (excluding HIV/AIDS and measles deaths) for corresponding years. Estimated prevalence of malaria parasites (see methods notes for Table 6.1) was used as a covariate within the model. It was assumed that the number of deaths follows a rectangular distribution with limits being the estimated 95% CI. The malaria mortality rate in children aged under 5 years estimated with this method was then used to infer malaria-specific mortality in those aged over 5 years, using the relationship between levels of malaria mortality in a series of age groups and the intensity of malaria transmission (17), and assuming a
nonlinear association between under-5-years mortality and over-5-years mortality, as follows: Proportion of deathsover 5
= - 0.293 × Mortalityunder 52 + 0.8918 ×
Mortalityunder 5 + 0.2896, where the Mortalityunder 5 is
estimated from the number of deaths from MCEE model over the population at risk per 1000. Countries where this method was used were: Angola, Benin, Burkina Faso, Burundi, Cameroon, Central African Republic, Chad, Congo, Côte d’Ivoire, Democratic Republic of the Congo, Equatorial Guinea, Gabon, Gambia, Ghana, Guinea, Guinea-Bissau, Kenya, Liberia, Malawi, Mali, Mauritania, Mozambique, Niger, Nigeria, Rwanda, Senegal, Sierra Leone, South Sudan, Togo, Uganda, United Republic of Tanzania and Zambia.
Category 3 method
For the Category 3 method, the registered number of indigenous malaria deaths by the NMCPs is reported without further adjustments. This category includes the following countries: Algeria, Argentina, Belize, Bhutan, Brazil, Cabo Verde, China, Colombia, Costa Rica, Democratic People’s Republic of Korea, Ecuador, El Salvador, Iran (Islamic Republic of), Iraq, Malaysia, Mexico, Panama, Paraguay, Peru, Republic of Korea, Sao Tome and Principe, Saudi Arabia, South Africa, Suriname and Thailand.
Fig. 6.7. Proportion of estimated malaria deaths attributable to the 15 countries with nearly 80% of malaria deaths globally in 2016See methods notes for Table 6.4.
Fig. 6.8. Percentage decrease in malaria mortality rate (deaths per 100 000 population at risk) by WHO region, 2010–2016See methods notes for Table 6.4.
Fig. 6.9. Trends in malaria mortality rate (deaths per 100 000 population at risk) globally and in the WHO African Region, 2010–2016See methods notes for Table 6.4.
Fig. 6.10. Trends in malaria mortality rate (deaths per 100 000 population at risk) in WHO regions, 2010–2016See methods notes for Table 6.4.
Fig. 7.1. Countries attaining zero indigenous malaria cases since 2000Countries are shown by the year in which they attained zero indigenous cases for 3 consecutive years, according to reports submitted by NMCPs.
WORLD MALARIA REPORT 2017 73

Annex 1 – Data sources and methods
Fig. 7.2. Number of countries that were malaria endemic in 2000 with fewer than 10 000 indigenous malaria cases in 2010 and 2016, by WHO regionFor the 17 countries that attained zero indigenous cases for 3 consecutive years between 2000 and 2016, the number of NMCP-reported indigenous cases was tabulated according to the number of years preceding the attainment of zero cases. Data from years before the peak number of cases were excluded. Thus, if a country had experienced zero cases and malaria returned, cases were only included from the year in which they peaked. This inclusion criterion generates a slope that is steeper than if cases from all years were included (because some increases are excluded). In some earlier years where data on indigenous cases were not available, the total number of reported cases was used (i.e. for country–years with larger numbers of cases, in which the proportion of imported cases is expected to be low).
Table 7.1. Trends in indigenous malaria cases in the E-2020 countriesData were derived from NMCP reports.
Fig. 8.1. Per capita expenditure for malaria control and elimination by WHO region, 2010–2016See methods notes for Fig. 2.1 for sources of information on funding from governments of malaria endemic countries and on international bilateral funding flows, and methods notes for Table 6.1. for data on population at risk of malaria.
Fig. 8.2. Percentage change in average of funding (US$) per capita population at risk in 2011–2013 and 2014–2016 in 41 high burden countriesData were derived from the ForeignAssistance.gov; Global Fund to Fight AIDS, Tuberculosis and Malaria; NMCP reports; Organisation for Economic Co-operation and Development creditor reporting system; the World Bank Data Bank; and the Department for International Development.
Fig. 8.3. Malaria cases in South Sudan, 2010–2016See methods notes for Table 6.1.
1 http://www.who.int/malaria/areas/drug_resistance/drug_efficacy_database/en/, accessed 10 November 2017
Fig. 8.4. Malaria cases in Yemen, 2010–2016See methods notes for Table 6.1.
Fig. 8.5. Malaria cases in the Bolivarian Republic of Venezuela, 2010–2016Data were derived from NMCP reports; also, see methods notes for Table 6.1.
Fig. 8.6. Number of ACTs failing in the Greater Mekong subregionData were derived from the Global database on antimalarial drug efficacy and resistance.1
Fig. 8.7. Reported insecticide resistance status as a proportion of sites for which monitoring was conducted by WHO region, 2010–2016Insecticide resistance monitoring results were collated from data submissions to WHO by NMCPs, the African Network for Vector Resistance, Liverpool School of Tropical Medicine, Malaria Atlas Project and the US President’s Malaria Initiative, and were extracted from other scientific publications. Data from standard WHO tube tests or CDC bottle bioassays with discriminating concentrations of insecticides were considered. Status was based on mosquito mortality, wherein <90% was confirmed resistance, 90–97% was possible resistance and ≥98% was susceptibility. Where multiple insecticide classes or types, mosquito species or time points were tested at an individual site, the highest resistance status was considered.
Fig. 8.8. Reported pyrethroid resistance status of malaria vectors measured with insecticide bioassays, 2010–2016The map displays a subset of the data from Fig. 8.7 for bioassays conducted with insecticides of the pyrethroid class only. The most recent resistance status is shown; where multiple insecticides or mosquito species were tested at an individual site, the highest resistance status is shown.
WORLD MALARIA REPORT 201774

References1. WHO. Global technical strategy for malaria 2016–2030.
Geneva: World Health Organization (WHO); 2015 (http://www.who.int/malaria/areas/global_technical_strategy/en, accessed 19 October 2017).
2. Roll Back Malaria Partnership Secretariat. Action and investment to defeat malaria 2016–2030. For a malaria-free world. Geneva: World Health Organization (WHO); 2015 (http://www.rollbackmalaria.org/files/files/aim/RBM_AIM_Report_A4_EN-Sept2015.pdf, accessed 19 October 2017).
3. Flaxman AD, Fullman N, Otten MW, Menon M, Cibulskis RE, Ng M et al. Rapid scaling up of insecticide-treated bed net coverage in Africa and its relationship with development assistance for health: a systematic synthesis of supply, distribution, and household survey data. PLoS Med. 2010;7(8):e1000328.
4. UN. Revision of world population prospects [website]. United Nations; 2015 (http://esa.un.org/unpd/wpp, accessed 1 August 2015).
5. Dellicour S, Tatem AJ, Guerra CA, Snow RW, ter Kuile FO. Quantifying the number of pregnancies at risk of malaria in 2007: a demographic study. PLoS Med. 2010;7(1):e1000221.
6. WHO. World malaria report. Geneva: World Health Organization (WHO); 2008 (http://www.who.int/malaria/publications/atoz/9789241563697/en, accessed 15 October 2013).
7. Cibulskis RE, Aregawi M, Williams R, Otten M, Dye C. Worldwide incidence of malaria in 2009: estimates, time trends, and a critique of methods. PLoS Med. 2011;8(12):e1001142.
8. The R Core Team. R: A lanaguage and environment for statistical computing: reference index. Vienna, Austria, R Foundation for Statistical Computing.
9. Ruckdeschel P, Kohl M, Stabla T, Camphausen F. S4 classes for distributions. R News. 2006;6(2):2–6.
10. Ruckdeschel P, Kohl M. General purpose convolution algorithm in S4-classes by means of FFT. Journal of Statistical Software, Articles. 2014;59(4):1–25.
11. Bhatt S, Weiss DJ, Cameron E, Bisanzio D, Mappin B, Dalrymple U et al. The effect of malaria control on Plasmodium falciparum in Africa between 2000 and 2015. Nature. 2015;526(7572):207–211.
12. Alles HK, Mendis KN, Carter R. Malaria mortality rates in South Asia and in Africa: implications for malaria control. Parasitol Today. 1998;14(9):369–375.
13. Luxemburger C, Ricci F, Nosten F, Raimond D, Bathet S, White NJ. The epidemiology of severe malaria in an area of low transmission in Thailand. Trans R Soc Trop Med Hyg. 1997;91(3):256–262.
14. Meek SR. Epidemiology of malaria in displaced Khmers on the Thai-Kampuchean border. Southeast Asian J Trop Med Public Health. 1988;19(2):243–252.
15. Douglas NM, Pontororing GJ, Lampah DA, Yeo TW, Kenangalem E, Poespoprodjo JR et al. Mortality attributable to Plasmodium vivax malaria: a clinical audit from Papua, Indonesia. BMC Med. 2014;12(1):217.
16. Liu L, Oza S, Hogan D, Perin J, Rudan I, Lawn JE et al. Global, regional, and national causes of child mortality in 2000–13, with projections to inform post-2015 priorities: an updated systematic analysis. Lancet. 2015;385(9966):430–440.
17. Ross A, Maire N, Molineaux L, Smith T. An epidemiologic model of severe morbidity and mortality caused by Plasmodium falciparum. Am J Trop Med Hyg. 2006;75(2 Suppl):63–73.
WORLD MALARIA REPORT 2017 75

EPIDEMIOLOGY
Population at risk: 367 millionParasites: P. falciparum (100%)Vectors: An. arabiensis, An. funestus, An. gambiae, An. hispaniola, An. labranchiae, An. melas, An. moucheti, An. multicolor, An. nili, An. pharoensis and An. sergentii
FUNDING, 2010–2016
Decreased from US$ 1.75 billion in 2010 to US$ 637.7 million in 2016 (64% decrease)Proportion of domestic source in 2016: 8%Regional funding mechanisms: none
Annex 2 - A. Regional profile: West Africa
A. Confirmed malaria cases per 1000 population/parasite prevalence (PP), 2016
B. Malaria funding by source, 2010–2016 C. Malaria funding* per person at risk, average 2014–2016
LiberiaGuinea
GambiaGhana
BeninSenegal
Guinea-BissauCabo Verde
MaliBurkina FasoCôte d’IvoireSierra Leone
NigeriaTogoNiger
MauritaniaAlgeria
US$6420 8
■ National ■ International
US$
(milli
on)
2016201520142013201220112010
1500
1000
500
2000
0
■ Domestic* ■ Global Fund ■ World Bank ■ USAID ■ UK ■ Other
* Excludes cost related to health staff and out-of-pocket expenditure
Confirmed cases per 1000 population■ Insu�cient data■ 0■ 0–0.1■ 0.1–1.0■ 1.0–10■ 10–50■ 50–100■ 100–200■ 200–300■ >300
PP>800
■ Not applicable
REPORTED CASES AND DEATHS, 2010–2016
Cases: Increased from 6.9 million in 2010 to 40.6 million in 2016 (488% increase)Deaths: Decreased from 39 100 in 2010 to 18 700 in 2016 (52% decrease)
ESTIMATED CASES AND DEATHS, 2010–2016
Cases: Decreased from 110.7 million in 2010 to 109.9 million in 2016 (0.01% decrease)Deaths: Decreased from 287 000 in 2010 to 224 000 in 2016 (22% decrease)
INTERVENTIONS, 2010–2016
Countries with ≥50% access to either LLINs or IRS in 2016: All countries except Cabo Verde and MauritaniaNumber of RDTs distributed in 2016: 52.6 millionNumber of ACT courses distributed in 2016: 44.2 million
ACCELERATION TO ELIMINATION, 2010–2016
Countries with elimination programmes: Algeria and Cabo VerdeZero indigenous cases for 3 consecutive years: AlgeriaZero indigenous cases in current year: AlgeriaCertification in progress: no country
WORLD MALARIA REPORT 201776
Global Fund, Global Fund to Fight AIDS, Tuberculosis and Malaria; UK, United Kingdom of Great Britain and Northern Ireland; USAID, United States Agency for International Development* Excludes patient service delivery costs and out-of-pocket expenditure

D. Share of estimated malaria cases, 2016
1%1%2%2%
52%
7%
3%2%
7%
7%
5%
4%
7%
■ Nigeria■ Ghana■ Mali■ Burkina Faso■ Niger■ Côte d’Ivoire■ Guinea■ Benin■ Sierra Leone■ Togo■ Other■ Senegal■ Liberia
KEY MESSAGES ■ About 367 million people living in the 17 countries are at high risk.
With the exception of Algeria, malaria transmission is year-round and almost exclusively due to P. falciparum in most of the countries, with strong seasonality in the Sahelian countries.
■ The subregion had about 111 million estimated cases and 41 million reported confirmed cases. Some 19 000 malaria deaths were reported in 2016 but reporting rates were low, and the estimated number of deaths was about 224 000. Six countries accounted for 85% of the estimated cases: Nigeria (52%), Burkina Faso, Ghana, Mali and Niger (each contributing 7%) and Côte d’Ivoire (5%).
■ Algeria, with zero indigenous cases since 2013, is now eligible for certification of elimination by WHO. Cabo Verde is on target for
malaria free status by 2020; however, cases increased from one indigenous case in 2012 to 48 cases in 2016. Senegal is on target for a 20–40% reduction by 2020. Overall, 14 countries had increased cases.
■ In line with the Nouakchott Declaration against malaria in the Sahelian countries, a meeting of malaria programme managers of seven countries (Cabo Verde, Chad, Gambia, Mali, Mauritania, Niger and Senegal), held in Monaco in June 2017, agreed to accelerate malaria elimination in these countries. Gambia, Mauritania and Senegal are reorienting their programmes towards malaria elimination.
■ Challenges include prioritization and sustainability of interventions, inappropriate application of larviciding, inadequate domestic financing and weak surveillance systems.
Ia. Change in reported malaria incidence and mortality rates, 2010–2016
J. Incidence in 2016 compared to 75th percentile of 2013-2015
Ib. Reported cases in countries with elimination activities, 2010 versus 2016
E. Proportion of population with access to either LLINs or IRS, 2016
LiberiaSenegal
GhanaMali
Guinea-BissauBurkina FasoSierra LeoneCôte d’Ivoire
GambiaNiger
GuineaTogo
NigeriaBenin
MauritaniaCabo Verde
100%80%60%40%20%0%
F. Countries projected to reduce case incidence by ≥40% by 2020
201520142013201220112010 2016
50
40
30
20
10
60
0
■ Algeria
.
G. Countries projected to reduce case incidence by <40% by 2020
201520142013201220112010 2016
400 000
300 000
200 000
100 000
500 000
600 000
0
■ Cabo Verde ■ Senegal
H. Countries with increase in case incidence, 2010–2016
201520142013201220112010 2016
40 000 000
30 000 000
20 000 000
10 000 000
50 000 000
0
■ Mauritania ■ Guinea-Bissau ■ Gambia ■ Guinea ■ Togo ■ Liberia ■ Benin ■ Sierra Leone ■ Mali ■ Côte d’Ivoire ■ Niger ■ Ghana ■ Burkina Faso ■ Nigeria
2020 milestone: -40%
Côte d’IvoireGuineaNigeria
MauritaniaBurkina Faso
MaliNiger
GhanaGuinea-Bissau
BeninSierra Leone
TogoLiberia
GambiaSenegal
f Reduction Increase p50%0%-50%-100% 100%
■ Incidence ■ Mortality
Burkina FasoSierra Leone
LiberiaCôte d’Ivoire
TogoGhana
MaliGambia
NigerBenin
Guinea-BissauGuineaNigeria
SenegalMauritania
Cabo VerdeAlgeria
6004002000
201675th percentile (2013-2015)
Algeria
Cabo Verde
2010 2016
40200 60
1
4748

Annex 2 - B. Regional profile: Central Africa
A. Confirmed malaria cases per 1000 population/parasite prevalence (PP), 2016
EPIDEMIOLOGY
Population at risk: 168 millionParasites: P. falciparum (100%)Vectors: An. arabiensis, An. funestus, An. gambiae, An. hancocki, An. melas, An. moucheti, An. Nili and An. pharoensis
FUNDING, 2010–2016
Increased from US$ 251.7 million in 2010 to US$ 303.6 million in 2016 (21% increase)Proportion of domestic source in 2016: 5%Regional funding mechanisms: none
INTERVENTIONS, 2010–2016
Countries with ≥50% access to either LLINs or IRS in 2016: All countries except Angola, Congo, Equatorial Guinea and GabonNumber of RDTs distributed in 2016: 33.8 millionNumber of ACT courses distributed in 2016: 32.1 million
REPORTED CASES AND DEATHS, 2010–2016
Cases: Increased from 6.3 million in 2010 to 31.7 million in 2016 (404% increase)Deaths: Increased from 40 000 in 2010 to 64 000 in 2016 (58% increase)
ESTIMATED CASES AND DEATHS, 2010–2016
Cases: Decreased from 43.7 million in 2010 to 38.3 million in 2016 (12% decrease)Deaths: Decreased from 137 000 in 2010 to 88 000 in 2016 (36% decrease)
ACCELERATION TO ELIMINATION, 2010–2016
Countries with elimination programmes: no countryZero indigenous cases for 3 consecutive years: no countryZero indigenous cases in current year: no countryCertification in progress: no country
B. Malaria funding by source, 2010–2016 C. Malaria funding* per person at risk, average 2014–2016
Sao Tome and Principe
Gabon
Angola
Democratic Republic of the Congo
Cameroon
Burundi
Chad
Central African Republic
Congo
Equatorial Guinea
US$1612840 20
National International
US$
(milli
on)
2016201520142013201220112010
400
300
200
100
500
0
■ Domestic* ■ Global Fund ■ World Bank ■ USAID ■ UK ■ Other
Global Fund, Global Fund to Fight AIDS, Tuberculosis and Malaria; UK, United Kingdom of Great Britain and Northern Ireland; USAID, United States Agency for International Development* Excludes patient service delivery costs and out-of-pocket expenditure
* Excludes cost related to health staff and out-of-pocket expenditure
Confirmed cases per 1000 population■ Insu�cient data■ 0■ 0–0.1■ 0.1–1.0■ 1.0–10■ 10–50■ 50–100■ 100–200■ 200–300■ >300PP
>800
■ Not applicable
WORLD MALARIA REPORT 201778

D. Share of estimated malaria cases, 2016
KEY MESSAGES ■ About 168 million people living in the 10 countries are at high risk.
Malaria transmission, almost exclusively due to P. falciparum, occurs throughout the year except in Burundi, Cameroon, northern Chad and the highlands of eastern Congo.
■ The subregion had about 38 million estimated cases, with 32 million reported confirmed cases and 64 000 malaria deaths in 2016. The Democratic Republic of the Congo accounted for 48% of reported cases, followed by Burundi (26%) and Angola (12%). Nine countries saw increased cases during 2015–2016. Angola and Burundi alone reported 3.8 and 8.3 million confirmed cases in 2016, a 60% and 37% increase since 2015, respectively. The increases may be due to multiple factors, including inadequate intervention, climatic factors (El Niño) in 2015–2016 and improved reporting.
■ Sao Tome and Principe has reported zero malaria deaths since 2014 but is on track for only 20–40% reduction in incidence by 2020. The testing rate in the subregion reached >81% except in Congo and Gabon (<60%). Cameroon and the Democratic Republic of the Congo conducted LLIN mass campaigns in 2016, but Congo, Equatorial Guinea and Gabon have failed to do so for the past 5 years owing to a shortage of funding.
■ Challenges include weak health systems, insufficient domestic and international funding, and malaria outbreaks in Angola and Burundi. Congo, Equatorial Guinea and Gabon are no longer eligible for Global Fund support, but domestic investment remains inadequate.
Ha. Change in reported malaria incidence and mortality rates, 2010–2016
I. Incidence in 2016 compared to 75th percentile of 2013-2015
Hb. Reported cases in countries with elimination activities, 2010 versus 2016
E. Proportion of population with access to either LLINs or IRS, 2016
Sao Tome and Principe
Democratic Republic of the Congo
Central African Republic
Burundi
Chad
Cameroon
Angola
Congo
Equatorial Guinea
Gabon
100%80%60%40%20%0%
F. Countries projected to reduce case incidence by <40% by 2020
201520142013201220112010 2016
9000
6000
3000
12 000
15 000
0
■ Sao Tome and Principe
G. Countries with increase in case incidence, 2010–2016
201520142013201220112010 2016
30 000 000
25 000 000
20 000 000
15 000 000
10 000 000
5 000 000
35 000 000
0
■ Gabon ■ Equatorial Guinea ■ Congo ■ Central African Republic ■ Chad ■ Cameroon ■ Angola ■ Burundi ■ Democratic Republic of the Congo
2020 milestone: -40%
Cameroon
Central African Republic
Chad
Democratic Republic of the Congo
Burundi
Equatorial Guinea
Congo
Angola
Gabon
Sao Tome and Principe
Incidence Mortality
f Reduction Increase p50%0%-50%-100% 100%
Burundi
Democratic Republic of the Congo
Angola
Central African Republic
Chad
Cameroon
Sao Tome and Principe
Equatorial Guinea
Gabon
Congo
600 8004002000
201675th percentile (2013-2015)
Sao Tome and Principe
2010 2016
200010000 3000
2740223848
1%1%3%
59%
14%
9%
5%
4%4%
■ Democratic Republic of the Congo
■ Cameroon■ Angola■ Chad■ Burundi■ Central African Republic■ Congo■ Equatorial Guinea■ Gabon

Annex 2 - C. Regional profile: East and Southern Africa
A. Confirmed malaria cases per 1000 population/parasite prevalence (PP), 2016
EPIDEMIOLOGY
Population at risk: 394.7 millionParasites: P. falciparum (98%) and P. vivax (2%)Vectors: An. arabiensis, An. funestus, An. gambiae, An. merus, An. nili and An. pharoensis
FUNDING, 2010–2016
Increased from US$ 820.3 million in 2010 to US$ 866 million in 2016 (5% increase)Proportion of domestic source in 2016: 6%Regional funding mechanisms: none
INTERVENTIONS, 2010–2016
Countries with ≥50% access to either LLINs or IRS in 2016: All countries except South Sudan, United Republic of Tanzania (mainland) and ZimbabweNumber of RDTs distributed in 2016: 87.9 millionNumber of ACT courses distributed in 2016: 115 million
REPORTED CASES AND DEATHS, 2010–2016
Cases: Increased from 13.5 million in 2010 to 41.5 million in 2016 (208% increase)Deaths: Decreased from 70 700 in 2010 to 20 800 in 2016 (71% decrease)
ESTIMATED CASES AND DEATHS, 2010–2016
Cases: Decreased from 49.9 million in 2010 to 46 million in 2016 (8% decrease)Deaths: Decreased from 109 000 in 2010 to 89 000 in 2016 (18% decrease)
ACCELERATION TO ELIMINATION, 2010–2016
Countries with elimination programmes: Botswana, Comoros, Namibia, South Africa and SwazilandZero indigenous cases for 3 consecutive years: no countryZero indigenous cases in current year: no countryCertification in progress: no country
B. Malaria funding by source, 2010–2016 C. Malaria funding* per person at risk, average 2014–2016
South Sudan
Zambia
Rwanda
Malawi
Mozambique
Uganda
Zimbabwe
Madagascar
Kenya
United Republic of Tanzania (mainland)
Ethiopia
United Republic of Tanzania (Zanzibar)
US$3210 4
■ National ■ International
US$
(milli
on)
2016201520142013201220112010
6000
4000
2000
8000
0
■ Domestic* ■ Global Fund ■ World Bank ■ USAID ■ UK ■ Other
Global Fund, Global Fund to Fight AIDS, Tuberculosis and Malaria; UK, United Kingdom of Great Britain and Northern Ireland; USAID, United States Agency for International Development* Excludes patient service delivery costs and out-of-pocket expenditure
* Excludes cost related to health staff and out-of-pocket expenditure
Confirmed cases per 1000 populationPP
■ Insucient data■ 0■ 0–0.1■ 0.1–1.0
■ 1.0–10■ 10–50■ 50–100■ 100–200
■ Not applicable
>800
■ 200–300■ >300
WORLD MALARIA REPORT 201780

D. Share of estimated malaria cases, 2016
KEY MESSAGES ■ About 395 million people in the 11 countries are at high risk. Malaria
transmission is almost exclusively due to P. falciparum (except in Ethiopia). It is highly seasonal in Ethiopia, Madagascar, Zimbabwe and coastal and highland areas of Kenya, and is stable in most of Malawi, Mozambique, South Sudan, Uganda, United Republic of Tanzania and Zambia.
■ The subregion had 46 million estimated malaria cases, with about 42 million reported confirmed cases and 21 000 reported deaths in 2016. Mozambique, Uganda and United Republic of Tanzania accounted for more than 50% of the estimated cases. Estimated deaths decreased from 109 000 to 89 000 during 2010–2016.
■ None of the countries in the subregion are on track for a 40% reduction by 2020. All countries except Ethiopia, Madagascar
and Zimbabwe reported a substantial increase in cases during 2015–2016. Cases in Rwanda increased from 640 000 in 2010 to 3.4 million in 2016, and in Zanzibar (United Republic of Tanzania) from 2300 to 5000 during the same period. Uganda reported a twofold increase in confirmed cases during 2015–2016 compared to 2013. The increases may be due to inadequate vector control, climatic factors (El Niño) in 2015–2016 affecting south-eastern Africa and improved reporting. In all the countries except South Sudan, United Republic of Tanzania and Zimbabwe, >60% of the population had access to LLINs in 2016.
■ Challenges include epidemics during the past 2 years, emergencies and inadequate response, inadequate funding, and weak surveil-lance systems in a number of the countries.
Ha. Change in reported malaria incidence and mortality rates, 2010–2016
I. Incidence in 2016 compared to 75th percentile of 2013-2015
Hb. Reported cases in countries with elimination activities, 2010 versus 2016
E. Proportion of population with access to either LLINs or IRS, 2016
United Republic of Tanzania (Zanzibar)
Rwanda
Madagascar
Zambia
Kenya
Malawi
Mozambique
Uganda
Ethiopia
South Sudan
Zimbabwe
United Republic of Tanzania (mainland)
100%80%60%40%20%0%
F. Countries projected to reduce case incidence by <40% by 2020
201520142013201220112010 2016
200 000
400 000
600 000
0
■ Zimbabwe
G. Countries with increase in case incidence, 2010–2016
201520142013201220112010 2016
40 000 000
35 000 000
30 000 000
25 000 000
10 000 000
5 000 000
45 000 000
0
■ United Republic of Tanzania (Zanzibar) ■ South Sudan ■ Madagascar ■ Ethiopia ■ Kenya ■ Rwanda ■ Malawi ■ Zambia ■ United Republic of Tanzania (mainland) ■ Mozambique ■ Uganda
2020 milestone: -40%
Uganda
Mozambique
Rwanda
MalawiUnited Republic of
Tanzania (mainland)Kenya
Madagascar
Ethiopia
Zambia
South Sudan
ZimbabweUnited Republic of
Tanzania (Zanzibar)
f Reduction Increase p50%0%-50%-100% 100%
■ Incidence ■ Mortality
Zambia
Malawi
Rwanda
Uganda
Kenya
United Republic of Tanzania (mainland)Zimbabwe
Ethiopia
Madagascar
South Sudan
United Republic of Tanzania (Zanzibar)
300 4002001000
201675th percentile (2013-2015)
United Republic ofTanzania (Zanzibar)
400020000 6000
5015
2338
■ 2010 ■ 2016
10%
10%
7%
8%
19%17%
15%
■ Mozambique■ Uganda■ United Republic
of Tanzania■ Rwanda■ Malawi■ Kenya■ Zambia■ Other
■ Zimbabwe■ Madagascar■ South Sudan■ Ethiopia
1%
3%
4%
6%

Annex 2 - D. Regional profile: Countries with low transmission in East and Southern Africa
A. Confirmed malaria cases per 1000 population, 2016
B. Malaria funding by source, 2010–2016 C. Malaria funding* per person at risk, average 2014–2016
Swaziland
Namibia
Comoros
Eritrea
Botswana
South Africa
US$6420 8
■ National ■ InternationalInternational
■ Domestic* ■ Global Fund ■ World Bank ■ USAID ■ UK ■ Other
US$
(milli
on)
2016201520142013201220112010
60
50
40
30
20
10
70
0
EPIDEMIOLOGY
Population at risk: 15.7 millionParasites: P. falciparum (98%) and P. vivax (2%)Vectors: An. funestus, An.gambiae s.s. and An. gambiae
FUNDING, 2010–2016
Decreased from US$ 61.3 million in 2010 to US$ 37 million in 2016 (40% decrease)Proportion of domestic source in 2016: 63%Regional funding mechanisms: Southern Africa Malaria Elimination 8 Initiative
INTERVENTIONS, 2010–2016
Countries with ≥50% access to either LLINs or IRS in 2016: Comoros, Eritrea and NamibiaNumber of RDTs distributed in 2016: 363 000Number of ACT courses distributed in 2016: 215 000
REPORTED CASES AND DEATHS, 2010–2016
Cases: Decreased from 82 000 in 2010 to 56 000 in 2016 (32% decrease)Deaths: Decreased from 242 in 2010 to 126 in 2016 (48% decrease)
ESTIMATED CASES AND DEATHS, 2010–2016
Cases: Decreased from 146 000 in 2010 to 126 000 in 2016 (14% decrease)Deaths: Decreased from 370 in 2010 to 320 in 2016 (13% decrease)
ACCELERATION TO ELIMINATION, 2010–2016
Countries with elimination programmes: Botswana, Comoros, Namibia, South Africa and SwazilandZero indigenous cases for 3 consecutive years: no countryZero indigenous cases in current year: no countryCertification in progress: no country
Global Fund, Global Fund to Fight AIDS, Tuberculosis and Malaria; UK, United Kingdom of Great Britain and Northern Ireland; USAID, United States Agency for International Development* Excludes patient service delivery costs and out-of-pocket expenditure
* Excludes cost related to health staff and out-of-pocket expenditure
Confirmed cases per 1000 population■ Insu�cient data■ 0■ 0–0.1■ 0.1–1.0■ 1.0–10■ 10–50■ 50–100■ 100–200■ 200–300■ >300
PP>800
■ Not applicable
WORLD MALARIA REPORT 201782
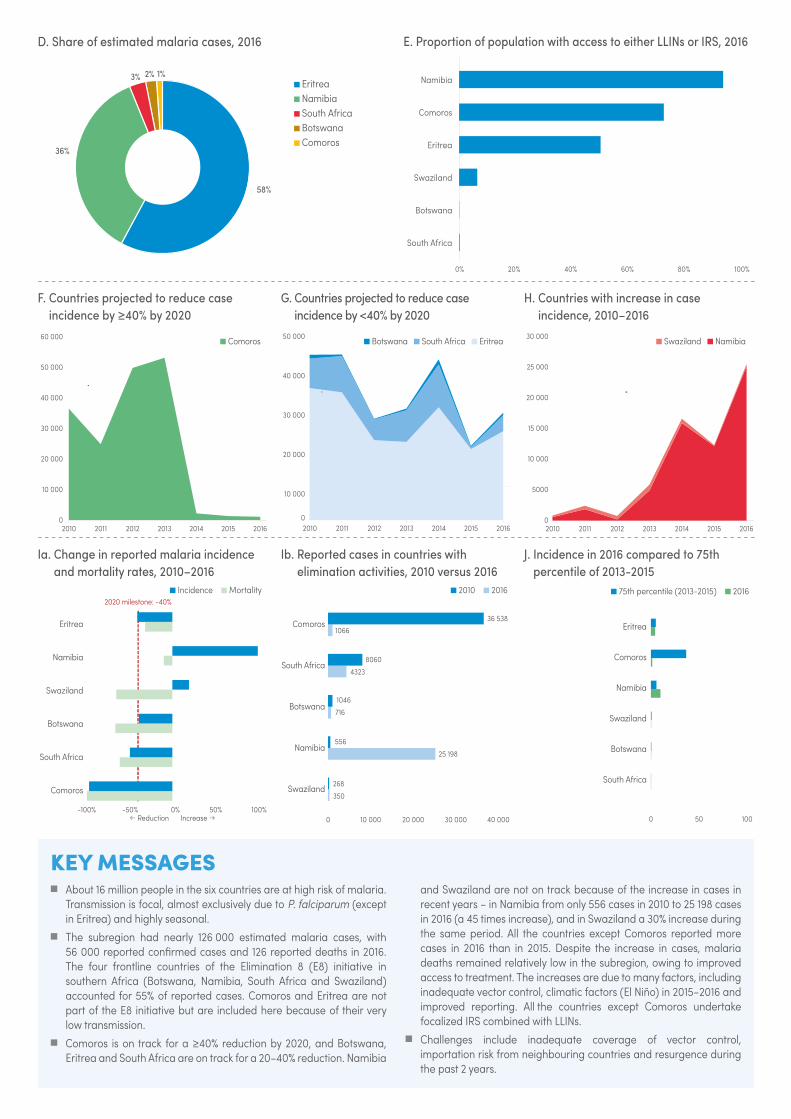
D. Share of estimated malaria cases, 2016
1%2%
58%
3%
36%
■ Eritrea■ Namibia■ South Africa■ Botswana■ Comoros
KEY MESSAGES ■ About 16 million people in the six countries are at high risk of malaria.
Transmission is focal, almost exclusively due to P. falciparum (except in Eritrea) and highly seasonal.
■ The subregion had nearly 126 000 estimated malaria cases, with 56 000 reported confirmed cases and 126 reported deaths in 2016. The four frontline countries of the Elimination 8 (E8) initiative in southern Africa (Botswana, Namibia, South Africa and Swaziland) accounted for 55% of reported cases. Comoros and Eritrea are not part of the E8 initiative but are included here because of their very low transmission.
■ Comoros is on track for a ≥40% reduction by 2020, and Botswana, Eritrea and South Africa are on track for a 20–40% reduction. Namibia
and Swaziland are not on track because of the increase in cases in recent years – in Namibia from only 556 cases in 2010 to 25 198 cases in 2016 (a 45 times increase), and in Swaziland a 30% increase during the same period. All the countries except Comoros reported more cases in 2016 than in 2015. Despite the increase in cases, malaria deaths remained relatively low in the subregion, owing to improved access to treatment. The increases are due to many factors, including inadequate vector control, climatic factors (El Niño) in 2015–2016 and improved reporting. All the countries except Comoros undertake focalized IRS combined with LLINs.
■ Challenges include inadequate coverage of vector control, importation risk from neighbouring countries and resurgence during the past 2 years.
Ia. Change in reported malaria incidence and mortality rates, 2010–2016
2020 milestone: -40%
Eritrea
Namibia
Swaziland
Botswana
South Africa
Comoros
■ Incidence ■ Mortality
f Reduction Increase p50%0%-50%-100% 100%
E. Proportion of population with access to either LLINs or IRS, 2016
Namibia
Comoros
Eritrea
Swaziland
Botswana
South Africa
100%80%60%40%20%0%
J. Incidence in 2016 compared to 75th percentile of 2013-2015
Eritrea
Comoros
Namibia
Swaziland
Botswana
South Africa
100500
■ 75th percentile (2013-2015) ■ 2016
F. Countries projected to reduce case incidence by ≥40% by 2020
201520142013201220112010 2016
60 000
50 000
40 000
30 000
20 000
10 000
0
■ Comoros
.
G. Countries projected to reduce case incidence by <40% by 2020
20152014201320122011 2016
40 000
30 000
20 000
10 000
50 000
02010
■ Botswana ■ South Africa ■ Eritrea
.
H. Countries with increase in case incidence, 2010–2016
201520142013201220112010 2016
25 000
20 000
15 000
10 000
5000
30 000
0
■ Swaziland ■ Namibia
.
Ib. Reported cases in countries with elimination activities, 2010 versus 2016
Comoros
South Africa
Botswana
Namibia
Swaziland
■ 2010 ■ 20162016
30 00020 00010 0000 40 000
36 5381066
8060
4323
1046
716
556
25 198
268
350

Annex 2 - E. Regional profile: Region of the Americas
A. Confirmed malaria cases per 1000 population, 2016
B. Malaria funding by source, 2010–2016
SurinamePanama
Costa RicaGuyana
NicaraguaBelize
EcuadorHaiti
El SalvadorParaguay
GuatemalaMexico
HondurasBrazil
Bolivia (Plurinational State of)Dominican Republic
Venezuela (Bolivarian Republic of)Colombia
PeruArgentina
French Guiana
US$3210 4
■ National ■ International
US$
(milli
on)
2016201520142013201220112010
200
100
300
0
■ Domestic* ■ Global Fund ■ World Bank ■ USAID ■ UK ■ Other
EPIDEMIOLOGY
Population at risk: 126.8 millionParasites: P. falciparum (27%), P. vivax (69%) and other (4%)Vectors: An. albimanus, An. albitarsis, An. aquasalis, An. braziliensis, An. darlingi, An. neivai, An. nuneztovari, An. pseudopunctipennis and An. punctimacula
FUNDING, 2010–2016
Decreased from US$ 192.3 million in 2010 to US$ 167.4 million in 2016 (13% decrease)Proportion of domestic source in 2016: 85%Regional funding mechanisms: Meso-America
INTERVENTIONS, 2010–2016
Countries with ≥50% coverage with either LLINs or IRS in 2016: Guatemala, Guyana and NicaraguaNumber of RDTs distributed in 2016: 847 000Number of ACT courses distributed in 2016: 274 000
REPORTED CASES AND DEATHS, 2010–2016
Cases: Decreased from 7.7 million in 2010 to 562 800 in 2016 (93% decrease)Deaths: Decreased from 190 in 2010 to 110 in 2016 (42% decrease)
ESTIMATED CASES AND DEATHS, 2010–2016
Cases: Decreased from 1 million in 2010 to 875 300 in 2016 (16% decrease)Deaths: Decreased from 831 in 2010 to 653 in 2016 (21% decrease)
ACCELERATION TO ELIMINATION, 2010–2016
Countries with elimination programmes: Argentina, Belize, Costa Rica, Ecuador, El Salvador, Mexico, Paraguay and SurinameZero indigenous cases for 3 consecutive years: Argentina and ParaguayZero indigenous cases in current year: Argentina and ParaguayCertification in progress: Argentina and Paraguay
Global Fund, Global Fund to Fight AIDS, Tuberculosis and Malaria; UK, United Kingdom of Great Britain and Northern Ireland; USAID, United States Agency for International Development* Excludes patient service delivery costs and out-of-pocket expenditure
Insu�cient data
Confirmed cases per 1000 population
0
0–0.1
1.0–10
0.1–1.0
10–50
50–100
>100
Not applicable
C. Malaria funding* per person at risk, average 2014–2016
* Excludes cost related to health staff and out-of-pocket expenditure
WORLD MALARIA REPORT 201784

D. Share of estimated malaria cases, 2016
KEY MESSAGES ■ Of the 18 endemic countries, 12 are on target to achieve a ≥40%
reduction in case incidence by 2020, while five are on target for a 20–40% reduction. Four countries (Nicaragua, Panama, Peru and Venezuela [Bolivarian Republic of]) saw increases in 2016 compared to 2010. Cases in Colombia doubled between 2015 and 2016, despite earlier reduction. Brazil and Venezuela (Bolivarian Republic of) account for 65% of reported cases. The increase in cases in Peru from 2010 onwards has led to loss of the gains achieved since 2000.
■ Despite increases in some countries, transmission is focalized; in particular, in Choco in Colombia, Loreto in Peru and Bolivar in Venezuela (Bolivarian Republic of). Similarly, nearly 45% of cases in Brazil come from 15 municipalities in Acre and Amazonas. Increases in other countries in 2016 are attributed to improved surveillance and focal outbreaks.
■ Nine countries reported zero local P. falciparum cases for more than 3 years, Bolivia (Plurinational State of) and Guatemala reported <10, and Brazil reported a 72% decline between 2010 and 2016. Coverage of IRS and LLINs has declined in recent years while funding stagnated in the region.
■ Two countries are in the process of certification for elimination. Nine countries in Central America and Hispaniola are taking part in the subregional initiative to eliminate malaria by 2020; three of these countries (Belize, Costa Rica and El Salvador) reported <15 cases each in 2016. Efforts are under way to enhance access to diagnosis and treatment, investigation of cases and adequate response.
Ia. Change in reported malaria incidence and mortality rates, 2010–2016
2020 milestone: -40%
NicaraguaVenezuela
(Bolivarian Republic of)
PanamaPeru
ColombiaGuatemala
GuyanaHonduras
Bolivia (Plurinational State of)
BrazilHaiti
Dominican RepublicFrench Guiana
f Reduction Increase p50%0%-50%-100% 100%
■ Incidence ■ Mortality
E. Proportion of Plasmodium species, 2010 and 2016
Dominican RepublicHaiti
ColombiaGuyanaEcuador
HondurasPeru
Venezuela (Bolivarian Republic of)French Guiana
NicaraguaBrazil
SurinamePanama
Bolivia (Plurinational State of)Guatemala
MexicoBelize
El Salvador100%50%0% 100%50%0%
P. falciparum P. vivax Other
2010 2016
J. Incidence in 2016 compared to 75th percentile of 2013-2015
GuyanaVenezuela (Bolivarian Republic of)
French GuianaPeruHaiti
SurinameColombia
BrazilBolivia (Plurinational State of)
HondurasGuatemalaNicaragua
PanamaDominican Republic
BelizeEcuadorMexico
El SalvadorParaguay
Costa Rica4020 30100
■ 75th percentile (2013-2015) ■ 2016
F. Countries and territories projected to reduce case incidence by ≥40% by 2020
201520142013201220112010 2016
500 000
400 000
300 000
200 000
100 000
0
■ Argentina ■ Paraguay ■ Costa Rica ■ Belize ■ Mexico
■ French Guiana ■ Suriname ■ Dominican Republic ■ Honduras
■ Bolivia (Plurinational State of) ■ Haiti ■ Brazil
.
G. Countries projected to reduce case incidence by <40% by 2020
201520142013201220112010 2016
120 000
90 000
60 000
30 000
150 000
0
■ El Salvador ■ Ecuador ■ Guatemala■ Guyana ■ Colombia
H. Countries with increase in case incidence, 2010–2016
201520142013201220112010 2016
300 000
250 000
200 000
150 000
100 000
50 000
350 000
0
■ Panama ■ Nicaragua ■ Peru■ Venezuela (Bolivarian Republic of)
Ib. Reported cases in countries with elimination activities, 2010 versus 2016
Ecuador
Suriname
Mexico
Belize
Costa Rica
El Salvador
Paraguay
Argentina
150010005000 2000
18881191
171276
1226551
1504
4
1913
180
140
110
■ 2010 ■ 2016
34.4%
18%
15.3%
3.8%
1.4%
14.3%
9.8%
■ Venezuela (Bolivarian Republic of)
■ Brazil■ Colombia■ Peru■ Haiti■ Guyana■ Nicaragua■ Other
■ Honduras■ Bolivia (Plurinational State of)■ Guatemala■ French Guiana■ Suriname
1%0.8%0.7%

Annex 2 - F. Regional profile: Eastern Mediterranean Region
A. Confirmed malaria cases per 1000 population/parasite prevalence (PP), 2016
EPIDEMIOLOGY
Population at risk: 301.2 millionParasites: P. falciparum (38%), P. vivax (41%) and other (21%)Vectors: An. albimanus, An. arabiensis, An. bacroftii, An. balabacensis, An. culicifacies, An. fluviatilis, An. funestus, An. gambiae, An. hyrcanus, An. nili, An. pharoensis, An. pulcherrimus, An. sacharovi, An. sergentii, An. stephensi and An. superuictus
FUNDING, 2010–2016
Increased from US$ 108.6 million reported in 2010 to US$ 148.8 million in 2016 (37% increase)Proportion of domestic source in 2016: 38%Regional funding mechanisms: none
B. Malaria funding by source, 2010–2016
Djibouti
Sudan
Saudi Arabia
Somalia
Afghanistan
Yemen
Iran (Islamic Republic of)
Pakistan
US$3210 4
■ National ■ International
US$
(milli
on)
2016201520142013201220112010
200
150
100
50
250
0
■ Domestic* ■ Global Fund ■ World Bank ■ USAID ■ UK ■ Other
C. Malaria funding* per person at risk, average 2014–2016
* Excludes cost related to health staff and out-of-pocket expenditure
Confirmed cases per 1000 population■ Insu�cient data■ 0■ 0–0.1■ 0.1–1.0■ 1.0–10■ 10–50■ 50–100■ 100–200■ 200–300■ >300
PP>800
■ Not applicable
REPORTED CASES AND DEATHS, 2010–2016
Cases: Decreased from 1.15 million in 2010 to 1.14 million in 2016 (2% decrease)Deaths: Decreased from 1143 in 2010 to 1142 in 2016
ESTIMATED CASES AND DEATHS, 2010–2016
Cases: Increased from 3.92 million in 2010 to 4.25 million in 2016 (8% increase)Deaths: Increased from 7189 in 2010 to 8159 in 2016 (13% increase)
INTERVENTIONS, 2010–2016
Countries with ≥50% coverage with either LLINs or IRS in 2016: Afghanistan, Sudan and YemenNumber of RDTs distributed in 2016: 17.1 millionNumber of ACT courses distributed in 2016: 4.3 million
ACCELERATION TO ELIMINATION, 2010–2016
Countries with elimination programmes: Iran (Islamic Republic of) and Saudi ArabiaZero indigenous cases for 3 consecutive years: OmanZero indigenous cases in current year: OmanCertification in progress: no country
WORLD MALARIA REPORT 201786
Global Fund, Global Fund to Fight AIDS, Tuberculosis and Malaria; UK, United Kingdom of Great Britain and Northern Ireland; USAID, United States Agency for International Development* Excludes patient service delivery costs and out-of-pocket expenditure

KEY MESSAGES ■ Fourteen countries in the region are free of indigenous malaria
and are at the stage of prevention of re-establishment, and eight countries are malaria endemic. Estimated malaria incidence in the region has declined since 2010 but increased in 2016, when the region reported a total of 3.6 million cases (presumed and confirmed) of which 1.23 million were confirmed.
■ Iran (Islamic Republic of) and Saudi Arabia are targeting elimination by 2020. Trends in Iran (Islamic Republic of) have declined from 1847 to 81 cases between 2010 and 2016. In Saudi Arabia, the number of cases remained below 100 between 2010 and 2015, but rose to 272 in 2016 mainly due to an increase in population movement and difficulties to access border areas with Yemen. The general health service in these countries undertakes continued vigilance, and provides free-of-charge diagnosis and treatment to all imported cases.
■ The other endemic countries (Afghanistan, Djibouti, Pakistan, Somalia, Sudan and Yemen) are at the burden reduction stage. Sudan and Yemen are on target for a 20–40% reduction, although the downward trend in Yemen was reversed in 2016. Afghanistan was on a downward trend until 2013 but cases have continuously increased since 2014.
■ Challenges include coverage of key malaria interventions still below the universal target in most endemic countries, inadequate funding and reliance on external resources, difficult operational environments and population displacements, availability of quality technical staff particularly at subnational level, weak surveillance and health information system. These may have resulted in the overall increase in cases during 2014–2016 in some countries of the region.
Ia. Change in reported malaria incidence and mortality rates, 2010–2016
2020 milestone: -40%
Djibouti
Afghanistan
Pakistan
Yemen
Sudan
Somalia
f Reduction Increase p50%0%-50%-100% 100%
■ Incidence ■ Mortality
E. Proportion of Plasmodium species, 2010 and 2016
Saudi Arabia
Djibouti
Yemen
Somalia
Sudan
Pakistan
Iran (Islamic Republic of)
Afghanistan
100%50%0%100%50%0%
P. falciparum P. vivax Other2010 2016
J. Incidence in 2016 compared to 75th percentile of 2013-2015
Yemen
Afghanistan
Pakistan
Somalia
Iran (Islamic Republic of)
Saudi Arabia
2515 201050
■ 75th percentile (2013-2015) ■ 2016
F. Countries projected to reduce case incidence by ≥40% by 2020
201520142013201220112010 2016
1500
1000
500
2000
0
■ Iran (Islamic Republic of)
.
G. Countries projected to reduce case incidence by <40% by 2020
201520142013201220112010 2016
1 200 000
900 000
600 000
300 000
1 500 000
0
■ Yemen ■ Sudan
.
H. Countries with increase in case incidence, 2010–2016
201520142013201220112010 2016
400 000
300 000
100 000
500 000
0
■ Somalia ■ Djibouti■ Afghanistan ■ Pakistan
Ib. Reported indigenous cases in countries with elimination activities, 2010 versus 2016
Iran (Islamic Republic of)
Saudi Arabia
150010005000 2000
184781
29272
■ 2010 ■ 2016
D. Share of estimated malaria cases, 2016
10%
31%13%
15%
31%
■ Pakistan■ Sudan■ Somalia■ Afghanistan■ Yemen

Annex 2 - G. Regional profile: European Region
A. Confirmed malaria cases per 1000 population, 2016
B. Imported malaria cases and associated deaths in Europe, 2010–2015
Impo
rted
mal
aria
cas
es
201520142013201220112010
8000
6000
4000
4000
10 000
0De
aths
due
to im
porte
d m
alar
ia c
ases
20
15
10
5
25
0
Deaths
Cases
C. Trends of imported malaria cases in Europe, 2010–2015
20142013201220112010 2015
6000
4000
2000
8000
0
■ Other ■ Portugal ■ Turkey ■ Sweden ■ Belgium ■ Netherlands ■ Switzerland ■ Spain ■ Germany ■ United Kingdom of Great Britain and Northern Ireland ■ France
Confirmed cases per 1000 population■ 0■ 0–0.1■ 0.1–1.0
■ 1.0–10■ 10–50■ 50–100
■ 0■ Insu�cient data■ Not applicable
■ >100
WORLD MALARIA REPORT 201788

D. Regional source of infection by country, 2015
800
600
400
200
1000
0
Ger
man
y
Italy
Switz
erla
nd
Portu
gal
Swed
en
Gre
ece
Denm
ark
Russ
ian
Fede
ratio
n
Norw
ay
Pola
nd
Czec
h Re
publ
ic
Irela
nd
Bulg
aria
Rom
ania
Hung
ary
Mal
ta
Geo
rgia
Repu
blic
of M
aced
onia
Kaza
khst
an
Alba
nia
Latv
ia
Lithu
ania
Azer
baija
n
Esto
nia
Cypr
us
Americas Eastern MediterraneanSouth-East Asia Western Pacific UnknownAfrica
KEY MESSAGES ■ Following interruption of indigenous malaria transmission in the WHO
European Region in 2015, 10 countries that had been the last stronghold for malaria in the region − Armenia, Azerbaijan, Georgia, Kazakhstan, Kyrgyzstan, Russian Federation, Tajikistan, Turkey, Turkmenistan and Uzbekistan − confirmed their commitment to preventing malaria reintroduction by signing the Ashgabat Statement: Preventing the re-establishment of malaria transmission in the WHO European Region. The Ashgabat Statement reaffirms the commitment made in the 2005 Tashkent Declaration: “The move from malaria control to elimination” in the WHO European Region, which was signed by the same group of countries (except Russian Federation).
■ The Tashkent Declaration represented a turning point in efforts to achieve a malaria-free Europe, using the Regional Strategy:
From malaria control to elimination in the WHO European Region 2006–2015, enabling the affected European countries to reduce the number of indigenous malaria cases from nearly 91 000 in 1995 to zero in 2015. The Ashgabat Statement outlines the commitment to control malaria importation, prevent the re-establishment of local transmission and rapidly contain any resurgence of the disease. As long as malaria continues to circulate globally, people travelling to and from malaria endemic countries can import the disease to Europe.
■ The Ashgabat Statement is serving as a platform for planning, implementing and monitoring activities to prevent the re-establishment of malaria in the region through enhanced vigilance especially of imported cases.
E. Imported malaria cases by country, 2015
2500
1063
706
434
340
277
250
218194
768
1397
■ France■ United Kingdom of
Great Britain and Northern Ireland
■ Germany■ Spain■ Switzerland■ Netherlands■ Belgium■ Sweden■ Turkey■ Portugal■ Other
F. Imported malaria cases by regional source of infection, 2015
15%
2% 2% 1% 0%
80%
■ Africa■ Eastern Mediterranean■ South-East Asia■ Unknown■ Americas■ Western Pacific

Annex 2 - H. Regional profile: South-East Asia Region
A. Confirmed malaria cases per 1000 population, 2016
EPIDEMIOLOGY
Population at risk: 1.35 billionParasites: P. falciparum (63%), P. vivax (35%) and other (2%)Vectors: An. albimanus, An. annularis, An. balabacensis, An. barbirostris, An. culicifacies, An. dirus, An. farauti, An. fluviatilis, An. maculatus, An. minimus, An. philippiensis, An. sinensis, An. stephensi, An. subpictus, An. sundaicus and An. varuna
FUNDING, 2010–2016
Decreased from US$ 239.7 million in 2010 to US$ 189.3 million in 2016 (21% decrease)Proportion of domestic source in 2016: 48%Regional funding mechanisms: Malaria Elimination in the Greater Mekong Region (MME): Myanmar and Thailand
B. Malaria funding by source, 2010–2016
Timor-Leste
Myanmar
Bhutan
Thailand
Democratic People’s Republic of Korea
Nepal
Indonesia
Sri Lanka
Bangladesh
India
US$3210 4
■ National ■ International
US$
(milli
on)
2016201520142013201220112010
200
150
100
50
250
0
■ Domestic* ■ Global Fund ■ World Bank ■ USAID ■ UK ■ Other
C. Malaria funding* per person at risk, average 2014–2016
* Excludes cost related to health staff and out-of-pocket expenditure
Insu�cient data
Confirmed cases per 1000 population
0
0–0.1
1.0–10
0.1–1.0
10–50
50–100
>100
Not applicable
REPORTED CASES AND DEATHS, 2010–2016
Cases: Decreased from 2.6 million in 2010 to 1.3 million in 2016 (50% decrease)Deaths: Decreased from 1403 in 2010 to 557 in 2016 (60% decrease)
ESTIMATED CASES AND DEATHS, 2010–2016
Cases: Decreased from 26.2 million in 2010 to 14.6 million in 2016 (44% decrease)Deaths: Decreased from 41 600 in 2010 to 26 600 in 2016 (36% decrease)
INTERVENTIONS, 2010–2016
Countries with ≥50% coverage with either LLINs or IRS in 2016: Bhutan, Democratic People’s Republic of Korea, Indonesia, Myanmar, Nepal and Timor-LesteNumber of RDTs distributed in 2016: 25 millionNumber of ACT courses distributed in 2016: 900 000
ACCELERATION TO ELIMINATION, 2010–2016
Countries with elimination programmes: Bangladesh, Bhutan, Democratic People's Republic of Korea, India, Indonesia, Myanmar, Nepal and ThailandZero indigenous cases for 3 consecutive years: no countryZero indigenous cases in current year: no countryCertification in progress: no country
WORLD MALARIA REPORT 201790
Global Fund, Global Fund to Fight AIDS, Tuberculosis and Malaria; UK, United Kingdom of Great Britain and Northern Ireland; USAID, United States Agency for International Development* Excludes patient service delivery costs and out-of-pocket expenditure

KEY MESSAGES ■ Malaria is endemic in nine of the 11 countries of this region, accounting
for nearly 70% of the burden outside the WHO African Region. Nearly 63% of the cases are due to P. falciparum. India and Indonesia accounted for 80% and 16% of the reported cases, and 60% and 30% of malaria deaths in 2016, respectively.
■ Eight of the nine countries are on target to achieve a ≥40% reduction in case incidence by 2020, and India is on track for a 20–40% reduction. Bangladesh has for the first time reported <5000 cases, Timor-Leste continued to report <100 cases and Bhutan reported only 15 indigenous cases in 2016.
■ Malaria deaths in the region decreased from 1403 in 2010 to 557 in 2016 (60% reduction). Bhutan and Timor-Leste reported zero deaths since 2013 and 2015, respectively. Odisha, the highest endemic state of India, reported an increase in cases in 2016 (to double the number in 2013). The other countries had no major outbreaks reported.
■ Maldives and Sri Lanka – both certified as malaria free in 2015 and 2016, respectively – have maintained their malaria free status. The region has the goal to become malaria free by 2030. According to Member States’ national strategic plans, Bhutan is aiming for malaria free status by 2018, Democratic People’s Republic of Korea, Nepal, Thailand and Timor-Leste by 2025, and the four remaining countries by 2030.*
■ Challenges include decreased funding, multiple ACT failures in the countries of the Greater Mekong subregion and vector resistance to pyrethroids. Efforts are under way to improve reporting from the private sector and NGOs, and case-based surveillance to accelerate elimination.
* The 2016 WHO report, Eliminating malaria, identified three countries (Bhutan, Nepal and Timor-Leste) with the potential to eliminate malaria by 2020 if activities are accelerated.
Ha. Change in reported malaria incidence and mortality rates, 2010–2016
2020 milestone: -40%
India
Indonesia
Nepal
Bangladesh
f Reduction Increase p50%0%-50%-100% 100%
■ Incidence ■ Mortality
E. Proportion of Plasmodium species, 2010 and 2016
Timor-Leste
Bangladesh
India
Myanmar
Indonesia
Thailand
Nepal
Bhutan
Democratic People’s Republic of Korea
100%50%0% 100%50%0%
P. falciparum P. vivax Other2010 2016
I. Incidence in 2016 compared to 75th percentile of 2013-2015
Myanmar
Indonesia
Thailand
India
Nepal
Bangladesh
Timor-Leste
Bhutan
Democratic People’sRepublic of Korea
42 310
■ 75th percentile (2013-2015) ■ 2016
F. Countries projected to reduce case incidence by ≥40% by 2020
201520142013201220112010 2016
1 000 000
800 000
600 000
400 000
200 000
1 200 000
0
■ Bhutan ■ Nepal ■ Democratic People’s Republic of Korea■ Thailand ■ Timor-Leste ■ Bangladesh ■ Myanmar ■ Indonesia
.
G. Countries projected to reduce case incidence by <40% by 2020
201520142013201220112010 2016
1 600 000
1 200 000
800 000
400 000
2 000 000
0
■ India
.
Hb. Reported cases in countries with elimination activities, 2010 versus 2016
Myanmar
Thailand
Democratic People’sRepublic of Korea
Bhutan
400 000300 000200 000100 0000 500 000
36 742
32 480
11 522
13 520
2719
436
15
■ 2010 ■ 2016
420 808
D. Share of estimated malaria cases, 2016
1%
90%
9%■ India■ Indonesia■ Myanmar
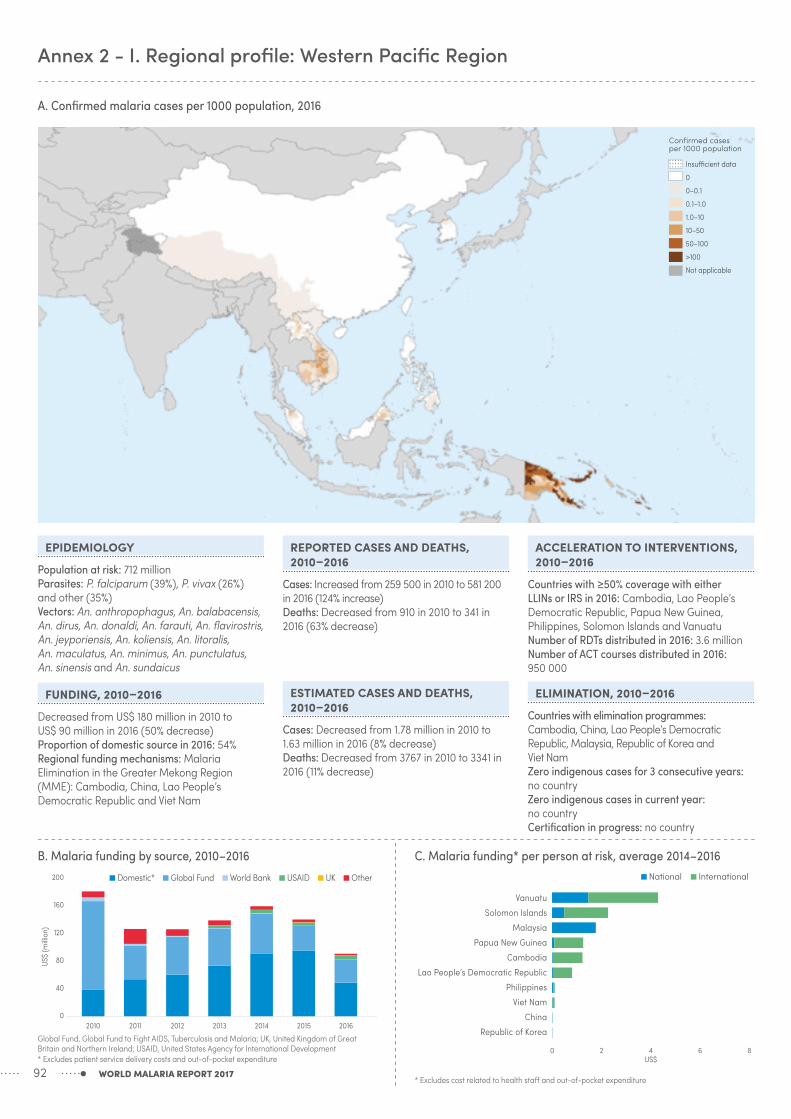
Annex 2 - I. Regional profile: Western Pacific Region
A. Confirmed malaria cases per 1000 population, 2016
B. Malaria funding by source, 2010–2016
Vanuatu
Solomon Islands
Malaysia
Papua New Guinea
Cambodia
Lao People’s Democratic Republic
Philippines
Viet Nam
China
Republic of Korea
6US$
420 8
■ National ■ International
US$
(milli
on)
2016201520142013201220112010
160
120
80
40
200
0
■ Domestic* ■ Global Fund ■ World Bank ■ USAID ■ UK ■ Other
EPIDEMIOLOGY
Population at risk: 712 millionParasites: P. falciparum (39%), P. vivax (26%) and other (35%)Vectors: An. anthropophagus, An. balabacensis, An. dirus, An. donaldi, An. farauti, An. flavirostris, An. jeyporiensis, An. koliensis, An. litoralis, An. maculatus, An. minimus, An. punctulatus, An. sinensis and An. sundaicus
FUNDING, 2010–2016
Decreased from US$ 180 million in 2010 to US$ 90 million in 2016 (50% decrease)Proportion of domestic source in 2016: 54%Regional funding mechanisms: Malaria Elimination in the Greater Mekong Region (MME): Cambodia, China, Lao People’s Democratic Republic and Viet Nam
Insu�cient data
Confirmed cases per 1000 population
0
0–0.1
1.0–10
0.1–1.0
10–50
50–100
>100
Not applicable
C. Malaria funding* per person at risk, average 2014–2016
* Excludes cost related to health staff and out-of-pocket expenditure
REPORTED CASES AND DEATHS, 2010–2016
Cases: Increased from 259 500 in 2010 to 581 200 in 2016 (124% increase)Deaths: Decreased from 910 in 2010 to 341 in 2016 (63% decrease)
ESTIMATED CASES AND DEATHS, 2010–2016
Cases: Decreased from 1.78 million in 2010 to 1.63 million in 2016 (8% decrease)Deaths: Decreased from 3767 in 2010 to 3341 in 2016 (11% decrease)
ACCELERATION TO INTERVENTIONS, 2010–2016
Countries with ≥50% coverage with either LLINs or IRS in 2016: Cambodia, Lao People’s Democratic Republic, Papua New Guinea, Philippines, Solomon Islands and VanuatuNumber of RDTs distributed in 2016: 3.6 millionNumber of ACT courses distributed in 2016: 950 000
ELIMINATION, 2010–2016
Countries with elimination programmes: Cambodia, China, Lao People’s Democratic Republic, Malaysia, Republic of Korea and Viet NamZero indigenous cases for 3 consecutive years: no countryZero indigenous cases in current year: no countryCertification in progress: no country
WORLD MALARIA REPORT 201792
Global Fund, Global Fund to Fight AIDS, Tuberculosis and Malaria; UK, United Kingdom of Great Britain and Northern Ireland; USAID, United States Agency for International Development* Excludes patient service delivery costs and out-of-pocket expenditure

KEY MESSAGES ■ Seven of the 10 malaria endemic countries are on target to achieve
a ≥40% reduction in case incidence by 2020, while Lao People’s Democratic Republic is on track for a 20–40% reduction. Papua New Guinea and Solomon Islands, accounting for 92% of the reported cases, reported a >400% and >40% increase in cases in 2016, respectively, partly due to inadequate access to services and improved surveillance.
■ Malaria deaths decreased from 910 in 2010 to 341 in 2016 (63% reduction). Three countries (China, Republic of Korea and Vanuatu) reported zero malaria deaths in 2016. China, Malaysia and Republic of Korea are on course for elimination by 2020. China reported only three indigenous cases in 2016 from areas bordering Yunnan and Tibet. Transmission in Malaysia is limited to Sarawak and Sabah. The country is also facing increasing cases of P. knowlesi. The Philippines
has initiated subnational elimination in Mindanao, islands of Palawan and Tawi-Tawi.
■ Three countries of the Greater Mekong subregion – Cambodia, Lao People’s Democratic Republic and Viet Nam – are supported through the Regional Artemisinin-resistance Initiative (financed by the Global Fund) to eliminate P. falciparum by 2025 and all species by 2030. These countries reported a 30% reduction of P. falciparum since 2010.
■ Challenges include decreasing funding; multiple ACT failures; vector resistance to pyrethroids (Cambodia, China, Lao People’s Democratic Republic, Philippines and Viet Nam), DDT (all except Viet Nam) and organophosphates (China); and resurgence of malaria. Substantial efforts are under way to improve access to services, and case-based surveillance to accelerate elimination.
Ia. Change in reported malaria incidence and mortality rates, 2010–2016
2020 milestone: -40%
Papua New Guinea
Solomon Islands
Philippines
Vanuatu
f Reduction Increase p50%0%-50%-100% 100%
■ Incidence ■ Mortality
E. Proportion of Plasmodium species, 2010 and 2016
Papua New Guinea
Viet Nam
Cambodia
Lao People’s Democratic Republic
Solomon Islands
Philippines
Vanuatu
Malaysia
China
Republic of Korea
100%50%0% 100%50%0%
P. falciparum P. vivax Other
2010 2016
J. Incidence in 2016 compared to 75th percentile of 2013-2015
Solomon Islands
Papua New Guinea
Vanuatu
Lao People’s Democratic Republic
Cambodia
Viet Nam
Malaysia
Philippines
Republic of Korea
China
10050 75250
■ 75th percentile (2013-2015) ■ 2016
F. Countries projected to reduce case incidence by ≥40% by 2020
201520142013201220112010 2016
100 000
80 000
60 000
40 000
20 000
120 000
0
■ Republic of Korea ■ China ■ Malaysia ■ Vanuatu ■ Viet Nam
■ Philippines ■ Cambodia.
G. Countries projected to reduce case incidence by <40% by 2020
201520142013201220112010 2016
40 000
20 000
60 000
0
■ Lao People’s Democratic Republic
H. Countries with increase in case incidence, 2010–2016
201520142013201220112010 2016
500 000
400 000
300 000
200 000
100 000
600 000
0
■ Solomon Islands■ Papua New Guinea
.
Ib. Reported cases in countries with elimination activities, 2010 versus 2016
Cambodia
Lao People’s Democratic Republic
Viet Nam
Malaysia
China
Republic of Korea
40 00030 00020 00010 0000 50 000
49 35623 492
20 80011 223
17 5154161
5194266
49903
1267601
■ 2010 ■ 2016
D. Share of estimated malaria cases, 2016
1%1%
86%
5%
5%2%
■ Papua New Guinea■ Cambodia■ Solomon Islands■ Lao People’s
Democratic Republic
■ Philippines■ Viet Nam

Annex 3 - A. Policy adoption, 2016
WHO region Country/area
Insecticide–treated mosquito nets Indoor residual spraying Chemoprevention Testing Treatment
ITNs/LLINs are
distributed free of charge
ITNs/LLINs are
distributed to all age
groups
ITNs/LLINs distributed
through mass campaigns to all age groups
IRS is recommended
by malaria control
programme
DDT is used for IRS
IPTp used to prevent
malaria during pregnancy
Seasonal malaria chemo-
prevention (SMC or IPTc)
is used
Patients of all ages should get diagnostic test
Malaria diagnosis is
free of charge in the public
sector
RDTs used at community
level
G6PD test is recommended
before treatment with
primaquine
ACT for treatment of
P. f.
Pre–referral treatment
with quinine or artemether IM or artesunate suppositories
Single dose of primaquine is used as
gametocidal medicine for
P. falciparum1
Primaquine is used for radical
treatment of P. vivax cases
Directly observed treatment
with primaquine is undertaken
AFRICAN
Algeria – – – – NA –
Angola
Benin –
Botswana
Burkina Faso
Burundi
Cabo Verde
Cameroon
Central African Republic
Chad
Comoros
Congo
Côte d'Ivoire
Democratic Republic of the Congo
Equatorial Guinea
Eritrea
Ethiopia
Gabon
Gambia
Ghana
Guinea
Guinea–Bissau
Kenya
Liberia
Madagascar
Malawi
Mali
Mauritania
Mayotte – – – – – – – –
Mozambique
Namibia
Niger –
Nigeria
Rwanda
Sao Tome and Principe
Senegal
Sierra Leone
South Africa
South Sudan2
Swaziland
Togo –
Uganda
United Republic of TanzaniaMainland
Zanzibar
Zambia
Zimbabwe
AMERICAS
Argentina NA NA NA –
Belize NA NA NA
Bolivia (Plurinational State of) NA NA
Brazil NA NA
Colombia NA NA
WORLD MALARIA REPORT 201794

WHO region Country/area
Insecticide–treated mosquito nets Indoor residual spraying Chemoprevention Testing Treatment
ITNs/LLINs are
distributed free of charge
ITNs/LLINs are
distributed to all age
groups
ITNs/LLINs distributed
through mass campaigns to all age groups
IRS is recommended
by malaria control
programme
DDT is used for IRS
IPTp used to prevent
malaria during pregnancy
Seasonal malaria chemo-
prevention (SMC or IPTc)
is used
Patients of all ages should get diagnostic test
Malaria diagnosis is
free of charge in the public
sector
RDTs used at community
level
G6PD test is recommended
before treatment with
primaquine
ACT for treatment of
P. f.
Pre–referral treatment
with quinine or artemether IM or artesunate suppositories
Single dose of primaquine is used as
gametocidal medicine for
P. falciparum1
Primaquine is used for radical
treatment of P. vivax cases
Directly observed treatment
with primaquine is undertaken
AFRICAN
Algeria – – – – NA –
Angola
Benin –
Botswana
Burkina Faso
Burundi
Cabo Verde
Cameroon
Central African Republic
Chad
Comoros
Congo
Côte d'Ivoire
Democratic Republic of the Congo
Equatorial Guinea
Eritrea
Ethiopia
Gabon
Gambia
Ghana
Guinea
Guinea–Bissau
Kenya
Liberia
Madagascar
Malawi
Mali
Mauritania
Mayotte – – – – – – – –
Mozambique
Namibia
Niger –
Nigeria
Rwanda
Sao Tome and Principe
Senegal
Sierra Leone
South Africa
South Sudan2
Swaziland
Togo –
Uganda
United Republic of TanzaniaMainland
Zanzibar
Zambia
Zimbabwe
AMERICAS
Argentina NA NA NA –
Belize NA NA NA
Bolivia (Plurinational State of) NA NA
Brazil NA NA
Colombia NA NA
WORLD MALARIA REPORT 2017 95

WHO region Country/area
Insecticide–treated mosquito nets Indoor residual spraying Chemoprevention Testing Treatment
ITNs/LLINs are
distributed free of charge
ITNs/LLINs are
distributed to all age
groups
ITNs/LLINs distributed
through mass campaigns to all age groups
IRS is recommended
by malaria control
programme
DDT is used for IRS
IPTp used to prevent
malaria during pregnancy
Seasonal malaria chemo-
prevention (SMC or IPTc)
is used
Patients of all ages should get diagnostic test
Malaria diagnosis is
free of charge in the public
sector
RDTs used at community
level
G6PD test is recommended
before treatment with
primaquine
ACT for treatment of
P. f.
Pre–referral treatment
with quinine or artemether IM or artesunate suppositories
Single dose of primaquine is used as
gametocidal medicine for
P. falciparum1
Primaquine is used for radical
treatment of P. vivax cases
Directly observed treatment
with primaquine is undertaken
AMERICAS
Costa Rica NA NA NA –
Dominican Republic NA NA NA
Ecuador NA NA
El Salvador NA NA NA
French Guiana NA NA
Guatemala NA NA NA
Guyana NA NA
Haiti NA NA NA
Honduras NA NA NA
Mexico NA NA NA
Nicaragua NA NA NA
Panama NA NA
Paraguay NA NA
Peru NA NA
Suriname NA NA
Venezuela (Bolivarian Republic of) NA NA
EASTERN MEDITERRANEAN
Afghanistan NA NA
Djibouti
Iran (Islamic Republic of) NA NA –
Pakistan NA NA
Saudi Arabia NA NA –
Somalia
Sudan
Yemen NA NA
SOUTH-EAST ASIA
Bangladesh NA NA
Bhutan NA NA
Democratic People's Republic of Korea NA NA – NA –
India NA NA
Indonesia NA NA
Myanmar NA NA
Nepal NA NA
Thailand NA NA
Timor-Leste NA NA
WESTERN PACIFIC
Cambodia NA NA
China NA NA
Lao People's Democratic Republic NA NA
Malaysia – NA NA –
Papua New Guinea NA NA
Philippines NA NA
Republic of Korea – – NA NA – NA –
Solomon Islands NA NA
Vanuatu NA NA
Viet Nam NA NA
ACT, artemisinin-based combination therapy; DDT, dichloro-diphenyl-trichloroethane; G6PD, glucose-6-phosphate dehydrogenase; IM, intramuscular; IPTc, intermittent preventive treatment in children; IPTp, intermittent preventive treatment in pregnancy; IRS, indoor residual spraying; ITN, insecticide-treated mosquito net; LLIN, long-lasting insecticidal net; NA, not applicable; NMCP, national malaria control programme; RDT, rapid diagnostic test; SMC, seasonal malaria chemoprevention
● = Actually implemented = Not implemented– = Question not answered or not applicable1 Single dose of primaquine (0.75 mg base/kg) for countries in the WHO Region of the Americas2 In May 2013 South Sudan was reassigned to the WHO African Region (WHA resolution 66.21, http://apps.who.int/gb/ebwha/pdf_files/WHA66/
A66_R21-en.pdf)
Annex 3 - A. Policy adoption, 2016
WORLD MALARIA REPORT 201796

WHO region Country/area
Insecticide–treated mosquito nets Indoor residual spraying Chemoprevention Testing Treatment
ITNs/LLINs are
distributed free of charge
ITNs/LLINs are
distributed to all age
groups
ITNs/LLINs distributed
through mass campaigns to all age groups
IRS is recommended
by malaria control
programme
DDT is used for IRS
IPTp used to prevent
malaria during pregnancy
Seasonal malaria chemo-
prevention (SMC or IPTc)
is used
Patients of all ages should get diagnostic test
Malaria diagnosis is
free of charge in the public
sector
RDTs used at community
level
G6PD test is recommended
before treatment with
primaquine
ACT for treatment of
P. f.
Pre–referral treatment
with quinine or artemether IM or artesunate suppositories
Single dose of primaquine is used as
gametocidal medicine for
P. falciparum1
Primaquine is used for radical
treatment of P. vivax cases
Directly observed treatment
with primaquine is undertaken
AMERICAS
Costa Rica NA NA NA –
Dominican Republic NA NA NA
Ecuador NA NA
El Salvador NA NA NA
French Guiana NA NA
Guatemala NA NA NA
Guyana NA NA
Haiti NA NA NA
Honduras NA NA NA
Mexico NA NA NA
Nicaragua NA NA NA
Panama NA NA
Paraguay NA NA
Peru NA NA
Suriname NA NA
Venezuela (Bolivarian Republic of) NA NA
EASTERN MEDITERRANEAN
Afghanistan NA NA
Djibouti
Iran (Islamic Republic of) NA NA –
Pakistan NA NA
Saudi Arabia NA NA –
Somalia
Sudan
Yemen NA NA
SOUTH-EAST ASIA
Bangladesh NA NA
Bhutan NA NA
Democratic People's Republic of Korea NA NA – NA –
India NA NA
Indonesia NA NA
Myanmar NA NA
Nepal NA NA
Thailand NA NA
Timor-Leste NA NA
WESTERN PACIFIC
Cambodia NA NA
China NA NA
Lao People's Democratic Republic NA NA
Malaysia – NA NA –
Papua New Guinea NA NA
Philippines NA NA
Republic of Korea – – NA NA – NA –
Solomon Islands NA NA
Vanuatu NA NA
Viet Nam NA NA
ACT, artemisinin-based combination therapy; DDT, dichloro-diphenyl-trichloroethane; G6PD, glucose-6-phosphate dehydrogenase; IM, intramuscular; IPTc, intermittent preventive treatment in children; IPTp, intermittent preventive treatment in pregnancy; IRS, indoor residual spraying; ITN, insecticide-treated mosquito net; LLIN, long-lasting insecticidal net; NA, not applicable; NMCP, national malaria control programme; RDT, rapid diagnostic test; SMC, seasonal malaria chemoprevention
● = Actually implemented = Not implemented– = Question not answered or not applicable1 Single dose of primaquine (0.75 mg base/kg) for countries in the WHO Region of the Americas2 In May 2013 South Sudan was reassigned to the WHO African Region (WHA resolution 66.21, http://apps.who.int/gb/ebwha/pdf_files/WHA66/
A66_R21-en.pdf)
WORLD MALARIA REPORT 2017 97

WHO regionCountry/area
P. falciparum P. vivax
Uncomplicated unconfirmed
Uncomplicated confirmed Severe Prevention during
pregnancy Treatment
AFRICAN
Algeria CQAngola AL AL AS; QNBenin AL AL AS; QNBotswana AL AL QNBurkina Faso AL; AS+AQ AL; AS+AQ AS; QN SP(IPT)Burundi AS+AQ AS+AQ AS; QNCabo Verde AL AL QNCameroon AS+AQ AS+AQ AS, AM;QNCentral African Republic AL AL AS, AM; QN SP(IPT)Chad AL; AS+AQ AL; AS+AQ AS,QN SP(IPT)Comoros AL AL QN SP(IPT)Congo AS+AQ AS+AQ QN SP(IPT)Côte d'Ivoire AS+AQ AS+AQ QN SP(IPT)Democratic Republic of the Congo AS+AQ AS+AQ AS, QNEquatorial Guinea AS+AQ AS+AQ ASEritrea AS+AQ AS+AQ QN AS+AQ+PQEthiopia AL AL AS; AM; QN CQGabon AS+AQ AS+AQ AS; AM; QNGambia AL AL QN SP(IPT)Ghana AS+AQ AL; AS+AQ AS; AM; QN SP(IPT)Guinea AS+AQ AS+AQ AS SP(IPT)Guinea-Bissau AL AL AS;QNKenya AL AL AS; AM; QNLiberia AS+AQ AS+AQ AS; AM; QNMadagascar AS+AQ AS+AQ QN SP(IPT)Malawi AL AL AS; QN SP(IPT)Mali AS+AQ AL; AS+AQ QN SP(IPT)Mauritania AS+AQ AL; AS+AQ QN
Mayotte AL QN; AS; QN+AS; AS+D; QN+D CQ+PQ
Mozambique AL AL AS, QNNamibia AL AL QN ALNiger AL AL AS; QN SP(IPT)Nigeria AL; AS+AQ AL; AS+AQ AS; AM; QN SP(IPT)Rwanda AL AL AS; QNSao Tome and Principe AS+AQ AS+AQ QNSenegal AL; AS+AQ; DHA-PPQ AL; AS+AQ; DHA-PPQ AS; QN SP(IPT)Sierra Leone AS+AQ AL; AS+AQ AS; AM; QN SP(IPT)South Africa AL; QN+CL; QN+D QN AL+PQ; CQ+PQSouth Sudan1 AS+AQ AS+AQ AM; AS; QN AS+AQ+PQSwaziland AL ASTogo AL; AS+AQ AL; AS+AQ AS; AM; QN SP(IPT)Uganda AL AL AS, QNUnited Republic of Tanzania AL; AS+AQ AL; AS+AQ AS, AM; QN
Mainland AL AL AS, AM; QN SP(IPT)Zanzibar AS+AQ AS+AQ AS; QN SP(IPT)
Zambia AL AL AS; AM; QNZimbabwe AL AL QN
AMERICAS
Argentina - AL+PQ CQ+PQBelize CQ+PQ(1d) QN CQ+PQ(14d)Bolivia (Plurinational State of) - AL AS CQ+PQ(7d)
Brazil - AL+PQ; AS+MQ+PQ AS+CL: AM+CL; QN+CL
CQ+PQ(7d); CQ+PQ(14d)
Colombia - AL+PQ AS - CQ+PQ(14d)
Costa Rica - CQ+PQ (1d) AS - CQ+PQ(7d); CQ+PQ(14d)
Annex 3 - B. Antimalarial drug policy, 2016
WORLD MALARIA REPORT 201798

WHO regionCountry/area
P. falciparum P. vivax
Uncomplicated unconfirmed
Uncomplicated confirmed Severe Prevention during
pregnancy Treatment
AMERICAS
Dominican Republic - CQ+PQ(1d) AS - CQ+PQ(14d)Ecuador - AL+PQ AS - CQ (3d)+PQ(7d)El Salvador - CQ+PQ(1d) QN - CQ+PQ(14d)French Guiana - AL AS - CQ+PQ(14d)Guatemala - CQ+PQ(1d) QN - CQ+PQ(14d)Guyana - AL+PQ(1d) AM - CQ+PQ(14d)Haiti - CQ+PQ(1d) QN - CQ+PQ(14d)Honduras - CQ+PQ(1d) QN; AS - CQ+PQ(14d)Mexico - CQ+PQ AM - CQ+PQNicaragua - CQ+PQ(1d) QN - CQ+PQ(7d)
Panama - AL+PQ(1d) QN - CQ+PQ(7d); CQ+PQ(14d)
Paraguay - AL+PQ AS CQ+PQPeru - AS+MQ+PQ AS+MQ - CQ+PQ(7d)Suriname - AL+PQ(1d) AS - CQ+PQ(14d)Venezuela (Bolivarian Republic of) - AS+MQ+PQ AM; QN - CQ+PQ(14d)
EASTERN MEDITERRANEAN
Afghanistan CQ AS+SP+PQ AS; AM; QN CQ+PQ(8w)Djibouti AL AL+PQ QN CQ+PQ (14d)Iran (Islamic Republic of) AS+SP+PQ AS; QN CQ+PQ(14d & 8w)Pakistan CQ AS+SP+PQ AS; QN CQ+PQ(14d & 8w)Saudi Arabia AS+SP+PQ AS; AM; QN CQ+PQ(14d)Somalia AL AL+PQ AS; AM; QN SP(IPT) AL+PQ(14d)Sudan AL AL AS; QN AL+PQ(14d)Yemen AS+SP AS+SP QN; AM CQ+PQ(14d)
SOUTH-EAST ASIA
Bangladesh AL AS+AL; QN CQ+PQ(14d)Bhutan AL AM; QN CQ+PQ(14d)Democratic People's Republic of Korea CQ+PQ(14d)India CQ AS+SP+PQ; AL AM; AS; QN CQ+PQ(14d)Indonesia DHA-PP+PQ AM; AS; QN DHA-PP+PQ(14d)
Myanmar AL; AM; AS+MQ; DHA-PPQ; PQ AM; AS; QN CQ+PQ(14d)
Nepal CQ AL+PQ AS; QN CQ+PQ(14d)Thailand DHA-PPQ QN+D CQ+PQ(14d)Timor-Leste AL+PQ AM; AS; QN CQ+PQ(14d)
WESTERN PACIFIC
Cambodia AS+MQ AM; AS; QN AS+MQ+PQ(14D)
China ART+NQ; ART-PPQ; AS+AQ; DHA-PPQ AM; AS; PYR CQ+PQ(8d)
Lao People's Democratic Republic AL AS+AL CQ+PQ(14d)Malaysia AS+MQ AS+D; QN CQ+PQ(14d)Papua New Guinea AL AM; AS AL+PQ
Philippines AL AL+PQ QN+T; QN+D; QN+CL SP(IPT) CQ+PQ(14d)
Republic of Korea CQ CQ+PQ(14d)Solomon Islands AL AL AL; AS AL+PQ(14d)Vanuatu AL AS CQ(weekly) AL+PQ(14d)Viet Nam DHA-PPQ DHA-PPQ AS; QN CQ+PQ(14d)
AL=Artemether-lumefantrineAS=ArtesunateD=DoxycyclinePG=ProguanilQN=Quinine
AM=ArtemetherAT= AtovaquoneDHA=DihydroartemisininPPQ=PiperaquineSP=Sulphadoxine-pyrimethamine
AQ=AmodiaquineCL=ClindamyclineMQ=MefloquinePQ=PrimaquineT=Tetracycline
ART=ArtemisininCQ=ChloroquineNQ=NaphroquinePYR=Pyronaridine
1 In May 2013, South Sudan was reassigned to the WHO African Region (WHA resolution 66.21, http://apps.who.int/gb/ebwha/pdf_files/WHA66/A66_R21-en.pdf)
WORLD MALARIA REPORT 2017 99

WHO regionCountry/area
Year Contributions reported by donors Contributions reported by countries
Global Fund¹ PMI/USAID² World Bank³ UK4 Government (NMCP)
Global Fund World Bank PMI/USAID Other bilaterals
WHO UNICEF Other contributions6
AFRICAN
Angola2014 -254 141 29 580 000 0 0 38 574 885 5 378 690 27 000 0002015 1 337 036 28 364 000 0 0 47 356 258 5 2 675 645 28 000 0002016 2 615 348 27 000 000 0 0 16 852 909 27 000 000
Benin2014 13 367 291 16 830 000 465 203 0 2 000 000 0 78 4622015 2 697 704 16 714 500 1 991 818 0 602 901 0 214 9302016 2 376 388 16 500 000 2 018 014 0 17 540 458 5 13 424 427 230 534 3 387 786 148 346 179 879
Botswana2014 0 0 0 0 1 972 980 0 0 0 0 0 02015 1 672 894 0 0 0 1 303 371 280 899 0 0 0 0 02016 0 0 0 0 1 311 075 2 019 079 0 0 0 0 0
Burkina Faso2014 6 082 881 9 690 000 1 752 599 141 765 3 870 328 2 433 376 697 173 8 571 017 70 804 19 048 136 540 379 6102015 26 989 184 12 156 000 -4 985 136 734 576 253 42 735 771 284 328 8 579 441 9 454 11 800 305 704 2 533 2002016 28 525 086 14 000 000 -5 050 116 451 8 410 046 41 106 186 2 522 884 5 849 900 20 367 179 278 3 638 120
Burundi2014 4 869 728 9 690 000 640 773 0 2 001 113 6 027 330 9 229 345 0 79 050 475 936 1 324 3852015 3 476 029 12 156 000 1 505 077 0 2 999 812 4 523 416 9 500 000 32 595 47 445 2922016 7 560 132 9 500 000 1 524 871 0 3 195 161 4 759 452 9 500 000 18 579 786 133
Cabo Verde2014 0 0 0 0 511 243 64 285 19 6382015 514 050 0 0 0 1 520 070 5 325 273 99 5192016 31 405 0 0 0 1 229 033 5 315 038 59 219
Cameroon2014 8 785 586 0 0 0 43 709 021 5 147 856 497 1 123 490 460 000 14 718 669 0002015 45 085 291 0 0 0 12 122 087 5 54 918 697 221 0002016 10 634 568 0 0 0 14 478 500 747 500 2 024 000
Central African Republic2014 2 031 751 0 0 0 530 000 5 2 852 385 20 500 5 596 0002015 2 686 793 0 0 0 530 000 5 0 100 0002016 2 132 104 0 0 0 530 000 4 724 918 150 000
Chad2014 12 839 706 0 0 0 9 122 400 5 30 125 205 239 735 54 574 2 667 358 673 4402015 3 733 548 0 0 0 895 199 6 141 762 20 000 216 4912016 32 976 575 0 0 0 1 000 000 5 504 853 73 721 1 000 263 754
Comoros2014 1 129 466 0 0 0 178 862 1 074 877 0 0 0 104 000 51 630 58 5002015 75 361 0 0 0 175 124 224 643 0 0 0 30 000 6 221 02016 2 895 669 0 0 0 175 124 2 154 616 15 000
Congo2014 0 0 0 0 7 240 000 0 45 000 3 8272015 -278 074 0 0 0 7 240 000 0 0 0 0 68 000 18 000 02016 0 0 0 0 3 272 727 0 0 0 0 24 727 2 863 0
Côte d’Ivoire2014 28 046 499 0 0 0 283 975 60 031 17 573 11 155 52 2412015 15 245 468 0 0 0 1 886 662 25 744 972 0 0 0 0 26 915 40 9982016 59 615 505 0 0 0 4 694 133 60 352 423 0 0 0 13 627 35 933
Democratic Republic of the Congo2014 79 679 445 51 000 000 -31 889 17 067 184 8 104 841 102 540 781 0 34 000 000 24 838 023 2 100 000 7 196 262 02015 128 000 000 50 650 000 0 4 676 856 7 014 345 107 594 221 0 34 000 000 23 018 218 2 933 630 808 130 02016 115 500 000 50 000 000 0 3 983 090 9 254 005 143 685 771 0 49 325 000 8 063 499 3 677 567 4 771 747 0
Equatorial Guinea2014 -140 883 0 0 0 02015 -138 309 0 0 0 02016 0 0 0 0 0
Eritrea2014 6 933 657 0 0 0 0 4 906 745 0 0 58 832 0 02015 7 381 838 0 0 0 0 6 216 618 0 0 0 46 081 0 02016 6 627 263 0 0 0 16 685 629 0 0 0 200 000 0 0
Ethiopia2014 10 088 281 45 900 000 0 0 93 201 4792015 36 858 309 44 572 000 0 0 18 448 416 3 800 000 13 114 6702016 25 249 808 40 000 000 0 0 49 500 000 10 600 000 13 500 000
Annex 3 - C. Funding for malaria control, 2014–2016
WORLD MALARIA REPORT 2017100

WHO regionCountry/area
Year Contributions reported by donors Contributions reported by countries
Global Fund¹ PMI/USAID² World Bank³ UK4 Government (NMCP)
Global Fund World Bank PMI/USAID Other bilaterals
WHO UNICEF Other contributions6
AFRICAN
Angola2014 -254 141 29 580 000 0 0 38 574 885 5 378 690 27 000 0002015 1 337 036 28 364 000 0 0 47 356 258 5 2 675 645 28 000 0002016 2 615 348 27 000 000 0 0 16 852 909 27 000 000
Benin2014 13 367 291 16 830 000 465 203 0 2 000 000 0 78 4622015 2 697 704 16 714 500 1 991 818 0 602 901 0 214 9302016 2 376 388 16 500 000 2 018 014 0 17 540 458 5 13 424 427 230 534 3 387 786 148 346 179 879
Botswana2014 0 0 0 0 1 972 980 0 0 0 0 0 02015 1 672 894 0 0 0 1 303 371 280 899 0 0 0 0 02016 0 0 0 0 1 311 075 2 019 079 0 0 0 0 0
Burkina Faso2014 6 082 881 9 690 000 1 752 599 141 765 3 870 328 2 433 376 697 173 8 571 017 70 804 19 048 136 540 379 6102015 26 989 184 12 156 000 -4 985 136 734 576 253 42 735 771 284 328 8 579 441 9 454 11 800 305 704 2 533 2002016 28 525 086 14 000 000 -5 050 116 451 8 410 046 41 106 186 2 522 884 5 849 900 20 367 179 278 3 638 120
Burundi2014 4 869 728 9 690 000 640 773 0 2 001 113 6 027 330 9 229 345 0 79 050 475 936 1 324 3852015 3 476 029 12 156 000 1 505 077 0 2 999 812 4 523 416 9 500 000 32 595 47 445 2922016 7 560 132 9 500 000 1 524 871 0 3 195 161 4 759 452 9 500 000 18 579 786 133
Cabo Verde2014 0 0 0 0 511 243 64 285 19 6382015 514 050 0 0 0 1 520 070 5 325 273 99 5192016 31 405 0 0 0 1 229 033 5 315 038 59 219
Cameroon2014 8 785 586 0 0 0 43 709 021 5 147 856 497 1 123 490 460 000 14 718 669 0002015 45 085 291 0 0 0 12 122 087 5 54 918 697 221 0002016 10 634 568 0 0 0 14 478 500 747 500 2 024 000
Central African Republic2014 2 031 751 0 0 0 530 000 5 2 852 385 20 500 5 596 0002015 2 686 793 0 0 0 530 000 5 0 100 0002016 2 132 104 0 0 0 530 000 4 724 918 150 000
Chad2014 12 839 706 0 0 0 9 122 400 5 30 125 205 239 735 54 574 2 667 358 673 4402015 3 733 548 0 0 0 895 199 6 141 762 20 000 216 4912016 32 976 575 0 0 0 1 000 000 5 504 853 73 721 1 000 263 754
Comoros2014 1 129 466 0 0 0 178 862 1 074 877 0 0 0 104 000 51 630 58 5002015 75 361 0 0 0 175 124 224 643 0 0 0 30 000 6 221 02016 2 895 669 0 0 0 175 124 2 154 616 15 000
Congo2014 0 0 0 0 7 240 000 0 45 000 3 8272015 -278 074 0 0 0 7 240 000 0 0 0 0 68 000 18 000 02016 0 0 0 0 3 272 727 0 0 0 0 24 727 2 863 0
Côte d’Ivoire2014 28 046 499 0 0 0 283 975 60 031 17 573 11 155 52 2412015 15 245 468 0 0 0 1 886 662 25 744 972 0 0 0 0 26 915 40 9982016 59 615 505 0 0 0 4 694 133 60 352 423 0 0 0 13 627 35 933
Democratic Republic of the Congo2014 79 679 445 51 000 000 -31 889 17 067 184 8 104 841 102 540 781 0 34 000 000 24 838 023 2 100 000 7 196 262 02015 128 000 000 50 650 000 0 4 676 856 7 014 345 107 594 221 0 34 000 000 23 018 218 2 933 630 808 130 02016 115 500 000 50 000 000 0 3 983 090 9 254 005 143 685 771 0 49 325 000 8 063 499 3 677 567 4 771 747 0
Equatorial Guinea2014 -140 883 0 0 0 02015 -138 309 0 0 0 02016 0 0 0 0 0
Eritrea2014 6 933 657 0 0 0 0 4 906 745 0 0 58 832 0 02015 7 381 838 0 0 0 0 6 216 618 0 0 0 46 081 0 02016 6 627 263 0 0 0 16 685 629 0 0 0 200 000 0 0
Ethiopia2014 10 088 281 45 900 000 0 0 93 201 4792015 36 858 309 44 572 000 0 0 18 448 416 3 800 000 13 114 6702016 25 249 808 40 000 000 0 0 49 500 000 10 600 000 13 500 000
WORLD MALARIA REPORT 2017 101

WHO regionCountry/area
Year Contributions reported by donors Contributions reported by countries
Global Fund¹ PMI/USAID² World Bank³ UK4 Government (NMCP)
Global Fund World Bank PMI/USAID Other bilaterals
WHO UNICEF Other contributions6
AFRICAN
Gabon2014 -157 924 0 0 0 121 958 0 0 0 0 34 855 02015 -301 410 0 0 0 27 677 576 5 0 0 0 0 47 147 0 272 2892016 -551 0 0 0 0 0 0 0 0
Gambia2014 4 217 650 0 0 2 777 653 882 535 5 934 320 132 833 150 000 120 8142015 3 616 801 0 0 2 935 395 876 759 2 887 213 0 0 0 3 062 2 406 5682016 3 043 329 0 0 2 499 958 9 352 149 0 0 1 031 868
Ghana2014 15 137 754 28 560 000 -176 299 12 724 910 8 855 177 64 952 156 4 730 000 825 000 32 514 7 519 6 4292015 49 200 527 28 364 000 0 5 746 882 9 832 327 39 759 327 0 28 000 000 520 000 60 000 0 02016 37 675 591 28 000 000 0 4 894 388 9 856 505 36 596 848 0 28 000 000 9 883 185 300 000 0 0
Guinea2014 9 327 240 12 750 000 0 0 956 833 15 603 972 12 052 476 105 114 36 639 16 5812015 11 261 412 12 662 500 0 0 4 817 845 28 859 411 12 500 000 3 979 774 21 886 10 4192016 27 985 091 15 000 000 0 0 4 229 893 36 810 868 15 000 000 2 235 000 91 500 5 001 636 998
Guinea-Bissau2014 2 387 627 0 0 0 767 496 2 952 761 0 0 0 16 869 7 231 02015 2 474 035 0 0 0 829 303 536 775 0 0 0 02016 8 745 839 0 0 0 1 590 508 8 972 945 0 0 0 269 981
Kenya2014 50 532 001 35 700 000 0 9 433 997 1 178 804 48 916 476 32 400 000 25 635 413 832 4022015 4 232 333 35 455 000 0 14 662 890 1 548 277 64 945 727 32 400 000 604 058 100 0002016 10 905 047 35 000 000 0 12 487 794 0
Liberia2014 10 613 399 12 240 000 0 0 11 341 797 10 399 555 0 12 000 000 0 0 02015 7 422 218 12 156 000 0 0 02016 6 116 348 14 000 000 0 0 0
Madagascar2014 509 303 26 520 000 0 0 43 387 2 524 013 600 000 25 920 000 0 3 369 341 254 170 02015 23 709 302 26 338 000 0 0 33 120 23 199 442 0 26 000 000 213 615 298 946 70 000 56 4222016 11 958 119 26 000 000 0 0 42 500 6 395 563 0 26 000 000 0 486 635
Malawi2014 7 271 845 22 440 000 0 0 8 023 075 19 118 000 150 0002015 29 468 309 22 286 000 0 0 4 266 640 5 22 777 197 12 234 171 1 082 0082016 15 872 372 22 000 000 0 0 0
Mali2014 11 019 080 25 500 000 0 249 991 1 775 161 26 392 018 0 25 500 000 95 000 1 437 5522015 7 249 296 25 325 000 0 95 563 2 437 492 21 201 959 0 25 500 000 120 000 574 693 5 326 8542016 9 323 291 25 000 000 0 81 388 3 322 612 16 374 449 25 500 000 4 983 2 203 890
Mauritania2014 0 0 0 183 180 2 328 000 0 46 000 42 0002015 -189 273 0 0 14 085 173 720 0 67 000 67 0002016 1 786 610 0 0 11 996 2 450 845 0 3 500 400 220 384 900
Mayotte2014 0 0 0 0 02015 0 0 0 0 02016 0 0 0 0 0
Mozambique2014 35 335 125 29 580 000 958 738 0 4 186 129 37 646 902 3 500 000 29 023 096 268 9932015 18 626 168 29 377 000 -460 827 0 5 178 112 4 357 070 0 29 000 000 0 200 000 1 688 356 139 5012016 59 221 741 29 000 000 -466 887 0 2 766 214 190 374 239 290 000 325 000 1 250 640
Namibia2014 567 945 0 0 0 2 816 280 2 910 095 0 0 0 100 000 0 02015 -433 987 0 0 0 3 810 220 2 172 606 0 100 000 0 136 9292016 2 123 377 0 0 0 5 218 841 4 227 559 0 0 0 100 000 0 878 882
Niger2014 24 489 836 0 0 0 6 900 000 2 494 013 0 0 0 70 248 1 249 000 44 0002015 7 677 557 0 0 0 6 462 202 9 324 003 0 72 000 0 86 567 18 500 02016 8 854 502 0 0 0 3 428 219 14 911 144 641 402 106 000 0 75 586 39 712 39 712
Nigeria2014 147 800 000 76 500 000 54 702 633 24 033 630 3 458 666 45 365 288 31 868 767 73 771 000 20 157 565 861 615 1 000 0002015 84 081 057 75 975 000 5 334 081 18 974 837 2 802 754 144 939 060 75 000 000 12 322 449 964 784 4 809 7172016 102 200 000 75 000 000 5 404 232 16 160 106 372 939 170 71 500 000 2 967 421
Annex 3 - C. Funding for malaria control, 2014–2016
WORLD MALARIA REPORT 2017102
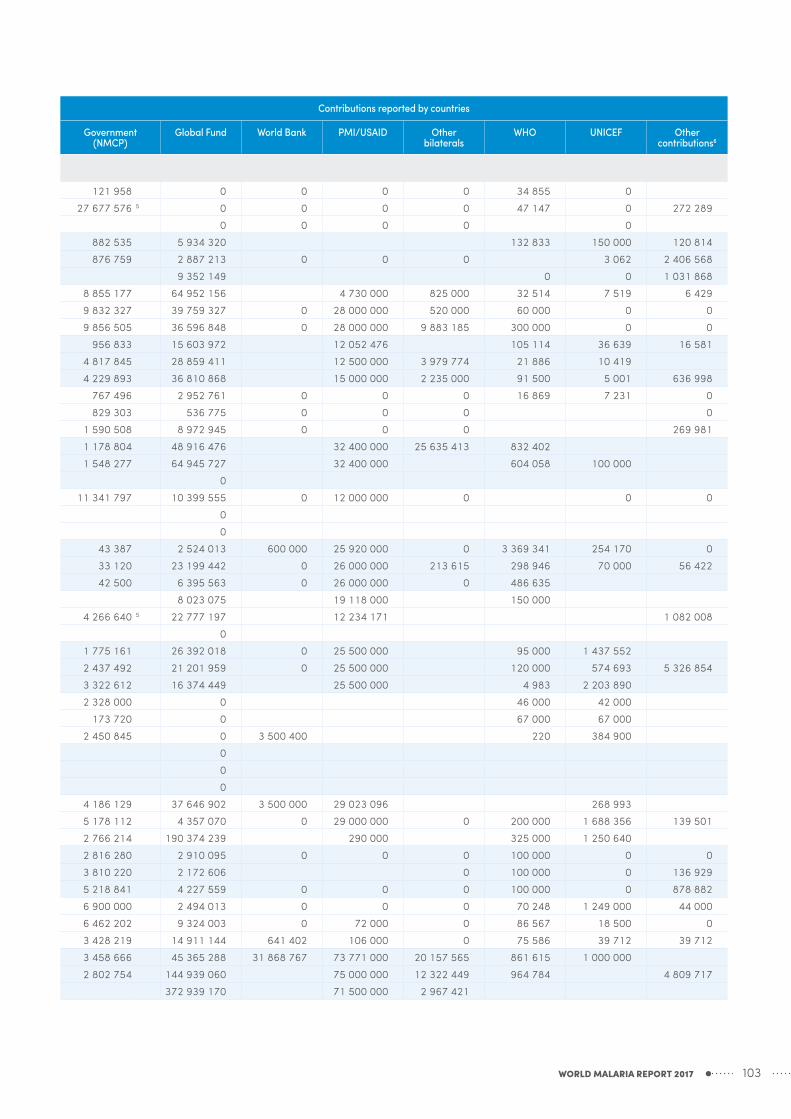
WHO regionCountry/area
Year Contributions reported by donors Contributions reported by countries
Global Fund¹ PMI/USAID² World Bank³ UK4 Government (NMCP)
Global Fund World Bank PMI/USAID Other bilaterals
WHO UNICEF Other contributions6
AFRICAN
Gabon2014 -157 924 0 0 0 121 958 0 0 0 0 34 855 02015 -301 410 0 0 0 27 677 576 5 0 0 0 0 47 147 0 272 2892016 -551 0 0 0 0 0 0 0 0
Gambia2014 4 217 650 0 0 2 777 653 882 535 5 934 320 132 833 150 000 120 8142015 3 616 801 0 0 2 935 395 876 759 2 887 213 0 0 0 3 062 2 406 5682016 3 043 329 0 0 2 499 958 9 352 149 0 0 1 031 868
Ghana2014 15 137 754 28 560 000 -176 299 12 724 910 8 855 177 64 952 156 4 730 000 825 000 32 514 7 519 6 4292015 49 200 527 28 364 000 0 5 746 882 9 832 327 39 759 327 0 28 000 000 520 000 60 000 0 02016 37 675 591 28 000 000 0 4 894 388 9 856 505 36 596 848 0 28 000 000 9 883 185 300 000 0 0
Guinea2014 9 327 240 12 750 000 0 0 956 833 15 603 972 12 052 476 105 114 36 639 16 5812015 11 261 412 12 662 500 0 0 4 817 845 28 859 411 12 500 000 3 979 774 21 886 10 4192016 27 985 091 15 000 000 0 0 4 229 893 36 810 868 15 000 000 2 235 000 91 500 5 001 636 998
Guinea-Bissau2014 2 387 627 0 0 0 767 496 2 952 761 0 0 0 16 869 7 231 02015 2 474 035 0 0 0 829 303 536 775 0 0 0 02016 8 745 839 0 0 0 1 590 508 8 972 945 0 0 0 269 981
Kenya2014 50 532 001 35 700 000 0 9 433 997 1 178 804 48 916 476 32 400 000 25 635 413 832 4022015 4 232 333 35 455 000 0 14 662 890 1 548 277 64 945 727 32 400 000 604 058 100 0002016 10 905 047 35 000 000 0 12 487 794 0
Liberia2014 10 613 399 12 240 000 0 0 11 341 797 10 399 555 0 12 000 000 0 0 02015 7 422 218 12 156 000 0 0 02016 6 116 348 14 000 000 0 0 0
Madagascar2014 509 303 26 520 000 0 0 43 387 2 524 013 600 000 25 920 000 0 3 369 341 254 170 02015 23 709 302 26 338 000 0 0 33 120 23 199 442 0 26 000 000 213 615 298 946 70 000 56 4222016 11 958 119 26 000 000 0 0 42 500 6 395 563 0 26 000 000 0 486 635
Malawi2014 7 271 845 22 440 000 0 0 8 023 075 19 118 000 150 0002015 29 468 309 22 286 000 0 0 4 266 640 5 22 777 197 12 234 171 1 082 0082016 15 872 372 22 000 000 0 0 0
Mali2014 11 019 080 25 500 000 0 249 991 1 775 161 26 392 018 0 25 500 000 95 000 1 437 5522015 7 249 296 25 325 000 0 95 563 2 437 492 21 201 959 0 25 500 000 120 000 574 693 5 326 8542016 9 323 291 25 000 000 0 81 388 3 322 612 16 374 449 25 500 000 4 983 2 203 890
Mauritania2014 0 0 0 183 180 2 328 000 0 46 000 42 0002015 -189 273 0 0 14 085 173 720 0 67 000 67 0002016 1 786 610 0 0 11 996 2 450 845 0 3 500 400 220 384 900
Mayotte2014 0 0 0 0 02015 0 0 0 0 02016 0 0 0 0 0
Mozambique2014 35 335 125 29 580 000 958 738 0 4 186 129 37 646 902 3 500 000 29 023 096 268 9932015 18 626 168 29 377 000 -460 827 0 5 178 112 4 357 070 0 29 000 000 0 200 000 1 688 356 139 5012016 59 221 741 29 000 000 -466 887 0 2 766 214 190 374 239 290 000 325 000 1 250 640
Namibia2014 567 945 0 0 0 2 816 280 2 910 095 0 0 0 100 000 0 02015 -433 987 0 0 0 3 810 220 2 172 606 0 100 000 0 136 9292016 2 123 377 0 0 0 5 218 841 4 227 559 0 0 0 100 000 0 878 882
Niger2014 24 489 836 0 0 0 6 900 000 2 494 013 0 0 0 70 248 1 249 000 44 0002015 7 677 557 0 0 0 6 462 202 9 324 003 0 72 000 0 86 567 18 500 02016 8 854 502 0 0 0 3 428 219 14 911 144 641 402 106 000 0 75 586 39 712 39 712
Nigeria2014 147 800 000 76 500 000 54 702 633 24 033 630 3 458 666 45 365 288 31 868 767 73 771 000 20 157 565 861 615 1 000 0002015 84 081 057 75 975 000 5 334 081 18 974 837 2 802 754 144 939 060 75 000 000 12 322 449 964 784 4 809 7172016 102 200 000 75 000 000 5 404 232 16 160 106 372 939 170 71 500 000 2 967 421
WORLD MALARIA REPORT 2017 103

WHO regionCountry/area
Year Contributions reported by donors Contributions reported by countries
Global Fund¹ PMI/USAID² World Bank³ UK4 Government (NMCP)
Global Fund World Bank PMI/USAID Other bilaterals
WHO UNICEF Other contributions6
AFRICAN
Rwanda2014 15 735 725 17 850 000 0 0 0 0 0 0 0 0 0 02015 11 035 459 18 234 000 0 0 10 893 838 18 000 0002016 21 756 393 18 000 000 0 0 1 006 923 25 671 350 18 000 000 72 000
Sao Tome and Principe2014 3 372 187 0 0 148 016 1 663 325 1 715 622 0 0 1 020 102 125 209 0 1 6002015 1 102 608 0 0 0 930 233 1 668 679 0 0 1 000 000 60 006 1 293 1 6002016 2 827 056 0 0 0 4 737 539 2 261 202 0 0 1 000 000 52 985 2 826 4 584
Senegal2014 22 107 955 24 480 000 0 101 210 213 986 15 023 299 0 25 302 960 0 12 491 200 000 02015 16 064 463 24 312 000 0 0 2 069 404 2 427 578 1 000 000 23 666 000 0 0 200 000 25 7052016 9 815 055 24 000 000 0 0 4 816 000 1 865 570 0 24 000 000 0 7 828 28 795 24 167
Sierra Leone2014 14 063 841 0 1 657 970 1 650 197 13 525 631 0 0 6 156 320 50 000 17 912 2 200 0672015 6 257 709 0 0 0 5 353 621 0 0 0 101 207 100 8472016 5 543 537 0 0 0 346 772 5 5 389 748 36 569 55 295
South Africa2014 0 0 0 42 346 17 398 691 0 68 1802015 0 0 0 101 897 7 752 321 0 0 0 41 140 40 000 0 02016 0 0 0 86 782 17 429 771 0 0 0 0 0 0 75 061
South Sudan7
2014 14 538 582 6 120 000 0 10 477 297 8 919 615 5 21 517 835 0 6 000 000 9 512 1762015 28 720 476 6 078 000 0 18 680 486 8 919 615 5 6 545 239 0 6 000 000 12 079 880 941 876 29 015 9742016 6 358 496 6 000 000 0 15 909 419 8 919 615 5 37 371 510 0 6 000 000 6 000 808 4 779 900 12 812 860
Swaziland2014 1 687 295 0 0 0 679 403 1 203 444 0 02015 -9 362 0 0 0 11 664 060 1 714 8402016 860 971 0 0 0 1 109 858 1 719 139 0 0 0 0
Togo2014 7 561 549 0 0 0 15 679 595 4 897 544 17 304 0 0 1 779 222 460 02015 581 555 0 720 784 0 02016 4 711 895 0 730 264 0 79 723 2 973 548 943 022 0 0 7 158 169 496
Uganda2014 14 507 681 34 680 000 0 22 199 178 4 617 443 24 195 015 3 418 520 33 000 000 39 623 353 1 359 595 4 896 0452015 19 405 993 34 442 000 0 20 749 437 8 035 963 74 643 525 0 33 000 000 32 222 500 743 791 4 899 0622016 73 185 026 34 000 000 0 17 671 461 7 585 730 31 501 450 0 33 000 000 29 246 018 743 791 3 772 657
United Republic of Tanzania8
2014 29 522 667 46 920 000 0 11 028 654 02015 57 208 352 46 598 000 0 4 890 641 02016 61 452 199 46 000 000 0 4 165 162 0
Mainland2014 0 0 0 0 6 022 000 145 506 422 0 450 000 0 500 0 02015 0 0 0 0 867 190 476 28 982 597 0 1 060 714 77 966 100 0 0 480 4122016 0 0 0 0 5 858 187 103 964 466 37 578 250 2 025 000 4 982 394 0 0 0
Zanzibar2014 0 0 0 0 5 419 364 2 126 000 0 1 525 000 50 000 350 02015 0 0 0 0 02016 0 0 0 0 22 071 639 075 0 863 539 484 175 0 0 0
Zambia2014 0 24 480 000 -72 379 9 015 509 15 462 950 24 362 218 24 000 000 20 000 6 000 0002015 9 657 417 24 312 000 121 578 0 22 640 090 10 614 665 24 000 000 170 500 1 006 000 6 500 0002016 26 509 052 25 000 000 123 177 0 25 500 000 20 134 623 24 000 000 200 000
Zimbabwe2014 10 909 733 15 300 000 0 0 954 000 7 626 664 12 000 000 42 5002015 24 597 474 15 195 000 0 0 500 000 33 425 777 12 000 000 39 6492016 16 314 961 15 000 000 0 0 958 000 21 823 373 12 000 000 46 698
AMERICAS
Belize2014 0 0 0 0 270 000 10 121 0 6 761 0 0 02015 0 0 0 0 297 500 189 879 0 12 747 0 0 0 02016 0 0 0 0 248 000 0 0 1 419 0 0 0 0
Bolivia (Plurinational State of)2014 1 344 538 0 0 0 718 391 1 631 520 0 0 0 0 0 02015 1 180 099 0 0 0 531 609 1 170 000 0 0 0 38 991 0 02016 4 150 580 0 0 0 531 756 2 846 786 0 0 0 0
Annex 3 - C. Funding for malaria control, 2014–2016
WORLD MALARIA REPORT 2017104

WHO regionCountry/area
Year Contributions reported by donors Contributions reported by countries
Global Fund¹ PMI/USAID² World Bank³ UK4 Government (NMCP)
Global Fund World Bank PMI/USAID Other bilaterals
WHO UNICEF Other contributions6
AFRICAN
Rwanda2014 15 735 725 17 850 000 0 0 0 0 0 0 0 0 0 02015 11 035 459 18 234 000 0 0 10 893 838 18 000 0002016 21 756 393 18 000 000 0 0 1 006 923 25 671 350 18 000 000 72 000
Sao Tome and Principe2014 3 372 187 0 0 148 016 1 663 325 1 715 622 0 0 1 020 102 125 209 0 1 6002015 1 102 608 0 0 0 930 233 1 668 679 0 0 1 000 000 60 006 1 293 1 6002016 2 827 056 0 0 0 4 737 539 2 261 202 0 0 1 000 000 52 985 2 826 4 584
Senegal2014 22 107 955 24 480 000 0 101 210 213 986 15 023 299 0 25 302 960 0 12 491 200 000 02015 16 064 463 24 312 000 0 0 2 069 404 2 427 578 1 000 000 23 666 000 0 0 200 000 25 7052016 9 815 055 24 000 000 0 0 4 816 000 1 865 570 0 24 000 000 0 7 828 28 795 24 167
Sierra Leone2014 14 063 841 0 1 657 970 1 650 197 13 525 631 0 0 6 156 320 50 000 17 912 2 200 0672015 6 257 709 0 0 0 5 353 621 0 0 0 101 207 100 8472016 5 543 537 0 0 0 346 772 5 5 389 748 36 569 55 295
South Africa2014 0 0 0 42 346 17 398 691 0 68 1802015 0 0 0 101 897 7 752 321 0 0 0 41 140 40 000 0 02016 0 0 0 86 782 17 429 771 0 0 0 0 0 0 75 061
South Sudan7
2014 14 538 582 6 120 000 0 10 477 297 8 919 615 5 21 517 835 0 6 000 000 9 512 1762015 28 720 476 6 078 000 0 18 680 486 8 919 615 5 6 545 239 0 6 000 000 12 079 880 941 876 29 015 9742016 6 358 496 6 000 000 0 15 909 419 8 919 615 5 37 371 510 0 6 000 000 6 000 808 4 779 900 12 812 860
Swaziland2014 1 687 295 0 0 0 679 403 1 203 444 0 02015 -9 362 0 0 0 11 664 060 1 714 8402016 860 971 0 0 0 1 109 858 1 719 139 0 0 0 0
Togo2014 7 561 549 0 0 0 15 679 595 4 897 544 17 304 0 0 1 779 222 460 02015 581 555 0 720 784 0 02016 4 711 895 0 730 264 0 79 723 2 973 548 943 022 0 0 7 158 169 496
Uganda2014 14 507 681 34 680 000 0 22 199 178 4 617 443 24 195 015 3 418 520 33 000 000 39 623 353 1 359 595 4 896 0452015 19 405 993 34 442 000 0 20 749 437 8 035 963 74 643 525 0 33 000 000 32 222 500 743 791 4 899 0622016 73 185 026 34 000 000 0 17 671 461 7 585 730 31 501 450 0 33 000 000 29 246 018 743 791 3 772 657
United Republic of Tanzania8
2014 29 522 667 46 920 000 0 11 028 654 02015 57 208 352 46 598 000 0 4 890 641 02016 61 452 199 46 000 000 0 4 165 162 0
Mainland2014 0 0 0 0 6 022 000 145 506 422 0 450 000 0 500 0 02015 0 0 0 0 867 190 476 28 982 597 0 1 060 714 77 966 100 0 0 480 4122016 0 0 0 0 5 858 187 103 964 466 37 578 250 2 025 000 4 982 394 0 0 0
Zanzibar2014 0 0 0 0 5 419 364 2 126 000 0 1 525 000 50 000 350 02015 0 0 0 0 02016 0 0 0 0 22 071 639 075 0 863 539 484 175 0 0 0
Zambia2014 0 24 480 000 -72 379 9 015 509 15 462 950 24 362 218 24 000 000 20 000 6 000 0002015 9 657 417 24 312 000 121 578 0 22 640 090 10 614 665 24 000 000 170 500 1 006 000 6 500 0002016 26 509 052 25 000 000 123 177 0 25 500 000 20 134 623 24 000 000 200 000
Zimbabwe2014 10 909 733 15 300 000 0 0 954 000 7 626 664 12 000 000 42 5002015 24 597 474 15 195 000 0 0 500 000 33 425 777 12 000 000 39 6492016 16 314 961 15 000 000 0 0 958 000 21 823 373 12 000 000 46 698
AMERICAS
Belize2014 0 0 0 0 270 000 10 121 0 6 761 0 0 02015 0 0 0 0 297 500 189 879 0 12 747 0 0 0 02016 0 0 0 0 248 000 0 0 1 419 0 0 0 0
Bolivia (Plurinational State of)2014 1 344 538 0 0 0 718 391 1 631 520 0 0 0 0 0 02015 1 180 099 0 0 0 531 609 1 170 000 0 0 0 38 991 0 02016 4 150 580 0 0 0 531 756 2 846 786 0 0 0 0
WORLD MALARIA REPORT 2017 105

WHO regionCountry/area
Year Contributions reported by donors Contributions reported by countries
Global Fund¹ PMI/USAID² World Bank³ UK4 Government (NMCP)
Global Fund World Bank PMI/USAID Other bilaterals
WHO UNICEF Other contributions6
AMERICAS
Brazil2014 0 0 0 0 72 248 286 5 0 0 47 495 0 0 0 02015 0 0 0 0 60 803 769 5 0 0 273 530 0 0 0 02016 0 0 0 0 44 240 812 5 0 0 0 0 0 0
Colombia2014 2 952 081 0 0 0 11 493 708 3 257 687 0 96 194 0 0 0 02015 -579 893 0 0 0 13 059 553 0 0 73 391 0 0 0 02016 0 0 0 0 10 159 785 0 0 147 210 0 14 660 0 0
Costa Rica2014 0 0 0 0 0 0 0 0 0 0 02015 0 0 0 0 5 000 000 5 64 496 0 0 0 0 0 02016 0 0 0 0 14 000 0 1 624 0 3 000 0 0
Dominican Republic2014 524 984 0 0 0 1 883 503 852 947 0 0 0 0 0 106 5982015 -23 979 0 0 0 2 663 837 72 511 0 0 0 0 0 213 0942016 0 0 0 0 4 372 339 0 0 0 0 0 0 334 363
Ecuador2014 1 022 289 0 0 0 983 835 0 98 057 0 02015 0 0 0 0 2 444 718 0 0 0 141 000 02016 0 0 0 0 20 000 000 5 0
El Salvador2014 0 0 0 0 0 0 0 0 54 340 0 02015 0 0 0 0 0 0 13 376 0 11 563 0 02016 0 0 0 0 166 311 0 1 089 0 0 65 789
French Guiana2014 0 0 0 0 0 0 0 0 0 0 02015 0 0 0 0 0 0 0 0 0 0 02016 0 0 0 0 0 0 0 0 0 0 0
Guatemala2014 4 476 189 0 0 0 542 663 3 278 171 0 92 462 0 0 0 02015 4 843 318 0 0 0 2 610 850 8 232 108 0 56 824 0 0 0 02016 1 784 460 0 0 0 3 067 361 10 669 242 0 0 0
Guyana2014 0 0 0 0 800 439 451 597 0 115 708 0 140 486 0 02015 55 096 0 0 0 1 023 795 337 939 0 288 169 0 47 500 0 02016 -58 728 0 0 0 338 772 0 98 000 0 50 000 0 0
Haiti2014 4 622 395 0 0 0 108 696 5 2 653 285 0 598 573 245 000 0 02015 4 576 785 0 0 0 152 174 5 5 144 270 0 62 156 470 000 231 185 2 694 3122016 6 152 134 0 0 0 362 174 5 4 926 108 0 0 500 000 227 455 4 360 177
Honduras2014 986 741 0 0 0 543 312 792 634 0 113 187 0 0 0 6 0462015 3 348 937 0 0 0 0 0 118 071 18 457 02016 1 178 066 0 0 0 543 312 3 413 845 7 840
Mexico2014 0 0 0 0 23 827 054 0 0 0 0 0 0 02015 0 0 0 0 46 662 926 0 0 0 0 0 0 02016 0 0 0 0 43 376 321 0 0 0 0 0 0 0
Nicaragua2014 1 030 296 0 0 0 2 596 547 1 214 811 0 51 323 0 21 868 0 02015 562 941 0 0 0 2 886 581 1 013 568 0 47 409 9 9372016 5 068 397 0 0 0 3 898 744 3 727 737 0 0 8 250 0
Panama2014 0 0 0 0 7 469 311 5 100 000 0 77 562 0 0 0 02015 0 0 0 0 7 964 427 10 000 0 49 079 0 11 000 0 02016 0 0 0 0 7 645 191 0 0 23 247 0 9 665 0
Paraguay2014 0 0 0 0 5 574 580 0 0 0 0 5 740 0 02015 0 0 0 0 2 264 399 0 0 0 0 16 800 0 02016 1 517 493 0 0 0 2 264 399 1 517 493 0 0 0 0 0
Peru2014 0 0 0 0 0 0 91 037 0 0 02015 0 0 0 0 2 134 919 5 0 0 98 598 0 0 02016 0 0 0 0 1 969 288 0 0 183 809 0 0 0
Annex 3 - C. Funding for malaria control, 2014–2016
WORLD MALARIA REPORT 2017106
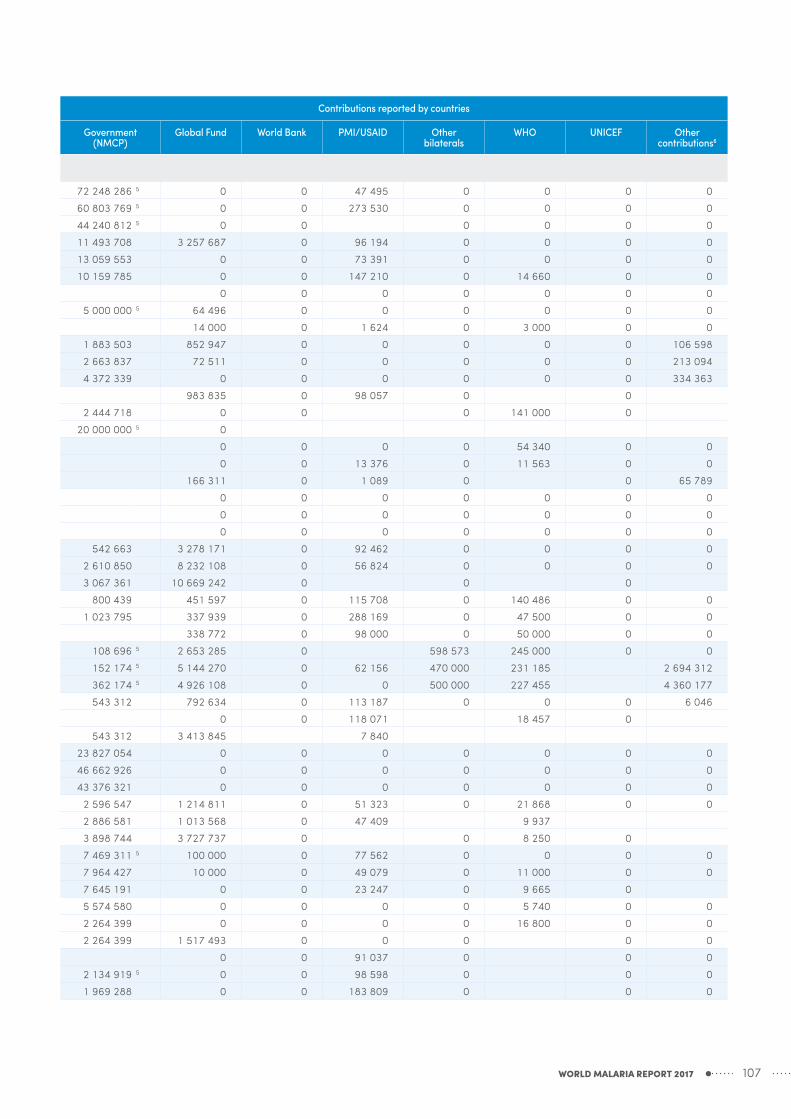
WHO regionCountry/area
Year Contributions reported by donors Contributions reported by countries
Global Fund¹ PMI/USAID² World Bank³ UK4 Government (NMCP)
Global Fund World Bank PMI/USAID Other bilaterals
WHO UNICEF Other contributions6
AMERICAS
Brazil2014 0 0 0 0 72 248 286 5 0 0 47 495 0 0 0 02015 0 0 0 0 60 803 769 5 0 0 273 530 0 0 0 02016 0 0 0 0 44 240 812 5 0 0 0 0 0 0
Colombia2014 2 952 081 0 0 0 11 493 708 3 257 687 0 96 194 0 0 0 02015 -579 893 0 0 0 13 059 553 0 0 73 391 0 0 0 02016 0 0 0 0 10 159 785 0 0 147 210 0 14 660 0 0
Costa Rica2014 0 0 0 0 0 0 0 0 0 0 02015 0 0 0 0 5 000 000 5 64 496 0 0 0 0 0 02016 0 0 0 0 14 000 0 1 624 0 3 000 0 0
Dominican Republic2014 524 984 0 0 0 1 883 503 852 947 0 0 0 0 0 106 5982015 -23 979 0 0 0 2 663 837 72 511 0 0 0 0 0 213 0942016 0 0 0 0 4 372 339 0 0 0 0 0 0 334 363
Ecuador2014 1 022 289 0 0 0 983 835 0 98 057 0 02015 0 0 0 0 2 444 718 0 0 0 141 000 02016 0 0 0 0 20 000 000 5 0
El Salvador2014 0 0 0 0 0 0 0 0 54 340 0 02015 0 0 0 0 0 0 13 376 0 11 563 0 02016 0 0 0 0 166 311 0 1 089 0 0 65 789
French Guiana2014 0 0 0 0 0 0 0 0 0 0 02015 0 0 0 0 0 0 0 0 0 0 02016 0 0 0 0 0 0 0 0 0 0 0
Guatemala2014 4 476 189 0 0 0 542 663 3 278 171 0 92 462 0 0 0 02015 4 843 318 0 0 0 2 610 850 8 232 108 0 56 824 0 0 0 02016 1 784 460 0 0 0 3 067 361 10 669 242 0 0 0
Guyana2014 0 0 0 0 800 439 451 597 0 115 708 0 140 486 0 02015 55 096 0 0 0 1 023 795 337 939 0 288 169 0 47 500 0 02016 -58 728 0 0 0 338 772 0 98 000 0 50 000 0 0
Haiti2014 4 622 395 0 0 0 108 696 5 2 653 285 0 598 573 245 000 0 02015 4 576 785 0 0 0 152 174 5 5 144 270 0 62 156 470 000 231 185 2 694 3122016 6 152 134 0 0 0 362 174 5 4 926 108 0 0 500 000 227 455 4 360 177
Honduras2014 986 741 0 0 0 543 312 792 634 0 113 187 0 0 0 6 0462015 3 348 937 0 0 0 0 0 118 071 18 457 02016 1 178 066 0 0 0 543 312 3 413 845 7 840
Mexico2014 0 0 0 0 23 827 054 0 0 0 0 0 0 02015 0 0 0 0 46 662 926 0 0 0 0 0 0 02016 0 0 0 0 43 376 321 0 0 0 0 0 0 0
Nicaragua2014 1 030 296 0 0 0 2 596 547 1 214 811 0 51 323 0 21 868 0 02015 562 941 0 0 0 2 886 581 1 013 568 0 47 409 9 9372016 5 068 397 0 0 0 3 898 744 3 727 737 0 0 8 250 0
Panama2014 0 0 0 0 7 469 311 5 100 000 0 77 562 0 0 0 02015 0 0 0 0 7 964 427 10 000 0 49 079 0 11 000 0 02016 0 0 0 0 7 645 191 0 0 23 247 0 9 665 0
Paraguay2014 0 0 0 0 5 574 580 0 0 0 0 5 740 0 02015 0 0 0 0 2 264 399 0 0 0 0 16 800 0 02016 1 517 493 0 0 0 2 264 399 1 517 493 0 0 0 0 0
Peru2014 0 0 0 0 0 0 91 037 0 0 02015 0 0 0 0 2 134 919 5 0 0 98 598 0 0 02016 0 0 0 0 1 969 288 0 0 183 809 0 0 0
WORLD MALARIA REPORT 2017 107

WHO regionCountry/area
Year Contributions reported by donors Contributions reported by countries
Global Fund¹ PMI/USAID² World Bank³ UK4 Government (NMCP)
Global Fund World Bank PMI/USAID Other bilaterals
WHO UNICEF Other contributions6
AMERICAS
Suriname2014 161 926 0 0 0 1 650 498 479 600 0 30 198 400 541 77 264 0 02015 1 291 082 0 0 0 1 049 230 975 757 0 47 762 400 541 41 437 0 02016 163 871 0 0 0 0
Venezuela (Bolivarian Republic of)2014 0 0 0 0 1 000 000 5 0 0 02015 0 0 0 0 19 600 139 0 0 02016 0 0 0 0 3 869 229 945 713 0 0 0 0 0
EASTERN MEDITERRANEAN
Afghanistan2014 8 571 431 0 -892 270 0 9 083 870 113 3412015 8 392 469 0 -557 745 0 4 571 460 89 1672016 5 706 151 0 -565 080 0 9 762 977 12 905
Djibouti2014 0 0 154 416 0 02015 -287 635 0 175 460 0 02016 4 547 153 0 177 767 0 2 598 332 5 4 547 153
Iran (Islamic Republic of)2014 2 718 537 0 0 0 6 300 000 2 979 260 34 0002015 2 512 580 0 0 0 2 500 000 2 418 943 5 0002016 1 726 286 0 0 0 2 500 000 1 364 857
Pakistan2014 9 183 606 0 0 0 10 718 906 154 0002015 8 602 305 0 0 0 5 910 215 89 0002016 10 875 717 0 0 0 16 400 000 11 536 047 300 000
Saudi Arabia2014 0 0 0 0 30 000 000 0 0 02015 0 0 0 0 30 000 000 0 0 0 0 0 0 02016 0 0 0 0 30 000 000 0 0 0 0 7 500 0 0
Somalia2014 9 865 831 0 0 0 67 740 9 604 810 0 0 0 85 000 0 02015 10 159 581 0 0 0 79 488 7 365 620 0 0 0 121 800 02016 9 433 517 0 0 0 81 200 9 946 059 0 0 0 135 000 0
Sudan2014 16 374 420 0 0 0 27 316 109 5 35 883 294 446 1602015 46 129 869 0 0 0 21 536 529 5 16 251 350 0 0 0 471 552 0 02016 53 412 091 0 0 0 24 209 740 5 61 304 230 0 0 0 93 302 1 200 574 0
Yemen2014 2 057 886 0 0 0 2 293 553 2 110 776 258 495 465 713 1 674 3502015 1 789 920 0 0 0 0 3 008 564 390 2592016 4 517 020 0 0 0 0 1 140 758 0 0 0 105 000 0
SOUTH-EAST ASIA
Bangladesh2014 4 483 314 0 0 0 5 642 718 8 912 4842015 6 839 955 0 0 0 942 538 9 507 849 0 0 0 65 000 0 02016 6 389 846 0 0 0 1 184 500 9 734 466 0 0 0 188 000 0 0
Bhutan2014 244 687 0 0 0 180 328 390 420 10 000 166 6392015 571 738 0 0 0 179 104 487 909 0 0 0 5 552 0 02016 437 520 0 0 0 163 046 550 197 0 0 0 40 273 0 72 424
Democratic People's Republic of Korea2014 6 838 697 0 0 0 2 000 000 1 571 206 0 0 0 98 000 0 02015 3 475 237 0 0 0 2 050 000 6 817 631 0 0 0 30 200 02016 3 629 084 0 0 0 2 080 000 3 775 232 0 0 0 35 000 0
India2014 4 571 581 0 306 651 0 77 461 828 16 129 032 02015 33 188 117 0 0 0 77 461 828 5 244 575 0 0 0 02016 4 077 028 0 0 0 77 461 828 15 892 221 0 0 0 0
Indonesia2014 11 717 891 0 0 145 806 15 956 285 5 15 913 410 0 0 0 277 282 3 490 400 02015 12 683 107 0 0 42 737 10 940 000 5 10 966 688 0 0 0 277 282 1 691 397 02016 10 821 533 0 0 36 398 20 307 710 5 10 821 533 0 0 0 228 000 1 938 220 0
Annex 3 - C. Funding for malaria control, 2014–2016
WORLD MALARIA REPORT 2017108

WHO regionCountry/area
Year Contributions reported by donors Contributions reported by countries
Global Fund¹ PMI/USAID² World Bank³ UK4 Government (NMCP)
Global Fund World Bank PMI/USAID Other bilaterals
WHO UNICEF Other contributions6
AMERICAS
Suriname2014 161 926 0 0 0 1 650 498 479 600 0 30 198 400 541 77 264 0 02015 1 291 082 0 0 0 1 049 230 975 757 0 47 762 400 541 41 437 0 02016 163 871 0 0 0 0
Venezuela (Bolivarian Republic of)2014 0 0 0 0 1 000 000 5 0 0 02015 0 0 0 0 19 600 139 0 0 02016 0 0 0 0 3 869 229 945 713 0 0 0 0 0
EASTERN MEDITERRANEAN
Afghanistan2014 8 571 431 0 -892 270 0 9 083 870 113 3412015 8 392 469 0 -557 745 0 4 571 460 89 1672016 5 706 151 0 -565 080 0 9 762 977 12 905
Djibouti2014 0 0 154 416 0 02015 -287 635 0 175 460 0 02016 4 547 153 0 177 767 0 2 598 332 5 4 547 153
Iran (Islamic Republic of)2014 2 718 537 0 0 0 6 300 000 2 979 260 34 0002015 2 512 580 0 0 0 2 500 000 2 418 943 5 0002016 1 726 286 0 0 0 2 500 000 1 364 857
Pakistan2014 9 183 606 0 0 0 10 718 906 154 0002015 8 602 305 0 0 0 5 910 215 89 0002016 10 875 717 0 0 0 16 400 000 11 536 047 300 000
Saudi Arabia2014 0 0 0 0 30 000 000 0 0 02015 0 0 0 0 30 000 000 0 0 0 0 0 0 02016 0 0 0 0 30 000 000 0 0 0 0 7 500 0 0
Somalia2014 9 865 831 0 0 0 67 740 9 604 810 0 0 0 85 000 0 02015 10 159 581 0 0 0 79 488 7 365 620 0 0 0 121 800 02016 9 433 517 0 0 0 81 200 9 946 059 0 0 0 135 000 0
Sudan2014 16 374 420 0 0 0 27 316 109 5 35 883 294 446 1602015 46 129 869 0 0 0 21 536 529 5 16 251 350 0 0 0 471 552 0 02016 53 412 091 0 0 0 24 209 740 5 61 304 230 0 0 0 93 302 1 200 574 0
Yemen2014 2 057 886 0 0 0 2 293 553 2 110 776 258 495 465 713 1 674 3502015 1 789 920 0 0 0 0 3 008 564 390 2592016 4 517 020 0 0 0 0 1 140 758 0 0 0 105 000 0
SOUTH-EAST ASIA
Bangladesh2014 4 483 314 0 0 0 5 642 718 8 912 4842015 6 839 955 0 0 0 942 538 9 507 849 0 0 0 65 000 0 02016 6 389 846 0 0 0 1 184 500 9 734 466 0 0 0 188 000 0 0
Bhutan2014 244 687 0 0 0 180 328 390 420 10 000 166 6392015 571 738 0 0 0 179 104 487 909 0 0 0 5 552 0 02016 437 520 0 0 0 163 046 550 197 0 0 0 40 273 0 72 424
Democratic People's Republic of Korea2014 6 838 697 0 0 0 2 000 000 1 571 206 0 0 0 98 000 0 02015 3 475 237 0 0 0 2 050 000 6 817 631 0 0 0 30 200 02016 3 629 084 0 0 0 2 080 000 3 775 232 0 0 0 35 000 0
India2014 4 571 581 0 306 651 0 77 461 828 16 129 032 02015 33 188 117 0 0 0 77 461 828 5 244 575 0 0 0 02016 4 077 028 0 0 0 77 461 828 15 892 221 0 0 0 0
Indonesia2014 11 717 891 0 0 145 806 15 956 285 5 15 913 410 0 0 0 277 282 3 490 400 02015 12 683 107 0 0 42 737 10 940 000 5 10 966 688 0 0 0 277 282 1 691 397 02016 10 821 533 0 0 36 398 20 307 710 5 10 821 533 0 0 0 228 000 1 938 220 0
WORLD MALARIA REPORT 2017 109

WHO regionCountry/area
Year Contributions reported by donors Contributions reported by countries
Global Fund¹ PMI/USAID² World Bank³ UK4 Government (NMCP)
Global Fund World Bank PMI/USAID Other bilaterals
WHO UNICEF Other contributions6
SOUTH-EAST ASIA
Myanmar2014 34 681 659 8 160 000 0 7 351 563 42 620 577 6 565 881 451 400 25 000 5 561 9172015 28 145 785 9 117 000 0 5 689 759 5 272 824 5 31 629 898 0 6 500 000 2 800 000 25 000 0 02016 33 646 118 10 000 000 0 4 845 739 6 437 430 5 55 302 769 9 000 000 6 607 886 25 000
Nepal2014 1 849 372 0 0 0 0 46 5002015 1 740 647 0 0 0 2 315 400 5 5 199 862 45 0002016 2 976 255 0 0 0 966 200 5 10 228 041 23 000
Thailand2014 20 870 397 0 0 0 7 546 409 20 175 612 0 345 667 0 0 0 02015 6 807 416 0 0 0 7 934 078 13 830 845 0 685 341 0 0 0 02016 8 740 652 0 0 0 8 502 036 13 984 633 0 0 0 103 514 0 61 463
Timor-Leste2014 1 558 397 0 0 0 3 482 9552015 2 548 036 0 0 0 791 375 2 610 355 0 0 0 27 280 0 02016 3 102 901 0 0 0 1 523 993 3 261 859 0 0 0 45 868 0 20 000
WESTERN PACIFIC
Cambodia2014 24 365 967 4 590 000 0 0 714 343 2 917 174 0 4 500 000 0 334 029 02015 8 892 603 4 558 500 0 0 692 698 4 042 964 0 4 500 000 0 406 393 02016 8 045 321 6 000 000 0 0 31 300 2 002 435 0 6 000 000 0 304 651 0
China2014 -1 773 012 0 0 0 23 113 017 0 0 02015 -7 365 0 0 0 18 574 013 02016 -304 319 0 0 0 0
Lao People's Democratic Republic2014 4 376 769 0 581 232 0 247 375 2 475 938 0 0 0 113 000 0 43 6202015 5 176 188 0 67 609 0 212 238 6 458 501 0 216 986 600 000 198 357 0 02016 5 681 906 0 68 498 0 655 798 5 050 407 0 340 021 184 632 75 000 0 45 199
Malaysia2014 0 0 0 202 601 60 648 325 0 0 02015 0 0 0 328 709 65 408 655 02016 0 0 0 279 948 42 319 091 0 0 0 0 0 0 0
Papua New Guinea2014 11 189 870 0 0 115 679 377 000 695 052 0 0 0 0 0 02015 7 833 985 0 0 77 267 1 637 421 11 000 0002016 7 562 557 0 0 65 805 181 200 5 900 000 0 0 0 0 0 0
Philippines2014 7 071 104 0 0 0 6 720 000 7 395 343 0 0 0 0 0 02015 4 326 902 0 0 0 6 720 000 6 087 433 0 0 0 0 0 02016 3 389 228 0 0 0 6 720 000 5 3 944 923 0 0 0 0 0 0
Republic of Korea2014 0 0 0 0 681 189 0 0 02015 0 0 0 0 561 372 0 0 0 0 0 0 02016 0 0 0 0 565 790 0 0 0 0 0 0 0
Solomon Islands2014 0 0 0 0 271 730 1 362 022 0 0 1 820 735 654 985 0 02015 690 889 0 0 0 267 444 2 232 220 0 0 1 017 390 464 914 0 02016 2 437 861 0 0 0 348 196 584 376 0 0 448 718 358 000 0 0
Vanuatu2014 0 0 0 0 812 377 5 1 310 500 0 0 1 064 592 287 615 0 02015 0 0 0 0 83 179 687 267 0 0 424 136 175 894 0 02016 0 0 0 0 223 752 927 486 0 0 249 071 148 217 0 0
Viet Nam2014 9 876 642 0 0 0 2 666 667 15 263 816 0 0 0 640 700 0 02015 7 870 861 0 0 0 2 666 666 5 528 000 0 0 0 560 000 0 200 0002016 5 846 063 0 0 0 801 554 11 088 506 200 764 200 000
NMCP, national malaria control programme; PMI, United States President’s Malaria Initiative; UK, United Kingdom of Great Britain and Northern Ireland government; UNICEF, United Nations Children’s Fund; USAID, United States Agency for International Development; World Health Organization, WHO1 Source: Global Fund to Fight AIDS, Tuberculosis and Malaria2 Source: www.foreignassistance.gov3 Source: Organisation for Economic Co-operation and Development (OECD) creditor reporting system (CRS) database4 Source: OECD CRS database5 Budget not expenditure
6 Other contributions as reported by countries (e.g. NGOs and foundations).7 South Sudan became an independent state on 9 July 2011 and a Member State of WHO on 27 September 2011. South Sudan and Sudan
have distinct epidemiological profiles comprising high-transmission and low-transmission areas, respectively. For this reason data up to June 2011 from the high-transmission areas of Sudan (10 southern states which correspond to contemporary South Sudan) and low-transmission areas (15 northern states which correspond to contemporary Sudan) are reported separately.
8 Where national totals for the United Republic of Tanzania are unavailable, refer to the sum of Mainland and Zanzibar* Negative disbursements reflect recovery of funds on behalf of the financing organization
Annex 3 - C. Funding for malaria control, 2014–2016
WORLD MALARIA REPORT 2017110

WHO regionCountry/area
Year Contributions reported by donors Contributions reported by countries
Global Fund¹ PMI/USAID² World Bank³ UK4 Government (NMCP)
Global Fund World Bank PMI/USAID Other bilaterals
WHO UNICEF Other contributions6
SOUTH-EAST ASIA
Myanmar2014 34 681 659 8 160 000 0 7 351 563 42 620 577 6 565 881 451 400 25 000 5 561 9172015 28 145 785 9 117 000 0 5 689 759 5 272 824 5 31 629 898 0 6 500 000 2 800 000 25 000 0 02016 33 646 118 10 000 000 0 4 845 739 6 437 430 5 55 302 769 9 000 000 6 607 886 25 000
Nepal2014 1 849 372 0 0 0 0 46 5002015 1 740 647 0 0 0 2 315 400 5 5 199 862 45 0002016 2 976 255 0 0 0 966 200 5 10 228 041 23 000
Thailand2014 20 870 397 0 0 0 7 546 409 20 175 612 0 345 667 0 0 0 02015 6 807 416 0 0 0 7 934 078 13 830 845 0 685 341 0 0 0 02016 8 740 652 0 0 0 8 502 036 13 984 633 0 0 0 103 514 0 61 463
Timor-Leste2014 1 558 397 0 0 0 3 482 9552015 2 548 036 0 0 0 791 375 2 610 355 0 0 0 27 280 0 02016 3 102 901 0 0 0 1 523 993 3 261 859 0 0 0 45 868 0 20 000
WESTERN PACIFIC
Cambodia2014 24 365 967 4 590 000 0 0 714 343 2 917 174 0 4 500 000 0 334 029 02015 8 892 603 4 558 500 0 0 692 698 4 042 964 0 4 500 000 0 406 393 02016 8 045 321 6 000 000 0 0 31 300 2 002 435 0 6 000 000 0 304 651 0
China2014 -1 773 012 0 0 0 23 113 017 0 0 02015 -7 365 0 0 0 18 574 013 02016 -304 319 0 0 0 0
Lao People's Democratic Republic2014 4 376 769 0 581 232 0 247 375 2 475 938 0 0 0 113 000 0 43 6202015 5 176 188 0 67 609 0 212 238 6 458 501 0 216 986 600 000 198 357 0 02016 5 681 906 0 68 498 0 655 798 5 050 407 0 340 021 184 632 75 000 0 45 199
Malaysia2014 0 0 0 202 601 60 648 325 0 0 02015 0 0 0 328 709 65 408 655 02016 0 0 0 279 948 42 319 091 0 0 0 0 0 0 0
Papua New Guinea2014 11 189 870 0 0 115 679 377 000 695 052 0 0 0 0 0 02015 7 833 985 0 0 77 267 1 637 421 11 000 0002016 7 562 557 0 0 65 805 181 200 5 900 000 0 0 0 0 0 0
Philippines2014 7 071 104 0 0 0 6 720 000 7 395 343 0 0 0 0 0 02015 4 326 902 0 0 0 6 720 000 6 087 433 0 0 0 0 0 02016 3 389 228 0 0 0 6 720 000 5 3 944 923 0 0 0 0 0 0
Republic of Korea2014 0 0 0 0 681 189 0 0 02015 0 0 0 0 561 372 0 0 0 0 0 0 02016 0 0 0 0 565 790 0 0 0 0 0 0 0
Solomon Islands2014 0 0 0 0 271 730 1 362 022 0 0 1 820 735 654 985 0 02015 690 889 0 0 0 267 444 2 232 220 0 0 1 017 390 464 914 0 02016 2 437 861 0 0 0 348 196 584 376 0 0 448 718 358 000 0 0
Vanuatu2014 0 0 0 0 812 377 5 1 310 500 0 0 1 064 592 287 615 0 02015 0 0 0 0 83 179 687 267 0 0 424 136 175 894 0 02016 0 0 0 0 223 752 927 486 0 0 249 071 148 217 0 0
Viet Nam2014 9 876 642 0 0 0 2 666 667 15 263 816 0 0 0 640 700 0 02015 7 870 861 0 0 0 2 666 666 5 528 000 0 0 0 560 000 0 200 0002016 5 846 063 0 0 0 801 554 11 088 506 200 764 200 000
NMCP, national malaria control programme; PMI, United States President’s Malaria Initiative; UK, United Kingdom of Great Britain and Northern Ireland government; UNICEF, United Nations Children’s Fund; USAID, United States Agency for International Development; World Health Organization, WHO1 Source: Global Fund to Fight AIDS, Tuberculosis and Malaria2 Source: www.foreignassistance.gov3 Source: Organisation for Economic Co-operation and Development (OECD) creditor reporting system (CRS) database4 Source: OECD CRS database5 Budget not expenditure
6 Other contributions as reported by countries (e.g. NGOs and foundations).7 South Sudan became an independent state on 9 July 2011 and a Member State of WHO on 27 September 2011. South Sudan and Sudan
have distinct epidemiological profiles comprising high-transmission and low-transmission areas, respectively. For this reason data up to June 2011 from the high-transmission areas of Sudan (10 southern states which correspond to contemporary South Sudan) and low-transmission areas (15 northern states which correspond to contemporary Sudan) are reported separately.
8 Where national totals for the United Republic of Tanzania are unavailable, refer to the sum of Mainland and Zanzibar* Negative disbursements reflect recovery of funds on behalf of the financing organization
WORLD MALARIA REPORT 2017 111

WHO region Country/area
Year No. of LLIN sold or delivered
Modelled proportion of
population with access to an
ITN (%)
No. of people protected by
IRS
IRS coverage (%)
No of RDTs distributed
Any first-line treatment
courses delivered
(including ACT)
ACT treatment courses
delivered
AFRICAN
Algeria2014 0 - - - - 266 922015 0 - - - 0 747 -2016 0 - - - - - -
Angola2014 2 978 937 33 58 370 <1 - - -2015 2 138 331 42 - - 2 500 000 3 185 160 3 185 1602016 3 507 740 40 - - 3 000 000 4 000 000 4 000 000
Benin2014 6 203 924 46 789 883 7 1 332 948 1 101 154 1 101 1542015 392 110 77 802 597 7 1 486 667 1 177 261 1 177 2612016 720 706 51 853 221 8 1 500 047 1 199 055 1 199 055
Botswana2014 - - 205 831 14 2 838 5 906 5 9062015 50 000 - 143 268 10 1 600 1 386 1 3862016 116 048 - 115 973 8 2 196 1 634 1 634
Burkina Faso2014 239 559 82 0 0 6 224 055 7 494 498 7 494 4982015 481 107 73 0 0 8 290 188 7 824 634 7 824 6342016 10 924 031 79 - - 11 974 810 9 519 568 9 519 568
Burundi2014 5 752 583 64 0 0 3 089 202 4 772 805 4 263 1782015 726 767 83 - - 5 075 437 4 798 379 4 798 3762016 755 182 70 - - 8 077 703 8 277 026 8 031 773
Cabo Verde2014 0 - 25 780 19 - 46 412015 0 - 308 586 100 6 620 26 262016 0 - 504 179 100 8 906 71 71
Cameroon2014 - 34 0 0 - 1 270 172 1 270 1722015 2 751 112 32 - - 1 573 992 826 434 826 4342016 9 588 733 63 - - 1 380 725 1 093 036 1 093 036
Central African Republic
2014 555 334 40 - - 303 582 522 270 522 2702015 1 170 566 62 - - 759 245 1 043 674 1 043 6742016 57 110 73 - - 1 651 645 1 714 647 1 714 647
Chad2014 6 321 676 63 - - 1 144 686 1 038 000 1 038 0002015 1 218 640 79 - - 1 057 033 1 326 091 1 326 0912016 384 606 68 - - 882 617 - -
Comoros2014 13 576 80 22 475 3 5 375 4 750 4 7502015 16 969 66 20 275 3 14 813 577 5502016 451 358 72 - - 61 600 1 373 1 373
Congo2014 180 595 61 0 0 19 746 0 02015 447 49 - - 0 1 304 959 1 304 9592016 1 291 34 - - 45 000 0 0
Côte d'Ivoire2014 12 627 282 51 - - - - -2015 3 663 080 83 - - 5 600 100 3 296 991 3 296 9912016 1 177 906 73 - - 5 351 325 4 964 065 4 964 065
Democratic Republic of the Congo
2014 13 918 109 48 194 566 <1 13 962 862 19 008 927 19 008 9272015 15 419 488 60 77 643 <1 13 574 891 9 871 484 9 871 4842016 31 439 920 77 916 524 1 18 630 636 17 258 290 17 258 290
Equatorial Guinea2014 10 010 13 165 944 20 9 801 14 577 -2015 - 21 - - - - -2016 - 26 - - - - -
Eritrea2014 0 31 320 881 6 54 516 216 195 216 1952015 2 054 194 38 328 915 6 645 255 602 255 6022016 156 553 48 364 007 7 0 177 525 177 525
Ethiopia2014 13 388 552 48 16 709 249 25 7 416 167 7 321 471 5 321 4712015 17 233 074 57 16 147 333 24 13 148 960 7 036 620 6 049 3202016 13 266 926 62 15 050 413 22 9 742 450 6 530 973 5 239 080
Gabon2014 10 000 17 - - - 984 423 984 4232015 10 730 13 - - - - -2016 9 660 9 0 0 0 0 0
Annex 3 - D. Commodities distribution and coverage, 2014–2016
WORLD MALARIA REPORT 2017112

WHO region Country/area
Year No. of LLIN sold or delivered
Modelled proportion of
population with access to an
ITN (%)
No. of people protected by
IRS
IRS coverage (%)
No of RDTs distributed
Any first-line treatment
courses delivered
(including ACT)
ACT treatment courses
delivered
AFRICAN
Gambia2014 1 046 510 80 350 442 18 603 900 319 182 319 1822015 93 375 83 438 234 22 875 850 351 677 351 6772016 113 385 69 399 176 19 1 017 889 272 895 272 895
Ghana2014 5 190 887 74 2 154 924 8 9 309 200 14 267 045 14 267 0452015 8 423 676 79 1 325 507 5 3 778 325 3 009 365 3 009 3652016 5 962 179 83 1 409 967 5 4 823 250 2 289 145 2 289 145
Guinea2014 73 145 77 - - 2 870 250 1 312 802 644 8292015 741 450 65 - - 2 412 597 1 645 493 -2016 8 236 154 64 - - 2 138 494 3 362 668 3 362 668
Guinea-Bissau2014 1 109 568 75 - - 917 200 171 540 171 5402015 62 942 88 - - 261 868 139 341 104 7302016 71 500 79 - - 238 412 133 647 115 361
Kenya2014 5 450 064 65 0 0 5 500 000 10 839 611 10 614 7172015 11 637 493 73 0 0 4 319 000 11 052 564 10 321 2212016 2 005 477 76 0 0 334 118 11 327 340 11 327 340
Liberia2014 236 996 40 0 0 58 248 100 535 96 7872015 2 914 331 69 0 0 - - -2016 - 87 - - - - -
Madagascar2014 105 442 65 1 307 384 6 2 839 325 1 648 093 1 648 0932015 11 249 042 68 1 327 326 5 4 962 600 2 040 289 2 040 2892016 464 407 78 2 856 873 11 1 352 225 757 613 757 613
Malawi2014 1 423 507 65 - - 8 197 250 8 735 160 8 735 1602015 1 100 000 58 - - 8 462 325 6 240 060 6 240 0602016 9 093 657 74 - - 8 746 750 6 799 354 6 440 490
Mali2014 3 790 403 54 836 568 5 2 563 993 2 211 118 2 211 1182015 6 080 030 73 494 163 3 4 381 050 3 761 319 3 761 3192016 2 189 027 80 788 711 4 3 250 000 3 511 970 3 511 970
Mauritania2014 178 922 13 - - 269 941 176 192 176 1922015 240 000 13 - - 360 000 - 109 0002016 51 000 11 - - 208 650 174 420 84 000
Mayotte 2014 5 252 - 450 <1 - - -2015 - - - - - - -2016 - - - - - - -
Mozambique2014 6 112 245 59 5 597 770 21 17 374 342 15 976 059 15 976 0592015 5 126 340 71 3 659 845 13 17 219 225 13 653 685 13 653 6852016 4 527 936 73 - - 19 822 825 14 136 250 14 136 250
Namibia2014 163 526 - 467 930 25 3 312 80 215 80 2152015 488 661 - 386 759 20 30 120 79 215 79 2152016 0 - 485 730 24 15 185 21 519 21 519
Niger2014 2 048 430 32 0 0 4 197 381 5 731 036 5 731 0362015 6 253 448 52 0 0 3 039 594 3 698 674 3 698 6742016 746 469 65 0 0 4 622 433 3 257 506 3 257 506
Nigeria2014 23 328 225 41 316 255 <1 10 679 235 22 145 889 22 145 8892015 27 628 073 51 - - 41 089 368 20 249 636 41 089 3682016 9 896 250 55 130 061 <1 11 178 434 9 177 309 9 177 309
Rwanda2014 1 373 582 87 1 243 704 11 444 729 1 917 021 1 917 0212015 2 066 915 84 2 013 652 17 2 015 100 4 392 006 4 392 0062016 2 882 445 84 2 484 672 21 - - -
Sao Tome and Principe2014 11 385 - 124 692 67 58 005 1 456 1 4562015 113 221 - 143 571 75 72 407 1 704 1 7042016 11 922 - 149 930 77 117 676 2 121 2 121
Senegal2014 3 785 595 74 708 999 5 1 193 075 703 712 703 7122015 556 135 79 514 833 3 2 570 500 958 492 958 4922016 8 960 663 83 496 728 3 1 823 405 709 394 709 394
WORLD MALARIA REPORT 2017 113

WHO region Country/area
Year No. of LLIN sold or delivered
Modelled proportion of
population with access to an
ITN (%)
No. of people protected by
IRS
IRS coverage (%)
No of RDTs distributed
Any first-line treatment
courses delivered
(including ACT)
ACT treatment courses
delivered
AFRICAN
Sierra Leone2014 3 846 204 58 0 0 2 057 306 1 391 273 1 391 2732015 395 061 83 - - 2 494 935 1 687 031 1 687 0312016 452 608 75 - - 3 093 725 4 714 900 4 714 900
South Africa2014 0 - 5 650 177 100 499 086 14 036 14 0362015 0 - 1 178 719 22 16 007 28 709 28 7092016 0 - 1 165 955 21 227 325 12 677 12 677
South Sudan1
2014 663 795 70 737 438 6 3 941 300 8 372 384 8 372 3842015 458 890 55 296 977 2 4 049 559 9 971 675 9 971 6752016 2 756 572 48 - - 5 147 954 13 617 422 13 617 422
Swaziland2014 5 399 - 3 971 1 - 588 5582015 3 808 - - - 58 700 491 3962016 4 758 - 24 179 7 56 780 600 600
Togo2014 4 042 425 66 0 0 1 633 891 1 134 604 1 208 5292015 8 600 82 - - 1 633 891 1 508 016 1 208 5292016 - 61 - - 1 428 696 1 064 876 1 049 903
Uganda2014 10 615 631 77 3 219 122 9 17 157 725 21 698 700 21 698 7002015 1 442 500 79 3 700 470 9 27 110 800 30 166 620 30 166 6202016 899 823 67 3 811 484 9 1 089 215 29 667 150 29 667 150
United Republic of Tanzania
2014 - 30 - - - - -2015 - 18 - - - - -2016 - 23 - - - - -
Mainland2014 510 000 30 2 000 000 4 24 126 300 19 937 820 19 937 8202015 20 794 000 18 14 386 280 28 16 416 675 10 160 910 10 160 9102016 11 731 272 23 2 377 403 4 23 223 400 13 786 620 13 786 620
Zanizibar2014 109 189 - 224 900 15 - - -2015 347 998 - 298 645 20 615 275 3 750 3 7502016 756 445 - 27 664 2 24 026 11 100 10 020
Zambia2014 6 368 026 83 5 538 574 35 7 500 000 13 000 845 13 000 8452015 1 506 206 86 5 930 141 37 11 310 350 14 365 969 14 365 9692016 1 292 400 78 6 737 918 40 15 286 570 19 084 818 19 084 818
Zimbabwe2014 1 743 542 37 3 460 871 29 2 446 996 960 455 960 4552015 84 087 38 3 548 246 29 1 981 613 847 333 847 3332016 1 752 855 34 3 674 932 29 3 154 200 934 580 934 580
AMERICAS
Argentina2014 0 - 300 <1 - 50 02015 0 - 1 895 <1 - 50 02016 0 - - - - 30 0
Belize2014 2 452 - 21 413 9 0 19 02015 4 152 - 36 796 15 0 13 02016 4 000 - 35 264 14 0 5 0
Bolivia (Plurinational State of)
2014 23 580 - 16 573 <1 - 7 401 3252015 17 514 - 11 138 <1 - 6 907 6 9072016 84 000 - 12 689 <1 - 5 553 5 553
Brazil2014 229 947 - 96 675 <1 47 375 346 015 70 9652015 0 - 929 834 2 101 700 290 580 94 3802016 0 - 98 562 <1 68 650 369 390 101 890
Colombia2014 169 500 - 519 333 5 2 960 86 228 32 4892015 25 100 - 252 500 2 0 108 469 55 4692016 306 498 - 1 180 400 11 21 575 202 175 94 494
Costa Rica2014 0 - 0 0 - 6 32015 0 - 0 0 - 8 42016 206 - 430 <1 0 13 3
Annex 3 - D. Commodities distribution and coverage, 2014–2016
WORLD MALARIA REPORT 2017114
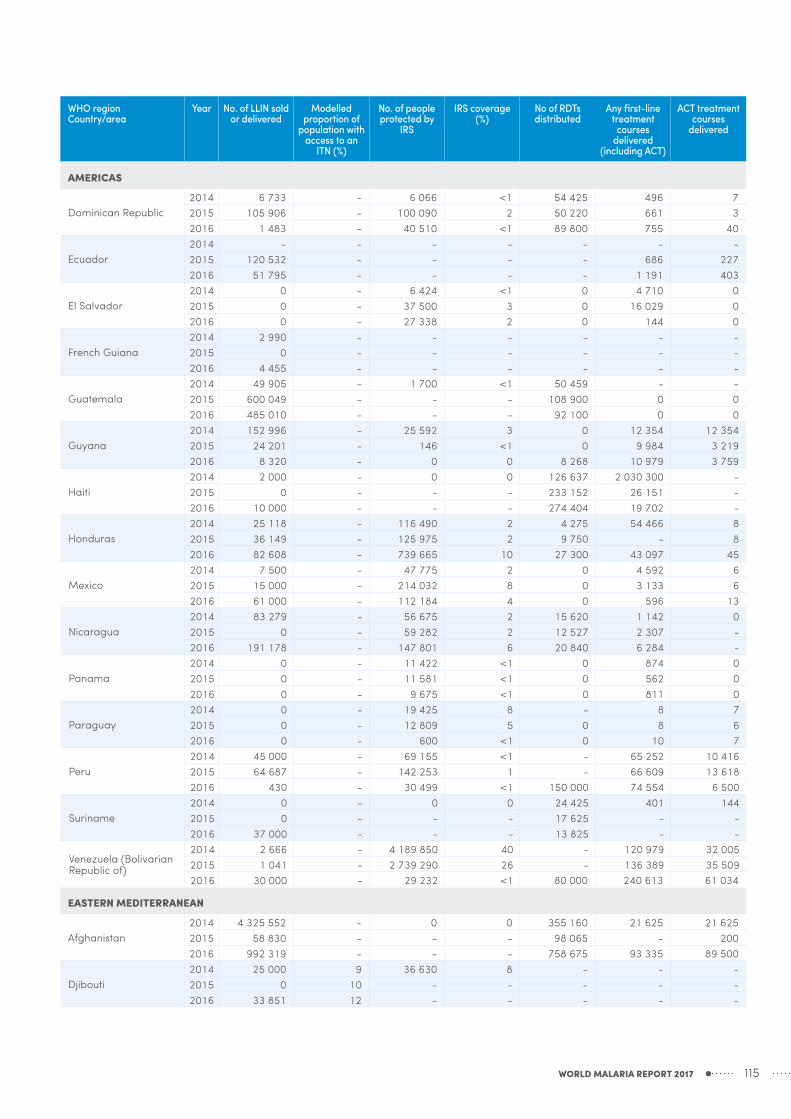
WHO region Country/area
Year No. of LLIN sold or delivered
Modelled proportion of
population with access to an
ITN (%)
No. of people protected by
IRS
IRS coverage (%)
No of RDTs distributed
Any first-line treatment
courses delivered
(including ACT)
ACT treatment courses
delivered
AMERICAS
Dominican Republic2014 6 733 - 6 066 <1 54 425 496 72015 105 906 - 100 090 2 50 220 661 32016 1 483 - 40 510 <1 89 800 755 40
Ecuador2014 - - - - - - -2015 120 532 - - - - 686 2272016 51 795 - - - - 1 191 403
El Salvador2014 0 - 6 424 <1 0 4 710 02015 0 - 37 500 3 0 16 029 02016 0 - 27 338 2 0 144 0
French Guiana2014 2 990 - - - - - -2015 0 - - - - - -2016 4 455 - - - - - -
Guatemala2014 49 905 - 1 700 <1 50 459 - -2015 600 049 - - - 108 900 0 02016 485 010 - - - 92 100 0 0
Guyana2014 152 996 - 25 592 3 0 12 354 12 3542015 24 201 - 146 <1 0 9 984 3 2192016 8 320 - 0 0 8 268 10 979 3 759
Haiti2014 2 000 - 0 0 126 637 2 030 300 -2015 0 - - - 233 152 26 151 -2016 10 000 - - - 274 404 19 702 -
Honduras2014 25 118 - 116 490 2 4 275 54 466 82015 36 149 - 125 975 2 9 750 - 82016 82 608 - 739 665 10 27 300 43 097 45
Mexico2014 7 500 - 47 775 2 0 4 592 62015 15 000 - 214 032 8 0 3 133 62016 61 000 - 112 184 4 0 596 13
Nicaragua2014 83 279 - 56 675 2 15 620 1 142 02015 0 - 59 282 2 12 527 2 307 -2016 191 178 - 147 801 6 20 840 6 284 -
Panama2014 0 - 11 422 <1 0 874 02015 0 - 11 581 <1 0 562 02016 0 - 9 675 <1 0 811 0
Paraguay2014 0 - 19 425 8 - 8 72015 0 - 12 809 5 0 8 62016 0 - 600 <1 0 10 7
Peru2014 45 000 - 69 155 <1 - 65 252 10 4162015 64 687 - 142 253 1 - 66 609 13 6182016 430 - 30 499 <1 150 000 74 554 6 500
Suriname2014 0 - 0 0 24 425 401 1442015 0 - - - 17 625 - -2016 37 000 - - - 13 825 - -
Venezuela (Bolivarian Republic of)
2014 2 666 - 4 189 850 40 - 120 979 32 0052015 1 041 - 2 739 290 26 - 136 389 35 5092016 30 000 - 29 232 <1 80 000 240 613 61 034
EASTERN MEDITERRANEAN
Afghanistan2014 4 325 552 - 0 0 355 160 21 625 21 6252015 58 830 - - - 98 065 - 2002016 992 319 - - - 758 675 93 335 89 500
Djibouti2014 25 000 9 36 630 8 - - -2015 0 10 - - - - -2016 33 851 12 - - - - -
WORLD MALARIA REPORT 2017 115

WHO region Country/area
Year No. of LLIN sold or delivered
Modelled proportion of
population with access to an
ITN (%)
No. of people protected by
IRS
IRS coverage (%)
No of RDTs distributed
Any first-line treatment
courses delivered
(including ACT)
ACT treatment courses
delivered
EASTERN MEDITERRANEAN
Iran (Islamic Republic of)
2014 70 360 - 289 249 36 - 8 830 8 8302015 91 845 - 217 773 27 114 450 37 971 2 0422016 6 393 - 172 666 21 120 000 - -
Pakistan2014 1 519 947 - 1 103 480 <1 857 690 907 200 162 8802015 1 822 015 - 1 685 264 <1 770 074 890 500 80 0002016 2 675 281 - 552 500 <1 13 446 268 850 000 62 000
Saudi Arabia2014 1 450 000 - 752 851 30 - 1 155 1 1552015 125 000 - 131 661 5 - 1 444 1 4442016 0 - 307 927 12 - 3 922 3 922
Somalia2014 413 000 23 61 362 <1 617 640 155 450 155 4502015 291 085 23 15 645 <1 424 140 386 200 386 2002016 655 798 21 11 015 <1 602 640 412 300 412 300
Sudan2014 4 432 714 48 3 942 110 10 2 200 000 3 823 175 3 823 1752015 2 729 334 49 2 460 816 6 4 344 150 2 551 310 2 551 3102016 5 370 774 43 3 678 400 9 2 375 275 3 847 768 3 847 768
Yemen2014 375 899 - 2 188 436 11 412 350 215 486 215 4862015 847 946 - 798 707 4 334 525 153 682 153 6822016 1 482 982 - 548 436 3 442 570 283 408 283 408
SOUTH-EAST ASIA
Bangladesh2014 728 773 - 0 0 211 662 75 479 58 7702015 2 380 759 - - - 259 171 40 742 35 7082016 41 255 - - - 420 049 28 407 24 431
Bhutan2014 10 609 - 144 669 26 - 118 1182015 26 000 - 70 926 12 16 875 416 4162016 22 322 - 66 675 11 12 600 216 216
Democratic People's Republic of Korea
2014 0 - 2 617 120 27 0 11 212 02015 864 750 - 1 146 750 12 253 320 29 272 02016 0 - 1 152 402 12 182 980 23 231 0
India2014 0 - 45 150 612 4 15 562 000 211 500 211 5002015 7 241 418 - 41 849 017 3 21 182 000 2 123 760 2 123 7602016 500 000 - 43 477 154 4 21 082 000 2 123 760 300 000
Indonesia2014 6 416 947 - 103 285 <1 879 650 212 346 212 1652015 56 337 - 53 497 <1 300 000 406 614 406 6142016 2 977 539 - 6 240 <1 1 382 208 438 178 438 178
Myanmar2014 904 613 - 48 626 <1 3 048 440 281 103 281 1032015 3 398 941 - 129 545 <1 1 309 300 243 515 243 5152016 3 965 187 - 44 484 <1 1 596 525 126 585 126 585
Nepal2014 1 064 518 - 372 000 5 60 000 24 500 1952015 304 437 - 329 905 4 56 000 3 350 3002016 290 647 - 286 865 3 61 000 4 500 274
Sri Lanka2014 0 - 50 <1 16 500 49 232015 104 000 - 22 115 <1 19 900 36 182016 16 465 - 57 111 1 31 950 41 19
Thailand2014 528 850 - 362 469 3 258 823 19 314 19 3142015 251 500 - 348 713 3 15 400 31 875 8 1252016 465 600 - 237 398 2 68 500 40 801 14 321
Timor-Leste2014 99 572 - 110 707 56 86 592 347 1052015 24 607 - 93 019 46 90 818 80 562016 309 067 - 166 426 81 114 263 84 84
Annex 3 - D. Commodities distribution and coverage, 2014–2016
WORLD MALARIA REPORT 2017116
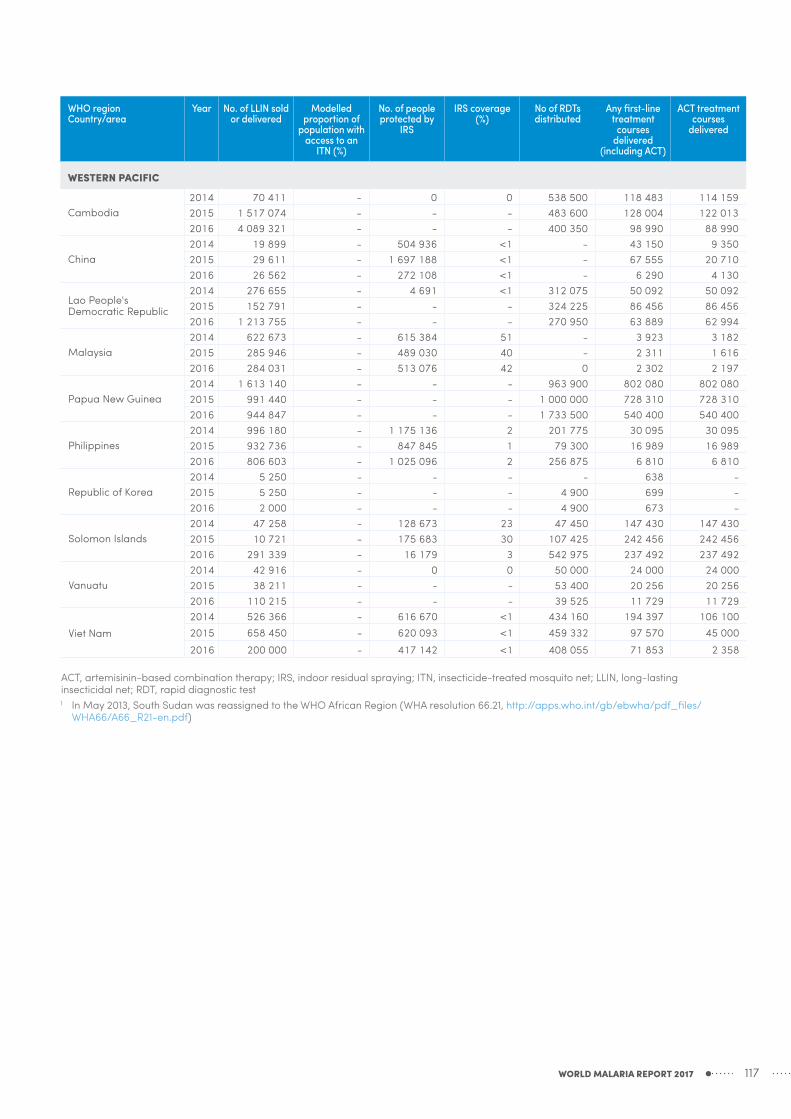
WHO region Country/area
Year No. of LLIN sold or delivered
Modelled proportion of
population with access to an
ITN (%)
No. of people protected by
IRS
IRS coverage (%)
No of RDTs distributed
Any first-line treatment
courses delivered
(including ACT)
ACT treatment courses
delivered
WESTERN PACIFIC
Cambodia2014 70 411 - 0 0 538 500 118 483 114 1592015 1 517 074 - - - 483 600 128 004 122 0132016 4 089 321 - - - 400 350 98 990 88 990
China2014 19 899 - 504 936 <1 - 43 150 9 3502015 29 611 - 1 697 188 <1 - 67 555 20 7102016 26 562 - 272 108 <1 - 6 290 4 130
Lao People's Democratic Republic
2014 276 655 - 4 691 <1 312 075 50 092 50 0922015 152 791 - - - 324 225 86 456 86 4562016 1 213 755 - - - 270 950 63 889 62 994
Malaysia2014 622 673 - 615 384 51 - 3 923 3 1822015 285 946 - 489 030 40 - 2 311 1 6162016 284 031 - 513 076 42 0 2 302 2 197
Papua New Guinea2014 1 613 140 - - - 963 900 802 080 802 0802015 991 440 - - - 1 000 000 728 310 728 3102016 944 847 - - - 1 733 500 540 400 540 400
Philippines2014 996 180 - 1 175 136 2 201 775 30 095 30 0952015 932 736 - 847 845 1 79 300 16 989 16 9892016 806 603 - 1 025 096 2 256 875 6 810 6 810
Republic of Korea2014 5 250 - - - - 638 -2015 5 250 - - - 4 900 699 -2016 2 000 - - - 4 900 673 -
Solomon Islands2014 47 258 - 128 673 23 47 450 147 430 147 4302015 10 721 - 175 683 30 107 425 242 456 242 4562016 291 339 - 16 179 3 542 975 237 492 237 492
Vanuatu2014 42 916 - 0 0 50 000 24 000 24 0002015 38 211 - - - 53 400 20 256 20 2562016 110 215 - - - 39 525 11 729 11 729
Viet Nam2014 526 366 - 616 670 <1 434 160 194 397 106 1002015 658 450 - 620 093 <1 459 332 97 570 45 0002016 200 000 - 417 142 <1 408 055 71 853 2 358
ACT, artemisinin-based combination therapy; IRS, indoor residual spraying; ITN, insecticide-treated mosquito net; LLIN, long-lasting insecticidal net; RDT, rapid diagnostic test1 In May 2013, South Sudan was reassigned to the WHO African Region (WHA resolution 66.21, http://apps.who.int/gb/ebwha/pdf_files/
WHA66/A66_R21-en.pdf)
WORLD MALARIA REPORT 2017 117

WHO region Country/area
Source % of households that have
at least one ITN
% of households with at least one ITN for every two
persons who slept in the household
the previous night
% of the population with access
to an ITN in their
household
% of existing ITNs in
households used the previous
night
% of the population who slept under an ITN the
previous night
% of children <5 years who slept under an ITN the
previous night
% of pregnant
women who slept under an ITN the previous
night
% of households
sprayed by IRS
within last 12 months
% of households with = 1 ITN for 2 pers.
and/or sprayed by IRS
within last 12 months
% of women who received at
least 3 doses of IPT during
ANC visits during their
last pre-gnancy
% of children aged 6-59 months with
% of children <5 years with fever in last 2 weeks
a hemoglobin
measurement <8 g/dL
a positive microscopy
blood smear
for whom advice or treatment
was sought
who received an ACT among those who
received any antimalarial
who had a finger or heel stick
AFRICAN
Angola DHS 2015–16 30.9 11.3 19.7 71 17.6 21.7 23 1.6 12.5 19 5.7 50.8 76.7 34.3Burkina Faso MIS 2014 89.8 49.2 71.2 85.2 67 75.3 77.1 0.4 48.9 21.5 25.9 45.7 61.4 27.9 30.3Chad DHS 2014–15 77.3 42.4 61.2 48.6 33.3 36.4 34.7 0.6 42.4 7.6 36.9 10 12.9Democratic Republic of the Congo DHS 2013–14 70 25.4 46.5 82.8 50.2 55.8 60.2 25.3 5.4 8.2 22.6 55.3 17 18.6Ethiopia DHS 2016 7.5 35.3 11.5Ghana DHS 2014 68.3 45.2 59 48.6 35.7 46.6 43.3 9.7 50.4 38.5 8.3 26.7 76.9 78.2 34.3Ghana MIS 2016 73 50.9 65.8 47.7 41.7 52.2 50 8.1 53.6 59.6 6.9 20.6 72.1 60.7 30.3Kenya DHS 2014 58.9 34.5 48.2 77.3 42.6 54.3 50.6 0.8 34.6 10.1 71.7 85.8 34.9Kenya MIS 2015 62.5 40 52.5 75.2 47.6 56.1 57.8 39.7 21.9 2.2 5 71.9 91.6 39.2Madagascar MIS 2016 79.5 44.4 62.1 78.7 68.2 73.4 68.5 6.9 47.9 10.3 2.3 6.9 55.5 17 15.5Malawi MIS 2014 70.2 30.3 51.8 83.6 52.5 67.1 62.4 8.5 36.6 6.4 33.2 58.8 92.7 32.4Malawi DHS 2015–16 56.9 23.5 38.8 73.3 33.9 42.7 43.9 4.9 27 30 6.4 66.9 91.8 52Mali MIS 2015 93 39.3 69.5 90.7 63.9 71.2 77.9 4 41.8 16 19.9 35.7 49.2 28.9 14.2Nigeria MIS 2015 68.8 34.9 54.7 60.8 37.3 43.6 49 1.3 35.5 19 9.3 27.4 66.1 37.5 12.6Rwanda DHS 2014–15 80.6 42.6 63.8 77.4 61.4 67.7 72.9 42.5 2.3 2.2 56.7 98.7 36.1Senegal DHS 2016 82.4 56.4 75.7 68.2 63.1 66.6 69 5.3 58 5.6 0.9 49.5 13Senegal DHS 2015 76.8 40.5 66 70.1 51 55.4 51.8 4.8 43 7.4 0.3 49.3 9.5Senegal DHS 2014 74.4 36.3 58.4 62.8 40.4 43.2 38.1 8.7 41.9 2.5 5.3 1.2 57.2 10.6 6.7Togo DHS 2013–14 65.4 32.9 48.8 61.2 33.6 42.8 40 32.8 19 8.7 36.4 60.1 49.6 23.8Uganda MIS 2014–15 90.2 62.3 78.8 74.4 68.6 74.3 75.4 4.9 64 25.2 4.7 20 82 86.7 35.8United Republic of Tanzania (mainland) DHS 2015–16 65.6 38.8 55.9 69.4 49 54.4 53.9 5.5 41 7.7 4.8 5.6 80.1 84.9 35.9
Zambia DHS 2013–14 67.7 27.4 46.6 63.6 34.9 40.6 41 28.4 46.9 49.6 75.3 90.4 48.6Zimbabwe DHS 2015 47.9 26.4 37.2 18.8 8.5 9 6.1 21.3 39.4 1.5 49.8 12.7
AMERICAS
Guatemala DHS 2014 0.2 50.1
EASTERN MEDITERRANEAN
Afghanistan DHS 2015 26 2.9 13.2 21.4 3.9 4.6 4.1 63.3 4.4 7.9
SOUTH-EAST ASIA
Bangladesh DHS 2014 55.4Myanmar DHS 2015–16 26.8 14.1 21.2 58.3 15.6 18.6 18.4 3.4 65 3
WESTERN PACIFIC
Cambodia DHS 2014 0.5 60.6
ACT, artemisinin-based combination therapy; ANC, antenatal care; DHS, demographic and health survey; IPT, intermittent preventive treatment; IRS, indoor residual spraying; ITN, insecticide-treated mosquito net; MIS, malaria indicator surveySource: Demographic and Health Survey (DHS) and Malaria Indicator Survey (MIS): STATcompiler - http://www.statcompiler.com/
Annex 3 - E. Household survey results, 2014–2016
WORLD MALARIA REPORT 2017118
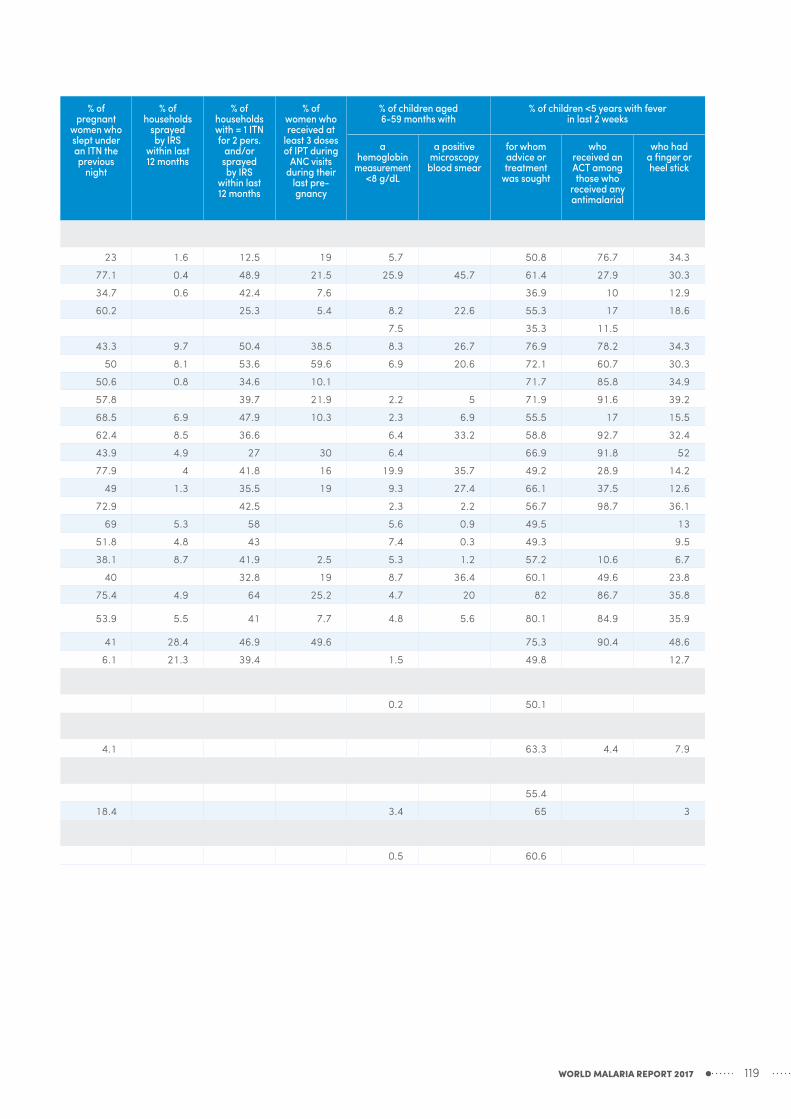
WHO region Country/area
Source % of households that have
at least one ITN
% of households with at least one ITN for every two
persons who slept in the household
the previous night
% of the population with access
to an ITN in their
household
% of existing ITNs in
households used the previous
night
% of the population who slept under an ITN the
previous night
% of children <5 years who slept under an ITN the
previous night
% of pregnant
women who slept under an ITN the previous
night
% of households
sprayed by IRS
within last 12 months
% of households with = 1 ITN for 2 pers.
and/or sprayed by IRS
within last 12 months
% of women who received at
least 3 doses of IPT during
ANC visits during their
last pre-gnancy
% of children aged 6-59 months with
% of children <5 years with fever in last 2 weeks
a hemoglobin
measurement <8 g/dL
a positive microscopy
blood smear
for whom advice or treatment
was sought
who received an ACT among those who
received any antimalarial
who had a finger or heel stick
AFRICAN
Angola DHS 2015–16 30.9 11.3 19.7 71 17.6 21.7 23 1.6 12.5 19 5.7 50.8 76.7 34.3Burkina Faso MIS 2014 89.8 49.2 71.2 85.2 67 75.3 77.1 0.4 48.9 21.5 25.9 45.7 61.4 27.9 30.3Chad DHS 2014–15 77.3 42.4 61.2 48.6 33.3 36.4 34.7 0.6 42.4 7.6 36.9 10 12.9Democratic Republic of the Congo DHS 2013–14 70 25.4 46.5 82.8 50.2 55.8 60.2 25.3 5.4 8.2 22.6 55.3 17 18.6Ethiopia DHS 2016 7.5 35.3 11.5Ghana DHS 2014 68.3 45.2 59 48.6 35.7 46.6 43.3 9.7 50.4 38.5 8.3 26.7 76.9 78.2 34.3Ghana MIS 2016 73 50.9 65.8 47.7 41.7 52.2 50 8.1 53.6 59.6 6.9 20.6 72.1 60.7 30.3Kenya DHS 2014 58.9 34.5 48.2 77.3 42.6 54.3 50.6 0.8 34.6 10.1 71.7 85.8 34.9Kenya MIS 2015 62.5 40 52.5 75.2 47.6 56.1 57.8 39.7 21.9 2.2 5 71.9 91.6 39.2Madagascar MIS 2016 79.5 44.4 62.1 78.7 68.2 73.4 68.5 6.9 47.9 10.3 2.3 6.9 55.5 17 15.5Malawi MIS 2014 70.2 30.3 51.8 83.6 52.5 67.1 62.4 8.5 36.6 6.4 33.2 58.8 92.7 32.4Malawi DHS 2015–16 56.9 23.5 38.8 73.3 33.9 42.7 43.9 4.9 27 30 6.4 66.9 91.8 52Mali MIS 2015 93 39.3 69.5 90.7 63.9 71.2 77.9 4 41.8 16 19.9 35.7 49.2 28.9 14.2Nigeria MIS 2015 68.8 34.9 54.7 60.8 37.3 43.6 49 1.3 35.5 19 9.3 27.4 66.1 37.5 12.6Rwanda DHS 2014–15 80.6 42.6 63.8 77.4 61.4 67.7 72.9 42.5 2.3 2.2 56.7 98.7 36.1Senegal DHS 2016 82.4 56.4 75.7 68.2 63.1 66.6 69 5.3 58 5.6 0.9 49.5 13Senegal DHS 2015 76.8 40.5 66 70.1 51 55.4 51.8 4.8 43 7.4 0.3 49.3 9.5Senegal DHS 2014 74.4 36.3 58.4 62.8 40.4 43.2 38.1 8.7 41.9 2.5 5.3 1.2 57.2 10.6 6.7Togo DHS 2013–14 65.4 32.9 48.8 61.2 33.6 42.8 40 32.8 19 8.7 36.4 60.1 49.6 23.8Uganda MIS 2014–15 90.2 62.3 78.8 74.4 68.6 74.3 75.4 4.9 64 25.2 4.7 20 82 86.7 35.8United Republic of Tanzania (mainland) DHS 2015–16 65.6 38.8 55.9 69.4 49 54.4 53.9 5.5 41 7.7 4.8 5.6 80.1 84.9 35.9
Zambia DHS 2013–14 67.7 27.4 46.6 63.6 34.9 40.6 41 28.4 46.9 49.6 75.3 90.4 48.6Zimbabwe DHS 2015 47.9 26.4 37.2 18.8 8.5 9 6.1 21.3 39.4 1.5 49.8 12.7
AMERICAS
Guatemala DHS 2014 0.2 50.1
EASTERN MEDITERRANEAN
Afghanistan DHS 2015 26 2.9 13.2 21.4 3.9 4.6 4.1 63.3 4.4 7.9
SOUTH-EAST ASIA
Bangladesh DHS 2014 55.4Myanmar DHS 2015–16 26.8 14.1 21.2 58.3 15.6 18.6 18.4 3.4 65 3
WESTERN PACIFIC
Cambodia DHS 2014 0.5 60.6
ACT, artemisinin-based combination therapy; ANC, antenatal care; DHS, demographic and health survey; IPT, intermittent preventive treatment; IRS, indoor residual spraying; ITN, insecticide-treated mosquito net; MIS, malaria indicator surveySource: Demographic and Health Survey (DHS) and Malaria Indicator Survey (MIS): STATcompiler - http://www.statcompiler.com/
WORLD MALARIA REPORT 2017 119

WHO regionCountry/area
Year Cases Deaths
Lower Point Upper Lower Point Upper
AFRICAN
Algeria
2010 ≤10 ≤102011 ≤10 02012 ≤100 02013 0 02014 0 02015 0 02016 0 0
Angola
2010 1 845 000 2 975 000 4 350 000 9 000 11 980 15 3002011 1 894 000 2 910 000 4 220 000 8 000 11 590 14 8002012 1 881 000 3 021 000 4 460 000 8 000 11 480 14 6102013 1 904 000 3 400 000 5 350 000 9 000 11 720 14 8702014 1 914 000 3 450 000 5 470 000 9 000 11 970 15 1202015 1 881 000 3 430 000 5 560 000 9 000 11 900 14 9902016 1 903 000 3 470 000 5 600 000 9 000 11 950 15 000
Benin
2010 2 008 000 2 974 000 4 290 000 5 000 6 000 8 0002011 1 985 000 2 931 000 4 170 000 5 000 6 000 7 0002012 2 104 000 3 058 000 4 500 000 5 000 6 000 8 0002013 2 016 000 3 137 000 4 570 000 5 000 6 000 8 0002014 1 976 000 3 091 000 4 540 000 5 000 6 000 7 0002015 2 051 000 3 190 000 4 670 000 5 000 6 000 8 0002016 2 080 000 3 230 000 4 730 000 5 000 6 000 8 000
Botswana
2010 1 800 5 000 16 950 ≤1002011 600 1 200 4 000 ≤102012 270 500 1 600 ≤102013 600 1 200 4 000 ≤102014 1 800 4 000 11 230 ≤102015 500 900 2 700 ≤102016 1 000 1 900 6 000 ≤10
Burkina Faso
2010 6 030 000 8 510 000 11 250 000 30 520 37 000 43 6002011 6 030 000 8 400 000 11 140 000 26 510 32 100 37 6002012 5 830 000 8 110 000 10 810 000 22 380 26 910 31 4502013 5 480 000 7 590 000 10 260 000 18 440 21 970 25 5002014 5 400 000 7 440 000 10 080 000 18 090 21 490 24 8802015 5 580 000 7 700 000 10 470 000 18 200 21 580 24 9602016 5 720 000 7 890 000 10 740 000 18 020 21 300 24 580
Burundi
2010 1 065 000 2 001 000 3 220 000 4 000 5 000 6 0002011 1 042 000 1 887 000 2 955 000 4 000 5 000 6 0002012 1 011 000 1 706 000 2 589 000 4 000 5 000 6 0002013 916 000 1 683 000 2 678 000 4 000 5 000 6 0002014 903 000 1 654 000 2 625 000 4 000 5 000 6 0002015 870 000 1 613 000 2 555 000 4 000 5 000 6 0002016 888 000 1 644 000 2 604 000 4 000 5 000 6 000
Cabo Verde
2010 ≤100 ≤102011 ≤10 ≤102012 ≤10 02013 ≤100 02014 ≤100 ≤102015 ≤10 02016 ≤100 ≤10
Cameroon
2010 3 600 000 5 550 000 8 360 000 7 000 10 000 12 0002011 3 360 000 5 210 000 7 810 000 6 000 9 000 10 9202012 3 069 000 5 090 000 7 660 000 6 000 9 000 10 7602013 3 154 000 5 330 000 8 120 000 7 000 9 000 10 9602014 3 159 000 5 380 000 8 230 000 6 000 9 000 10 6802015 3 170 000 5 360 000 8 200 000 6 000 8 000 10 2102016 3 220 000 5 440 000 8 320 000 6 000 8 000 10 000
Central African Republic
2010 916 000 1 605 000 2 515 000 5 000 6 000 7 0002011 803 000 1 549 000 2 461 000 4 000 5 000 6 0002012 719 000 1 526 000 2 416 000 4 000 5 000 6 0002013 643 000 1 491 000 2 389 000 4 000 4 000 5 0002014 608 000 1 463 000 2 360 000 3 000 4 000 5 0002015 572 000 1 409 000 2 287 000 3 000 4 000 4 0002016 581 000 1 431 000 2 322 000 2 900 4 000 4 000
Annex 3 - F.a. Estimated malaria cases and deaths, 2010–2016
WORLD MALARIA REPORT 2017120

WHO regionCountry/area
Year Cases Deaths
Lower Point Upper Lower Point Upper
AFRICAN
Chad
2010 762 000 1 889 000 3 700 000 5 000 7 000 9 0002011 734 000 1 809 000 3 450 000 5 000 7 000 9 0002012 696 000 1 840 000 3 840 000 5 000 7 000 9 0002013 722 000 1 835 000 3 810 000 6 000 7 000 9 0002014 750 000 1 901 000 3 900 000 6 000 7 000 9 0002015 769 000 1 963 000 4 070 000 6 000 7 000 9 0002016 793 000 2 014 000 4 170 000 6 000 7 000 9 000
Comoros
2010 36 500 ≤1002011 24 860 ≤1002012 49 800 ≤10 120 2002013 53 200 ≤10 130 2102014 2 200 ≤102015 1 300 ≤102016 1 100 ≤10
Congo
2010 453 000 847 000 1 534 000 1 600 1 800 2 0002011 481 000 869 000 1 577 000 1 600 1 800 2 0002012 467 000 900 000 1 565 000 1 600 1 900 2 1002013 467 000 936 000 1 554 000 1 700 1 900 2 2002014 494 000 988 000 1 638 000 1 800 2 000 2 2002015 511 000 1 030 000 1 724 000 1 800 2 000 2 3002016 522 000 1 049 000 1 758 000 1 800 2 000 2 300
Côte d’Ivoire
2010 6 480 000 9 530 000 13 740 000 20 840 26 030 31 2102011 5 840 000 8 640 000 12 770 000 14 530 18 340 22 1502012 4 160 000 6 640 000 10 170 000 8 000 10 500 12 7902013 3 440 000 5 580 000 9 010 000 6 000 8 000 10 1502014 3 170 000 5 270 000 8 590 000 6 000 8 000 9 0002015 3 072 000 5 160 000 8 460 000 6 000 7 000 9 0002016 3 146 000 5 290 000 8 660 000 6 000 7 000 9 000
Democratic Republic of the Congo
2010 19 100 000 28 390 000 40 200 000 84 300 104 100 123 9002011 18 330 000 27 210 000 39 400 000 71 700 88 400 105 1002012 16 380 000 24 720 000 37 200 000 58 400 71 700 85 0002013 15 360 000 23 420 000 36 200 000 53 500 65 300 77 2002014 15 100 000 23 250 000 36 200 000 53 000 64 500 76 0002015 13 970 000 22 130 000 35 100 000 49 700 60 100 70 5002016 14 280 000 22 640 000 35 900 000 50 100 60 500 70 800
Equatorial Guinea
2010 93 900 192 000 313 700 400 500 6002011 151 700 277 100 425 000 600 700 9002012 185 400 301 000 458 000 600 800 1 0002013 206 500 329 000 489 000 800 900 1 1002014 174 800 281 600 405 000 700 800 1 0002015 173 700 284 400 408 000 600 800 9002016 178 100 291 700 419 000 600 800 900
Eritrea
2010 57 800 92 200 131 100 ≤100 180 4002011 53 500 84 600 118 800 ≤100 160 3002012 36 100 58 200 84 100 ≤1002013 34 100 54 600 77 700 ≤1002014 47 100 74 300 104 700 ≤10 160 3002015 29 880 47 300 66 600 ≤1002016 44 000 72 800 107 400 ≤10 170 400
Ethiopia
2010 608 000 4 840 000 14 020 000 180 9 000 33 7002011 616 000 3 260 000 11 140 000 170 5 000 21 8402012 645 000 3 650 000 12 490 000 180 6 000 24 9902013 574 000 3 780 000 12 940 000 150 7 000 29 4002014 612 000 3 170 000 7 350 000 200 5 000 16 4202015 586 000 2 818 000 6 460 000 180 5 000 15 4402016 573 000 2 588 000 5 850 000 170 5 000 14 630
Gabon
2010 85 600 220 000 397 000 290 300 4002011 114 600 265 100 471 000 310 400 4002012 145 400 326 000 625 000 300 400 4002013 157 500 375 000 690 000 400 400 5002014 166 900 392 000 712 000 400 400 5002015 170 900 401 000 730 000 400 400 5002016 173 700 408 000 743 000 400 500 500
WORLD MALARIA REPORT 2017 121

WHO regionCountry/area
Year Cases Deaths
Lower Point Upper Lower Point Upper
AFRICAN
Gambia
2010 326 000 434 000 567 000 500 600 7002011 357 000 445 000 537 000 500 600 7002012 404 000 512 000 628 000 500 600 7002013 332 000 432 000 540 000 500 600 7002014 219 600 285 300 356 000 500 600 7002015 320 000 416 000 519 000 500 600 7002016 203 500 264 200 329 000 500 600 700
Ghana
2010 5 910 000 8 730 000 12 340 000 13 800 16 060 18 3102011 6 250 000 9 070 000 12 770 000 13 810 16 020 18 2302012 5 890 000 8 670 000 12 370 000 12 800 14 700 16 6002013 5 510 000 8 250 000 12 080 000 12 240 13 940 15 6502014 5 360 000 8 040 000 11 840 000 11 790 13 330 14 8702015 5 190 000 7 890 000 11 710 000 11 490 12 900 14 3002016 5 300 000 8 060 000 11 950 000 11 510 12 880 14 250
Guinea
2010 2 973 000 4 420 000 6 270 000 9 000 11 050 13 3202011 3 170 000 4 550 000 6 300 000 9 000 11 090 13 3602012 3 380 000 4 680 000 6 350 000 9 000 11 270 13 5802013 3 260 000 4 650 000 6 410 000 8 000 10 460 12 5602014 3 270 000 4 680 000 6 460 000 8 000 10 190 12 2302015 3 210 000 4 640 000 6 460 000 8 000 9 000 11 2102016 3 310 000 4 790 000 6 660 000 7 000 9 000 11 040
Guinea-Bissau
2010 78 400 145 400 262 800 500 600 7002011 72 400 152 000 289 500 500 600 7002012 66 100 149 400 324 000 500 600 7002013 55 500 151 000 342 000 500 600 7002014 52 200 142 700 331 000 500 600 7002015 46 900 130 300 311 500 500 600 7002016 47 900 132 600 317 000 500 600 700
Kenya
2010 1 611 000 2 922 000 4 880 000 9 000 10 000 11 2202011 1 477 000 2 723 000 4 600 000 9 000 10 190 11 4802012 1 450 000 2 811 000 4 770 000 9 000 10 230 11 4902013 1 552 000 3 059 000 5 290 000 9 000 10 330 11 5602014 1 753 000 3 420 000 5 860 000 9 000 10 540 11 7702015 1 781 000 3 470 000 5 960 000 9 000 10 650 11 8602016 1 814 000 3 520 000 6 040 000 10 000 10 780 11 970
Liberia
2010 810 000 1 294 000 1 968 000 2 100 2 500 2 9002011 739 000 1 234 000 1 941 000 1 900 2 300 2 6002012 657 000 1 125 000 1 920 000 1 700 2 000 2 3002013 642 000 1 131 000 2 038 000 1 700 2 000 2 3002014 652 000 1 154 000 2 073 000 1 700 2 000 2 3002015 581 000 1 076 000 2 016 000 1 600 1 900 2 1002016 593 000 1 094 000 2 047 000 1 700 1 900 2 200
Madagascar
2010 516 000 920 000 1 450 000 ≤100 2 400 5 0002011 476 000 843 000 1 267 000 ≤100 2 200 5 0002012 934 000 1 673 000 2 663 000 120 4 000 10 0002013 967 000 1 650 000 2 576 000 120 4 000 9 0002014 757 000 1 215 000 1 781 000 ≤100 3 100 6 0002015 1 472 000 2 358 000 3 450 000 180 6 000 12 4602016 943 000 1 504 000 2 203 000 110 4 000 8 000
Malawi
2010 4 030 000 5 870 000 8 070 000 9 000 11 010 12 8902011 3 740 000 5 410 000 7 620 000 8 000 10 000 11 2202012 3 270 000 4 670 000 6 670 000 7 000 8 000 10 0002013 2 829 000 4 190 000 5 980 000 7 000 8 000 9 0002014 3 028 000 4 500 000 6 440 000 7 000 8 000 9 0002015 2 952 000 4 390 000 6 310 000 6 000 7 000 8 0002016 3 025 000 4 510 000 6 470 000 6 000 7 000 8 000
Mali
2010 3 830 000 5 360 000 7 500 000 11 370 14 410 17 4502011 4 220 000 5 870 000 8 190 000 12 840 16 310 19 7802012 4 930 000 6 820 000 9 390 000 15 870 20 260 24 6502013 5 380 000 7 450 000 10 130 000 17 790 22 770 27 7502014 5 470 000 7 550 000 10 300 000 17 140 21 910 26 6802015 5 550 000 7 680 000 10 510 000 16 510 21 070 25 6402016 5 700 000 7 910 000 10 830 000 16 380 20 890 25 400
Annex 3 - F.a. Estimated malaria cases and deaths, 2010–2016
WORLD MALARIA REPORT 2017122

WHO regionCountry/area
Year Cases Deaths
Lower Point Upper Lower Point Upper
AFRICAN
Mauritania
2010 22 560 136 100 298 900 900 1 100 1 3002011 36 200 148 100 309 700 900 1 100 1 3002012 12 950 79 100 183 000 900 1 100 1 3002013 13 190 74 200 166 600 1 000 1 100 1 3002014 74 200 207 000 402 000 1 000 1 200 1 4002015 99 000 250 000 473 000 1 000 1 200 1 4002016 139 500 313 000 563 000 1 000 1 200 1 400
Mayotte
2010 280 500 1 600 ≤102011 ≤100 120 400 02012 ≤100 02013 ≤10 02014 ≤10 02015 0 02016 ≤100 0
Mozambique
2010 6 260 000 8 720 000 11 740 000 13 660 16 670 19 6702011 6 580 000 9 050 000 12 300 000 13 640 16 600 19 5502012 6 720 000 9 520 000 13 140 000 14 020 17 050 20 0802013 6 320 000 9 320 000 13 250 000 13 540 16 380 19 2202014 5 990 000 8 920 000 12 630 000 12 690 15 230 17 7602015 5 800 000 8 680 000 12 420 000 12 020 14 290 16 5702016 5 930 000 8 870 000 12 700 000 12 110 14 370 16 630
Namibia
2010 1 100 3 000 7 000 ≤102011 3 000 4 000 6 000 ≤1002012 3 100 7 000 10 810 ≤1002013 7 000 9 000 11 080 ≤1002014 22 140 28 770 35 800 ≤1002015 16 890 21 990 27 420 ≤1002016 35 000 45 500 56 700 ≤10 120 220
Niger
2010 3 810 000 6 800 000 11 190 000 16 290 21 180 26 0702011 3 660 000 7 180 000 11 690 000 16 340 21 210 26 0802012 3 640 000 7 250 000 11 950 000 15 540 20 110 24 6802013 3 430 000 7 080 000 11 840 000 14 240 18 350 22 4502014 3 510 000 7 270 000 12 170 000 14 050 18 050 22 0502015 3 590 000 7 490 000 12 580 000 13 570 17 370 21 1702016 3 760 000 7 830 000 13 150 000 13 930 17 800 21 680
Nigeria
2010 39 200 000 55 900 000 76 700 000 94 200 121 000 147 8002011 37 500 000 54 500 000 76 900 000 85 500 109 800 134 1002012 35 900 000 53 600 000 79 500 000 80 500 103 400 126 2002013 34 900 000 54 600 000 81 100 000 82 000 105 200 128 3002014 35 400 000 55 500 000 82 400 000 82 100 105 300 128 5002015 35 500 000 56 200 000 83 500 000 78 700 100 800 123 0002016 36 200 000 57 300 000 85 300 000 78 700 100 700 122 800
Rwanda
2010 738 000 1 086 000 1 475 000 3 000 4 000 4 0002011 238 400 328 000 430 000 3 100 3 000 4 0002012 545 000 710 000 899 000 3 000 4 000 4 0002013 1 072 000 1 334 000 1 623 000 3 000 4 000 4 0002014 1 793 000 2 233 000 2 717 000 3 000 4 000 4 0002015 2 787 000 3 470 000 4 230 000 4 000 4 000 4 0002016 3 760 000 4 680 000 5 690 000 4 000 4 000 4 000
Sao Tome and Principe
2010 2 700 ≤1002011 8 000 ≤1002012 12 550 ≤102013 9 000 ≤1002014 1 800 02015 2 100 02016 2 200 0
Senegal
2010 811 000 1 307 000 1 914 000 3 000 4 000 5 0002011 742 000 1 202 000 1 741 000 3 000 4 000 4 0002012 772 000 1 266 000 1 854 000 3 000 4 000 4 0002013 969 000 1 588 000 2 318 000 4 000 4 000 4 0002014 675 000 1 065 000 1 522 000 4 000 4 000 5 0002015 770 000 1 069 000 1 397 000 4 000 4 000 5 0002016 541 000 753 000 982 000 4 000 4 000 5 000
WORLD MALARIA REPORT 2017 123

WHO regionCountry/area
Year Cases Deaths
Lower Point Upper Lower Point Upper
AFRICAN
Sierra Leone
2010 1 494 000 2 587 000 3 810 000 10 530 13 340 16 1602011 1 527 000 2 545 000 3 790 000 10 000 12 130 14 6502012 1 535 000 2 480 000 3 690 000 9 000 10 750 12 9302013 1 505 000 2 405 000 3 750 000 7 000 9 000 11 1902014 1 445 000 2 346 000 3 720 000 7 000 8 000 10 0002015 1 292 000 2 223 000 3 600 000 6 000 7 000 8 0002016 1 307 000 2 244 000 3 640 000 6 000 7 000 8 000
South Africa
2010 8 000 ≤1002011 10 000 ≤1002012 6 000 ≤1002013 9 000 1002014 11 700 1702015 600 1102016 4 000 ≤100
South Sudan1
2010 844 000 1 764 000 2 984 000 5 000 6 000 7 0002011 811 000 1 730 000 3 025 000 5 000 6 000 7 0002012 816 000 1 727 000 3 170 000 5 000 6 000 7 0002013 792 000 1 734 000 3 280 000 5 000 6 000 7 0002014 895 000 1 929 000 3 610 000 5 000 6 000 7 0002015 857 000 1 872 000 3 550 000 5 000 6 000 7 0002016 889 000 1 945 000 3 690 000 5 000 6 000 7 000
Swaziland
2010 270 02011 500 ≤102012 600 ≤102013 1 000 ≤102014 700 ≤102015 160 02016 400 0
Togo
2010 1 772 000 2 568 000 3 740 000 5 000 6 000 7 0002011 1 779 000 2 574 000 3 580 000 4 000 5 000 6 0002012 1 813 000 2 639 000 3 670 000 4 000 5 000 6 0002013 1 833 000 2 690 000 3 770 000 4 000 5 000 6 0002014 1 791 000 2 658 000 3 740 000 4 000 5 000 5 0002015 1 812 000 2 683 000 3 780 000 4 000 4 000 5 0002016 1 850 000 2 741 000 3 870 000 4 000 4 000 5 000
Uganda
2010 8 990 000 13 410 000 19 920 000 20 330 25 370 30 4102011 8 020 000 12 310 000 18 980 000 16 590 20 580 24 5602012 6 540 000 10 370 000 16 250 000 13 080 16 000 18 9302013 5 010 000 8 270 000 13 060 000 10 780 12 930 15 0802014 4 700 000 7 920 000 12 560 000 10 570 12 590 14 6002015 4 460 000 7 610 000 12 150 000 10 240 12 080 13 9202016 4 550 000 7 770 000 12 390 000 10 280 12 060 13 850
United Republic of Tanzania
2010 4 350 000 7 070 000 10 870 000 15 070 17 540 20 0102011 3 920 000 6 470 000 9 910 000 14 920 17 240 19 5602012 3 450 000 5 800 000 8 520 000 14 860 17 050 19 2302013 3 520 000 5 920 000 8 680 000 15 610 17 920 20 2402014 3 870 000 6 460 000 9 440 000 16 080 18 430 20 7802015 3 990 000 6 660 000 9 720 000 16 370 18 690 21 0102016 4 120 000 6 880 000 10 040 000 16 640 18 930 21 210
Zambia
2010 1 490 000 2 212 000 3 149 000 5 000 6 000 7 0002011 1 529 000 2 251 000 3 250 000 5 000 6 000 7 0002012 1 774 000 2 595 000 3 800 000 5 000 6 000 7 0002013 2 192 000 3 290 000 4 880 000 6 000 7 000 8 0002014 2 237 000 3 350 000 4 980 000 6 000 7 000 8 0002015 2 030 000 3 083 000 4 680 000 6 000 7 000 8 0002016 2 075 000 3 149 000 4 780 000 6 000 7 000 8 000
Zimbabwe
2010 619 000 1 146 000 1 838 000 ≤100 2 900 7 0002011 464 000 770 000 1 128 000 ≤100 2 000 4 0002012 401 000 667 000 975 000 ≤100 1 700 4 0002013 613 000 1 018 000 1 491 000 ≤100 2 600 6 0002014 777 000 1 293 000 1 891 000 ≤100 3 000 7 0002015 567 000 944 000 1 381 000 ≤100 2 400 5 0002016 406 000 675 000 990 000 ≤100 1 700 4 000
Annex 3 - F.a. Estimated malaria cases and deaths, 2010–2016
WORLD MALARIA REPORT 2017124

WHO regionCountry/area
Year Cases Deaths
Lower Point Upper Lower Point Upper
AMERICAS
Belize
2010 150 02011 ≤100 02012 ≤100 02013 ≤100 02014 ≤100 02015 ≤10 02016 ≤10 0
Bolivia (Plurinational State of)
2010 6 000 17 190 35 900 ≤1002011 3 000 9 000 18 410 ≤102012 3 000 9 000 18 800 ≤102013 3 000 9 000 18 480 ≤102014 3 000 9 000 18 830 ≤102015 3 000 9 000 17 400 ≤102016 2 400 7 000 14 030 ≤10
Brazil
2010 370 000 423 000 474 000 ≤1002011 295 400 338 000 378 000 ≤1002012 268 200 307 000 343 000 ≤1002013 196 700 225 000 251 600 ≤1002014 154 100 176 200 196 900 ≤1002015 153 000 174 900 195 500 ≤1002016 137 300 157 100 175 700 ≤100
Colombia
2010 133 700 180 900 231 700 ≤1002011 73 100 98 900 126 600 ≤1002012 68 300 92 600 118 500 ≤1002013 58 800 79 600 101 900 ≤102014 46 400 62 700 80 300 ≤1002015 54 700 74 100 94 900 ≤1002016 98 800 134 400 173 200 ≤100
Dominican Republic
2010 4 000 5 000 6 000 ≤1002011 1 800 2 200 2 700 ≤102012 1 100 1 300 1 600 ≤102013 600 800 1 000 ≤102014 500 600 800 ≤102015 700 900 1 000 ≤102016 800 1 000 1 100 ≤10
Ecuador
2010 1 900 02011 1 200 02012 500 02013 400 02014 240 02015 600 02016 1 200 0
El Salvador
2010 ≤100 02011 ≤10 02012 ≤100 02013 ≤10 02014 ≤10 02015 ≤10 02016 ≤100 0
French Guiana
2010 700 2 000 4 000 ≤102011 500 1 500 3 100 ≤102012 400 1 100 2 300 ≤102013 400 1 100 2 200 ≤102014 200 600 1 100 ≤102015 100 300 600 02016 ≤100 160 300 0
Guatemala
2010 3 000 9 000 19 250 ≤102011 3 000 9 000 17 510 ≤102012 2 300 7 000 13 590 ≤102013 2 700 8 000 15 780 ≤102014 2 500 7 000 14 470 ≤102015 3 000 9 000 17 210 ≤102016 2 100 6 000 12 310 ≤10
WORLD MALARIA REPORT 2017 125

WHO regionCountry/area
Year Cases Deaths
Lower Point Upper Lower Point Upper
AMERICAS
Guyana
2010 33 200 45 600 59 800 ≤1002011 42 700 58 700 77 100 ≤10 110 2102012 45 800 63 000 82 500 ≤10 110 2102013 56 800 84 800 121 600 ≤100 140 2702014 22 310 33 300 47 700 ≤1002015 18 040 26 920 38 700 ≤1002016 22 370 33 300 47 800 ≤100
Haiti
2010 111 500 207 600 336 000 ≤100 500 1 2002011 102 800 177 900 275 900 ≤100 500 1 0002012 78 300 134 000 207 000 ≤10 300 7002013 66 800 114 500 176 900 ≤10 290 6002014 43 400 68 900 97 300 ≤10 180 4002015 43 200 68 500 96 700 ≤10 180 4002016 54 000 85 700 121 000 ≤10 220 400
Honduras
2010 14 960 20 340 26 250 ≤1002011 11 530 15 490 19 830 ≤102012 10 000 13 020 16 520 ≤102013 8 000 10 960 13 910 ≤102014 5 000 7 000 9 000 ≤102015 5 000 7 000 9 000 ≤102016 7 000 9 000 11 140 ≤10
Mexico
2010 1 200 02011 1 100 02012 800 02013 500 02014 700 02015 500 02016 600 0
Nicaragua
2010 1 100 1 400 1 700 ≤102011 1 400 1 800 2 300 ≤102012 1 900 2 500 3 000 ≤102013 1 800 2 300 2 800 ≤102014 1 800 2 300 2 800 ≤102015 4 000 5 000 6 000 ≤102016 10 000 12 460 15 380 ≤100
Panama
2010 400 500 500 ≤102011 400 400 400 02012 900 1 000 1 100 ≤102013 700 800 900 02014 900 1 000 1 100 02015 600 700 700 02016 800 900 1 000 0
Peru
2010 50 400 63 100 76 500 02011 41 600 52 600 64 000 ≤102012 54 700 69 400 85 000 ≤102013 84 700 107 700 132 000 ≤102014 113 500 144 200 176 500 ≤102015 107 600 136 700 167 500 ≤102016 98 600 125 000 153 100 ≤10
Suriname
2010 1 700 ≤102011 800 ≤102012 400 02013 700 ≤102014 400 ≤102015 ≤100 02016 ≤100 0
Venezuela (Bolivarian Republic of)
2010 19 690 56 600 118 100 ≤1002011 20 740 57 400 117 100 ≤10 100 2502012 23 060 66 200 133 900 ≤1002013 34 800 98 500 199 300 ≤100 110 2602014 40 300 113 900 229 900 ≤100 120 2702015 60 800 171 200 343 000 ≤100 160 4002016 104 800 300 900 608 000 ≤100 280 600
Annex 3 - F.a. Estimated malaria cases and deaths, 2010–2016
WORLD MALARIA REPORT 2017126

WHO regionCountry/area
Year Cases Deaths
Lower Point Upper Lower Point Upper
EASTERN MEDITERRANEAN
Afghanistan
2010 207 600 348 000 534 000 ≤100 200 4002011 246 400 424 000 655 000 ≤100 230 4002012 168 200 285 500 442 000 ≤100 120 2302013 116 800 194 200 299 900 ≤1002014 180 800 275 200 398 000 ≤100 130 2302015 261 900 398 000 571 000 ≤100 190 3002016 398 000 556 000 751 000 ≤100 270 500
Djibouti
2010 400 1 000 2 300 ≤102011 300 900 2 700 ≤102012 290 1 400 4 000 ≤102013 400 2 100 7 000 ≤102014 400 2 200 7 000 ≤102015 400 2 200 7 000 ≤102016 400 2 300 7 000 ≤10
Iran (Islamic Republic of)
2010 1 800 02011 1 600 02012 800 02013 500 02014 400 02015 170 ≤102016 ≤100 0
Pakistan
2010 777 000 1 645 000 3 004 000 230 1 900 4 0002011 1 060 000 2 101 000 3 660 000 300 2 000 4 0002012 924 000 1 857 000 3 310 000 270 1 900 4 0002013 863 000 1 588 000 2 706 000 250 1 200 2 2002014 839 000 1 547 000 2 649 000 240 1 100 2 1002015 612 000 1 161 000 2 038 000 180 900 1 8002016 874 000 1 307 000 1 933 000 210 1 100 2 000
Saudi Arabia
2010 ≤100 02011 ≤100 02012 ≤100 02013 ≤100 02014 ≤100 02015 ≤100 02016 270 0
Somalia
2010 167 100 276 500 442 000 ≤100 700 1 6002011 160 200 283 200 478 000 ≤100 800 1 8002012 206 600 424 000 810 000 ≤100 1 300 3 1002013 291 100 638 000 1 306 000 ≤100 2 000 5 0002014 322 000 645 000 1 481 000 ≤100 2 100 5 0002015 320 000 642 000 1 474 000 ≤100 2 100 5 0002016 326 000 650 000 1 490 000 ≤100 2 100 5 000
Sudan
2010 770 000 1 131 000 1 927 000 110 3 200 7 0002011 743 000 1 089 000 1 805 000 110 3 000 6 0002012 768 000 1 132 000 1 885 000 110 3 100 7 0002013 785 000 1 210 000 2 075 000 120 3 000 7 0002014 829 000 1 268 000 2 160 000 120 4 000 8 0002015 841 000 1 288 000 2 199 000 130 4 000 8 0002016 855 000 1 305 000 2 222 000 130 4 000 8 000
Yemen
2010 330 000 506 000 763 000 ≤100 1 200 2 6002011 269 700 409 000 614 000 ≤100 1 000 2 1002012 327 000 495 000 742 000 ≤100 1 200 2 5002013 302 300 458 000 686 000 ≤100 1 100 2 3002014 254 000 384 000 574 000 ≤100 900 1 9002015 222 300 336 000 502 000 ≤100 800 1 7002016 287 100 433 000 647 000 ≤100 1 100 2 200
EUROPEAN
Tajikistan
2010 120 130 140 02011 ≤100 02012 ≤100 02013 ≤10 02014 ≤10 02015 0 02016 0 0
WORLD MALARIA REPORT 2017 127

WHO regionCountry/area
Year Cases Deaths
Lower Point Upper Lower Point Upper
SOUTH-EAST ASIA
Bangladesh
2010 64 400 79 300 95 300 ≤10 190 3002011 57 300 69 700 82 500 ≤10 170 3002012 11 340 13 750 16 330 ≤1002013 4 000 5 000 6 000 ≤1002014 11 110 12 990 14 840 ≤1002015 7 000 8 000 10 000 ≤1002016 5 000 6 000 7 000 ≤100
Bhutan
2010 400 ≤102011 190 ≤102012 ≤100 ≤102013 ≤100 02014 ≤100 02015 ≤100 02016 ≤100 0
Democratic People's Republic of Korea
2010 13 520 02011 16 760 02012 21 850 02013 14 410 02014 10 540 02015 800 02016 2 700 0
India
2010 15 580 000 21 090 000 28 440 000 2 800 32 600 65 4002011 13 330 000 17 930 000 24 010 000 2 500 26 890 49 5002012 10 880 000 14 640 000 19 640 000 2 000 21 440 39 5002013 8 680 000 11 540 000 15 290 000 1 500 17 820 35 5002014 8 900 000 11 850 000 15 720 000 1 500 21 560 40 5002015 9 580 000 12 670 000 16 660 000 1 600 23 390 43 8002016 9 400 000 13 170 000 18 300 000 1 600 23 990 46 500
Indonesia
2010 2 107 000 2 715 000 3 510 000 400 4 000 8 0002011 1 926 000 2 469 000 3 170 000 300 4 000 7 0002012 1 919 000 2 453 000 3 142 000 300 4 000 7 0002013 1 579 000 2 017 000 2 584 000 270 3 100 6 0002014 1 158 000 1 479 000 1 893 000 200 2 400 4 0002015 999 000 1 274 000 1 630 000 170 2 000 4 0002016 1 004 000 1 281 000 1 643 000 160 2 200 4 000
Myanmar
2010 1 437 000 2 155 000 3 147 000 250 4 000 8 0002011 1 128 000 1 506 000 1 987 000 180 2 800 5 0002012 1 364 000 1 974 000 2 815 000 230 4 000 8 0002013 446 000 585 000 766 000 ≤100 1 100 2 1002014 274 400 360 000 472 000 ≤100 700 1 3002015 200 000 236 500 273 900 ≤100 400 7002016 120 600 142 600 165 000 ≤100 240 400
Nepal
2010 20 270 43 400 80 800 ≤1002011 17 800 32 700 56 300 ≤1002012 10 960 20 520 36 400 ≤1002013 10 000 16 230 26 080 ≤1002014 4 000 8 000 14 170 ≤102015 3 000 7 000 12 230 ≤102016 2 500 4 000 7 000 ≤10
Thailand
2010 32 500 ≤1002011 24 900 ≤1002012 32 600 ≤1002013 33 300 ≤1002014 37 900 ≤1002015 8 000 ≤1002016 11 520 ≤100
Timor-Leste
2010 78 800 113 300 153 500 ≤100 220 4002011 27 780 36 200 45 900 ≤1002012 7 000 8 000 10 000 ≤1002013 1 300 1 600 1 900 ≤102014 400 500 600 02015 ≤100 120 150 02016 120 140 170 0
Annex 3 - F.a. Estimated malaria cases and deaths, 2010–2016
WORLD MALARIA REPORT 2017128

WHO regionCountry/area
Year Cases Deaths
Lower Point Upper Lower Point Upper
WESTERN PACIFIC
Cambodia
2010 139 800 175 000 213 200 ≤100 300 6002011 162 900 203 600 248 000 ≤100 400 6002012 116 900 146 000 178 000 ≤100 220 4002013 61 100 76 500 93 300 ≤100 110 1802014 71 700 89 700 109 100 ≤100 150 2702015 96 300 120 300 146 700 ≤100 210 4002016 66 600 83 300 101 400 ≤100 140 250
China
2010 5 000 ≤1002011 3 000 ≤1002012 240 02013 ≤100 02014 ≤100 02015 ≤100 02016 ≤10 0
Lao People's Democratic Republic
2010 39 300 51 000 63 500 ≤10 120 2302011 33 000 42 800 53 300 ≤1002012 86 800 112 700 140 500 ≤100 250 5002013 72 100 93 500 116 600 ≤100 170 3002014 90 500 117 300 146 100 ≤100 180 3002015 67 800 87 900 109 500 ≤100 120 2002016 21 130 27 390 34 100 ≤100
Malaysia
2010 5 000 ≤1002011 4 000 ≤1002012 4 000 ≤1002013 2 900 ≤102014 3 100 ≤102015 240 ≤102016 270 ≤10
Papua New Guinea
2010 506 000 1 342 000 2 348 000 120 2 900 7 0002011 437 000 1 130 000 1 967 000 ≤100 2 600 6 0002012 528 000 1 452 000 2 718 000 120 3 000 8 0002013 901 000 1 617 000 2 492 000 140 4 000 8 0002014 828 000 1 260 000 1 739 000 150 2 400 5 0002015 687 000 1 014 000 1 402 000 110 2 100 4 0002016 990 000 1 407 000 1 887 000 150 3 000 6 000
Philippines
2010 35 800 53 200 72 400 ≤10 110 2302011 17 940 25 970 34 800 ≤1002012 13 140 18 630 24 610 ≤1002013 11 720 16 290 21 240 ≤1002014 9 000 12 210 15 910 ≤1002015 14 810 20 580 26 810 ≤1002016 12 000 16 630 21 660 ≤100
Republic of Korea
2010 1 300 ≤102011 500 ≤102012 400 02013 400 02014 600 02015 600 02016 600 0
Solomon Islands
2010 67 600 95 900 133 500 ≤100 170 4002011 45 700 66 200 94 000 ≤10 120 2302012 39 800 55 000 75 100 ≤1002013 41 300 56 400 76 400 ≤1002014 24 300 30 780 38 500 ≤1002015 31 590 39 400 48 500 ≤1002016 70 300 86 000 103 200 ≤100 110 180
Vanuatu
2010 10 890 13 780 17 120 ≤1002011 7 000 10 000 12 960 ≤1002012 5 000 7 000 9 000 ≤1002013 4 000 5 000 6 000 ≤102014 1 500 1 900 2 600 ≤102015 500 600 700 02016 2 800 4 000 5 000 ≤10
WORLD MALARIA REPORT 2017 129

WHO regionCountry/area
Year Cases Deaths
Lower Point Upper Lower Point Upper
WESTERN PACIFIC
Viet Nam
2010 21 840 25 460 29 020 ≤1002011 19 650 22 630 25 460 ≤1002012 23 150 26 610 29 850 ≤1002013 20 160 23 140 25 960 ≤1002014 18 460 21 200 23 740 ≤1002015 10 940 12 560 14 070 ≤1002016 5 000 6 000 6 000 ≤10
Annex 3 - F.a. Estimated malaria cases and deaths, 2010–2016
1 South Sudan became an independent state on 9 July 2011 and a Member State of WHO on 27 September 2011. South Sudan and Sudan have distinct epidemiological profiles comprising high-transmission and low-transmission areas respectively. For this reason, data up to June 2011 from the high-transmission areas of Sudan (10 southern states, which correspond to contemporary South Sudan) and low-transmission areas (15 northern states which correspond to contemporary Sudan) are reported separately.
WORLD MALARIA REPORT 2017130

WHO regionCountry/area
Year Cases Deaths
Lower Point Upper Lower Point Upper
REGIONAL SUMMARY
African
2010 185 400 000 204 500 000 243 900 000 492 000 538 000 585 0002011 178 600 000 196 700 000 237 600 000 446 000 484 000 524 0002012 173 100 000 190 800 000 235 100 000 409 000 445 000 482 0002013 170 100 000 189 300 000 234 500 000 394 000 430 000 469 0002014 170 900 000 190 000 000 234 700 000 389 000 423 000 457 0002015 171 100 000 190 800 000 236 000 000 377 000 409 000 442 0002016 175 100 000 194 500 000 240 800 000 375 000 407 000 438 000
Americas
2010 902 000 1 038 000 1 193 000 250 800 1 5002011 719 000 826 000 946 000 250 800 1 4002012 677 000 769 000 873 000 210 600 1 1002013 645 000 745 000 865 000 220 600 1 0002014 536 000 628 000 747 000 160 400 7002015 560 000 684 000 859 000 170 400 7002016 666 000 875 000 1 185 000 260 700 1 100
Eastern Mediterranean
2010 2 938 000 3 910 000 5 650 000 2 600 7 000 11 7602011 3 220 000 4 310 000 6 210 000 2 700 7 000 11 4202012 3 180 000 4 200 000 6 080 000 2 900 8 000 12 4202013 3 180 000 4 090 000 5 890 000 2 600 8 000 13 0302014 3 270 000 4 120 000 6 030 000 2 500 8 000 13 1302015 3 058 000 3 830 000 5 620 000 2 400 8 000 12 9702016 3 550 000 4 250 000 5 920 000 2 700 8 000 13 680
European
2010 180 200 210 02011 ≤100 02012 ≤100 02013 ≤10 02014 ≤10 02015 0 02016 0 0
South-East Asia
2010 20 660 000 26 250 000 33 700 000 9 000 41 700 74 9002011 17 430 000 22 080 000 28 210 000 8 000 33 900 57 0002012 15 290 000 19 160 000 24 320 000 7 000 29 130 48 3002013 11 280 000 14 210 000 17 940 000 4 000 22 150 40 1002014 10 780 000 13 760 000 17 610 000 3 000 24 740 43 8002015 11 100 000 14 210 000 18 200 000 3 000 25 900 46 4002016 10 810 000 14 610 000 19 710 000 3 000 26 520 49 300
Western Pacific
2010 939 000 1 768 000 2 767 000 800 4 000 8 0002011 811 000 1 509 000 2 348 000 600 3 000 7 0002012 898 000 1 822 000 3 100 000 600 4 000 9 0002013 1 174 000 1 891 000 2 771 000 500 4 000 9 0002014 1 102 000 1 537 000 2 021 000 500 2 900 5 0002015 966 000 1 297 000 1 680 000 400 2 600 5 0002016 1 214 000 1 631 000 2 109 000 400 3 000 6 000
Total
2010 217 700 000 237 400 000 278 100 000 532 000 591 000 650 0002011 207 000 000 225 400 000 267 000 000 480 000 529 000 577 0002012 198 800 000 216 800 000 261 800 000 443 000 487 000 531 0002013 191 200 000 210 300 000 256 000 000 423 000 465 000 509 0002014 191 100 000 210 100 000 255 700 000 416 000 459 000 500 0002015 191 500 000 210 800 000 257 000 000 403 000 446 000 487 0002016 196 400 000 215 900 000 262 600 000 402 000 445 000 486 000
WORLD MALARIA REPORT 2017 131

WHO region Country/area 2010 2011 2012 2013 2014 2015 2016
AFRICAN
Algeria 1 060 685 1 081 299 1 103 215 1 125 907 1 148 660 1 170 927 1 192 498Angola 23 369 124 24 218 571 25 096 151 25 998 342 26 920 475 27 859 303 28 813 475Benin 9 199 254 9 460 802 9 729 160 10 004 442 10 286 715 10 575 962 10 872 305Botswana 710 347 723 206 736 593 750 414 764 536 778 859 793 336Burkina Faso 15 605 211 16 081 903 16 571 207 17 072 731 17 585 973 18 110 616 18 646 436Burundi 8 766 936 9 043 497 9 319 702 9 600 189 9 891 791 10 199 267 10 524 125Cabo Verde 65 310 66 049 66 818 67 616 68 437 69 278 70 143Cameroon 17 074 779 17 544 981 18 025 432 18 515 636 19 015 120 19 523 522 20 040 511Central African Republic 4 448 521 4 476 145 4 490 417 4 499 658 4 515 392 4 546 103 4 594 618Chad 9 881 854 10 215 578 10 561 789 10 917 971 11 280 292 11 646 047 12 014 422Comoros 508 928 521 385 534 139 547 157 560 353 573 670 587 077Congo 4 386 700 4 512 720 4 633 368 4 751 394 4 871 102 4 995 644 5 125 827Côte d'Ivoire 20 401 332 20 895 315 21 418 603 21 966 307 22 531 354 23 108 477 23 695 923Democratic Republic of the Congo 63 555 414 65 712 893 67 944 000 70 246 289 72 617 014 75 053 666 77 555 120Equatorial Guinea 951 102 994 285 1 038 591 1 083 738 1 129 421 1 175 380 1 221 495Eritrea 3 754 167 3 825 864 3 899 633 3 976 600 4 057 871 4 144 173 4 236 220Ethiopia 41 746 474 42 862 255 44 003 429 45 166 559 46 346 580 47 539 561 48 743 923Gabon 1 640 213 1 697 096 1 756 817 1 817 273 1 875 717 1 930 178 1 979 787Gambia 1 692 147 1 746 369 1 802 122 1 859 331 1 917 851 1 977 584 2 038 507Ghana 24 512 093 25 121 786 25 733 048 26 346 250 26 962 572 27 582 820 28 206 727Guinea 10 794 176 11 035 170 11 281 464 11 536 622 11 805 512 12 091 534 12 395 916Guinea-Bissau 1 555 869 1 596 156 1 638 140 1 681 489 1 725 743 1 770 528 1 815 702Kenya 35 187 929 36 155 213 37 142 170 38 146 505 39 165 461 40 196 859 41 239 555Liberia 3 948 136 4 070 173 4 181 557 4 286 293 4 390 744 4 499 620 4 613 828Madagascar 19 858 048 20 414 134 20 979 907 21 556 889 22 147 093 22 751 972 23 372 043Malawi 15 167 096 15 627 611 16 097 313 16 577 150 17 068 838 17 573 606 18 091 580Mali 14 408 152 14 853 449 15 298 522 15 748 831 16 212 409 16 695 124 17 198 735Mauritania 2 968 271 3 057 185 3 149 758 3 245 093 3 341 930 3 439 304 3 536 902Mayotte 27 588 28 390 29 191 29 991 30 789 31 589 32 389Mozambique 24 221 406 24 939 008 25 676 608 26 434 367 27 212 381 28 010 695 28 829 471Namibia 1 364 053 1 390 695 1 421 026 1 454 029 1 488 220 1 522 469 1 556 461Niger 16 425 582 17 064 637 17 731 634 18 426 368 19 148 225 19 896 963 20 672 980Nigeria 139 848 502 143 639 582 147 537 723 151 534 460 155 618 665 159 782 280 164 022 315Rwanda 10 246 837 10 516 067 10 788 851 11 065 156 11 345 347 11 629 546 11 917 511Sao Tome and Principe 174 770 178 802 182 893 187 050 191 273 195 549 199 909Senegal 12 878 992 13 262 559 13 664 012 14 079 619 14 504 178 14 933 812 15 367 182Sierra Leone 6 458 719 6 611 686 6 766 101 6 922 079 7 079 168 7 237 028 7 396 182South Africa 3 610 927 3 658 446 3 709 875 3 763 718 3 817 770 3 870 386 3 921 083South Sudan1 10 067 196 10 448 856 10 818 259 11 177 483 11 530 974 11 882 127 12 230 730Swaziland 168 398 171 536 174 742 178 005 181 314 184 662 188 034Togo 6 502 946 6 679 278 6 859 485 7 042 947 7 228 905 7 416 806 7 606 369Uganda 33 915 138 35 093 648 36 306 795 37 553 731 38 833 341 40 144 867 41 487 969United Republic of Tanzania 39 485 974 40 761 393 42 078 538 43 434 640 44 826 567 46 251 913 47 709 484Zambia 13 850 036 14 264 756 14 699 937 15 153 206 15 620 967 16 100 579 16 591 381Zimbabwe 7 561 448 7 722 659 7 896 672 8 081 161 8 272 885 8 469 232 8 669 407
AMERICAS
Argentina 103 060 104 142 105 242 106 350 107 454 108 544 109 619Belize 110 954 113 571 116 164 118 745 121 335 123 954 126 599Bolivia (Plurinational State of) 2 373 709 2 412 025 2 450 475 2 489 069 2 527 816 2 566 716 2 605 769Brazil 22 237 979 22 451 595 22 663 391 22 872 175 23 076 084 23 273 719 23 464 773Colombia 7 389 854 7 468 478 7 544 894 7 619 167 7 691 414 7 761 711 7 830 064Costa Rica 818 150 828 085 837 742 847 152 856 364 865 412 874 309Dominican Republic 2 796 010 2 832 485 2 868 602 2 904 291 2 939 475 2 974 094 3 008 101Ecuador 285 880 290 525 295 163 299 793 304 417 309 035 313 643El Salvador 625 710 628 545 631 456 634 453 637 540 640 717 643 989French Guiana 75 467 77 571 79 786 82 080 84 399 86 703 86 525Guatemala 6 520 420 6 662 367 6 805 936 6 950 847 7 096 741 7 243 308 7 390 398
Annex 3 - F.b. Population at risk for estimates of malaria cases and deaths, 2010–2016
WORLD MALARIA REPORT 2017132

WHO region Country/area 2010 2011 2012 2013 2014 2015 2016
AMERICAS
Guyana 414 019 415 425 417 642 420 406 423 353 426 194 428 850Haiti 5 678 817 5 761 421 5 843 287 5 924 248 6 004 146 6 082 860 6 160 247Honduras 4 755 756 4 846 763 4 936 162 5 024 455 5 112 334 5 200 320 5 288 556Mexico 1 302 182 1 321 840 1 341 134 1 360 088 1 378 798 1 397 327 1 415 635Nicaragua 1 498 474 1 516 782 1 534 877 1 552 802 1 570 629 1 588 395 1 606 128Panama 1 839 046 1 871 634 1 904 527 1 937 600 1 970 679 2 003 620 2 036 369Paraguay 111 778 113 288 114 826 116 383 117 946 119 504 121 055Peru 6 503 588 6 589 129 6 677 466 6 767 524 6 857 780 6 947 079 7 035 014Suriname 50 022 50 544 51 067 51 586 52 098 52 600 53 090Venezuela (Bolivarian Republic of) 6 185 398 6 278 140 6 369 720 6 460 233 6 549 839 6 638 645 6 726 659
EASTERN MEDITERRANEAN
Afghanistan 15 022 161 15 494 388 16 009 860 16 549 522 17 084 798 17 595 117 18 074 695Djibouti 212 787 216 487 220 297 224 173 228 044 231 854 235 586Iran (Islamic Republic of) 380 816 385 535 390 448 395 463 400 445 405 294 409 977Iraq 1 999 576 2 062 259 2 130 477 2 202 404 2 275 395 2 347 517 2 418 168Pakistan 108 499 981 110 805 406 113 176 460 115 594 468 118 033 214 120 472 326 122 904 269Saudi Arabia 1 098 481 1 131 017 1 164 996 1 199 366 1 232 700 1 263 958 1 292 738Somalia 9 094 000 9 359 197 9 630 097 9 908 182 10 195 462 10 493 493 10 802 729Sudan 32 133 681 32 863 852 33 632 833 34 436 247 35 266 076 36 116 370 36 986 413Yemen 12 151 726 12 483 956 12 822 546 13 165 556 13 510 442 13 855 264 14 199 123
EUROPEAN
Armenia 0 0 0 0 0 0 0Azerbaijan 103 873 105 183 106 547 107 931 109 293 110 601 111 842Georgia 21 158 20 856 20 539 20 230 19 962 19 758 19 627Kyrgyzstan 2 158 2 192 2 226 2 262 2 298 2 334 2 370Tajikistan 1 406 059 1 438 134 1 471 092 1 504 717 1 538 745 1 572 951 1 607 231Turkey 8 209 8 332 8 464 8 602 8 743 8 884 9 025Turkmenistan 0 0 0 0 0 0 0Uzbekistan 28 606 29 068 29 541 30 020 30 500 30 976 31 447
SOUTH-EAST ASIA
Bangladesh 9 140 814 9 246 720 9 355 770 9 466 568 9 576 750 9 684 627 9 789 803Bhutan 316 526 322 126 327 539 332 758 337 756 342 513 347 023Democratic People's Republic of Korea 5 491 969 5 521 158 5 550 577 5 580 040 5 609 163 5 637 648 5 665 498India 649 780 540 658 361 024 666 716 887 674 896 732 682 971 394 690 992 000 698 971 796Indonesia 129 015 921 130 709 390 132 398 787 134 073 982 135 722 480 137 334 887 138 905 980Myanmar 18 890 792 19 040 373 19 203 634 19 377 523 19 556 799 19 737 400 19 918 767Nepal 4 628 293 4 680 362 4 735 645 4 793 086 4 850 962 4 908 005 4 963 923Sri Lanka 2 322 811 2 336 228 2 348 823 2 360 632 2 371 711 2 382 115 2 391 826Thailand 7 120 773 7 154 817 7 188 069 7 219 758 7 248 757 7 274 272 7 296 090Timor-Leste 132 565 135 186 138 201 141 499 144 898 148 263 151 571
WESTERN PACIFIC
Cambodia 8 502 630 8 638 798 8 780 809 8 926 879 9 074 309 9 220 985 9 366 419China 286 014 749 287 641 792 289 267 542 290 867 782 292 410 712 293 871 090 295 239 160Lao People's Democratic Republic 3 250 162 3 295 540 3 338 043 3 379 352 3 421 931 3 467 506 3 516 615Malaysia 983 931 1 002 230 1 020 966 1 039 735 1 057 981 1 075 310 1 091 554Papua New Guinea 6 895 001 7 051 273 7 207 906 7 365 077 7 523 104 7 682 231 7 842 443Philippines 30 409 133 30 912 451 31 427 896 31 951 677 32 477 672 33 001 366 33 521 730Republic of Korea 1 734 350 1 741 063 1 748 328 1 755 924 1 763 495 1 770 778 1 777 717Solomon Islands 522 518 534 210 546 019 557 877 569 754 581 601 593 432Vanuatu 220 861 226 058 231 302 236 598 241 926 247 304 252 727Viet Nam 35 608 591 35 996 640 36 405 254 36 826 187 37 247 663 37 660 872 38 062 347
1 South Sudan became an independent state on 9 July 2011 and a Member State of WHO on 27 September 2011. South Sudan and Sudan have distinct epidemiological profiles comprising high-transmission and low-transmission areas respectively. For this reason, data up to June 2011 from the high-transmission areas of Sudan (10 southern states, which correspond to contemporary South Sudan) and low-transmission areas (15 northern states which correspond to contemporary Sudan) are reported separately.
WORLD MALARIA REPORT 2017 133

WHO region Country/area
Population Public sector Private sector Community level
UN population At risk (low + high)
At risk (high)
Number of people living in active foci Presumed Confirmed Presumed Confirmed Presumed Confirmed
AFRICAN
Angola 28 813 475 28 813 475 28 813 475 - 506 893 3 794 253 - - - -Benin 10 872 305 10 872 305 10 872 305 - 50 153 1 324 576 199 975 215 172 6 062 71 042Botswana 2 250 256 1 491 882 94 790 - 2 716 0 7 - -Burkina Faso 18 646 436 18 646 436 18 646 436 - 6 668 9 779 154 - - 13 739 257Burundi 10 524 125 10 524 125 10 524 125 - 109 327 8 274 062 - - - 519 114Cabo Verde 539 559 - - 170 786 - 75 - - - -Cameroon 23 439 194 23 439 194 16 641 828 - 115 627 1 675 264 - - 23 970 18 738Central African Republic 4 594 618 4 594 618 4 594 618 - 367 762 1 032 764 73 552 206 553 - -Chad 14 452 545 14 294 354 9 734 495 - 107 447 1 294 768 - - - -Comoros 795 603 795 603 378 551 - 267 1 066 19 324 0 77Congo 5 125 827 5 125 827 5 125 827 - 202 405 171 847 - - - -Côte d'Ivoire 23 695 923 23 695 923 23 695 923 - 0 3 471 024 0 109 423 0 174 057Democratic Republic of the Congo 78 736 162 78 736 162 76 374 077 - 66 876 15 330 841 - - 0 1 490 289Equatorial Guinea 1 221 495 1 221 495 1 221 495 - 0 147 714 - - - -Eritrea 4 954 643 4 954 643 3 517 797 - 22 804 24 251 - - 33 395 0Ethiopia 102 403 200 69 634 175 27 853 670 - 244 492 1 718 504 - - - -Gabon 1 979 787 1 979 787 1 979 787 - 137 593 23 915 - - - -Gambia 2 038 507 2 038 507 2 038 507 - 1 682 153 774 0 2 742 0 6 223Ghana 28 206 727 28 206 727 28 206 727 - 5 913 100 4 535 167 1 209 430 893 812 109 249 0Guinea 12 395 916 12 395 916 12 395 916 - 0 992 146 0 17 445 6 507 130 677Guinea-Bissau 1 815 702 1 815 702 1 815 702 - 0 150 903 0 4 067 52 1 501Kenya 48 461 564 48 461 564 34 017 550 - 5 538 654 2 783 846 59 164 133 390 43 622 147 560Liberia 4 613 828 4 613 828 4 613 828 - 1 152 273 1 191 137 - - - -Madagascar 24 894 543 24 894 543 21 849 543 - 0 475 333 151 027 30 544 530 053 180 147Malawi 18 091 580 18 091 580 18 091 580 - 338 013 4 827 373 - - 452 086 513 303Mali 17 994 835 17 994 835 16 402 634 - 154 816 2 156 282 - - 0 154 816Mauritania 4 301 022 4 301 022 2 772 783 - 130 069 29 156 - - - -Mayotte 239 917 - - - 0 27 - - - -Mozambique 28 829 471 28 829 471 28 829 471 - 0 8 520 376 - - 682 468 1 170 497Namibia 2 479 711 1 968 260 1 144 661 - 0 25 198 - - - -Niger 20 672 980 20 672 980 20 672 980 - 908 226 4 148 167 0 0 0 109 943Nigeria 185 989 645 185 989 645 142 054 940 - 7 318 051 9 378 257 595 702 1 304 462 2 852 214 3 059 433Rwanda 11 917 511 11 917 511 11 917 511 - 0 3 380 568 - - - 1 345 009Sao Tome and Principe 199 909 199 909 199 909 - 0 2 238 - - - -Senegal 15 411 614 15 411 614 15 322 751 - 6 732 349 540 - - 2 161 75 750Sierra Leone 7 396 182 7 396 182 7 396 182 - 70 421 1 775 306 10 026 18 928 102 196 526 342South Africa 56 015 475 5 601 548 2 240 619 - 0 4 323 - - - -South Sudan1 12 230 730 12 230 730 12 230 730 - - 7 619 - - 185 168 136Swaziland 1 343 098 376 067 0 - 137 350 0 249 - -Togo 7 606 369 7 606 369 7 606 369 - 0 1 183 265 - - 0 562 969Uganda 41 487 969 41 487 969 41 487 969 - 6 732 294 9 385 132 229 699 350 717 - -United Republic of Tanzania 55 155 473 55 155 473 54 551 284 - 861 592 5 193 520 36 719 568 495 - -Mainland 53 594 890 53 594 890 53 594 890 - 861 592 5 188 505 36 719 567 164 - -
Zanzibar 1 560 583 1 560 583 956 394 - 0 5 015 0 1 331 - -Zambia 16 591 381 16 591 381 16 591 381 - 1 124 873 4 851 319 - - 0 85 348
Zimbabwe 16 150 357 12 717 224 4 621 593 - 865 279 988 - - 69 161 34 015
AMERICAS
Belize 366 954 - - 30 856 0 5 0 0 - -Bolivia (Plurinational State of) 10 887 879 4 939 515 272 023 - 0 5 553 - - - -Brazil 207 652 860 42 153 531 4 776 016 - 0 129 251 - - - -Colombia 48 653 432 10 771 432 4 888 697 - 0 63 170 - - - -Costa Rica 4 857 274 - - 44 715 0 13 0 2 - -Dominican Republic 10 648 787 5 865 522 150 680 - 0 755 0 80 - -Ecuador 16 385 070 - - 284 640 0 1 191 - - - -El Salvador 6 344 720 - - 9 586 0 14 0 0 0 0French Guiana 268 054 148 309 24 741 - 0 258 - - - -Guatemala 16 582 465 12 518 434 2 262 362 - 0 4 854 - - - -Guyana 773 302 773 302 84 397 - 0 12 367 0 161 0 102
Annex 3 - G. Population at risk and reported malaria cases by place of care, 2016
WORLD MALARIA REPORT 2017134

WHO region Country/area
Population Public sector Private sector Community level
UN population At risk (low + high)
At risk (high)
Number of people living in active foci Presumed Confirmed Presumed Confirmed Presumed Confirmed
AFRICAN
Angola 28 813 475 28 813 475 28 813 475 - 506 893 3 794 253 - - - -Benin 10 872 305 10 872 305 10 872 305 - 50 153 1 324 576 199 975 215 172 6 062 71 042Botswana 2 250 256 1 491 882 94 790 - 2 716 0 7 - -Burkina Faso 18 646 436 18 646 436 18 646 436 - 6 668 9 779 154 - - 13 739 257Burundi 10 524 125 10 524 125 10 524 125 - 109 327 8 274 062 - - - 519 114Cabo Verde 539 559 - - 170 786 - 75 - - - -Cameroon 23 439 194 23 439 194 16 641 828 - 115 627 1 675 264 - - 23 970 18 738Central African Republic 4 594 618 4 594 618 4 594 618 - 367 762 1 032 764 73 552 206 553 - -Chad 14 452 545 14 294 354 9 734 495 - 107 447 1 294 768 - - - -Comoros 795 603 795 603 378 551 - 267 1 066 19 324 0 77Congo 5 125 827 5 125 827 5 125 827 - 202 405 171 847 - - - -Côte d'Ivoire 23 695 923 23 695 923 23 695 923 - 0 3 471 024 0 109 423 0 174 057Democratic Republic of the Congo 78 736 162 78 736 162 76 374 077 - 66 876 15 330 841 - - 0 1 490 289Equatorial Guinea 1 221 495 1 221 495 1 221 495 - 0 147 714 - - - -Eritrea 4 954 643 4 954 643 3 517 797 - 22 804 24 251 - - 33 395 0Ethiopia 102 403 200 69 634 175 27 853 670 - 244 492 1 718 504 - - - -Gabon 1 979 787 1 979 787 1 979 787 - 137 593 23 915 - - - -Gambia 2 038 507 2 038 507 2 038 507 - 1 682 153 774 0 2 742 0 6 223Ghana 28 206 727 28 206 727 28 206 727 - 5 913 100 4 535 167 1 209 430 893 812 109 249 0Guinea 12 395 916 12 395 916 12 395 916 - 0 992 146 0 17 445 6 507 130 677Guinea-Bissau 1 815 702 1 815 702 1 815 702 - 0 150 903 0 4 067 52 1 501Kenya 48 461 564 48 461 564 34 017 550 - 5 538 654 2 783 846 59 164 133 390 43 622 147 560Liberia 4 613 828 4 613 828 4 613 828 - 1 152 273 1 191 137 - - - -Madagascar 24 894 543 24 894 543 21 849 543 - 0 475 333 151 027 30 544 530 053 180 147Malawi 18 091 580 18 091 580 18 091 580 - 338 013 4 827 373 - - 452 086 513 303Mali 17 994 835 17 994 835 16 402 634 - 154 816 2 156 282 - - 0 154 816Mauritania 4 301 022 4 301 022 2 772 783 - 130 069 29 156 - - - -Mayotte 239 917 - - - 0 27 - - - -Mozambique 28 829 471 28 829 471 28 829 471 - 0 8 520 376 - - 682 468 1 170 497Namibia 2 479 711 1 968 260 1 144 661 - 0 25 198 - - - -Niger 20 672 980 20 672 980 20 672 980 - 908 226 4 148 167 0 0 0 109 943Nigeria 185 989 645 185 989 645 142 054 940 - 7 318 051 9 378 257 595 702 1 304 462 2 852 214 3 059 433Rwanda 11 917 511 11 917 511 11 917 511 - 0 3 380 568 - - - 1 345 009Sao Tome and Principe 199 909 199 909 199 909 - 0 2 238 - - - -Senegal 15 411 614 15 411 614 15 322 751 - 6 732 349 540 - - 2 161 75 750Sierra Leone 7 396 182 7 396 182 7 396 182 - 70 421 1 775 306 10 026 18 928 102 196 526 342South Africa 56 015 475 5 601 548 2 240 619 - 0 4 323 - - - -South Sudan1 12 230 730 12 230 730 12 230 730 - - 7 619 - - 185 168 136Swaziland 1 343 098 376 067 0 - 137 350 0 249 - -Togo 7 606 369 7 606 369 7 606 369 - 0 1 183 265 - - 0 562 969Uganda 41 487 969 41 487 969 41 487 969 - 6 732 294 9 385 132 229 699 350 717 - -United Republic of Tanzania 55 155 473 55 155 473 54 551 284 - 861 592 5 193 520 36 719 568 495 - -Mainland 53 594 890 53 594 890 53 594 890 - 861 592 5 188 505 36 719 567 164 - -
Zanzibar 1 560 583 1 560 583 956 394 - 0 5 015 0 1 331 - -Zambia 16 591 381 16 591 381 16 591 381 - 1 124 873 4 851 319 - - 0 85 348
Zimbabwe 16 150 357 12 717 224 4 621 593 - 865 279 988 - - 69 161 34 015
AMERICAS
Belize 366 954 - - 30 856 0 5 0 0 - -Bolivia (Plurinational State of) 10 887 879 4 939 515 272 023 - 0 5 553 - - - -Brazil 207 652 860 42 153 531 4 776 016 - 0 129 251 - - - -Colombia 48 653 432 10 771 432 4 888 697 - 0 63 170 - - - -Costa Rica 4 857 274 - - 44 715 0 13 0 2 - -Dominican Republic 10 648 787 5 865 522 150 680 - 0 755 0 80 - -Ecuador 16 385 070 - - 284 640 0 1 191 - - - -El Salvador 6 344 720 - - 9 586 0 14 0 0 0 0French Guiana 268 054 148 309 24 741 - 0 258 - - - -Guatemala 16 582 465 12 518 434 2 262 362 - 0 4 854 - - - -Guyana 773 302 773 302 84 397 - 0 12 367 0 161 0 102
WORLD MALARIA REPORT 2017 135

WHO region Country/area
Population Public sector Private sector Community level
UN population At risk (low + high)
At risk (high)
Number of people living in active foci Presumed Confirmed Presumed Confirmed Presumed Confirmed
AMERICAS
Haiti 10 847 338 9 691 229 2 629 265 - 0 21 998 0 203 0 261Honduras 9 112 865 8 254 451 2 322 660 - 0 4 338 0 134 - -Mexico 127 540 430 - - 293 619 0 596 0 6 - -Nicaragua 6 149 929 2 684 438 527 818 - 0 6 284 - - - -Panama 4 034 124 3 902 741 169 998 - 0 811 0 5 - -Peru 31 773 838 12 479 556 1 590 471 - 0 56 623 - - - -Suriname 558 360 82 470 23 710 - 0 327 - - - -Venezuela (Bolivarian Republic of) 31 568 183 10 774 694 2 678 623 - 0 242 561 - - - -
EASTERN MEDITERRANEAN
Afghanistan 34 656 027 26 713 178 9 436 212 - 111 255 139 087 - - 91 135 51 074Djibouti 942 344 471 172 0 - 0 13 804 - - - -Iran (Islamic Republic of) 80 277 430 - - 456 340 0 705 - - - -Pakistan 193 203 481 189 940 043 55 868 505 - 1 797 492 318 449 - - - -Saudi Arabia 32 275 689 - - 48 183 0 5 382 - - - -Somalia 14 317 989 14 317 989 7 287 472 - 22 393 35 628 - - - -Sudan 39 578 826 39 578 826 34 393 999 - 322 179 575 015 - - - -Yemen 27 584 209 21 485 364 6 912 881 - 45 927 98 701 553 999 - -
SOUTH-EAST ASIA
Bangladesh 162 951 549 17 521 528 2 058 078 - 0 4 787 0 276 0 22 674Bhutan 797 753 - - 31 516 0 74 0 14 - -Democratic People's Republic of Korea 25 368 619 - - 9 499 488 80 5 033 - - - -
India 1 324 171 357 1 237 304 392 160 639 200 - 0 1 090 724 - - - -Indonesia 261 115 454 261 115 454 16 696 505 - 0 218 450 - - - -Myanmar 52 885 215 31 476 064 8 361 470 - 0 36 742 0 3 030 0 70 374Nepal 28 982 772 8 413 061 1 514 785 - 9 678 1 009 - - - -Thailand 68 863 519 13 067 679 1 524 501 - 0 11 522 0 4 349 0 1 929Timor-Leste 1 268 667 215 332 87 810 - 1 94 - - 0 12
WESTERN PACIFIC
Cambodia 15 762 371 11 147 062 7 585 781 - 0 23 492 0 14 847 0 5 041China 1 411 415 363 - - 2 565 14 3 129 - - - -Lao People's Democratic Republic 6 758 354 3 516 617 3 516 615 - 530 11 223 0 576 0 4 742Malaysia 31 187 264 - - 12 565 0 2 302 0 47 - -Papua New Guinea 8 084 993 8 084 993 7 599 893 - 250 301 478 497 - - 21 337 56 322Philippines 103 320 224 60 002 187 7 041 273 - 10 6 680 - - - -Republic of Korea 50 791 925 - - - 0 673 0 673 - -Solomon Islands 599 426 593 432 593 432 - 30 082 54 431 - - - -Vanuatu 270 405 270 405 235 049 - 279 1 868 - - 0 384Viet Nam 94 569 066 69 696 341 6 428 340 - 6 285 4 161 - - - -
REGIONAL SUMMARY
African 975 577 169 885 786 562 749 142 318 170 786 32 190 114 113 845 104 2 565 313 3 856 330 5 112 103 10 377 243Americas 545 005 864 125 039 625 22 401 461 663 416 20 057 550 969 0 591 2 363Eastern Mediterranean 422 835 995 292 506 571 113 899 071 504 523 2 299 246 1 186 771 553 999 91 135 51 074South-East Asia 1 926 404 905 1 569 113 510 190 882 348 9 531 004 9 759 1 368 435 0 7 669 0 94 989Western Pacific 1 722 759 391 153 311 037 33 000 383 15 130 287 501 586 456 0 16 143 21 337 66 489Total 5 592 583 324 3 025 757 305 1 109 325 581 10 884 859 34 806 677 117 537 735 2 565 866 3 881 732 5 224 577 10 590 158
1 In May 2013, South Sudan was reassigned to the WHO African Region (WHA resolution 66.21, http://apps.who.int/gb/ebwha/pdf_files/WHA66/A66_R21-en.pdf)
Annex 3 - G. Population at risk and reported malaria cases by place of care, 2016
WORLD MALARIA REPORT 2017136

WHO region Country/area
Population Public sector Private sector Community level
UN population At risk (low + high)
At risk (high)
Number of people living in active foci Presumed Confirmed Presumed Confirmed Presumed Confirmed
AMERICAS
Haiti 10 847 338 9 691 229 2 629 265 - 0 21 998 0 203 0 261Honduras 9 112 865 8 254 451 2 322 660 - 0 4 338 0 134 - -Mexico 127 540 430 - - 293 619 0 596 0 6 - -Nicaragua 6 149 929 2 684 438 527 818 - 0 6 284 - - - -Panama 4 034 124 3 902 741 169 998 - 0 811 0 5 - -Peru 31 773 838 12 479 556 1 590 471 - 0 56 623 - - - -Suriname 558 360 82 470 23 710 - 0 327 - - - -Venezuela (Bolivarian Republic of) 31 568 183 10 774 694 2 678 623 - 0 242 561 - - - -
EASTERN MEDITERRANEAN
Afghanistan 34 656 027 26 713 178 9 436 212 - 111 255 139 087 - - 91 135 51 074Djibouti 942 344 471 172 0 - 0 13 804 - - - -Iran (Islamic Republic of) 80 277 430 - - 456 340 0 705 - - - -Pakistan 193 203 481 189 940 043 55 868 505 - 1 797 492 318 449 - - - -Saudi Arabia 32 275 689 - - 48 183 0 5 382 - - - -Somalia 14 317 989 14 317 989 7 287 472 - 22 393 35 628 - - - -Sudan 39 578 826 39 578 826 34 393 999 - 322 179 575 015 - - - -Yemen 27 584 209 21 485 364 6 912 881 - 45 927 98 701 553 999 - -
SOUTH-EAST ASIA
Bangladesh 162 951 549 17 521 528 2 058 078 - 0 4 787 0 276 0 22 674Bhutan 797 753 - - 31 516 0 74 0 14 - -Democratic People's Republic of Korea 25 368 619 - - 9 499 488 80 5 033 - - - -
India 1 324 171 357 1 237 304 392 160 639 200 - 0 1 090 724 - - - -Indonesia 261 115 454 261 115 454 16 696 505 - 0 218 450 - - - -Myanmar 52 885 215 31 476 064 8 361 470 - 0 36 742 0 3 030 0 70 374Nepal 28 982 772 8 413 061 1 514 785 - 9 678 1 009 - - - -Thailand 68 863 519 13 067 679 1 524 501 - 0 11 522 0 4 349 0 1 929Timor-Leste 1 268 667 215 332 87 810 - 1 94 - - 0 12
WESTERN PACIFIC
Cambodia 15 762 371 11 147 062 7 585 781 - 0 23 492 0 14 847 0 5 041China 1 411 415 363 - - 2 565 14 3 129 - - - -Lao People's Democratic Republic 6 758 354 3 516 617 3 516 615 - 530 11 223 0 576 0 4 742Malaysia 31 187 264 - - 12 565 0 2 302 0 47 - -Papua New Guinea 8 084 993 8 084 993 7 599 893 - 250 301 478 497 - - 21 337 56 322Philippines 103 320 224 60 002 187 7 041 273 - 10 6 680 - - - -Republic of Korea 50 791 925 - - - 0 673 0 673 - -Solomon Islands 599 426 593 432 593 432 - 30 082 54 431 - - - -Vanuatu 270 405 270 405 235 049 - 279 1 868 - - 0 384Viet Nam 94 569 066 69 696 341 6 428 340 - 6 285 4 161 - - - -
REGIONAL SUMMARY
African 975 577 169 885 786 562 749 142 318 170 786 32 190 114 113 845 104 2 565 313 3 856 330 5 112 103 10 377 243Americas 545 005 864 125 039 625 22 401 461 663 416 20 057 550 969 0 591 2 363Eastern Mediterranean 422 835 995 292 506 571 113 899 071 504 523 2 299 246 1 186 771 553 999 91 135 51 074South-East Asia 1 926 404 905 1 569 113 510 190 882 348 9 531 004 9 759 1 368 435 0 7 669 0 94 989Western Pacific 1 722 759 391 153 311 037 33 000 383 15 130 287 501 586 456 0 16 143 21 337 66 489Total 5 592 583 324 3 025 757 305 1 109 325 581 10 884 859 34 806 677 117 537 735 2 565 866 3 881 732 5 224 577 10 590 158
1 In May 2013, South Sudan was reassigned to the WHO African Region (WHA resolution 66.21, http://apps.who.int/gb/ebwha/pdf_files/WHA66/A66_R21-en.pdf)
WORLD MALARIA REPORT 2017 137

WHO region Country/area 2010 2011 2012 2013 2014 2015 2016
AFRICAN
Algeria
Presumed and confirmed 408 191 887 603 266 747 432Microscopy examined 12 224 11 974 15 790 12 762 8 690 8 000 6 628Confirmed with microscopy 408 191 887 603 266 747 432RDT examined - - - - - 0 -Confirmed with RDT - - - - - 0 -Imported cases 396 187 828 587 260 727 420
Angola
Presumed and confirmed 3 687 574 3 501 953 3 031 546 3 144 100 3 180 021 3 254 270 4 301 146Microscopy examined 1 947 349 1 765 933 2 245 223 3 025 258 3 398 029 3 345 693 4 183 727Confirmed with microscopy 1 324 264 1 147 473 1 056 563 1 462 941 1 431 313 1 396 773 2 058 128RDT examined 639 476 833 753 1 069 483 1 103 815 1 855 400 3 009 305 2 959 282Confirmed with RDT 358 606 484 809 440 271 536 927 867 666 1 372 532 1 736 125Imported cases - - - - - - -
Benin
Presumed and confirmed 1 432 095 1 424 335 1 513 212 1 670 273 1 509 221 1 495 375 1 374 729Microscopy examined - 88 134 243 008 291 479 155 205 296 264 267 405Confirmed with microscopy - 68 745 - 99 368 108 714 108 061 104 601RDT examined - 475 986 825 005 1 158 526 1 335 582 1 486 667 1 500 047Confirmed with RDT - 354 223 705 839 979 466 935 521 1 160 286 1 219 975Imported cases - - - - - - -
Botswana
Presumed and confirmed 12 196 1 141 308 506 1 485 340 718Microscopy examined - - - - - - 5 178Confirmed with microscopy 1 046 432 - - - - -RDT examined - - - - - 1 284 7 806Confirmed with RDT - - 193 456 1 346 326 716Imported cases - - - 30 30 48 64
Burkina Faso
Presumed and confirmed 5 723 481 5 024 697 6 970 700 7 146 026 8 278 408 8 286 453 9 785 822Microscopy examined 177 879 400 005 223 372 183 971 198 947 222 190 191 208Confirmed with microscopy 88 540 83 857 90 089 82 875 83 259 92 589 80 077RDT examined 940 985 450 281 4 516 273 4 296 350 6 224 055 8 290 188 11 794 810Confirmed with RDT 715 999 344 256 3 767 957 3 686 176 5 345 396 6 922 857 9 699 077Imported cases - - - - - - -
Burundi
Presumed and confirmed 4 255 301 3 298 979 2 570 754 4 469 007 4 831 758 5 243 410 8 383 389Microscopy examined 2 825 558 2 859 720 2 659 372 4 123 012 4 471 998 3 254 670 3 941 251Confirmed with microscopy 1 599 908 1 485 332 1 484 676 2 366 134 2 718 391 1 964 862 2 520 622RDT examined 273 324 181 489 1 148 965 2 933 869 2 903 679 5 076 107 8 307 007Confirmed with RDT 163 539 86 542 666 400 1 775 253 1 866 882 3 194 844 5 753 440Imported cases - - - - - - -
Cabo Verde
Presumed and confirmed 47 36 36 46 46 28 75Microscopy examined - - 8 715 10 621 6 894 3 117 8 393Confirmed with microscopy 47 - 36 46 46 28 75RDT examined - 26 508 - - - 6 620 8 906Confirmed with RDT - 36 - - 46 28 75Imported cases - 29 35 24 20 21 27
Cameroon
Presumed and confirmed 1 845 691 1 829 266 1 589 317 1 824 633 1 369 518 2 321 933 1 790 891Microscopy examined - 1 110 308 1 182 610 1 236 306 1 086 095 1 024 306 1 373 802Confirmed with microscopy - - - - - 592 351 810 367RDT examined - 120 466 93 392 591 670 1 254 293 1 128 818 1 740 375Confirmed with RDT - - - - - 570 433 864 897Imported cases - - - - - - -
Central African Republic
Presumed and confirmed 66 484 221 980 459 999 407 131 495 238 953 535 1 400 526Microscopy examined - - - 63 695 55 943 139 241 189 481Confirmed with microscopy - - - 36 943 41 436 106 524 144 924RDT examined - - 55 746 136 548 369 208 724 303 1 249 963Confirmed with RDT - - 46 759 79 357 253 652 492 309 887 840Imported cases - - - - - - -
Annex 3 - H. Reported malaria cases by method of confirmation, 2010–2016
WORLD MALARIA REPORT 2017138

WHO region Country/area 2010 2011 2012 2013 2014 2015 2016
AFRICAN
Chad
Presumed and confirmed 544 243 528 454 660 575 1 272 841 1 513 772 1 490 556 1 402 215Microscopy examined 89 749 - 69 789 - - - 1 063 293Confirmed with microscopy 75 342 86 348 - 206 082 160 260 149 574 720 765RDT examined 309 927 114 122 - 621 469 1 137 455 937 775 861 561Confirmed with RDT 125 106 94 778 - 548 483 753 772 637 472 574 003Imported cases - - - - - - -
Comoros
Presumed and confirmed 103 670 76 661 65 139 62 565 2 465 1 517 1 333Microscopy examined 87 595 63 217 125 030 154 824 93 444 89 634 71 902Confirmed with microscopy 35 199 22 278 45 507 46 130 1 987 963 559RDT examined 5 249 20 226 27 714 21 546 9 839 11 479 22 219Confirmed with RDT 1 339 2 578 4 333 7 026 216 337 507Imported cases - - - - - - -
Congo
Presumed and confirmed 446 656 277 263 120 319 183 026 248 159 264 574 374 252Microscopy examined - - - 69 375 88 764 87 547 202 922Confirmed with microscopy - 37 744 120 319 43 232 54 523 51 529 134 612RDT examined - - - 0 19 746 0 60 927Confirmed with RDT - - - 0 11 800 0 37 235Imported cases - - - - - - -
Côte d'Ivoire
Presumed and confirmed 1 721 461 2 588 004 2 795 919 4 708 425 4 658 774 3 606 725 3 471 024Microscopy examined - 49 828 195 546 395 914 568 562 811 426 975 507Confirmed with microscopy 62 726 29 976 107 563 215 104 306 926 478 870 579 566RDT examined - - 1 572 785 3 384 765 4 904 066 4 174 097 4 202 868Confirmed with RDT - - 1 033 064 2 291 849 3 405 905 2 897 034 2 891 458Imported cases - - - - - - -
Democratic Republic of the Congo
Presumed and confirmed 9 252 959 9 442 144 9 128 398 11 363 817 9 968 983 11 627 473 15 397 717Microscopy examined 3 678 849 4 226 533 4 329 318 4 126 129 3 533 165 2 877 585 2 810 067Confirmed with microscopy 2 374 930 2 700 818 2 656 864 2 611 478 2 126 554 1 902 640 1 847 143RDT examined 54 728 2 912 088 3 327 071 6 096 993 11 114 215 13 574 891 18 630 636Confirmed with RDT 42 850 1 861 163 2 134 734 4 103 745 7 842 429 9 724 833 13 483 698Imported cases - - - - - - -
Equatorial Guinea
Presumed and confirmed 78 095 37 267 20 890 25 162 20 417 15 142 147 714Microscopy examined 42 585 23 004 33 245 27 039 47 322 21 831 239 938Confirmed with microscopy 39 636 20 601 13 196 11 235 17 685 8 564 125 623RDT examined 16 772 2 899 6 826 5 489 9 807 46 227 78 841Confirmed with RDT 14 177 1 865 1 973 1 894 2 732 6 578 22 091Imported cases - - - - - - -
Eritrea
Presumed and confirmed 53 750 39 567 42 178 34 678 35 725 24 310 47 055Microscopy examined 79 024 67 190 84 861 81 541 63 766 59 268 83 599Confirmed with microscopy 13 894 15 308 11 557 10 890 10 993 8 332 24 251RDT examined - 25 570 33 758 39 281 53 032 47 744 -Confirmed with RDT 22 088 19 540 10 258 10 427 19 775 11 040 -Imported cases - - - - - - -
Ethiopia
Presumed and confirmed 4 068 764 3 549 559 3 876 745 3 316 013 2 513 863 2 174 707 1 962 996Microscopy examined 2 509 543 3 418 719 3 778 479 8 573 335 7 062 717 5 679 932 6 367 309Confirmed with microscopy 1 158 197 1 480 306 1 692 578 2 645 454 2 118 815 1 867 059 1 718 504RDT examined - - - - - - -Confirmed with RDT - - - - - - -Imported cases - - - - - - -
Gabon
Presumed and confirmed 185 105 178 822 188 089 185 196 185 996 217 287 161 508Microscopy examined 54 714 - 66 018 90 185 90 275 79 308 62 658Confirmed with microscopy 12 816 - 18 694 26 432 27 687 20 390 22 419RDT examined 7 887 - 4 129 10 132 11 812 12 761 2 738Confirmed with RDT 1 120 - 1 059 2 550 4 213 3 477 1 496Imported cases - - - - - - -
WORLD MALARIA REPORT 2017 139

WHO region Country/area 2010 2011 2012 2013 2014 2015 2016
AFRICAN
Gambia
Presumed and confirmed 194 009 261 967 300 363 279 829 166 229 249 437 155 456Microscopy examined 290 842 172 241 156 580 236 329 286 111 272 604 165 793Confirmed with microscopy 52 245 71 588 29 325 65 666 66 253 49 649 26 397RDT examined 123 564 - 705 862 614 128 317 313 609 852 677 346Confirmed with RDT 64 108 190 379 271 038 175 126 99 976 190 733 127 377Imported cases - - - - - - -
Ghana
Presumed and confirmed 3 849 536 4 154 261 10 676 731 7 200 797 8 453 557 10 186 510 10 448 267Microscopy examined 2 031 674 1 172 838 4 219 097 1 394 249 1 987 959 2 023 581 2 594 918Confirmed with microscopy 1 029 384 624 756 2 971 699 721 898 970 448 934 304 1 189 012RDT examined 247 278 781 892 1 438 284 1 488 822 3 610 453 5 478 585 5 532 416Confirmed with RDT 42 253 416 504 783 467 917 553 2 445 464 3 385 615 3 346 155Imported cases - - - - - - -
Guinea
Presumed and confirmed 1 092 554 1 189 016 1 220 574 775 341 1 595 828 895 016 992 146Microscopy examined - 43 549 - - 116 767 78 377 79 233Confirmed with microscopy 20 936 5 450 191 421 63 353 82 818 52 211 53 805RDT examined - 139 066 - - - 1 092 523 1 423 802Confirmed with RDT - 90 124 125 779 147 904 577 389 758 768 938 341Imported cases - - - - - - -
Guinea-Bissau
Presumed and confirmed 140 143 174 986 129 684 132 176 98 952 142 309 150 903Microscopy examined 48 799 57 698 61 048 58 909 106 882 123 810 146 708Confirmed with microscopy 30 239 21 320 23 547 17 733 35 546 45 789 53 014RDT examined 56 455 139 531 97 047 102 079 197 536 261 868 234 488Confirmed with RDT 20 152 50 662 26 834 36 851 57 885 96 520 97 889Imported cases - - - - - - -
Kenya
Presumed and confirmed 6 071 583 11 120 812 9 335 951 9 750 953 9 655 905 7 676 980 8 322 500Microscopy examined 2 384 402 3 009 051 4 836 617 6 606 885 7 444 865 7 772 329 6 167 609Confirmed with microscopy 898 531 1 002 805 1 426 719 2 060 608 2 415 950 1 025 508 1 569 045RDT examined - - 164 424 655 285 850 884 1 965 661 3 588 676Confirmed with RDT - - 26 752 274 678 392 981 473 519 1 214 801Imported cases - - - - - - -
Liberia
Presumed and confirmed 2 675 816 2 480 748 1 800 372 1 483 676 1 066 107 1 781 092 2 343 410Microscopy examined 335 973 728 443 772 362 818 352 1 318 801 509 062 649 096Confirmed with microscopy 212 927 577 641 507 967 496 269 302 708 305 981 381 781RDT examined 998 043 1 593 676 1 276 521 1 144 405 912 382 947 048 1 304 021Confirmed with RDT 709 246 1 338 121 899 488 747 951 561 496 625 105 809 356Imported cases - - - - - - -
Madagascar
Presumed and confirmed 293 910 255 814 395 149 385 598 433 101 752 176 475 333Microscopy examined 24 393 34 813 38 453 42 573 37 362 39 604 33 085Confirmed with microscopy 2 173 3 447 3 667 4 947 3 853 4 748 3 734RDT examined 604 114 739 572 906 080 1 026 110 926 998 1 488 667 1 496 990Confirmed with RDT 200 277 221 051 355 753 380 651 374 110 739 355 471 599Imported cases - - - - 712 1 167 1 212
Malawi
Presumed and confirmed 6 851 108 5 338 701 4 922 596 3 906 838 5 065 703 4 933 416 5 165 386Microscopy examined - 119 996 406 907 132 475 198 534 216 643 240 212Confirmed with microscopy - 50 526 283 138 44 501 77 635 75 923 96 538RDT examined - 580 708 2 763 986 3 029 020 5 344 724 7 030 084 8 661 237Confirmed with RDT - 253 973 1 281 846 1 236 391 2 827 675 3 585 315 4 730 835Imported cases - - - - - - -
Mali
Presumed and confirmed 2 171 542 1 961 070 2 171 739 2 327 385 2 590 643 3 317 001 2 311 098Microscopy examined - - - - - - -Confirmed with microscopy - - 97 995 190 337 219 637 243 151 235 212RDT examined 1 380 178 974 558 - 1 889 286 - 3 389 449 3 408 254Confirmed with RDT 227 482 307 035 788 487 1 176 881 1 820 216 2 052 460 1 921 070Imported cases - - - - - - -
Annex 3 - H. Reported malaria cases by method of confirmation, 2010–2016
WORLD MALARIA REPORT 2017140

WHO region Country/area 2010 2011 2012 2013 2014 2015 2016
AFRICAN
Mauritania
Presumed and confirmed 244 319 154 003 169 104 128 486 172 326 181 562 159 225Microscopy examined 5 449 3 752 1 865 5 510 - - -Confirmed with microscopy 909 1 130 255 957 - - -RDT examined 2 299 7 991 3 293 3 576 47 500 60 253 50 788Confirmed with RDT 1 085 1 796 1 633 630 15 835 22 631 29 156Imported cases - - - - - - -
Mayotte
Presumed and confirmed 396 92 72 82 15 - 27Microscopy examined 2 023 1 214 1 463 - - - -Confirmed with microscopy 396 92 72 82 15 - 27RDT examined - - - - - - -Confirmed with RDT - - - - - - -Imported cases 236 51 47 71 14 - 10
Mozambique
Presumed and confirmed 3 381 371 3 344 413 3 203 338 3 924 832 7 117 648 7 718 782 8 520 376Microscopy examined 1 950 933 2 504 720 2 546 213 2 058 998 2 295 823 2 313 129 1 886 154Confirmed with microscopy 644 568 1 093 742 886 143 774 891 1 009 496 735 750 674 697RDT examined 2 287 536 2 966 853 2 234 994 5 215 893 9 944 222 11 928 263 13 567 501Confirmed with RDT 878 009 663 132 927 841 2 223 983 6 108 152 6 983 032 7 845 679Imported cases - - - - - - -
Namibia
Presumed and confirmed 25 889 14 406 3 163 4 911 15 914 12 168 25 198Microscopy examined 14 522 13 262 7 875 1 507 1 894 1 471 1 778Confirmed with microscopy 556 335 194 136 222 118 329RDT examined - 48 599 - 32 495 185 078 207 612 308 414Confirmed with RDT - 1 525 - 4 775 15 692 12 050 24 869Imported cases - - - - - 2 888 3 980
Niger
Presumed and confirmed 3 643 803 3 157 482 4 592 519 4 288 425 3 222 613 3 817 634 5 056 393Microscopy examined 165 514 130 658 1 781 505 1 799 299 2 872 710 295 229 3 198 194Confirmed with microscopy 49 285 68 529 1 119 929 1 176 711 0 206 660 2 120 515RDT examined 7 426 774 1 130 514 1 781 505 1 799 299 2 872 710 2 657 057 3 066 101Confirmed with RDT 570 773 712 347 1 119 929 1 176 711 1 953 309 2 065 340 2 027 652Imported cases - - - - - - -
Nigeria
Presumed and confirmed 3 873 463 4 306 945 6 938 519 12 830 911 16 512 127 14 732 621 16 696 308Microscopy examined - 672 185 1 953 399 1 633 960 1 681 469 851 183 929 728Confirmed with microscopy 523 513 - - - 1 233 654 569 036 636 599RDT examined 45 924 242 526 2 898 052 7 194 960 9 188 933 8 655 024 11 908 534Confirmed with RDT 27 674 - - - 6 593 300 6 281 746 8 741 658Imported cases - - - - - - -
Rwanda
Presumed and confirmed 638 669 208 858 483 470 962 618 1 610 812 2 505 794 3 380 568Microscopy examined 2 708 973 1 602 271 2 904 793 2 862 877 4 010 202 5 811 267 6 603 261Confirmed with microscopy 638 669 208 858 422 224 879 316 1 528 825 2 354 400 2 916 902RDT examined - - 190 593 201 708 168 004 281 847 898 913Confirmed with RDT - - 61 246 83 302 81 987 151 394 463 666Imported cases - - - - - - -
Sao Tome and Principe
Presumed and confirmed 3 346 8 442 12 550 9 243 1 754 2 058 2 238Microscopy examined 48 366 83 355 103 773 73 866 33 355 11 941 3 658Confirmed with microscopy 2 233 6 373 10 706 6 352 569 140 35RDT examined 9 989 33 924 23 124 34 768 58 090 72 407 117 676Confirmed with RDT 507 2 069 1 844 2 891 1 185 1 918 2 203Imported cases - - - - - 2 4
Senegal
Presumed and confirmed 707 772 604 290 634 106 772 222 628 642 502 084 356 272Microscopy examined 27 793 18 325 19 946 24 205 19 343 26 556 38 748Confirmed with microscopy 17 750 14 142 15 612 20 801 12 636 17 846 9 918RDT examined 651 737 555 614 524 971 668 562 697 175 1 384 834 1 513 574Confirmed with RDT 325 920 263 184 265 468 325 088 252 988 474 407 339 622Imported cases - - - - - 352 1 905
WORLD MALARIA REPORT 2017 141

WHO region Country/area 2010 2011 2012 2013 2014 2015 2016
AFRICAN
Sierra Leone
Presumed and confirmed 934 028 856 332 1 945 859 1 715 851 1 898 852 1 569 606 1 845 727Microscopy examined 718 473 46 280 194 787 185 403 66 277 75 025 120 917Confirmed with microscopy 218 473 25 511 104 533 76 077 39 414 37 820 60 458RDT examined 1 609 455 886 994 1 975 972 2 377 254 2 056 722 2 176 042 2 805 621Confirmed with RDT 715 555 613 348 1 432 789 1 625 881 1 335 062 1 445 556 1 714 848Imported cases - - - - - - -
South Africa
Presumed and confirmed 8 060 9 866 6 846 8 851 13 988 8 976 4 323Microscopy examined - 178 387 121 291 364 021 300 291 13 917 20 653Confirmed with microscopy 3 787 5 986 1 632 2 572 4 101 785 1 219RDT examined 276 669 204 047 30 053 239 705 240 622 17 446 42 624Confirmed with RDT 4 273 3 880 3 997 6 073 7 604 3 572 3 104Imported cases - - - - - 3 568 3 075
South Sudan1
Presumed and confirmed 900 283 795 784 1 125 039 1 855 501 2 433 991 3 789 475 7 619Microscopy examined - - - - 27 321 22 721 6 954Confirmed with microscopy 900 283 112 024 225 371 262 520 18 344 11 272 2 357RDT examined - - - - 102 538 26 507 10 751Confirmed with RDT - - - - 53 033 13 099 5 262Imported cases - - - - - - -
Swaziland
Presumed and confirmed 1 722 797 626 962 711 651 487Microscopy examined - - - - - - 1 249Confirmed with microscopy 87 130 345 488 711 43 141RDT examined - - - - - - -Confirmed with RDT 181 419 217 474 - 152 209Imported cases - 170 153 234 322 282 221
Togo
Presumed and confirmed 983 430 519 450 768 287 882 430 1 130 251 1 113 928 1 183 265Microscopy examined 478 354 502 977 579 507 560 096 621 119 621 119 435 164Confirmed with microscopy 224 087 237 305 260 535 272 855 310 207 305 727 231 819RDT examined 575 245 390 611 660 627 882 475 1 135 581 1 135 581 1 410 290Confirmed with RDT 393 014 282 145 436 839 609 575 820 044 808 200 951 446Imported cases - - - - - - -
Uganda
Presumed and confirmed 13 208 169 12 173 358 13 591 932 16 541 563 13 724 345 13 421 804 16 117 426Microscopy examined 3 705 284 385 928 3 466 571 3 718 588 2 048 185 3 684 722 4 492 090Confirmed with microscopy 1 581 160 134 726 1 413 149 1 502 362 578 289 1 248 576 1 542 091RDT examined - 194 819 2 449 526 7 387 826 7 060 545 12 126 996 17 473 299Confirmed with RDT - 97 147 1 249 109 - 3 053 650 5 889 086 7 843 041Imported cases - - - - - - -
United Republic of Tanzania
Presumed and confirmed 12 893 535 10 164 967 8 477 435 8 585 482 7 403 562 7 746 258 6 055 112Microscopy examined 3 637 659 5 656 907 6 931 025 6 804 085 - - -Confirmed with microscopy 1 277 024 1 813 179 1 772 062 1 481 275 - - -RDT examined 136 123 1 628 092 1 091 615 813 103 - - -Confirmed with RDT 1 974 337 582 214 893 71 169 - - -Imported cases - - - 719 1 583 2 550 -
Mainland
Presumed and confirmed 12 819 192 10 160 478 8 474 278 8 582 934 7 399 316 7 741 816 6 050 097Microscopy examined 3 573 710 5 513 619 6 784 639 6 720 141 592 320 532 118 1 285 720Confirmed with microscopy 1 276 660 1 812 704 1 771 388 1 480 791 571 598 411 741 1 261 650RDT examined - 1 315 662 701 477 369 444 17 566 750 16 416 675 15 379 517Confirmed with RDT - 333 568 212 636 69 459 106 609 3 827 749 3 926 855Imported cases - - - - - - -
Zanzibar
Presumed and confirmed 74 343 4 489 3 157 2 548 4 246 4 442 5 015Microscopy examined 63 949 143 288 146 386 83 944 134 810 141 105 100 669Confirmed with microscopy 364 475 674 484 691 961 1 029RDT examined 136 123 312 430 390 138 443 659 173 457 203 624 159 192Confirmed with RDT 1 974 4 014 2 257 1 710 1 119 2 281 3 986Imported cases - - - 719 1 583 2 550 -
Annex 3 - H. Reported malaria cases by method of confirmation, 2010–2016
WORLD MALARIA REPORT 2017142

WHO region Country/area 2010 2011 2012 2013 2014 2015 2016
AFRICAN
Zambia
Presumed and confirmed 4 229 839 4 607 908 4 695 400 5 465 122 5 972 933 5 094 123 5 976 192Microscopy examined - - - - - - -Confirmed with microscopy - - - - - - -RDT examined - - - - 5 964 354 7 207 500 8 502 989Confirmed with RDT - - - - 4 077 547 4 184 661 4 851 319Imported cases - - - - - - -
Zimbabwe
Presumed and confirmed 648 965 319 935 276 963 422 633 535 983 391 651 280 853Microscopy examined - 10 004 - - - - -Confirmed with microscopy - - - - - - -RDT examined 513 032 470 007 727 174 1 115 005 1 420 894 1 384 893 1 223 509Confirmed with RDT 249 379 319 935 276 963 422 633 535 931 391 651 279 988Imported cases - - - - - 180 358
AMERICAS
Argentina
Presumed and confirmed 72 18 4 4 4 1 1Microscopy examined 2 547 7 872 7 027 4 913 5 691 3 005 2 277Confirmed with microscopy 72 18 4 4 4 1 1RDT examined - - - 0 0 0 0Confirmed with RDT - - - 0 0 0 0Imported cases 46 18 4 4 4 1 1
Belize
Presumed and confirmed 150 79 37 26 19 13 5Microscopy examined 27 366 22 996 20 789 25 351 24 122 26 367 20 936Confirmed with microscopy 150 79 37 26 19 13 5RDT examined - - - - - - -Confirmed with RDT - - - - - - -Imported cases - 7 4 4 0 4 1
Bolivia (Plurinational State of)
Presumed and confirmed 13 769 7 143 7 415 7 342 7 401 6 907 5 553Microscopy examined 133 463 143 272 121 944 133 260 124 900 159 167 155 407Confirmed with microscopy 12 252 6 108 6 293 6 272 7 401 6 907 5 553RDT examined 7 394 7 390 10 960 10 789 - - -Confirmed with RDT 1 517 1 035 1 122 1 070 - - -Imported cases - - - - - 33 11
Brazil
Presumed and confirmed 334 668 267 146 242 758 178 546 144 130 143 161 129 251Microscopy examined 2 711 432 2 476 335 2 325 775 1 873 518 1 744 640 1 573 542 1 341 669Confirmed with microscopy 334 667 266 713 237 978 174 048 142 746 139 843 124 217RDT examined - 1 486 23 566 19 500 11 820 16 865 23 273Confirmed with RDT - 433 4 780 3 719 1 384 3 318 5 034Imported cases - - - 8 905 4 847 4 935 5 070
Colombia
Presumed and confirmed 117 650 64 436 60 179 51 722 40 768 55 866 83 227Microscopy examined 521 342 396 861 346 599 284 332 325 713 316 451 242 973Confirmed with microscopy 117 637 60 121 50 938 44 293 36 166 48 059 57 515RDT examined - 21 171 70 168 42 723 77 819 11 983 53 118Confirmed with RDT 13 4 188 9 241 7 403 4 602 3 535 5 655Imported cases - - - - - 532 618
Costa Rica
Presumed and confirmed 114 17 8 6 6 8 13Microscopy examined 15 599 10 690 7 485 16 774 4 420 7 373 5 160Confirmed with microscopy 114 17 8 6 6 8 13RDT examined - - - 0 0 0 0Confirmed with RDT - - - 0 0 0 0Imported cases 4 6 1 4 5 8 9
Dominican Republic
Presumed and confirmed 3 414 1 616 952 579 496 661 755Microscopy examined 469 052 421 405 415 808 431 683 362 304 316 947 280 124Confirmed with microscopy 2 482 1 616 952 579 496 661 755RDT examined 26 585 56 150 90 775 71 000 54 425 50 220 92 650Confirmed with RDT 932 - - - - - -Imported cases - - - 105 37 30 65
WORLD MALARIA REPORT 2017 143
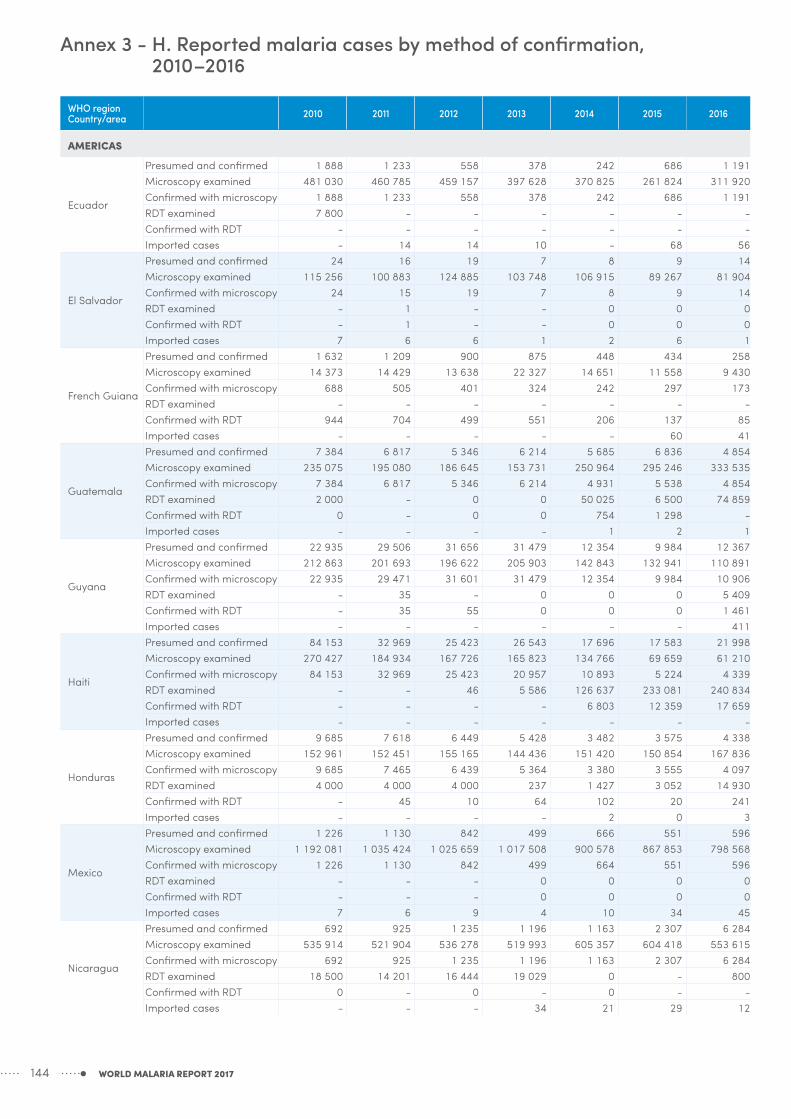
WHO region Country/area 2010 2011 2012 2013 2014 2015 2016
AMERICAS
Ecuador
Presumed and confirmed 1 888 1 233 558 378 242 686 1 191Microscopy examined 481 030 460 785 459 157 397 628 370 825 261 824 311 920Confirmed with microscopy 1 888 1 233 558 378 242 686 1 191RDT examined 7 800 - - - - - -Confirmed with RDT - - - - - - -Imported cases - 14 14 10 - 68 56
El Salvador
Presumed and confirmed 24 16 19 7 8 9 14Microscopy examined 115 256 100 883 124 885 103 748 106 915 89 267 81 904Confirmed with microscopy 24 15 19 7 8 9 14RDT examined - 1 - - 0 0 0Confirmed with RDT - 1 - - 0 0 0Imported cases 7 6 6 1 2 6 1
French Guiana
Presumed and confirmed 1 632 1 209 900 875 448 434 258Microscopy examined 14 373 14 429 13 638 22 327 14 651 11 558 9 430Confirmed with microscopy 688 505 401 324 242 297 173RDT examined - - - - - - -Confirmed with RDT 944 704 499 551 206 137 85Imported cases - - - - - 60 41
Guatemala
Presumed and confirmed 7 384 6 817 5 346 6 214 5 685 6 836 4 854Microscopy examined 235 075 195 080 186 645 153 731 250 964 295 246 333 535Confirmed with microscopy 7 384 6 817 5 346 6 214 4 931 5 538 4 854RDT examined 2 000 - 0 0 50 025 6 500 74 859Confirmed with RDT 0 - 0 0 754 1 298 -Imported cases - - - - 1 2 1
Guyana
Presumed and confirmed 22 935 29 506 31 656 31 479 12 354 9 984 12 367Microscopy examined 212 863 201 693 196 622 205 903 142 843 132 941 110 891Confirmed with microscopy 22 935 29 471 31 601 31 479 12 354 9 984 10 906RDT examined - 35 - 0 0 0 5 409Confirmed with RDT - 35 55 0 0 0 1 461Imported cases - - - - - - 411
Haiti
Presumed and confirmed 84 153 32 969 25 423 26 543 17 696 17 583 21 998Microscopy examined 270 427 184 934 167 726 165 823 134 766 69 659 61 210Confirmed with microscopy 84 153 32 969 25 423 20 957 10 893 5 224 4 339RDT examined - - 46 5 586 126 637 233 081 240 834Confirmed with RDT - - - - 6 803 12 359 17 659Imported cases - - - - - - -
Honduras
Presumed and confirmed 9 685 7 618 6 449 5 428 3 482 3 575 4 338Microscopy examined 152 961 152 451 155 165 144 436 151 420 150 854 167 836Confirmed with microscopy 9 685 7 465 6 439 5 364 3 380 3 555 4 097RDT examined 4 000 4 000 4 000 237 1 427 3 052 14 930Confirmed with RDT - 45 10 64 102 20 241Imported cases - - - - 2 0 3
Mexico
Presumed and confirmed 1 226 1 130 842 499 666 551 596Microscopy examined 1 192 081 1 035 424 1 025 659 1 017 508 900 578 867 853 798 568Confirmed with microscopy 1 226 1 130 842 499 664 551 596RDT examined - - - 0 0 0 0Confirmed with RDT - - - 0 0 0 0Imported cases 7 6 9 4 10 34 45
Nicaragua
Presumed and confirmed 692 925 1 235 1 196 1 163 2 307 6 284Microscopy examined 535 914 521 904 536 278 519 993 605 357 604 418 553 615Confirmed with microscopy 692 925 1 235 1 196 1 163 2 307 6 284RDT examined 18 500 14 201 16 444 19 029 0 - 800Confirmed with RDT 0 - 0 - 0 - -Imported cases - - - 34 21 29 12
Annex 3 - H. Reported malaria cases by method of confirmation, 2010–2016
WORLD MALARIA REPORT 2017144

WHO region Country/area 2010 2011 2012 2013 2014 2015 2016
AMERICAS
Panama
Presumed and confirmed 418 354 844 705 874 562 811Microscopy examined 141 038 116 588 107 711 93 624 80 701 64 511 50 772Confirmed with microscopy 418 354 844 705 874 562 811RDT examined - 0 0 0 0 0 0Confirmed with RDT - 0 0 0 0 0 0Imported cases - - - 9 10 16 42
Paraguay
Presumed and confirmed 27 10 15 11 8 8 11Microscopy examined 62 178 48 611 31 499 24 806 24 832 9 157 3 191Confirmed with microscopy 27 10 15 11 8 8 10RDT examined - - - - - 0 1Confirmed with RDT - - - - - 0 1Imported cases 9 9 15 11 8 8 10
Peru
Presumed and confirmed 31 546 25 039 31 436 48 719 65 252 63 865 56 623Microscopy examined 744 627 702 894 758 723 863 790 864 413 865 980 566 230Confirmed with microscopy 31 545 25 005 31 436 48 719 65 252 61 865 56 623RDT examined 23 58 562 858 1 634 0 -Confirmed with RDT 1 34 - - - - -Imported cases - - - - 0 0 0
Suriname
Presumed and confirmed 1 771 795 569 729 729 376 327Microscopy examined 16 533 15 135 17 464 13 693 17 608 15 083 14 946Confirmed with microscopy 1 574 751 306 530 98 345 315RDT examined 541 1 025 4 008 6 043 15 489 153 8 498Confirmed with RDT 138 20 50 199 303 31 12Imported cases - - - 204 - 274 251
Venezuela (Bolivarian Republic of)
Presumed and confirmed 45 155 45 824 52 803 78 643 91 918 137 996 242 561Microscopy examined 400 495 382 303 410 663 476 764 522 617 625 174 852 556Confirmed with microscopy 45 155 45 824 52 803 78 643 91 918 137 996 242 561RDT examined - - - - - - 80 000Confirmed with RDT - - - - - - -Imported cases - - - 1 677 1 210 1 594 1 948
EASTERN MEDITERRANEAN
Afghanistan
Presumed and confirmed 392 463 482 748 391 365 319 742 290 079 350 044 392 551Microscopy examined 524 523 531 053 511 408 507 145 514 466 538 789 598 556Confirmed with microscopy 69 397 77 549 54 840 39 263 61 362 86 895 100 456RDT examined - 0 0 0 - - 94 975Confirmed with RDT - 0 0 0 - - 38 631Imported cases - - - - - - -
Djibouti
Presumed and confirmed 1 010 230 27 1 684 9 439 9 557 13 804Microscopy examined - 124 1 410 7 189 39 284 10 502 19 492Confirmed with microscopy 1 010 - 22 1 684 9 439 1 764 2 280RDT examined - - - - - - -Confirmed with RDT - - 3 - - 7 709 11 524Imported cases - - - - - - -
Iran (Islamic Republic of)
Presumed and confirmed 3 031 3 239 1 629 1 373 1 243 799 705Microscopy examined 614 817 530 470 479 655 385 172 468 513 610 337 418 125Confirmed with microscopy 3 031 3 239 1 629 1 373 1 243 799 705RDT examined - - 0 - - - -Confirmed with RDT - - 0 - - - -Imported cases 1 184 1 529 842 853 867 632 612
Pakistan
Presumed and confirmed 4 281 356 4 065 802 4 285 449 3 472 727 3 666 257 3 776 244 2 115 941Microscopy examined 4 281 346 4 168 648 4 497 330 3 933 321 4 343 418 4 619 980 4 982 935Confirmed with microscopy 220 870 287 592 250 526 196 078 193 952 137 401 152 611RDT examined 279 724 518 709 410 949 628 504 779 815 691 245 1 223 880Confirmed with RDT 19 721 46 997 40 255 85 677 81 197 64 612 165 838Imported cases - - - - - - -
WORLD MALARIA REPORT 2017 145
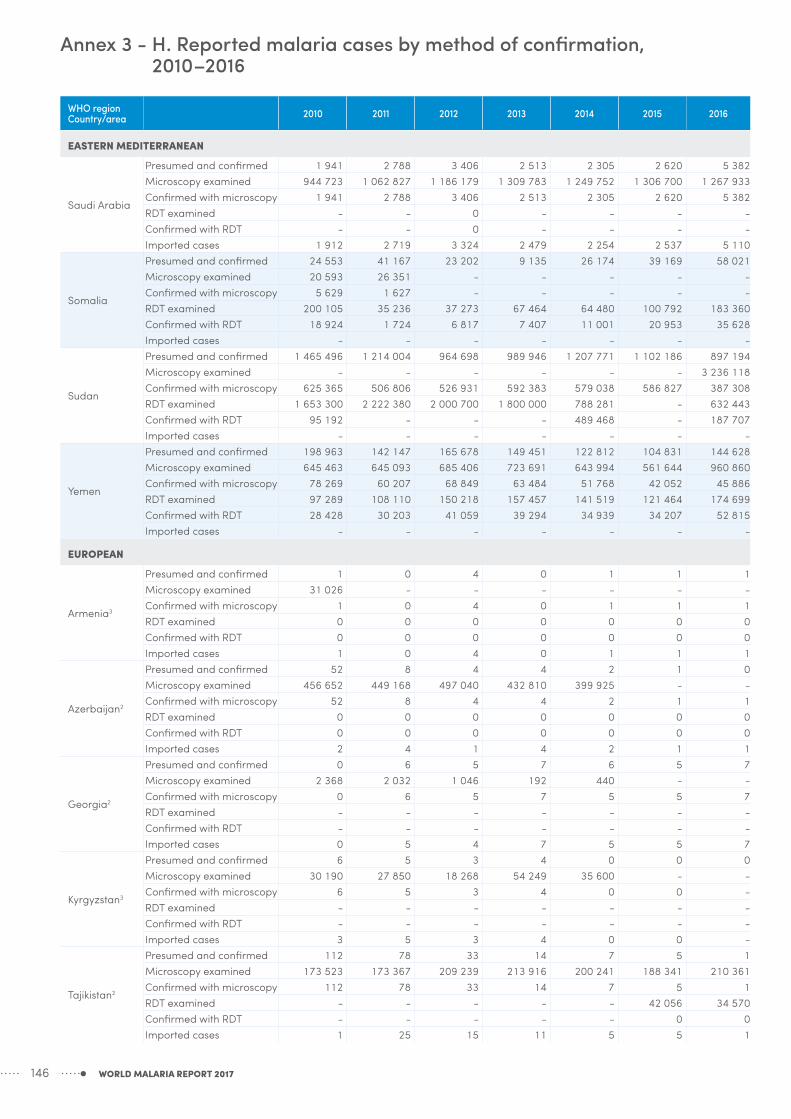
WHO region Country/area 2010 2011 2012 2013 2014 2015 2016
EASTERN MEDITERRANEAN
Saudi Arabia
Presumed and confirmed 1 941 2 788 3 406 2 513 2 305 2 620 5 382Microscopy examined 944 723 1 062 827 1 186 179 1 309 783 1 249 752 1 306 700 1 267 933Confirmed with microscopy 1 941 2 788 3 406 2 513 2 305 2 620 5 382RDT examined - - 0 - - - -Confirmed with RDT - - 0 - - - -Imported cases 1 912 2 719 3 324 2 479 2 254 2 537 5 110
Somalia
Presumed and confirmed 24 553 41 167 23 202 9 135 26 174 39 169 58 021Microscopy examined 20 593 26 351 - - - - -Confirmed with microscopy 5 629 1 627 - - - - -RDT examined 200 105 35 236 37 273 67 464 64 480 100 792 183 360Confirmed with RDT 18 924 1 724 6 817 7 407 11 001 20 953 35 628Imported cases - - - - - - -
Sudan
Presumed and confirmed 1 465 496 1 214 004 964 698 989 946 1 207 771 1 102 186 897 194Microscopy examined - - - - - - 3 236 118Confirmed with microscopy 625 365 506 806 526 931 592 383 579 038 586 827 387 308RDT examined 1 653 300 2 222 380 2 000 700 1 800 000 788 281 - 632 443Confirmed with RDT 95 192 - - - 489 468 - 187 707Imported cases - - - - - - -
Yemen
Presumed and confirmed 198 963 142 147 165 678 149 451 122 812 104 831 144 628Microscopy examined 645 463 645 093 685 406 723 691 643 994 561 644 960 860Confirmed with microscopy 78 269 60 207 68 849 63 484 51 768 42 052 45 886RDT examined 97 289 108 110 150 218 157 457 141 519 121 464 174 699Confirmed with RDT 28 428 30 203 41 059 39 294 34 939 34 207 52 815Imported cases - - - - - - -
EUROPEAN
Armenia3
Presumed and confirmed 1 0 4 0 1 1 1Microscopy examined 31 026 - - - - - -Confirmed with microscopy 1 0 4 0 1 1 1RDT examined 0 0 0 0 0 0 0Confirmed with RDT 0 0 0 0 0 0 0Imported cases 1 0 4 0 1 1 1
Azerbaijan2
Presumed and confirmed 52 8 4 4 2 1 0Microscopy examined 456 652 449 168 497 040 432 810 399 925 - -Confirmed with microscopy 52 8 4 4 2 1 1RDT examined 0 0 0 0 0 0 0Confirmed with RDT 0 0 0 0 0 0 0Imported cases 2 4 1 4 2 1 1
Georgia2
Presumed and confirmed 0 6 5 7 6 5 7Microscopy examined 2 368 2 032 1 046 192 440 - -Confirmed with microscopy 0 6 5 7 5 5 7RDT examined - - - - - - -Confirmed with RDT - - - - - - -Imported cases 0 5 4 7 5 5 7
Kyrgyzstan3
Presumed and confirmed 6 5 3 4 0 0 0Microscopy examined 30 190 27 850 18 268 54 249 35 600 - -Confirmed with microscopy 6 5 3 4 0 0 -RDT examined - - - - - - -Confirmed with RDT - - - - - - -Imported cases 3 5 3 4 0 0 -
Tajikistan2
Presumed and confirmed 112 78 33 14 7 5 1Microscopy examined 173 523 173 367 209 239 213 916 200 241 188 341 210 361Confirmed with microscopy 112 78 33 14 7 5 1RDT examined - - - - - 42 056 34 570Confirmed with RDT - - - - - 0 0Imported cases 1 25 15 11 5 5 1
Annex 3 - H. Reported malaria cases by method of confirmation, 2010–2016
WORLD MALARIA REPORT 2017146

WHO region Country/area 2010 2011 2012 2013 2014 2015 2016
EUROPEAN
Turkey2
Presumed and confirmed 90 132 376 285 249 221 209Microscopy examined 507 841 421 295 337 830 255 125 189 854 - -Confirmed with microscopy 90 132 376 285 249 221 209RDT examined - - - - - - -Confirmed with RDT - - - - - - -Imported cases 81 128 376 251 249 221 209
Turkmenistan3
Presumed and confirmed 0 0 0 0 0 0 0Microscopy examined 81 784 - - - - - -Confirmed with microscopy 0 0 0 0 0 0 0RDT examined - - - - - - -Confirmed with RDT - - - - - - -Imported cases 0 0 0 0 0 0 0
Uzbekistan2
Presumed and confirmed 5 1 1 3 1 0 0Microscopy examined 921 364 886 243 805 761 908 301 812 347 - -Confirmed with microscopy 5 1 1 3 1 0 -RDT examined - - - - - - -Confirmed with RDT - - - - - - -Imported cases 2 1 1 3 1 0 0
SOUTH-EAST ASIA
Bangladesh
Presumed and confirmed 91 227 51 773 29 518 3 864 10 216 6 608 4 787Microscopy examined 308 326 270 253 253 887 74 755 78 719 69 093 65 845Confirmed with microscopy 20 519 20 232 4 016 1 866 3 249 1 612 1 022RDT examined 152 936 119 849 35 675 19 171 46 482 53 713 73 128Confirmed with RDT 35 354 31 541 5 885 1 998 6 967 4 996 3 765Imported cases - - - - - 129 109
Bhutan
Presumed and confirmed 487 207 82 45 48 104 74Microscopy examined 54 709 44 481 42 512 31 632 33 586 26 149 23 442Confirmed with microscopy 436 194 82 45 48 84 59RDT examined - - - - - 47 938 95 399Confirmed with RDT - - - - - 20 15Imported cases - - 0 23 0 70 56
Democratic People's Republic of Korea
Presumed and confirmed 13 520 16 760 23 537 15 673 11 212 7 409 5 113Microscopy examined 25 147 26 513 39 238 71 453 38 201 29 272 22 747Confirmed with microscopy 13 520 16 760 21 850 14 407 10 535 7 010 4 890RDT examined - - 0 0 0 61 348 182 980Confirmed with RDT - - 0 0 0 12 143Imported cases - - 0 0 0 205 0
India
Presumed and confirmed 1 599 986 1 310 656 1 067 824 881 730 1 102 205 1 169 261 1 090 724Microscopy examined 108 679 429 108 969 660 109 033 790 113 109 094 124 066 331 121 141 970 124 920 962Confirmed with microscopy 1 599 986 1 310 656 1 067 824 881 730 1 102 205 1 169 261 1 090 724RDT examined 10 600 000 10 500 384 13 125 480 14 782 104 14 562 000 19 699 260 19 606 260Confirmed with RDT - - - - - - -Imported cases - - - - - - -
Indonesia
Presumed and confirmed 465 764 422 447 417 819 343 527 252 027 217 025 218 450Microscopy examined 1 335 445 962 090 1 429 139 1 447 980 1 300 835 1 224 504 1 092 093Confirmed with microscopy 465 764 422 447 417 819 343 527 252 027 217 025 218 450RDT examined 255 734 250 709 471 586 260 181 249 461 342 946 365 765Confirmed with RDT - - - - - - -Imported cases - - - - - - -
Myanmar
Presumed and confirmed 693 124 567 452 480 586 333 871 205 658 182 768 110 146Microscopy examined 275 374 312 689 265 135 138 473 151 258 99 025 122 078Confirmed with microscopy 103 285 91 752 75 192 26 509 12 010 6 782 6 717RDT examined 729 878 795 618 1 158 420 1 162 083 1 415 837 2 564 707 3 063 167Confirmed with RDT 317 523 373 542 405 394 307 362 193 648 175 986 103 429Imported cases - - - - - 345 -
WORLD MALARIA REPORT 2017 147

WHO region Country/area 2010 2011 2012 2013 2014 2015 2016
SOUTH-EAST ASIA
Nepal
Presumed and confirmed 96 383 71 752 70 272 38 113 26 526 20 621 10 687Microscopy examined 102 977 95 011 152 780 100 336 127 130 63 946 84 595Confirmed with microscopy 3 115 1 910 1 659 1 197 1 469 1 112 1 009RDT examined 17 887 25 353 22 472 32 989 48 444 49 649 52 432Confirmed with RDT 779 1 504 433 777 - 725 -Imported cases - 1 069 592 - 667 521 502
Sri Lanka3
Presumed and confirmed 736 175 93 95 49 36 41Microscopy examined 1 001 107 985 060 948 250 1 236 580 1 069 817 1 142 466 1 072 396Confirmed with microscopy 736 175 93 95 49 21 23RDT examined - - - - - 13 671 18 347Confirmed with RDT - - - - - 1 1Imported cases 52 51 70 95 49 36 41
Thailand
Presumed and confirmed 32 480 24 897 32 569 33 302 37 921 14 135 11 522Microscopy examined 1 695 980 1 354 215 1 130 757 1 830 090 1 756 528 1 358 953 1 302 834Confirmed with microscopy 22 969 14 478 32 569 33 302 37 921 14 135 11 301RDT examined 81 997 96 670 - - - 10 888 158 173Confirmed with RDT 9 511 10 419 - - - 0 221Imported cases - - - - - 9 890 5 724
Timor-Leste
Presumed and confirmed 119 072 36 064 6 148 1 042 342 80 95Microscopy examined 109 806 82 175 64 318 56 192 30 515 30 275 35 947Confirmed with microscopy 40 250 19 739 5 211 1 025 342 80 94RDT examined 85 643 127 272 117 599 121 991 86 592 90 835 114 385Confirmed with RDT 7 887 - - - 0 0 0Imported cases - - - - - - 0
WESTERN PACIFIC
Cambodia
Presumed and confirmed 49 356 57 423 45 553 24 130 26 278 33 930 23 492Microscopy examined 90 175 86 526 80 212 54 716 48 591 49 357 42 802Confirmed with microscopy 14 277 13 792 10 124 4 598 5 288 7 423 3 695RDT examined 103 035 130 186 108 974 94 600 92 525 114 323 123 893Confirmed with RDT 35 079 43 631 30 352 16 711 19 864 26 507 19 797Imported cases - - - - - - -
China
Presumed and confirmed 7 855 4 498 2 716 4 127 2 921 3 116 3 143Microscopy examined 7 115 784 9 189 270 6 918 657 5 554 960 4 403 633 4 052 588 3 194 915Confirmed with microscopy 4 990 3 367 2 603 4 086 2 921 3 088 3 129RDT examined - - - - - - -Confirmed with RDT - - - - - - -Imported cases - - 2 399 4 007 2 864 3 055 3 125
Lao People's Democratic Republic
Presumed and confirmed 23 047 17 904 46 819 41 385 48 071 36 056 11 753Microscopy examined 150 512 213 578 223 934 202 422 133 916 110 084 89 998Confirmed with microscopy 4 524 6 226 13 232 10 036 8 018 4 167 1 597RDT examined 127 790 77 825 145 425 133 337 160 626 173 919 133 464Confirmed with RDT 16 276 11 306 32 970 28 095 40 053 31 889 9 626Imported cases - - - - - 0 -
Malaysia
Presumed and confirmed 6 650 5 306 4 725 3 850 3 923 2 311 2 302Microscopy examined 1 619 074 1 600 439 1 566 872 1 576 012 1 443 958 1 066 470 1 153 108Confirmed with microscopy 6 650 5 306 4 725 3 850 3 923 2 311 2 302RDT examined - - - - - - 0Confirmed with RDT - - - - - - 0Imported cases 831 1 142 924 865 766 435 428
Papua New Guinea
Presumed and confirmed 1 379 787 1 151 343 878 371 1 125 808 644 688 553 103 728 798Microscopy examined 198 742 184 466 156 495 139 972 83 257 112 864 146 242Confirmed with microscopy 75 985 70 603 67 202 70 658 68 114 64 719 80 472RDT examined 20 820 27 391 228 857 468 380 475 654 541 760 772 254Confirmed with RDT 17 971 13 457 82 993 209 336 213 068 233 068 398 025Imported cases - - - - - - -
Annex 3 - H. Reported malaria cases by method of confirmation, 2010–2016
WORLD MALARIA REPORT 2017148

WHO region Country/area 2010 2011 2012 2013 2014 2015 2016
WESTERN PACIFIC
Philippines
Presumed and confirmed 19 106 9 617 8 154 7 720 4 972 8 301 6 690Microscopy examined 301 031 327 060 332 063 317 360 287 725 224 843 255 302Confirmed with microscopy 18 560 9 552 7 133 5 826 3 618 5 694 2 860RDT examined - - - 1 523 28 598 35 799 66 536Confirmed with RDT - - - 688 1 285 2 572 3 820Imported cases - - - - - 18 55
Republic of Korea
Presumed and confirmed 1 772 838 555 443 638 699 673Microscopy examined - - - - - - -Confirmed with microscopy 1 772 838 555 443 638 699 673RDT examined - - - - - - -Confirmed with RDT - - - - - - -Imported cases 56 64 47 50 78 65 72
Solomon Islands
Presumed and confirmed 95 006 80 859 57 296 53 270 51 649 50 916 84 513Microscopy examined 212 329 182 847 202 620 191 137 173 900 124 376 152 690Confirmed with microscopy 35 373 23 202 21 904 21 540 13 865 14 793 26 187RDT examined 17 300 17 457 13 987 26 216 26 658 40 750 92 109Confirmed with RDT 4 331 3 455 2 479 4 069 4 539 9 205 28 244Imported cases - - - - - - -
Vanuatu
Presumed and confirmed 16 831 5 764 3 435 2 381 982 697 2 147Microscopy examined 29 180 19 183 16 981 15 219 18 135 4 870 6 704Confirmed with microscopy 4 013 2 077 733 767 190 15 225RDT examined 10 246 12 529 16 292 13 724 17 435 9 794 14 501Confirmed with RDT 4 156 2 743 2 702 1 614 792 408 1 643Imported cases - - - - - 0 0
Viet Nam
Presumed and confirmed 54 297 45 588 43 717 35 406 27 868 19 252 10 446Microscopy examined 2 760 119 2 791 917 2 897 730 2 684 996 2 357 536 2 204 409 2 082 986Confirmed with microscopy 17 515 16 612 19 638 17 128 15 752 9 331 4 161RDT examined 7 017 491 373 514 725 412 530 416 483 459 332 408 055Confirmed with RDT - - - - - - -Imported cases - - - - - - -
2010 2011 2012 2013 2014 2015 2016
REGIONAL SUMMARY (presumed and confirmed malaria cases)African 103 145 240 100 205 022 110 913 398 124 456 766 130 336 607 133 521 494 146 035 650Americas 678 373 493 900 469 448 439 651 393 349 451 389 571 038Eastern Mediterranean 6 370 339 5 954 143 5 838 125 4 948 628 5 327 910 5 387 087 3 629 687European 266 230 422 317 266 233 218South-East Asia 3 112 779 2 502 183 2 128 448 1 651 262 1 646 204 1 618 047 1 451 639Western Pacific 1 653 707 1 379 140 1 091 341 1 298 520 811 990 708 381 873 957
Total 1 653 707 1 379 140 1 091 341 1 298 520 811 990 708 381 873 957
RDT, rapid diagnostic test* The table indicates cases reported at health facilities and excludes cases at community level1 In May 2013, South Sudan was reassigned to the WHO African Region (WHA resolution 66.21, http://apps.who.int/gb/ebwha/pdf_files/WHA66/
A66_R21-en.pdf)2 There is no local transmission3 Certified malaria free countries are included in this listing for historical purposes
WORLD MALARIA REPORT 2017 149

WHO regionCountry/area
2010 2011 2012 2013 2014 2015 2016
AFRICAN
Algeria
Suspected 12 224 11 974 15 790 12 762 8 690 8 000 6 628No Pf 7 4 48 14 5 0 0No Pv 4 0 11 2 0 0 0No Other 1 0 - 23 13 0 0
Angola
Suspected 4 591 529 4 469 357 4 849 418 5 273 305 6 134 471 6 839 963 7 649 902No Pf - - - - - - -No Pv - - - - - - -No Other - - - - - - -
Benin
Suspected 1 432 095 1 565 487 1 875 386 2 041 444 1 955 773 2 009 959 1 817 605No Pf - 68 745 0 - 1 044 235 1 268 347 1 324 576No Pv - 0 0 - 0 0 0No Other - 0 0 - - - -
Botswana
Suspected 12 196 1 141 308 506 1 485 1 298 12 986No Pf 1 046 432 193 456 1 346 326 715No Pv 0 0 0 0 0 0 0No Other - - - - - - -
Burkina Faso
Suspected 6 037 806 5 446 870 7 852 299 7 857 296 9 272 755 9 783 385 11 992 686No Pf - - - - - - -No Pv - - - - - - -No Other - - - - - - -
Burundi
Suspected 5 590 736 4 768 314 4 228 015 7 384 501 7 622 162 8 414 481 12 357 585No Pf - - - - - - -No Pv - - - - - - -No Other - - - - - - -
Cabo Verde
Suspected 47 26 508 8 715 10 621 6 894 3 117 8 393No Pf 47 7 1 22 72 7 48No Pv 0 0 0 0 0 0 0No Other 0 0 0 0 0 0 0
Cameroon
Suspected 1 845 691 3 060 040 2 865 319 3 652 609 3 709 906 3 312 273 3 229 804No Pf - - - - - 592 351 810 367No Pv - - - - - 0 0No Other - - - - - - 0
Central African Republic
Suspected 66 484 221 980 468 986 491 074 625 301 1 218 246 1 807 206No Pf - - - - 295 088 598 833 1 032 764No Pv - - - - 0 0 0No Other - - - - 0 - -
Chad
Suspected 743 471 528 454 730 364 1 272 841 1 737 195 1 641 285 2 032 301No Pf - - - - - - -No Pv - - - - - - -No Other - - - - - - -
Comoros
Suspected 159 976 135 248 168 043 185 779 103 545 101 330 94 388No Pf 33 791 21 387 43 681 46 032 2 203 1 300 1 066No Pv 528 334 637 72 0 0 0No Other 880 557 - 363 0 0 0
Congo
Suspected 446 656 277 263 117 640 209 169 290 346 300 592 466 254No Pf - 37 744 120 319 43 232 66 323 51 529 171 847No Pv - 0 0 0 0 0 0No Other - - - 0 0 0 0
Côte d'Ivoire
Suspected 1 721 461 2 607 856 3 423 623 5 982 151 6 418 571 5 216 344 5 178 375No Pf - - - 2 506 953 3 712 831 3 375 904 3 471 024No Pv - - - 0 0 0 0No Other - - - 0 0 0 0
Democratic Republic of the Congo
Suspected 10 568 756 12 018 784 11 993 189 14 871 716 14 647 380 16 452 476 21 507 579No Pf 0 0 0 0 - - -No Pv 0 0 0 0 - - -No Other 0 0 0 0 - - -
Annex 3 - I. Reported malaria cases by species, 2010–2016
WORLD MALARIA REPORT 2017150

WHO regionCountry/area
2010 2011 2012 2013 2014 2015 2016
AFRICAN
Equatorial Guinea
Suspected 83 639 40 704 45 792 44 561 57 129 68 058 318 779No Pf 53 813 22 466 15 169 13 129 17 452 - -No Pv 0 0 0 0 0 - -No Other - - - - - - -
Eritrea
Suspected 96 792 97 479 138 982 134 183 121 755 111 950 106 403No Pf 9 848 10 357 12 467 13 873 23 953 14 580 21 247No Pv 3 989 4 932 9 204 7 361 6 780 4 780 2 999No Other 57 19 - 83 35 12 5
Ethiopia
Suspected 5 420 110 5 487 972 5 962 646 9 243 894 7 457 765 5 987 580 6 611 801No Pf 806 577 814 547 946 595 1 687 163 1 250 110 1 188 627 1 142 235No Pv 390 252 665 813 745 983 958 291 868 705 678 432 576 269No Other 0 - - - - - -
Gabon
Suspected 233 770 178 822 238 483 256 531 256 183 285 489 202 989No Pf 2 212 - - 26 432 26 117 - 23 915No Pv 720 - - 0 0 - 0No Other 2 015 - - 0 1 570 - 0
Gambia
Suspected 492 062 261 967 862 442 889 494 603 424 891 511 844 821No Pf 64 108 190 379 271 038 240 792 99 976 240 382 153 685No Pv 0 0 0 0 0 0 0No Other - - - - - - -
Ghana
Suspected 5 056 851 5 067 731 12 578 946 8 444 417 10 636 057 13 368 757 14 040 434No Pf 926 447 593 518 3 755 166 1 629 198 3 415 912 4 319 919 4 505 442No Pv 0 0 0 0 0 0 0No Other 102 937 31 238 0 0 0 0 29 725
Guinea
Suspected 1 092 554 1 276 057 1 220 574 775 341 1 595 828 1 254 937 1 503 035No Pf 20 936 5 450 191 421 63 353 660 207 810 979 992 146No Pv 0 0 0 0 0 0 0No Other - - - 0 - - -
Guinea-Bissau
Suspected 195 006 300 233 237 398 238 580 309 939 385 678 381 196No Pf - - - - - - -No Pv - - - - - - -No Other - - - - - - -
Kenya
Suspected 7 557 454 13 127 058 12 883 521 14 677 837 15 142 723 15 915 943 15 294 939No Pf 898 531 1 002 805 1 453 471 2 335 286 2 808 931 1 499 027 2 783 846No Pv 0 0 0 0 0 0 0No Other - - - - - - -
Liberia
Suspected 3 087 659 2 887 105 2 441 800 2 202 213 2 433 086 2 306 116 3 105 390No Pf 212 927 577 641 1 407 455 1 244 220 864 204 2 086 600 1 191 137No Pv 0 0 0 0 0 0 0No Other 0 - - 0 0 0 0
Madagascar
Suspected 719 967 805 701 980 262 1 068 683 1 019 498 1 536 344 1 530 075No Pf - - - - - - -No Pv - - - - - - -No Other - - - - - - -
Malawi
Suspected 6 851 108 5 734 906 6 528 505 5 787 441 7 703 651 8 518 905 9 239 462No Pf - - 1 564 984 1 280 892 2 905 310 3 585 315 4 730 835No Pv - - 0 0 0 0 0No Other - - - - - - -
Mali
Suspected 3 324 238 2 628 593 2 171 739 2 849 453 2 590 643 4 410 839 3 563 070No Pf - - - - - - -No Pv - - - - - - -No Other - - - - - - -
Mauritania
Suspected 250 073 162 820 172 374 135 985 203 991 219 184 180 857No Pf - - - - - - -No Pv - - - - - - -No Other - - - - - - -
WORLD MALARIA REPORT 2017 151
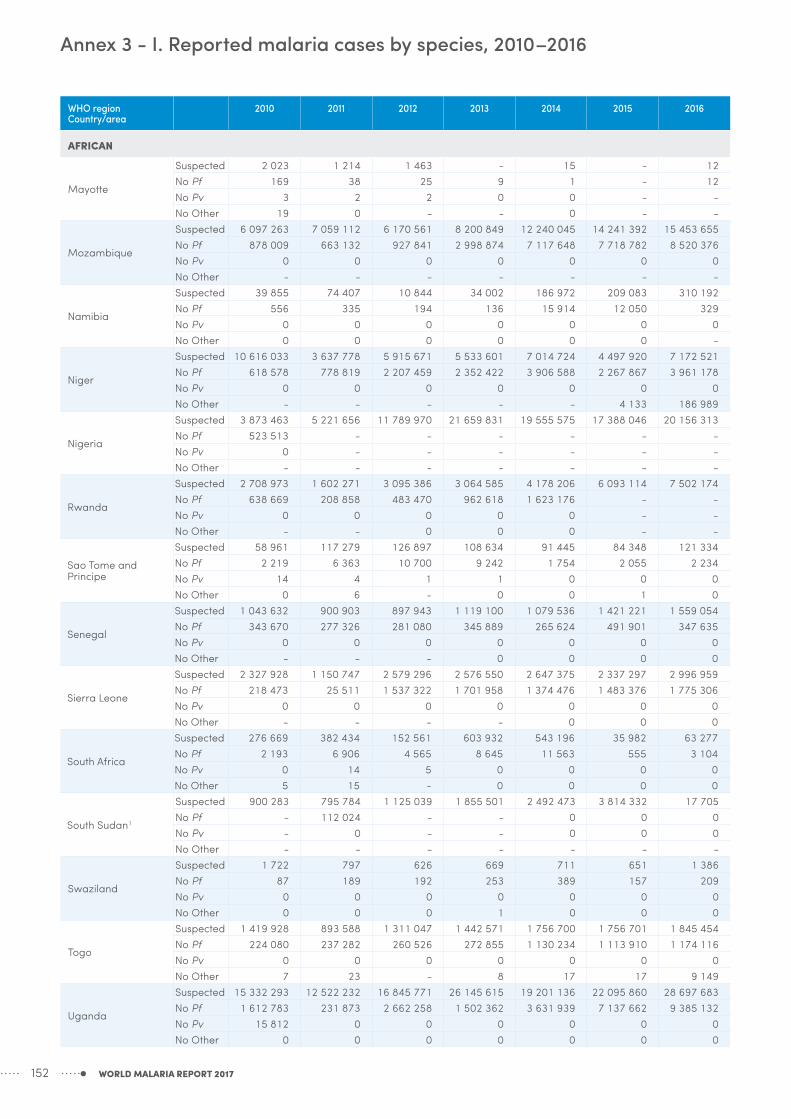
WHO regionCountry/area
2010 2011 2012 2013 2014 2015 2016
AFRICAN
Mayotte
Suspected 2 023 1 214 1 463 - 15 - 12No Pf 169 38 25 9 1 - 12No Pv 3 2 2 0 0 - -No Other 19 0 - - 0 - -
Mozambique
Suspected 6 097 263 7 059 112 6 170 561 8 200 849 12 240 045 14 241 392 15 453 655No Pf 878 009 663 132 927 841 2 998 874 7 117 648 7 718 782 8 520 376No Pv 0 0 0 0 0 0 0No Other - - - - - - -
Namibia
Suspected 39 855 74 407 10 844 34 002 186 972 209 083 310 192No Pf 556 335 194 136 15 914 12 050 329No Pv 0 0 0 0 0 0 0No Other 0 0 0 0 0 0 -
Niger
Suspected 10 616 033 3 637 778 5 915 671 5 533 601 7 014 724 4 497 920 7 172 521No Pf 618 578 778 819 2 207 459 2 352 422 3 906 588 2 267 867 3 961 178No Pv 0 0 0 0 0 0 0No Other - - - - - 4 133 186 989
Nigeria
Suspected 3 873 463 5 221 656 11 789 970 21 659 831 19 555 575 17 388 046 20 156 313No Pf 523 513 - - - - - -No Pv 0 - - - - - -No Other - - - - - - -
Rwanda
Suspected 2 708 973 1 602 271 3 095 386 3 064 585 4 178 206 6 093 114 7 502 174No Pf 638 669 208 858 483 470 962 618 1 623 176 - -No Pv 0 0 0 0 0 - -No Other - - 0 0 0 - -
Sao Tome and Principe
Suspected 58 961 117 279 126 897 108 634 91 445 84 348 121 334No Pf 2 219 6 363 10 700 9 242 1 754 2 055 2 234No Pv 14 4 1 1 0 0 0No Other 0 6 - 0 0 1 0
Senegal
Suspected 1 043 632 900 903 897 943 1 119 100 1 079 536 1 421 221 1 559 054No Pf 343 670 277 326 281 080 345 889 265 624 491 901 347 635No Pv 0 0 0 0 0 0 0No Other - - - 0 0 0 0
Sierra Leone
Suspected 2 327 928 1 150 747 2 579 296 2 576 550 2 647 375 2 337 297 2 996 959No Pf 218 473 25 511 1 537 322 1 701 958 1 374 476 1 483 376 1 775 306No Pv 0 0 0 0 0 0 0No Other - - - - 0 0 0
South Africa
Suspected 276 669 382 434 152 561 603 932 543 196 35 982 63 277No Pf 2 193 6 906 4 565 8 645 11 563 555 3 104No Pv 0 14 5 0 0 0 0No Other 5 15 - 0 0 0 0
South Sudan1
Suspected 900 283 795 784 1 125 039 1 855 501 2 492 473 3 814 332 17 705No Pf - 112 024 - - 0 0 0No Pv - 0 - - 0 0 0No Other - - - - - - -
Swaziland
Suspected 1 722 797 626 669 711 651 1 386No Pf 87 189 192 253 389 157 209No Pv 0 0 0 0 0 0 0No Other 0 0 0 1 0 0 0
Togo
Suspected 1 419 928 893 588 1 311 047 1 442 571 1 756 700 1 756 701 1 845 454No Pf 224 080 237 282 260 526 272 855 1 130 234 1 113 910 1 174 116No Pv 0 0 0 0 0 0 0No Other 7 23 - 8 17 17 9 149
Uganda
Suspected 15 332 293 12 522 232 16 845 771 26 145 615 19 201 136 22 095 860 28 697 683No Pf 1 612 783 231 873 2 662 258 1 502 362 3 631 939 7 137 662 9 385 132No Pv 15 812 0 0 0 0 0 0No Other 0 0 0 0 0 0 0
Annex 3 - I. Reported malaria cases by species, 2010–2016
WORLD MALARIA REPORT 2017152

WHO regionCountry/area
2010 2011 2012 2013 2014 2015 2016
AFRICAN
United Republic of Tanzania
Suspected 15 388 319 15 299 205 14 513 120 14 650 226 25 190 882 20 797 048 17 786 690No Pf 2 338 4 489 2 931 1 710 1 119 412 433 -No Pv 0 0 0 0 0 0 -No Other - - - 0 0 0 0
Mainland
Suspected 15 116 242 14 843 487 13 976 370 14 122 269 24 880 179 20 451 119 17 526 829No Pf - - 212 636 69 459 106 609 411 741 -No Pv - - 0 0 0 0 -No Other - - - - - - -
Zanzibar
Suspected 272 077 455 718 536 750 527 957 310 703 345 929 259 861No Pf 2 338 4 489 2 931 1 725 2 390 2 049 5 104No Pv 0 0 0 0 0 0 0No Other 0 0 0 0 - 0 0
Zambia
Suspected 4 229 839 4 607 908 4 695 400 5 465 122 7 859 740 8 116 962 9 627 862No Pf - - - - 4 077 547 4 184 661 4 851 319No Pv - - - - 0 0 0No Other - - - - - - -
Zimbabwe
Suspected 912 618 480 011 727 174 1 115 005 1 420 946 1 384 893 1 224 374No Pf 249 379 319 935 276 963 422 633 535 931 391 651 279 988No Pv 0 0 0 0 0 0 0No Other - 0 - - - - -
AMERICAS
Argentina
Suspected 2 547 7 872 7 027 4 913 5 691 3 005 2 277No Pf 0 0 0 0 0 0 0No Pv 26 0 0 0 0 0 0No Other 0 0 0 0 0 0 0
Belize
Suspected 27 366 22 996 20 789 25 351 24 122 26 367 20 936No Pf 1 0 0 0 0 0 0No Pv 149 72 33 20 19 9 4No Other 0 0 0 0 0 0 0
Bolivia (Plurinational State of)
Suspected 140 857 150 662 132 904 144 049 124 900 159 167 155 407No Pf 1 592 543 396 996 341 89 7No Pv 13 694 7 635 8 141 6 346 7 060 6 785 5 535No Other 0 0 0 0 0 0 0
Brazil
Suspected 2 711 433 2 477 821 2 349 341 1 893 797 1 756 460 1 590 407 1 364 942No Pf 51 048 35 706 40 159 30 943 22 234 15 445 13 829No Pv 283 435 231 368 203 018 137 887 117 009 122 743 110 343No Other 183 143 105 32 28 38 8
Colombia
Suspected 521 342 418 159 416 767 327 081 403 532 332 706 316 148No Pf 34 334 15 404 17 778 18 340 20 634 26 061 49 974No Pv 83 255 44 701 51 467 33 345 20 129 21 987 32 635No Other 48 16 9 11 5 0 0
Costa Rica
Suspected 15 599 10 690 7 485 16 774 4 420 7 373 5 160No Pf 0 0 1 0 0 0 0No Pv 110 11 4 0 0 0 4No Other 0 0 2 0 0 0 0
Dominican Republic
Suspected 495 637 477 555 506 583 502 683 416 729 367 167 372 774No Pf 2 480 1 614 950 474 459 631 690No Pv 2 2 2 0 0 0 0No Other 0 0 0 0 0 0 0
Ecuador
Suspected 488 830 460 785 459 157 397 628 370 825 261 824 311 920No Pf 258 290 78 160 40 184 403No Pv 1 630 929 466 208 202 434 788No Other 0 0 0 0 0 0 0
WORLD MALARIA REPORT 2017 153

WHO regionCountry/area
2010 2011 2012 2013 2014 2015 2016
AMERICAS
El Salvador
Suspected 115 256 100 884 124 885 103 748 106 915 89 267 81 904No Pf 0 1 0 0 0 0 0No Pv 17 8 15 6 6 3 13No Other 0 0 0 0 0 0 0
French Guiana
Suspected 14 373 14 429 13 638 22 327 14 651 11 558 9 430No Pf 1 548 1 080 763 652 318 35 32No Pv 476 339 257 220 129 203 99No Other 5 5 2 - 1 0 0
Guatemala
Suspected 237 075 195 080 186 645 153 731 300 989 301 746 408 394No Pf 35 67 68 152 91 51 4No Pv 7 163 6 707 5 278 6 062 5 593 5 487 4 849No Other - - 0 0 0 0 0
Guyana
Suspected 212 863 201 728 196 622 205 903 142 843 132 941 116 300No Pf 14 401 20 309 20 329 17 425 5 140 3 950 4 976No Pv 8 402 9 066 11 244 13 953 7 173 6 002 6 923No Other 132 96 83 101 41 32 57
Haiti
Suspected 270 427 184 934 167 772 176 995 261 403 302 740 302 044No Pf 84 153 32 969 25 423 20 957 17 696 17 583 21 998No Pv 0 0 0 0 0 0 0No Other 0 0 0 0 0 0 0
Honduras
Suspected 156 961 156 559 159 165 144 673 152 847 153 906 182 766No Pf 986 619 584 1 159 599 933 1 350No Pv 8 759 7 044 5 865 4 269 2 881 2 642 2 744No Other 0 0 0 0 0 0 0
Mexico
Suspected 1 192 081 1 035 424 1 025 659 1 017 508 900 580 867 853 798 568No Pf 0 0 0 0 0 0 0No Pv 1 226 1 124 833 495 656 517 551No Other 0 0 0 0 0 0 0
Nicaragua
Suspected 554 414 536 105 552 722 539 022 605 357 604 418 554 415No Pf 154 150 236 208 157 342 1 307No Pv 538 775 999 954 985 1 937 4 965No Other 0 0 0 0 0 0 0
Panama
Suspected 141 038 116 588 107 711 93 624 80 701 64 511 50 772No Pf 20 1 1 0 0 6 21No Pv 398 353 843 696 864 556 748No Other 0 0 0 0 0 0 0
Paraguay
Suspected 62 178 48 611 31 499 24 806 24 832 9 157 3 192No Pf 0 0 0 0 0 0 1No Pv 18 1 0 0 0 0 0No Other 0 0 0 1 0 0 0
Peru
Suspected 744 650 702 952 759 285 864 648 866 047 867 980 566 230No Pf 2 374 3 018 3 501 8 103 10 416 12 569 15 319No Pv 29 169 21 984 28 030 40 829 54 819 49 287 41 287No Other 3 3 7 11 17 9 17
Suriname
Suspected 17 133 16 184 21 685 19 736 33 425 15 236 23 444No Pf 721 331 126 407 323 20 7No Pv 817 382 167 322 78 61 69No Other 36 17 2 0 0 0 0
Venezuela (Bolivarian Republic of)
Suspected 400 495 382 303 410 663 476 764 522 617 625 174 932 556No Pf 10 915 10 633 13 302 27 659 27 843 35 509 61 034No Pv 32 710 34 651 39 478 50 938 62 850 100 880 179 554No Other 60 6 23 46 15 13 25
Annex 3 - I. Reported malaria cases by species, 2010–2016
WORLD MALARIA REPORT 2017154
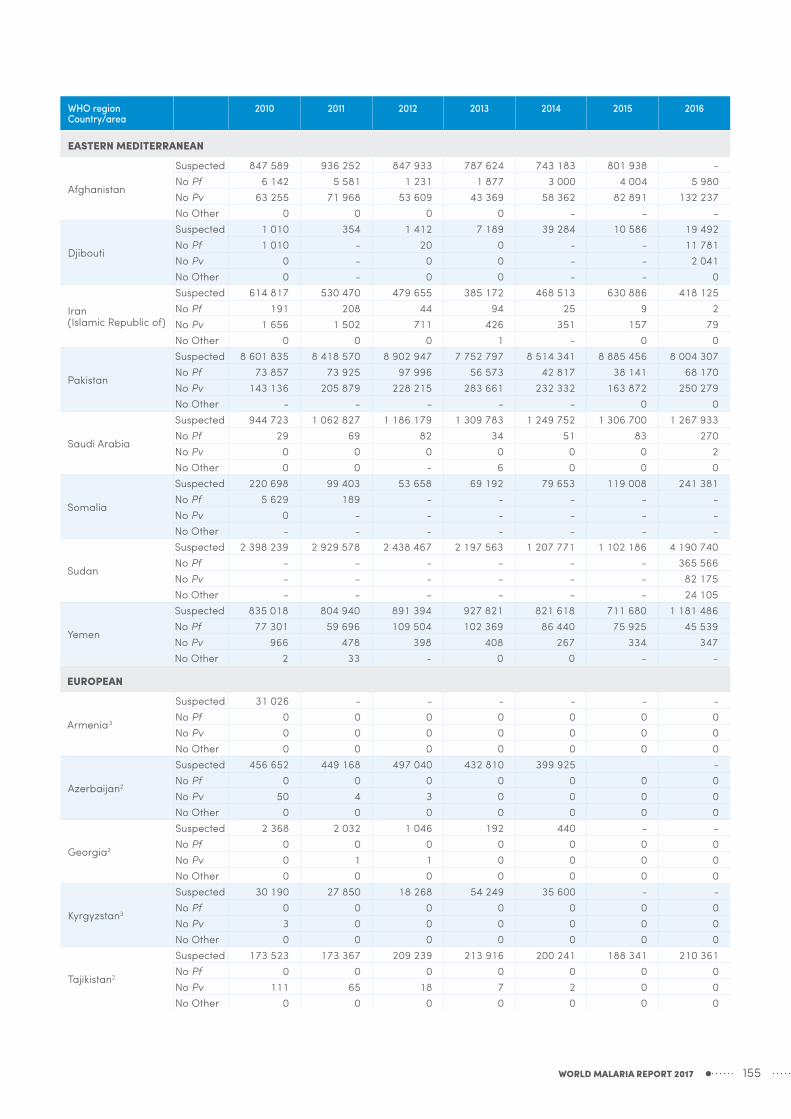
WHO regionCountry/area
2010 2011 2012 2013 2014 2015 2016
EASTERN MEDITERRANEAN
Afghanistan
Suspected 847 589 936 252 847 933 787 624 743 183 801 938 -No Pf 6 142 5 581 1 231 1 877 3 000 4 004 5 980No Pv 63 255 71 968 53 609 43 369 58 362 82 891 132 237No Other 0 0 0 0 - - -
Djibouti
Suspected 1 010 354 1 412 7 189 39 284 10 586 19 492No Pf 1 010 - 20 0 - - 11 781No Pv 0 - 0 0 - - 2 041No Other 0 - 0 0 - - 0
Iran (Islamic Republic of)
Suspected 614 817 530 470 479 655 385 172 468 513 630 886 418 125No Pf 191 208 44 94 25 9 2No Pv 1 656 1 502 711 426 351 157 79No Other 0 0 0 1 - 0 0
Pakistan
Suspected 8 601 835 8 418 570 8 902 947 7 752 797 8 514 341 8 885 456 8 004 307No Pf 73 857 73 925 97 996 56 573 42 817 38 141 68 170No Pv 143 136 205 879 228 215 283 661 232 332 163 872 250 279No Other - - - - - 0 0
Saudi Arabia
Suspected 944 723 1 062 827 1 186 179 1 309 783 1 249 752 1 306 700 1 267 933No Pf 29 69 82 34 51 83 270No Pv 0 0 0 0 0 0 2No Other 0 0 - 6 0 0 0
Somalia
Suspected 220 698 99 403 53 658 69 192 79 653 119 008 241 381No Pf 5 629 189 - - - - -No Pv 0 - - - - - -No Other - - - - - - -
Sudan
Suspected 2 398 239 2 929 578 2 438 467 2 197 563 1 207 771 1 102 186 4 190 740No Pf - - - - - - 365 566No Pv - - - - - - 82 175No Other - - - - - - 24 105
Yemen
Suspected 835 018 804 940 891 394 927 821 821 618 711 680 1 181 486No Pf 77 301 59 696 109 504 102 369 86 440 75 925 45 539No Pv 966 478 398 408 267 334 347No Other 2 33 - 0 0 - -
EUROPEAN
Armenia3
Suspected 31 026 - - - - - -No Pf 0 0 0 0 0 0 0No Pv 0 0 0 0 0 0 0No Other 0 0 0 0 0 0 0
Azerbaijan2
Suspected 456 652 449 168 497 040 432 810 399 925 -No Pf 0 0 0 0 0 0 0No Pv 50 4 3 0 0 0 0No Other 0 0 0 0 0 0 0
Georgia2
Suspected 2 368 2 032 1 046 192 440 - -No Pf 0 0 0 0 0 0 0No Pv 0 1 1 0 0 0 0No Other 0 0 0 0 0 0 0
Kyrgyzstan3
Suspected 30 190 27 850 18 268 54 249 35 600 - -No Pf 0 0 0 0 0 0 0No Pv 3 0 0 0 0 0 0No Other 0 0 0 0 0 0 0
Tajikistan2
Suspected 173 523 173 367 209 239 213 916 200 241 188 341 210 361No Pf 0 0 0 0 0 0 0No Pv 111 65 18 7 2 0 0No Other 0 0 0 0 0 0 0
WORLD MALARIA REPORT 2017 155

WHO regionCountry/area
2010 2011 2012 2013 2014 2015 2016
EUROPEAN
Turkey2
Suspected 507 841 421 295 337 830 255 125 189 854 -No Pf 0 0 0 0 0 0 0No Pv 9 0 219 34 5 0 0No Other 0 0 0 0 0 0 0
Turkmenistan3
Suspected 81 784 - - - - - -No Pf 0 0 0 0 0 0 0No Pv 0 0 0 0 0 0 0No Other 0 0 0 0 0 0 0
Uzbekistan2
Suspected 921 364 886 243 805 761 908 301 812 347 - -No Pf 0 0 0 0 0 0 0No Pv 3 0 0 0 0 0 0No Other 0 0 0 0 0 0 0
SOUTH-EAST ASIA
Bangladesh
Suspected 496 616 390 102 309 179 93 926 125 201 122 806 138 973No Pf 52 049 49 194 9 464 3 602 9 727 6 002 4 260No Pv 3 824 2 579 396 262 489 477 418No Other 0 0 0 0 - 0 0
Bhutan
Suspected 54 760 44 494 42 512 31 632 33 586 74 087 118 841No Pf 175 102 33 14 17 13 2No Pv 261 92 47 9 31 21 13No Other 0 0 0 - - 0 0
Democratic People's Republic of Korea
Suspected 25 147 26 513 40 925 72 719 38 878 91 007 205 807No Pf 0 0 0 0 0 0 0No Pv 13 520 16 760 21 850 14 407 10 535 6 817 5 033No Other 0 0 0 0 0 - -
India
Suspected 119 279 429
119 470 044
122 159 270
127 891 198
138 628 331
140 841 230
144 527 222
No Pf 834 364 665 004 524 370 463 846 722 546 778 821 721 505No Pv 765 622 645 652 534 129 417 884 379 659 390 440 374 511No Other - - - - - 0 0
Indonesia
Suspected 1 591 179 1 212 799 1 900 725 1 708 161 1 550 296 1 567 450 1 457 858No Pf 242 041 232 197 229 255 191 200 142 807 116 420 135 595No Pv 187 583 187 989 187 583 150 985 107 260 94 267 81 748No Other 2 547 2 261 981 1 342 1 960 1 387 1 106
Myanmar
Suspected 1 277 568 1 210 465 1 423 555 1 300 556 1 567 095 2 663 732 3 185 245No Pf 72 995 62 624 345 069 235 558 143 822 117 171 66 393No Pv 29 944 28 966 135 386 99 037 61 830 65 590 43 748No Other 346 - - - - 7 -
Nepal
Suspected 213 353 188 702 243 432 169 464 200 631 132 379 146 705No Pf 766 30 108 295 139 87 74No Pv 2 349 908 1 480 1 659 693 504 433No Other 0 0 0 0 - 0 0
Sri Lanka3
Suspected 1 001 107 985 060 948 250 1 236 580 1 069 817 1 156 151 1 090 760No Pf 11 5 4 0 0 0 0No Pv 668 119 19 0 0 0 0No Other - - - 0 0 0 0
Thailand
Suspected 1 777 977 1 450 885 1 130 757 1 830 090 1 756 528 1 369 841 1 461 007No Pf 9 548 5 857 11 553 14 645 14 331 3 348 1 883No Pv 13 401 8 608 17 506 15 573 20 513 4 655 2 671No Other 20 13 - 3 084 3 077 19 1 244
Timor-Leste
Suspected 266 384 225 772 182 854 178 200 117 107 121 110 150 333No Pf 28 818 15 981 1 962 513 203 56 84No Pv 11 432 3 758 2 288 512 139 24 10No Other 0 0 0 0 0 0 0
Annex 3 - I. Reported malaria cases by species, 2010–2016
WORLD MALARIA REPORT 2017156

WHO regionCountry/area
2010 2011 2012 2013 2014 2015 2016
WESTERN PACIFIC
Cambodia
Suspected 193 210 216 712 194 263 152 137 142 242 163 680 166 695No Pf 9 483 8 637 19 867 9 510 14 796 20 784 13 676No Pv 4 794 5 155 19 575 11 267 10 356 13 146 9 816No Other 0 0 - 0 0 - -
China
Suspected 7 118 649 9 190 401 6 918 770 5 555 001 4 403 633 4 052 616 3 194 929No Pf 1 295 1 410 16 127 6 1 0No Pv 3 675 1 907 179 71 50 26 3No Other 20 50 - 0 0 6 0
Lao People's Democratic Republic
Suspected 280 549 291 775 369 976 339 013 294 542 284 003 223 992No Pf 4 401 5 770 38 461 25 494 25 445 15 252 4 428No Pv 122 442 7 634 12 537 22 625 20 804 6 795No Other 1 14 - 1 1 0 0
Malaysia
Suspected 1 619 074 1 600 439 1 566 872 1 576 012 1 443 958 1 066 470 1 153 108No Pf 1 489 754 651 464 210 132 76No Pv 3 387 1 750 915 385 241 84 178No Other 943 1 660 - 194 120 26 12
Papua New Guinea
Suspected 1 505 393 1 279 140 1 113 528 1 454 166 922 417 909 940 1 168 797No Pf 60 824 60 317 58 747 120 748 200 215 233 609 381 397No Pv 13 171 9 654 7 108 7 579 78 846 62 228 95 328No Other 1 990 632 - 1 279 2 125 1 950 1 772
Philippines
Suspected 301 577 327 125 333 084 320 089 316 323 280 222 321 838No Pf 12 038 7 043 4 774 5 051 3 760 834 366No Pv 2 885 2 380 2 189 1 357 5 881 882 1 503No Other 175 127 - 67 5 320 826 534
Republic of Korea
Suspected 1 772 838 555 443 638 699 673No Pf 27 20 36 0 0 0 0No Pv 1 691 754 473 383 557 627 601No Other 0 0 0 0 0 0 0
Solomon Islands
Suspected 284 931 254 506 249 520 245 014 233 803 192 044 274 881No Pf 23 092 14 537 14 980 13 640 10 559 11 848 21 325No Pv 12 281 8 665 9 339 11 628 7 845 12 150 33 060No Other - 0 - 0 0 0 46
Vanuatu
Suspected 48 088 32 656 33 273 28 943 35 570 14 938 21 484No Pf 1 738 851 1 727 1 039 279 150 186No Pv 2 265 1 224 1 680 1 342 703 273 1 682No Other 10 2 0 0 0 0 0
Viet Nam
Suspected 2 803 918 3 312 266 3 436 534 3 115 804 2 786 135 2 673 662 2 497 326No Pf 12 763 10 101 11 448 9 532 8 532 4 561 2 396No Pv 4 466 5 602 7 220 6 901 7 220 4 756 1 750No Other 0 0 0 0 0 14 15
Pf, Plasmodium falciparum + mixed cases; Pv, Plasmodium vivaxThe number of Pf, Pv and other cases (respectively, No Pf, No Pv and No other) are indigenous cases.1 In May 2013, South Sudan was reassigned to the WHO African Region (WHA resolution 66.21, http://apps.who.int/gb/ebwha/pdf_files/
WHA66/A66_R21-en.pdf)2 There is no local transmission3 Certified malaria free countries are included in this listing for historical purposes
WORLD MALARIA REPORT 2017 157

WHO regionCountry/area 2010 2011 2012 2013 2014 2015 2016
AFRICAN
Algeria 1 0 0 0 0 0 0Angola 8 114 6 909 5 736 7 300 5 714 7 832 15 997Benin 964 1 753 2 261 2 288 1 869 1 416 1 646Botswana 8 8 3 7 22 5 3Burkina Faso 9 024 7 001 7 963 6 294 5 632 5 379 3 974Burundi 2 677 2 233 2 263 3 411 2 974 3 799 5 853Cabo Verde 1 1 0 0 2 0 1Cameroon 4 536 3 808 3 209 4 349 4 398 3 440 2 639Central African Republic 526 858 1 442 1 026 635 1 763 2 668Chad 886 1 220 1 359 1 881 1 720 1 572 1 686Comoros 53 19 17 15 0 1 0Congo - 892 623 2 870 271 435 733Côte d'Ivoire 1 023 1 389 1 534 3 261 4 069 2 604 3 340Democratic Republic of the Congo 23 476 23 748 21 601 30 918 25 502 39 054 33 997Equatorial Guinea 30 52 77 66 - 28 109Eritrea 27 12 30 6 15 12 21Ethiopia 1 581 936 1 621 358 213 662 510Gabon 182 74 134 273 159 309 101Gambia 151 440 289 262 170 167 79Ghana 3 859 3 259 2 855 2 506 2 200 2 137 1 264Guinea 735 743 979 108 1 067 846 867Guinea-Bissau 296 472 370 418 357 477 191Kenya 26 017 713 785 360 472 15 061 603Liberia 1 422 - 1 725 1 191 2 288 1 379 1 259Madagascar 427 398 552 641 551 841 443Malawi 8 206 6 674 5 516 3 723 4 490 3 799 4 000Mali 3 006 2 128 1 894 1 680 2 309 1 544 1 344Mauritania 211 77 106 25 19 39 317Mayotte 0 0 0 0 0 0 0Mozambique 3 354 3 086 2 818 2 941 3 245 2 467 1 685Namibia 63 36 4 21 61 45 65Niger 3 929 2 802 2 825 2 209 2 691 2 778 2 226Nigeria 4 238 3 353 7 734 7 878 6 082 - -Rwanda 670 380 459 409 496 516 715Sao Tome and Principe 14 19 7 11 0 0 0Senegal 553 472 649 815 500 0 0Sierra Leone 8 188 3 573 3 611 4 326 2 848 1 107 1 345South Africa 83 54 72 105 174 110 34South Sudan1 1 053 406 1 321 1 311 - - -Swaziland 8 1 3 4 4 5 3Togo 1 507 1 314 1 197 1 361 1 205 1 205 847Uganda 8 431 5 958 6 585 7 277 5 921 6 100 5 635United Republic of Tanzania 15 867 11 806 7 820 8 528 5 373 6 313 5 046
Mainland 15 819 11 799 7 812 8 526 5 368 6 311 5 045Zanzibar 48 7 8 2 5 2 1
Zambia 4 834 4 540 3 705 3 548 3 257 2 389 1 827Zimbabwe 255 451 351 352 406 200 351
AMERICAS
Argentina 0 0 0 0 0 0 0Belize 0 0 0 0 0 0 0Bolivia (Plurinational State of) 0 0 0 0 1 0 0Brazil 76 70 60 40 36 35 37Colombia 42 23 24 10 17 18 36Costa Rica 0 0 0 0 0 0 0Dominican Republic 15 10 8 5 4 3 1Ecuador 0 0 0 0 0 0 0El Salvador 0 0 0 0 0 0 0French Guiana 1 2 2 3 0 0 0Guatemala 0 0 0 1 1 1 0Guyana 24 36 35 14 11 12 13Haiti 8 5 6 10 9 15 13Honduras 3 2 1 1 2 0 0Mexico 0 0 0 0 0 0 0
Annex 3 - J. Reported malaria deaths, 2010–2016
WORLD MALARIA REPORT 2017158

WHO regionCountry/area 2010 2011 2012 2013 2014 2015 2016
AMERICAS
Nicaragua 1 1 2 0 0 0 2Panama 1 0 1 0 0 0 0Paraguay 0 0 0 0 0 0 0Peru 0 1 7 4 4 5 7Suriname 1 1 0 1 1 0 0Venezuela (Bolivarian Republic of) 18 16 10 6 5 8 1
EASTERN MEDITERRANEAN
Afghanistan 22 40 36 24 32 49 47Djibouti 0 0 0 17 28 - -Iran (Islamic Republic of) 0 0 0 0 0 1 0Pakistan - 4 260 244 56 34 33Saudi Arabia 0 0 0 0 0 0 0Somalia 6 5 10 23 14 27 13Sudan 1 023 612 618 685 823 868 984Yemen 92 75 72 55 23 14 65
EUROPEAN
Armenia3 0 0 0 0 0 0 0Azerbaijan2 0 0 0 0 0 0 0Georgia2 0 0 0 0 0 0 0Kyrgyzstan3 0 0 0 0 0 0 0Tajikistan2 0 0 0 0 0 0 0Turkey2 0 0 0 0 0 0 0Turkmenistan3 0 0 0 0 0 0 0Uzbekistan2 0 0 0 0 0 0 0
SOUTH-EAST ASIA
Bangladesh 37 36 11 15 45 9 17Bhutan 2 1 1 0 0 0 0Democratic People's Republic of Korea 0 0 0 0 0 0 0India 1 018 754 519 440 562 384 331Indonesia 432 388 252 385 217 157 161Myanmar 788 581 403 236 92 37 21Nepal 6 2 0 0 0 0 0Sri Lanka3 0 0 0 0 0 0 0Thailand 80 43 37 47 38 33 27Timor-Leste 58 16 3 3 1 0 0
WESTERN PACIFIC
Cambodia 151 94 45 12 18 10 3China 19 33 0 0 0 0 0Lao People's Democratic Republic 24 17 44 28 4 2 1Malaysia 13 12 12 10 4 4 2Papua New Guinea 616 523 381 307 203 163 306Philippines 30 12 16 12 10 20 7Republic of Korea 1 2 0 0 0 0 0Solomon Islands 34 19 18 18 23 13 20Vanuatu 1 1 0 0 0 0 0Viet Nam 21 14 8 6 6 3 2
REGIONAL SUMMARY
African 150 486 104 068 104 105 116 333 99 381 117 836 103 424Americas 190 167 156 95 91 97 110Eastern Mediterranean 1 143 736 996 1 048 976 993 1 142European 0 0 0 0 0 0 0South-East Asia 2 421 1 821 1 226 1 126 955 620 557Western Pacific 910 727 524 393 268 215 341
Total 155 150 107 519 107 007 118 995 101 671 119 761 105 574
Reported malaria can be presumed and confirmed or only confirmed deaths depending on the country. Indigenous malaria deaths are in italics1 In May 2013 South Sudan was reassigned to the WHO African Region (WHA resolution 66.21, http://apps.who.int/gb/ebwha/pdf_files/
WHA66/A66_R21-en.pdf)2 There is no local transmission3 Certified malaria free countries are included in this listing for historical purposes WORLD MALARIA REPORT 2017 159

Notes
WORLD MALARIA REPORT 2017160


For further information please contact:
Global Malaria ProgrammeWorld Health Organization20, avenue AppiaCH-1211 Geneva 27Web: www.who.int/malariaEmail: [email protected]
m a l a r i a a t l a s p r o j e c t
The mark “CDC” is owned by the US Dept. of Health and Human Services and is used with permission. Use of
this logo is not an endorsement by HHS or CDC of any particular product, service, or enterprise.
WO
RL
D M
AL
AR
IA R
EP
OR
T 2017
ISBN 978 92 4 156552 3