Embed Size (px)
Citation preview

An Investment Case for Eliminating Malaria in the Greater Mekong Subregion (GMS)


REPORT
An Investment Case for Eliminating Malaria in the Greater Mekong Subregion (GMS)

Copyright © 2017 UCSF Global Health Group. All rights reserved.
UCSF Global Health Group 550 16th Street, 3rd Floor, Box 1224 San Francisco, CA 94158
AcknowledgementsFunding for this study was provided by the Asian Development Bank and the Bill & Melinda Gates Foundation.
The authors are responsible for any errors or omissions.
Recommended CitationShretta R., Silal S., Avancena A.L.V., Zelman B., Fox K., Baral R., White L. (2017). An investment case for eliminating malaria in the Greater Mekong Subregion. San Francisco: The Global Health Group, University of California, San Francisco.
Produced in the United States of America. First Edition, March 2017.
This is an open-access document distributed under the terms of the Creative Commons Attribution-Noncommercial License, which permits any noncommercial use, distribution, and repro-duction in any medium, provided the original authors and source are credited.
Cover photo: Rima Shretta, UCSF Global Health Group (Cam-bodia: Feb 15 2017)

REPORT
An Investment Case for Eliminating Malaria in the Greater Mekong Subregion (GMS) | July 2017
ContentsKey terms and Acronyms vi
Executive Summary vii
Introduction 1
Background 1Historical financing for malaria in the GMS countries 3Current and projected funding in the GMS countries 5Estimated costs/funding need and gap between now and 2030 at national and regional levels 5Projected funding gap at national and regional levels 6Limitation of funding gap data from NSPs and existing models 7Objective and significance of the study 7
Methodology 8
Cost projections 9Economic benefits estimation 9Return on investment 10Uncertainty analysis 10Limitations 10Gap analysis and opportunities for resource mobilization 10
Results 11
Projected declines in transmission 11Cost of regional and national malaria elimination through 2030 12Return on investment 12Financial gap 13Discussion and opportunities for resource mobilization 13
Conclusion 17
About the Global Health Group 17
References 18
Annexes 20
Annex 1. Health and economic indicators in the GMS countries 20
Annex 2. Methods and data sources 21Annex 3. Individual country transmission plots 25Annex 4. Results of sensitivity analysis 26
The Malaria Elimination Initiative (MEI) at the University of California San Francisco (UCSF) Global Health Group believes a malaria-free world is possible within a generation. As a forward-thinking partner to malaria-eliminating countries and regions, the MEI generates evidence, develops new tools and approaches, documents and disseminates elimination experiences, and builds consensus to shrink the malaria map. With support from the MEI’s highly-skilled team, countries around the world are actively working to eliminate malaria – a goal that nearly 30 countries will achieve by 2020.
shrinkingthemalariamap.org

vi
REPORT
An Investment Case for Eliminating Malaria in the Greater Mekong Subregion (GMS) | Key Terms and Acronyms | July 2017
Key Terms and AcronymsABC ASEAN Business Club
ACT Artemisinin-based combination therapy
ADB Asian Development Bank
APLMA Asia Pacific Leaders Malaria Alliance
ASEAN Association of Southeast Asian Nations
G6PDd Glucose 6-phosphate dehydrogenase deficiency
GDP Gross domestic product
Global Fund Global Fund to Fight AIDS, Tuberculosis and Malaria
GMS Greater Mekong Subregion
IEC Information, education, and communication
IP Inpatient
IRS Indoor residual spraying
ITN Insecticide-treated net
Lao PDR Lao People’s Democratic Republic
LLIN Long-lasting insecticidal net
MBI Mekong Business Initiative
MDA Mass drug administration
MEI Malaria Elimination Initiative
NMCP National malaria control program
NSP National Strategic Plan
OOP Out-of-pocket
OP Outpatient
PAR Population at risk
PMI United States Presidents’ Malaria Initiative
PNG Papua New Guinea
PPP Public-private partnerships
RDT Rapid diagnostic test
RMTF Regional Malaria and Other Communicable Diseases Trust Fund
ROI Return on investment
VLY Value of additional life year
WHO World Health Organization

vii
REPORT REPORT
An Investment Case for Eliminating Malaria in the Greater Mekong Subregion (GMS) | Executive Summary | July 2017
Executive Summary The Greater Mekong Subregion (GMS) had made signifi-cant progress against malaria in the past decade. The Malaria burden has declined by more than 60% in just five years (2011-2015). Multiple factors have contributed to these reductions including the unwavering political and financial commitment to malaria from governments, do-nors, and partners. However, the region continues to face a high burden of disease; gains are fragile and threatened by declining donor support, budget deficits, and persis-tent health system challenges exacerbated by the spread of antimalarial drug resistance. To address this challenge, the World Health Organization (WHO) adopted a regional strategy with the goal to eliminate all malaria species in the GMS by 2030. Achieving this will require an intensifi-cation of efforts accompanied by sustainable financing for the region.
The UCSF Global Health Group’s Malaria Elimination Initia-tive (MEI), in collaboration with the Asia Pacific Leaders Malaria Alliance (APLMA), developed an investment case to estimate the cost of malaria elimination in the region, with economic evidence that highlights the benefits of ma-laria elimination. A mathematical transmission model was developed which projects rates of decline to elimination by at least 2030, and determines the associated costs of the interventions required to reach regional elimination by 2030.
This study found that by employing a variety of aggres-sive interventions, countries in the region would achieve malaria elimination four years before the regional goal of
2030. Regional elimination and prevention of re-introduc-tion will cost about USD 2.4 billion over 14 years (range of USD 2.07-3.28 billion). When comparing aggressive re-gional elimination to a ‘business as usual’ scenario where current levels of malaria control are maintained, over 91,000 lives are saved and 23.5 million cases are averted. In economic terms, these benefits translate to over USD 9 billion in savings. Malaria elimination has a return on investment (ROI) of 5:1 exceeding the minimum threshold returns considered to be a “best-buy” in global public health, comparable to other high value investments such as immunization and cardiovascular research. Malaria elimination results in major cost savings to the health sys-tem by averting micro- and macro-economic losses and generating broader social and economic benefits through increased productivity and household prosperity.
Projected resources available to fight malaria in the GMS are just over half of the total amount required to reach zero. As the region embarks on the final push for malaria elimination, maintaining and intensifying political and financial commitment will be a sine qua non to ensuring success.
Various opportunities exist for domestic resource mobili-zation including expanding the revenue base for malaria through income and hypothecated taxes, public private partnerships and innovative financing approaches. These new mechanisms, coupled with blended financing options that may include buy-downs from traditional donors, are potential sources for additional resources.


1
REPORT
An Investment Case for Eliminating Malaria in the Greater Mekong Subregion (GMS) | Introduction | July 2017
Introduction
Background
Recent efforts to fight malaria in the Greater Mekong Subregion (GMS)a have yielded impressive results and the disease burden across the region has reached a historical low point. In the past five years, the malaria burden has declined by more than 61% from 582,061 cases in 2011
a The term “Greater Mekong Subregion” refers to the international region of the Mekong River basin in Southeast Asia which includes six countries (Cambodia, Lao PDR, Myanmar, Thailand, Viet Nam, and Yunnan Province, China). In this document however, the term “Greater Mekong Subregion” (GMS) refers exclusively to the five Regional Artemisinin-resistance Initiative (RAI) countries (i.e., excluding China).
to 224,471 in 2015 (WHO, 2016a)b. Mortality rates have decreased by 98% from 4,281 deaths in 2000 to 85 in 2015c (Figure 1).
Multiple factors have contributed to these reductions. Governments and partners have made malaria control a priority by increasing investments, strengthening political will, scaling up interventions, integrating malaria con-trol efforts into national health systems, and intensifying cross-border collaboration.
However, the region continues to face a high burden of disease. In 2015, 152.3 million people were at risk of malaria (64% of the population), with about 30 million (12.6%) at high riskd (WHO, 2016b). In addition, the spread of antimalarial drug resistance threatens to undermine the gains made in the past decade fuelling a potential resur-gence of the disease. Drug resistance could lead to 22 million treatment failures and cause 230,000 additional severe malaria cases and 116,000 excess deaths annually globally (Lubell, 2014). To date, resistance of malaria para-sites to the mainstay of malaria treatment, artemisinin, has been detected in all five countries of the GMS (Figure 2). In some areas, resistance to artemisinin and its partner drugs has reached alarming levels, with up to 25% treatment
b These figures are based on data from public sector and community based health services and do not include data from the private sector (except in the case of Cambodia where partial private sector data is included). The overall disease burden is therefore underestimated, but trends are reflective of the overall progress made towards successfully controlling malaria.
c Does not include 3,116 reported malaria cases and 0 confirmed deaths in China.d Does not include Yunnan Province and Guangxi Zhuang Autonomous Re-
gion of China. According to the World Malaria Report 2016, around 33,000 people in China lived in active foci.
THE GMS AT A GLANCE (2015)
Total reported cases of malaria: to 224,471 (55% P. falciparum)Total estimated cases of malaria: 513,000Total deaths: 85 Population at risk: 152.3 million peopleGDP: USD 1.165 trillionGDP per capita: USD 3,105 (growth rate: 6.7%)Health expenditure per capita (2015): USD 20 (Lao PDR) – USD 220 (Thailand)Population living in poverty: 7.2% (Thailand) – 25.6% (Myanmar)
Sources: WMR, 2016, World Bank, 2017
Figure 1. Confirmed cases and deaths of malaria in the GMS countries, 2000-2015
Source: World Malaria Reports 2000–2016, World Health Organization, Geneva. Created by: Epidemiology, Mahidol-Oxford Tropical Medicine Research Unit (MORU).
Total Confirmed Cases of Malariain the Greater Mekong Subregion, 2000-2015
Lao People’sDemocratic Republic
Lao People’s Democratic Republic
Ca
ses/
yea
r
Ca
ses/
yea
r
Cambodia
Cambodia
Viet Nam
Viet Nam
Thailand
Thailand
Myanmar
Myanmar
2000 2001 2002 2003 2004 2005 2006 2007 2008 2009 2010 2011 2012 2013 2014 2015 2000 2001 2002 2003 2004 2005 2006 2007 2008 2009 2010 2011 2012 2013 2014 2015
Total Reported Deaths from Malariain the Greater Mekong Subregion, 2000-2015
800,000
600,000
400,000
200,000
0
5,000
4,000
3,000
2,000
1,000
0

2
REPORT
An Investment Case for Eliminating Malaria in the Greater Mekong Subregion (GMS) | Introduction | July 2017
failure in Cambodia (WHO, 2016a; Imwong, 2017). Drug resistance represents the greatest threat to on-going malaria elimination efforts and health security in the region and the looming threat is also the strongest rationale for undertaking accelerated elimination efforts (Smith-Gueye, 2014). Eliminating malaria and curbing resistance will, however, require intensifying efforts and continuing prioriti-zation of financing for key interventions (APLMA, 2015a).
The epidemiology of malaria in the GMS is dynamic and complex. While all four species of human plasmodia oc-cur, the majority of malaria cases are caused by Plasmo-dium falciparum (P. falciparum) and Plasmodium vivax (P. vivax) (Figure 3).
Malaria transmission in the region is largely restricted to forests and forest fringes in less accessible hilly areas, which are often close to national borders. Malaria trans-mission is exacerbated by the movement of populations, often non-immune, into endemic areas associated with rapid and uneven regional economic growth, socio-economic vulnerabilities, and demographic disparities between countries. Consequently, although every GMS country has a different epidemiological and geopolitical situation, there is widespread consensus that eliminat-ing malaria will require close and constant collaboration. Therefore, in 2014, the World Health Organization (WHO) adopted the Strategy for Malaria Elimination in the GMS, 2015-2030 with the goal of eliminating all malaria species in all GMS countries by 2030 (WHO, 2015c).
Figure 3. Cases of malaria in the GMS in 2015
Source: World Malaria Report 2016. Prepared by Malaria Atlas Project (MAP) and MORU Epidemiology.
Figure 2. ACT failure rates in the GMS in 2016
Source: WHO.

3
REPORT REPORT
An Investment Case for Eliminating Malaria in the Greater Mekong Subregion (GMS) | Introduction | July 2017
Specifically, the strategy outlines an approach to:
• Interrupt transmission of P. falciparum in areas of multidrug resistance, including artemisinin-based combination therapy (ACT) resistance by 2020, and in all areas of the GMS by 2025
• Reduce malaria in all high-transmission areas to less than 1 case per 1,000 population at risk (PAR), and initiate elimination activities by 2020
• Prevent the reintroduction of malaria in areas where it has been interrupted
In parallel, heads of states at the Ninth East Asia Summit in Myanmar in November 2014 committed to the goal of an Asia Pacific free of malaria by 2030 through their sup-port of roadmap for malaria elimination developed by the
Asia Pacific Leaders Malaria Alliance (APLMA) (APLMA, 2015c).
Table 1 presents the breakdown of malaria cases and deaths by country.
Historical financing for malaria in the GMS countriesThe GMS has an overall gross domestic product (GDP) per capita of USD 3,105 ranging from 1,227 in Cambo-dia to 5,662.30 in Thailand. The overall GDP growth rate for the region is 6.7% (2.8% in Thailand to 7.4% in Lao). Public health expenditure varies considerably amongst the countries in the region from about 1% of the GDP in Myanmar to almost 6% in Thailand (World Bank, 2017) in 2014 (Figure 4). Annex 1 contains more detailed econom-ic and health indicators.
Table 1. Breakdown of select malaria indictors in the GMS countries (2015)
Cambodia Lao PDR Myanmar Thailand Viet Nam
Population, in millions 15.6 6.8 53.9 68 91.7
People at risk of malaria, in millions (% of population)
11 (70.7) 6.3 (92.6) 32 (59.5) 34 (50) 68.9 (73.7)
People in high- transmission area, in millions (% of population)
7.5 (48.1) 2.1 (31.2) 8.5 (15.8) 5.4 (8) 6.3 (6.8)
Estimated malaria cases 120,000 88,000 240,000 52,000 14,000
Reported and confirmed malaria cases 68,109 50,724 182,767 23,540 9,331
Reported malaria deaths 10 2 37 33 3
Target elimination date 2025 2030 2030 2024 2030
Source: WMR, 2016
Figure 4. Public health expenditure as a percentage of GDP in the GMS in 2000-2014
0.00%
1.00%
2.00%
3.00%
4.00%
5.00%
6.00%
Cambodia
2000 2005 2010 2014
Lao PDR Myanmar Thailand Viet Nam
Source: Compiled from data from World Bank, 2017

4
REPORT
An Investment Case for Eliminating Malaria in the Greater Mekong Subregion (GMS) | Introduction | July 2017
Total annual financing for malaria in the GMS increased from USD 25 million in 2000 to a peak of over USD 111 million in 2010 (Figure 5).
This declined to about USD 75 million in 2010 before ris-ing back up in 2014 (not shown in graph) with the Region-al Artemisinin Initiative (RAI) grant from the Global Fund for HIV, TB and Malaria (Global Fund), a three-year USD 100 million grant to support the GMS countries to contain
the spread of artemisinin resistance (Regional Artemis-inin-resistance Initiative, 2014; Shretta, et al. 2017). The Global Fund has been the largest external contributor of malaria funding in the GMS in the past decade, provid-ing more than USD 340 million between 2003 and 2013 (Global Fund, 2017).
Table 2 illustrates the historical and current malaria financ-ing from the Global Fund to the GMS countries.
Figure 5. Financing for malaria in the GMS (2000-2013)
Exp
en
dit
ure
s fo
r M
ala
ria
(m
illio
ns
in 2
014
US
D)
2000 2001 2002 2003 2004 2005 2006 2007 2008 2009 2010 2011 2012 2013
‐
20
40
60
80
100
120
Government External
Source: Adapted from Shretta et. al., 2017
Table 2. History of Global Fund malaria financing to the GMS
Country
USD Million
2003-2013 Total 2014-2017
Cambodia USD 120 (2003-2013) USD 45
Lao PDR USD 54 (2003-2013) USD 17.5
Myanmar USD 60 (2005-2013) USD 66
Thailand USD 59 (2004-2013) USD 45
Viet Nam USD 50 (2004-2013) USD 22
RAI Inter-country - USD 15
Total USD 343 USD 210.5

5
REPORT REPORT
An Investment Case for Eliminating Malaria in the Greater Mekong Subregion (GMS) | Introduction | July 2017
Current and projected funding in the GMS countriesIn 2017, total financing for malaria in the GMS is estimat-ed at USD 97.2 million, of which about 36% is from gov-ernments and 37% from the Global Fund (Global Fund, 2017). Dependency on Global Fund varies across the countries. Thailand is comparatively less dependent with about 11% of available funding contributed by the Global Fund, whereas in Myanmar 72% of available funding is contributed by the Global Fund. The remaining is financed by other external donors such as the Bill & Melinda Gates Foundation, the Asia Development Bank (ADB) with sup-port from the governments of Australia and the United Kingdom under the Regional Malaria and Other Commu-nicable Diseases Trust Fund (RMTF), and the US Gov-ernment’s President’s Malaria Initiative (PMI). PMI is the primary non-Global Fund financing source in the region. In FY2017, the PMI budget for the GMS is USD 16.5 million (USD 9 million to Myanmar, USD 4.5 million to Cambodia, and USD 3 million combined to Thailand, Lao PDR, and Viet Nam) (RAI2E, 2017).
The Global Fund will continue to be the primary external financier of malaria programs in the GMS in the next few years. In 2017, the GMS countries were invited by the Global Fund to submit a regional funding request for three years (2018-2020). The new regional funding, renamed the RAI2 Elimination (RAI2E) program, in-line with the elimination goal adopted by all GMS countries, is also aligned with the Malaria Global Technical Strategy, 2016-2030
and the Strategy for Malaria Elimination in the GMS,
2015-2030. The concept note, submitted in May 2017
for USD 243 million, consists of a request for funding for each of the countries to implement their national strategic plans (NSPs) as well as a regional component (14% of the total amount) to complement, coordinate, and boost countries in their efforts to achieve elimination Govern-ment contributions are expected to be approximately USD 320 million for the same period (2018-2020), an increase of 47 million or about 20% compared to 2015-2017. Figure 6 illustrates the relative contribution of the vari-ous funding sources to available financing (Global Fund, 2017).
Estimated costs/funding need and gap between now and 2030 at national and regional levelsThe funding need for the region for 2018-2020 as ex-pressed in the National Strategic Plans (NSPs), is estimat-ed at USD 711.2 million, or an average of USD 237 million annually (RAI2E, 2017). These estimates are derived from the costing of the NSPs of the respective countries based on national estimates of activities and interventions. NSPs often represent country “demand” rather than “need”, they are purposefully, are not costed for elimination and, except for in a few countries, the costs do not build in provisions for efficiency. However, they are often the best available proxies of projected need in the short-term.
Other estimates of need or cost of elimination are also available from mathematical models. WHO has previously estimated the cost of P. falciparum elimination in the GMS region to be USD 3.2 - 3.9 billion over 15 years.
Figure 6. Projected Contribution of funding sources to projected available financing (2018-2020)
Global Fund allocation
Cambodia Laos Myanmar Thailand Vietnam Total
Government Non GF external
0%
10%
20%
30%
40%
50%
60%
70%
80%
90%
100%
53%
25%
22%
61
23
16
%
%
6%
72%
25%
2%
11%
89%
1%
33
65
3
%
%
%
37%
57%
5%
Source: Global Fund, 2017
6
REPORT
An Investment Case for Eliminating Malaria in the Greater Mekong Subregion (GMS) | Introduction | July 2017
The NSP projections indicate that government contri-bution to malaria control and elimination in the GMS is expected to finance about 57% of the total funding need from 2018-2020, while the Global Fund will contribute about 29% of total need (Global Fund, 2017).
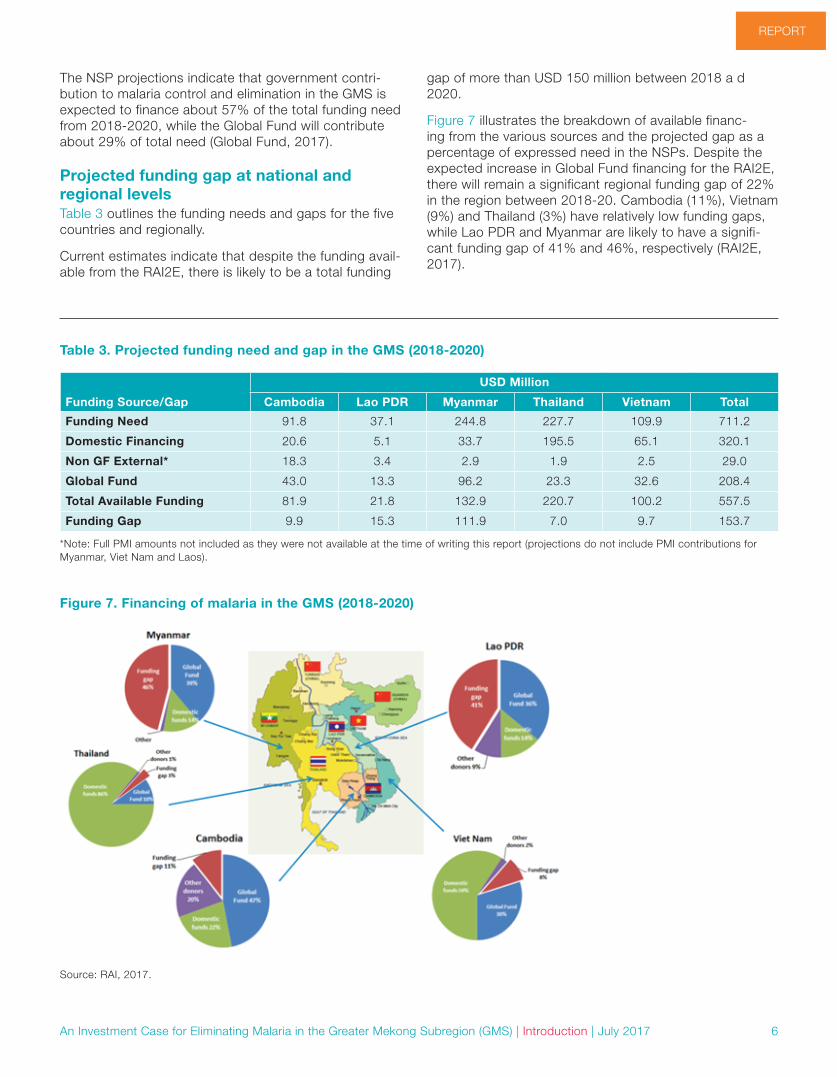
Projected funding gap at national and regional levelsTable 3 outlines the funding needs and gaps for the five countries and regionally.
Current estimates indicate that despite the funding avail-able from the RAI2E, there is likely to be a total funding
gap of more than USD 150 million between 2018 a d 2020.
Figure 7 illustrates the breakdown of available financ-ing from the various sources and the projected gap as a percentage of expressed need in the NSPs. Despite the expected increase in Global Fund financing for the RAI2E, there will remain a significant regional funding gap of 22% in the region between 2018-20. Cambodia (11%), Vietnam (9%) and Thailand (3%) have relatively low funding gaps, while Lao PDR and Myanmar are likely to have a signifi-cant funding gap of 41% and 46%, respectively (RAI2E, 2017).
Table 3. Projected funding need and gap in the GMS (2018-2020)
Funding Source/Gap
USD Million
Cambodia Lao PDR Myanmar Thailand Vietnam Total
Funding Need 91.8 37.1 244.8 227.7 109.9 711.2
Domestic Financing 20.6 5.1 33.7 195.5 65.1 320.1
Non GF External* 18.3 3.4 2.9 1.9 2.5 29.0
Global Fund 43.0 13.3 96.2 23.3 32.6 208.4
Total Available Funding 81.9 21.8 132.9 220.7 100.2 557.5
Funding Gap 9.9 15.3 111.9 7.0 9.7 153.7
*Note: Full PMI amounts not included as they were not available at the time of writing this report (projections do not include PMI contributions for Myanmar, Viet Nam and Laos).
Figure 7. Financing of malaria in the GMS (2018-2020)
Source: RAI, 2017.

7
REPORT REPORT
An Investment Case for Eliminating Malaria in the Greater Mekong Subregion (GMS) | Introduction | July 2017
Limitation of funding gap data from NSPs and existing modelsData from NSPs offer valuable information about ex-pressed demand. However, they cannot be used to accurately cost the needs for elimination. Most NSPs are three to five year plans and are often not consistent of a comprehensive, long-term elimination plan purposefully costed for elimination in a standardized way. Except for in a few countries, the estimates do not build in provisions for efficiency and are therefore likely to be overestimations of need.
Previous regional estimates were based on a deterministic cost model whose outputs were fully determined by the parameters and conditions set by the analysts, such as the mix and scale of interventions that countries might re-quire to achieve elimination. The costs were not informed by predictions using epidemiological models that estimate the impact of interventions against the transmission of the disease. Other estimates have relied on transmission models whose exclusive focus is on P. falciparum malaria. In the GMS, P. vivax and other Plasmodium species are common and the impact of malaria interventions, such as long-lasting insecticidal nets (LLIN) and indoor residual spraying (IRS), on those differ across species. Additionally, these models applied malaria transmission dynamics from sub-Saharan African countries where transmission is high and stable, which means that the model is likely unsuit-able for malaria-eliminating countries in Asia.
Objective and significance of the studyThe UCSF Global Health Group’s Malaria Elimination Initia-tive (MEI) and APLMA partnered to develop an invest-ment case to estimate the cost of malaria elimination in the GMS and to generate evidence that highlights the economic benefit of malaria elimination and prevention of reintroduction. Specifically, the objective of this work was to:
• Estimate the cost to achieve the goal of malaria elimi-nation in the GMS region by 2030
• Generate an investment case for malaria by estimat-ing the economic benefits of malaria elimination
• Identify the funding gaps and explore the potential opportunities for generating financial resources for achieving elimination goals
Past studies suggest that major financial constraints and lack of political will can derail success and lead to resurgence of malaria (Cohen, 2012). Better estimates are therefore needed to sufficiently plan for the financial requirements for elimination and provide evidence for advocacy for sustained financing,.

8
REPORT
An Investment Case for Eliminating Malaria in the Greater Mekong Subregion (GMS) | Methodology | July 2017
MethodologyWe used outputs from a dynamic epidemiological trans-mission model to estimate the costs and benefits of malaria elimination. The model predicted the reductions of malaria incidence required to reach malaria elimination on or before 2030 (based on a set of intervention cover-age scenarios). Three scenarios were simulated, and outputs from three scenarios were used in the investment case. Two scenarios were used as the counterfactual to malaria elimination: business as usual and reverse sce-narios (details on the model and its limitations are found in Annex 2). Figure 8 illustrates a summary of the scenarios used in the transmission mode.
• Business as usual This scenario projects the malaria burden in 2016-2030 based on continuing the mix and scale of ma-laria interventions implemented in 2014.
• Reverse scenario This scenario projects the malaria burden in 2016-2030 assuming that LLIN distributions cease and treatment rates fall by 50% a would be likely should external funding be suspended.
• Elimination scenario(s) The mathematical model was developed to estimate the impact of intervention scenarios against the trans-mission of P. falciparum and P. vivax malaria in 2016-2030 in each of the five countries. Each scenario
comprises several activities such as LLIN distribution, treatment, and surveillance. Scenarios were explored under two assumptions of future artemisinin resis-tance:
• Stable Resistance: probability of treatment fail-ure to ACTs is constant at 5% for all countries
• Increasing Resistance: probability of treat-ment failure to ACTs is constant at 5% across all countries until 2018, when it increases steadily to 30% between 2018 and 2025 to account for the possibility of artemisinin resistance spreading to all of the GMS.
Mass drug administration (MDA) is an intervention that has received increasing interest in the last decade with respect to its role in malaria elimination. MDA was also incorporated in addition to any scenario in the following manner:
• Five annual rounds of MDA at 50% coverage, from 2018, starting 4 months before the peak of the sea-son
In a third set of simulations, if elimination was not achieved, LLIN scale-up was incorporated in accordance with WHO guidelines. LLIN coverage was increased in addition to any scenario as an option to 80% coverage in three-year distribution cycles from 2017 to 2026.
These additional rates of decline were projected separately.
Figure 8. Scenarios used in the transmission mode

9
REPORT REPORT
An Investment Case for Eliminating Malaria in the Greater Mekong Subregion (GMS) | Methodology | July 2017
In all cases, a declining PAR was used as predicted by the models. The PAR values used to estimate costs in the model were adjusted to incorporate the decrease in incidence predicted due to elimination-focused interven-tions. Historical incidence and PAR data were analyzed statistically to infer a predicted change in PAR for a given change in incidence. This relationship was applied to the 2015 PAR data and updated every year until 2030 as interventions were applied in the modelled scenarios. This method has limitations including a non-standardized definition of PAR.
Elimination was defined as the first year in which less than one reported clinical case is achieved. Note that the mod-els do not distinguish between indigenous and imported cases, hence, we estimated elimination thresholds based on the output of a regression model of indigenous and im-ported cases from countries that have recently eliminated. The scenario that allowed attainment of the elimination threshold using a minimum package of interventions was considered as the “elimination” scenario.
Cost projectionsWe built a companion cost estimation model aligned with the outputs of the transmission model to estimate the costs associated with implementing each of the scenarios above. Program costs were modeled to include costs of testing and treatment of uncomplicated and severe ma-laria, LLINs, IRS, supply chains, service delivery (outpatient and inpatient), surveillance, community health workers (CHWs), information, education, and communication (IEC), training, MDA, new treatments, and a new radical cure for P. vivax (tafenoquine). Unit costs for each of these inputs were obtained using a combination of empirical data col-lected in the country by UCSF/MEI, literature reviews, and proxies when neither of the previous options was available. The cost inputs for the model are provided in Annex 2.
The minimum elimination packages were costed under two scenarios:
• Interventions are applied to the entire PAR (low and high risk)
• Interventions are applied focally to a subset of the PAR (70%)
The total cost of the elimination scenario(s) of interest was used to construct the investment case. The costs to reach elimination were calculated separately for each country and then summed to obtain the total cost of elimination in the region. To calculate the incremental or additional costs of elimination (which is used to calculate the ROI), we sub-tracted the estimated costs of the business as usual and reverse scenarios from the elimination scenario. All costs were discounted at 3% to net present value.
Economic benefits estimationWe used outputs from the transmission models that esti-mated the mortality and morbidity averted (by subtracting the estimated cases and deaths of the elimination sce-nario from the corresponding outputs of the business as usual and reverse scenarios) and compared the elimina-tion scenario(s) to the counterfactual baseline scenarios. The economic benefits estimation was developed using the full-income approach as recommended by the Lancet Commission on Investing in Health (Jamison et al, 2013).
The economic burden averted in the elimination scenario was categorized based on three broad dimensions: 1) cost to the health system, 2) cost to the individual house-holds, and 3) cost to the society and estimated using the averted deaths and cases through elimination:
1. Cost averted to the health system: these were the costs averted for diagnosis and treatment costs as inpatients and outpatients
2. Cost averted to the individual households: these are out of pocket expenditures for seeking care
3. Cost averted to the society: patients lost productivity due to premature death and morbidity and caretakers reduced economic output as a result of taking care of patients was calculated
The same inputs used in the cost estimates were used for the economic benefits estimation. Unit costs of case man-agement include outpatient visits, diagnostic tests, and drug treatments for uncomplicated malaria cases as well as hospital hotel costs and drug treatments for severe malaria cases. Out-of-pocket (OOP) expenditures were estimated by applying the country-specific OOP expen-diture per capita for each outpatient and inpatient. We calculated productivity loss among patients and caretak-ers by multiplying an estimate of daily productivity by the number of days lost due to illness or care seeking. The total income approach was used to determine the eco-nomic impact of lost productivity due to illness and death. This approach quantifies the value that people place on living longer and healthier lives. The value-of-statistical-life method was used to evaluate population-level reductions in mortality risk. Specifically, we assumed that the global value of a one-year increase in life expectancy was 2.2 times the GDP per capita for each of the countries as recommended by the Lancet Commission on Investing in Health. This was applied to the numbers of life-years saved though elimination.
Economic benefits were calculated by adding together the cost averted to the health system to the cost averted to the individual households and cost averted to society. The economic benefits of elimination were calculated sepa-rately for each country and then summed to obtain the total benefit for the region.

10
REPORT
An Investment Case for Eliminating Malaria in the Greater Mekong Subregion (GMS) | Methodology | July 2017
Return on investment The ROI was calculated by obtaining the net economic benefit by subtracting the incremental cost of elimina-tion from the economic benefits obtained above. The net benefit was then divided by the incremental cost of elimination. We performed the return on investment analy-sis for 2016-2030 for the elimination scenario with drug resistance compared with the counterfactual “business as usual” and reverse scenarios. All costs and economic benefits are presented in 2015 US dollars, and future costs and benefits were discounted at 3% to the present value. The ROI is interpreted as the economic return from every additional dollar spent on malaria elimination above the business as usual scenario.
Uncertainty analysisWe performed stochastic sensitivity analysis on the epi-demiological and cost outputs of the transmission model. The minimum, median, and maximum malaria cases and deaths predicted by the model for each scenario were used to calculate the minimum, median, and maximum economic benefits.
For the costs, we assigned an uncertainty interval of +/-25% on the value of the input costs used. Three hundred random samples were drawn, which generated a range of costs. From the range of costs generated, we determined the minimum, maximum, median, mean, and other mea-sures (e.g., percentiles), which are presented in Annex 2 (Table A2-2).
LimitationsThere are considerable uncertainties associated with the estimates. We were unable to predict the impact that eco-nomic development and housing improvements may have on malaria transmission or how the costs of commodities or interventions may change at the global or national lev-els. In addition, the cost of new interventions such as new LLINs, treatments, and tafenoquine specifically are based on historical estimates of the cost of new tools when they were first adopted rather than actual costs.
In calculating the benefits of elimination, we did not ac-count for the impact of elimination on tourism or on cogni-tive development, as there are no reliable quantitative estimates on how malaria elimination may impact these variables. Our benefits estimations are therefore likely to be conservative. The malaria transmission model itself has inherent limitations, which may introduce uncertainty to the benefits estimations. A sensitivity analysis was con-ducted to test the robustness if the findings in relation to these uncertainties.
Gap analysis and opportunities for resource mobilizationUsing available malaria financing data in the GMS (ex-ternal and government), we estimated the potential gap in financing assuming the total funding envelope would remain the same. Lastly, we assessed potential oppor-tunities for resource mobilization to fill financing gaps by mapping the main private sector investors and analyzing the domestic funding landscape.

11
REPORT REPORT
An Investment Case for Eliminating Malaria in the Greater Mekong Subregion (GMS) | Results | July 2017
Results
Projected declines in transmissionFigure 9 and Table 4 illustrate the predicted output of the transmission model modeled under a scenario of increas-ing artemisinin resistance.
The model predicted that with aggressive interventions, elimination can occur as early as 2023 in Cambodia to 2026 in Thailand, four years before the WHO target for the GMS and the APLMA roadmap target for the Asia Pacific. In Vietnam, elimination is possible with the scale up of existing interventions - a “more of the same” approach. In Thailand elimination is possible with the introduction of a new vivax treatment. Cambodia, Lao and Myanmar will require a combiantion of new technologies and MDA.
Figure 10 illustrates median cases between 2016-2030 un-der the business as usual scenario and minimum elimination scenario for the region. (country level outputs are illustrated in Annex 3). In the business as usual scenario, clinical cases rise from an estimated 1.3 million in 2016 to 2 million in 2026 and over 2.5 million by 2030. The business as usual scenario assumes that all current activities are maintained, but artemisinin resistance increases to 30% by 2018. In the reverse scenario, cases increase to over 6 million by 2028. Elimination is achieved in the elimination scenario using a variety of interventions in the five countries. Elimination averts over 23.5 million clinical cases; 3.2 million reported cases and approximately 91,000 deaths in the regione.
In a worst case scenario, where malaria elimination inter-ventions are reduced (reverse scenario), there will be an additional 33.8 million new clinical cases and 146,480 excess deaths.
e A Clinical malaria case is an individual who tests positive for malaria while displaying malaria-related symptoms such as fever, headache and vomit-ing. A reported malaria case refers to a malaria case reported by medical units and medical practitioners to either the health department or the malaria control program, as prescribed by national laws or regulations.
Table 4. Scenarios and predicted elimination dates
Predicted elimination date (range)
National elimi-nation goal
Minimum elimination scenario and interventions
Elimination scenario with LLIN scale up
Cambodia 2023 (2022,2030)with and without LLIN
scale-up
2025 New vector control technology plus MDA (scenario 79)
Effective usage plus MDA (scenario 37)
Lao PDR 2025 (2022, >2030) with and without LLIN
scale-up
2030 (regional) New P. falciparum medicine (scenario 40) plus MDA & ITN scale
up to 80% (scenario 40)
NA
Myanmar 2025 (2024, >2030) with and without LLIN
scale-up
2030 (regional) New P. falciparum medicine (scenario 40) plus MDA & ITN scale
up to 80% (scenario 40)
NA
Thailand 2026 (2025, 2029)2025 (with LLIN scale
up)
2024 New Pv medicine (scenario 68) Effective usage (scenario 27)
Vietnam 2024 (2022, 2027) with and without LLIN
scale-up
2030 Effective usage (scenario 67) Effective usage (scenario 27)
Figure 9. Predicted minimum elimination scenarios

12
REPORT
An Investment Case for Eliminating Malaria in the Greater Mekong Subregion (GMS) | Results | July 2017
Cost of regional and national malaria elimi-nation through 2030Costs were modeled based on the elimination scenario (Figure 9 and Table 4). In total, the median cost to reach elimination by 2030 in all five countries is estimated to cost USD 2.4 billion (interquartile range of USD 2.07-3.28 billion). The annual cost in 2017 for the elimination scenar-ios is about USD 130 million, peaking in 2020 at USD 415 million, and declining to less than USD 100 million after 2030. Costs incurred are expected to continue after elimi-nation as interventions to prevent the reintroduction of malaria continue. Figure 11 illustrates the costs of malaria elimination in the GMS. When modeled using LLIN scale-up to 80% of the PAR in countries where LLINs were not needed in the minimum elimination scenario (Cambodia, Thailand, and Vietnam), the total cost to reach elimination by 2030 in all five countries increased marginally to USD 2.52 billion. The elimination dates remained the same in all, except Thailand for which the elimination date was brought forward by five years to 2025.
If interventions were applied to only 70% of the PAR in the low transmission areas total costs would be reduced by 20%. In a “worse case” scenario, where malaria elimina-tion interventions are reduced (reverse scenario), there would be an estimated USD 16 billion in extra costs.
Table 5 illustrates the national level cost of malaria elimi-nation in each of the five GMS countries.
Return on investmentThe cost of malaria elimination should be weighed against the epidemiological and economic costs of inaction. When the benefits of elimination were compared to the cases and costs averted in the business as usual scenario of the transmission model for the period of 2016 – 2030, the benefits outweighed the costs by a factor of 5.6. The return for each additional dollar invested in malaria elimination was calculated to be 5.1 to 1. Table 6 summa-rizes the costs and benefits of elimination for the different scenarios.
Table 5. National cost of malaria elimination
Cambodia Lao PDR Myanmar Thailand Vietnam
Total cost USD: 2016-2030 368,986,250 285,536,761 1,222,887,616 263,604,231 362,779,671
(IQR) (311,624,282 - 436,152,105)
(237861548-397257011)
(1,012,814,804- 1,604,270,296)
(215,067,110- 41,982,362)
(296,401,335- 501,403,127)
Figure 10. Transmission prediction for GMS (2016-2030)
Thailand eliminates
Lao & Myanmar eliminate
Vietnam eliminates
Cambodia eliminates
Ca
ses
De
ath
s
2016 2017 2018 2019 2020 2021 2022 2023 2024 2025 2026 2027 2028 2029 2030
Esimated clinical (BAU) Cases reported (BAU) Estimated clinical (Elim) Cases Rep (Elim) Estimated clinical (rev) Deaths
8,000,000
7,000,000
6,000,000
5,000,000
4,000,000
3,000,000
2,000,000
1,000,000
-
4,500
4,000
3,500
3,000
2,500
2,000
1,500
1,000
500
-

13
REPORT REPORT
An Investment Case for Eliminating Malaria in the Greater Mekong Subregion (GMS) | Results | July 2017
Figure 11. Modeled costs of the elimination scenario 2016-2030
2017 2018 2019 2020 2021 2022 2023 2024 2025 2026 2027 2028 2029 2030
2017-2020USD 1,291,423,141
2021-2025USD: 919,575,246
2026-2030USD: 197,009,897
Viet Nam
Thailand
Myanmar
Cambodia
Lao
Co
st U
SD
(20
15)
Mill
ion
s
450
400
350
300
250
200
150
100
50
-
2017-2030 2021-2025 2026-2030 2017-2030
Cost (USD) 1,291,423,141 919,575,246 197,009,897 2,503,794,529
Cases averted 3,283,050 8,497,343 11,722,232 2,408,008,284
Deaths averted 12,059 31,105 48,014 91,177
Table 6. Summary of costs and benefits
Scenarios compared Total cost Cases averted
Deaths averted
Economic benefits (USD)
Incremental cost (USD)
ROI
Business as usual vs. elimination (baseline)
2,544,684,531 18,167,808 60,437 6,725,960,586 1,617,262,790 3:1
Business as usual vs. elimination (with resistance assumption)
2,408,008,284 23,502,625 91,177 9,032,334,129 1,614,220,586 5:1
Reverse vs. elimination (with resistance assumption)
NA 33,808,119 146,480 NA NA N/A
Business as usual vs. elimination (with resistance and LLIN scale up assumption)
2,427,408,107 23,542,734 81,523 6,964,579,866 1,873,105,591 3:1
Financial gapA median resource envelope of USD 277 million is needed annually until 2020 and about USD 184 million for the fol-lowing five years to achieve elimination. Total financing for the GMS is projected to be USD 148 million annually for 2018-20 with the anticipated RAI2E grant from the Global Fund, still leaving a gap of 45% of the need until 2020. Total financing for the region is expected to drop signifi-cantly after the end of the RAI2E grant, further widening the gap.
Discussion and opportunities for resource mobilizationThis analysis compared the monetized value of expected benefits from malaria elimination to the investment costs over a 14-year investment period (2017-2030), demon-strating a median return of more than 5 times the invest-ment. Even with conservative estimates on the morbidity and mortality averted from malaria elimination not incor-porating the distal benefits such as tourism and cognitive

14
REPORT
An Investment Case for Eliminating Malaria in the Greater Mekong Subregion (GMS) | Results | July 2017
development externalities, the ROIs remain robust, com-parable to those obtained for other high impact invest-ments such as immunization programs and cardiovascular disease research.
The total cost of achieving elimination and preventing its reintroduction was estimated at about USD 2.4 bil-lion over 14 years. The study found that by employing a variety of aggressive interventions, the region can elimi-nate malaria by 2026 – four years before the 2030 APLMA goal. The health, social, and economic returns are poten-tially formidable. Malaria elimination will save over 90,000 lives and avert over 23.5 million cases translating to economic benefits of over USD 9 billion. These economic data are key for understanding the requirements for fully funding the malaria elimination strategy and the poten-tial returns of the investment, particularly in the context of evolving health priorities, which can create a void in resources needed to eliminate the disease. The poten-tial consequences of funding reductions at this critical juncture can be serious. A systematic review of malaria resurgence found that interruption of financing was one of the most critical factors that led to 75 resurgence events in the 61 countries reviewed (Cohen, 2012).
Successfully achieving elimination in the GMS will require sustained financial resources. The Global Fund currently plays a large role by funding a large percentage of all GMS malaria needs. The RAI2E grant of USD 243 million is expected to be disbursed in 2018-2020 and will play an important role in financing priority interventions in the region. However, given declining trends in malaria burden and the region’s rising economic status, this level of sup-port is not likely to be sustained in subsequent years. As-suming a linear trend of current resources, there is still a substantial annual financial gap of about 50%. As external funding decreases, new revenue generation, prioritiza-tion of domestic funding, and improved efficiencies in the existing malaria envelope need to be explored.
The GMS countries are at various stages of economic development. Thailand and Viet Nam are rapidly industrial-izing countries, with a growing manufacturing sector, and both are part of major global value chains (ADB, 2016b). Thailand is a regional hub for the manufacturing of cars while the economies of Cambodia, Lao PDR and Myanmar continue to have a large agricultural component account-ing for more than 25% of GDP (Chandran, 2014). Thailand has a GDP per capita of USD 5,662 while the other coun-tries had GDP per capita ranging from USD 1,227–2,164 in 2015. Overall, the region has experienced strong GDP growth rates of 6.5% over the past five years. In 2014, public health expenditure was 5.6% of GDP in Thailand, while Myanmar spends 1.045% and Lao PDR spends only 0.943% of their GDP on health (World Bank, 2017). While the GMS countries have enjoyed robust growth in recent years, this growth is unbalanced, with significant differ-ences in the levels of income and the development of the social sectors (ADB, 2016a). This has led to substantial
cross-border migration, mainly as people move from less developed to more developed countries in search of job opportunities. (ADB, 2016b; Cuong, 2016).
At the same time, governments are implementing reforms to improve the efficiency and productivity of the economic sectors. These initiatives have increased Foreign Direct Investment in the region and garnered greater private sector interest. Air travel has doubled between 2010 and 2015 increasing connectivity and facilitating trade and tourism has almost quadrupled since 2000. These and other developments have created several opportunities for resource mobilization for malaria and human health security including leveraging the private sector’s consider-able resources and networks. Public-private partnerships (PPPs) can facilitate investments in malaria elimination through government incentives, such as tax relief or tax credit schemes, policies that promote expansion or diver-sification programs, awards in recognition of companies that contribute to malaria elimination efforts, or instituting requirements such as health impact assessments from infrastructure and other projects. These PPP strategies can be linked to universal health coverage. For example, the Cambodian Ministry of Health has developed a policy framework for PPPs in the health sector. Investing in ma-laria elimination also has wider implications for the health security of communities in the GMS (APLMA, 2015b, 2016). Strengthened health systems will be better able to respond to the health needs of the communities and be an important cornerstone of universal health coverage, while a robust surveillance system will be a crucial tool against emerging and re-emerging infectious diseases.
Networks such as the Mekong Business Initiative (MBI),f
which is focused on promoting business environment reforms and private sector development in the GMS, can play a critical role together with other regional platforms that link the public and private sectors. MBI focuses on enterprise development, commercial law, financial ser-vices, incubation, and acceleration (ADB, 2017). Activities could include: supporting the creation of new and innova-tive approaches; commodity development utilizing private sector’s distribution networks and transportation (e.g., helicopters, trucks, boats, etc.) to deliver commodities to hard-to-reach communities; technology transfer; and sup-ply chain management amongst others.
Private foundations can also play important roles in mobi-lizing resources. For example, in PNG, foundations estab-lished by corporations are actively involved in addressing community issues. The region has a number of business platforms that can be included to promote the involve-ment of the burgeoning private sector. For example, the ASEAN Business Club (ABC) is a leading platform that brings together leading business people from Southeast
f The MBI aligns to the ADB Strategy 2020 focus on private sector development, as well as the GMS Economic Cooperation Program Strategic Framework (2012- 2022).

15
REPORT REPORT
An Investment Case for Eliminating Malaria in the Greater Mekong Subregion (GMS) | Results | July 2017
Asia to promote business integration in the context of the ASEAN Economic Community. Health can be proposed as an issue for the ABC to address as part of their busi-ness activities. The ASEAN Tourism Association covers the travel and tourism sector across the ten Southeast Asian countries including all five GMS countries; it could support engagement of the tourism sector in malaria elimination efforts, particularly as tourism plays a major role in the economies of all GMS countries contributing to about 30% of Cambodia’s GDP and 19.3% of Thailand’s economy (UCSF/MEI, 2017, UNESCAP, 2017).
Multilateral development banks and partners can pro-vide new financing opportunities to governments and the private sector, including cross-sectoral financing for health programs, incentivizing companies to invest in health interventions. They can also provide technical assistance to support governments to improve regulatory frameworks in a number of areas including health, private sector development, insurance, etc. For example, ADB provides grants, concessional loans, and technical assistance to countries in the region. Although ADB does not finance malaria interventions specifically, it does co-fund for ex-ample, the Rural Primary Health Services Delivery Project in Papua New Guinea (PNG) that aims to improve ac-cess to and quality of rural health services, which can be leveraged for malaria (ADB, 2016b). Countries can seek out additional grants and soft-loans from ADB to help frontload the costs of elimination. ADB’s RMTF could also provide supplemental financing for selected high-impact malaria projects.
International and regional funds pooling resources from various sources including governments, aid agencies, development institutions, corporations, foundations, and individuals may efficiently finance certain causes or objec-tives. The pooling of resources reflects a shared commit-ment to fight specific problems at the local, regional, or global levels. The RAI2E grant, a regional funding mecha-nism, may be expanded to include pooling from other sources of financing.
Other means of increasing domestic financing include the use of innovative financing mechanisms which include (a) instruments for resource generation and pooling and (b) fund deployment mechanisms and are favorably viewed as a means to meeting the short- and medium-term needs of health and other development sectors. These may include health bonds, debt swaps and blended financing mechanisms. Debt conversion mechanisms shift resources away from debt repayments towards develop-ment spending. An example is a “debt buy-down” where portions or an entire debt of a country is paid by a donor in exchange for achieving predetermined results. In a debt swap, a lender or donor writes off parts of a country’s debt; in turn, the government invests an agreed amount on a specific program. Debt swaps have been used in several countries by the Global Fund, Germany, and Australia. Partnerships between multilateral development
banks and traditional donors can provide short-terms so-lutions and shared risk, tying key performance indicators linked to disbursements. Several multilateral development banks are currently engaged in these models including ADB, the Inter-American Development Bank, the Islamic Development Bank, and others in collaboration with the Bill & Melinda Gates Foundation, the Global Fund and other partners (USCF/MEI, 2017). Social impact bonds and development impact bonds are other types of perfor-mance-based contracts that have been implemented in selected settings. One example is the Mozambique Malar-ia Performance Bond, which is being used to raise fund-ing from “outcome funders” or investors interested in both financial and social return (Murray, 2016; Devex Impact, 2016). As the first “malaria bond” of its kind, investors are only paid when the malaria program meets its targets (Devex Impact, 2016). These innovative instruments have been used to raise financing for health and other sectors, such as education and environment (Kumar, 2013).
“Sin taxes,” or taxes on harmful products such as alco-hol and tobacco, are another way to potentially increase supplementary revenue for health and have been suc-cessfully implemented in other Asian countries. The Philip-pines instituted a “sin tax” that generated an additional USD 2.3 billion in revenue during the first two years of implementation (Paul J., 2015). As a result, health funding in the Philippines increased by 57.3% in 2014 and 63.2% in 2015 (in comparison to 2013). Other types of taxes include levies on sugar-sweetened beverages, foreign currency transactions, and transactions in international finance markets. The large revenue base and the long-term nature of taxes make such instruments reliable and sustainable sources of funding.
In general, tax revenue (in 2016) as a percent of GDP in the GMS countries is between 13.1% in Myanmar to 24% in Vietnam. The Addis Ababa accord for the Sustainable Development Goals recommends that countries with gov-ernment revenue below 20% of GDP from taxes should progressively increase tax revenues to meet the 20% tar-get by 2025. Allocating a portion of tax revenue to malaria could provide a sustainable source of funding to help the region to fill the financing gap (UNGA, 2015).
Another option for resource mobilization is to find funding efficiencies in the current domestic funding landscape. For example, the malaria programs can work with other ministries such as agriculture, or with other mosquito borne diseases such as dengue to integrate approaches and interventions. Increasing program efficiencies can help maximize limited resources. Greater efficiency can be achieved by targeting and implementing an optimal mix of malaria interventions that will create the most impact; or by maximizing the impact of current inputs to the malaria program. While there is currently no global recommenda-tion for an optimal mix of interventions to achieve malaria elimination, technical or programmatic efficiencies may significantly decrease the projected cost of elimination.

16
REPORT
An Investment Case for Eliminating Malaria in the Greater Mekong Subregion (GMS) | Results | July 2017
An important consideration is the expanded role of advocacy to increase the national budget for elimina-tion. Beyond the benefits of achieving malaria-elimination explained in this report, other benefits are likely but are harder to quantify. As a byproduct of national elimination, other positive externalities such as increased tourism, a strengthened health system, and improved regional health security could result. This investment case provides robust evidence for the minimum benefits of continued prioritization of funding for malaria as well as options for resource mobilization; they can be used to develop an advocacy strategy for increased domestic and external funding for improving health security and to reach the regional goal to be malaria-free by 2030.
There are a number of unknown factors and limitations that impact on the findings of this report. The costs of medicines and other interventions have been estimated based on available data and proxies when data were un-available. In particular, separating out the cost of interven-tions in integrated systems is challenging and the analysts have relied on country level partners to apportion the amounts spent on each intervention to arrive at disag-gregated costs. In addition, the costs are highly depen-dent on the output of the transmission model, which was developed using national; level data on incidence and in-tervention coverage. These estimates are subject to error particularly in countries with heterogeneous transmission patterns. Furthermore, elimination often requires targeted interventions to risk areas or populations, rather than ubiquitous coverage to an entire country. Without subna-tional estimates of incidence and coverage, targeted inter-ventions are difficult to estimate and cost.
While we have tried to estimate the effect that drug and insecticide resistance would have on cost, it is impossible at this stage to know the future extent and effect of drug and insecticide resistance and the actual interventions that would be put in place to address these which would likely impact the costs. The impact and cost of known tools in the innovation pipeline have been modeled, however, the impact of new tools and approaches not yet developed is unknown and will be likely to decrease costs. Moreover, the cost of new tools is greatest at the time of adoption with economies of scale and competition driving costs down over time. It is difficult to predict how the costs of interventions may change at the regional or national levels over time.
Lastly, current assessments of reported malaria incidence have limitations. Research suggests that there may be significant under-reporting in the scale of global malaria incidence and mortality due to the weakness of health reporting and information management systems and widespread and undocumented use of the private sec-tor in many endemic countries. For example, the IHME estimated a figure of 1.2m malaria deaths in 2010—al-most double the WHO’s figure of 655,000 (Murray, 2012). There have been various attempts at quantifying the true burden and more recent publications of the World Malaria Reports contain data on reported cases to health facili-tates as well as estimated cases based on a number of assumptions. This report utilizes reported cases from the World Malaria Reports as well as estimated clinical cases for the countries in the Asia Pacific region derived by the Mahidol-Oxford Tropical Medicine Research Unit in col-laboration with a number of partners including the WHO (Maude, 2017). These estimates were obtained by com-bining and triangulating data from a variety of data sourc-es. The revised burden data were used to populate the models used in this analysis. Both reported and estimated clinical cases are depicted in the graphs. Nevertheless, the wide variation in estimates of burden makes it harder to be sure of the resources required to eliminate the dis-ease. Without an informed and complete understanding of the current cartography of malaria risk and prevalence, future projections of the cost of eliminating malaria face overwhelming uncertainty. We believe that the estimated benefits of elimination are conservative, as we did not ac-count for the impact of elimination on tourism or on cogni-tive development, as there are no reliable quantitative estimates on how malaria may impact on these. Because of these uncertainties, it is well understood that estimated costs can only provide an indicative guide at present to help frame financing needs. It is therefore important that economic estimates are constantly reviewed in the light of new information, through to 2030. This however, makes it even more important that funds can be put in place quickly to match currently expected costs.
This investment case provides evidence for the minimum benefits of continued prioritization of funding for malaria, and can be used to develop an advocacy strategy for in-creased financing to reach the region’s goal to be malaria-free by 2030. The window of opportunity to eliminate the parasite before drug resistance spreads is closing fast. The elimination of malaria in the GMS constitutes a human security and public health emergency.
17
REPORT REPORT
An Investment Case for Eliminating Malaria in the Greater Mekong Subregion (GMS) | Conclusion | July 2017
ConclusionGlobal progress against malaria has been dramatic over the past decade. These gains, however, have been driven by substantial political and financial commitments that must be sustained to avoid a resurgence of malaria. Declining financing for malaria is an imminent threat to malaria elimination, the spread of drug resistance, and regional health security in the GMS. This investment case provides compelling evidence for the benefits of contin-ued prioritization of funding for malaria, and can be used to develop an advocacy strategy for increased domestic and external funding for the GMS to reach its goal to be malaria-free by 2030.
About the Global Health Group
The Global Health Group at the University of California, San Francisco (UCSF) is an ‘action tank’ dedicated to translating new evidence into large-scale action to im-prove the lives of millions of people. The Global Health Group’s Malaria Elimination Initiative (MEI) was launched in 2007 to accelerate progress in countries and regions that are pursuing achievable and evidence-based elimination goals and paving the way to malaria eradication.
In partnership with other forward-thinking researchers, implementers, and advocates, the MEI works across global, regional and national levels to conduct operational research on surveillance and response, develop new tools and approaches for aggressive elimination, document and disseminate country experience, determine the costs of and financing needs for achieving elimination, build consensus, and influence policy and financing to foster an enabling environment to shrink the malaria map. The MEI believes that global eradication of malaria is possible within a generation.
For further information about the work of the Global Health Group and the Malaria Elimination Initiative, visit:
globalhealthsciences.ucsf.edu/GHG/MEI
shrinkingthemalariamap.org

18
REPORT
An Investment Case for Eliminating Malaria in the Greater Mekong Subregion (GMS) | References | July 2017
ReferencesAPLMA. 2015a. A “Widespread artemisinin resistance could
wipe out a decade of malaria investment.” Asia Pacific Leaders Malaria Alliance, 9 April 2015.
APLMA. 2015b. Brief: Malaria and health security in Asia Pa-cific. Asia Pacific Leaders Malaria Alliance. Unpublished.
APLMA. 2015c. APLMA malaria elimination roadmap. 2015; published online Oct 26. Asia Pacific Leaders’ Malaria Alliance. http://aplma.org/blog/24/East-Asia-Summit-leaders-endorse-APLMA-Malaria-Elimination-Road-map/.
APLMA. 2016. “The drug resistance, health security and malaria nexus.” Asia Pacific Leaders Malaria Alliance. 24 April 2016.
ADB. 2016a. Key Indicators of Asia and the Pacific 2016. Asian Development Bank, Manila, Philippines.
ADB. 2016b. Mekong Subregion Statistics on Growth, Infrastructure, and Trade: Second Edition, p. 18. Asian Development Bank, Manila, Philippines.
ADB. 2017. Mekong Business Initiative. https://www.adb.org/projects/48270-001/main. Asian Development Bank, Manila, Philippines.
Chandran, N. “Is this Asia’s new manufacturing hub?” CNBC, 29 December 2014.
Cohen J, Smith D, Cotter C, et al. Malaria resurgence: a sys-tematic review and assessment of its causes. Malaria journal 2012; 11(1): 122.
Cuong, C.M. 2016. “6 challenges to advancing GMS eco-nomic corridors,” Asian Development Blog, 15 August 2016.
Devex Impact. Goodbye Malaria: Mozambique Malaria Per-formance Bond. 2016. https://www.devex.com/impact/partnerships/ goodbye-malaria-mozambique-malaria-performance-bond-362 (accessed June 29, 2016).
Feachem RG, Phillips AA, Hwang J, Cotter C, Wielgosz B, Greenwood BM, Sabot O, Rodriguez MH, Abeyasinghe RR, Ghebreyesus TA, Snow RW, 2010. Shrinking the malaria map: progress and prospects. Lancet 376: 1566 – 1578.
Global Fund for HIV/TB and Malaria. 2017. Unpublished data.
Suwannasin K, Kunasol C, Sutawong K, Mayxay M, Rekol H, Smithuis FM, Hlaing TM, Tun KM, van der Pluijm RW, Tripura R, Miotto O, Menard D, Dhorda M1, Day NPJ, White NJ, Dondorp AM
Jamison DT, Summers LH, Alleyne G, Arrow KJ, Berkley S, Binagwaho A, Bustreo F, Evans D, Feachem RG, Frenk J, 2013. Global health 2035: a world converging within a generation. Lancet 382: 1898–1955.
Kumar K, Pigazzini A, Stenson B, 2013. Financing for Malaria Elimination. Available at: http://globalhealthsciences.ucsf. edu/sites/default/files/content/ghg/mei-financing-malaria- elimination.pdf. Accessed September 8, 2015.
Kyaw, SS. 2017. Personal communication.
Lubell Y et al. “Artemisinin resistance – modelling the poten-tial human and economic costs.” Malaria Journal 2014; 13:452.
Smith Gueye C, Newby G, Hwang J, Phillips AA, Whittaker M, MacArthur JR, Gosling RD, Feachem RG: The challenge of artemisinin resistance can only be met by eliminating Plasmodium falciparum malaria across the Greater Mekong subregion. Malar J. 2014, 13: 286-10.1186/1475-2875-13-286.
Maude R, Drake T, Nercade CE, Ekapirat N, Rowley J. 2017. Assessing current status for malaria elimination in the Asia-Pacific. Draft report submitted to APLMA.
Maude RJ, Pongtavornpinyo W, Saralamba sS Aguas R, Van Effelterre T, Day NPJ, White NJ.
Murray S. ‘Malaria bond’ set to play innovative role in fun-drais- ing. FT.com. 2016; published online April 24. http://www.ft.com/ cms/s/0/f7b41a48-f839-11e5-96db-fc683b5e52db.html#ax- zz4CtgBK5z6 (accessed June 29, 2016).
Paul Jr. J. PH sin tax reform: lessons for financing malaria elimination. 2015 in UCSF/MEI. 2017. A Survey of Inno-vative Financing Mechanisms and Instruments: Oppor-tunities for Malaria Elimination Financing
Regional Artemisinin-resistance Initiative. 2014. “Q&A on Artemisinin Resistance,” (http://www.raifund.org/node/7027) accessed 1 February 2017
RAI2E. 2017. Regional Artemisinin-resistance Initiative 2 Elimination. Concept Note to the Global Fund for HIV/TB and Malaria.
Rosenfeld LC, Lim SS, Andrews KG, Foreman KJ, Haring D, Fullman N, Naghavi M, Lozano R, Lopez AD.
Silal, S.P. Forthcoming. (2017).
Shretta R, Zelman B, Birger M, Haakenstad A, Singh L, Liu Y, Dieleman J. 2017. Tracking development assistance and government health expenditures: 1990-2017. In press.

19
REPORT REPORT
An Investment Case for Eliminating Malaria in the Greater Mekong Subregion (GMS) | References | July 2017
WHO. 2017. http://www.who.int/mediacentre/news/releas-es/2017/world-malaria-day/en/.
WHO 2016a. Eliminating malaria in the GMS, United to end a deadly disease. (Annex: REG_WHO Elim Malaria GMS).
WHO, 2016b. World Malaria Report 2016. Geneva, Switzer-land: World Health Organization.
WHO, 2015a. Global Technical Strategy for Malaria 2016–2030. Geneva, Switzerland: World Health Organization.
WHO. 2015b. Tables of costs and prices used in WHO- CHOICE analysis. Geneva: WHO. Available from: http://www.who .int/choice/costs/en/. World Health Organiza-tion, Geneva, Switzerland.
World Health Organization, 2015c. Strategy for Malaria Elimi-nation in the Greater Mekong Subregion (2015–2030).
World Bank 2017. Retrieved from http://data.worldbank.org/. Accessed June 2017.
USCF/MEI. 2017. Private sector business cases for malaria elimination in the GMS. Unpublished report, San Fran-cisco, USA.
UNGA. 2015. Addis Ababa Action Agenda of the Third International Conference on Financing for Development (Addis Ababa Action Agenda). United Nations General Assembly, New York, NY: United Nations.
UNESCAP. 2016. Economic and Social Survey of Asia and the Pacific. United Nations Economic and Social Com-mission for Asia and the Pacific.

20
REPORT
An Investment Case for Eliminating Malaria in the Greater Mekong Subregion (GMS) | Annex 1. Health and economic indicators in the GMS countries | July 2017
Annex 1. Health and economic indicators in the GMS countries
Table 1. Select health and economic indicators in the GMS countries
Economy Cambodia Lao PDR Myanmar Thailand Viet Nam
Population, in millions (2016) 15.6 6.8 53.9 68 91.7
GDP (in billions, USD, 2016) 19.4 13.7 68.2 390.6 200.5
GDP per capita (USD, 2016) 1,227.7 1,921.2 1,306.6 5,662.3 2,164.3
GDP growth rate (%, 2015) 7 7.4 7.3 2.8 6.7
Agriculture 30.5 27.6 27.8 10.2 17.7
Industry 27.1 31.3 34.5 36.8 39
Services 42.4 41 37.7 53 43.3
People at risk of malaria, in millions (% of population)
11 (70.7)
6.3 (92.6)
32 (59.5)
34 (50)
68.9 (73.7)
People in high-malaria transmission area, in millions (% of population)
7.5
(48.1)
2.1
(31.2)
8.5
(15.8)
5.4
(8)
6.3
(6.8)
Confirmed malaria cases 33,930 36,056 77,842 14,755 19, 252
Reported malaria deaths 10 2 37 33 3
Government spending on heath per capita (USD) 61 33 20 360 142
Public health expenditure as % of GDP 1.3 0.9 1 5.6 3.8
Government expenditure as % of total health expenditure
22 50.5 45.9 86 54.1
Human Development Index score 0.555 0.575 0.536 0.726 0.666
Life expectancy at birth (years) 68.2 66.1 65.9 74.4 75.6
Infant mortality (per 1,000 live births) 25 51 40 11 17
Under-five mortality (per 1,000 live births) 29 67 50 12 22
Sources: World Bank, United Nations Development Programme, World Health Organization, World Malaria Report 2016, the Institute of Health Metrics and Evaluation, Central Intelligence Agency, the International Monetary Fund, and the World Bank.

21
REPORT REPORT
An Investment Case for Eliminating Malaria in the Greater Mekong Subregion (GMS) | Annex 2. Methods and data sources | July 2017
Annex 2. Methods and data sourcesTo estimate the costs of malaria elimination, we used out-puts from dynamic epidemiological transmission models that simulated the impact of various scenarios on the ma-laria burden across 22 Asia Pacific countries from 2016 to 2030. A full description of the mathematical model and the parameters driving the model is available elsewhere (Silal et al., 2017, White, 2015). The model uses four infection classes (severe, clinical, asymptomatic and de-tectable by microscopy, and asymptomatic and undetect-able by microscopy) in estimating the impact of malaria interventions on P. falciparum and P. vivax transmission. P. vivax infections were characterized by relapses of malaria arising from persistent liver stages of the parasite (i.e., hypnozoites). The relationship between glucose 6-phos-phate dehydrogenase deficiency (G6PDd) and P. vivax malaria was captured using existing estimated G6PDd proportions in the population (unpublished data from the Malaria Atlas Project). The model was designed to be spatially explicit with interconnected patches represent-ing geographic areas of interest. A diagram of the model structure is shown (Figure A2-1).
Data used to calibrate and validate the model were sourced from World Malaria Reports (2001-2016), the Mahidol Oxford Tropical Diseases Research Unit, and peer reviewed literature. Research suggests that there may be
significant under-reporting in the scale of global malaria incidence and mortality due to the weakness of health reporting and information management systems and widespread and undocumented use of the private sector in many endemic countries. The Mahidol-Oxford Tropical Medicine Research Unit in collaboration with a number of partners including the WHO has derived revised bur-den estimates for the countries in the Asia Pacific region by combining and triangulating data from a variety of data sources (data from the WMR, a systematic review on access to healthcare, completeness of reporting and the sensitivity of diagnostic tests). In 2015, 2,436,813 total confirmed cases of malaria in the 22 countries were reported in the WMR whereas MORU estimates that the actual number of malaria cases in these 22 countries in 2015 was 4,809,884 (3,141,137-31,153,623). These re-vised burden data were used to populate the models used in this analysis. Both reported and total/clinical cases are depicted in the graphs.
The model was validated separately against the estimated burden of disease for P. falciparum and P. vivax and ac-cumulated case mortality. While reported coverage of interventions (particularly LLINs and IRS) were included in the model to inform changes in incidence, there was little available data on health system advances between 2000 and 2015 (such as the introduction of community health workers); thus, these were imputed based on observed changes in reported incidence. The mortality predicted by the model was validated against reported deaths.
We modeled four counterfactual scenarios (No. 1-4 in Table A2-1) including one business as usual scenario and three reverse scenarios that simulated the potential impact of scaling down the malaria program. The six elimination scenarios (No. 5-10 in Table A2-1) were modeled sequen-tially to show an increase in complexity and in the number of interventions included. Across all 10 scenarios, we ap-plied three assumptions around the likelihood of artemis-inin resistance, the use of MDA, and the scale up of LLINs to 80% of the PAR. For each country, we determined the minimum scenario that would achieve malaria elimina-tion, defined here as one year with less than one reported clinical case. Since the model does not distinguish be-tween indigenous and imported cases, we assumed that a certain threshold of cases are imported, which we sub-tracted from the model outputs. The elimination threshold for each country was determined using a regression model of imported clinical cases from reported data based on countries that have recently eliminated malaria.
These additional scenarios produced a total of 80 scenar-ios (with and without resistance; with and without MDA; and with and without LLIN scale up to 80%).
Figure A2-1. Transmission model structure

22
REPORT
An Investment Case for Eliminating Malaria in the Greater Mekong Subregion (GMS) | Annex 2. Methods and data sources | July 2017
Table A2-1. Modeled scenarios
No. Scenario Description
1 Business as usual • Continue all interventions at 2014 levels from 2016 through 2030
2 Reverse scenario 1 • Business as usual• IRS activities ceased
3 Reverse scenario 2 • Reverse scenario 1• Distribution of new LLINs ceased
4 Reverse scenario 3 • Reverse scenario 2• Treatment rates reduced by 50%
5 Universal coverage • Business as usual• Coverage test and treat increased from 2017 onwards in a linear fashion over
eight years to 80% by 2025• Quinine is switched to injectable artesunate for management of severe disease
in 2017
6 IRS • Universal coverage• IRS coverage in 2017 doubled in a linear fashion over eight years
7 Effective usage • Universal coverage• Effectiveness of LLINs increased from 15% to 30%• Surveillance increased
8 Single dose radical cure • Effective usage• Replace primaquine with a single dose drug (such as tafenoquine)
9 New LLINs • Single dose radical cure• Life of LLINs doubled
10 New P. falciparum treatment • New LLINs• First-line ACT replaced with new candidate for P. falciparum treatment
Assumption Description
A Artemisinin resistance Five percent probability of treatment failure from ACTs across all countries is constant until 2018 and then increased to 30% through 2025
B MDA Five annual rounds of MDA at 50% coverage from 2018, starting four months before the peak of the transmission season
C. LLINs Scaling up LLINs to 80% coverage on a 3 year scale up plan (net replacement every 3 years)
In addition, we simulated the effect of improved targeting of malaria interventions on both costs and epidemiological outputs. We did this by reducing intervention coverage by 30% among the PAR for all scenarios, with and without the resistance and MDA assumptions.
Cost projectionsWe built a cost estimation model aligned with the outputs of the transmission model to estimate the costs associ-ated with implementing each of the scenarios above. We included the costs of OP and IP treatment, LLIN distribu-tion, IRS (where applicable), supply chains, surveillance, community health workers, IEC, training, MDA, new treatments such as a radical cure for P. vivax (i.e., tafeno-quine), and new LLINs in the cost model. Unit costs were obtained from country reports, expert opinion, published literature, WHO CHOICE data and other proxies when data were not available (Table A1-1). Costs were dis-counted by 3%. Cost inputs are provided (Table A1-2.)
Benefits estimationWe used outputs from the transmission model to esti-mate the benefits of malaria elimination. We calculated the deaths and cases averted from malaria elimination by obtaining the difference between the outputs of the elimination and business as usual and reverse scenarios to estimate the direct and indirect costs averted in 2016-2030. The same inputs and assumptions were used in estimating benefits. In addition, we also estimated the benefits of continuing current interventions by compar-ing the business as usual and reverse scenarios. Benefits were discounted at 3%.
For patients’ productivity losses, we multiplied the number of malaria cases by the average number of days malaria patients are ill and the 2015 GDP per capita per day. We assumed that the productivity losses of caregivers were equal to those of patients.

23
REPORT REPORT
An Investment Case for Eliminating Malaria in the Greater Mekong Subregion (GMS) | Annex 2. Methods and data sources | July 2017
To quantify the economic impact of premature deaths due to malaria, we used full income accounting to estimate value of additional life years (VLY) lost. Full income ap-proaches combine growth in national income with the val-ue individuals place on increased life expectancy. By cap-turing the instrumental and intrinsic value of better health, full income measures provide more accurate and com-plete picture of the benefits of health investments com-pared to traditional national income accounting, which only looks at GDP growth. In full income accounting, one VLY is the value people place in a one-year increase in life expectancy. VLYs vary by region and country, and based on estimates by the Lancet Commission on Investing in Health, one VLY in the East Asia & Pacific region is 2.2 times the GDP per capita at a 3% discount rate.
We assumed that 40 was the average age of death among malaria-related deaths, and that the life years lost to malaria was equal to the life expectancy at age 40 as reported in the United Nations World Population Pros-pects (2015 revision). We multiplied this number by the number of deaths and VLY to estimate the total economic impact of premature deaths.
The costs and benefits of elimination were compiled for each of the five GMS countries and added together to obtain the total cost and benefits in the region.
Return on investmentTo calculate ROI of malaria elimination in 2016-2030, we subtracted the benefits of elimination in the region by the incremental cost of elimination and divided the resulting figure by the incremental cost of elimination. The ROI is interpreted as the economic return from every additional dollar spent on malaria above the counterfactual scenario. We calculated ROIs for both the resistance and baseline assumptions.
Financial landscapeWe triangulated data from various sources to estimate past, present, and future financing for malaria. Historical figures (2000-2014) were retrieved from finance tracking work completed by the Institute of Health Metrics and Evaluation and MEI (unpublished data); this was supple-mented by data from the Global Fund and the World Malaria Report of the WHO. Financing data and the gaps from 2018-2020 were obtained from the RAI2E concept note.
Sensitivity analysisWe performed stochastic sensitivity analysis on the epi-demiological and cost outputs of the transmission model. The minimum, median, and maximum malaria cases and deaths predicted by the model for each scenario were used to calculate the minimum, median, and maximum economic benefits.
For the costs, we assigned an uncertainty interval of +/-25% on the value of the input costs used. Three hundred random samples were drawn, which generated a range of costs. From the range of costs generated, we determined the minimum, maximum, median, mean, and other mea-sures (e.g., percentiles) which are presented in Annex 2.
LimitationsMany of the costs were estimates and may therefore not reflect the actual costs of elimination in the country. Several benefits of malaria elimination, which could not be valued accurately, were excluded from our calculations; thus, our benefits estimations are likely to be underestimates. The malaria transmission model used has inherent limitations, which may introduce uncertainty to the benefits estimations. In the sensitivity analysis we aim to address such issues.

24
REPORT
An Investment Case for Eliminating Malaria in the Greater Mekong Subregion (GMS) | Annex 2. Methods and data sources | July 2017
Table A2-2. Inputs and assumptions used in various analyses
Name Cambodia Lao PDR Myanmar Thailand Vietnam
Cost (USD)
Cost of OP malaria treatment (with medicines) 4.02 4.27 3.50 10.35 4.63
Cost of IP malaria treatment (with medicines) 64.72 68.41 48.11 223.89 81.22
Cost of RDT per case 1.08 1.07 0.40 1.20 1.20
Cost of P. falciparum drugs per OP case 0.925 0.925 0.925 0.925 0.925
Cost of P. vivax drugs per OP case 1.96 1.96 1.96 1.96 1.96
Cost of antimalarials per IP case 14.46 14.46 30.18 84.57 14.46
Cost per person protected by an LLIN 2.51 2.51 3.17 4.05 2.51
Cost per person treated through MDA 13.00 (Kyaw, 2017)
Annual cost of training per capita 0.15 0.02 0.02 0.02 0.02
Annual cost of surveillance per capita 0.439 1.027 0.36 0.36 0.36
Annual cost of IEC per capita 0.10 0.279 0.06 0.06 0.06
OOP per OP malaria case 19.98 9.35 8.66 2.81 2.81
OOP per IP malaria case 42.54 46.15 46.15 46.15 46.15
Economics
GDP per capita (US$) 1158 1818 1161 5814 2111
Coefficient for VLY calculation 2.20 (Jameson et al., 2013)
Discount rate (%) 3.00
Mortality
Life expectancy at 40 (years) 33.66 32.8 32.86 37.94 39.35
Epidemiology and length of disease
Proportion of malaria cases that are treated OP Model output
Proportion of malaria cases that are treated IP Model output
Length of OP malaria case (days) 4.82
Length of IP malaria case (days) 8.75
Length of IP malaria hospitalization 5.00
a Calculated by authors using data from the references cited. b Assumption made by authors.

25
REPORT REPORT
An Investment Case for Eliminating Malaria in the Greater Mekong Subregion (GMS) | Annex 3. Individual country transmission plots | July 2017
Annex 3. Individual country transmission plots
Figure A3.1. Cambodia
400,000
300,000
200,000
100,000
0
MDA ScenarioYes
ITNYesBusiness as usual New Pf drug
2015 2020 2025 2030
Clinical Incidence Pf+Mix+Pv with stable resistanceModel Prediction, Absolute numbers
Elimination
Figure A3.2. Lao PDR
800,000
600,000
400,000
200,000
0
MDA ScenarioYes
ITNYesBusiness as usual New Pf drug
2015 2020 2025 2030
Clinical Incidence Pf+Mix+Pv with stable resistanceModel Prediction, Absolute numbers
Elimination
Figure A3.3. Myanmar
1,200,000
900,000
600,000
300,000
0
MDA ScenarioYes
ITNYesBusiness as usual New Pf drug
2015 2020 2025 2030
Clinical Incidence Pf+Mix+Pv with stable resistanceModel Prediction, Absolute numbers
Elimination
Figure A3.4. Thailand
120,000
80,000
40,000
0
MDA ScenarioNo
ITNNoBusiness as usual Single dose new Pv treatment
2015 2020 2025 2030
Clinical Incidence Pf+Mix+Pv with stable resistanceModel Prediction, Absolute numbers
Elimination
Figure A3.5. Vietnam
100,000
75,000
50,000
25,000
0
MDA ScenarioNo
ITNNoBusiness as usual Effective usage
2015 2020 2025 2030
Clinical Incidence Pf+Mix+Pv with stable resistanceModel Prediction, Absolute numbers
Elimination

26
REPORT
An Investment Case for Eliminating Malaria in the Greater Mekong Subregion (GMS) | Annex 4. Results of sensitivity analysis | July 2017
Annex 4. Results of sensitivity analysis
Figure A4-1. Cost of elimination sensitivity analysis
Co
st U
SD
(20
15)
800,000
700,000
600,000
500,000
400,000
300,000
200,000
100,000
-2016 2017 2018 2019 2020 2021 2022 2023 2024 2025 2026 2027 2028 2029 2030
Cost min Cost 25% Cost median Cost 75% Cost max
shrinkingthemalariamap.org

27
REPORT REPORT
An Investment Case for Eliminating Malaria in the Greater Mekong Subregion (GMS) | Annex 4. Results of sensitivity analysis | July 2017
shrinkingthemalariamap.org


