Embed Size (px)
Citation preview
Maini, R; Van den Bergh, R; van Griensven, J; Tayler-Smith, K;Ousley, J; Carter, D; Mhatre, S; Ho, L; Zachariah, R (2014) Pick-ing up the bill - improving health-care utilisation in the DemocraticRepublic of Congo through user fee subsidisation: a before and afterstudy. BMC Health Serv Res, 14. p. 504. ISSN 1472-6963 DOI:10.1186/s12913-014-0504-6
Downloaded from: http://researchonline.lshtm.ac.uk/2026625/
DOI: 10.1186/s12913-014-0504-6
Usage Guidelines
Please refer to usage guidelines at http://researchonline.lshtm.ac.uk/policies.html or alterna-tively contact [email protected].
Available under license: http://creativecommons.org/licenses/by/2.5/
brought to you by COREView metadata, citation and similar papers at core.ac.uk
provided by LSHTM Research Online
RESEARCH ARTICLE Open Access
Picking up the bill - improving health-careutilisation in the Democratic Republic of Congothrough user fee subsidisation: a before andafter studyRishma Maini1*, Rafael Van den Bergh2, Johan van Griensven3, Katie Tayler-Smith2, Janet Ousley4, Daniel Carter1,Seb Mhatre5, Lara Ho4 and Rony Zachariah2
Abstract
Background: User fees have been shown to constitute a major barrier to the utilisation of health-care, particularlyin low-income countries such as the Democratic Republic of Congo (DRC). Importantly, such barriers can lead tothe exclusion of vulnerable individuals from health-care. In 2008, a donor-funded primary health-care programmebegan implementing user fee subsidisation in 20 health zones of the DRC. In this study, we quantified the shortand long-term effects of this policy on health-care utilisation.
Methods: Sixteen health zones were included for analysis. Using routinely collected health-care utilisation databefore and after policy implementation, interrupted time series regression was applied to quantify the temporalimpact of the user fee policy in the studied health zones. Payment of salary supplements to health-care workersand provision of free drugs - the other components of the programme - were controlled for where possible.
Results: Fourteen (88%) health zones showed an immediate positive effect in health-care utilisation rates (overallmedian increase of 19%, interquartile range 11 to 43) one month after the policy was introduced, and the effectwas significant in seven zones (P <0.05). This initial effect was sustained or increased at 24 months in five healthzones but was only significant in one health zone at P <0.05. Utilisation reduced over time in the remaining healthzones (overall median increase of 4%, interquartile range −10 to 33). The modelled mean health-care utilisation rateinitially increased significantly from 43 consultations/1000 population to 51 consultations/1000 population duringthe first month following implementation (P <0.01). However, the on-going effect was not significant (P =0.69).
Conclusions: Our research brings mixed findings on the effectiveness of user fee subsidisation as a strategy toincrease the utilisation of services. Future work should focus on feasibility issues associated with the removal orreduction of user fees and how to sustain its effects on utilisation in the longer term.
Keywords: User fees, Subsidisation, Health-care utilisation, Operational research, DRC
BackgroundUser fees, defined as out-of-pocket payments by patientsfor medical services in health facilities, were introducedin many African countries as a response to deterioratingprimary health-care systems and a decline in both donorand government expenditure on health during the global
economic crisis of the 1980s [1]. This was supportedboth by the United Nations Children's Fund (UNICEF)and the World Health Organization through the BamakoInitiative [2], which aimed to secure the continuation ofthe delivery of basic services through generating fundsfrom communities by charging drugs at a mark-up cost.The additional funds generated through this mark-up couldthen be used by the community to establish a revolvingdrug fund and finance other primary health-care servicesin combination with government and donor funding. The
* Correspondence: [email protected] for International Development, British Embassy, 83 Ave RoiBaudouin, Kinshasa, the Democratic Republic of CongoFull list of author information is available at the end of the article
© 2014 Maini et al.; licensee BioMed Central Ltd. This is an Open Access article distributed under the terms of the CreativeCommons Attribution License (http://creativecommons.org/licenses/by/2.0), which permits unrestricted use, distribution, andreproduction in any medium, provided the original work is properly credited. The Creative Commons Public DomainDedication waiver (http://creativecommons.org/publicdomain/zero/1.0/) applies to the data made available in this article,unless otherwise stated.
Maini et al. BMC Health Services Research 2014, 14:504http://www.biomedcentral.com/1472-6963/14/504
initiative also sought to improve accountability betweenproviders and communities, as well as provide a sus-tainable way of improving access to health facilities,health-care utilisation and quality of care, while loweringfrivolous use of health services [3,1].However, the implementation of debt relief initiatives
for developing countries [4], reinvestment of donors inthe health sector, strong economic growth, and theMillennium Development Goals have created a newcontext. Once seen as a solution, user fees are growinglyseen as part of the problem. Ponsar et al. [5] showedthat user fees in several African countries may presentsignificant barriers for accessing health-care and canresult in the exclusion of vulnerable individuals. Theysuggested a mechanism of user fee abolition combinedwith compensation of health facilities for the lost revenue.User fee subsidisation – whereby the running cost ofservices (which covers fuel for generators, disinfectantproducts, and medical supplies) is subsidised by a donorand/or government thus resulting in a lower fee to theuser - may be an expedient approach towards achievingsuch abolition, particularly for vulnerable groups.Yet there is still an ongoing debate regarding user fees
in the literature. Evidence has shown that introducing orincreasing user fees can result in a decrease in the use ofboth preventative and curative health-care services [6],while abolishing user fees can lead to an overall increasein health-care utilisation rates [7]. However, it shouldalso be recognised that failure to support the supply-sideof health-care may constrain the value of user fee removal[8,9]. In areas where user fees have been reduced orabolished, the resultant increase in health-care utilisa-tion can negatively affect staff morale because of theincreased workload and reduced revenue [10,11]. Inaddition, although the evidence is limited, the abolishmentof user fees has sometimes been accompanied by anincrease in the number of reports of informal paymentsbeing made to health workers [12]. These findings illus-trate the importance of monitoring the implementationof policies targeting user fees.To date, qualitative studies on patients’ perceptions of
user fees have been previously conducted in the Demo-cratic Republic of Congo (DRC) [5] but there have been noquantitative studies on user fee subsidisation in this con-text. This study aimed to address this gap by answering thefollowing research question: what are the effects on health-care utilisation of a policy to subsidise user fees in theDRC? Specific objectives included assessing the short-andlong-term effects of user fee subsidisation on health-careutilisation in a) individual health zones and b) for the entiresample population. It is hoped that the findings of thisstudy will contribute to discussions on whether user feesshould be subsidised through third party subsidisation inthe DRC and other low-income countries [13].
BackgroundThe DRCThe DRC has faced decades of conflict and instabilitywhich continues to impact on its health system. Healthservices rely on a system of cost recovery through userfees, as government financing of the health sector is verylimited [14]. Yet, according to the 2011 Human Develop-ment Index, the DRC is the poorest country in the world[15]. It has the lowest Gross Domestic Product per capitain the world with 60% of its population living on less than$1.25 per day [16]. In such a context, user fees would likelyconstitute a major barrier for accessing health services.The country also has catastrophic health indicators, and
child and maternal mortality rates are respectively thesecond and fourth highest in the world [17,18]. Utilisationof health services is extremely low; on average one personconsults health services every 6.7 years [19].The DRC government published its Health Systems
Strengthening Strategy in 2006 [20], which recognisedthe poor budgetary allocation to health and the weakexecution of these funds. The strategy proposed differentoptions for improving the health financing system suchas increasing the mobilisation of public sector resources,use of community health insurance schemes and alsouser fee subsidisation. The DRC Ministry of Health evenhas a policy to reduce or abolish fees for some “vulnerablegroups” such as sexual violence survivors, indigents andthe elderly, and supports the abolishment of user feesduring emergency periods in conflict zones, but this isvariably enforced.
Access to health-care programmeBetween 2008 and 2012, two non-governmental organisa-tions (NGOs) - the International Rescue Committee (IRC)and Medical Emergency Relief International (MERLIN) -implemented the Access to Health-Care Programme in theDRC which was funded by the Department of InternationalDevelopment (DFID) [21]. The programme covered a totalof 20 health zones and was located in four provinces –Province Orientale, Maniema, Kasai Occidental, and SouthKivu, the latter of which has been affected by devastatingconflict since the second Congo war, which occurred be-tween 1998 and 2003 [22]. Each health zone is similar to a“health district” in other areas of Africa; it is a well-definedgeographical area comprising a referral hospital and satel-lite health centres serving a population of approximately120,000 people.The Access to Health-Care Programme supported pub-
lic primary health-care centres and hospitals situated inthese health zones to provide a package of primary health-care services, covering a total population of approximatelytwo and a half million inhabitants. The support includedfinancing of: day-to-day running costs, construction andrehabilitation of facilities, medical equipment, training of
Maini et al. BMC Health Services Research 2014, 14:504 Page 2 of 11http://www.biomedcentral.com/1472-6963/14/504
health workers, drugs, and salary supplements for healthworkers. The cost per capita per year (which includedNGO costs) was estimated to be $13.9.Fixed amounts of money were paid by the NGOs to
health facilities each month for their running costs. Forhealth centres, the average amount was $40 per month,while $1500 was given to hospitals, yielding a cost percapita per year of $0.20. Given the general disrepair ofmany facilities, health facilities were constructed or reha-bilitated where necessary. In order to improve the capacityof health personnel, the NGOs provided clinical, manage-ment, monitoring, evaluation and community healthtraining throughout the programme. Including equipmentand NGO costs, this resulted in a high cost per capita peryear of approximately $10.15.In terms of drug provision, the NGOs operated a
“pull” system; health zones placed orders with the NGOswhich were based on average monthly drug consumptioncalculations. The amount spent by NGOs on drugs wasestimated to be $1.5 per capita per year, which includedtransportation costs. Staff were discouraged from over-reporting drug consumption as regular and randomsupervisory drug checks were conducted by the NGOs ona monthly basis. Another deterrent to over-reporting wasthat several registers would need to be changed in orderto record the distribution of drugs; these included thepatient register, dispensing register and drug report.Frequent audits of the drug management systems wereundertaken in order to verify that these registers wereconsistent with one another.With respect to salary supplements, seventy percent of
the salary supplement was provided to workers eachmonth based on their attendance at health facilities,while the remaining thirty percent was dependent onattaining a minimum score at the quarterly performancereview of the health facility. The amount allocated toeach health zone per month also varied according to thenumber of health facilities and number and grades ofhealth workers; the average cost per capita per year wasapproximately $2.05.Drug provision, salary supplements, and the financing
of running costs in order to subsidise user fees wereintroduced progressively at different times in health zones,with all interventions in place in all health zones byOctober 2010 (see Table 1). In general, free provision ofdrugs either preceded the introduction of salary supple-ments or occurred simultaneously, while the financingof running costs occurred some months thereafter. Onlyonce the running costs were financed were the user feesthen lowered. Financing of all of these costs by DFIDenabled all primary health-care services to be providedfree of charge (i.e. fully subsidised) for vulnerable groupswhich included: pregnant women, children under fiveyears of age, survivors of sexual violence, and indigents. It
also allowed services to be provided at a substantiallyreduced cost (i.e. partially subsidised) of 30 cents forthe rest of the population. Prior to the programme, thecost for a consultation was just over $5, equivalent tothe average weekly wage, with additional charges for drugs,tests and procedures. No other donor-funded healthsystems strengthening programmes were known to beoperating within the health zones specified above duringthe Access to health-care programme.
MethodDesignThis was a “before and after” study assessing the effectsof user fee subsidisation on health-care utilisation.
Data collectionAll patients attending public primary health-care facilitiessupported by the Access to Health-Care Programme wereincluded in this study. Data on the number of primaryhealth-care consultations were extracted from the nationalroutine health information system, known as the SystèmeNational d’Informations Sanitaires, for each month be-tween January 2008 and December 2012, by health zone.For all zones, data on health-care utilisation were cross-checked against health facility registers on a bi-annual basisbetween 2008 and 2012, in order to confirm that reportingwas accurate. Spot checks in all health zones were also con-ducted on a quarterly basis for a small number of indicatorsselected at random; these indicators were either the overallutilisation rate, the number of malaria consultations, thenumber of assisted births, or the number of vaccinations.Similar to the bi-annual checks, data on the routine healthinformation system were cross-checked against registersheld at the facility.All health zones had at least 12 months of data prior
to the introduction of user fee subsidies. Seven out of 16health zones had at least three or more data points priorto the introduction of drugs and salary supplements.
Data analysisStatistical analyses were performed using the software“R”, version 3.0. The main outcome measure was thehealth-care utilisation rate per 1000 population (thenumber of monthly consultations divided by the annualpopulation for each health zone multiplied by 1000). Pop-ulation denominators within health zones were extrapo-lated from the 1984 census (the most recent available)[23], with population growth assumed to be 2.7% perannum [24]. Although this source of data is thirty yearsout of date, it continues to be used by the Ministry ofHealth in all health information data calculations. Subse-quent census data for health zones have been collectedduring vaccination campaigns but have never been vali-dated and so were not used.
Maini et al. BMC Health Services Research 2014, 14:504 Page 3 of 11http://www.biomedcentral.com/1472-6963/14/504

For each of the health zones, interrupted time seriesregression analysis was used to adjust for structuraltrends and potential serial correlation of the data, asdescribed in detail by Lagarde [25]. In order to aggregatethe data and understand the overall effect of subsidieson utilisation, all monthly data points for each healthzone 12 months prior to the introduction of user feesubsidies and 24 months following the introduction ofuser fee subsidies were compiled and the mean utilisationrate at each of these time points calculated.Two econometric models were used; one included
dummy variables for salary supplements and drugs, andthe other did not. For the nine health zones where therewere no data points prior to the introduction of drugs andsalary supplements (see Table 1), equation 1 was used:
Yt ¼ βo þ β1 � time þ β2 � subsidies
þ β3 � postslope þ εt
ð1Þ
In this equation, Yt represents health-care utilisation attime t, where t is a continuous variable indicating timein months which is coded sequentially from 0 from thestart of the programme until the end of the programme.User fee subsidies are coded 0 prior to the intervention
and then 1 for all post-intervention time points. Thepostslope is also coded 0 for time points prior to theintervention, and then coded sequentially from 1 whenthe intervention is introduced. βo represents the constantwhich captures the baseline level of the outcome attime 0, while β1 estimates the structural trend of thedata and is independent of the intervention. β2 esti-mates the immediate impact of the intervention and β3estimates the change in trend after the intervention isintroduced. This equation was also used to measure theaggregate effect of subsidies, using the mean utilisationrate across all health zones.Essentially, the difference before and after the intro-
duction of user fee subsidisation was quantified by test-ing the change in the level (β2) and the slope (β3) of theregression. A change in level between the pre- and post-intervention segments indicated an immediate (short-term) effect, and a change in slope indicated a change intrend and therefore on-going (long-term) effect.Drugs and salary supplements were included as dummy
variables in the interrupted time series analysis model forthe seven zones in which data points prior to their intro-duction were available (see Table 1). The aim was to adjustfor the effects of these potential confounding factors in
Table 1 Timing of interventions in each of the health zones
Province Health zone Drug supply forfree by the projectto the health centres
Salary supplementpaid to the staff
Subsidisation ofrunning costs anduserfee subsidisation(full and partial)
First month ofthe data set
Last month ofthe dataset
Regressionequation
Kasai Occidental Demba 01/04/2008 01/04/2008 01/04/2009 January 2009 December 2012 1
South Kivu Itombwe 01/04/2008 01/04/2008 01/09/2010 January 2009 December 2012 1
Maniema Kailo 01/04/2008 01/08/2008 01/08/2010 January 2009 December 2012 1
South Kivu Kabare 01/04/2008 01/04/2008 01/09/2010 January 2009 December 2012 1
Maniema Kampene 01/04/2008 01/08/2008 01/08/2010 January 2009 December 2012 1
South Kivu Minembwe 01/04/2008 01/04/2008 01/09/2010 January 2009 December 2012 1
Maniema Pangi 01/04/2008 01/08/2008 01/08/2010 January 2009 December 2012 1
South Kivu Kalehe 01/04/2008 01/04/2008 01/08/2010 January 2009 December 2012 1
ProvinceOrientale
Ubundu 01/04/2008 01/04/2008 01/04/2009 March 2008 December 2012 1
Maniema Punia 01/04/2008 01/08/2008 01/08/2010 January 2008 December 2012 2
Maniema Ferekeni 01/04/2008 01/08/2008 01/08/2010 January 2008 December 2012 2
Maniema Kalima 01/04/2008 01/08/2008 01/08/2010 January 2008 December 2012 2
Maniema Lubutu 01/04/2008 01/08/2008 01/08/2010 January 2008 December 2012 2
Maniema Obokote 01/04/2008 01/08/2008 01/08/2010 January 2008 December 2012 2
ProvinceOrientale
Banalia 01/10/2008 01/10/2008 01/04/2009 March 2008 December 2012 3
ProvinceOrientale
Bengamisa 01/10/2008 01/10/2008 01/04/2009 March 2008 December 2012 3
N.B For health zones Alunguli, Kindu, Lukonga and Mutoto, data included consultations at private facilities or the times at which salary supplements or free drugprovision were introduced were not known. As a result, these zones were not analysed in the study. The remaining 16 health zones had less than 10% of datamissing. All health zones in the table above had 12 months data prior to user fee subsidisation. The last seven zones had at least three or more data points priorto the introduction of drugs and salary supplements.
Maini et al. BMC Health Services Research 2014, 14:504 Page 4 of 11http://www.biomedcentral.com/1472-6963/14/504
those zones. Where drugs and salary supplements wereintroduced at the same time, equation 2 was used:
Yt ¼ βo þ β1 � time þ β2 � salary supplementsand drugs þ β3 � subsidies þ β4 � postslopesalarysupplements and drugs þ β5 � postslopesubsidies þ εt
ð2ÞIn this equation, similar to user fee subsidies, salary
supplements and drugs are coded 0 prior to their intro-duction and then 1 for all post-intervention time points.Postslope salary supplements and drugs is also coded 0 fortime points prior to their implementation, and then codedsequentially from 1 when they have been introduced.Where drugs and salary supplements were introduced
at different times, equation 3 was employed:
Yt ¼ βo þ β1 � time þ β2 � drugs þ β3� salary supplements þ β4 � subsidies þ β5� postslopesalary supplements þ β6 � postslopedrugs þ β7 � postslope subsidies þ εt
ð3ÞAs in equation two, salary supplements and drugs are
coded 0 prior to their introduction and then 1 followingtheir implementation. Postslope drugs and postslope sal-ary supplements are also coded 0 for time points priorto their introduction, and then coded sequentially from1 following their introduction.For each regression model, autocorrelation of the data
was detected using the Durbin-Watson test and correctedusing general least squares regression [25,6].A Student’s t-test was used to assess whether the
provision of drugs or salary supplements significantlyaltered the effect of user fee subsidisation on health-care utilisation rates. Specifically, the test examined fordifferences in the mean user fee subsidisation coefficients(both the level and the slope coefficients) between zonesaccording to their drugs and salary supplements status.The coefficients for user fee subsidisation (level and
slope) obtained from the interrupted time series regres-sion analyses were also used to model outcomes at oneand 24 months after the introduction of subsidisation, andcompared to counterfactual outcomes (i.e. the projectedoutcomes in the absence of an intervention) as describedpreviously by Lagarde et al. [7]. For example, if by month24 of data collection the intervention has been in place for12 months, the expected utilisation rate can be calculatedby imputing the values of the explanatory variables intothe estimated regression equation as follows:
Y24 mð Þ ¼ βo þ β1 � 24 þ β2 � 1 þ β3 � 13
The counterfactual outcome is obtained using the fol-lowing equation:
Y24 cð Þ ¼ βo þ β1 � 24
The difference between these outcomes can then becalculated to obtain a relative percentage change:
Φ ¼ Y24 mð Þ ‐ Y24 cð Þ� �
=Y24 cð Þ
Ethical approvalThis study met the Médecins Sans Frontières (Geneva,Switzerland) Ethics Review Board-approved criteria foranalysis of routinely-collected program data, and was alsoapproved by the Ethics Advisory Group of the InternationalUnion Against Tuberculosis and Lung Disease (Paris,France). Ethics approval was also obtained from theKinshasa School of Public Health (Kinshasa, DRC).
ResultsFirst, we will present some descriptions on the trendof utilisation rates in individual health zones. Then wewill detail the significance of the coefficients for theshort- and long-term effects of subsidies on utilisationat the health zone level, and at the aggregate level.Eventually, we report the relative percentage changesin utilisation at 1 month and 24 months at the healthzone level.
Trends of utilisation rates: individual and aggregate levelIn all health zones, utilisation rates were higher by theend of the programme compared to the start of theprogramme. The health zone Banalia demonstrated themost change during the programme, with utilisationrates starting at 5 consultations/month/1000 populationand ending at 63 consultations/month/1000 population.However, Kabare health zone demonstrated the leastchange overall during the course of the programme, withutilisation rates starting from 60 consultations/month/1000 population in 2008 and ending with only 65 con-sultations/month/1000 population by the end of theprogramme. With respect to the aggregate data, themean utilisation rate increased from 38 consultations/month/1000 population in 2008 to 69 consultations/month/1000 population after 12 months of the policy.
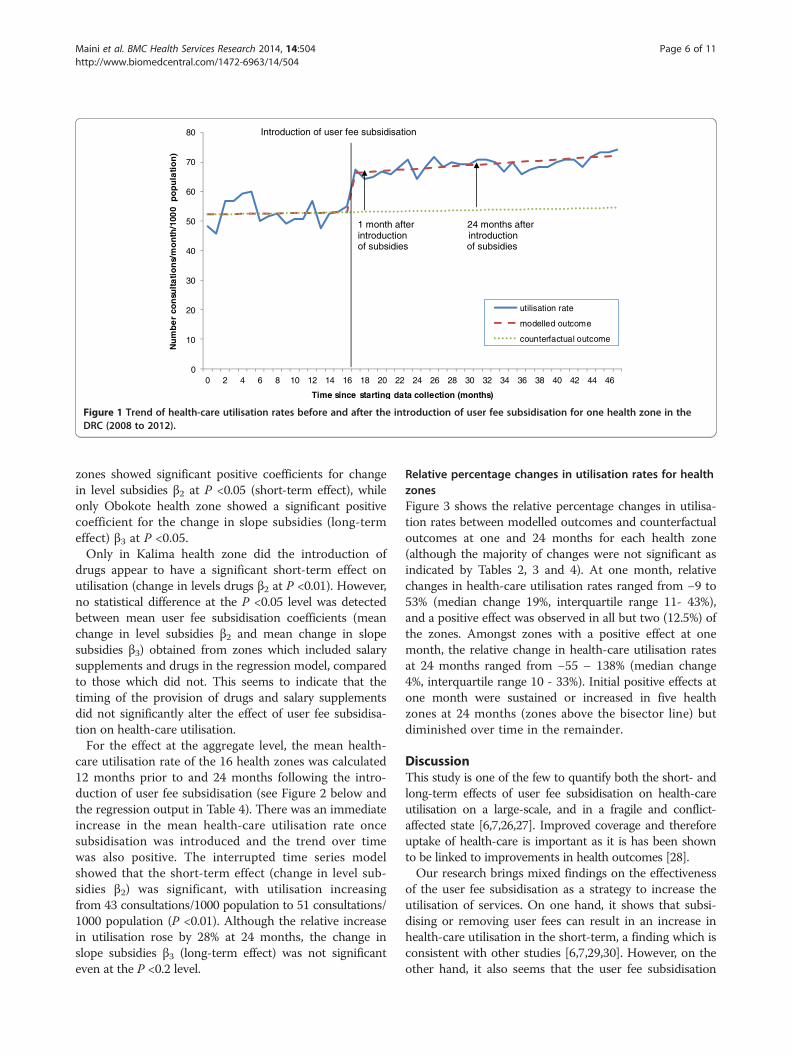
Short- and long-term effects of user fee subsidisation onhealth-care utilisation: Individual health zones and ataggregate levelFigure 1 is an example of the results observed in onehealth zone, and also illustrates the difference betweenthe change in utilisation after one month and 24 monthsof user fee subsidisation. Similar analyses were performedfor the remaining 15 health zones (see Table 1 for infor-mation on the equations used for each zone and Tables 2and 3 for regression outputs). Seven out of the 16 health
Maini et al. BMC Health Services Research 2014, 14:504 Page 5 of 11http://www.biomedcentral.com/1472-6963/14/504
zones showed significant positive coefficients for changein level subsidies β2 at P <0.05 (short-term effect), whileonly Obokote health zone showed a significant positivecoefficient for the change in slope subsidies (long-termeffect) β3 at P <0.05.Only in Kalima health zone did the introduction of
drugs appear to have a significant short-term effect onutilisation (change in levels drugs β2 at P <0.01). However,no statistical difference at the P <0.05 level was detectedbetween mean user fee subsidisation coefficients (meanchange in level subsidies β2 and mean change in slopesubsidies β3) obtained from zones which included salarysupplements and drugs in the regression model, comparedto those which did not. This seems to indicate that thetiming of the provision of drugs and salary supplementsdid not significantly alter the effect of user fee subsidisa-tion on health-care utilisation.For the effect at the aggregate level, the mean health-
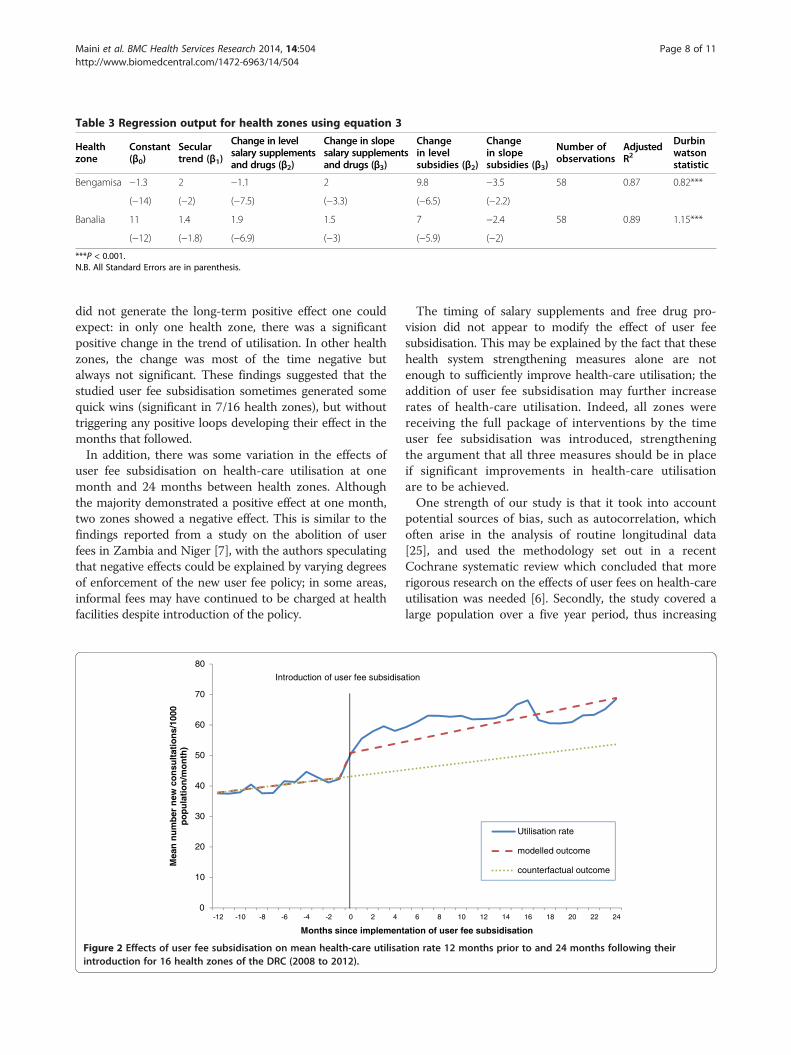
care utilisation rate of the 16 health zones was calculated12 months prior to and 24 months following the intro-duction of user fee subsidisation (see Figure 2 below andthe regression output in Table 4). There was an immediateincrease in the mean health-care utilisation rate oncesubsidisation was introduced and the trend over timewas also positive. The interrupted time series modelshowed that the short-term effect (change in level sub-sidies β2) was significant, with utilisation increasingfrom 43 consultations/1000 population to 51 consultations/1000 population (P <0.01). Although the relative increasein utilisation rose by 28% at 24 months, the change inslope subsidies β3 (long-term effect) was not significanteven at the P <0.2 level.
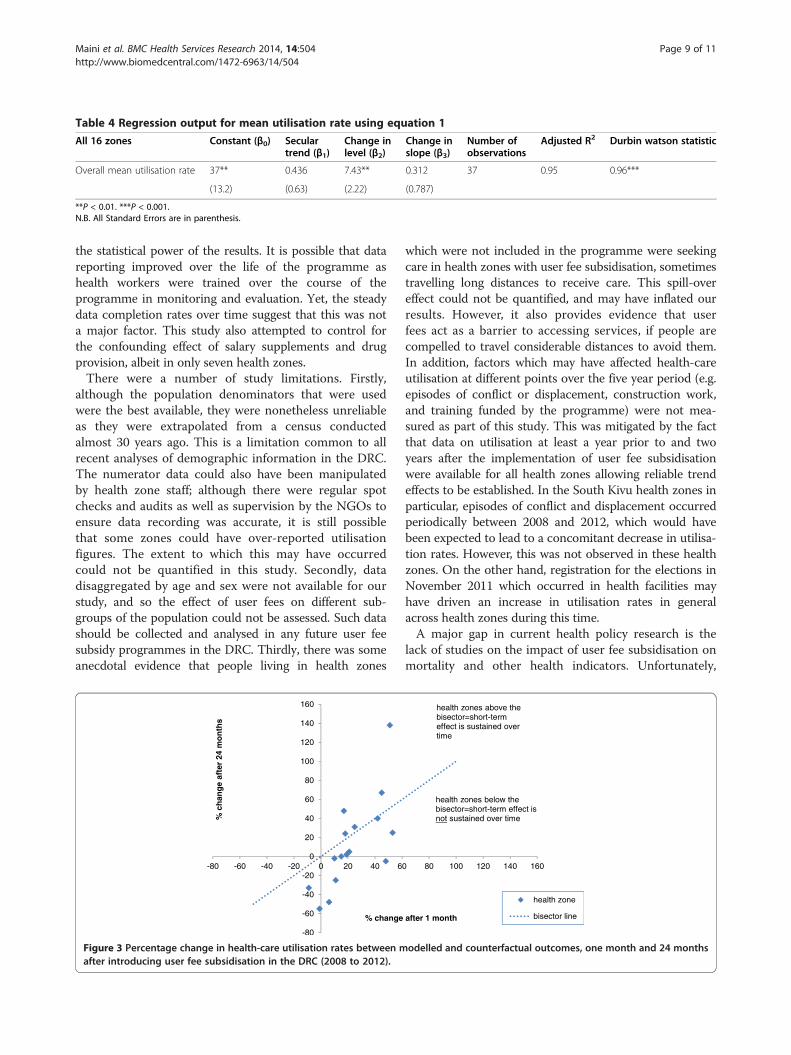
Relative percentage changes in utilisation rates for healthzonesFigure 3 shows the relative percentage changes in utilisa-tion rates between modelled outcomes and counterfactualoutcomes at one and 24 months for each health zone(although the majority of changes were not significant asindicated by Tables 2, 3 and 4). At one month, relativechanges in health-care utilisation rates ranged from −9 to53% (median change 19%, interquartile range 11- 43%),and a positive effect was observed in all but two (12.5%) ofthe zones. Amongst zones with a positive effect at onemonth, the relative change in health-care utilisation ratesat 24 months ranged from −55 – 138% (median change4%, interquartile range 10 - 33%). Initial positive effects atone month were sustained or increased in five healthzones at 24 months (zones above the bisector line) butdiminished over time in the remainder.
DiscussionThis study is one of the few to quantify both the short- andlong-term effects of user fee subsidisation on health-careutilisation on a large-scale, and in a fragile and conflict-affected state [6,7,26,27]. Improved coverage and thereforeuptake of health-care is important as it is has been shownto be linked to improvements in health outcomes [28].Our research brings mixed findings on the effectiveness
of the user fee subsidisation as a strategy to increase theutilisation of services. On one hand, it shows that subsi-dising or removing user fees can result in an increase inhealth-care utilisation in the short-term, a finding which isconsistent with other studies [6,7,29,30]. However, on theother hand, it also seems that the user fee subsidisation
Figure 1 Trend of health-care utilisation rates before and after the introduction of user fee subsidisation for one health zone in theDRC (2008 to 2012).
Maini et al. BMC Health Services Research 2014, 14:504 Page 6 of 11http://www.biomedcentral.com/1472-6963/14/504
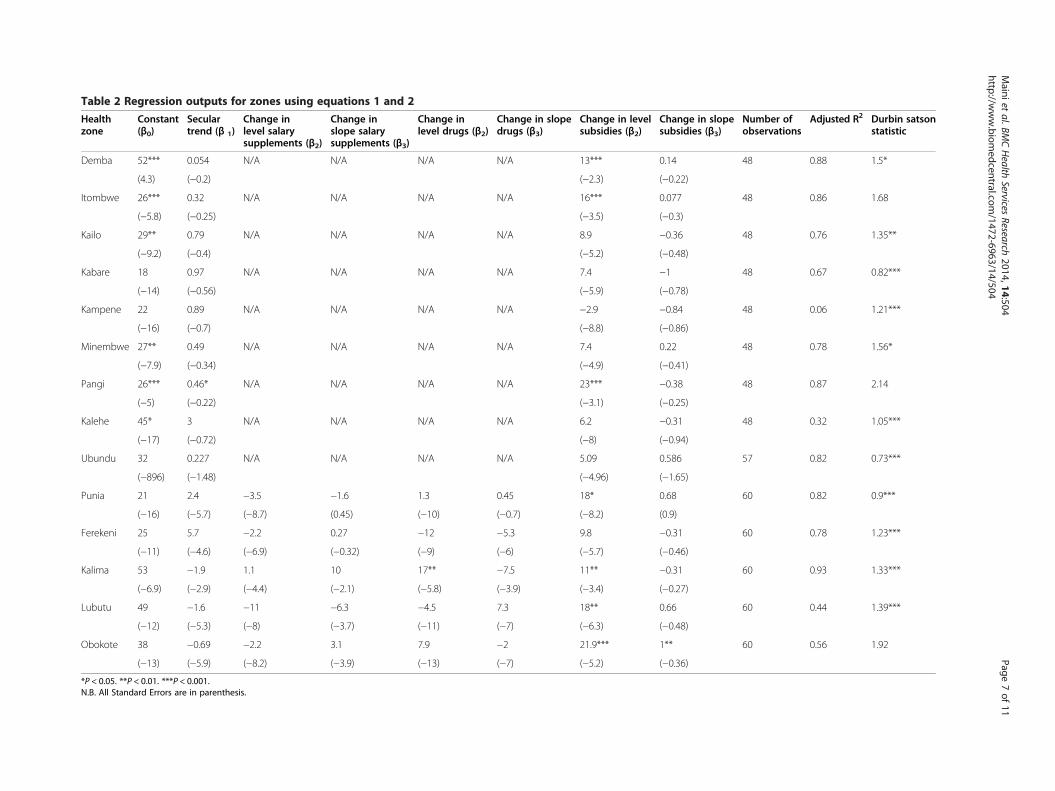
Table 2 Regression outputs for zones using equations 1 and 2
Healthzone
Constant(β0)
Seculartrend (β 1)
Change inlevel salarysupplements (β2)
Change inslope salarysupplements (β3)
Change inlevel drugs (β2)
Change in slopedrugs (β3)
Change in levelsubsidies (β2)
Change in slopesubsidies (β3)
Number ofobservations
Adjusted R2 Durbin satsonstatistic
Demba 52*** 0.054 N/A N/A N/A N/A 13*** 0.14 48 0.88 1.5*
(4.3) (−0.2) (−2.3) (−0.22)
Itombwe 26*** 0.32 N/A N/A N/A N/A 16*** 0.077 48 0.86 1.68
(−5.8) (−0.25) (−3.5) (−0.3)
Kailo 29** 0.79 N/A N/A N/A N/A 8.9 −0.36 48 0.76 1.35**
(−9.2) (−0.4) (−5.2) (−0.48)
Kabare 18 0.97 N/A N/A N/A N/A 7.4 −1 48 0.67 0.82***
(−14) (−0.56) (−5.9) (−0.78)
Kampene 22 0.89 N/A N/A N/A N/A −2.9 −0.84 48 0.06 1.21***
(−16) (−0.7) (−8.8) (−0.86)
Minembwe 27** 0.49 N/A N/A N/A N/A 7.4 0.22 48 0.78 1.56*
(−7.9) (−0.34) (−4.9) (−0.41)
Pangi 26*** 0.46* N/A N/A N/A N/A 23*** −0.38 48 0.87 2.14
(−5) (−0.22) (−3.1) (−0.25)
Kalehe 45* 3 N/A N/A N/A N/A 6.2 −0.31 48 0.32 1.05***
(−17) (−0.72) (−8) (−0.94)
Ubundu 32 0.227 N/A N/A N/A N/A 5.09 0.586 57 0.82 0.73***
(−896) (−1.48) (−4.96) (−1.65)
Punia 21 2.4 −3.5 −1.6 1.3 0.45 18* 0.68 60 0.82 0.9***
(−16) (−5.7) (−8.7) (0.45) (−10) (−0.7) (−8.2) (0.9)
Ferekeni 25 5.7 −2.2 0.27 −12 −5.3 9.8 −0.31 60 0.78 1.23***
(−11) (−4.6) (−6.9) (−0.32) (−9) (−6) (−5.7) (−0.46)
Kalima 53 −1.9 1.1 10 17** −7.5 11** −0.31 60 0.93 1.33***
(−6.9) (−2.9) (−4.4) (−2.1) (−5.8) (−3.9) (−3.4) (−0.27)
Lubutu 49 −1.6 −11 −6.3 −4.5 7.3 18** 0.66 60 0.44 1.39***
(−12) (−5.3) (−8) (−3.7) (−11) (−7) (−6.3) (−0.48)
Obokote 38 −0.69 −2.2 3.1 7.9 −2 21.9*** 1** 60 0.56 1.92
(−13) (−5.9) (−8.2) (−3.9) (−13) (−7) (−5.2) (−0.36)
*P < 0.05. **P < 0.01. ***P < 0.001.N.B. All Standard Errors are in parenthesis.
Mainiet
al.BMCHealth
ServicesResearch
2014,14:504Page
7of
11http://w
ww.biom
edcentral.com/1472-6963/14/504
did not generate the long-term positive effect one couldexpect: in only one health zone, there was a significantpositive change in the trend of utilisation. In other healthzones, the change was most of the time negative butalways not significant. These findings suggested that thestudied user fee subsidisation sometimes generated somequick wins (significant in 7/16 health zones), but withouttriggering any positive loops developing their effect in themonths that followed.In addition, there was some variation in the effects of
user fee subsidisation on health-care utilisation at onemonth and 24 months between health zones. Althoughthe majority demonstrated a positive effect at one month,two zones showed a negative effect. This is similar to thefindings reported from a study on the abolition of userfees in Zambia and Niger [7], with the authors speculatingthat negative effects could be explained by varying degreesof enforcement of the new user fee policy; in some areas,informal fees may have continued to be charged at healthfacilities despite introduction of the policy.
The timing of salary supplements and free drug pro-vision did not appear to modify the effect of user feesubsidisation. This may be explained by the fact that thesehealth system strengthening measures alone are notenough to sufficiently improve health-care utilisation; theaddition of user fee subsidisation may further increaserates of health-care utilisation. Indeed, all zones werereceiving the full package of interventions by the timeuser fee subsidisation was introduced, strengtheningthe argument that all three measures should be in placeif significant improvements in health-care utilisationare to be achieved.One strength of our study is that it took into account
potential sources of bias, such as autocorrelation, whichoften arise in the analysis of routine longitudinal data[25], and used the methodology set out in a recentCochrane systematic review which concluded that morerigorous research on the effects of user fees on health-careutilisation was needed [6]. Secondly, the study covered alarge population over a five year period, thus increasing
Table 3 Regression output for health zones using equation 3
Healthzone
Constant(β0)
Seculartrend (β1)
Change in levelsalary supplementsand drugs (β2)
Change in slopesalary supplementsand drugs (β3)
Changein levelsubsidies (β2)
Changein slopesubsidies (β3)
Number ofobservations
AdjustedR2
Durbinwatsonstatistic
Bengamisa −1.3 2 −1.1 2 9.8 −3.5 58 0.87 0.82***
(−14) (−2) (−7.5) (−3.3) (−6.5) (−2.2)
Banalia 11 1.4 1.9 1.5 7 −2.4 58 0.89 1.15***
(−12) (−1.8) (−6.9) (−3) (−5.9) (−2)
***P < 0.001.N.B. All Standard Errors are in parenthesis.
Figure 2 Effects of user fee subsidisation on mean health-care utilisation rate 12 months prior to and 24 months following theirintroduction for 16 health zones of the DRC (2008 to 2012).
Maini et al. BMC Health Services Research 2014, 14:504 Page 8 of 11http://www.biomedcentral.com/1472-6963/14/504
the statistical power of the results. It is possible that datareporting improved over the life of the programme ashealth workers were trained over the course of theprogramme in monitoring and evaluation. Yet, the steadydata completion rates over time suggest that this was nota major factor. This study also attempted to control forthe confounding effect of salary supplements and drugprovision, albeit in only seven health zones.There were a number of study limitations. Firstly,
although the population denominators that were usedwere the best available, they were nonetheless unreliableas they were extrapolated from a census conductedalmost 30 years ago. This is a limitation common to allrecent analyses of demographic information in the DRC.The numerator data could also have been manipulatedby health zone staff; although there were regular spotchecks and audits as well as supervision by the NGOs toensure data recording was accurate, it is still possiblethat some zones could have over-reported utilisationfigures. The extent to which this may have occurredcould not be quantified in this study. Secondly, datadisaggregated by age and sex were not available for ourstudy, and so the effect of user fees on different sub-groups of the population could not be assessed. Such datashould be collected and analysed in any future user feesubsidy programmes in the DRC. Thirdly, there was someanecdotal evidence that people living in health zones
which were not included in the programme were seekingcare in health zones with user fee subsidisation, sometimestravelling long distances to receive care. This spill-overeffect could not be quantified, and may have inflated ourresults. However, it also provides evidence that userfees act as a barrier to accessing services, if people arecompelled to travel considerable distances to avoid them.In addition, factors which may have affected health-careutilisation at different points over the five year period (e.g.episodes of conflict or displacement, construction work,and training funded by the programme) were not mea-sured as part of this study. This was mitigated by the factthat data on utilisation at least a year prior to and twoyears after the implementation of user fee subsidisationwere available for all health zones allowing reliable trendeffects to be established. In the South Kivu health zones inparticular, episodes of conflict and displacement occurredperiodically between 2008 and 2012, which would havebeen expected to lead to a concomitant decrease in utilisa-tion rates. However, this was not observed in these healthzones. On the other hand, registration for the elections inNovember 2011 which occurred in health facilities mayhave driven an increase in utilisation rates in generalacross health zones during this time.A major gap in current health policy research is the
lack of studies on the impact of user fee subsidisation onmortality and other health indicators. Unfortunately,
Table 4 Regression output for mean utilisation rate using equation 1
All 16 zones Constant (β0) Seculartrend (β1)
Change inlevel (β2)
Change inslope (β3)
Number ofobservations
Adjusted R2 Durbin watson statistic
Overall mean utilisation rate 37** 0.436 7.43** 0.312 37 0.95 0.96***
(13.2) (0.63) (2.22) (0.787)
**P < 0.01. ***P < 0.001.N.B. All Standard Errors are in parenthesis.
Figure 3 Percentage change in health-care utilisation rates between modelled and counterfactual outcomes, one month and 24 monthsafter introducing user fee subsidisation in the DRC (2008 to 2012).
Maini et al. BMC Health Services Research 2014, 14:504 Page 9 of 11http://www.biomedcentral.com/1472-6963/14/504
given the retrospective nature of our study, we wereunable to assess the impact of user fee subsidisation onsuch indicators but further studies exploring this arewarranted. Finally, without performing a randomisedcontrolled trial, it is not possible to test the assumptionthat the underlying trend in utilisation prior to the intro-duction of the user fee policy would have continued inthe absence of the intervention.While recognising that there are many facets and strat-
egies that need to be considered in terms of the DRCachieving universal health coverage, this study illustratesthat the current levels of user fees in the DRC may presenta barrier to accessing health-care. It was beyond the scopeof this study to consider the issue of sustainability withrespect to user fee subsidisation. However, any reluctanceto subsidise user fees is largely due to the increased healthbudget required. As such, for user fee subsidisation to beimplemented successfully there has to be long-termcommitment and investment by international donors andnational governments. Investing in a public health systemthat is underused because of financial barriers is not anoptimal allocation of resources. Until financial barriers areaddressed, improvements in health system funding totackle essential elements such as provision of health-carefacilities, inadequate drug supplies and poor quality medi-cations, poor training and motivation of health staff, short-ages of health-care workers (all common in poor resourcesettings), will continue to benefit only a limited number ofpeople. This is of utmost importance for donors and pol-icy makers striving towards health impact. Furthermore,the feasibility of alternative financing mechanisms shouldalso be explored and in this vein, DFID’s new Access toHealth-care programme aims to explore and evaluate theeffect of a system of community health insurance [31].
ConclusionIn conclusion, this study adds some evidence that subsi-dising user fees may increase utilisation in the short-term,and it is hoped that donors and government will embracethese findings when deciding on health financing policy,particularly as there is not yet a consensus view. Futurework however should focus on feasibility and sustainabil-ity issues associated with the removal or reduction of userfees and how to sustain its effects on utilisation in thelonger term [32].
Competing interestsRM and DC work as health advisers for the Department for InternationalDevelopment (DFID), which funded the primary health-care programme.SM provided statistical support from DFID London.
Authors’ contributionsJO and DC conceived the idea for the study. RM, RZ, RVB and JG developedthe study protocol. RM, SM, RVB and KT analysed the data. LH was involved inrevising the manuscript and contributed to the interpretation of data. RM wrotethe first draft of the article. All authors read and approved the final manuscript.
Authors’ informationRM is a specialist registrar in Public Health Medicine with the LondonDeanery, and is currently working on health systems research in theDemocratic Republic of Congo.
AcknowledgmentsThis research was supported through an operational research course, whichwas jointly developed and run by the Operational Research Unit (LUXOR),Médecins sans Frontières, Brussels-Luxembourg, The Centre for Operational Re-search, International Union Against Tuberculosis and Lung Disease, France,and The Union South-East Asia Regional Office. Additional support for runningthe course was provided by the Centre for International Health, University ofBergen, Norway and the Institute of Tropical Medicine, Antwerp, Belgium.Funding for the course was from an anonymous donor, the Department forInternational Development, UK, and Médecins Sans Frontières, Luxembourg.The authors also wish to thank IRC and MERLIN for assisting with datacollection. Finally, we would like to thank Christopher Pycroft, SarahGoldsmith and Albert Mudingayi from DFID DRC for giving their full supportto the implementation of the study.
Author details1Department for International Development, British Embassy, 83 Ave RoiBaudouin, Kinshasa, the Democratic Republic of Congo. 2Médecins SansFrontières Operational Centre Brussels, Operational Research Unit (LuxOR),Luxembourg, Luxembourg. 3Institute of Tropical Medicine, Antwerp, Belgium.4International Rescue Committee, Kinshasa, the Democratic Republic ofCongo. 5Department for International Development, London, UK.
Received: 6 July 2013 Accepted: 6 October 2014
References1. Harmonisation for Health in Africa Blogs. http://www.healthfinancingafrica.
org/3/post/2013/04/a-history-of-the-bamako-initiative-12-under-the-leadership-of-mr-grant-and-dr-mahler.html.
2. Garner P: The Bamako Initiative: financing health in Africa by sellingdrugs. BMJ 1989, 299:277–278.
3. Dupas P: Global Health Systems: Pricing and User Fees. www.stanford.edu/~pdupas/Dupas_Pricing&UserFees.pdf.
4. International Monetary Fund. http://www.imf.org/external/np/exr/facts/mdri.htm.
5. Ponsar F, Tayler-Smith K, Philips M, Gerard S, Van Herp M, Reid T, Zachariah R:No cash, no care: how user fees endanger health – lessons learnt regardingfinancial barriers to health-care services in Burundi, Sierra Leone, DemocraticRepublic of Congo, Chad, Haiti and Mali. Int Health 2011, 3:91–100.
6. Lagarde M, Palmer N: The impact of user fees on access to healthservices in low- and middle-income countries. Cochrane Database Syst Rev2011, 4: CD009094.
7. Lagarde M, Barroy H, Palmer N: Assessing the effects of removing userfees in Zambia and Niger. J Health Serv Res Policy 2012, 17(1):30–36.
8. Campbell J, Oulton J, McPake B, Buchan J: Removing user fees? Engagethe health workforce. Lancet 2009, 374:1966.
9. McPake B, Witter S, Ensor T, Fustukian S, Newlands D, Martineau T, Chirwa Y:Removing financial barriers to access reproductive maternal andnewborn health services: the challenges and policy implications forhuman resources for health. Hum Resour Health 2013, 11:46.
10. Burnham GM, Pariyo G, Galiwango E, Wabire-Mangen F: Discontinuation ofcost sharing in Uganda. Bull World Health Organ 2004, 82:187–195.
11. Gilson L, McIntyre D: Removing user fees for primary care in Africa: theneed for careful action. BMJ 2005, 331:762–765.
12. Nabyongo Orem J, Mugisha F, Kirunga C, Macq J, Criel B: Abolition of userfees: the Uganda paradox. Health Policy Plan 2011, 26:41–51.
13. James CD, Hanon K, McPake B, Balabanova D, Gwatkin D, Hopwood I,Kirunga C, Knippenberg C, Meessen B, Morris SS, Preker A, Soutevrand Y,Tibouti A, Villeneuve P, Xu K: To retain or remove user fees? Reflectionson the current debate in low- and middle- income countries. Appl HealthEcon Health Policy 2006, 5(3):137–153.
14. National Health Accounts DRC (2008–2009) Health Systems 20/20. http://www.healthsystems2020.org/section/where_we_work/drc/nha.
15. World Development Indicators Online. http://data.worldbank.org/indicator/NY.GNP.PCAP.CD.
Maini et al. BMC Health Services Research 2014, 14:504 Page 10 of 11http://www.biomedcentral.com/1472-6963/14/504
16. World Bank PovCalNet. http://iresearch.worldbank.org/PovcalNet/povcalSvy.html.
17. Hogan MC, Foreman KJ, Naghavi M, Ahn SY, Wang M, Makela SM, Lopez AD,Lozano R, Murray CJ: Maternal mortality for 181 countries, 1980–2008: asystematic analysis of progress towards Millennium Development Goal 5.Lancet 2010, 375(9726):1609–1627.
18. Black RE, Cousens S, Johnson HL, Lawn JE, Rudan I, Bassani DG, Jha P,Campbell H, Walker CF, Cibulskis R, Eisele T, Liu L, Mathers C: Child healthepidemiology reference group of WHO and UNICEF: global, regional,and national causes of child mortality in 2008: a systematic analysis.Lancet 2010, 375(9730):1969–1987.
19. Ministry of Planning: Document de Stratégie de la Croissance et de laRéduction de Pauvreté. Kinshasa: Government of the Democratic Republic ofCongo; 2006.
20. Ministry of Health: Document de Stratégie de Renforcement du Système deSanté. Kinshasa: Government of the Democratic Republic of Congo; 2006.
21. DFID Access to health-care in the Democratic Republic of Congo (2008–2013).http://projects.dfid.gov.uk/projects/GB-1-105861.
22. Turner T: The Congo Wars: Conflict, Myth, and Reality. New York:Zed Books; 2007.
23. 1984 Latest census in DRC. http://rtkapend.wordpress.com/2012/02/17/drc-population-by-age-group-latest-census-1984.
24. The World Bank: Democratic Republic of Congo. http://web.worldbank.org/.25. Lagarde M: How to do (or not to do)…Assessing the impact of a policy
change with routine longitudinal data. Health Policy Plan 2011, 27(1):1–8.26. Dzakpasu S, Powell-Jackson T, Campbell OMR: Impact of user fees on
maternal health utilisation and related outcomes: a systematic review.Health Policy Plan 2014, 29(2):137–150.
27. Witter S: Health financing in fragile and post-conflict states: what do weknow and what are the gaps? Soc Sci Med 2012, 75(12):2370–2377.
28. Morena-Serro R, Smith PC: Does progress towards universal healthcoverage improve population health? Original text. Lancet 2012,380(9845):917–923.
29. Steinhardt LC, Aman I, Pakzad I, Kumar B, Singh LP, Peters DH: Removinguser fees for basic health services: a pilot survey and national roll-out inAfghanistan. Health Policy Plan 2011, 26(Suppl 2):92–103.
30. Ponsar F, Herp MV, Zachariah R, Gerard S, Philips M, Jouquet G: Abolishinguser fees for children and pregnant women trebled uptake of malaria-related inteventions in Kangaba, Mali. Health Policy Plan 2011, 26:72–83.
31. DFID Access to Health-Care in the Democratic Republic of Congo (2013–2018).http://projects.dfid.gov.uk/projects/GB-1-202732.
32. Hercot D, Meesen B, Ridde V, Gilson L: Removing user fees for healthservices in low-income countries: a multi-country review framework forassessing the process of policy change. Health Policy Plan 2011, 26:5–15.
doi:10.1186/s12913-014-0504-6Cite this article as: Maini et al.: Picking up the bill - improving health-care utilisation in the Democratic Republic of Congo through user feesubsidisation: a before and after study. BMC Health Services Research2014 14:504.
Submit your next manuscript to BioMed Centraland take full advantage of:
• Convenient online submission
• Thorough peer review
• No space constraints or color figure charges
• Immediate publication on acceptance
• Inclusion in PubMed, CAS, Scopus and Google Scholar
• Research which is freely available for redistribution
Submit your manuscript at www.biomedcentral.com/submit
Maini et al. BMC Health Services Research 2014, 14:504 Page 11 of 11http://www.biomedcentral.com/1472-6963/14/504
![MAINI PRECISION PRODUCTS LIMITED - Capital …SUDARSHAN KUMAR MAINI, SANDEEP KUMAR MAINI, GAUTAM MAINI AND CHETAN KUMAR MAINI PUBLIC OFFER OF UP TO [ ] EQUITY SHARES OF FACE VALUE](https://img.dokumen.tips/doc/110x75/5f2b395e885ffb34c179bf00/maini-precision-products-limited-capital-sudarshan-kumar-maini-sandeep-kumar.jpg)