Embed Size (px)
Citation preview

PRODUCTIVE SPILLOVERS OF THE TAKEUP OF INDEX-BASED LIVESTOCK INSURANCE
Russell TothWith Chris Barrett, Rich Bernstein, Pat Clark, Carla Gomes, Shibia Mohamed,
Andrew Mude, and Birhanu Taddesse
2014 AAEA Annual Meeting – Minneapolis
July 28, 2014

Main Question
What is the impact of index-based livestock insurance (IBLI) on herd stocking and movement choices of East African pastoralists (livestock herders)?
IBLI could enhance welfare by helping pastoralists smooth shocks to herd stocks due to weather.
Concern that scale-up of IBLI could lead to unsustainable environmental degradation.
Introduction | Setting | Design | Data | Results | Conclusion

Theoretical Possibilities
• Herd sizes follow boom-and-bust cycles between normal weather and shocks due to drought.
• What happens if we introduce weather-indexed insurance that pays out during droughts?
Introduction | Setting | Design | Data | Results | Conclusion
Time
Livestock
Drought Drought

Theoretical Possibilities
• Herd sizes follow boom-and-bust cycles between normal weather and shocks due to drought.
• What happens if we introduce weather-indexed insurance that pays out during droughts?
Introduction | Setting | Design | Data | Results | Conclusion
Time
Livestock
Drought Drought

Theoretical Possibilities
• Predictions for behavioural response depend on what motivates herd accumulation choices: Precautionary savings? Lack of investment alternatives?o If precautionary savings motives dominate, then
IBLI herd size ↓o If risk-adjusted investment motives dominate,
then IBLI could herd size ↑• Will they feel less need to move (increasing grazing
intensity), due to substituting IBLI for self-insurance through costly movement, or perceiving less risk? Or trickle-through effects of herd size – e.g., more vigilant asset protection?
Introduction | Setting | Design | Data | Results | Conclusion

Existing Literature is Mixed
• Janzen and Carter (2013): Insured HH with larger asset stocks show less asset decumulation after a drought (in Kenya).
• Jensen et al (2014): IBLI leads to decumulation of herd assets (in Kenya).
• Cole et el (2013): weather index insurance leads Indian farmers to more risky production choices.
Introduction | Setting | Design | Data | Results | Conclusion
Mobile Pastoralism
• Arid and semi-arid rangelands of southern Ethiopia (Borena plateau).
• Over 8 million migrant pastoralists in Ethiopia, accounting for significant proportion of agricultural GDP and grazing land.
Introduction | Setting | Design | Data | Results | Conclusion
• Implications for food security and use of otherwise unproductive land.

Mobile Pastoralism
• Bi-annual dry seasons in which local forage and water resources are not enough to sustain most herds.
• Hence mobile pastoralists temporarily migrate to remote water points and pastures.o Occupational ladder: sedentarism mobile
pastoralism diversification
Introduction | Setting | Design | Data | Results | Conclusion

Mobile Pastoralism
Introduction | Setting | Design | Data | Results | Conclusion

Mobile Pastoralism
Introduction | Setting | Design | Data | Results | Conclusion
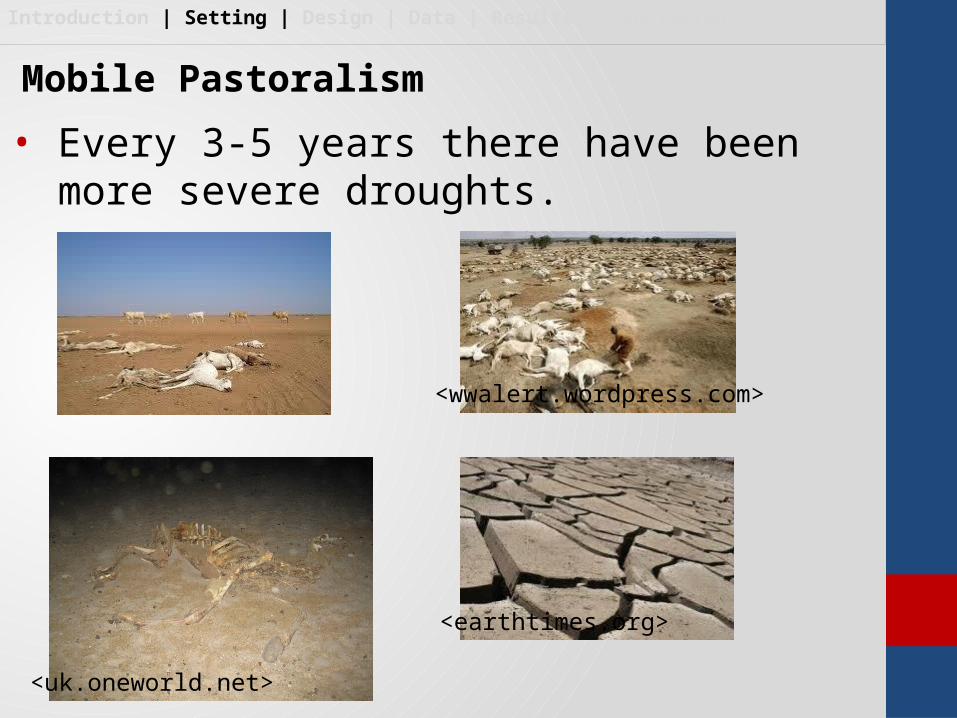
Mobile Pastoralism
• Every 3-5 years there have been more severe droughts.
Introduction | Setting | Design | Data | Results | Conclusion
<wwalert.wordpress.com>
<uk.oneworld.net>
<earthtimes.org>

Index Insurance (IBLI)
• In response to this, colleagues at Cornell, UC Davis and the International Livestock Research Institute (Nairobi, Kenya) began developing an index-based livestock insurance (IBLI) product around 2005, and rolled it out in 2009.
• Index-based: uses weather data to detect high probability of herd loss.
• Livestock insurance: households can directly insure cattle.
Introduction | Setting | Design | Data | Results | Conclusion

What We Do
• Randomly allocate free IBLI contracts covering 15 cattle, to 10 households (10 control).o Sample stratified to cover 4 segments of herd size
distribution (trimming poor, immobile HH and rich ones), in 5 villages.
• GPS collar data:• In order to study impacts on movement, track 3
cows per household (so 60 collars in total) using satellite-based GPS collars.
• August, 2011 to present (some gaps due to collar issues/failure).
• Record exact location at 5 minute intervals.
Introduction | Setting | Design | Data | Results | Conclusion

Data: GPS Collaring
Introduction | Setting | Design | Data | Results | Conclusion

Several Globules of Concentrated Use
High Potential for Environmental Impact
Linear, Trailing Features
Limited Foraging Extent
Each Globule Centered Around a Watering Point.
GlobularMovement Pattern

Foraging Loops
Very ExtensiveMovement Patterns
Foraging Much More Dispersed.
Daily Watering
Generally Less Impactful.

Data: Checking Baseline Balance
Introduction | Setting | Design | Data | Results | Conclusion
1 TLU = 1 adult cow
Treatment Control Variable name Mean SD Mean SD Difference
Age HH head 49.55 9.55 49.95 16.72 0.93Sex HH head 1.00 0.00 1.10 0.31 0.15Num HH member 7.90 3.16 8.40 5.07 0.71Num subherds 3.65 1.04 2.75 1.02 0.01***TLU whole herd 32.15 41.21 26.40 19.63 0.58TLU cattle only 36.75 41.89 29.75 22.42 0.51IBLI know. Index (/8) 5.40 0.82 5.50 0.83 0.70Concern 1 1.57 0.87 1.50 1.05 0.81Concern 2 1.26 0.91 1.84 1.69 0.19Concern 3 0.83 0.68 0.76 0.61 0.72Concern 4 0.58 0.56 0.62 0.61 0.86Concern 5 0.68 0.67 0.71 0.92 0.91Concern 6 0.71 0.86 0.71 0.75 0.99Concern 7 0.75 0.87 0.78 0.84 0.91Concern 8 0.56 0.52 0.64 0.67 0.66Concern 9 0.93 0.87 0.89 0.89 0.88Concern 10 0.69 0.72 0.78 0.95 0.74N 20 20 Note: *** p<0.01, ** p<0.05, * p<0.1Note: TLU = Tropical Livestock Units (1 TLU = 1 cow = 0.7 camels = 0.1 sheep or goats)
Econometric Approach
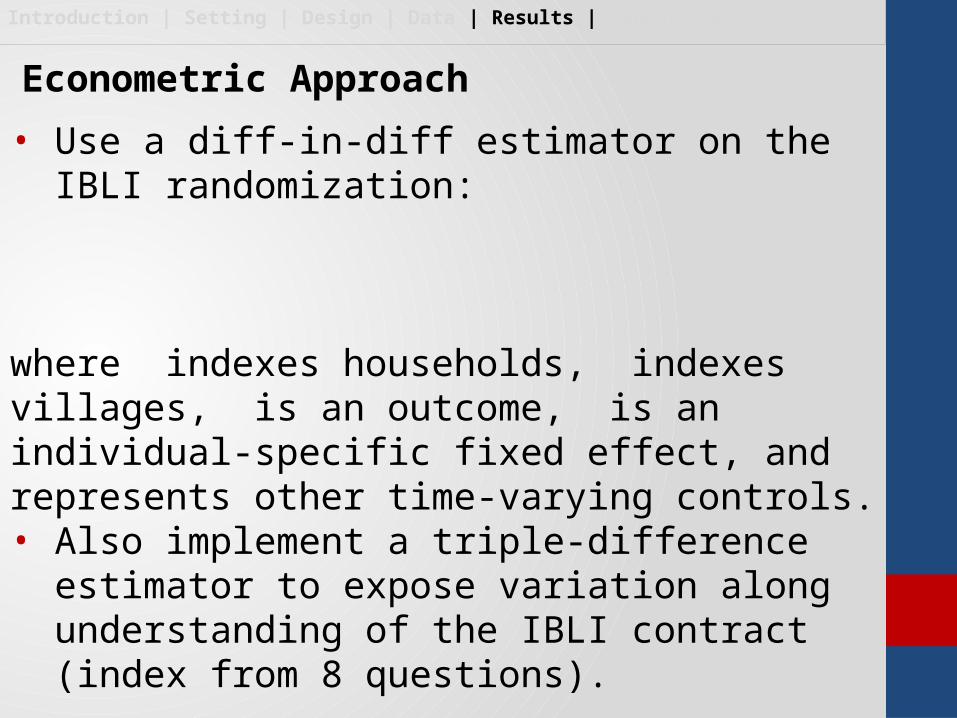
• Use a diff-in-diff estimator on the IBLI randomization:
where indexes households, indexes villages, is an outcome, is an individual-specific fixed effect, and represents other time-varying controls.• Also implement a triple-difference estimator to
expose variation along understanding of the IBLI contract (index from 8 questions).
Introduction | Setting | Design | Data | Results | Conclusion

Results: Impacts on Asset Accumulation: TLU cattle
Introduction | Setting | Design | Data | Results | Conclusion
At baseline: mean(TLU cattle) = 29.3, sd(TLU cattle) = 32
(1) (3)Treatment -154.319** -64.221 -68.823 -66.392Post -22.114** -57.955 -9.595 -79.872Treament*Post 11.167* 36.459 -5.711 -60.818Age of HH Head 28.638*** 30.249** -10.536 -13.788Age of HH head squared -0.117 -0.133 -0.079 -0.11HH members -109.285*** -122.133*** -31.342 -41.562Post*IBLI index 6.581 -14.454Treatment*Post*IBLI index -4.631 -10.874R-squared 0.939 0.939Adj. R-squared 0.919 0.917N 100 100* p<0.10, ** p<0.05, *** p<0.01Note: All regresssion control for HH fixed effects.
IBLI increases herd accumulation by about 11 TLU, about 1/3 of mean herd size and 1/3 of the sd.

Results: Impacts on Asset Accumulation: TLU cattle
Introduction | Setting | Design | Data | Results | Conclusion
At baseline: mean(TLU cattle) = 29.3, sd(TLU cattle) = 32
(1) (3)Treatment -154.319** -64.221 -68.823 -66.392Post -22.114** -57.955 -9.595 -79.872Treament*Post 11.167* 36.459 -5.711 -60.818Age of HH Head 28.638*** 30.249** -10.536 -13.788Age of HH head squared -0.117 -0.133 -0.079 -0.11HH members -109.285*** -122.133*** -31.342 -41.562Post*IBLI index 6.581 -14.454Treatment*Post*IBLI index -4.631 -10.874R-squared 0.939 0.939Adj. R-squared 0.919 0.917N 100 100* p<0.10, ** p<0.05, *** p<0.01Note: All regresssion control for HH fixed effects.
The mean herd size result does not vary in knowledge of IBLI

Results: Impacts on Max Distance Travelled
Introduction | Setting | Design | Data | Results | Conclusion
(1) (2) (3)
Treatment 4.350*** -3.867 . -0.099 -3.919 . Post -0.064 -0.113 -1.159*** -0.052 -0.146 -0.378Treament*Post 0.101 0.097 5.103*** -0.084 -0.084 -0.591Age of HH Head 0.552*** 0.217 -0.169 -0.177Age of HH head squared -0.005*** -0.003** -0.001 -0.001HH members -0.651* -0.163 -0.353 -0.527Number IBLI Q correct (/8) 0.588 -2.21Post*IBLI index 0.205*** -0.065Treatment*IBLI index -0.252 -0.896Treatment*Post*IBLI index -0.942*** -0.109R-squared 0.729 0.73 0.731Adj. R-squared 0.729 0.729 0.731N 17569 17569 17569* p<0.10, ** p<0.05, *** p<0.01Note: All regresssion control for HH fixed effects.
No significant average effect of IBLI on max distance travelled.
At baseline: mean(Max. Dist. Traveled) = 4.2 km, sd(Max. Dist. Traveled) = 3 km

Results: Impacts on Max Distance Travelled
Introduction | Setting | Design | Data | Results | Conclusion
(1) (2) (3)
Treatment 4.350*** -3.867 . -0.099 -3.919 . Post -0.064 -0.113 -1.159*** -0.052 -0.146 -0.378Treament*Post 0.101 0.097 5.103*** -0.084 -0.084 -0.591Age of HH Head 0.552*** 0.217 -0.169 -0.177Age of HH head squared -0.005*** -0.003** -0.001 -0.001HH members -0.651* -0.163 -0.353 -0.527Number IBLI Q correct (/8) 0.588 -2.21Post*IBLI index 0.205*** -0.065Treatment*IBLI index -0.252 -0.896Treatment*Post*IBLI index -0.942*** -0.109R-squared 0.729 0.73 0.731Adj. R-squared 0.729 0.729 0.731N 17569 17569 17569* p<0.10, ** p<0.05, *** p<0.01Note: All regresssion control for HH fixed effects.
Max distance decreases by ~1 km (25% of mean) per day per correct question (out of 8)
At baseline: mean(Max. Dist. Traveled) = 4.2 km, sd(Max. Dist. Traveled) = 3 km

Results: Impacts on Average Speed
Introduction | Setting | Design | Data | Results | Conclusion
(1) (2) (3)Treatment 0.617*** 0.691** . -0.008 -0.343 . Post 0.005 0.036*** -0.071** -0.004 -0.013 -0.032Treament*Post 0.020*** 0.019*** 0.476*** -0.007 -0.007 -0.048Age of HH Head 0.016 -0.015 -0.015 -0.015Age of HH head squared -0.000*** -0.000* 0.00 0.00HH members 0.038 -0.140*** -0.031 -0.045Number IBLI Q correct (/8) 0.645*** -0.192Post*IBLI index 0.021*** -0.006Treatment*IBLI index 0.202*** -0.079Treatment*Post*IBLI index -0.086*** -0.009R-squared 0.893 0.893 0.894Adj. R-squared 0.893 0.893 0.894N 17569 17569 17569
* p<0.10, ** p<0.05, *** p<0.01Note: All regresssions control for HH fixed effects.
IBLI increases average speed (economically small effect, 3.1% of mean, 6.7% of sd).
At baseline: mean(Avg. Speed) = 0.63 km/hr, sd(Avg. Speed) = 0.3 km/hr

Results: Impacts on Average Speed
Introduction | Setting | Design | Data | Results | Conclusion
(1) (2) (3)Treatment 0.617*** 0.691** . -0.008 -0.343 . Post 0.005 0.036*** -0.071** -0.004 -0.013 -0.032Treament*Post 0.020*** 0.019*** 0.476*** -0.007 -0.007 -0.048Age of HH Head 0.016 -0.015 -0.015 -0.015Age of HH head squared -0.000*** -0.000* 0.00 0.00HH members 0.038 -0.140*** -0.031 -0.045Number IBLI Q correct (/8) 0.645*** -0.192Post*IBLI index 0.021*** -0.006Treatment*IBLI index 0.202*** -0.079Treatment*Post*IBLI index -0.086*** -0.009R-squared 0.893 0.893 0.894Adj. R-squared 0.893 0.893 0.894N 17569 17569 17569
* p<0.10, ** p<0.05, *** p<0.01Note: All regresssion control for HH fixed effects. At baseline: mean(Avg. Speed) = 0.63 km/hr,
sd(Avg. Speed) = 0.3 km/hr
Average speed significantly decreases in knowledge of IBLI (14% of mean, 29% of sd per correct question)

Conclusion and Discussion
• Evidence of an economically-significant impact of IBLI on asset accumulation. Consistent with fears about excess accumulation.
• Interesting interaction in IBLI knowledge – potentially increasing grazing intensity.
Future Work• Richer measures of movement.• More fine-grained analysis (sub-herd level).• Bring in data from large HH survey:
o Potential for IV on insurance uptake from larger sample (using cruder movement data on large HH survey).
Introduction | Setting | Design | Data | Results | Conclusion