Embed Size (px)
Citation preview

MAGNITUDES AND MECHANISMS OF CAPITAL FLIGHT FROM ANGOLA, CÔTE D’IVOIRE AND SOUTH AFRICA
PERI WORKING PAPER SERIES: CAPITAL FLIGHT FROM AFRICA / WP#500
By Léonce Ndikumana and James K. BoycePolitical Economy Research Institute (PERI)
University of Massachusetts-Amherst
DECEMBER 2019
This paper was revised May 2021

Magnitudes and Mechanisms of Capital Flight from Angola,
Côte d’Ivoire and South Africa*
Léonce Ndikumana and James K. Boyce
Political Economy Research Institute (PERI) University of Massachusetts Amherst
Revised: May 2021
Abstract This paper presents an updated methodology for estimation of capital flight, which is applied to the cases of Angola, Côte d’Ivoire and South Africa. The results indicate that the three countries have experienced substantial capital flight over the past four decades, amounting to $103 billion in constant 2018 dollars for Angola (over 1986-2018), $55 billion for Côte d’Ivoire (over 1970-2018), and $329 billion for South Africa (over 1970-2018). An important mechanism of capital flight is misinvoicing of exports and imports, especially in primary commodities. The fact that these outflows have persisted over a long period indicates that they are driven by fundamental structural and institutional factors pertaining to both the source countries and the global financial system. These outflows have led to the accumulation of massive offshore wealth belonging to the economic and political elites from these countries, even as their populations continue to face deprivation in access to basic services. Capital flight is clearly a major obstacle to development financing that needs to be tackled through coordinated strategies at national and international level.
* This paper is a product of a research project funded by a grant from the Open Society Foundation, which is very much appreciated. Additional support from Freidrich Ebert Stiftung is acknowledged. The project undertakes a detailed historical and institutional investigation of the magnitudes, drivers, and enablers of capital flight from Angola, Côte d’Ivoire and South Africa. The research will produce individual case studies on these three countries along with a chapter on the capital flight-governance nexus. The findings will be published in an edited volume, country case study reports, academic papers and other outlets. The research team includes Melvin Ayogu (study on capital flight-governance nexus), Adam Aboobaker and Karmen Naidoo (case study on South Africa), Jean Merckaert (case study on Côte d’Ivoire), and Nicholas Shaxson (case study on Angola).

Preface to the Working Paper Series on Capital Flight from Africa
Capital flight constitutes a major constraint to Africa’s efforts to fill the large and growing financing gaps that hold back its progress towards achieving sustainable development goals. The mounting evidence on the unrecorded outflows of capital from Africa has spurred calls for strategies to curb the financial hemorrhage that is afflicting the continent. The existing evidence is still inadequate, however, on four fronts. First, the quantitative evidence is predominantly aggregate and does not furnish adequate country-specific information on the mechanisms of capital flight, its institutional contexts, and the role of domestic and foreign players in facilitating it. Second, the literature has not paid adequate attention to the destinations of wealth accumulated through capital flight and the roles of the banking sector and public institutions in destination jurisdictions. Third, much of the literature conflates the capital flight with the broader concept of illicit financial flows. While all capital flight is illicit owing to its unrecorded transfer – and often, as well, by virtue of the illegal origins of the wealth, and the failure to declare the assets and pay tax on the associated income – not all illicit financial flows are capital flight; for example, payments for smuggled imports are an illicit flow but distinct from capital flight. Fourth, the existing literature has not sufficiently explored the two-way relationship between capital flight and governance in national and international institutions. To help fill these gaps in the literature, the African Development Policy Program at the Political Economy Research Institute has initiated detailed analyses in a project generously supported by the Open Society Foundations and the Friedrich Ebert Foundation. This Working Paper series presents the project’s outputs. Our goal in issuing these reports is to engender informed public participation in decision making on financial regulation. Key findings will be distilled and published in the coming year in an edited volume that is forthcoming from Oxford University Press. Léonce Ndikumana Distinguished Professor and Director African Development Policy Program University of Massachusetts Amherst

1
I. Introduction
This paper presents an analysis of the magnitude of capital flight from Angola, Côte d’Ivoire, and South Africa during 1970-2018. It begins with a discussion of the distinction between capital flight and illicit financial flows, two phenomena that are related but different, although the two terms are often used interchangeably in both technical literature and the media.
The measurement of capital flight follows the methodology used by Ndikumana and Boyce (2010) and J.S. Henry (2012), in which capital flight is defined as unrecorded capital flows and measured as discrepancies between recorded inflows and outflows of foreign exchange as reported in the country’s official Balance of Payments. Net foreign exchange inflows consist mainly of additions to the stock of external debt and capital inflows in the form of foreign direct investment, portfolio investment and other investment. In the absence of capital flight, these inflows should be balanced by the sum of the current account deficit and net additions to foreign exchange reserves.
Net trade misinvoicing – obtained from trading partner data comparisons – is added to this residual to obtain our measure of capital flight. A key innovation in this paper is that it goes beyond national aggregate measures to examine trade misinvoicing at the bilateral and product level in order to shed light on possible conduits of capital flight, focusing on major export commodities for each of these three countries.
In addition to the flow perspective on capital flight, it is important to recognize that a substantial fraction of capital smuggled abroad is invested offshore in income generating assets. The paper therefore presents estimates of stocks of private wealth accumulated offshore, drawing on the work of J.S. Henry (2012) and J.S. Henry (2016). The twin processes of unrecorded capital outflows and the accumulation of hidden offshore private wealth both are facilitated by enabling institutions in the international financial system.
The next section presents the definitions of the key concepts used in the paper and describes the methodology and the data used to estimate capital flight. Sections III, IV and V present the results for South Africa, Côte d’Ivoire and Angola, respectively. Section VI discusses the phenomenon of unrecorded offshore wealth resulting from the outflows of capital from these countries, and Section VII concludes.

2
II. Definitions, Methodology and Data
II.1. The capital flight subset of illicit financial flows
It is useful to clarify the relationship between capital flight and 'illicit financial flows,' concepts
that sometimes have been used interchangeably in the recent literature and policy debates.1 Capital
flight is usually defined as unrecorded capital outflows and measured as the missing residual in
the Balance of Payments, after corrections for underreported external borrowing and trade
misinvoicing. The definition of capital flight is discussed in detail in the next subsection. The
important point is that while all capital flight is illicit, not all illicit financial flows are capital flight.
For example, some illicitly acquired funds may be shifted abroad through officially recorded
transfer mechanisms, in which case they would not count as capital flight according to the
conventional definition.
Capital flight refers to illicitly transferred financial assets, capital outflows that are not reported
to government authorities. Mechanisms for illicit transfer include the smuggling of bank notes,
clandestine wire transfers, and falsification of trade invoices. The motives for illicit cross-border
transfers include evasion of judicial scrutiny of the origin of the wealth, evasion of tax on the
transaction and subsequent earnings on the assets, and fear of extortion or outright expropriation.
In addition to being illicit by virtue of its unrecorded transfer, capital flight often is also illicit by
virtue of illegal acquisition and illegal holding abroad. Illicitly acquired capital is money obtained
through corruption, embezzlement, theft, bribes, extortion, tax evasion, counterfeit, trafficking in
illegal goods and services, and other criminal activities. Wealth acquired by these means is often
transferred abroad clandestinely in an effort to shield it from legal scrutiny and forfeiture risk.
Illicitly held funds are external assets that are not declared to national authorities of the owner's
country. The concealment of foreign asset holdings may be motivated by the desire to evade
1 See Boyce, James K. and Léonce Ndikumana. 2015. "Strategies for Addressing Capital Flight," S. I. Ajayi and L. Ndikumana, Capital Flight from Africa: Causes, Effects and Policy Issues. Oxford: Oxford University Press, 393-417. for a discussion of the policy implications for the distinction between various forms of illicit financial flows. The edited volume by Reuter, Peter ed. 2012. Draining Development? Controlling Flows of Illicit Funds from Developing Countries. Washington DC: The World Bank. also includes discussions of the composition of illicit financial flows and the role played by safe havens and corporate practices.

3
prosecution for illicit acquisition or transfer of the funds, or to evade tax payments on asset
earnings.
The broader universe of illicit financial flows includes not only capital flight but also illicit
payments for goods and services as opposed to asset transfers, and asset transfers that are officially
recorded but nevertheless illicit by virtue of their mode of acquisition or concealed holding. This
wider domain includes payments for smuggled imports, transactions connected with illicit trade in
narcotics and other contraband, outflows of illicitly acquired funds that were domestically
laundered before flowing overseas through recorded channels, transfer pricing for purposes of tax
evasion, and outflows of the proceeds from other illicit practices. These, too, are illicit financial
flows, but they are not the same as capital flight.
Private assets held abroad consist of a heterogeneous pool that includes clean capital associated
with normal portfolio allocation, laundered capital that was illegally acquired but legally
transferred, smuggled capital that was legally acquired but illegally transferred, and dirty capital
that was both illegally acquired and illegally transferred. These distinctions are summarized in
Table 1. Capital flight comprises the latter two categories. This implies that policies to address
capital flight and illicit financial flows more broadly need to be tailored to the nature and type of
flows so as to both deter further illicit outflows and to facilitate repatriation of assets held abroad.
Table 1: Private assets held abroad
Acquisition Transfer
Legally acquired
Illegally acquired
(stolen assets)
Legally transferred Clean capital Laundered capital
Illegally transferred (capital flight) Smuggled capital Dirty capital
Source: James K. Boyce and Léonce Ndikumana (2015).

4
Capital flight and other illicit financial flows share in common the feature that they all involve
cross-border movements of money. They do not include illicit transactions whose proceeds remain
within the national boundaries. Illicit financial flows raise concerns because for the economy of
origin they constitute net losses of foreign exchange, tax revenue, and capital. At the same time,
these flows are associated with costs as well as benefits to the foreign economies that receive them,
where the gains in foreign exchange, tax revenue, and capital are often accompanied by adverse
effects resulting from corrosion of the integrity of financial and public institutions. A central theme
of this book is that capital flight is enabled by factors and actors both at the origin (here African
economies) and in the destination countries. The illicit export of capital from African countries is
a manifestation of failures in the international financial system that facilitates and enables it.
Former German president Horst Köhler put the matter clearly:
We cannot ignore the global kleptocratic model of capitalism that is sucking obscene amounts of
capital out of Africa… Chief among the beneficiaries of this flight of capital are the European banks
where African despots and tax-evading corporations stash their billions. If we finally brought order
to the international financial system and allowed the tax havens to wither away, that would be
credible! (German Ministry of Education and Research, 2014).2
In this sense, capital flight from Africa is a global phenomenon involving shared costs and
responsibilities for Africans and the global community. Any analysis of the drivers of capital
flight and strategies to prevent it must therefore pay attention to factors and actors at both ends of
the flows.
II.2. Capital flight as a Balance of Payments residual
The economics literature defines capital flight as unrecorded outflows of capital from a country.
Measuring capital flight is a challenging exercise because it is by nature a hidden activity due to
its inherent illicit nature. Thus it can only be measured indirectly. The problem is that the
underlying data that can be used for such a detective exercise is also imperfect and fraught with
imprecisions. The original approach to measuring capital flight considers it as consisting of
2 See Köhler, Horst. 2015. "On the Impossibility of Speaking of Africa: Essay Based on a Speech at the Africa Days of the German Federal Ministry of Education and Research on March 18, 2014." Africa Journal of Management, 1(3), 257-63. for an essay based on his speech.

5
discrepancies between recorded inflows of foreign exchange and recorded uses of these resources
as reported in the country’s Balance of Payments (John T. Cuddington, 1986, 1987, Susanne Erbe,
1985, World Bank, 1985).3 This is referred to as the BoP residual method. J.S. Henry (2012)
provides a critical review of the various approaches to measuring capital flight and their
limitations.
Two key sources of foreign exchange inflows are considered in the Balance Payment residual
method: external borrowing and foreign direct investment inflows. In the wake of the debt crisis
of the 1980s, World Bank economists uncovered that external debt flows were underreported in
the Balance of Payments. The World Debt Tables (WDT), which were deemed to track debt flows
better than the Balance of Payments (BoP), were therefore used as an alternative source of data on
external borrowing in the computation of capital flight. The WDT were renamed the Global
Finance Development (GDF) database, which was subsequently renamed the International Debt
Statistics (IDS).
To obtain an accurate measure of resource inflows through external borrowing, three important
adjustments are made to the published debt series. First, given that countries borrow in different
currencies and that the stock of debt is reported at the end of the year in a common currency (the
US dollar), variations of the exchange rates of the currencies of original denomination of the debt
vis-à-vis the US dollar may create biases in the debt inflows obtained as simple year-on-year
changes in debt stock. The debt stock is therefore adjusted taking into account the currency
composition of long-term debt and the annual change in the exchange rate vis-à-vis the dollar of
the respective currencies in which the debt was obtained. Details of the adjustment algorithm are
described in Léonce Ndikumana and James K. Boyce (2010) and they are reproduced in Appendix
A.1 of this paper.
Second, following Henry (2012), an adjustment is made to correct the bias caused by the fact that
in the IDS database, interest arrears are added to the debt stock even though they do not correspond
3 See Ndikumana, Léonce; James K. Boyce and Ameth S. Ndiaye. 2015. "Capital Flight from Africa: Measurement and Drivers," S. I. Ajayi and L. Ndikumana, Capital Flight from Africa: Causes, Effects and Policy Issues. Oxford: Oxford University Press, 15-54. for a detailed discussion of various definitions of capital flight.

6
to inflows of foreign exchange. Therefore, net changes in interest arrears are subtracted from the
change in debt stock to obtain an accurate measure of annual debt inflows.
Third, the series are adjusted for debt forgiveness or debt write-offs. Otherwise, the resulting
changes in end-of-year debt stocks would give the false impression of a debt repayment and
apparent outflow of foreign exchange. This is corrected by adding back the debt write-offs in
calculating the annual changes in debt stocks.
Over the past three decades, developing countries have experienced a diversification of capital
inflows beyond external borrowing and foreign direct investment. Inflows recorded in the BoP
categories of portfolio investment and ‘other investments’ have increased substantially, especially
since the turn of the century. These two flows are added to the sources of funds in the computation
of capital flight as a BoP residual.
For each country, the annual base measure of capital flight as a BoP residual is therefore
computed as follows:
!" = $%&'()%* + "%, + -, + ., − ($)% + $1&2) (1)
where CDEBTADJ is the change in debt stock adjusted for exchange rate fluctuations, debt
forgiveness, and change in interest arrears; FDI is foreign direct investment, PI is portfolio
investment, OI is other investments, CAD is the current account deficit, and CRES is net additions
to foreign exchange reserves.
Data on debt are obtained from the World Bank’s International Debt Statistics Database.4 For
South Africa, these series start in 1994; data for 1970-1993 are obtained from the African
Development Indicators (now discontinued), the South African Reserve Bank, and the African
Development Bank. Data for the other variables are taken from the Balance of Payments.5 The
transition from edition 5 to edition 6 of the Balance of Payments reporting system introduced
4 International Debt Statistics Database are available online at: https://databank.worldbank.org/source/international-debt-statistics 5 Data on foreign direct investment may also be obtained from the UNCTAD statistical database (UNCTAD Data Center, Investment: http://unctadstat.unctad.org/wds/ReportFolders/reportFolders.aspx).

7
changes in the way some elements of the financial account are reported (IMF, 2010).6 Investment
flows are recorded in terms of assets and liabilities rather than credit and debit as it was done in
the 5th BoP edition format. As a result, a net inflow of FDI, PI, or OI appears with a negative sign
(representing a liability) while a net outflow is reported with a positive sign (representing an asset),
a reversal of the conventional BoP practice of assigning positive signs to foreign exchange inflows
and negative signs to outflows. Therefore, the new series need to be modified by flipping the sign
before they are entered in the formula (1) above. The same applies for CRES. The reporting of
the current account remains unchanged in the new format of the BOP, so no adjustment is
necessary for this variable.
II.3. Adjustment for trade misinvoicing
The data on trade transactions in the BoP may be affected by erroneous or deliberate misinvoicing
of the value of imports and exports. Indeed trade misinvoicing has emerged as an important
channel of capital flight (Léonce Ndikumana, James K. Boyce and Ameth S. Ndiaye, 2015) and
money-laundering (D. Kar and J. Spanjers, 2014, Joseph Spanjers and Matthew Salomon, 2017).7
Attention to trade misinvoicing dates from the 1960s with the pioneering work of Jagdish
Bhagwati (J. Bhagwati, 1967, 1964, J. Bhagwati and Bent Hansen, 1973, J. Bhagwati et al., 1974),
and it was revived in the 1980s in the context of the research on capital flight motivated by the
debt crisis faced by developing countries (Gulati, 1987).
In addition to serving as a mechanism for capital flight through under-invoicing of exports
(allowing foreign exchange receipts to be sequestered abroad) or over-invoicing of imports
(allowing foreign exchange outflows in excess of the true cost of imports), misinvoicing may also
take the form of import smuggling. In “technical” smuggling, a false invoice is submitted that
understates the value of the imported goods and services. In “pure” smuggling, the import is wholly
6 See the Balance of Payments and International Financial Position Manual 6th Edition: https://www.imf.org/external/pubs/ft/bop/2007/pdf/bpm6.pdf. 7 Also see UNCTAD. 2016. "Trade Misinvoicing in Primary Commodities in Developing Countries: The Cases of Chile, Côte D’ivoire, Nigeria, South Africa and Zambia," Geneva: UNCTAD, December, . Spanjers, Joseph and Matthew Salomon. 2017. "Illicit Financial Flows to and from Developing Countries: 2005-2014," Washington, DC: Global Financial Integrity, estimate that trade misinvoicing represents up to 87 percent of total illicit financial flows from developing countries from 2005 to 2014. Estimates of the share of trade misinvoicing in illicit financial flows and capital flight vary across studies due to differences in methodology, data and sample.

8
concealed and no invoice is submitted. Of course, imports must be paid for (in foreign exchange)
regardless of whether or not truthful invoices are submitted to local authorities. These payments
are illicit financial outflows, but since goods and services are received in return for the payments,
they are not a transfer of assets and hence not capital flight.
The accuracy of the residual measure of capital flight can be improved by adjustments for the net
impact of trade misinvoicing. The effect on the magnitude of capital flight can go in either
direction. If misinvoicing for purposes of capital flight exceeds smuggling, the adjustment adds to
the total; if smuggling exceeds misinvoicing for purposes of capital flight, it subtracts from the
total, since part of the “missing money” was used to finance unrecorded imports.
Measuring trade misinvoicing
In this paper we introduce two innovations in the measurement of trade misinvoicing relative to
our previous estimates. The first is the proxy for the cost of insurance and freight (c.i.f.) factor
used to convert exports from free-on-board values to cif values. The second is a refinement in the
computation of aggregate trade misinvoicing obtained by scaling up discrepancies between an
African country’s exports and imports and the values reported by the group of advanced or
industrialized countries (ICs). These changes are described in sequence in this section.
The measurement of trade misinvoicing is based on data from the Direction of Trade Statistics
(DoTS) database compiled by the IMF,8 which contains aggregate imports and exports by partner.
Trade misinvoicing at a disaggregated level by product can be estimated using the Comtrade
database compiled by the United Nations Statistics Division.9 Trade misinvoicing can be estimated
at three levels: for all trading partners taken together, by partner individually, and by product.
Estimates are based on the simple principle that the value of exports by a country A to partner B,
as reported by the exporter, should match the value of imports from country A as reported by
country B, after accounting for the cost of insurance and freight (c.i.f.).10
8 The Direction of Trade Statistics database is available online at http://www.imf.org/en/data. 9 The Comtrade database is available online at https://comtrade.un.org/data/. 10 This principle was first proposed more than a century ago by Ferraris, C. F. 1885. "La Statistica Del Movimento Dei Metalli Preziosi Fra L'italia E L'estero (Rome)," .
9
When data from trading partners can be considered more reliable than the mirror data reported by
African authorities, comparisons of the two can be used to estimate the direction and magnitude
of net misinvoicing. In the case of exports, we expect such comparisons to show systematic under-
invoicing, since apart from special circumstances (such as export incentive programs) there is little
incentive for over-invoicing. In the case of imports, the net impact of misinvoicing could go either
way: if smuggling exceeds under-invoicing for capital flight, the value of imports reported by the
trading partner exceeds the value of exports reported by the African country (after adding the
normal cost of insurance and freight), whereas if under-invoicing dominates, the discrepancy has
the opposite sign. The methodology for computing net trade misinvoicing is described below.
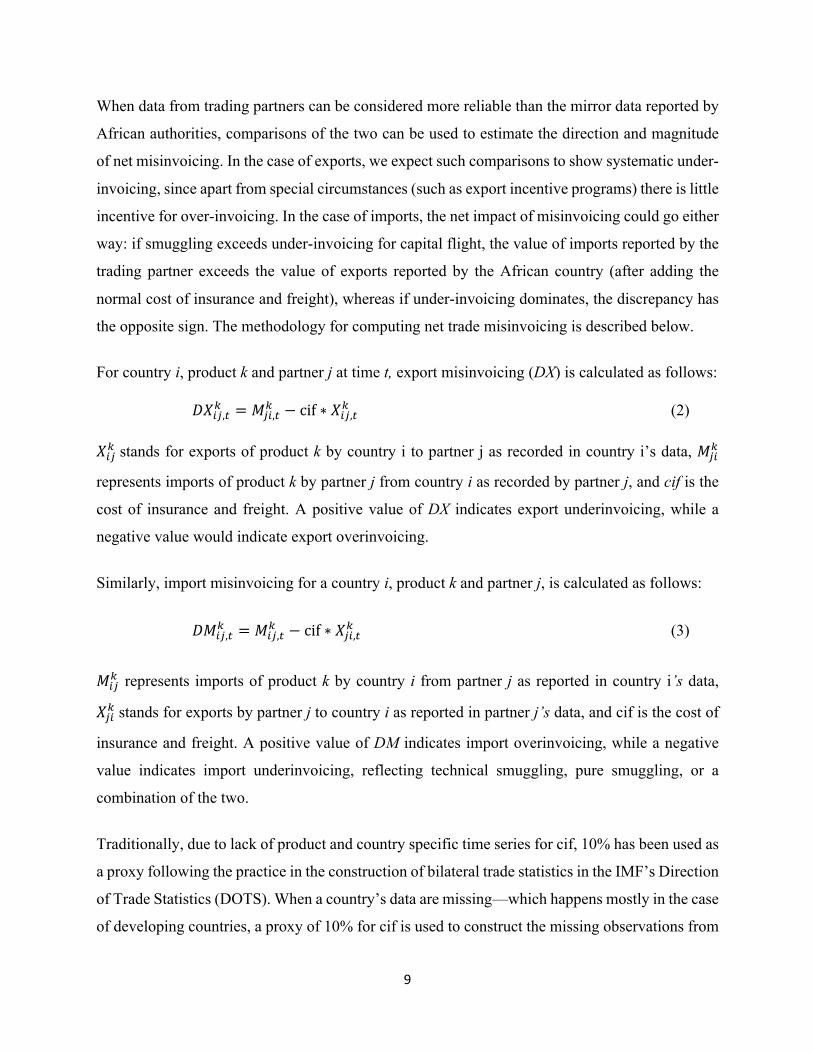
For country i, product k and partner j at time t, export misinvoicing (DX) is calculated as follows:
%4!",$% = 5"!,$% − cif ∗ 4!",$% (2)
4!"% stands for exports of product k by country i to partner j as recorded in country i’s data, 5"!%
represents imports of product k by partner j from country i as recorded by partner j, and cif is the
cost of insurance and freight. A positive value of DX indicates export underinvoicing, while a
negative value would indicate export overinvoicing.
Similarly, import misinvoicing for a country i, product k and partner j, is calculated as follows:
%5!",$% = 5!",$
% − cif ∗ 4"!,$% (3)
5!"% represents imports of product k by country i from partner j as reported in country i’s data,
4"!% stands for exports by partner j to country i as reported in partner j’s data, and cif is the cost of
insurance and freight. A positive value of DM indicates import overinvoicing, while a negative
value indicates import underinvoicing, reflecting technical smuggling, pure smuggling, or a
combination of the two.
Traditionally, due to lack of product and country specific time series for cif, 10% has been used as
a proxy following the practice in the construction of bilateral trade statistics in the IMF’s Direction
of Trade Statistics (DOTS). When a country’s data are missing—which happens mostly in the case
of developing countries, a proxy of 10% for cif is used to construct the missing observations from

10
partners’ data—typically advanced economies. However, in 2018, the IMF changed the cif proxy
from 10% to 6%. The 6% applies to series from 2000 onward, while 10% is used for earlier series
(IMF 2018). The results in this paper are obtained using this new conversion.
By replacing imports and exports of product k with total imports and total exports, equations (2)
and (3) yield total export and import misinvoicing for country i with respect to partner j. Net trade
misinvoicing with respect to partner j is obtained as the sum of export misinvoicing and import
misinvoicing:
5,2,;<!",$ = %4!",$ + %5!",$ (4)
A positive net trade misinvoicing represents unrecorded outflow of foreign exchange, leading to
an increase in capital flight beyond the BoP residual measured in equation (1). A negative net
value represents an unrecorded use of foreign exchange, thus a reduction of estimated capital flight.
There are three possible ways to compute total export misinvoicing and import misinvoicing. The
first consists of replacing partner country j with the rest of the world in the above equations. The
second consists of summing up over individual partners. In principle these two should yield similar
results, with the second approach having the advantage of providing insights on dynamics of
misinvoicing at bilateral level while the former is less laborious. The third approach is to estimate
aggregate misinvoicing by summing up over a subset of partners, such as the industrialized
countries (termed ‘advanced countries’ in the DoTS database), whose trade statistics are
considered relatively accurate, and then scaling up this total by the inverse of this group’s share in
the country’s recorded exports and imports. This approach has been extensively used in the
literature. It is based on the assumption that developed countries’ data are of relatively higher
quality than those of developing countries. Therefore, it is expected that this approach will help
minimize biases in trade misinvoicing estimates arising from poor quality data.
We introduce a refinement necessitated by the fact that the destination of exports and the source
of imports is not comprehensively reported. Some exports and imports are recorded under
‘unspecified areas.’ When some exports by an African country to ICs are recorded under
‘unspecified areas’ while members of the ICs group properly record the goods as imports from the
African country, this results in an upward bias in the export underinvoicing estimate. When some

11
imports by an African country from ICs are recorded as coming from ‘unspecified areas’, this
causes a downward bias in the import overinvoicing estimate.
To minimize these biases, we assume that the fraction of exports and imports recorded under
‘unspecified areas’ which were in reality exported to or imported from ICs is proportional to the
share of ICs in the African country’s total imports and exports. This fraction of exports and imports
is added to the country’s exports to ICs and imports from ICs. In a given year t, for an African
country i, export misinvoicing (DXIC) and import misinvoicing (DMIC) with respect to ICs are
computed as follows:
Export misinvoicing:
%4,$!$ = 5&',!$ − =>? ∗ (4!,&',$ + 4!,&',$( ) (5)
Import misinvoicing:
%5,$!$ = (5!,&',$ +5!,&',$( ) − =>? ∗ 4&',!$ (6)
The terms 4!,&',$( and 5!,&',$( represent the amounts of exports and imports recorded under
‘unspecified areas’ that are allocated to ICs based on the latter’s shares in the African country’s
total exports and imports.
When some imports and exports are classified under ‘unspecified territories’, the ‘total world’
values of imports or exports in DoTS will not correspond to the sum of the values under the three
categories of advanced economies, developing economies, and transition economies.11 If the
values recorded under these unclassified destinations and origins are large, this can affect the
estimates of export and import misinvoicing.
11 UNCTAD has noted this aggregation issue: Why does the "Total word" not correspond to the sum of "Developing economies", "Transition economies" and "Developed economies"? World total represents the sum of the figures of the three above-mentioned groups plus the figures of a group of territories and partners not elsewhere classified, whose composition is detailed in classifications. Data of these territories are included in the world total if they have been reported but are not presented individually or in any group, either by geography, economy or trade. Source: http://unctadstat.unctad.org/EN/FAQ.html.

12
To minimize the bias in the estimate of trade misinvoicing, the scaling up factor is calculated as
the share of advanced countries in the sum of imports or exports from/to classified countries (that
is, advanced, developing and transition countries), rather than the share in the country’s total
imports or exports from/to the world (which includes unclassified partners). The export share of
advanced countries is calculated as:
,$42 = )&')&'*)+, rather than ,$42 = )&'
)-.-
Their import share is computed as:
,$52 = /&'/&'*/+, rather than ,$52 = /&'
/-.-
XTOT and MTOT are exports to and imports from the rest of the world as reported by the
concerned country. XED and MED stand for exports to and imports from emerging and developing
countries, respectively.
Following these adjustments, total trade misinvoicing vis-à-vis all partners, or aggregate trade
misinvoicing is obtained as follows:
5,2,;<!$ = ,)&'!"&')0!"
+ ,/&'!"&'/0!"
(7)
The estimate of capital flight adjusted for trade misinvoicing (ADJKF) is obtained by adding net
trade misinvoicing to the BoP residual computed using equation (1), as follows.
ADJ!" = $%&'()%* + "%, + -, + ., − ($)% + $1&2) + 5,2,;< (8)
Motivations for trade misinvoicing
Trade misinvoicing can occur for a number of reasons. The literature has discussed three main
categories of motivations: 1) financial motives; 2) circumventing foreign exchange controls; 3)
reducing administrative burdens (Andreas Buehn and Stefan Eichler, 2011, Andreas Buehn and

13
Mohammad Reza Farzanegan, 2012, Ila Patnaik et al., 2012, Cláudia Costa Storti and Paul de
Grauwe, 2012).12
Financial motives: Exporters and importers may engage in trade misinvoicing to maximize profits
by minimizing tax liabilities and taking advantage of tax incentives associated with imports and
exports. Import underinvoicing enables importers to reduce tariffs, and pure smuggling allows
them to avoid them altogether. Import misinvoicing may occur through under-reporting of the
value of imports as well as through the misreporting of products types by declaring low-tariff
products in lieu of the actual products that may face higher import tariff rates or quotas. J. Bhagwati
(1964) noted that import underinvoicing appeared to be prevalent in the case of products facing
high tariffs, and subsequent studies have lent support to this proposition (Andreas Buehn and
Stefan Eichler, 2011, Manamba Epaphra, 2015, Raymond Fisman and Shang-Jin Wei, 2004).
Similarly, export underinvoicing may result from attempts to avoid export taxes levied on specific
products (Donogh C. McDonald (1985). In the presence of tax incentives aimed at promoting
exports, exporters may instead resort to overinvoicing, inflating the value of their exports to reap
more incentives. If the exporter must surrender the inflated amount of foreign exchange to the
central bank, however, export overinvoicing will occur only if the firm expects the gains from
extra subsidies to exceed the costs of the premium on foreign exchange on the black market (J.
Bhagwati, 1967).
Circumventing exchange controls: Another motive for trade misinvoicing is to avoid currency
controls to gain access to foreign exchange or move money abroad. In the presence of strict
exchange controls, trade misinvoicing provides a means to acquire foreign exchange out of the
control of the authorities that can be held abroad or traded for a profit on the black market. Such
an environment is expected to encourage overinvoicing of imports and underinvoicing of exports.
Empirical studies have found a positive correlation between the black market premium and the
12 See Kellenberg, Derek and Arik Levinson. 2016. "Misreporting Trade: Tariff Evasion, Corruption, and Auditing Standards," National Bureau of Economic Research, Working Paper 22593, and UNCTAD. 2016. "Trade Misinvoicing in Primary Commodities in Developing Countries: The Cases of Chile, Côte D’ivoire, Nigeria, South Africa and Zambia," Geneva: UNCTAD, December, for further discussions of the motives for trade misinvoicing, with a focus in the latter on primary commodities exports from resource-rich developing countries.

14
extent of import overinvoicing (see, for example, Mohsen Bahmani-Oskooee and Gour G.
Goswami (2003); Richard Clay Barnett (2003); and A. K. Biswas and S. Marjit (2005).
Reducing administrative burdens: Perceived or actual onerous administrative procedures can
incite firms to underreport the true value of trade. Bureaucratic and regulatory inefficiencies can
create costs to importers and exporters and delay the authorization of relevant transactions. Firms
may seek to circumvent these hurdles to speed up inward and outward shipment of merchandise.
Such hurdles are most likely to be prevalent in countries with high corruption in the customs
service as well as those with low human and technological capacity to process imports and exports.
Such an environment is expected to induce smuggling, a prediction that has been supported by
empirical evidence (Raymond Fisman and Shang-Jin Wei (2007); Helge Berger and Volker Nitsch
(2012).
Methodological and data issues in the estimation of trade misinvoicing
In addition to the problems of the c.i.f. factor and ‘unspecified’ destinations of exports and origins
of imports described above, the estimation of trade misinvoicing faces other issues related to
methodology as well as data. The first and most general problem is inadequate reporting and low
quality of the data. Some countries do not report national trade data to the IMF, in which case the
IMF imputes the numbers from partner data. In such cases, comparisons of mirror trade data cannot
detect trade misinvoicing. This is the case for Angola; therefore, the Angolan capital flight
estimates presented in this paper do not include adjustment for trade misinvoicing. In the case of
South Africa, the series in the electronic DoTS database start only in 1998. Therefore, the estimate
of capital flight for 1970-97 does not include adjustment for trade misinvoicing.
An additional data issue relates to classification of products. Accurate estimation of trade
misinvoicing requires consistency in product classification across trading partners. The
misclassification of products may occur by error or as a result of deliberate actions by importers
and exporters seeking to minimize customs levies (e.g., labeling consignments of taxable goods
with names of exonerated products) or to take advantage of investment and export incentives
(labeling consignments of taxable goods with names of capital goods or inputs that qualify for tax
credits, reduced tax rates, or tax exonerations). Such classification inconsistencies will generate

15
biases in estimates of trade misinvoicing at the product level, although their effects on aggregate
estimates of trade misinvoicing are not likely to be significant.
A note specific to Comtrade data, which are used for product-level misinvoicing estimates, is that
for some countries, imports are reported in f.o.b. rather than c.i.f. The countries that use this
reporting system are Australia, Brazil, Canada, Dominican Republic, Palau, South Africa and the
United States. In these cases, export and import misinvoicing is obtained simply by subtracting
partner exports from the concerned country’s imports without the c.i.f. adjustment.
The special case of ‘trading hubs’, transit trade and re-exports
An important feature of globalization is the increasing role of trading hubs in international trade,
especially in the case of primary commodities – oil, minerals and agricultural commodities.
Trading hubs facilitate transit trade, transshipment, and re-exports (see definitions in Appendix
A.2). These phenomena may cause biases in the estimates of trade misinvoicing obtained through
comparison of mirror trade data. Given that most of the trading hubs are in advanced economies,
when trade misinvoicing is estimated using the group of advanced as the benchmark, the impact
on the estimates will depend on whether the goods routed through trading hubs (e.g., Switzerland
and the Netherlands) end up in another advanced country or in a country outside of this group. If
the goods end up in another advanced country, which reports them properly as imports from the
source country, the estimates of export misinvoicing will not be affected. In fact, in this scenario,
if the trading hubs were removed from the group of advanced countries, this would result in higher
estimated trade misinvoicing, thus an overestimated adjusted capital flight. If the goods eventually
end up in a country outside of the advanced countries group, the estimates of trade misinvoicing
based on advanced countries as a benchmark (including the trading hubs) are also biased
downward, tending to show export overinvoicing. In a nutshell, the methodology consisting of
using advanced countries as a benchmark is in fact conservative in the sense that it tends to
underestimate the amount of trade misinvoicing.

16
III. Results for the Case of South Africa
III.1. Capital flight from South Africa
This section presents the estimates of capital flight obtained using the formula displayed in
equation 5 over the period 1970-2018. This is followed by more detailed discussion of the
estimates of trade misinvoicing at the aggregate level, by partner and for major export products.
All estimates are presented in constant 2018 dollars unless otherwise indicated.
The estimates of capital flight from South Africa are summarized in Table 2 and Figure 1 in terms
of totals by decade. Along with net capital flight measured as an adjusted BoP residual, the table
also presents the various elements that enter into the computation of the residual. This enables us
to examine potential drivers of the trend and fluctuations in the discrepancies between the sources
and uses of foreign exchange resources in the country. It is important to note that the capital flight
estimate presented here does not include an adjustment for trade misinvoicing over the 1970-1997
due to lack of South African data in the electronic DoTS database. Given the observed pattern of
trade misinvoicing after 1997, it is most likely that capital flight presented for the 1970-2017 is
substantially underestimated. The discontinuity in the adjusted capital flight around 1997-98 due
to the missing trade data calls for caution in the use of the results for time series analysis.
Table 2: Capital flight from South Africa (billion, constant 2018 dollars) 1970-79 1980-89 1990-99 2000-09 2010-18 1970-2018 CDEBTADJ 3.9 22.5 10.6 68.2 110.5 215.7 FDI 2.5 -4.7 -6.9 44.2 0.4 35.6 PI 0.0 -3.6 45.2 33.6 109.4 184.6 OI 1.0 -10.5 -10.7 23.8 41.3 44.9 CA -24.5 11.0 -1.0 -81.4 -127.8 -223.7 CRES 6.1 -6.2 -9.3 -34.1 -17.6 -61.1 BoP Residual -11.1 8.6 27.8 54.4 116.2 196.0 Trade misinvoicing 0.0 0.0 4.9 97.7 30.9 133.5 Adjusted capital flight -11.1 8.6 32.7 152.1 147.2 329.5 Memorandum: total private capital flows FDI+PI+OI 3.5 -18.7 27.5 101.7 151.1 265.1
Source: Authors’ computations

17
Figure 1: Capital flight from South Africa, totals by decade (constant 2018 $, billion)
Source: Authors’ computations
Note: No adjustment for trade misinvoicing over 1970-1997 due to lack of data.
Over the 1970-2018 period, South Africa experienced an estimated $328 billion of capital flight.
This includes net trade misinvoicing of $133.5 billion over 1998-2018. There are two key features
of the trend of capital flight over the past two decades. First is a rapid accumulation of external
debt, starting at the end of the Apartheid regime. While external borrowing was minimal prior to
1994, it surged thereafter as the end of the international embargo ushered the resumption of
international economic and political cooperation. External borrowing (measured as the change in
debt stock) increased from $22.5 billion in 1980s to $68.2 billion in 2000-09 and $110.5 billion
over 2000-2018.
Second, South Africa experienced a substantial increase in private capital flows, especially in the
form of portfolio investment. This reflects the country’s developed and active equity markets that
attract foreign investors seeking returns to capital. The sum of private flows (FDI, portfolio
investment and other investments) rose from $27.5 billion in the 1990s to $101.7 billion over 2000-
2009, and $151.1 billion over 2010-2018.
-20
0
20
40
60
80
100
120
140
160
180
1970-79 1980-89 1990-99 2000-09 2010-18
BoP Residual Trade misinvoicing Adjusted capital flight

18
The expansion of recorded resource inflows outpaced recorded uses of resources. The unadjusted
BoP residual increased from a decadal total of $27.8 billion in 1990-99 to $116.2 billion over the
2010-2018 period.
III.2. Trade misinvoicing at the aggregate level
Trade misinvoicing appears to be an important channel of capital flight from South Africa.13 Over
the period 1998-2018, trade misinvoicing contributed $133.5 billion to the country’s estimated
capital flight (Table 3). This value is obtained by scaling up misinvoicing relative to industrialized
countries as described earlier in section II. The most notable phenomenon is export underinvoicing,
amounting to a total of $185.2 billion over the 1998-2018 period. This illustrates large gaps
between South Africa’s reported exports and the value of imports by the partners as reported by
the latter. Figure 2 illustrates these patterns.
The results also show net underinvoicing of imports to the tune of $51.7 billion over the 1998-
2018 period. This indicates that technical smuggling, pure smuggling or a combination of the two
exceeded import overinvoicing. The phenomenon is especially pronounced over 2010-2018 with
an estimated $55.4 billion of import underinvoicing, or imports which were not accounted for in
the country’s trade statistics as reported in the DoTS. Over the same period, export underinvoicing
amounted to $86.3 billion.
13 Electronic DOTS data for South Africa start in 1998; therefore, no estimates of trade misinvoicing are computed over 1970-1997.

19
Figure 2: South Africa: export and import misinvoicing 1998-2018 (million, constant 2018 $)
Source: Authors’ computations
One issue with South African trade data is the incomplete reporting of the destination of exports
and origin of imports. The DoTS tables show substantial amounts of exports to undisclosed
destinations. The problem is less pronounced for imports. We used data from printed DOTS reports
over 1970-97 to investigate this phenomenon. The reports show that over the 1970-2018 period,
exports to unspecified destinations amounted to $533.6 billion (or 20.9% of total exports). By
comparison, the cumulative amount of imports from unspecified origins amounted to $104.2
billion (or 4% of total imports) over the same period. Figure B.1 shows the level and trend of the
share of imports and exports that are registered under unspecified destinations and origins. This
phenomenon ended in 1995 for imports, but it has persisted for exports up to today, albeit at a
lower rate since the mid-2000s. This phenomenon is worth exploring further by examining data at
partner and product levels.
-15000
-10000
-5000
0
5000
10000
15000
20000
25000
30000
1998
1999
2000
2001
2002
2003
2004
2005
2006
2007
2008
2009
2010
2011
2012
2013
2014
2015
2016
2017
2018
Export misinvoicing Import misinvoicing
20
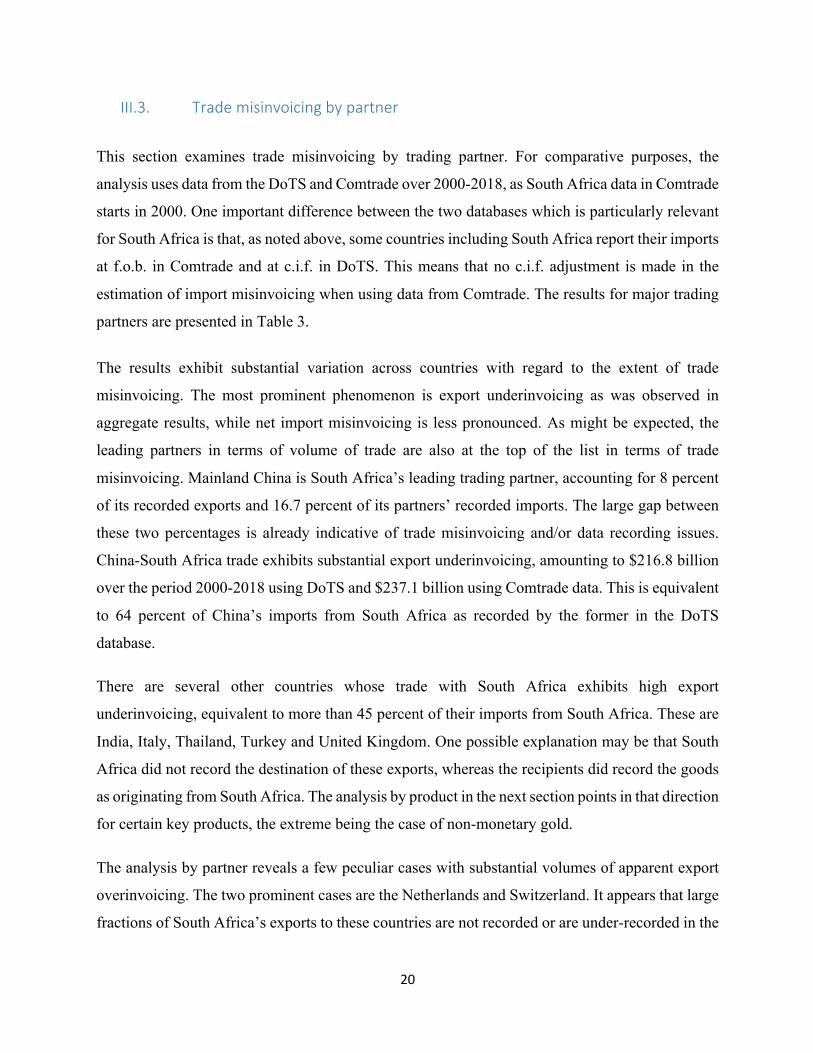
III.3. Trade misinvoicing by partner
This section examines trade misinvoicing by trading partner. For comparative purposes, the
analysis uses data from the DoTS and Comtrade over 2000-2018, as South Africa data in Comtrade
starts in 2000. One important difference between the two databases which is particularly relevant
for South Africa is that, as noted above, some countries including South Africa report their imports
at f.o.b. in Comtrade and at c.i.f. in DoTS. This means that no c.i.f. adjustment is made in the
estimation of import misinvoicing when using data from Comtrade. The results for major trading
partners are presented in Table 3.
The results exhibit substantial variation across countries with regard to the extent of trade
misinvoicing. The most prominent phenomenon is export underinvoicing as was observed in
aggregate results, while net import misinvoicing is less pronounced. As might be expected, the
leading partners in terms of volume of trade are also at the top of the list in terms of trade
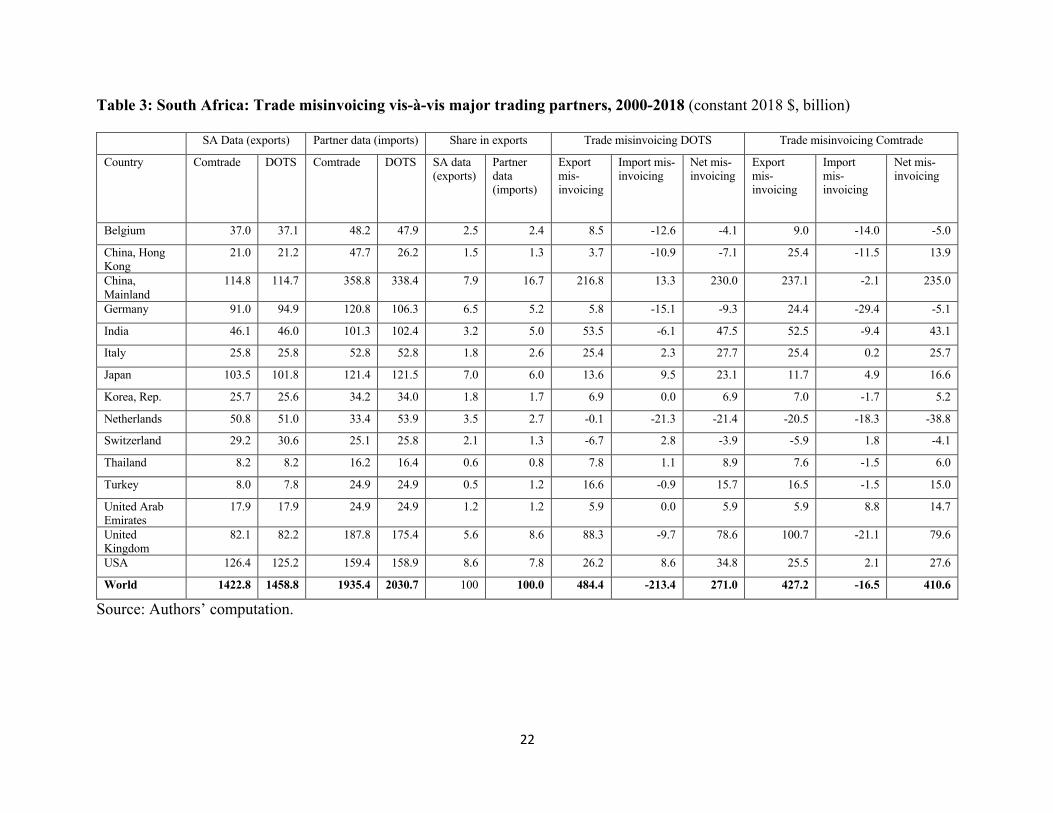
misinvoicing. Mainland China is South Africa’s leading trading partner, accounting for 8 percent
of its recorded exports and 16.7 percent of its partners’ recorded imports. The large gap between
these two percentages is already indicative of trade misinvoicing and/or data recording issues.
China-South Africa trade exhibits substantial export underinvoicing, amounting to $216.8 billion
over the period 2000-2018 using DoTS and $237.1 billion using Comtrade data. This is equivalent
to 64 percent of China’s imports from South Africa as recorded by the former in the DoTS
database.
There are several other countries whose trade with South Africa exhibits high export
underinvoicing, equivalent to more than 45 percent of their imports from South Africa. These are
India, Italy, Thailand, Turkey and United Kingdom. One possible explanation may be that South
Africa did not record the destination of these exports, whereas the recipients did record the goods
as originating from South Africa. The analysis by product in the next section points in that direction
for certain key products, the extreme being the case of non-monetary gold.
The analysis by partner reveals a few peculiar cases with substantial volumes of apparent export
overinvoicing. The two prominent cases are the Netherlands and Switzerland. It appears that large
fractions of South Africa’s exports to these countries are not recorded or are under-recorded in the

21
these partners’ trade statistics. This may be related to the fact that these two countries are major
trading hubs, hosting multinational corporations involved in global trading of primary
commodities. Goods registered in South Africa as exported to Dutch or Swiss companies may not
dock in the Netherlands or Switzerland, but rather end up in other countries where the firms have
affiliated corporations or independent clients. The goods may also be traded during shipment to
the Netherlands or Switzerland, in which case they would be recorded as imports in the final
buyer’s country. Such transactions create discrepancies in mirror trade data that yield apparent
export overinvoicing vis-à-vis the Netherlands and Switzerland.
22
Table 3: South Africa: Trade misinvoicing vis-à-vis major trading partners, 2000-2018 (constant 2018 $, billion)
SA Data (exports) Partner data (imports) Share in exports Trade misinvoicing DOTS Trade misinvoicing Comtrade
Country Comtrade DOTS Comtrade DOTS SA data (exports)
Partner data (imports)
Export mis-invoicing
Import mis-invoicing
Net mis-invoicing
Export mis-invoicing
Import mis-invoicing
Net mis-invoicing
Belgium 37.0 37.1 48.2 47.9 2.5 2.4 8.5 -12.6 -4.1 9.0 -14.0 -5.0
China, Hong Kong
21.0 21.2 47.7 26.2 1.5 1.3 3.7 -10.9 -7.1 25.4 -11.5 13.9
China, Mainland
114.8 114.7 358.8 338.4 7.9 16.7 216.8 13.3 230.0 237.1 -2.1 235.0
Germany 91.0 94.9 120.8 106.3 6.5 5.2 5.8 -15.1 -9.3 24.4 -29.4 -5.1
India 46.1 46.0 101.3 102.4 3.2 5.0 53.5 -6.1 47.5 52.5 -9.4 43.1
Italy 25.8 25.8 52.8 52.8 1.8 2.6 25.4 2.3 27.7 25.4 0.2 25.7
Japan 103.5 101.8 121.4 121.5 7.0 6.0 13.6 9.5 23.1 11.7 4.9 16.6
Korea, Rep. 25.7 25.6 34.2 34.0 1.8 1.7 6.9 0.0 6.9 7.0 -1.7 5.2
Netherlands 50.8 51.0 33.4 53.9 3.5 2.7 -0.1 -21.3 -21.4 -20.5 -18.3 -38.8
Switzerland 29.2 30.6 25.1 25.8 2.1 1.3 -6.7 2.8 -3.9 -5.9 1.8 -4.1
Thailand 8.2 8.2 16.2 16.4 0.6 0.8 7.8 1.1 8.9 7.6 -1.5 6.0
Turkey 8.0 7.8 24.9 24.9 0.5 1.2 16.6 -0.9 15.7 16.5 -1.5 15.0
United Arab Emirates
17.9 17.9 24.9 24.9 1.2 1.2 5.9 0.0 5.9 5.9 8.8 14.7
United Kingdom
82.1 82.2 187.8 175.4 5.6 8.6 88.3 -9.7 78.6 100.7 -21.1 79.6
USA 126.4 125.2 159.4 158.9 8.6 7.8 26.2 8.6 34.8 25.5 2.1 27.6
World 1422.8 1458.8 1935.4 2030.7 100 100.0 484.4 -213.4 271.0 427.2 -16.5 410.6
Source: Authors’ computation.

23
III.4. Trade misinvoicing by product
To shed further light on the mechanisms and extent of trade misinvoicing, the analysis is
undertaken at the product level. For a middle-income country with a diversified economy like
South Africa, it would be rather onerous to analyze every single product. The analysis therefore
focuses on major export products, based on their shares in total exports using data from Comtrade
for the period 2000-2018. The top export products in South Africa are primary commodities: the
silver and platinum group, iron ore, and non-monetary gold. The respective shares of the country’s
top 15 export products are presented in Figure 3. The silver-platinum group leads with 9 percent
of total exports.14
Figure 3: South Africa's top 15 export product groups: Share in total exports (%, average
2010-2017)
Source: UNCTAD Statistical Database (online). Figures in brackets are SITC codes.
14 The shares are calculated using average annual exports over the 2000-2014 period.
1.0
1.2
1.9
2.3
2.4
2.9
2.9
3.2
4.4
4.7
5.1
6.0
6.2
7.1
9.0
0.0 1.0 2.0 3.0 4.0 5.0 6.0 7.0 8.0 9.0 10.0
[784] Parts & accessories of vehicles of 722,…
[112] Alcoholic beverages
[684] Aluminium
[667] Pearls, precious & semi-precious stones
[743] Pumps (excluding liquid), gas…
[057] Fruits and nuts (excluding oil nuts), fresh…
[782] Motor vehic. for transport of goods,…
[334] Petroleum oils or bituminous minerals >…
[287] Ores and concentrates of base metals,…
[671] Pig iron & spiegeleisen, sponge iron,…
[781] Motor vehicles for the transport of…
[971] Gold, non-monetary (excluding gold ores…
[321] Coal, whether or not pulverized, not…
[281] Iron ore and concentrates
[681] Silver, platinum, other metals of the…

24
Estimates of trade misinvoicing for these leading products are presented in Table 4 (panels 4A-
4D). Note that, for any given year, export misinvoicing is calculated only when both South Africa
and its partner report their respective data. The misinvoicing estimate is set to zero when data for
either partner is missing.
Silver export misinvoicing
The results for silver exports are presented in panel A of Table 4. The results from the analysis
show a predominance of export underinvoicing. For trade with India, the leading trading partner,
the results show $82 billion of export underinvoicing out of a total of $235.6 billion of India’s
silver imports from South Africa.15 There is negligible export misinvoicing in silver trade with the
United Kingdom: about $14.9 billion of estimated export misinvoicing out of a total of $138.7
billion of imports over the 2000-2018 period. Considering the top five partners, export
underinvoicing amounts to $52.1 billion over the 2000-2018 period.
Surprisingly, Comtrade contains no data on exports of silver to China, even though the latter is the
second leading partner (behind India) with 26.4% of total world silver imports. Consequently, the
extent of misinvoicing of silver exports to China cannot be estimated.
Peculiar reporting is also noted in the case of trade with Switzerland. Swiss data shows very little
silver imports from South Africa. Over the 2000-2018 period, South Africa reported $108.6 billion
of silver exports to Switzerland, but the latter reported importing only $12.2 billion. Considering
only the years in which both countries report data, there is an estimated $38.8 billion in export
overinvoicing.
Export overinvoicing of primary commodities may reflect situations where exports nominally
recorded as heading to Switzerland (or another partner) are rerouted to other destinations. If, for
example, the commodities end up in another country such as China, and China records the imports
as coming from South Africa, whereas Switzerland records some of the goods as transit trade
15 In any given year, the estimate of export misinvoicing is set to zero if the data for either trading partner is missing.

25
destined to China or does not record them at all, this will result in a mismatch between South
African data and those of China and Switzerland.
These results provide some insight into why there is a substantial amount of exports recorded under
unclassified “other areas” in South Africa’s aggregate trade statistics. This practice is especially
predominant in the case of non-monetary gold, as discussed further below.
Platinum export misinvoicing
Estimates for export misinvoicing of platinum are reported in Table 4, panel 4.B. Platinum exports
are also heavily concentrated by partner, with the two leading partners, Japan and the United States,
accounting for over 51.6 percent of total exports. There is evidence of export underinvoicing,
especially in platinum trade with mainland China. While South Africa reported $2.6 billion of
platinum exports to China, the latter recorded $24.3 billion. Trade with the major partners as a
group shows overall export underinvoicing of $21.1 billion, which represents 12 percent of their
total platinum imports, when we only count years where both South Africa and its partner report
data in Comtrade.
Similar to silver, the results show export overinvoicing vis-à-vis Switzerland. The apparent export
overinvoicing vis-à-vis Hong Kong could reflect re-exports of platinum initially exported to Hong
Kong that end up in China. The export overinvoicing relative to the United Kingdom is peculiar;
the mechanisms behind it require further investigation.
Iron ore export misinvoicing
Table 4, panel 4.C reports the estimates of export misinvoicing for iron ore. China is the leading
partner, buying 62 percent of South Africa’s iron ore exports of this product. The analysis shows
relatively low levels of export misinvoicing. Total export misinvoicing over the 2000-2018 period
amounted to $7.5 billion for the four leading trading partners (China, Germany, Japan and Korea),
out of $59.6 billion of exports to the group (and a reported $73.3 billion of imports by the group).
The case of non-monetary gold
Gold exports are officially classified into two categories: monetary gold and non-monetary gold.
The results presented in Table 4.D are for non-monetary gold exports only. The evidence reveals

26
three key features: (i) export underinvoicing, (ii) inadequate reporting of destinations of gold
exports, and (iii) inconsistencies in classification of gold exports. Like other products, non-
monetary gold exports are characterized by substantial underinvoicing vis-à-vis individual
partners. The phenomenon is most pronounced in the case of exports to Hong Kong and the United
Kingdom. While Hong Kong records about $30.7 billion of total imports of non-monetary gold
from South Africa, South Africa’s data show $2.7 billion worth of exports to Hong Kong.
Similarly, only $30 million of non-monetary gold exports to the United Kingdom appear in South
Africa’s data compared to about $32.5 billion of imports in the UK’s data. The cumulative amount
of export misinvoicing vis-à-vis major partners over 2000-2018 is $89 billion. Most of the non-
monetary gold exports recorded in South Africa’s data are reported under non-specified areas:
$55.6 billion against a total of $60 billion to all the destinations in the table.
In addition to the lack of information on the individual destinations of non-monetary gold exports,
the data also shows inconsistencies in the distinction between monetary gold and non-monetary
gold. While government statistics traditionally distinguished between the two series as do its
trading partners, they have been merged since 2010.16 The country’s statistics also exhibit
inconsistency between the values of non-monetary gold recorded in Comtrade and those recorded
in the Balance of Payments.17 Unfortunately, the BoP cannot be used for estimation of export
misinvoicing at the partner level, because it does not contain data on the destination of non-
monetary gold exports from South Africa. The South African Reserve Bank issued a note where it
reported that prior to 2011 “non-monetary gold was incorrectly classified as monetary gold by the
entity responsible for provision of trade statistics to the United Nations.” The analysis of Comtrade
data shows, however, that substantial discrepancies between South Africa’s data and its partners
have persisted even in the post-2011 period.
16 The data by the Department of Trade and Industry are available online at: http://tradestats.thedti.gov.za/ReportFolders/reportFolders.aspx 17 Non-monetary gold is reported in the Current Account under "Goods", whereas monetary gold is reported under “Reserves”.

27
Table 4: Export misinvoicing of major primary commodities in South Africa, 2000-2018 Panel 4.A: Silver (constant 2018 $, million)
Excluding years where one partner’s data is not reported
Considering all years
Partner Export misinvoicing
South Africa’s exports
Partner’s imports
South Africa’s exports
Partner’s imports
China
0.0 204.8 Germany -4.3 8.5 4.4 8.5 4.4 India 82.0 126.4 214.7 126.4 235.6 Switzerland -38.8 48.6 11.6 108.6 12.2 Turkey -1.6 47.1 47.6 47.1 47.6 United Kingdom
14.9 122.2 138.7 122.2 138.7
Major partners 52.1 352.7 417.0 412.8 643.3 Rest of the world 227.0 122.8 358.1 62.7 131.8
World 279.1 475.5 775.1 475.5 775.1 Source: Authors’ computations Panel 4.B: Platinum (constant 2018 $, billion)
Excluding years where one partner’s data is not reported Considering all years
Partner Export misinvoicing
South Africa’s exports
Partner’s imports
South Africa’s exports
Partner’s imports
China, Mainland 21.5 2.6 24.2 2.6 24.3 China, Hong Kong -2.0 6.6 4.6 6.6 4.6 Germany 2.2 11.6 14.0 11.6 15.3 Japan 4.2 45.1 50.7 45.1 54.0 Switzerland -6.7 17.9 11.6 17.9 12.3 United Kingdom -5.6 19.6 14.2 19.6 14.8 USA* 7.4 31.1 38.5 31.1 42.3 Major partners 21.1 134.5 157.9 134.5 167.6 Rest of the world 12.8 3.9 18.2 3.9 18.9 World 33.9 138.4 176.1** 138.4 186.5
Source: Authors’ computations *Note: USA imports are f.o.b.

28
Panel 4.C: Iron ore (constant 2018 $, billion)
Excluding years where one partner’s data is not reported Considering all years
Partner Export misinvoicing
South Africa’s exports
Partner’s imports
South Africa’s exports
Partner’s imports
China 4.3 44.7 53.7 44.7 53.7 Germany 1.0 3.2 4.4 3.2 4.4 Japan 1.1 8.4 10.5 8.4 10.5 Korea, Rep. 1.1 3.2 4.7 3.2 4.7 Major partners 7.5 59.6 73.3 59.6 73.3
Rest of the world -7.3 13.1 7.2 13.1 7.2
World 0.2 72.7 80.6 72.7 80.6 Source: Authors’ computations Panel 4.D: Non-monetary gold (constant 2018 $, billion)
Excluding years where one partner’s data is not reported
Considering all years
Partner Export misinvoicing
South Africa’s exports
Partner’s imports
South Africa’s exports
Partner’s imports
China 0.0 0.0 0.0 0.0 38.4 China, Hong Kong 27.6 2.7 30.3 2.7 30.7 India 8.2 0.2 8.4 0.2 49.0 Italy 9.0 0.0 9.1 0.0 18.1 Switzerland 6.8 0.4 7.2 0.4 8.1 Thailand 0.0 0.0 0.0 0.0 5.9 Turkey 2.7 0.0 2.8 0.0 12.0 United Arab Emirates 2.4 0.1 2.5 0.1 5.8 United Kingdom 32.2 0.3 32.5 0.3 32.5 Total major partners 89.0 3.7 92.8 3.7 200.6 Rest of the World 61.2 56.4 119.6 56.4 11.7 World (all partners) 150.2 60.1 212.3 60.1 212.3
Source: Authors’ computations Note: In any given year, the value of export misinvoicing is set to zero when data for either partner are missing.
29
IV. Results for the Case of Côte d’Ivoire
This section presents the results for the case of Côte d’Ivoire. Following an analysis of the levels
and trends of capital flight from 1970 to 2018, it discusses the evidence on trade misinvoicing at
the aggregate, partner and product levels.
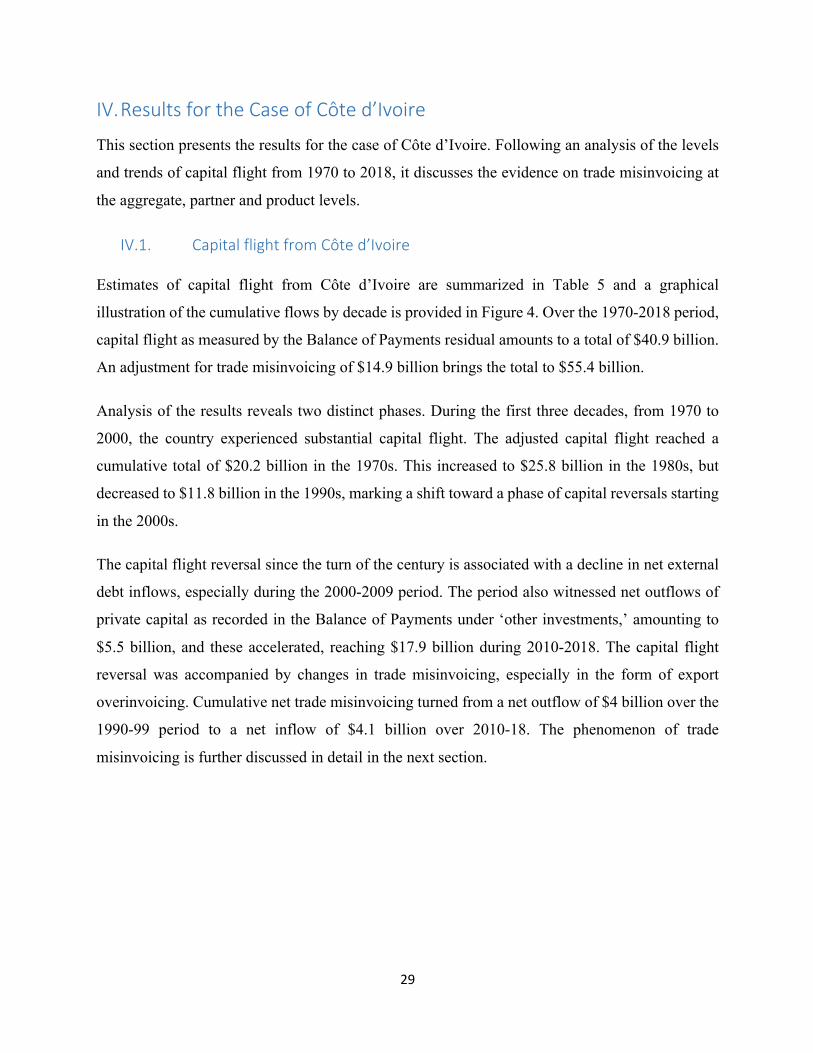
IV.1. Capital flight from Côte d’Ivoire Estimates of capital flight from Côte d’Ivoire are summarized in Table 5 and a graphical
illustration of the cumulative flows by decade is provided in Figure 4. Over the 1970-2018 period,
capital flight as measured by the Balance of Payments residual amounts to a total of $40.9 billion.
An adjustment for trade misinvoicing of $14.9 billion brings the total to $55.4 billion.
Analysis of the results reveals two distinct phases. During the first three decades, from 1970 to
2000, the country experienced substantial capital flight. The adjusted capital flight reached a
cumulative total of $20.2 billion in the 1970s. This increased to $25.8 billion in the 1980s, but
decreased to $11.8 billion in the 1990s, marking a shift toward a phase of capital reversals starting
in the 2000s.
The capital flight reversal since the turn of the century is associated with a decline in net external
debt inflows, especially during the 2000-2009 period. The period also witnessed net outflows of
private capital as recorded in the Balance of Payments under ‘other investments,’ amounting to
$5.5 billion, and these accelerated, reaching $17.9 billion during 2010-2018. The capital flight
reversal was accompanied by changes in trade misinvoicing, especially in the form of export
overinvoicing. Cumulative net trade misinvoicing turned from a net outflow of $4 billion over the
1990-99 period to a net inflow of $4.1 billion over 2010-18. The phenomenon of trade
misinvoicing is further discussed in detail in the next section.

30
Table 5: Capital flight from Côte d'Ivoire, total by decade (constant 2018 $, billion)
1970-79 1980-89 1990-99 2000-09 2010-18 1970-2018
CDEBTADJ 14.0 22.2 7.9 0.5 7.5 52.0
FDI 1.6 1.1 3.5 3.9 3.8 13.8
PI -0.1 0.0 -0.1 0.2 6.6 6.6
OI 8.8 18.7 6.7 -5.5 -17.9 10.7
CA -11.7 -18.9 -8.8 4.2 -0.8 -36.1
CRES 0.1 0.4 -1.3 -2.3 -3.4 -6.5
BoP Residual 12.6 23.3 7.8 0.9 -4.1 40.5 Trade misinvoicing 7.6 2.5 4.0 0.9 0.0 14.9
Adjusted capital flight 20.2 25.8 11.8 1.8 -4.2 55.4 Memorandum: total private capital flows
FDI+PI+OI 10.3 19.7 10.1 -1.5 -7.5 31.1 Source: Authors’ computations
Figure 4: Capital flight from Côte d'Ivoire, total by decade (constant 2018 $, million)
Source: Authors’ computations
-10
-5
0
5
10
15
20
25
30
1970-79 1980-89 1990-99 2000-09 2010-18
BoP Residual Trade misinvoicing Adjusted capital flight

31
IV.2. Trade misinvoicing at the aggregate level This section presents estimates of trade misinvoicing at the aggregate level; i.e., vis-à-vis the rest
of the world obtained using data from the DoTS over the period 1970-2018. Estimates at the
partner level and product level are presented in the next sections.
The trend of export and import misinvoicing is depicted in Figure 5. The results show cumulative
net trade misinvoicing amounting to $14.9 billion over 1970-2018. During this period, the country
experienced export underinvoicing to the tune of $5.9 billion and import underinvoicing of $9
billion. Overall, aggregate trade misinvoicing accounts for 26.9 percent of total capital flight from
Côte d’Ivoire over the four and a half decades.
Figure 5: Trade misinvoicing in Côte d’Ivoire (constant 2018 $, million)
Source: Authors’ computations
IV.3. Trade misinvoicing by partner
Trade misinvoicing at the partner level is investigated to shed further light on the results at the
aggregate level. Table 6, panel 6.A presents the results for top partners among developed countries,
-3000
-2000
-1000
0
1000
2000
3000
4000
1970
1972
1974
1976
1978
1980
1982
1984
1986
1988
1990
1992
1994
1996
1998
2000
2002
2004
2006
2008
2010
2012
2014
2016
2018
Export misinvoicing Import misinvoicing

32
while panel 6.B contains the results for leading partners among developing and transition
countries. There are substantial differences in patterns of misinvoicing between the two groups.
For partners among developed countries, the predominant phenomenon is export underinvoicing,
resulting in net unrecorded outflow of capital from Côte d’Ivoire . The two major exceptions are
the Netherlands and France, where the results show export overinvoicing as well as import
underinvoicing. Trade with Belgium also exhibits import underinvoicing and, to a lesser extent,
some export overinvoicing. Trade with the top ten developed countries as a group exhibits $4.2
billion of cumulative export underinvoicing and $3.1 billion of import underinvoicing, resulting
in net misinvoicing adjustment to capital flight of $1.1 billion over the 2000-2018 period.
In the case of Côte d’Ivoire’s top trading partners among developing and transition countries, the
prevalent phenomena are export overinvoicing and import underinvoicing with cumulative
amounts of $31.5 billion and $1 billion, respectively. The net trade misinvoicing adjustment vis-
à-vis this group implies a net unrecorded inflow of capital and/or goods worth $31.5 billion over
the 2000-2018.
The results raise the question of how to explain the unusual phenomenon of export overinvoicing
vis-à-vis most key trading partners among developing countries and in the special cases of the
Netherlands, France and Belgium that stand out among developed countries. In the case of these
exceptions among developed countries, the results could reflect third-party trade whereby
companies registered in these countries buy Ivorian goods, but on-sell them to another country that
records it as an import from Côte d’Ivoire. This scenario is less likely in the case of developing
and transition countries that do not host major trading hubs.
Another possible explanation for apparent export overinvoicing is import underinvoicing on the
part of Côte d’Ivoire’s partners. This could entail technical smuggling where the declared value of
the imported goods is artificially understated in the partners’ records. Yet another possibility is
simply poor reporting of trade data on either or both sides of the transaction regarding the actual
destinations of exports and the actual origins of imports.

33
Table 6: Trade misinvoicing in Côte d'Ivoire’s trade with major partners 1970-2018 (constant 2018 $, million) Panel 6.A: Developed countries Partner Export
misinvoicing Import misinvoicing
Net misinvoicing
Share in CIV's exports (%)
Share in CIV's imports (%)
Belgium -15.0 -1840.9 -1855.9 0.0 0.5 Canada 2126.6 92.9 2219.6 0.8 0.0 France -1672.0 -2966.2 -4638.1 0.6 0.8 Germany 9247.8 1586.0 10833.8 3.3 0.4 Mali -576.6 -2575.2 -3151.8 0.2 0.7 Netherlands -15184.8 -1054.6 -16239.4 5.4 0.3 Spain 2362.5 1098.6 3461.1 0.8 0.3 Switzerland 107.0 -199.5 -92.6 0.0 0.1 United Kingdom
399.7 658.5 1058.2 0.1 0.2
USA 4315.0 1005.7 5320.7 1.5 0.3 Total 1110.1 -4194.7 -3084.5 0.4 1.2
Panel 6.B: Developing countries
Partner Export misinvoicing
Import misinvoicing
Net misinvoicing
Share in CIV's exports (%)
Share in CIV's imports (%)
Burkina Faso -3162.4 -2568.8 -5731.1 1.1 0.7 Estonia -2223.7 5.0 -2218.8 0.8 0.0 Ghana -8243.8 -659.5 -8903.3 2.9 0.2 Guinea -86.7 205.3 118.6 0.0 0.1 India 1019.5 -246.8 772.7 0.4 0.1 Mali -576.6 -2575.2 -3151.8 0.2 0.7 Nigeria -11130.7 4807.5 -6323.2 4.0 1.3 Senegal -732.5 -88.0 -820.5 0.3 0.0 South Africa -3907.0 38.2 -3868.8 1.4 0.0 Togo -2489.8 16.6 -2473.2 0.9 0.0 Total -31533.8 -1065.7 -32599.4 11.2 0.3
Source: Authors’ computations

34
IV.4. Trade misinvoicing by product This section presents an analysis at the product-partner level to further explore the mechanisms
and patterns of trade misinvoicing in Côte d’Ivoire. The data are drawn from Comtrade using 3-
digit SITC codes. As can be seen in Figure 6, Côte d’Ivoire’s exports are quite concentrated by
product. The analysis of export misinvoicing therefore focuses on the country’s key export
products: cocoa, which account for 32 percent of total exports (average over 2000-2016), the group
of petroleum oils (SITC 333 and 334) which make up 22% of exports, and rubber with 6% (Figure
6). Estimates of export misinvoicing for these commodities are presented in Tables 7.A-7.C.
Cocoa export misinvoicing
The data show heavy concentration of cocoa exports by destination, with the Netherlands and the
United States accounting for nearly half of the total (29% and 19%, respectively. The case of the
Netherlands stands out from other partners. The value of cocoa imports as declared by the
Netherlands is lower than the value of cocoa exports as declared by Côte d’Ivoire, even after
accounting for the cost of insurance and freight, thus the apparent export overinvoicing. This
overinvoicing of cocoa accounts for much of the observed aggregate overinvoicing of exports from
Côte d’Ivoire to the Netherlands as shown earlier. Exports to Estonia also appear to be
overinvoiced and the amount of overinvoicing represents a large fraction of total exports to this
country, at more than half the value of exports as declared by Côte d’Ivoire.
For other partners, the most predominant phenomenon is export underinvoicing. The amount of
underinvoicing is especially high for Germany: $4.5 billion, which represents 49 percent of the
country’s total imports from Côte d’Ivoire over the 2000-2018 period. Exports to France and the
USA were underinvoiced by $2 billion and $1.5 billion, respectively. For the group of the nine
leading export destinations, cocoa exports are underinvoiced by $4 billion over the 2000-2018
period.

35
Petroleum export misinvoicing
Exports of petroleum oils (SITC 333 + SITC 334) are less concentrated by destination than cocoa
exports. The top 11 largest partners account for 69% of Côte d’Ivoire’s total exports of petroleum
oils. Contrary to the case of cocoa, export overinvoicing is predominant. For the group of eleven
top trading partners, total export overinvoicing amounts to $3.7 billion out of a total of $24.2
billion of exports.
There is substantial overinvoicing of exports to The Netherlands ($1.6 billion) as was the case for
cocoa exports. Exports to Nigeria were cumulatively overinvoiced by $3.2 billion, out of a total of
$4.2 billion of exports as declared by Côte d’Ivoire. The corresponding figures for France are $1.5
billion in export overinvoicing out of $2 billion of declared exports. The overinvoicing of exports
to Togo ($518 million) and Benin ($499 million) is small in absolute terms but large in relative
terms. For Togo, the amount of export misinvoicing represents 46 percent of the amount of exports
as declared by Côte d’Ivoire ($1.1 billion). Here again, the question is what factors account for
the overinvoicing of exports. Unless there are substantial fiscal incentives aimed at promoting
exports, such discrepancies may be due to either third party trade (also unlikely), underinvoicing
of imports by the trading partners, or incorrect reporting of the destination of petroleum exports.
Natural rubber export misinvoicing
Export underinvoicing is the most prevalent phenomenon for natural rubber, with the exception of
exports to Belgium, the Netherlands and South Africa that exhibit export overinvoicing. While the
absolute amounts involved may be small, they represent a substantial share of total exports by Côte
d’Ivoire.
Summary
The evidence presented above indicates substantial export overinvoicing and export
underinvoicing in Côte d’Ivoire’s key primary commodity exports – cocoa, petroleum oils and
natural rubber. The case of the Netherlands stands out, as the values of exports declared by Côte
d’Ivoire are substantially larger than the amounts of imports reported by the Netherlands. This may
be due to the fact that the latter is a major trading hub, suggesting that some of the goods recorded
as headed there are in fact only passing through ‘bonded warehouses’, then traded subsequently.
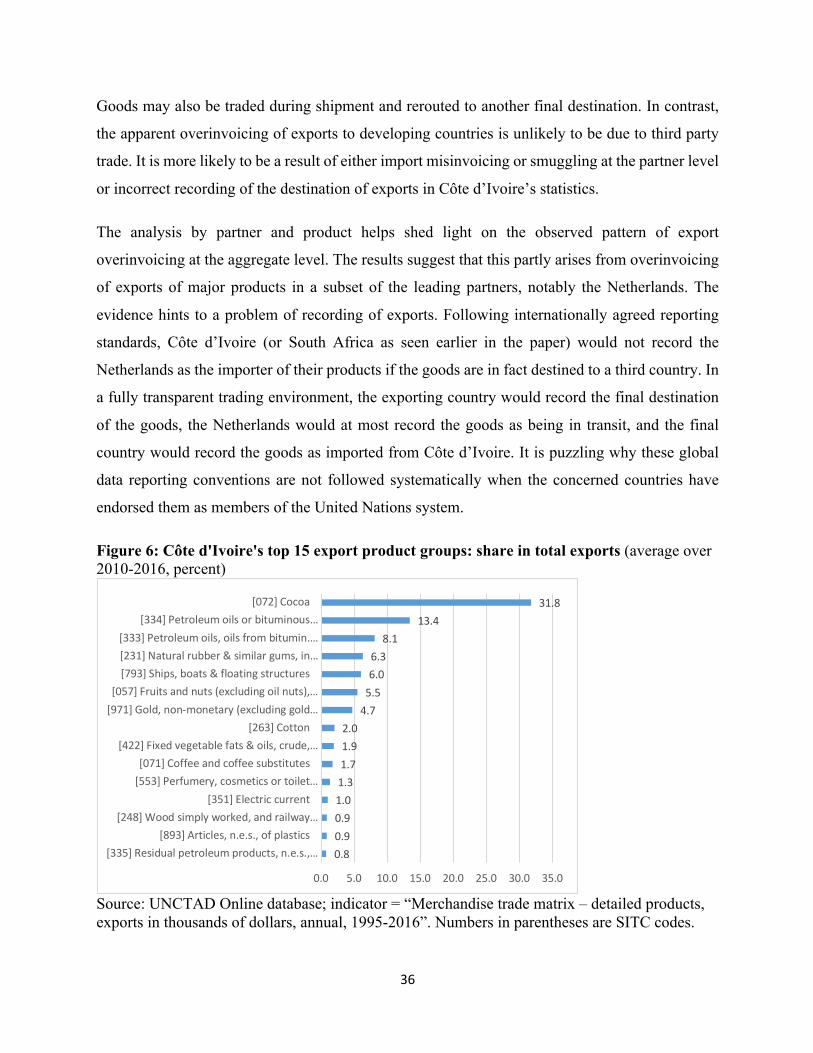
36
Goods may also be traded during shipment and rerouted to another final destination. In contrast,
the apparent overinvoicing of exports to developing countries is unlikely to be due to third party
trade. It is more likely to be a result of either import misinvoicing or smuggling at the partner level
or incorrect recording of the destination of exports in Côte d’Ivoire’s statistics.
The analysis by partner and product helps shed light on the observed pattern of export
overinvoicing at the aggregate level. The results suggest that this partly arises from overinvoicing
of exports of major products in a subset of the leading partners, notably the Netherlands. The
evidence hints to a problem of recording of exports. Following internationally agreed reporting
standards, Côte d’Ivoire (or South Africa as seen earlier in the paper) would not record the
Netherlands as the importer of their products if the goods are in fact destined to a third country. In
a fully transparent trading environment, the exporting country would record the final destination
of the goods, the Netherlands would at most record the goods as being in transit, and the final
country would record the goods as imported from Côte d’Ivoire. It is puzzling why these global
data reporting conventions are not followed systematically when the concerned countries have
endorsed them as members of the United Nations system.
Figure 6: Côte d'Ivoire's top 15 export product groups: share in total exports (average over 2010-2016, percent)
Source: UNCTAD Online database; indicator = “Merchandise trade matrix – detailed products, exports in thousands of dollars, annual, 1995-2016”. Numbers in parentheses are SITC codes.
0.8
0.9
0.9
1.0
1.3
1.7
1.9
2.0
4.7
5.5
6.0
6.3
8.1
13.4
31.8
0.0 5.0 10.0 15.0 20.0 25.0 30.0 35.0
[335] Residual petroleum products, n.e.s.,…
[893] Articles, n.e.s., of plastics
[248] Wood simply worked, and railway…
[351] Electric current
[553] Perfumery, cosmetics or toilet…
[071] Coffee and coffee substitutes
[422] Fixed vegetable fats & oils, crude,…
[263] Cotton
[971] Gold, non-monetary (excluding gold…
[057] Fruits and nuts (excluding oil nuts),…
[793] Ships, boats & floating structures
[231] Natural rubber & similar gums, in…
[333] Petroleum oils, oils from bitumin.…
[334] Petroleum oils or bituminous…
[072] Cocoa

37
Table 7: Export misinvoicing for Côte d’Ivoire’s major products, 2000-2018 (constant 2018 $, million) Panel 7.A: Cocoa (SITC 072) Partner Export misinvoicing Ivorian exports (fob) Partner's imports (cif)* Belgium -13.5 4463.4 4734.7 Estonia -1252.2 2292.1 1187.3 France 2051.7 5413.3 7798.4 Germany 4475.1 4522.8 9102.8 Italy 334.5 2035.2 2460.8 Netherlands -3195.9 19607.0 17662.0 Spain -67.8 2048.5 2109.3 United Kingdom 146.3 2252.7 2443.6 USA 1545.2 12611.7 14156.9 Total 4023.4 55246.7 61656.0
* Note: USA's imports are in f.o.b. Panel 7.B: Petroleum (SITC 333 & 3334)
Partner Export misinvoicing
Ivorian exports (fob)
Partner imports (cif)*
Benin -499.3 1050.9 647.8 Burkina Faso 599.6 1630.4 2330.0 Canada 0.3 2499.3 2499.6 France -1489.6 2150.7 825.4 Germany 2471.0 3602.8 6152.7 Mali 336.2 1407.4 1831.3 Netherlands -1558.9 2367.5 968.5 Nigeria -3195.6 4182.8 1332.3 Spain 0.3 653.4 689.6 Togo -517.9 1121.4 690.7 USA 174.1 3534.3 4061.8 Total -3679.7 24200.8 22029.8
* Note: Imports are in f.o.b. for Canada and USA.
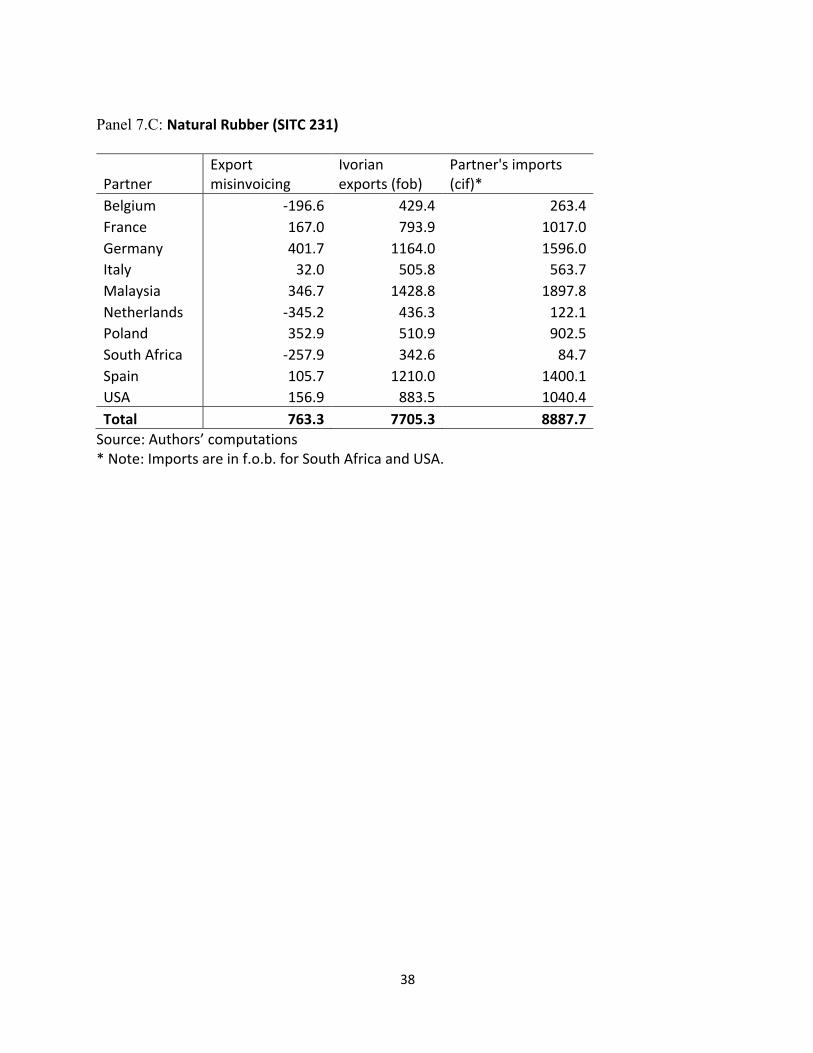
38
Panel 7.C: Natural Rubber (SITC 231)
Partner Export misinvoicing
Ivorian exports (fob)
Partner's imports (cif)*
Belgium -196.6 429.4 263.4 France 167.0 793.9 1017.0 Germany 401.7 1164.0 1596.0 Italy 32.0 505.8 563.7 Malaysia 346.7 1428.8 1897.8 Netherlands -345.2 436.3 122.1 Poland 352.9 510.9 902.5 South Africa -257.9 342.6 84.7 Spain 105.7 1210.0 1400.1 USA 156.9 883.5 1040.4 Total 763.3 7705.3 8887.7
Source: Authors’ computations * Note: Imports are in f.o.b. for South Africa and USA.

39
V. Results for the Case of Angola
The analysis of capital flight from Angola covers a shorter period than in the case of Côte d’Ivoire
and South Africa, starting only in 1986 due to lack of data on relevant indicators. Moreover, unlike
the other two countries, lack of adequate data prevents an analysis of trade misinvoicing. The
Angola export and import data published in the DOTS are reconstructed from partner data.
Therefore, they cannot be used to calculate trade misinvoicing. As a result, the analysis leaves out
an important potential channel of capital flight from Angola.
V.1. Capital flight from Angola
Angola has experienced substantial capital flight over the period from 1986 to 2018 as illustrated
in Table 8 and Figure 7. Over this period, the country witnessed cumulative net outflows of
unrecorded capital of $103 billion. This estimate is not adjusted for trade misinvoicing due to lack
of data as indicated above.
A number of features emerge from the analysis of the trends and patterns of capital flight from
Angola. The first is massive accumulation of current account surpluses, mainly driven by oil
exports. The second is a reversal in net private capital flows since the past decade. From 2010 to
2018, net foreign direct investment outflows totaled a staggering $23.8 billion. The cumulative net
inflows of FDI from 1986 to 2009 was $20 billion. Portfolio investment also generated net
outflows amounting to $8.4 billion over 2000-2009. Similarly, the BoP line other investment
recorded a net outflow in the 1990s and 2000s of $13.5 billion, but this was offset by net inflows
of $16.2 billion in the subsequent period of 2010-2018.
The key question is what lies behind the massive net outflows of private capital from Angola over
the past one and a half decades. For FDI, the outflows may arise from foreign firms’ repatriation
of profits to their home countries. These outflows may also include investments by Angolan
residents abroad as well. In any case, it would be worth investigating the motivation for such large
outward investments. In the case of portfolio investment, these net outflows may be driven by
speculation by private investors seeking to maximize risk-adjusted returns. They could also reflect
portfolio adjustments by firms facing excess cash balances that they seek to invest or simply hold
abroad. The various net outflows could include repayment of external debts by private firms.

40
However, given the observed high volumes of outflows, this scenario would imply that
commensurate volumes of borrowing took place in previous periods. The data shows no evidence
in support of this scenario. This issue is therefore worth investigating further.
Table 8: Capital flight from Angola (constant 2018 $, billion)
1986-89 1990-99 2000-09 2010-18 1970-2018 CDEBTADJ 9.1 10.0 12.4 39.0 70.5
FDI 1.3 8.6 10.1 -23.8 -3.9
PI 0.0 0.0 -8.4 3.0 -5.4
OI 3.3 -1.1 -12.4 16.2 6.0
CA -0.8 -6.2 30.7 36.1 59.7
CRES 0.0 -0.7 -15.6 -7.4 -23.8
BoP Residual 12.8 10.5 16.8 63.1 103.1 Trade misinvoicing 0.0 0.0 0.0 0.0 0.0
Adjusted capital flight 12.8 10.5 16.8 63.1 103.1 Memorandum: total private capital flows
FDI+PI+OI 4.6 7.5 -10.7 -4.7 -3.4
Source: Authors’ computations Figure 7: Capital flight from Angola (constant 2018 $, billion)
Source: Authors’ computation
12.8 10.5
16.8
63.1
0
10
20
30
40
50
60
70
1986-89 1990-99 2000-09 2010-18

41
V.2. Trade data limitations in the case of Angola
As indicated earlier, lack of adequate bilateral data prevents exploration of the potential
contribution of trade misinvoicing to capital flight from Angola. This is an important limitation in
the analysis of capital flight from Angola, especially given the predominance of the natural
resource sector (mainly oil), as the extractive industries tend to be highly exposed to trade
misinvoicing as a mechanism of capital flight and other practices that generate illicit financial
flows such as transfer pricing. The data show heavy dependence of the Angolan economy on
petroleum oils and related products, which account for over 95 percent of total exports.18 The next
product group in line, pearls, precious and semi-precious stones accounts for only 2 percent of
total exports. Angola’s exports are also heavily concentrated by destination. The top 5 partners
account for 80 percent of petroleum oils exports (SITC 333) and 96% of total exports of pearls,
precious and semi-precious stones (Table 10).
Given the importance of the oil sector in Angola, it would be worth investigating the contribution
of export misinvoicing to capital flight from this country. As the oil sector is the primary
destination for foreign investment, it is also an important avenue for investigating the factors
behind the net outflows of private capital over the past one and a half decades. It would be worth
exploring the contribution of corporate practices such as profit repatriation, reverse foreign
investment, intra-firm lending and borrowing, and pure speculation as sources of these net private
capital outflows.
18 Petroleum oils, oils from bitumin materials, crude (SITC 333) accounts for 95% of exports (average over 2000-2014). Adding the other petroleum related categories (SITC 334, 342, 343) brings the share to about 97%. Source: UNCTAD Statistics Database (UNCTADSTAT).

42
Table 9: Angola’s major partners for key export commodities: share in total partners’ imports from Angola (percent over 2010-2017) [SITC 333] Petroleum oils, oils from bitumin materials, crude
[SITC 334] Petroleum oils or bituminous minerals > 70 % oil
[SITC 667] Pearls, precious & semi-precious stones
China 47.2 United States
66.2 United Arab Emirates
43.0
United States 13.8 Belgium 6.3 Belgium 31.1 India 9.8 Sao Tome
and Principe
5.7 United States
9.3
China, Taiwan Province of 6.0 Germany 5.2 India 8.1 South Africa 3.5 Netherlands 3.9 China 4 Total 80.3 Total 87.3 Total 95.5
Source: UNCTADSTAT

43
VI. From unrecorded outflows to unrecorded offshore wealth
VI.1. Relevance of the analysis of unrecorded offshore wealth
Thus far, we have focused on measuring and analyzing unrecorded capital outflows from the three
African countries. The evidence has demonstrated that all the three countries experienced high
volumes of capital flight over the past four decades. The fact that these outflows have persisted
over time suggests that they are driven by fundamental structural and institutional factors in both
the source countries and the global financial system. They cannot be explained simply as a result
of portfolio management decisions by savers seeking to maximize the return to investment. With
the low market interest rates in destination countries, it is not clear that returns are higher there
than in African countries. It is clear that capital flight is driven by medium and long-term
considerations. In other words, it is flight with intention to stay. As James Henry (2012: p. 23) puts
it, “since net outflows from developing countries have continued over sustained periods of time,
and since little offshore wealth or the earnings that it produces have been repatriated, the most
important factors driving it are not those that drive ‘hot money’, but long-term de-capitalization.”
In addition to measuring the flows of capital flight, therefore, it is important to assess the
corresponding accumulation of private wealth deriving from the capital that remains abroad. The
story of capital flight does not end with illicit crossing of national borders.
The concealment of private wealth accumulated from unrecorded capital outflows is facilitated by
services offered by offshore financial centers. The domiciliation and concealment of this wealth is
facilitated by the special services that these centers offer. The term “offshore” here refers “not so
much to the actual physical location of private assets or liabilities, but to nominal, hyper-portable,
multi-jurisdictional, often quite temporary locations of networks of legal and quasi-legal entities
and arrangements that manage and control private wealth – always in the interests of those who
manage it, supposedly in the interests of its beneficial owners, and often in indifference or outright
defiance of the interests and laws of multiple nation states” (J.S. Henry, 2012). African private

44
wealth held offshore has a number of deleterious effects on the source countries and their people.19
Here we highlight the most important.
First, the accumulation of unrecorded private wealth in offshore financial centers erodes the source
country’s tax base. In addition to initial losses in income tax when private savings are concealed
and exported abroad, subsequent losses are incurred due to untaxed income from the hidden
wealth. This is especially problematic for African countries, which generally have very low tax
revenue/GDP ratios and face large and growing financial gaps. It has been estimated that globally
the lost revenue from unrecorded income from wealth stashed offshore is more than twice the total
aid from OECD countries (J.S. Henry, 2012). This substantially changes the debate on financing
for development. Rather than focusing on increasing foreign aid, as is typical in international
discourse, the focus should be on helping African countries reduce the tax losses due to base
erosion resulting from unrecorded offshore wealth.
Second, accumulation of unrecorded offshore wealth changes the picture of wealth inequality both
within African countries and between Africa and the rest of the world. Because unrecorded
offshore wealth generally belongs to political and economic elites, measures of national wealth
inequality in Africa based on recorded assets are biased downward. At the same time, the wealth
gap between African countries and the rich countries where this wealth is domiciled is lower than
official statistics may suggest. In short, African countries may be wealthier than we think, but this
wealth is grossly unequally distributed.
Third, the accumulation of offshore wealth by the African elites depresses public service delivery,
again increasing inequality. The lost tax revenue implies suboptimal provision of public health,
education and infrastructure, services on which the poor depend most heavily. The poor in Africa
cannot ‘vote with their feet’ in protest against poor public service delivery; unlike the rich they
cannot afford education and health care for their families in the West. At the same time, as the
elites do not suffer from poor public service delivery, they have little incentives to improve it.
19 Destination countries, too, experience deleterious impacts from illicit financial flows. For discussion, see Shaxson (2018).

45
Finally, the accumulation of offshore wealth undermines institutions of accountability and the
regulatory system. The political and economic elites who hold offshore wealth do not have
incentives for developing the type of institutions needed to stem capital flight, induce wealth
repatriation and combat tax evasion; quite the contrary. Thus they are unlikely to promote capital
controls, anti-money laundering measures, customs reforms, and policies against trade
misinvoicing and the abuse of transfer pricing rules, etc. Ultimately, capital flight and offshore
wealth accumulation persist because of the incentive structures that make them possible in the first
place.
VI.2. Measurement of hidden offshore wealth
There are various approaches to measuring private offshore wealth. One approach consists of
estimating unrecorded private wealth accumulated from historical capital flight flows, on the
assumption that some fraction of these flows is saved. A second approach consists of measuring
‘missing wealth’ as a discrepancy between recorded liabilities and assets as reported in
international financial statistics. This approach can be found in the work by Gabriel Zucman
(2013). In a third approach, total private wealth is estimated directly using the offshore assets held
by global private banks (J.S. Henry, 2012).
a. Wealth Accumulation from Capital Flight
The most elaborate method for estimating offshore wealth accumulated from capital flight was
developed by James Henry in his work for the Tax Justice Network (J.S. Henry, 2012), updated in
J.S. Henry (2016).20 The key premise in this approach is that unrecorded capital flight is held
abroad for long-term purposes, therefore accumulating wealth that also is not recorded. This wealth
earns interest income and capital gains that often are not taxed. The main challenge is that given
that this wealth is unrecorded, it is difficult to know its precise amount and asset composition. For
example, it is difficult to know how much of the wealth is held in liquid versus illiquid assets such
as real estate, art objects and other valuables. Moreover, some of the capital flight finances
20 The results are available online at “Global Haven Industry”: http://globalhavenindustry.com/.

46
consumption, including the extravagant lifestyles often profiled in investigative reports on
prominent economic and political figures.21
James Henry (2012) proposed some working assumptions to address these challenges, based on
information from bank industry analysis as well as interviews with operators and informed
observers of the offshore banking industry. The first assumption is that about 50-75 percent of
capital flight is invested offshore in financial interest-generating vehicles and physical assets. The
second is that the earnings on these offshore investments are not taxed, as they are not reported to
the tax authorities of source countries. The third is that offshore wealth earns a modest market
interest rate, proxied by the 6-month CD rate. On this basis, Henry capitalizes past capital flight to
arrive at a measure of unrecorded private offshore wealth. Worldwide, Henry finds that the sample
of 139 countries examined over 1970-2010 have accumulated $7.3 to $9.3 trillion of unrecorded
wealth as of 2010. In the case of Sub-Saharan Africa, unrecorded stock of private capital stood at
$683 billion in 2010 and it rose to $709 billion by 2014. Table 10 presents estimates of the stock
of offshore wealth for the three case study countries as well as regional totals.
James Henry’s estimates of offshore wealth indicate that, contrary to commonly held beliefs,
African countries are not heavily indebted vis-à-vis the rest of the world; they are instead ‘net
creditors’ (a phenomenon pointed out by James K. Boyce and Léonce Ndikumana (2001)) in the
sense that the stock of wealth stashed abroad vastly exceed their external liabilities as measured
by the stock of external debt (Henry 2012, 2016). The problem is that offshore wealth does not
contribute to Africa’s development.
21 For examples, see Ndikumana, Léonce and James K. Boyce. 2012. "Rich Presidents of Poor Nations: Capital Flight from Resource-Rich Countries in Africa." ACAS Bulletin, 87, 2-7., Boyce, James K. and Léonce Ndikumana. 2012a. "Elites Loot Africa as Foreign Debts Mount," N. Chanda and S. Froetschel, A World Connected: Globalization in the 21st Century. Yaleglobal Online Ebook. 44-47. and ____. 2012b. "How Capital Flight Drains Africa: Stolen Money and Lost Lives," N. Pons-Vignon and P. Ncube, Confronting Finance: Mobilizing the 99% for Economic and Social Progress. . Geneva: International Labour Office, 31-34..

47
Table 10: Estimates of offshore wealth as stock of capital flight ($ billion)
Country or Region Stock accumulated
over 1970-2014
Angola 70.4
Côte d’Ivoire 14.0
South Africa 113.5
Top 5 SSA 639.6
SSA 709.8
East Asia (excl. China) 2524.0
Latin America and Caribbean 1969.8
Source: Estimates are obtained from The Global Haven Industry database (http://globalhavenindustry.com/) for 1970-2014 (Henry 2016). See Henry (2012) for estimates over 1970-2010. Note: The estimates of the flows of capital flight constructed by Henry (2016) as a basis for deriving the accumulated stock do not include adjustment for trade misinvoicing.
b. Missing External Assets
A second approach to measuring offshore wealth starts with anomalies in the IMF data on
international investment positions (IIP), which report external liabilities and external assets – that
is, on stocks of capital, rather than the flows reported in the BoP, for the countries of the world.
Implausibly, these data purport to show that the world as a whole is a ‘net debtor’: the world’s
total external liabilities exceed its total external assets (Philip R. Lane and Gian Maria Milesi-
Ferretti, 2007). That is, the total amount of financial securities and bank deposits recorded as being
held by foreigners (liabilities) exceeds the total amount recorded as being held in foreign countries.
‘There is a “hole”,’ observes Gabriel Zucman (2015, p. 37), who uses this discrepancy to estimate
hidden wealth: ‘if we look at the world balance sheet, more financial assets are recorded as
liabilities than as assets, as if planet Earth were in part held by Mars.’
In 2013, this discrepancy amounted to $7.6 trillion (Zucman 2014). Because the IIP data only refer
to financial wealth, other types of hidden wealth are missing from this number. As Zucman (2015,
pp. 44-45) explains:

48
My method says nothing about the amount on non-financial wealth in tax havens. This includes yachts registered in the Cayman Islands, as well as works of art, jewelry, and gold stashed freeports – warehouses that serve as repositories for valuables. Geneva, Luxembourg, and Singapore all have one: in these places, great paintings can be kept and traded tax-free – no customs duty or value-added tax is owed – and anonymously, without ever seeing the light of day. High-net-worth individuals also own real estate in foreign countries: islands in the Seychelles, chalets in Gstaad, and so on. Registry data show that a large chunk of London’s luxury real estate is held through shell companies, largely domiciled in the British Virgin Islands, a scheme that enables owners to remain anonymous and to exploit tax loopholes. Unfortunately, there is no way yet to estimate the value of such real assets held abroad.
Zucman nonetheless reckons that his method captures the bulk of hidden wealth:
At the top of the wealth distribution – that is, for fortunes of dozens of millions of dollars and more – on average most of the wealth takes the form of financial securities. It is rare than someone invests all of his wealth in a yacht. It is one the great rules of capitalism that the higher one rises on the ladder of wealth, the greater the share of financial securities in one’s portfolio.
He concludes that his estimate that hidden wealth amounts to about 8% of total personal financial
wealth worldwide is on the right order of magnitude, although that ‘one might imagine that the
true figure, all wealth combined, is 10% or 11%.’ This would suggest that hidden non-financial
assets amounted to another $2-3 trillion as of 2013, bringing total hidden assets to around $10
trillion.
There are reasons to suspect, however, that even this figure errs on the low side. High net-worth
individuals who conceal their wealth behind veils of anonymity may not follow the unwritten rules
of capitalism with regard to portfolio allocation, any more than they obey its written rules.

49
Box 1
Hidden Real Estate
Evidence from the world’s ‘supercities’ – global centers like New York, London, Paris, Hong Kong and Singapore – suggest that anonymous real estate holdings account for a substantial amount of hidden wealth. The Financial Action Task Force, an intergovernmental body that combats money laundering, reported in 2013 that ‘real estate accounted for up to 30% of criminal assets confiscated in the last two years, demonstrating this as a clear area of vulnerability’ (FATF 2013, p. 24). The Financial Times, announcing that ‘London has become a center for dirty money,’ reported in 2014 that at least £122 billion (about $200 billion) worth of property in England and Wales is held by shell companies registered in offshore tax havens, most of them in the British Virgin Islands and Channel Islands (O’Murchu 2014). In the U.S., Title III of the Patriot Act, signed into law soon after the September 11, 2001 attack, required banks to report suspicious money transfers from abroad, but it contained an exemption for real estate purchases. This ‘gaping loophole – and extraordinary growth opportunity for high-end real estate,’ meant that ‘foreigners could still buy penthouse apartments or mansions anonymously and with ease, by hiding behind shell companies set up in states such as Delaware and Nevada’ (Foer 2019). Shell companies accounted for 54% of luxury real estate purchases in Manhattan in 2014, 51% in Los Angeles, and 48% in San Francisco in 2014 (New York Times 2015). The total value of residential property in Manhattan is estimated at $733 billion (Metrocosm 2015), and luxury properties (those sold for $4 million and up) accounted for about 37% of residential sales in 2014 (City Realty 2017). Together these figures suggest that the value of hidden residential properties in Manhattan alone exceeds $100 billion.* U.S. government investigations “continue to show corrupt politicians, drug traffickers, and other criminals using shell companies to purchase luxury real estate with cash,” Jennifer Shasky Calvery, director of the U.S. Treasury Department’s Financial Crimes Enforcement Network, stated in a speech in 2016. ‘We see wire transfers originating from foreign banks in offshore havens where shell companies have established accounts, but in many cases we also see criminals using U.S. incorporated limited liability companies to launder their illicit funds through the U.S. real estate market’ (quoted in Swanson 2016). ‘The real estate market has long provided a way for individuals to secretly launder or invest stolen money and other illicitly gained funds,’ observes a recent study by Transparency International (2017, p. 5). ‘Not only do expensive apartments in New York, London or Paris raise the social status of their owners and enhance their luxurious lifestyles, but they are also an easy and convenient place to hide hundreds of millions of dollars from criminal investigators, tax authorities or others.’ _______ * Calculated as follows: $733 billion x 0.37 x 0.54 = $146 billion. Note that this excludes non-residential property holdings as well as residential properties valued at less than $4 million. * Calculated as follows: $733 billion x 0.37 x 0.54 = $146 billion. Note that this excludes non-residential property holdings as well as residential properties valued at less than $4 million.

50
Apart from the non-financial assets mentioned by Zucman – art, yachts, gold, jewelry and real
estate – a considerable amount of hidden wealth takes the form of cash. One hundred dollar bills,
though not widely used in day-to-day transactions, account for 78% of the $1.5 trillion value of
U.S. banknotes in circulation. The €500 note accounts for 30% of the total value of Euros, and the
1000 Swiss franc note – which is especially handy for carrying in a briefcase, being worth more
than 20 times its weight in gold – accounts for 92% of the total value of the Swiss currency (Sands
2016). ‘Rather than being a way of paying for things,’ the Economist (2016) remarks, large-
denomination notes serve as a ‘convenient store of value’ – convenient, above all, for wealth
holders who prize anonymity.
Furthermore, not all of the world’s wealth that is hidden in the form of financial assets shows up
in the IIP discrepancy. To understand why, consider Zucman’s (2015, p. 37) explanation for the
discrepancy:
Let’s imagine a British person who holds in her Swiss bank account a portfolio of American securities – for example, stock in Google. What information is recorded in each country’s balance sheet? In the United States, a liability: American institutions see that foreigners hold US equities. In Switzerland, nothing at all, and for a reason: the Swiss statisticians see some Google stock deposited in a Swiss bank, but they see that the stock belongs to a UK resident – and so they are neither assets nor liabilities for Switzerland. In the United Kingdom, nothing is registered, either, but wrongly this time: the Office for National Statistics should record an asset for the United Kingdom, but it can’t, because it has no way of knowing that the British person has Google stock in her Geneva account. (Zucman 2015, p. 37).
Now imagine that the same person has Google stock in a bank account in the United States, which
is ‘by some measures, the world’s single most important tax haven’ (Shaxson 2011, p. 18). The
U.S. ranks second in the world in the latest edition of the Financial Secrecy Index, which measures
the volume of foreign deposits and the laxity of transparency rules, between #1 Switzerland and
#3 Cayman Islands (Tax Justice Network 2018). In this case, the United States would not record a
liability, and the hidden asset would not lead to a discrepancy in the IIP accounts. Similarly, if
capital flight from Africa is routed through a shell company incorporated in Delaware and then
invested in US equities, there is no discrepancy to be found.
Moreover, apart from unrecorded assets there also may be misrecorded assets – external assets
recorded in the IIP as belonging to country A, but whose beneficial owners are really from country

51
B. This is particularly likely if country A is a secrecy jurisdiction. Mauritius, for example, is a
haven for capital from African countries, including South Africa and Angola (Fitzgibbon 2017).
With a population of only 1.3 million, the country recorded a whopping $423 billion in recorded
external assets in the IIP data in 2015, more than $300,000 per person, about 15 times the country’s
per capita income. By way of comparison, Poland and Turkey, with similar per capita incomes,
recorded external assets amounting to about $6000 and $3000 per person, respectively.
For these reasons, while Zucman may be correct that the IIP discrepancy gives the right order of
magnitude for the world’s total hidden wealth – meaning that it’s closer to $7.6 trillion than to
either $760 billion or $76 trillion – the total amount may be considerably larger, perhaps by a
multiple or two.
The IIP discrepancy provides a lower-bound estimate of total hidden wealth, but cannot tell us
how hidden wealth is distributed by source regions or countries. To estimate Africa’s hidden
wealth, we must rely on other data sources. Zucman (2013, 2015) used data on financial assets in
Swiss banks. Since 1998, the Swiss National Bank (SNB – Switzerland’s central bank) has
reported data on foreign-owned assets held in Swiss banks. These assets amounted to $2.3 trillion
in spring 2015. About 60% of these assets were held by shell corporations, trusts, and foundations,
meaning that the nationality of their beneficial owners was unknown. The SNB data do, however,
report nationality for the remaining assets, and Zucman (2015, pp. 31-32) uses on this information
to impute ownership of the assets held by shell corporations:
To know who really owns wealth in Switzerland, we need to make some assumptions about who is behind these shell entities. After examining the available evidence, the assumption I retain is that the wealth held through shell companies belongs to American, British, or German citizens in the same proportion as the directly held wealth does, with a correction to take into account that since 2005 Europeans have had greater incentives to use shell companies and Gulf countries have less incentive to do so.
On this basis he concludes that Africa accounted for $150 billion of the non-resident bank accounts
in Switzerland, about 6.5% of the total. More than half belonged to Europeans, with Germany,
France and Italy, the three countries that share a border with Switzerland, leading the way, together
accounting for $640 billion.

52
Africa likewise accounts for 6.5% ($500 billion) in Zucman’s estimate of the distribution by source
countries of the $7.6 trillion in hidden wealth revealed by the IIP discrepancy. In other words,
Africa’s share of hidden financial wealth worldwide is the same as its share of directly held wealth
deposited in Swiss bank accounts.
Is it reasonable to assume that the distribution of wealth held by shell companies in Swiss banks
mirrors that of directly held assets? Do Germans and Angolans, for example, have exactly the same
incentives to channel funds through anonymous offshore entities, incurring the attendant
transaction costs, as opposed to opening Swiss bank accounts in their own names? Or does the
incentive to use shell entities vary, depending on the provenance of the funds?
If the motive for a British person to put money in a Swiss bank is simply to avoid UK taxes, she
may deem it sufficient to open an account in her own name. If the UK government somehow were
to learn of the ruse, the most she would face are tax penalties. But if the motive is to conceal wealth
that was acquired by fraudulent or questionable means – if the wealth is the proceeds of what’s
called in ‘predicate crime’ in anti-money laundering legislation – she may decide that more
elaborate precautions, including routing the money through a shell company, or a web of shell
companies, is worth the extra expense. For in this case, the penalty for being caught could be
forfeiture of the entire amount and criminal prosecution.
Law professor Cass Sunstein (2016), in a review of Zucman’s book, alludes to this important point
when he writes that ‘all uses of tax havens are not the same.’ Noting that Zucman’s estimates imply
that half of Russia’s financial wealth is held offshore, Sunstein suggests that ‘the extraordinarily
high figure for Russia might be best understood as involving money corruptly acquired or
invested.’ The same may be true of Africa: Zucman estimates that 30% of the region’s financial
wealth is offshore, compared to 10% for Europe and 4% for the U.S. (Zucman 2015, p. 53).
In sum, estimates of missing external assets based on the global IIP anomalies do not provide a
reliable measure of the magnitude or timing of capital flight from individual African countries.
For this purpose, we start instead with discrepancies in the country’s balance of payments,
corrected as described above for external borrowing and trade misinvoicing. When recorded
inflows of foreign exchange systematically exceed recorded outflows, we can safely assume that

53
most of the missing money is not sitting under mattresses in Johannesburg, Luanda or Abidjan. It
is leaving Africa, although its departure is not registered in official statistics.
To be sure, there is uncertainty as to how much of the flight capital is accumulated as offshore
wealth and how much is dissipated in consumption. Mapping from flows to wealth stocks requires
strong assumptions, too. In terms of capital flight’s cost to source countries, however, it matters
little whether the missing money winds up being saved or consumed. From the standpoint of
ordinary people in the Democratic Republic of Congo, for example, what matters is not how frugal
Mobutu was with his stolen money, but the simple fact that he stole it.

54
VII. Conclusion
This paper applied an updated methodology and data from 1970 to 2017 to estimate capital flight
from Angola, Côte d’Ivoire, and South Africa, three African countries that feature prominently in
the volume of capital flight from the continent. The paper also delved into a key mechanism of
capital flight, trade misinvoicing, including an analysis at the bilateral and product level with a
focus on the main primary commodity exports. The results show that these three countries have
suffered substantial loss of capital over the past four decades amounting to $327 billion for South
Africa, $80 billion for Angola and $37 billion for Côte d’Ivoire. For South Africa, trade
misinvoicing over the period of 1998-2017 contributed about $146 billion to capital flight, most
of it occurring through export underinvoicing especially in primary commodities.
The chronic nature of capital flight from these countries suggests that the phenomenon is driven
by structural and institutional factors in both the source country and the global and financial
systems that facilitate it. These outflows result in accumulation of private offshore wealth, some
of which is financed by embezzlement of public resources including externally borrowed funds.
The results imply that, like many other African countries, these three countries are ‘net creditors’
to the rest of the world in the sense that the assets held offshore exceed the stock of their external
debts. The difference is that the debts are a liability on the shoulders of the entire population while
the offshore wealth is private. It follows that strategies to combat capital flight must involve both
measures to curtail new outflows and measures to repatriate the wealth hidden in offshore financial
centers.
The analysis reveals a number of limitations and some areas of potentially fruitful further
investigation. For Angola, due to the lack of adequate trade data it is not possible to estimate capital
flight occurring through trade misinvoicing. This is an important limitation given the
predominance of oil in the country’s economy, a sector known to be subject to misinvoicing in
other resource-rich countries. The paper also uncovered important methodological shortcomings
in reporting of exports and imports, which is a handicap to the analysis of trade misinvoicing. The
evidence calls for scaling up efforts by governments to improve transparency and consistency in
the reporting of trade statistics in line with established international rules and conventions. To
fully understand the mechanisms of capital flight, it is important to examine in detail the respective

55
roles of domestic and international factors, including the actors, conduits and enablers of these
outflows. In this perspective, detailed country studies constitute a highly fruitful avenue for
research on capital flight.
References Bahmani-Oskooee, Mohsen and Gour G. Goswami. 2003. "Smuggling as Another Cause of Failure of the
PPP." Journal of Economic Development, 28(2), 23-38. Barnett, Richard Clay. 2003. "Smuggling, Non-Fundamental Uncertainty, and Parallel Market Exchange
Rate Volatility." Canadian Journal of Economics, 36(3), 701-27. Berger, Helge and Volker Nitsch. 2012. "Gotcha! A Profile of Smuggling in International Trade," C. Costa
Storti and P. De Grauwe, Illicit Trade and the Global Economy. Cambridge and London: MIT Press, 49-72.
Bhagwati, J. 1967. "Fiscal Policies, the Faking of Foreign Trade Declarations, and the Balance of Payments." Bulletin of the Institute of Economics and Statistics (Oxford University), 29, 61-77.
____. 1964. "On the Underinvoicing of Imports [with Application to Recent Turkish Experience]." Bulletin of the Institute of Economics and Statistics (Oxford University), 26, 389-97.
Bhagwati, J. and Bent Hansen. 1973. "A Theoretical Analysis of Smuggling." Quarterly Journal of Economics, 87(2), 172-87.
Bhagwati, J.; Anne O. Krueger and Chaiyawat Wibulswasdi. 1974. "Capital Flight from Ldcs: A Statistical Analysis." Studies in International Economics, 1, 148-54.
Biswas, A. K. and S. Marjit 2005. "Mis-Invoicing and Trade Policy." The Journal of Policy Reform, 8(3), 189-205.
Boyce, James K. and Léonce Ndikumana. 2012a. "Elites Loot Africa as Foreign Debts Mount," N. Chanda and S. Froetschel, A World Connected: Globalization in the 21st Century. Yaleglobal Online Ebook. 44-47.
____. 2012b. "How Capital Flight Drains Africa: Stolen Money and Lost Lives," N. Pons-Vignon and P. Ncube, Confronting Finance: Mobilizing the 99% for Economic and Social Progress. . Geneva: International Labour Office, 31-34.
____. 2001. "Is Africa a Net Creditor? New Estimates of Capital Flight from Severely Indebted Sub-Saharan African Countries, 1970–1996." Journal of Development Studies, 38(2), 27-56.
____. 2015. "Strategies for Addressing Capital Flight," S. I. Ajayi and L. Ndikumana, Capital Flight from Africa: Causes, Effects and Policy Issues. Oxford: Oxford University Press, 393-417.
Buehn, Andreas and Stefan Eichler. 2011. "Trade Misinvoicing: The Dark Side of World Trade." The World Economy, 34(8), 1263-87.
Buehn, Andreas and Mohammad Reza Farzanegan. 2012. "Smuggling around the World: Evidence from a Structural Equation Model." Applied Economics, 44(23), 3047-64.
Cuddington, John T. 1986. "Capital Flight: Estimates, Issues, and Explanations." Princeton Studies in International Finance, no. 58
____. 1987. "Macroeconomic Determinants of Capital Flight: An Econometric Investigation," D. R. Lessard and J. T. Cuddington, Capital Flight and Third World Debt. Washington, DC: Institute for International Economics., 85–96.

56
Epaphra, Manamba. 2015. "Tax Rates and Tax Evasion: Evidence from Missing Imports in Tanzania." Business and Economics Journal, 2015.
Erbe, Susanne. 1985. "The Flight of Capital from Developing Countries." Intereconometrics, 268-75. Ferraris, C. F. 1885. "La Statistica Del Movimento Dei Metalli Preziosi Fra L'italia E L'estero (Rome)," Fisman, Raymond and Shang-Jin Wei. 2007. "The Smuggling of Art, and the Art of Smuggling:
Uncovering the Illicit Trade in Cultural Property and Antiques." NBER Working Paper, No. 13446. ____. 2004. "Tax Rates and Tax Evasion: Evidence from" Missing Imports" in China." Journal of political
Economy, 112(2), 471. German Ministry of Education and Research. 2014. German-African Cooperation in Education and
Research. Bmbf Africa Days 16 – 18 March 2014. Berlin: BMBF, Division of Cooperation with Developing and Emerging Countries, Africa and the Middle East.
Henry, J.S. 2016. "The Price of Offshore - Data by Region," The Global Haven Industry: http://globalhavenindustry.com/price-of-offshore-menu,
____. 2012. " The Price of Offshore Revisited: New Estimates for ‘Missing’ Global Private Wealth, Income, Inequality and Lost Taxes," London: Tax Justice Network,
IMF. 2010. Balance of Payments Manual, Sixth Edition. Washington, D.C.: International Monetary Fund. Kar, D. and J. Spanjers. 2014. "Illicit Financial Flows from Developing Countries: 2003-2012,"
Washington, DC: Global Financial Integrity (December), Kellenberg, Derek and Arik Levinson. 2016. "Misreporting Trade: Tariff Evasion, Corruption, and
Auditing Standards," National Bureau of Economic Research, Working Paper 22593, Köhler, Horst. 2015. "On the Impossibility of Speaking of Africa: Essay Based on a Speech at the Africa
Days of the German Federal Ministry of Education and Research on March 18, 2014." Africa Journal of Management, 1(3), 257-63.
Lane, Philip R. and Gian Maria Milesi-Ferretti. 2007. "The External Wealth of Nations Mark Ii: Revised and Extended Estimates of Foreign Assets and Liabilities, 1970–2004." Journal of International Economics, 73(2), 223-50.
McDonald, Donogh C. 1985. "Trade Data Discrepancies and the Incentive to Smuggle: An Empirical Analysis." International Monetary Fund Staff Papers, 32(4), 668-92.
Ndikumana, Léonce and James K. Boyce. 2010. "Measurement of Capital Flight: Methodology and Results for Sub-Saharan African Countries." African Development Review, 22(4), 471-81.
____. 2012. "Rich Presidents of Poor Nations: Capital Flight from Resource-Rich Countries in Africa." ACAS Bulletin, 87, 2-7.
Ndikumana, Léonce; James K. Boyce and Ameth S. Ndiaye. 2015. "Capital Flight from Africa: Measurement and Drivers," S. I. Ajayi and L. Ndikumana, Capital Flight from Africa: Causes, Effects and Policy Issues. Oxford: Oxford University Press, 15-54.
Patnaik, Ila; Abhijit Sen Gupta and Ajay Shah. 2012. "Determinants of Trade Misinvoicing." Open Economies Review, 23(5), 891-910.
Reuter, Peter ed. 2012. Draining Development? Controlling Flows of Illicit Funds from Developing Countries. Washington DC: The World Bank.
Spanjers, Joseph and Matthew Salomon. 2017. "Illicit Financial Flows to and from Developing Countries: 2005-2014," Washington, DC: Global Financial Integrity,
Storti, Cláudia Costa and Paul de Grauwe eds. 2012. Illicit Trade and the Global Economy. Cambridge, MA: MIT Press.
UNCTAD. 2016. "Trade Misinvoicing in Primary Commodities in Developing Countries: The Cases of Chile, Côte D’ivoire, Nigeria, South Africa and Zambia," Geneva: UNCTAD, December,
United Nations. 1998. International Merchandise Trade Statistics: Concepts and Definitions. New York: UNDESA, Statistics Division.
World Bank. 1985. World Development Report 1985. Washington, DC: World Bank.

57
Zucman, Gabriel. 2013. "The Missing Wealth of Nations: Are Europe and the Us Net Debtors or Net Creditors?" The Quarterly Journal of Economics, 128(3), 1321-61.
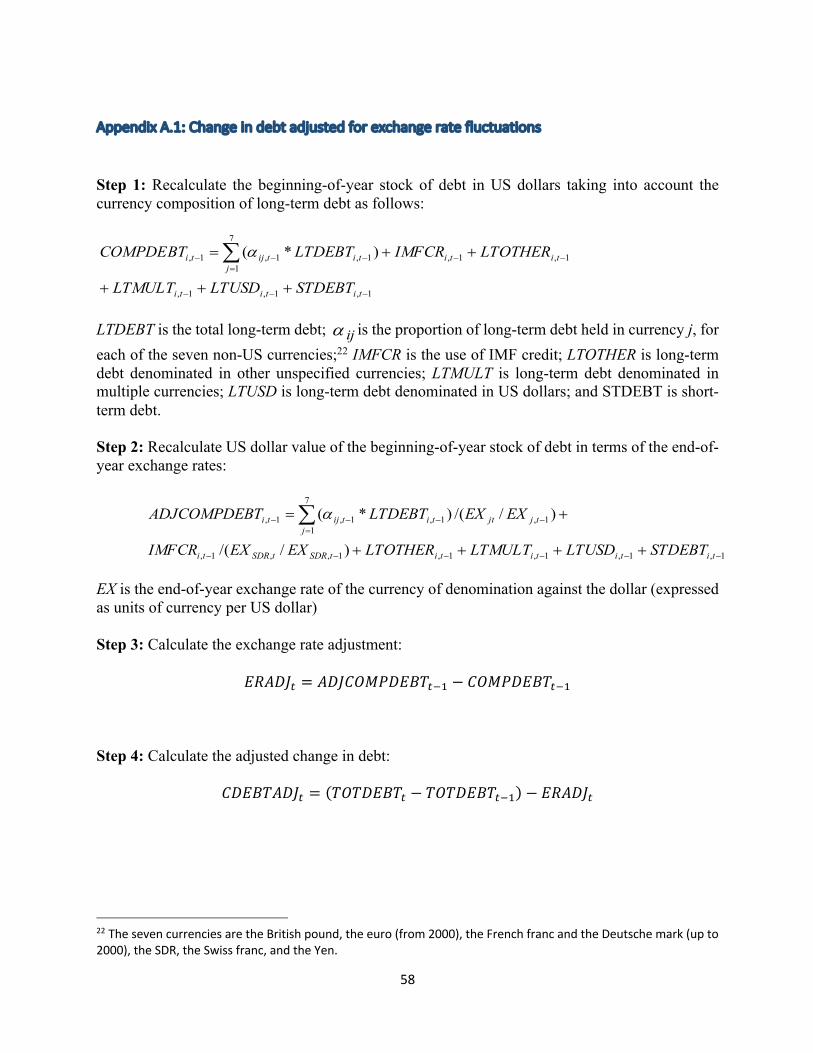
58
Appendix A.1: Change in debt adjusted for exchange rate fluctuations
Step 1: Recalculate the beginning-of-year stock of debt in US dollars taking into account the currency composition of long-term debt as follows:
LTDEBT is the total long-term debt; is the proportion of long-term debt held in currency j, for each of the seven non-US currencies;22 IMFCR is the use of IMF credit; LTOTHER is long-term debt denominated in other unspecified currencies; LTMULT is long-term debt denominated in multiple currencies; LTUSD is long-term debt denominated in US dollars; and STDEBT is short-term debt.
Step 2: Recalculate US dollar value of the beginning-of-year stock of debt in terms of the end-of-year exchange rates:
EX is the end-of-year exchange rate of the currency of denomination against the dollar (expressed as units of currency per US dollar)
Step 3: Calculate the exchange rate adjustment:
!"#$%! = #$%'()*$!+,!"# − '()*$!+,!"#
Step 4: Calculate the adjusted change in debt:
'$!+,#$%! = (,(,$!+,! − ,(,$!+,!"#) − !"#$%!
22 The seven currencies are the British pound, the euro (from 2000), the French franc and the Deutsche mark (up to 2000), the SDR, the Swiss franc, and the Yen.
1,1,1,
1,1,
7
11,1,1, )*(
---
--=
---
+++
++=å
tititi
titij
titijti
STDEBTLTUSDLTMULT
LTOTHERIMFCRLTDEBTCOMPDEBT a
ija
1,1,1,1,1,,1,
7
11,1,1,1,
)//(
)//()*(
------
=----
++++
+=å
tititititSDRtSDRti
jtjjttitijti
STDEBTLTUSDLTMULTLTOTHEREXEXIMFCR
EXEXLTDEBTTADJCOMPDEB a

59
Appendix A.2. Definitions of some special trade transactions
Re-exports: Re-exports of foreign goods, in the same state as previously imported, from the free circulation area, premises for inward processing or industrial free zones, directly to the rest of the world; Re-exports of foreign goods, in the same state as previously imported, from premises for customs warehousing or commercial free zones, to the rest of the world. Re-exports are to be included in the country exports. They are also recommended to be recorded separately for analytical purposes, which may require the use of supplementary sources of information in order to determine the origin of re-exports, i.e., to determine that the goods in question are indeed re-exports rather than the export of goods that have acquired domestic origin through processing. Goods in transit: Goods entering and leaving a country with the exclusive purpose of reaching a third country are excluded, since they do not add to or subtract from the stock of material resources of the country through which they pass. Trans-shipment: The customs procedure under which goods are transferred under customs control from the importing means of transport to the exporting means of transport within the area of one customs office which is the office of both importation and exportation... [This procedure] does not apply to goods which on arrival in the customs territory of a country are already under a customs procedure (such as customs transit) and are transferred from one means of transport to another during the course of that procedure, such transfer being dealt with by the customs under the procedure already in operation. Nor does [it] ... apply to goods carried by post or in travelers' baggage. (Kyoto Convention, annex E.2, pp. 5 and 6). Source: United Nations (1998).

60
Appendix B: Figure Figure B.1: South Africa’s exports to and imports from unspecified partners (% of total)
Source: DOTS
0
0.05
0.1
0.15
0.2
0.25
0.3
0.35
0.4
0.45
0.5
1970 1975 1980 1985 1990 1995 2000 2005 2010 2015
Exports (% of total) Imports (% of total)