Embed Size (px)
Citation preview

-----------------------------------~. ~
INSTRUCTION MANUAL
FOR
MAGNETIC SUSCEPTIBILlTY BRIDGE
~~{jíJ{jíJ~~{íJ~(l;~~~{:,~••~
Geofyzika n. p. BrnoCzechoslovakia

CONTENTS
page
1. GENERAL INFORMATION 5
1.1 BASIC FEATURES 5
1.2 SPECIFICATIONS 6
1.3 SAFETY REQUIREMENTS 8
2. PRINCIPLE OF OPERATION 9
2.1 BRIDGE NUCLEUS 9
2.2 THE DIRECT AND THE FEEDBACK BRANCHES 11
2.3 ZEROING 13
2.4 CONTROL LOGIC 15
2.5 OSCI LLOSCOPE AND EXTERNAL VOL TMETER 16
3. INSTRUMENT LAYOUT 183.1 PICK - UP U N IT K LY - 2.1 a nd K LY - 2.2 18
3.2 MEASURING UNIT KL y -2.0 22
3.2.1 Control unit 25
3.2.2 Digital voltmeter 26
3.2.3 Connectors and terminals on the rear side of the measuring
unit and the pick-up unit 28
4. THEORETICAL PRINCIPLES OF MEASUREMENT OF THE
MAGNETIC SUSCEPTIBILlTY OF ROCKS 314.1 THE SUSCEPTIBILlTY TENSOR 31
4.2 DI RECTIONAL SUSCEPTIBI L1TY 32
4.3 DETERMINATION OF THE SUSCEPTIBILlTY TENSORFROM DIRECTIONAL SUSCEPTIBILlTIES 33
4.4 PRINCIPAL SUSCEPTIBILlTIES AND PRINCIPAL
DI RECTIONS 34
4.5 MEAN SUSCEPTIBILlTY 35
4.6 ISOTROPIC MEDIUM SUSCEPTIBILlTY 35
4.7 DIRECTIONAL TOTAL SUSCEPTIBILlTY 36
4.8 INFLUENCE OF THE DEMAGNETIZATION EFFECT 37
4.9 INFLUENCE OF THE SPECIMEN HOLDER 39
5. METHODOLOGY OF MEASUREMENT 395.1 GENERA L IN FORMA TI ON 39
5.1.1 Installation of the bridge, arrangement of the workingplace 39
5.1.2 Shapesof specimen, holders 415.1.3 Calibration standards 43
5.1.4 Measuring ranges 435.2 INSTRUCTIONS FOR MEASUREMENT 45
5.2.1 Switching on and off 455.2.2 Zeroing 455.2.3 Measurement of TSB of specimen with holder 475.2.4 Measuring range selection 485.2.5 Measurement of the TSB of the holder 505.2.6 Calibration 50
5.2.7 Setting the phaseconditions 515.2.8 Check of the stability of zero 51
5.3 MEASUREMENT OF THE ANISOTROPY OF SUSCEPTIBILlTY 52
5.3.1 Cubic specimen 525.3.2 Cylindrical specimen 545.3.3 Processing 57
5.4 MEASUREMENT OF THE MEAN SUSCEPTIBILlTY 58
5.4.1 Cubic, cylindrical and spherical specimens 585.4.2 Fragment specimens 59
5.5 NOTE ON THE SENSITIVITY OF THE BRIDGE 60
6. FINAL INFORMATION 616.1 MAINTENANCE 616.2 SERVICING 616.3 STORAGE AND TRANSPORTATION 626.4 WARRANTY 626.5 COMPLETE DELlVERY 62
7. BIBLlOGRAPHY 63

l
1. GENERAL INFORMATlON
1.1 BASIC FEATURES
The Kappabridge KL Y-2 is designed for measuring the magneticsusceptibi lit Y of rocks and its anisotropy. Its operation is based on mea
surements of inductivity changes in a coi I due to a rock specimen.
In principie the instrument represents a precision semi-automatic
autobalance inductivity bridge. It is equipped with automatic zeroing andautomatic compensation of the thermal drift of the bridge unbalance. The datameasured is shown in the "digítal display and besides it is put out on the connector in the parallel BCD codeo
The standard pick-up unit is designed for measuring regularly shaped
rock specimens of a volume of 10 crí130rof fragments in a measuring vessel
of a volume of 40 cm3• As an option, a pick-up unit for measuring regularly
shaped rock specimens of a volume of 65 cm3or of fragments in a measuringvessel of a volume of 240 cm3 can be delivered. The measuring coi Is ofboth the units are designed as 6th-order compensated solenoids, with a remarkably high field homogeneity.
The KL Y-2 bridge has high accuracy, fast measuring rate and an out
standing sensitlvity that makes it possible to measure even rocks with veryweak magnetic properties. Owing to these features the instrument can be
widely utilized in research Into the magnetic properties of rocks, as well as
for routine measurements in geophysical survey.
The output of the bridge can be connected to a data recording or toa data processing device via an appropriate interface.
The manufacturer can supply the KIM-20 Asynchronou~ InterfaceModule for interfacing the KL Y-2 to a teletype (full duplex, 20 mA current
5
",

loop). The teletype prints a listing of the data measured and simultaneouslypunches the data on a punch tape for further processing.
By means of the KIM-20 Interface Module the KL Y-2 can also beconnected to a computer or a terminal with an lEC RS 232 C standard inputinterface.
1.2 SPECIFICA TIONS
Kappabridge KL Y-2 comprisesmeasuring unitstandard pick-up unitpick-up unit for large specimens(optiona1)
KL Y-2,0KL Y-2.1KL Y-2.2
Pick-up unit
KL Y-2.1 KLY-2.2
920 Hz100, 200, 400, 1 000, •••200 000 x 10.6 (SI)11 ranges
Inner diameterof the pick-up coi INominal specimen volumeCubic specimen* )Cylindrical specimen*)Spherical specimenMeasuring vesselfor fragment specimensMagnetic field intensity(r .m.s. value)Field homogenity **)Operating freq uencyMeasuring ranges
43 mm
10 cm320x20x20 mm~ 25.4 x22 mm
300 A/m
0,2 %
76 mm
65 cm338x38x38 mmq¡ 46 x 40 mm~ 50 mm
240 cm3
6
----~ ----
Digital displayOutputSensitivity for specimenof nominal volume 10 cm3(65 cm3)
Accuracy within one range
Accuracy of the range dividerAccuracy of absolute calibration
power req ui rements
power consumption (withthe KIM-20 Interface)
Operating conditionsAmbient temperature
Relative humfdity
Dimensions, weight
Measuring unít KL Y-2.0
Standard pick-up unitKL Y-2.1
Large specimen pick-upunít KL Y-2.2
o - 1 999 units
parallel SCD
4 x 10⁻⁸± O. 1 % ± 1 count
± 0.3 %
± 3 %
220 V **~) 50/60 Hz
60 VA
10°C - 35°C
up to 80 %
554 x 170 x 389 mm
20.5 kg
208 x 260 x 223 mm
7.5 kg
380 x 428 x 374 mm
26.5 kg
Notes:
*) Holders of specimens of slightly different síze can be supplied on request.
**) Within the cylindrical space 43 mm in diam. (76 mm) and 41 mmin height (72 mm).
***) Standard instrumento Kappabridge adapted for another mains voltagecan be suppl ied on request.
7

1.3 SAFETY REQUIREMENTS
The metal surface of the instrument, the panel, the handles and thecovers are separated by double reinforced insulation from the inner liveparts with dangerous voltage. In this way, protection against dangeroustouch voltage is ensured in accordance with electrotechnical safety regulations. Therefore, there is no terminal on theinstrument for connecting protective earthing.
The zero point of the bridge connected with the chassis of the instrument is earthed through the operational earthing terminal. This operationalearthing does not function as a protective earthing and can even be eliminated provided that the function of the bridge does not deteriorate under thegiven conditions.
The mains voltage is in the power-input part of the instrument up tothe main insulating transformer. The voltage in the other parts of the instument is not dangerous.
The floor in the room in which measurementsare mademust be covered
with dry insulating material, e.g., rubber.
Whenworking with the instrument the operator must not touch electricinstruments with conductive (metal) surfaces and earthed objects, e.g. waterpiping, conductive building constructions, etc.
The instrument can be moved or carried only when disconnected fromthe mains.
The operator must be properly trained for operation with the instrumentoHe must follow Instruction Manual and observe safety regulations.
The instrument can be operated only if it is in good condition. In caseof unexpected malfunction or damage the instrument must immediately be
8

disconnected and must not be operated before It has been repaired.
If the instrument has not been in use tor a Ipnger time, it must becleaned and checked tor damageor maltunction with respect to safety. Thisshould also be performed at regular intervals. Damagedor worn parts shouldbe exchanged to prevent malfunction.
A slow fuse (type T, 250 mA for 220 V, 400 mA tor 120 V) servesfor protection agalnst short-clrcuit and overload.
Fuses from the manufacturer should be used only. If a fuse with a dlfferent characterlstic is used, the protection is not effective.
Other devices e.g. a desk-calculator, a computer, a teletype, a voltmeter or an oscllloscope can be connected to the instrument via the appropriate interface, If needed.
The zero point of an additional device whlch Is connected via an approprlate connector with the zero point of the bridge, must either be floatingor must have zero potential.
The construction, testíng and quality control of the instrument arein accordance with the Czechoslovak State Standard CSN 356501 ELECTRONIC MEASURING INSTRUMENTS - Safety Requírements,
2. PRINCIPLE OF OPERATION
2.1 BRIDGE NUCLEUS
The bridge nucleus, I.e. the bridge circuit proper, is illustrated ina símplified form In Fíg. 1. The prímary of the differential transformer Tr
is supplied with an AC voltage of 920 Hz trequency from the generator G.
9

On the secondary it produces two voltages of the same amplitude and opposite phase.
G
Tr L
.tPs
t
F
compensatingsignal
unbalancesignal
Fig.1 Simplifled circuit diagram of theKLY-2 bridge nucleus
Two measuring coils areconnected to the secondary winding of thetransformer: the pick-up cOiI L into which the specimen is inserted duringthe measurement, and identically designedbalancing coi I L' equipped witha small ferrite slug F for manualzeroing of the bridge.
The terminals L, L- that are not connected to the transformer Tr areconnected to the bridge network output point P from which the signal ofunbalance is taken for furher processing. The output ofthe bridge is tuned by means of the capacitar e 1 connected between the point P and thezero point of the bridge. (The requiredselectivityand real output impedanceof the bridge network are thus obtalned).
To the point P the compensating signal, maintaining the balance of thebridge circuit during the measurement, is also fed via the resistor R 1 •
10
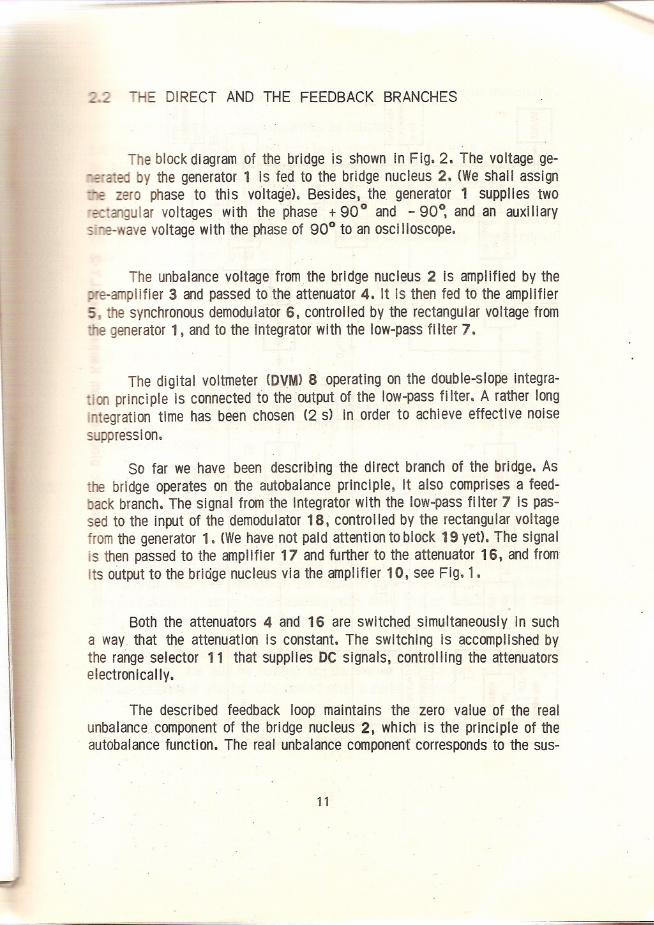
E DIRECT ANDTHE FEEDBACK BRANCHES
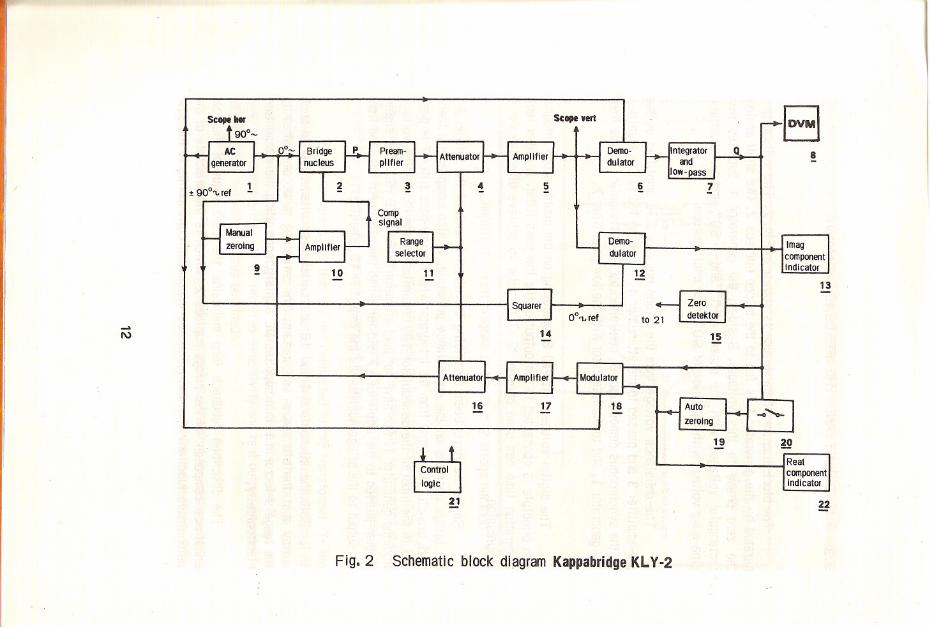
The block diagram of th~ bridge is shown in Fig. 2. The voltage ge---ated by the generator 1 is fed to the bridge nucleus 2. (We shail assign--z zero phase to this vOltage). Besides. the generator 1 supplies two-sc"(algular voltages with the phase + 90° and - 90°, and an auxiliarysi::e-wave voltage with the phase of 90° to an osci Iloscope.
The unbalance voltage from the bridge nucleus 2 is amplified by the
e-amplifier 3 and passed to the attenuator 4. It is then fed to the amplifier5 J the synchronous demodulator 6, controlled by the rectangular voltage from-. e generator 1, and to the integrator with the low-pass fi Iter 7.
The digital voltmeter <OVM) 8 operating on the double-slope integra-ion princi pie is connected to the 'output of the low-pass fi Iter. A rather longintegration time has been chosen (2 s) in order to achieve effective noisesuppression,
So far we have been describing the direct branch of the bridge. As
the bridge operates on the autobalance principie, it also comprises a feed-ack branch. The signal from the integrator with the low-pass fi Iter 7 ls pas
sed to the input of the demodulator 18. controlled by the rectangular vOltagefrom the generator 1. (Wehave not paid attention to block 19 yet). The signalis then passed to the amplifier 17 and further to the attenuator 16. and fromits output to the briáge nucleus via the amplifier 10, see Fig. 1.
Both the attenuators 4 and 16 are switched simultaneously in sucha way that the attenuation is constant. The switching is accomplished bythe range selector 11 that supplles De signals, controlling the attenuatorselectronically.
The described feedback loop maintains the zero value ofthe realunbalance, component ofthe bridge nucleus 2, which is the principie of theautobalance function. The real unbalance componenf corresponds to the sus-
11
10 11
Seope ,ert
12
Q
IDVMI
8
...•l\) 14
0°'\, ref
15
13
Fig.2
21
Schematic block diagram Kappabridge KLY-2
19 ~~Reat
componentIndlcator
~

ceptibilíty of the specimen, i.e. to the change of the pick-up coil inductivlty.
The principie of measurementis as follows:
Let us assume that the bridge has been zeroed, i;e. there is zero voltage00 the input of DVM 8, and that the switch 20 is off. nhe zeroing will beexplained later on). By Inserting the specimen into the measuring coil itsinductivity wi 11be increased. The induced signal of unbalance wi 11be compensated immediately by the effect of the feedback loop. A vOltage proportional to the inductivity change and thus to the susceptibility measured willappear on the Input of DVM 8.
2.3 ZEROING
To a certain extent the zeroing is automatic and is combined wlththe automatic compensation of the drift due to changes in the parametersofthe measuring coils. By manual zeroing the bridge is brought to the regionof automatic zerolng.
The circuit 19 (Fig. 2) for transmission with. double integration,i .e. its transfer function F (p) has a double pole at the point p = O, servestor automatic zeroing and compensatíonof the drift.
Let us assume that the bridge has roughly been zeroed manually. Theswitch 20 is off, and let us suppose that also the output of the circuit 19is disconnected. The voltageon. the input of DVM 8 differs trom zero and itchangesgradua!ly due to the measuring coils drift. Let us assume that thesechanges are linear, time-dependent.
Now actívate the circuit 19 by connecting its output to the input ofthe modulator 18 and by turning on the switch 20. In this way the inputvoltage of DVM 8 wi 11be fully zeroed after a certain periodo
It we now turn off the switch 20, neither the immediate value, northe rateof change of the output voltage of the circuit 19 change because
13
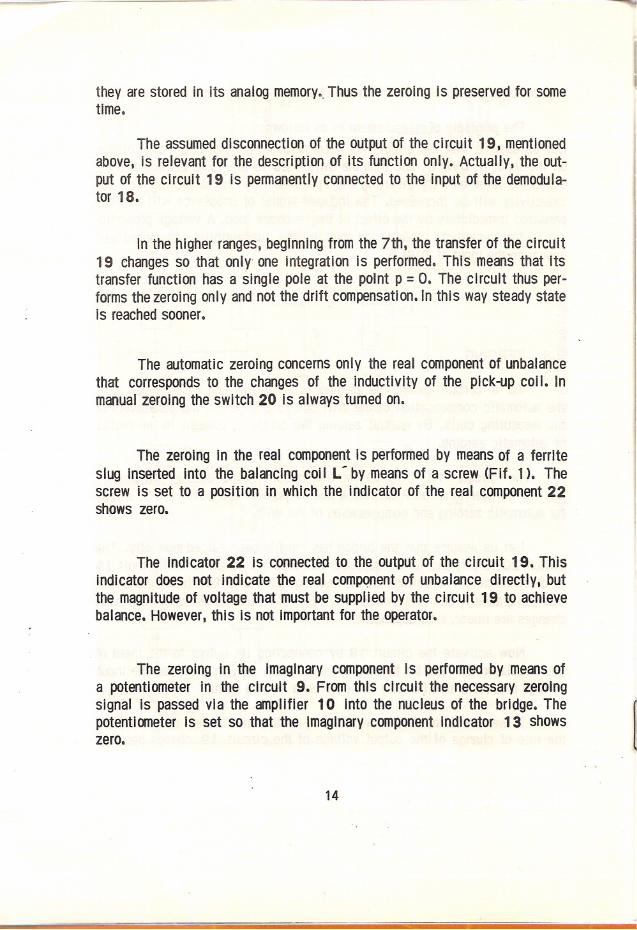
they are stored in its analog memory•.Thus the zeroing is preserved for sometime.
The assumed disconnection of the output of the clrcuit 19, mentionedabove, is relevant for the description of its function only. Actually, the output of the circuit 19 is permanently connected to the input of the demodulator 18.
In the higher ranges, beginning from the 7th, the transfer of the circuit19 changes so that only one integration is performed. This means that itstransfer function has a single pole at the point p = O. The circuit thus performs the zeroing only and not the drift compensation.ln this way steady stateis reachedsooner.
The automatic zeroing concerns only the real component of unbalancethat corresponds to the changes of the inductivity of the pick-up coi l. Inmanual zeroing the switch 20 is always turned on.
The zeroing in the real component is performed by meansof a ferriteslug inserted Into the balancing coll L' by means of a screw (Fif. 1). Thescrew is set to a position in whlch the Indlcator of the real component22shows zero.
The Indicator 22 is connected to the output of the circult 19. ThisIndicator does not indicate the real component of unbalance dlrectly, butthe magnitude of voltage that must be supplied by the circuit 19 to achievebalance. However, this is not Important for the operator.
The zeroing in the Imaginary component is performed by means ofa potentiometer in the circuit 9. From this circult the necessary zeroingsignal is passed vla the amplifier 10 into the nucleus of the bridge. Thepotentiometer is set so that the imaginary component indicator 13 showszero.
14

The indicator 13 is connected to the output of the demodulator 12.e input of the demodulator is connected to the output of the amplifier 5
is controlled by the reference rectangular voltage generated by the squa14 of the voltage of the generator 1.
The manual zeroing need not be accurate. In the course of measure
eni it should be repeated only if the deflection of any of the indicators22, 13 exceeds about 50 % of the scale range to either side.
2.4 CONTROL LOGIC
The measuring process is controlled by the logic 21 gathering informa
tion from individual circuits and giving the necessary commands. The logic's operated by the push-button PBl START/RESET, see Fig.7.
The bridge operates in four statuses. Each of them is indicated bya luminiscence diode:
Status Diode
WAIT
1. redREADY
greenMEASURE
yellowHALT
2. red
WAIT. The switch 20 is on, the automatic zeroing is on. The signal
VTS for the voltmeter start (see the connectors on the rear panel of themeasuring unit, Fig.8) is at the logic level 1. DVM measures the residual
unbalance repeatedly. The push-button PBl is disabled. When the zeroing hasbeen completed, the signal transmitted by the zero detector 15 to the control
logic changes from the level O to the level 1, after approx. 2 s the bridgeenters the status READY.
READY. This status does not differ from the previous one substan
tially. The push-button PBl is enabled. When it is pressed, the bridge pas-
15

ses to the status MEASURE. If the balance is disturbed in the status REAOY, the bridge returns to the status WAIT.
MEASURE. After reaching this status, the switch 20 is turned offand thus the automatic zeroing is eliminated. DVM is blocked and internallycleared when the signal VTS (Fig. 8) drops to O, and a short pulse of thelevel 1 appears in the signal VLC. Immediately after enterning the statusMEASURE the specimen is inserted for measurement.
After approx. 4 s, the voltmeter is started for a single measurementby a pUlse of the level 1 in VST. After the integration has been completed(2 s) a pulse of the level 1 in the EOI signal is sentí an accoustic signalis generated in the control logic indicating that the specimen should be pulled out.
Approx. 3 s after the integration has been completed. the circuitconverts to the status HALT.
HAL T. The automatic zeroíng is resumed since the switch 20 is turned on. The reading on the voltmeter does not change as the signal VSTremains at the level O. In this status, the reading can be read off and recor
ded (also automatically). The push-button PB1 is enabled. If it is pressed.the bridge enters WAIT or REAOY according to the zeroing 5tate.
2.5 OSCILLOSCOPE ANO EXTERNAL VOLTMETER
An oscilloscope and an externaI voltmeter may be used to check someof the Instrument functions.
For this purpose a special measuring cord is delivered, with a con
nector on one end and six banana plugs on the other. The connector is plugged into the connector AS on the rear panel of the measuring unit, see Fig. 8.The bananaplugs are connected as follows :
16

Outlet
short
short
short
longlong
long
Colour
greenblue
red
greenblue
red
Connection
zero terminal of the scope
horizontal input of the scope
vertical input of the scopezero terminal of the voltmeter
"low" terminal of the voltmeter
"high" terminal of the voltmeter
In this way the horizontal and the vertical inputs of the scope areconnected to the points marked in Fig. 2; the external voltmeter is connected in parallel to the digital voltmeter of the bridge.
The measurement by the scope is performed in the status WAIT orREADY. The basic pattem Is a horizontal elllpse. The narrower the elllpse,the better the zeroing of the imaginar~ycomponent. If the ellipse is inclined,the feedback is not working. This may be due, In particular, to serious detuning in the real component.
On the screen of the scope we can observe nolse and dlsturblng slgnals that are induced in the measurlng colls. In this way we can estlmatewhether the operation can be performed in the enVironment given.
The external digital voltmeter can be used for checking the functlonof the internal voltmeter. A count on the digital display DATA representsapprox. 5 mV.
Sometimes it is useful to uti Ilze an external analog voltmeter withzero in the middle of the scale. Noise and spurious signals, in particularthe pulse bnes, can be observed in the status READY.,
17

3. INSTRUMENT LAYOUT
The instrument consists of two independent units - the pick-up unitKL Y-2.1 (or KL Y-2.2), and the measuring unit KL Y-:2.0. A general viewof the instrument with the pick-up unit KL Y-2.1 is in Fig. 3.
3.1 PICK-UP UNITS KLY-2. 1 and KL Y-2.2
The pick-up unit comprises the nucleus of the bridge 2 - Fig. 2 (thetransformer, the pick-up coi 1, the balance coi I and other passive components),and the pre-amplifier 3 located on the printed-circuit card denoted PAM1and PAM2 in the pick-up unit KL Y-2.1 and KL Y-2.2, respectively. Thepre-amplifiers differ in the value of one resistor only.
The KL Y-2.1 with the cover removed is i lIustrated in Fig. 4. Thedesign of the KL Y-2.2 is almost identical.
A cross-section view of the pick-up unit KL Y-2. 1 is in Fig. 5 a:
1 - ceramic former
2 - winding3,; tubular inset
4 - base plate
The tubular inset defines the position of the specimen during themeasurement, prevents mechanical contact of the specimen with the coil, andacts as thermal insulation.
Fig. 5 b shows the field homogenity along the axis of the pick-up coi Iof the unit KL Y-2.1 •
A cross-section through the KL Y-2.2 pick-up cOil is illustrated InFig. 6 a. The individual items are identical wlth those of the KL Y-2.1 pick-
18

.-
19
...NI>..J~
Q)..c:.•....•
.•...O:¡:Q)
>ro•...Q)c:Q)
<.9
.(Y)
O)
LL

20
"'CQJ>oE~•...QJ>ou.c+-'
s:C\II>....J
~
e~c."~uC.
"'C•...C'O
"'CeC'O+-'(f)

-up coil. The tubular inset is designed in a rather different way. It is notmounted on the base plate, but suspended from the case of the unit. Thusa deformation of the pick-up system by the weight of the specimen is almostavoided.
Fig. 6 b shows the field homogeneity along the axsis of the pick-upof the unit KL Y-2.2.
-5-0,5 O
AH/Ho [%J
1cP 43
I
I ~~1
~ 5
2I
I
il._~I--+---11~----------It°x[cm]
a) bl
Fig.5. Pick-up cOil of the KL Y-2.1 unita} cross-section viewb) field homogeneity diagram
21

el> 76
1
a) b)
5
o
-5
Fig.6. Pick-up coil of the KL Y-2.2 unita) cross-section view b) field homogeneity diagram
3.2 MEASURING UNIT KLY-2.0
The measuring unit panel with control elements is i lIustrated in Fig. 7.
The measuring unas of three sub-units :
a) control unit
b) digital voltmetere) power supply
22

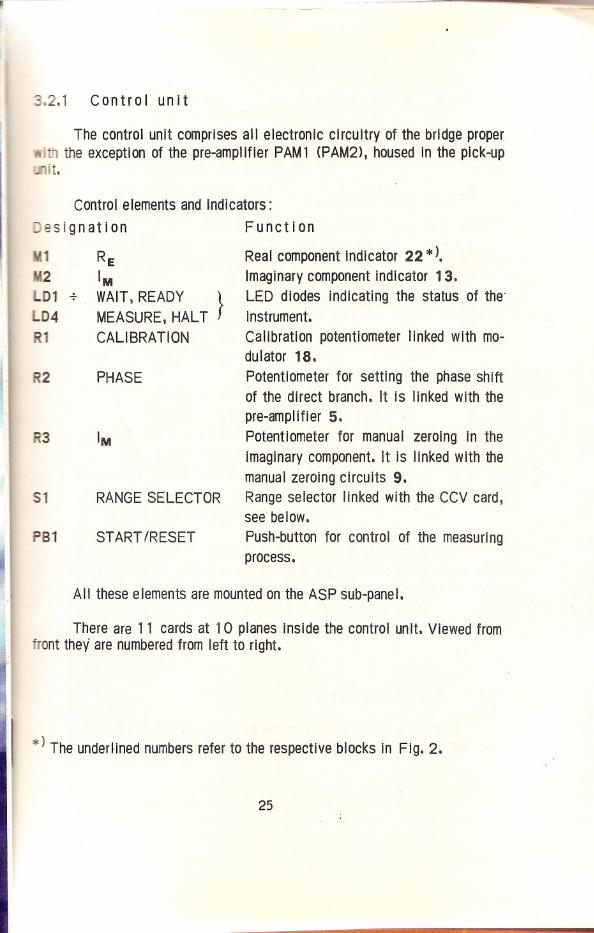
~.2. 1 Con t rol un I t
The control unit comprises all electronic circuitry of the bridge properthe exception of the pre-amplifier PAM1 (PAM2), housed in the pick-up
¡,.
All these elements are mountedonthe ASP sub-panel.
There are 11 cards at 10 planes inside the control unit. Viewed fromront they' are numberedfrom left to right.
1 RE2
1M
D1 + WAIT, REAOY }LD4MEASURE,HALT
R1
CALlBRATION
R2
PHASE
Control elements and indicators:
esignation Function
Real component indicator 22 *).
lmaginary component indicator 13.
LEO dlodes indicating the status. of the'instrumento
Calibration potentiometer Iinked with modulator 18.
Potentiometer for setting the phase shiftof the direct branch. It is linked with the
pre-amplifier 5.
R3 1M Potentiometer for manual zeroing in theimaginary component. It is linked with the
manual zeroing circuits 9.
51 RANGE SELECTOR Range selector Iinked with the CCV card,see below.
PB1 START fRESET Push-button for control of the measuringprocess.
:;:) The underlined numbers refer to the respective blocks in Fig. 2.
25

Position Designation
1 ADB
2 AZI
3a TZP64(front)
3b TZP64(rear)
4 AFB
5 GNA
6 GNB
7 APS
8 LGA
9 LGB
10 CCV
F u nc t Ion (contents)
Attenuator 4, amplifier S, demodulator 6. integrator and low-pass fi Iter 7(part).
Aut. zeroing circuit 19 (part), zerodetector 15, squarer 14, demodulator12.Commercial operational amplifier, thisbelongs to the integrator and low-passfi Iter 7.
Cornmercial operational amplifier withinthe autozeroing circuit 19.Modulator 18, amplifier 17, attenuator16. amplifier 10, manual zeroing circuit 9.
Generator 1 (part).
Generator 1 (partl.Stabilizer 2 x 15 V.
Control logic (part).
Control logic (part). stabilizer 5 V.
Coding matrices processing the signal
from the range selector 11.
~
The control unlt is enclosed with a couple of so-called prlnted-circuitside-boards interconnecting the grate at the bottom of the sub-unit. The left-hand printed-circuit side-board is designated LSB, the right-hand RSB.
3.2.2 Digital voltmeter
There is a double display on the panel mounted on the sub-panelDVP.The left half of the display des. RANGE shows the sequential number of
26
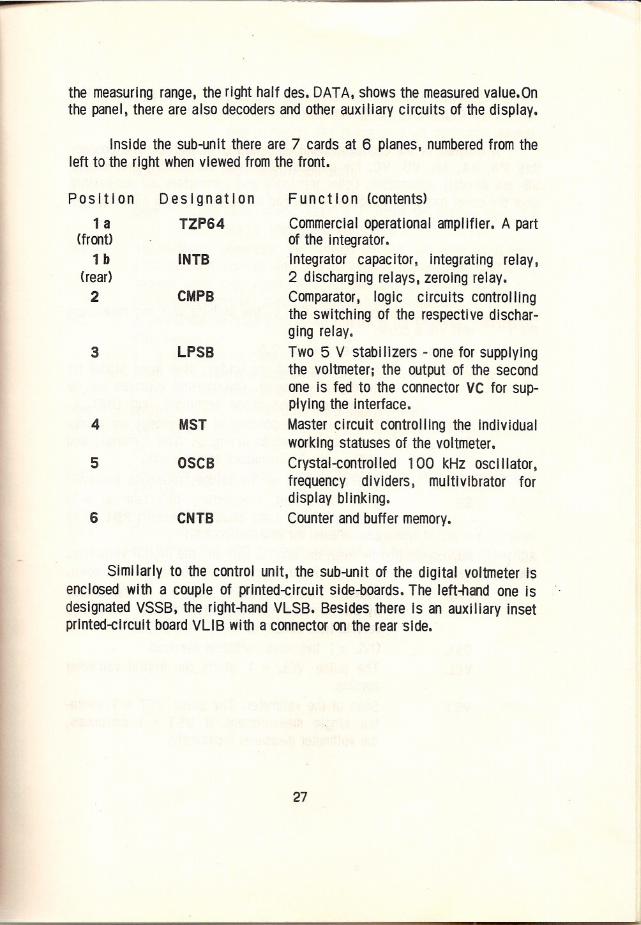
----------------------------~'~~~-----~~~~~------------------,-----
the measuring range, the right half des. DATA, shows the measuredvalue.Onthe panel, there are also decoders ano other auxiliary circuits of the display.
Inside the sub-unit there are 7 cards at 6 planes, numberedfrom theleft to the right when viewed from the front.
Position Designation
1 a
TZP64(front> 1 b
INTB(rear) 2
CMPB
3
4
5
6
LPSB
MST
OSCB
CNTB
F un c t ion (contents)
Commercial operational amplifier. A partof the integrator•
Integrator capacitor, integrating relay,2 discharging relays, zeroing relay.
Comparator, logic circuits controllingthe swltching of the respective discharging relay.
Two 5 V stabi Iizers - one for supplyingthe voltmeter¡ the output of the secondone is fed to the connector VC for supplying the interface.
Master circuit controlling the individualworking statuses of the voltmeter.
Crystal-controlled 100 kHz oscillator,frequency dividers, multivibrator fordisplay blinking.
Counter and buffer memory.
Simi larly to the control unit, the sub-unit of the digital voltmeter isenclosed with a couple of printed-circuit side-boards. The left-hand one is
designated VSSB, the right-hand VLSB. Besides there is an auxiliary insetprinted-circuit board VLlB with a connector on therear side.
27