Embed Size (px)
Citation preview

Macroeconomics: Economic growth and fluctuations
Chapter 1

The point of Chapter 1
• Macro economics and its uses
• Historical performance of the US economy
• Explaining the basic framework used in this text
• Some agreed-upon facts in practical macro economics

Macroeconomics
• Fundamental concern of macroeconomics is the overall performance of the economy.
• Output (Income) and output per capita are the usual barometers of performance.
• Gross domestic product (GDP) is most comprehensive measure of output.
• The central focus of our study is the level and growth of GDP and GDP per capita.

Other barometers of performance
• Employment and unemployment
• The price level
• The interest rate
• The exchange rate
• The trade balance and the balance of payments
• Note that income (revenue) and expenditure (output) are two sides of the same ledger

Recent U.S. Performance
1929 2006 Growthrate
GDP 865.0 11,319 3.40
Population (mil.) 122 300 1.18
GDP per capita ($000s) 7.1 37.8 2.19

Compare growth rates
1929 1973 2006
Gross domestic product 865.2 4,342 11,319
Population (000s) 122 212 300
GDP per capita ($000s) 7.1 20.5 37.8


U.S. GDP per Capita, 1929-73 & 73-06
Trends: 2.19% and 1.87%
5.0
10.0
15.0
20.0
25.0
30.0
35.0
40.0
1920 1930 1940 1950 1960 1970 1980 1990 2000 2010
Y2
k$
(0
00
s)
GDP Trend

0
10,000
20,000
30,000
40,000
1900 1910 1920 1930 1940 1950 1960 1970 1980 1990 2000
U.S. Real GDP per capita (2000 dollars)
Great Depression
World War II
First oil price shock
Second oil price shock
long-run upward trend…
9/11/2001

Employment to Population RatioPersons aged 16 and older
50
52
54
56
58
60
62
64
66
1940 1950 1960 1970 1980 1990 2000 2010
Pe
rce
nt


U.S. unemployment rate(% of labor force)
0
5
10
15
20
25
30
1900 1910 1920 1930 1940 1950 1960 1970 1980 1990 2000

Unemployment Rate1947-2006
2
3
4
5
6
7
8
9
10
1940 1950 1960 1970 1980 1990 2000 2010
Pe
rce
nt


U.S. Inflation Rate based on CPI
-15
-10
-5
0
5
10
15
20
25
1910 1920 1930 1940 1950 1960 1970 1980 1990 2000 2010
Pe
rce
nt
Annual

Alternative Measures of U.S. InflationPCE Deflator vs. CPI
(15.00)
(10.00)
(5.00)
0.00
5.00
10.00
15.00
1930 1940 1950 1960 1970 1980 1990 2000
Pe
ce
nt
PCE Deflator CPI

Fig. 1.6

Fig. 1.7
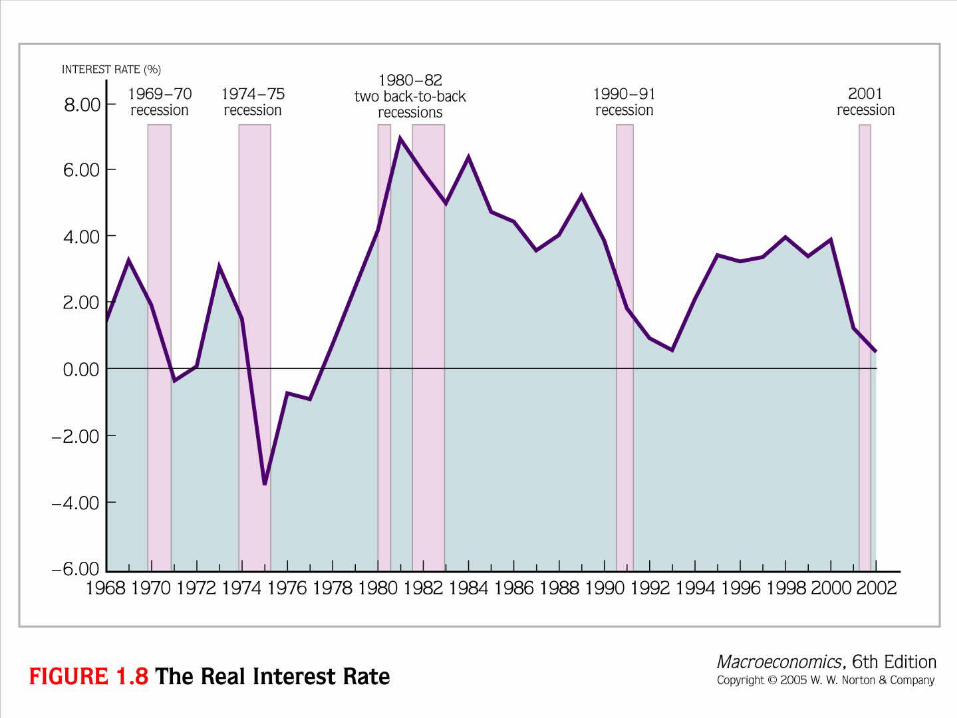
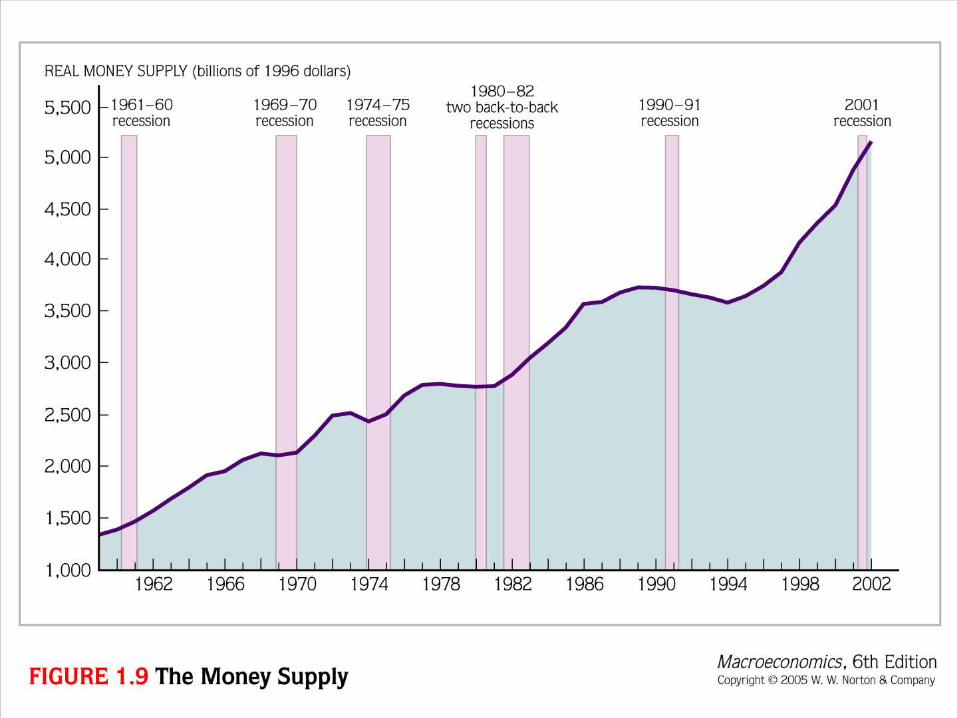
Fig. 1.9

Stylized facts about recent history
• GDP grew a 3.73% per annum in 1929-73 and at 2.95% in 1973-2006.
• GDP per capita grew 2.44% in 1929–73 and at 1.87% in 1973-2006.
• Output and employment moved together; employment percentage seems to be a leading indicator.
• Unemployment peaks at the end of a recession.
• Inflation seems to increase before a recession hits.
• Nominal and real interest rates also increases before the recession occurs.
Three models
• Long-run growth
• Fluctuations
• Macroeconomic policy

Core of practical macro economics
• the long-run growth rate
• Inflation and unemployment in the long run
• Inflation and unemployment in the short run
• Rational expectations
• Monetary policy rules